Citation: Choi, M.; Porter, S.C.; Meisen, A. Application of Mathematical Models to Determine the Feasibility of Amorphous Drug Layering in Pan Coaters. Pharmaceutics 2022, 14, 149. https://doi.org/10.3390/ pharmaceutics14010149 Academic Editors: Kyriakos Kachrimanis and Jaehwi Lee Received: 7 December 2021 Accepted: 5 January 2022 Published: 8 January 2022 Publisher’s Note: MDPI stays neutral with regard to jurisdictional claims in published maps and institutional affil- iations. Copyright: © 2022 by the authors. Licensee MDPI, Basel, Switzerland. This article is an open access article distributed under the terms and conditions of the Creative Commons Attribution (CC BY) license (https:// creativecommons.org/licenses/by/ 4.0/). pharmaceutics Article Application of Mathematical Models to Determine the Feasibility of Amorphous Drug Layering in Pan Coaters Michael Choi 1, *, Stuart C. Porter 2 and Axel Meisen 3 1 Particle Coating Technology Solutions, Inc., Lyndell, PA 19354, USA 2 PPT Pharm Technologies, Hatfield, PA 19440, USA; [email protected] 3 Department of Chemical and Biological Engineering, The University of British Columbia, Vancouver, BC V6T 1Z3, Canada; [email protected] * Correspondence: [email protected] Abstract: Oral solid dosage forms that contain APIs in the amorphous state have become common- place because of many drug substances exhibiting poor water solubility, which negatively impacts their absorption in the human GI tract. While micronization, solvent spray-drying, and hot-melt extrusion can address solubility issues, spray coating of the APIs onto beads and tablets offers an- other option for producing amorphous drug products. High-level comparisons between bead and tablet coating technologies have the potential for simpler equipment and operation that can reduce the cost of development and manufacturing. However, spray coating directly onto tablets is not without challenges, especially with respect to meeting uniformity acceptance value (AV) criteria, comprising accuracy (mean) and precision (variance) objectives. The feasibility of meeting AV criteria is examined, based on mathematical models for accuracy and precision. The results indicate that the main difficulty in manufacturing satisfactory drug-layered tablets by spray coating is caused by the practical limitations of achieving the necessary coating precision. Despite this limitation, it is shown that AV criteria can be consistently met by appropriate materials monitoring and control as well as processing equipment setup, operation, and maintenance. Keywords: drug-layering; accuracy; precision; coating efficiency; coating uniformity; acceptance value; process capability 1. Introduction The main advantage of creating oral solid dosage forms containing an amorphous active pharmaceutical ingredient (API) is the improved drug solubility in the human GI tract that leads to higher bioavailability. Micronizing, solvent spray drying, and hot-melt extrusion are classic techniques for creating APIs with enhanced solubility characteristics, but these techniques involve relatively complex procedures with high manufacturing costs. A recent study on the feasibility of coating an amorphous solid dispersion onto beads [1] confirms the feasibility of active drug-layering directly onto pellets or tablets, with the benefits of reducing complexity as well as material and manufacturing costs. Drug products with drug-layered pellets have a historical significance [2] and, as shown in Table 1, the manufacturing process requires fewer steps compared to those for typical solid-dosage forms prepared, for example, when using amorphous APIs obtained using the classic techniques. This table also indicates the potential reduction in the number of manufacturing unit operations required to produce the final dosage form, which can be of considerable benefit not only for development cost and time-to-market but also for commercial manufacturing when considering the capital and operating costs of multiple unit operations. Pharmaceutics 2022, 14, 149. https://doi.org/10.3390/pharmaceutics14010149 https://www.mdpi.com/journal/pharmaceutics

Welcome message from author
This document is posted to help you gain knowledge. Please leave a comment to let me know what you think about it! Share it to your friends and learn new things together.
Transcript
�����������������
Citation: Choi, M.; Porter,
S.C.; Meisen, A. Application of
Mathematical Models to Determine
the Feasibility of Amorphous Drug
Layering in Pan Coaters.
Pharmaceutics 2022, 14, 149.
https://doi.org/10.3390/
pharmaceutics14010149
Academic Editors:
Kyriakos Kachrimanis and
Jaehwi Lee
Received: 7 December 2021
Accepted: 5 January 2022
Published: 8 January 2022
Publisher’s Note: MDPI stays neutral
with regard to jurisdictional claims in
published maps and institutional affil-
iations.
Copyright: © 2022 by the authors.
Licensee MDPI, Basel, Switzerland.
This article is an open access article
distributed under the terms and
conditions of the Creative Commons
Attribution (CC BY) license (https://
creativecommons.org/licenses/by/
4.0/).
pharmaceutics
Article
Application of Mathematical Models to Determine theFeasibility of Amorphous Drug Layering in Pan CoatersMichael Choi 1,*, Stuart C. Porter 2 and Axel Meisen 3
1 Particle Coating Technology Solutions, Inc., Lyndell, PA 19354, USA2 PPT Pharm Technologies, Hatfield, PA 19440, USA; [email protected] Department of Chemical and Biological Engineering, The University of British Columbia,
Vancouver, BC V6T 1Z3, Canada; [email protected]* Correspondence: [email protected]
Abstract: Oral solid dosage forms that contain APIs in the amorphous state have become common-place because of many drug substances exhibiting poor water solubility, which negatively impactstheir absorption in the human GI tract. While micronization, solvent spray-drying, and hot-meltextrusion can address solubility issues, spray coating of the APIs onto beads and tablets offers an-other option for producing amorphous drug products. High-level comparisons between bead andtablet coating technologies have the potential for simpler equipment and operation that can reducethe cost of development and manufacturing. However, spray coating directly onto tablets is notwithout challenges, especially with respect to meeting uniformity acceptance value (AV) criteria,comprising accuracy (mean) and precision (variance) objectives. The feasibility of meeting AV criteriais examined, based on mathematical models for accuracy and precision. The results indicate that themain difficulty in manufacturing satisfactory drug-layered tablets by spray coating is caused by thepractical limitations of achieving the necessary coating precision. Despite this limitation, it is shownthat AV criteria can be consistently met by appropriate materials monitoring and control as well asprocessing equipment setup, operation, and maintenance.
Keywords: drug-layering; accuracy; precision; coating efficiency; coating uniformity; acceptancevalue; process capability
1. Introduction
The main advantage of creating oral solid dosage forms containing an amorphousactive pharmaceutical ingredient (API) is the improved drug solubility in the human GItract that leads to higher bioavailability. Micronizing, solvent spray drying, and hot-meltextrusion are classic techniques for creating APIs with enhanced solubility characteristics,but these techniques involve relatively complex procedures with high manufacturingcosts. A recent study on the feasibility of coating an amorphous solid dispersion ontobeads [1] confirms the feasibility of active drug-layering directly onto pellets or tablets,with the benefits of reducing complexity as well as material and manufacturing costs.Drug products with drug-layered pellets have a historical significance [2] and, as shownin Table 1, the manufacturing process requires fewer steps compared to those for typicalsolid-dosage forms prepared, for example, when using amorphous APIs obtained usingthe classic techniques. This table also indicates the potential reduction in the number ofmanufacturing unit operations required to produce the final dosage form, which can beof considerable benefit not only for development cost and time-to-market but also forcommercial manufacturing when considering the capital and operating costs of multipleunit operations.
Pharmaceutics 2022, 14, 149. https://doi.org/10.3390/pharmaceutics14010149 https://www.mdpi.com/journal/pharmaceutics
Pharmaceutics 2022, 14, 149 2 of 12
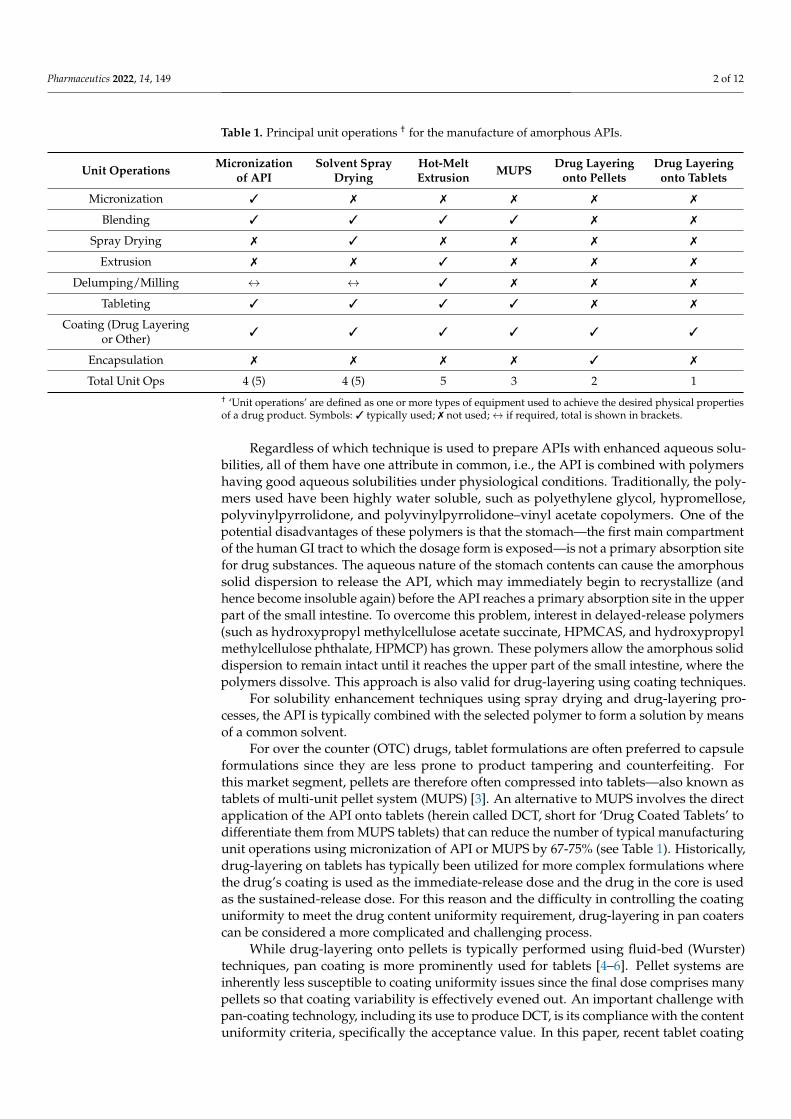
Table 1. Principal unit operations † for the manufacture of amorphous APIs.
Unit Operations Micronizationof API
Solvent SprayDrying
Hot-MeltExtrusion MUPS Drug Layering
onto PelletsDrug Layering
onto Tablets
Micronization 3 7 7 7 7 7
Blending 3 3 3 3 7 7
Spray Drying 7 3 7 7 7 7
Extrusion 7 7 3 7 7 7
Delumping/Milling ↔ ↔ 3 7 7 7
Tableting 3 3 3 3 7 7
Coating (Drug Layeringor Other) 3 3 3 3 3 3
Encapsulation 7 7 7 7 3 7
Total Unit Ops 4 (5) 4 (5) 5 3 2 1† ‘Unit operations’ are defined as one or more types of equipment used to achieve the desired physical propertiesof a drug product. Symbols: 3 typically used; 7 not used;↔ if required, total is shown in brackets.
Regardless of which technique is used to prepare APIs with enhanced aqueous solu-bilities, all of them have one attribute in common, i.e., the API is combined with polymershaving good aqueous solubilities under physiological conditions. Traditionally, the poly-mers used have been highly water soluble, such as polyethylene glycol, hypromellose,polyvinylpyrrolidone, and polyvinylpyrrolidone–vinyl acetate copolymers. One of thepotential disadvantages of these polymers is that the stomach—the first main compartmentof the human GI tract to which the dosage form is exposed—is not a primary absorption sitefor drug substances. The aqueous nature of the stomach contents can cause the amorphoussolid dispersion to release the API, which may immediately begin to recrystallize (andhence become insoluble again) before the API reaches a primary absorption site in the upperpart of the small intestine. To overcome this problem, interest in delayed-release polymers(such as hydroxypropyl methylcellulose acetate succinate, HPMCAS, and hydroxypropylmethylcellulose phthalate, HPMCP) has grown. These polymers allow the amorphous soliddispersion to remain intact until it reaches the upper part of the small intestine, where thepolymers dissolve. This approach is also valid for drug-layering using coating techniques.
For solubility enhancement techniques using spray drying and drug-layering pro-cesses, the API is typically combined with the selected polymer to form a solution by meansof a common solvent.
For over the counter (OTC) drugs, tablet formulations are often preferred to capsuleformulations since they are less prone to product tampering and counterfeiting. Forthis market segment, pellets are therefore often compressed into tablets—also known astablets of multi-unit pellet system (MUPS) [3]. An alternative to MUPS involves the directapplication of the API onto tablets (herein called DCT, short for ‘Drug Coated Tablets’ todifferentiate them from MUPS tablets) that can reduce the number of typical manufacturingunit operations using micronization of API or MUPS by 67-75% (see Table 1). Historically,drug-layering on tablets has typically been utilized for more complex formulations wherethe drug’s coating is used as the immediate-release dose and the drug in the core is usedas the sustained-release dose. For this reason and the difficulty in controlling the coatinguniformity to meet the drug content uniformity requirement, drug-layering in pan coaterscan be considered a more complicated and challenging process.
While drug-layering onto pellets is typically performed using fluid-bed (Wurster)techniques, pan coating is more prominently used for tablets [4–6]. Pellet systems areinherently less susceptible to coating uniformity issues since the final dose comprises manypellets so that coating variability is effectively evened out. An important challenge withpan-coating technology, including its use to produce DCT, is its compliance with the contentuniformity criteria, specifically the acceptance value. In this paper, recent tablet coating
Pharmaceutics 2022, 14, 149 3 of 12
models [7,8] are used to show that it is possible to meet the criteria by a judicious choice ofdesign and operating parameters.
2. Methods
The methods used to derive the relationship between the acceptance value criteria,accuracy, and precision parameters are provided in this section. However, since applyingamorphous drugs directly onto tablets in pan coaters is a relatively new concept, exampleapproaches for preparing tablets and the coating solution, and for processing to ensure theamorphous state of API, are provided first.
2.1. Description of Amorphous Drug Coating Process in Pan Coaters
Before the application of a coating solution containing an API to a suitable tablet corecan be considered, key development steps must be undertaken, namely:
• Selection of a suitable polymer that is compatible with the API, which can maintain theamorphous state of the API during application of the coating to the tablets, and ensurethat once the final dosage form is consumed by the patient, the amorphous nature ofthe API is maintained right up to the delivery to the primary site of absorption.
• Selection of a suitable solvent system that is capable of dissolving both the polymerand the API. Ideally, the solvent should be a single component system. If a solventmixture is selected, ideally, a constant boiling (i.e., an azeotrope) mixture should beused or one where the least volatile solvent in the mixture can maintain both the APIand polymer in the solution.
• Design of an optimized coating process that allows the coating to be uniformly de-posited on the substrate, and allows for the control of the drying process, so thatonce a dry coating is formed on the substrate, the API still retains its amorphouscharacteristics.
Once the necessary developmental work has been accomplished, the applicationprocess typically comprises the following steps:
• Creating a coating solution by dissolving the polymer and the API in the requisitesolvent system;
• Loading the tablet cores into the coating pan;• Warming the tablets until they reach the required temperature;• Coating the tablets by using the optimal coating process conditions described below;• Drying the coated tablets at the conclusion of the coating process to remove traces of
residual solvent(s);• Cooling the tablets;• Emptying the coating pan.
Modern pan coaters typically have cylindrical rotary drums with tapered ends andbaffles to turnover and mix the bed of tablets efficiently [9]. A coating solution containingamorphous API is sprayed onto the bed surface with the aid of pneumatic nozzles locatedalong the bed axis and utilizing patterned air to enhance the spray coverage over the bedsurface. The coating substrate remains on the tablets as the solvent in the coating solutionis removed by conditioned processed air that is drawn through the bed of tablets andperforated drum walls. Repeated tablet passages through the spray zone, caused by therotation of the pan and aided by baffles, improve the coating uniformity on the surface andbetween the tablets. The process is concluded when the specified quantity of amorphousAPI is applied on the tablets that meet the content uniformity acceptance value.
2.2. Acceptance Value and Its Relationship to Accuracy and Precision in Pan Coating Processes
The API content uniformity acceptance value (AV) is defined in the harmonizedUSP/EP/JP Convention [10]:
AV = |M− X|+ kAVs (1)
Pharmaceutics 2022, 14, 149 4 of 12
where M is the reference value, X is the mean of the individual API content as a percentageof the label claim, kAV is the acceptability constant (kAV = 2.4 and 2.0 for sample sizes (ns)of 10 and 30, respectively), and s is the sample standard deviation. For drug-layeringprocesses, X and s represent the average content and variability of the API in the coating,respectively. The content uniformity criterion is met if AV is equal to or less than 15 for thelevel 1 test and 25 for the level 2 test. Equation (1) is also conditional on the value of X:
AV = kAVs for 98.5% ≤ X ≤ 101.5% (2)
AV = 98.5− X + kAVs for X < 98.5% (3)
AV = X− 101.5 + kAVs for X > 101.5% (4)
USP/EP/JP further specifies that, for a target content per dosage unit (T) at the timeof manufacture greater than 101.5%, Equations (2) and (4) must be replaced with
AV = kAVs for 98.5% ≤ X ≤ T (5)
AV = X− T + kAVs for X > T (6)
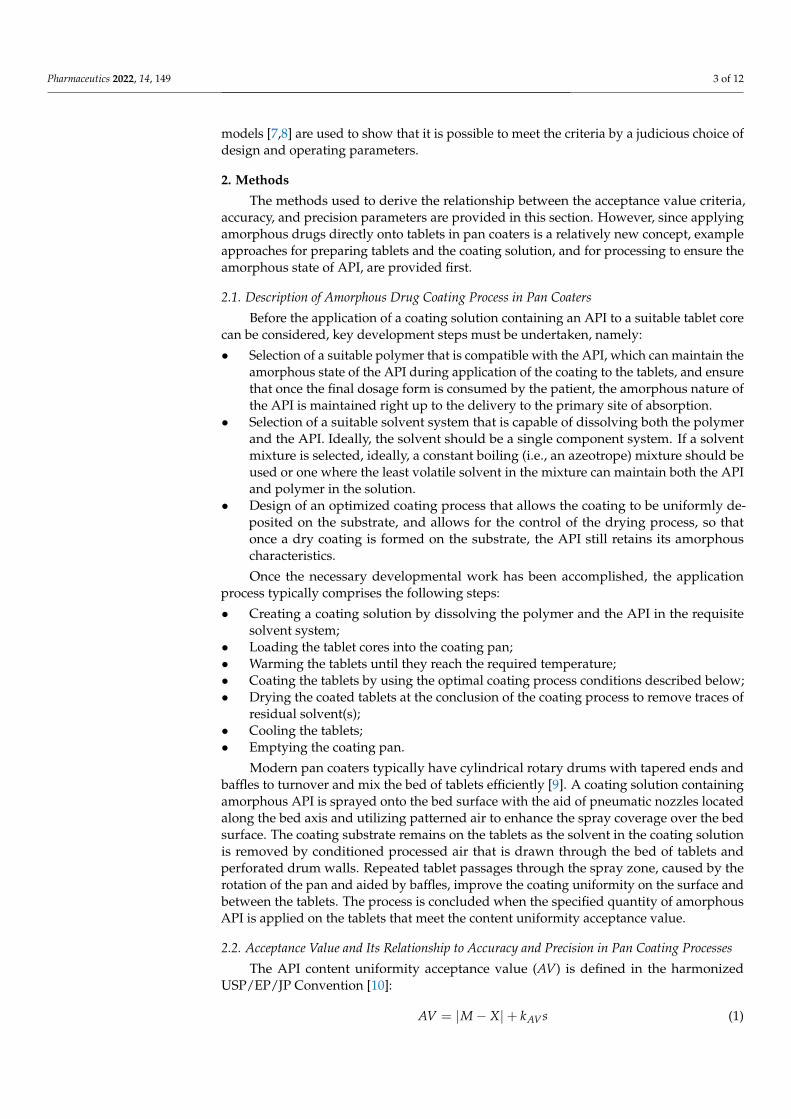
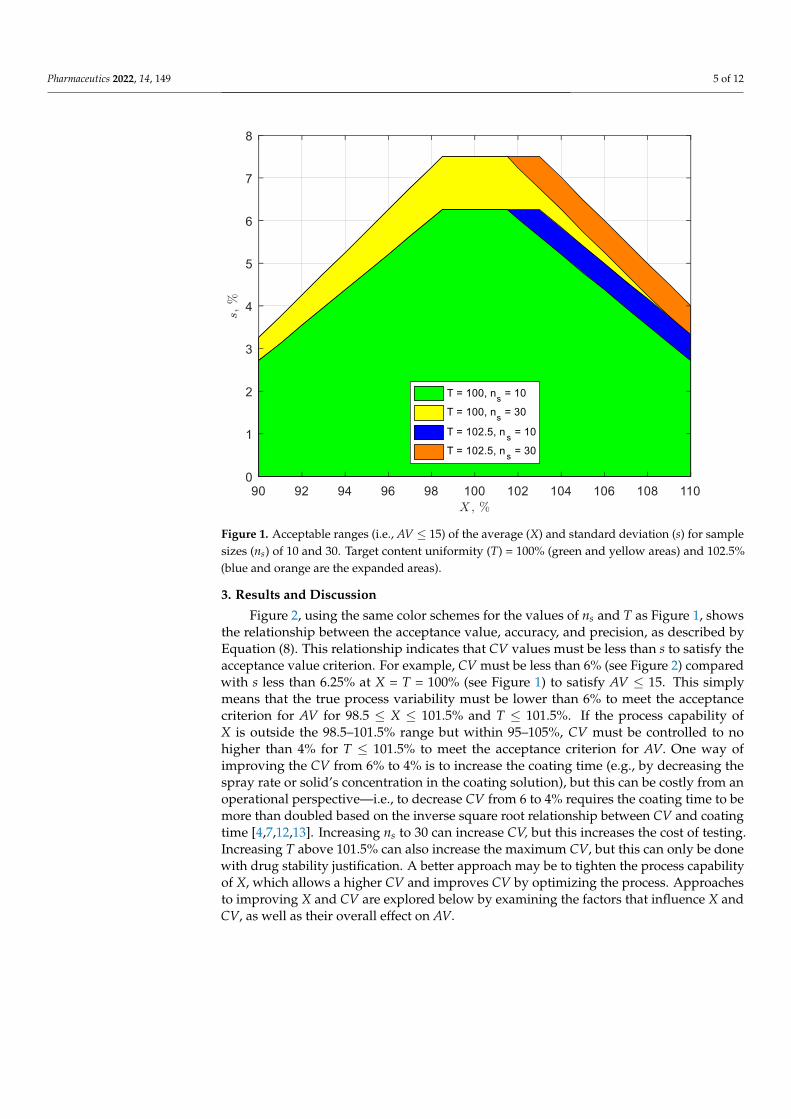
The above relationships between s and X are shown in Figure 1 for the level 1 criterion(i.e., AV ≤ 15) for ns = 10 and 30, and T = 100 and 102.5%. Any combination of X and sthat falls within the green-colored region under the curves represents acceptable operatingranges of AV ≤ 15. For example, when ns = 10 and T = 100%, s must be equal to orless than 6.25% to meet this AV criterion for X between 98.5 and 101.5%. However, ifX falls outside this range, the penalty comes in the form of a lower acceptable s, whichdecreases approximately proportional to the proximity of the 98.5–101.5% range, as shownin Figure 1. For example, if the process capability is such that X = 97.0%, s must be lessthan 5.83% to meet the level 1 AV criterion (compared to 6.25% at 98.5% ≤ X ≤ 101.5%).Consequently, tighter control on the coating variability (i.e., s) is needed when X deviatesfrom the 98.5–101.5% range. Increasing ns to 30 increases the acceptable operating range ofcoating variability (shown in yellow), resulting in s being equal to or less than 7.5% if X isbetween 98.5 and 101.5%, and increasing T to 102.5% widens the flat operating range to98.5 and 102.5%, as shown by the blue and orange regions for ns = 10 and 30, respectively,in Figure 1.
Coating uniformity is commonly characterized in terms of the coefficient of variation(CV) based on the entire population, which is the true measure of the process variability,and CV is widely used in modeling coating uniformity [11]. Hence, s may be converted toCV using the relationship
s =√
ns
ns − 1X·CV (7)
Substituting Equation (5) into (1) gives
AV = |M− X|+ k′AV X·CV (8)
where k′AV = kAV
√ns
ns − 1(9)
Statistically, X denotes the ‘accuracy’ of the process since it is the measure of closenessto the target, and CV denotes the ‘precision’ of the process since it is the measure of thevariability of the API content in the tablet coatings.
Pharmaceutics 2022, 14, 149 5 of 12
Pharmaceutics 2022, 14, x FOR PEER REVIEW 5 of 12
Statistically, X denotes the ‘accuracy’ of the process since it is the measure of close-
ness to the target, and CV denotes the ‘precision’ of the process since it is the measure of
the variability of the API content in the tablet coatings.
Figure 1. Acceptable ranges (i.e., AV ≤ 15) of the average (X) and standard deviation (s) for sample
sizes (ns) of 10 and 30. Target content uniformity (T) = 100% (green and yellow areas) and 102.5%
(blue and orange are the expanded areas).
3. Results and Discussion
Figure 2, using the same color schemes for the values of ns and T as Figure 1, shows
the relationship between the acceptance value, accuracy, and precision, as described by
Equation (8). This relationship indicates that CV values must be less than s to satisfy the
acceptance value criterion. For example, CV must be less than 6% (see Figure 2) compared
with s less than 6.25% at X = T = 100% (see Figure 1) to satisfy AV ≤ 15. This simply means
that the true process variability must be lower than 6% to meet the acceptance criterion
for AV for 98.5 ≤ X ≤ 101.5% and T ≤ 101.5%. If the process capability of X is outside the
98.5–101.5% range but within 95–105%, CV must be controlled to no higher than 4% for T
≤ 101.5% to meet the acceptance criterion for AV. One way of improving the CV from 6%
to 4% is to increase the coating time (e.g., by decreasing the spray rate or solid’s concen-
tration in the coating solution), but this can be costly from an operational perspective—
i.e., to decrease CV from 6 to 4% requires the coating time to be more than doubled based
on the inverse square root relationship between CV and coating time [4,7,12,13]. Increas-
ing ns to 30 can increase CV, but this increases the cost of testing. Increasing T above 101.5%
can also increase the maximum CV, but this can only be done with drug stability justifica-
tion. A better approach may be to tighten the process capability of X, which allows a
higher CV and improves CV by optimizing the process. Approaches to improving X and
CV are explored below by examining the factors that influence X and CV, as well as their
overall effect on AV.
Figure 1. Acceptable ranges (i.e., AV ≤ 15) of the average (X) and standard deviation (s) for samplesizes (ns) of 10 and 30. Target content uniformity (T) = 100% (green and yellow areas) and 102.5%(blue and orange are the expanded areas).
3. Results and Discussion
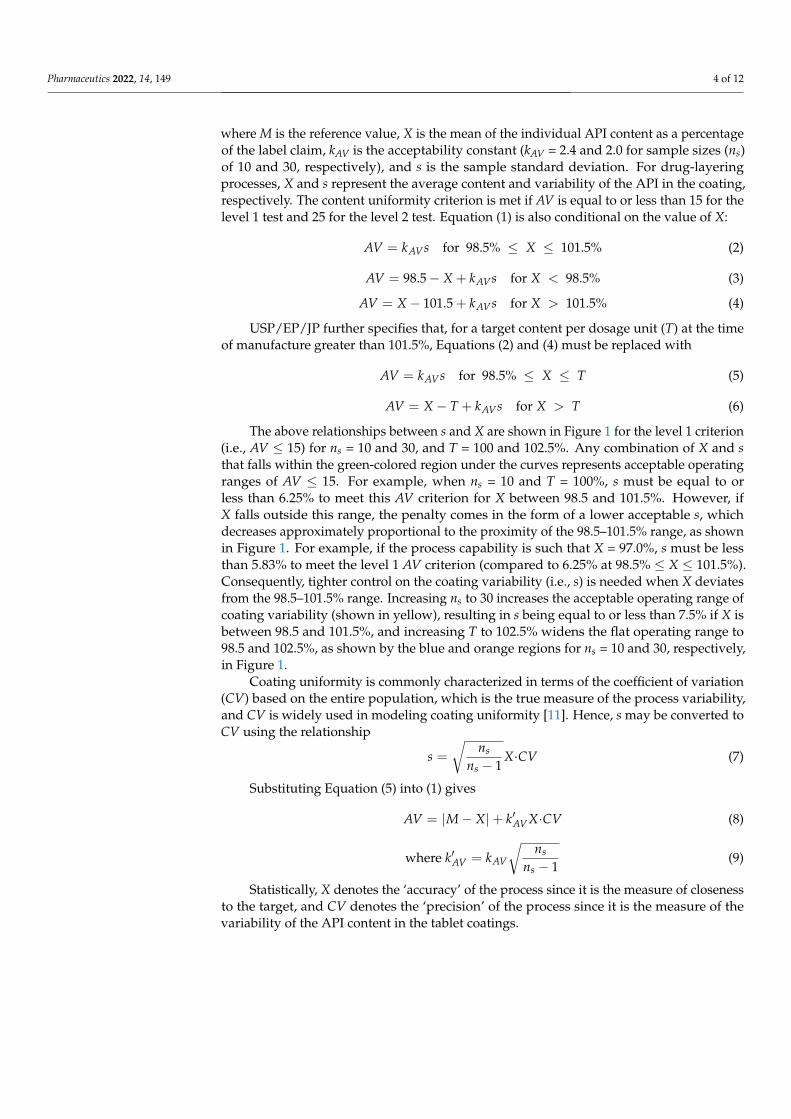
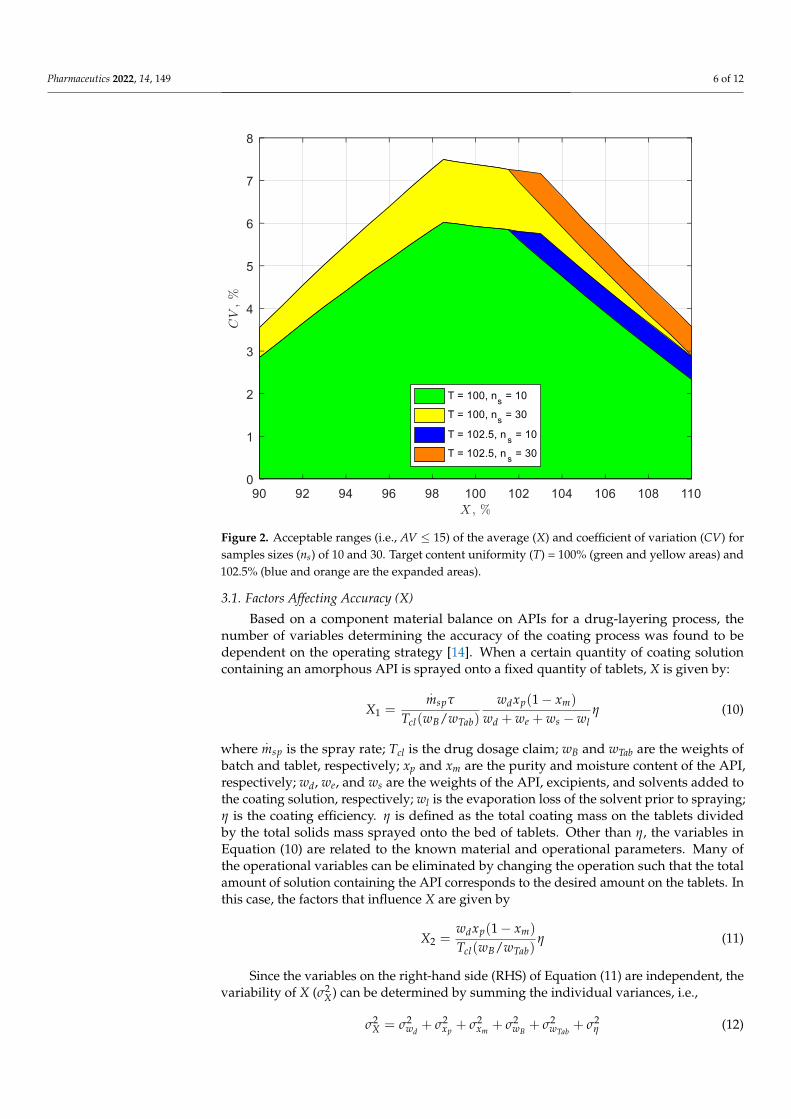
Figure 2, using the same color schemes for the values of ns and T as Figure 1, showsthe relationship between the acceptance value, accuracy, and precision, as described byEquation (8). This relationship indicates that CV values must be less than s to satisfy theacceptance value criterion. For example, CV must be less than 6% (see Figure 2) comparedwith s less than 6.25% at X = T = 100% (see Figure 1) to satisfy AV ≤ 15. This simplymeans that the true process variability must be lower than 6% to meet the acceptancecriterion for AV for 98.5 ≤ X ≤ 101.5% and T ≤ 101.5%. If the process capability ofX is outside the 98.5–101.5% range but within 95–105%, CV must be controlled to nohigher than 4% for T ≤ 101.5% to meet the acceptance criterion for AV. One way ofimproving the CV from 6% to 4% is to increase the coating time (e.g., by decreasing thespray rate or solid’s concentration in the coating solution), but this can be costly from anoperational perspective—i.e., to decrease CV from 6 to 4% requires the coating time to bemore than doubled based on the inverse square root relationship between CV and coatingtime [4,7,12,13]. Increasing ns to 30 can increase CV, but this increases the cost of testing.Increasing T above 101.5% can also increase the maximum CV, but this can only be donewith drug stability justification. A better approach may be to tighten the process capabilityof X, which allows a higher CV and improves CV by optimizing the process. Approachesto improving X and CV are explored below by examining the factors that influence X andCV, as well as their overall effect on AV.
Pharmaceutics 2022, 14, 149 6 of 12
Pharmaceutics 2022, 14, x FOR PEER REVIEW 6 of 12
Figure 2. Acceptable ranges (i.e., AV ≤ 15) of the average (X) and coefficient of variation (CV) for
samples sizes (ns) of 10 and 30. Target content uniformity (T) = 100% (green and yellow areas) and
102.5% (blue and orange are the expanded areas).
3.1. Factors Affecting Accuracy (X)
Based on a component material balance on APIs for a drug-layering process, the
number of variables determining the accuracy of the coating process was found to be de-
pendent on the operating strategy [14]. When a certain quantity of coating solution con-
taining an amorphous API is sprayed onto a fixed quantity of tablets, X is given by:
𝑋1 =��𝑠𝑝𝜏
𝑇𝑐𝑙(𝑤𝐵/𝑤𝑇𝑎𝑏)
𝑤𝑑𝑥𝑝(1 − 𝑥𝑚)
𝑤𝑑 +𝑤𝑒 + 𝑤𝑠 − 𝑤𝑙
𝜂 (10)
where ��𝑠𝑝 is the spray rate; Tcl is the drug dosage claim; wB and wTab are the weights of
batch and tablet, respectively; xp and xm are the purity and moisture content of the API,
respectively; wd, we, and ws are the weights of the API, excipients, and solvents added to
the coating solution, respectively; wl is the evaporation loss of the solvent prior to spray-
ing; η is the coating efficiency. η is defined as the total coating mass on the tablets divided
by the total solids mass sprayed onto the bed of tablets. Other than η, the variables in
Equation (10) are related to the known material and operational parameters. Many of the
operational variables can be eliminated by changing the operation such that the total
amount of solution containing the API corresponds to the desired amount on the tablets.
In this case, the factors that influence X are given by
𝑋2 =𝑤𝑑𝑥𝑝(1 − 𝑥𝑚)
𝑇𝑐𝑙(𝑤𝐵/𝑤𝑇𝑎𝑏)𝜂 (11)
Since the variables on the right-hand side (RHS) of Equation (11) are independent,
the variability of X (𝜎𝑋2) can be determined by summing the individual variances, i.e.,
𝜎𝑋2 = 𝜎𝑤𝑑
2 + 𝜎𝑥𝑝2 + 𝜎𝑥𝑚
2 + 𝜎𝑤𝐵2 + 𝜎𝑤𝑇𝑎𝑏
2 + 𝜎𝜂2 (12)
Figure 2. Acceptable ranges (i.e., AV ≤ 15) of the average (X) and coefficient of variation (CV) forsamples sizes (ns) of 10 and 30. Target content uniformity (T) = 100% (green and yellow areas) and102.5% (blue and orange are the expanded areas).
3.1. Factors Affecting Accuracy (X)
Based on a component material balance on APIs for a drug-layering process, thenumber of variables determining the accuracy of the coating process was found to bedependent on the operating strategy [14]. When a certain quantity of coating solutioncontaining an amorphous API is sprayed onto a fixed quantity of tablets, X is given by:
X1 =
.mspτ
Tcl(wB/wTab)
wdxp(1− xm)
wd + we + ws − wlη (10)
where.
msp is the spray rate; Tcl is the drug dosage claim; wB and wTab are the weights ofbatch and tablet, respectively; xp and xm are the purity and moisture content of the API,respectively; wd, we, and ws are the weights of the API, excipients, and solvents added tothe coating solution, respectively; wl is the evaporation loss of the solvent prior to spraying;η is the coating efficiency. η is defined as the total coating mass on the tablets dividedby the total solids mass sprayed onto the bed of tablets. Other than η, the variables inEquation (10) are related to the known material and operational parameters. Many ofthe operational variables can be eliminated by changing the operation such that the totalamount of solution containing the API corresponds to the desired amount on the tablets. Inthis case, the factors that influence X are given by
X2 =wdxp(1− xm)
Tcl(wB/wTab)η (11)
Since the variables on the right-hand side (RHS) of Equation (11) are independent, thevariability of X (σ2
X) can be determined by summing the individual variances, i.e.,
σ2X = σ2
wd+ σ2
xp + σ2xm + σ2
wB+ σ2
wTab+ σ2
η (12)
Pharmaceutics 2022, 14, 149 7 of 12
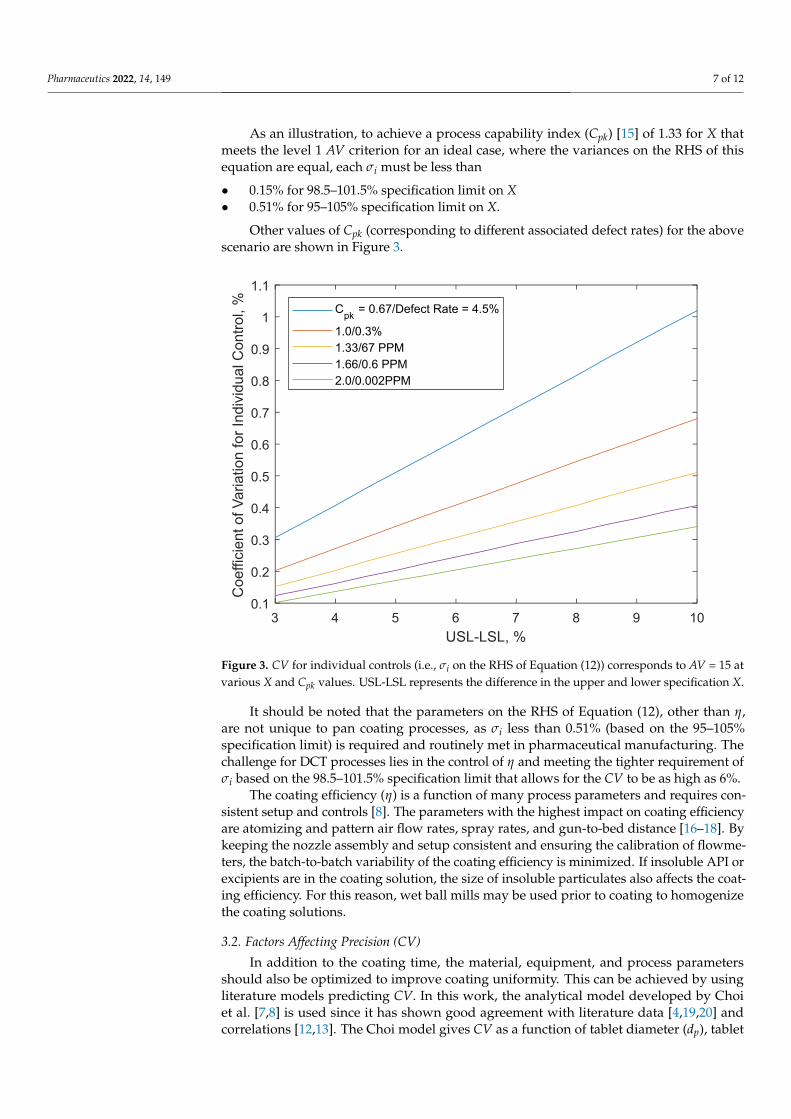
As an illustration, to achieve a process capability index (Cpk) [15] of 1.33 for X thatmeets the level 1 AV criterion for an ideal case, where the variances on the RHS of thisequation are equal, each σi must be less than
• 0.15% for 98.5–101.5% specification limit on X• 0.51% for 95–105% specification limit on X.
Other values of Cpk (corresponding to different associated defect rates) for the abovescenario are shown in Figure 3.
Pharmaceutics 2022, 14, x FOR PEER REVIEW 7 of 12
As an illustration, to achieve a process capability index (Cpk) [15] of 1.33 for X that meets the level 1 AV criterion for an ideal case, where the variances on the RHS of this equation are equal, each σi must be less than • 0.15% for 98.5–101.5% specification limit on X • 0.51% for 95–105% specification limit on X.
Other values of Cpk (corresponding to different associated defect rates) for the above scenario are shown in Figure 3.
Figure 3. CV for individual controls (i.e., σi on the RHS of Equation (12)) corresponds to AV = 15 at various X and Cpk values. USL-LSL represents the difference in the upper and lower specification X.
It should be noted that the parameters on the RHS of Equation (12), other than η, are not unique to pan coating processes, as σi less than 0.51% (based on the 95–105% specifi-cation limit) is required and routinely met in pharmaceutical manufacturing. The chal-lenge for DCT processes lies in the control of η and meeting the tighter requirement of σi based on the 98.5–101.5% specification limit that allows for the CV to be as high as 6%.
The coating efficiency (η) is a function of many process parameters and requires con-sistent setup and controls [8]. The parameters with the highest impact on coating effi-ciency are atomizing and pattern air flow rates, spray rates, and gun-to-bed distance [16–18]. By keeping the nozzle assembly and setup consistent and ensuring the calibration of flowmeters, the batch-to-batch variability of the coating efficiency is minimized. If insol-uble API or excipients are in the coating solution, the size of insoluble particulates also affects the coating efficiency. For this reason, wet ball mills may be used prior to coating to homogenize the coating solutions.
3.2. Factors Affecting Precision (CV) In addition to the coating time, the material, equipment, and process parameters
should also be optimized to improve coating uniformity. This can be achieved by using literature models predicting CV. In this work, the analytical model developed by Choi et
3 4 5 6 7 8 9 10USL-LSL, %
0.1
0.2
0.3
0.4
0.5
0.6
0.7
0.8
0.9
1
1.1
Coe
ffici
ent o
f Var
iatio
n fo
r Ind
ivid
ual C
ontro
l, % Cpk = 0.67/Defect Rate = 4.5%
1.0/0.3%1.33/67 PPM1.66/0.6 PPM2.0/0.002PPM
Figure 3. CV for individual controls (i.e., σi on the RHS of Equation (12)) corresponds to AV = 15 atvarious X and Cpk values. USL-LSL represents the difference in the upper and lower specification X.
It should be noted that the parameters on the RHS of Equation (12), other than η,are not unique to pan coating processes, as σi less than 0.51% (based on the 95–105%specification limit) is required and routinely met in pharmaceutical manufacturing. Thechallenge for DCT processes lies in the control of η and meeting the tighter requirement ofσi based on the 98.5–101.5% specification limit that allows for the CV to be as high as 6%.
The coating efficiency (η) is a function of many process parameters and requires con-sistent setup and controls [8]. The parameters with the highest impact on coating efficiencyare atomizing and pattern air flow rates, spray rates, and gun-to-bed distance [16–18]. Bykeeping the nozzle assembly and setup consistent and ensuring the calibration of flowme-ters, the batch-to-batch variability of the coating efficiency is minimized. If insoluble API orexcipients are in the coating solution, the size of insoluble particulates also affects the coat-ing efficiency. For this reason, wet ball mills may be used prior to coating to homogenizethe coating solutions.
3.2. Factors Affecting Precision (CV)
In addition to the coating time, the material, equipment, and process parametersshould also be optimized to improve coating uniformity. This can be achieved by usingliterature models predicting CV. In this work, the analytical model developed by Choiet al. [7,8] is used since it has shown good agreement with literature data [4,19,20] andcorrelations [12,13]. The Choi model gives CV as a function of tablet diameter (dp), tablet
Pharmaceutics 2022, 14, 149 8 of 12
shape (ψ), bed porosity (ε), pan speed (.ϕ), coating time (τ), bed height (h), pan diameter
(D), and the characteristic size of the spray zone (∆):
CV =
√√√√ d1/6p
kn.ϕ
2/3τ
(θ+ sin θ)(2θ∆ − sin(2θ∆))
(2θ − sin(2θ))− (2θ∆ − sin(2θ∆))(13)
where θ = cos−1(
1− 2hD
)(14)
θ∆ = cos−1(
1− 2h− ∆
D
)(15)
and ∆ = k′∆dvψε
1− ε(16)
where ∆ is a function of the spray coverage of the bed surface and the spray penetrationinto the bed. k∆ is a proportionality factor, and dv is the volume-equivalent sphere diameterof the tablet. Varying τ should be the last resort to improve coating uniformity (i.e., tolower CV) since it increases operating costs. The design of the tablet geometry and coatingformulation, coating pan geometry, and other process variables should be optimized firstbefore considering longer coating times. However, batch-to-batch variability is expectedto be low once formulation, equipment, and process parameters are fixed or given tightspecifications. Consistency in the equipment set up of baffles, nozzle assembly, and location,and ensuring the calibration status of coating solutions, atomizing air, and pattern air flowrates, are critical for product quality.
Once the tablet formulation and pan equipment with optimized nozzle setup areselected, the highest pan speed with minimal tolerable tablet breakage and attrition shouldbe used. If the coating time is excessive, the batch size can be reduced to improve the cycletime.
For a desired CV, Equation (13) can be used to optimize the production rate (.B) based
on the coating time (τ), changeover time (tco), and batch size (wB), i.e.,
.B =
wBτ + tco
(17)
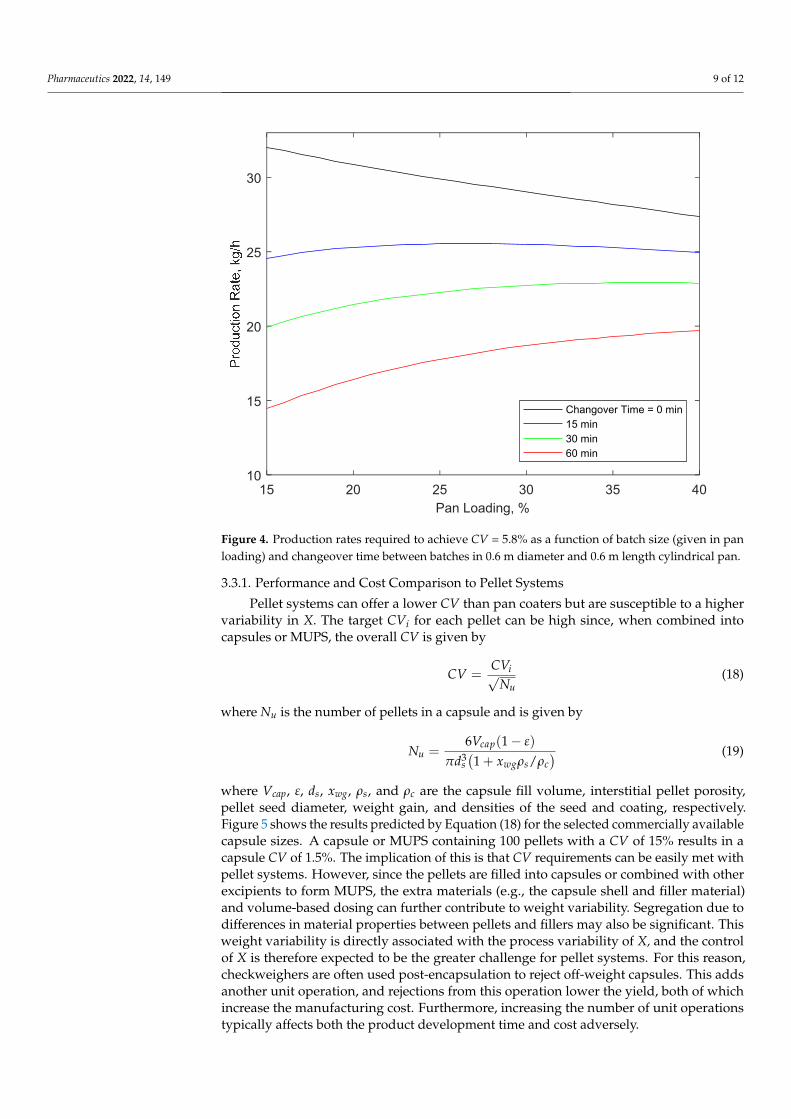
For fixed changeover times, larger batches have shorter changeover times per unit ofproduct due to the lower frequency of changeovers. However, as indicated by Equation (13),larger batches take longer to coat to the same coating uniformity. Consequently, largerbatches, shown in Figure 4 as % pan loading, will have higher production rates for longerchangeover times, while smaller batches will have higher production rates for shorterchangeover times.
3.3. Practical Implications
The incremental cost of reducing CV for DCT is high (especially at low CV values)because the coating time increases exponentially with a decreasing CV. Longer processingtimes mean a lower capacity and higher operating costs. There is potentially a majordisconnect between achieving the requisite CV values and minimizing manufacturing costs.However, on-specification manufacturing can still be achieved at high CV values (e.g., at aCV of 4–6%) with shorter coating times by minimizing the variability in X, as discussedabove. Targeting CV below 4–6% may be impractical for manufacturing drug-layeredtablets due to long coating times.
Pharmaceutics 2022, 14, 149 9 of 12
Pharmaceutics 2022, 14, x FOR PEER REVIEW 9 of 12
𝐶𝑉 = 𝐶𝑉𝑁 (18)
where Nu is the number of pellets in a capsule and is given by 𝑁 = 6𝑉 1 − 𝜀𝜋𝑑 1 + 𝑥 𝜌 𝜌⁄ (19)
where Vcap, ε, ds, xwg, ρs, and ρc are the capsule fill volume, interstitial pellet porosity, pellet seed diameter, weight gain, and densities of the seed and coating, respectively. Figure 5 shows the results predicted by Equation (18) for the selected commercially available cap-sule sizes. A capsule or MUPS containing 100 pellets with a CV of 15% results in a capsule CV of 1.5%. The implication of this is that CV requirements can be easily met with pellet systems. However, since the pellets are filled into capsules or combined with other excip-ients to form MUPS, the extra materials (e.g., the capsule shell and filler material) and volume-based dosing can further contribute to weight variability. Segregation due to dif-ferences in material properties between pellets and fillers may also be significant. This weight variability is directly associated with the process variability of X, and the control of X is therefore expected to be the greater challenge for pellet systems. For this reason, checkweighers are often used post-encapsulation to reject off-weight capsules. This adds another unit operation, and rejections from this operation lower the yield, both of which increase the manufacturing cost. Furthermore, increasing the number of unit operations typically affects both the product development time and cost adversely.
Figure 4. Production rates required to achieve CV = 5.8% as a function of batch size (given in pan loading) and changeover time between batches in 0.6 m diameter and 0.6 m length cylindrical pan.
The capital and operating costs of pellet systems are generally higher than the costs of tablet pan coaters. Pellet processing systems are typically fluid beds that pneumatically mix pellets, with the most widely used pellet coaters using Wurster technology. Fluid bed
15 20 25 30 35 40Pan Loading, %
10
15
20
25
30
Changover Time = 0 min15 min30 min60 min
Figure 4. Production rates required to achieve CV = 5.8% as a function of batch size (given in panloading) and changeover time between batches in 0.6 m diameter and 0.6 m length cylindrical pan.
3.3.1. Performance and Cost Comparison to Pellet Systems
Pellet systems can offer a lower CV than pan coaters but are susceptible to a highervariability in X. The target CVi for each pellet can be high since, when combined intocapsules or MUPS, the overall CV is given by
CV =CVi√
Nu(18)
where Nu is the number of pellets in a capsule and is given by
Nu =6Vcap(1− ε)
πd3s(1 + xwgρs/ρc
) (19)
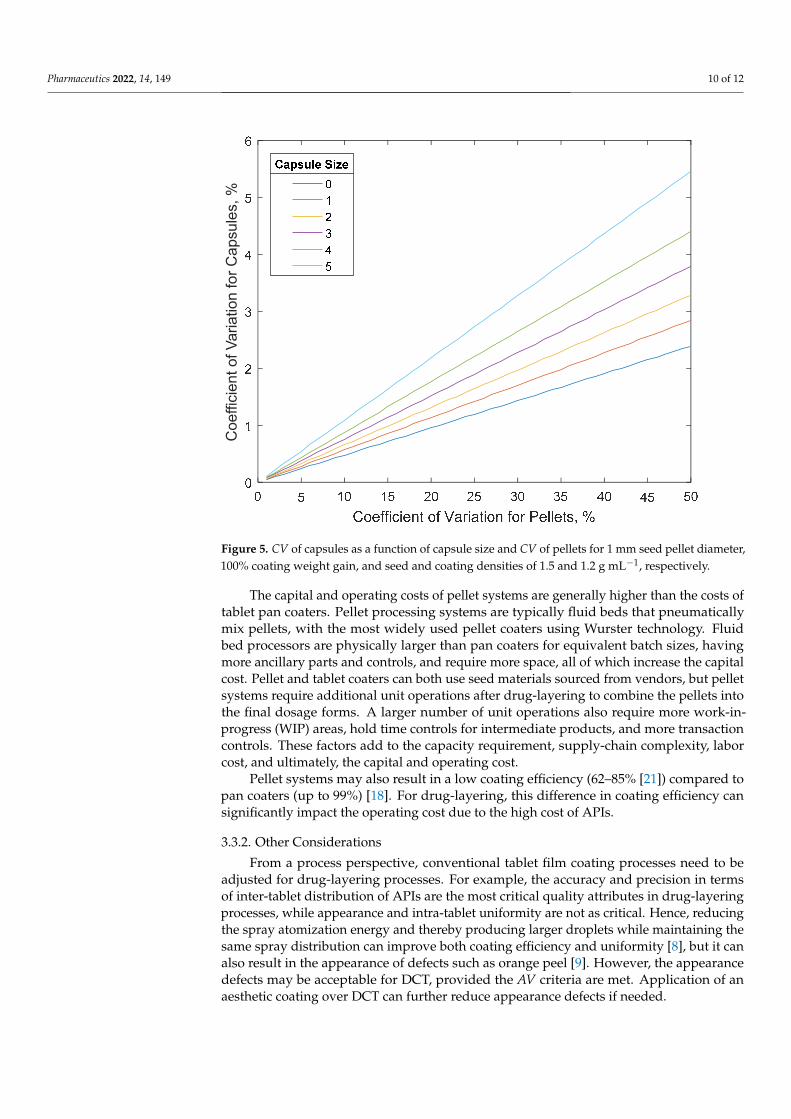
where Vcap, ε, ds, xwg, ρs, and ρc are the capsule fill volume, interstitial pellet porosity,pellet seed diameter, weight gain, and densities of the seed and coating, respectively.Figure 5 shows the results predicted by Equation (18) for the selected commercially availablecapsule sizes. A capsule or MUPS containing 100 pellets with a CV of 15% results in acapsule CV of 1.5%. The implication of this is that CV requirements can be easily met withpellet systems. However, since the pellets are filled into capsules or combined with otherexcipients to form MUPS, the extra materials (e.g., the capsule shell and filler material)and volume-based dosing can further contribute to weight variability. Segregation due todifferences in material properties between pellets and fillers may also be significant. Thisweight variability is directly associated with the process variability of X, and the controlof X is therefore expected to be the greater challenge for pellet systems. For this reason,checkweighers are often used post-encapsulation to reject off-weight capsules. This addsanother unit operation, and rejections from this operation lower the yield, both of whichincrease the manufacturing cost. Furthermore, increasing the number of unit operationstypically affects both the product development time and cost adversely.
Pharmaceutics 2022, 14, 149 10 of 12
Pharmaceutics 2022, 14, x FOR PEER REVIEW 10 of 12
processors are physically larger than pan coaters for equivalent batch sizes, having more ancillary parts and controls, and require more space, all of which increase the capital cost. Pellet and tablet coaters can both use seed materials sourced from vendors, but pellet sys-tems require additional unit operations after drug-layering to combine the pellets into the final dosage forms. A larger number of unit operations also require more work-in-pro-gress (WIP) areas, hold time controls for intermediate products, and more transaction con-trols. These factors add to the capacity requirement, supply-chain complexity, labor cost, and ultimately, the capital and operating cost.
Pellet systems may also result in a low coating efficiency (62–85% [21]) compared to pan coaters (up to 99%) [18]. For drug-layering, this difference in coating efficiency can significantly impact the operating cost due to the high cost of APIs.
Figure 5. CV of capsules as a function of capsule size and CV of pellets for 1 mm seed pellet diameter, 100% coating weight gain, and seed and coating densities of 1.5 and 1.2 g mL−1, respectively.
3.3.2. Other Considerations From a process perspective, conventional tablet film coating processes need to be ad-
justed for drug-layering processes. For example, the accuracy and precision in terms of inter-tablet distribution of APIs are the most critical quality attributes in drug-layering processes, while appearance and intra-tablet uniformity are not as critical. Hence, reduc-ing the spray atomization energy and thereby producing larger droplets while maintain-ing the same spray distribution can improve both coating efficiency and uniformity [8], but it can also result in the appearance of defects such as orange peel [9]. However, the appearance defects may be acceptable for DCT, provided the AV criteria are met. Appli-cation of an aesthetic coating over DCT can further reduce appearance defects if needed.
4. Conclusions
Coe
ffici
ent o
f Var
iatio
n fo
r Cap
sule
s, %
Figure 5. CV of capsules as a function of capsule size and CV of pellets for 1 mm seed pellet diameter,100% coating weight gain, and seed and coating densities of 1.5 and 1.2 g mL−1, respectively.
The capital and operating costs of pellet systems are generally higher than the costs oftablet pan coaters. Pellet processing systems are typically fluid beds that pneumaticallymix pellets, with the most widely used pellet coaters using Wurster technology. Fluidbed processors are physically larger than pan coaters for equivalent batch sizes, havingmore ancillary parts and controls, and require more space, all of which increase the capitalcost. Pellet and tablet coaters can both use seed materials sourced from vendors, but pelletsystems require additional unit operations after drug-layering to combine the pellets intothe final dosage forms. A larger number of unit operations also require more work-in-progress (WIP) areas, hold time controls for intermediate products, and more transactioncontrols. These factors add to the capacity requirement, supply-chain complexity, laborcost, and ultimately, the capital and operating cost.
Pellet systems may also result in a low coating efficiency (62–85% [21]) compared topan coaters (up to 99%) [18]. For drug-layering, this difference in coating efficiency cansignificantly impact the operating cost due to the high cost of APIs.
3.3.2. Other Considerations
From a process perspective, conventional tablet film coating processes need to beadjusted for drug-layering processes. For example, the accuracy and precision in termsof inter-tablet distribution of APIs are the most critical quality attributes in drug-layeringprocesses, while appearance and intra-tablet uniformity are not as critical. Hence, reducingthe spray atomization energy and thereby producing larger droplets while maintaining thesame spray distribution can improve both coating efficiency and uniformity [8], but it canalso result in the appearance of defects such as orange peel [9]. However, the appearancedefects may be acceptable for DCT, provided the AV criteria are met. Application of anaesthetic coating over DCT can further reduce appearance defects if needed.
Pharmaceutics 2022, 14, 149 11 of 12
4. Conclusions
The manufacture of oral dosage forms containing amorphous solids by the pan coatingof tablets involves significantly fewer unit operations than the more widely used processesbased on micronizing, spray drying, and hot-melt extrusion, followed by encapsulation.This results in pan-coaters having relatively lower capital and equipment costs as well asreduced set-up times and process complexities.
It was shown that the pan-coating of tablets can meet the harmonized USP/EP/JPacceptance value (AV) criteria. Analyses of the factors affecting accuracy and precision, thetwo parameters determining AV, indicate that the main difficulty in manufacturing drug-coated tablets is the practical limitations of coating precision. However, model analyses alsoshow that the AV criteria can be met by implementing appropriate monitors and controlsaround materials, maintenance, and setup and operation of processing equipment.
Author Contributions: All authors contributed to the study conception and design. Material prepa-ration, data collection and analysis were performed by M.C., S.C.P. and A.M. The first draft of themanuscript was written by M.C., and all authors commented on previous versions of the manuscript.All authors have read and agreed to the published version of the manuscript.
Funding: The publication of this work was funded by Particle Coating Technology Solutions, Inc.
Institutional Review Board Statement: Not applicable.
Informed Consent Statement: Not applicable.
Data Availability Statement: Not applicable.
Conflicts of Interest: The authors have no conflict of interest to declare that are relevant to the contentof this article.
References1. Boel, E.; Panini, P.; Van den Mooter, G. Development of a Surface Coating Technique with Predictive Value for Bead Coating in
the Manufacturing of Amorphous Solid Dispersions. Pharmaceutics 2020, 12, 878. [CrossRef] [PubMed]2. Aubert, J.; Mulder, C.J.; Schrör, K.; Vavricka, S.J. Omeprazole MUPS®: An advanced formulation offering flexibility and
predictability for self medication. SelfCare 2011, 2, 1–14.3. Patel, N.G.; Patel, S.A.; Joshi, A.B. Multiple unit pellet system (MUPS technology) for development of modified release fast
disintegrating tablets: A review. J. Pharm. Sci. Innov. 2017, 6, 50–56. [CrossRef]4. Chen, W.; Chang, S.-Y.; Kiang, S.; Marchut, A.; Lyngberg, O.; Wang, J.; Rao, V.; Desai, D.; Stamato, H.; Early, W. Modeling of pan
coating processes: Prediction of tablet content uniformity and determination of critical process parameters. J. Pharm. Sci. 2010, 9,3213–3225. [CrossRef] [PubMed]
5. Gaur, P.K.; Mishra, S.; Gautam, R.; Singh, A.P.; Yasir, M. Film Coating Technology: Past, Present and Future. J. Pharm. Sci.Pharmacol. 2014, 1, 57–67. [CrossRef]
6. Seo, K.-S.; Bajracharya, R.; Lee, S.H.; Han, H.-K. Pharmaceutical Application of Tablet Film Coating. Pharmaceutics 2020, 12, 853.[CrossRef] [PubMed]
7. Choi, M.; Porter, S.C.; Macht, B.; Meisen, A. Novel Coating Uniformity Models for Tablet Pan Coaters. AAPS PharmSciTech 2021,22, 7. [CrossRef] [PubMed]
8. Choi, M.; Porter, S.C.; Meisen, A. Interrelationships Between Coating Uniformity and Efficiency in Pan Coating Processes. AAPSPharmSciTech 2021, 22, 265. [CrossRef] [PubMed]
9. Porter, S.C. Troubleshooting appearance-related problems of film coated tablets. Tablets Capsul. 2008, 6, 16–22.10. United States Pharmacopeial Convention. General Chapters:<905> Uniformity of Dosage Units; USP35-NF30; United States
Pharmacopeial Convention: Rockville, MD, USA, 2012; p. 420.11. Sherony, D.F. A model of surface renewal with application to fluid bed coating of particles. Chem. Eng. Sci. 1981, 36, 845–848.
[CrossRef]12. Pandey, P.; Katakdaunde, M.; Turton, R. Modeling weight variability in a pan coating process using Monte Carlo simulations.
AAPS PharmSciTech 2006, 7, E2–E11. [CrossRef] [PubMed]13. Kalbag, A.; Wassgren, C. Inter-tablet coating variability: Tablet residence time variability. Chem. Eng. Sci. 2009, 64, 2705–2717.
[CrossRef]14. Choi, M. Determining the manufacturability of drug-layered tablets. Pharm. Manuf. 2007, 6, 34–42.15. Montgomery, D.C. Introduction to Statistical Quality Control, 8th ed.; Wiley: Hoboken, NJ, USA, 2020.16. Rege, B.D.; Gawel, J.; Kou, J.H. Identification of critical process variables for coating actives onto tablets via statistically designed
experiments. Int. J. Pharm. 2002, 237, 87–94. [CrossRef]

Pharmaceutics 2022, 14, 149 12 of 12
17. Tobiska, S.; Kleinebudde, P. Coating Uniformity: Influence of Atomizing Air Pressure. Pharm. Dev. Technol. 2003, 8, 39–46.[CrossRef] [PubMed]
18. Wang, J.; Hemenway, J.; Chen, W.; Desai, D.; Early, W.; Paruchuri, S.; Chang, S.-Y.; Stamato, H.; Varia, S. An evaluation of processparameters to improve coating efficiency of an active tablet film-coating process. Int. J. Pharm. 2012, 427, 163–169. [CrossRef][PubMed]
19. Brock, D.; Zeitler, J.A.; Funke, A.; Knop, K.; Kleinebudde, P. Evaluation of critical process parameters for intra-tablet coatinguniformity using terahertz pulsed imaging. Eur. J. Pharm. Biopharm. 2013, 85, 1122–1129. [CrossRef] [PubMed]
20. Boehling, P.; Toschkoff, G.; Knop, K.; Kleinebudde, P.; Just, S.; Funke, A.; Rehbaum, H.; Khinast, J. Analysis of large-scale tabletcoating: Modeling, simulation and experiments. Eur. J. Pharm. Sci. 2016, 90, 14–24. [CrossRef] [PubMed]
21. Podrekar, G.; Kitak, D.; Mehle, A.; Lavric, Z.; Likar, B.; Tomaževic, D.; Dreu, R. In-Line Film Coating Thickness Estimation ofMinitablets in a Fluid-Bed Coating Equipment. AAPS PharmSciTech 2018, 19, 3440–3453. [CrossRef] [PubMed]
Related Documents


