California Department of Fish and Game Master Plan for Marine Protected Areas January 2008 Page R-1 Appendix R. Science Methodology for Study Regions 1. North Coast Region (California/Oregon border to Alder Creek near Point Arena) To be added upon region completion

Welcome message from author
This document is posted to help you gain knowledge. Please leave a comment to let me know what you think about it! Share it to your friends and learn new things together.
Transcript
California Department of Fish and Game Master Plan for Marine Protected Areas January 2008 Page R-1
Appendix R. Science Methodology for Study Regions
1. North Coast Region (California/Oregon border to Alder Creek near Point Arena)
To be added upon region completion
California Department of Fish and Game Master Plan for Marine Protected Areas January 2008 Page R-2
2. North Central Coast Region (Alder Creek near Point Arena to Pigeon Point)
To be added upon region completion
California Department of Fish and Game Master Plan for Marine Protected Areas January 2008 Page R-3
3. San Francisco Bay Region (Waters within the San Francisco Bay, from the Golden Gate Bridge northeast to Carquinez Bridge)
To be added upon region completion
California Department of Fish and Game Master Plan for Marine Protected Areas January 2008 Page R-4
4. Central Coast Region (Pigeon Point to Point Conception)
Levels of Protection for MPA Classification
SMCA High Protection – These SMCAs protect benthic communities, both directly and indirectly, and allow only the take of pelagic finfish. Proposed SMCAs that prohibit take of all species except salmon and other pelagic finfish in water depth greater than 50m (164 ft) were placed in this category.17 SMCAs with high protection are equivalent to SMRs for protecting many, but not all, species and habitats. However, our understanding of the interactions among pelagic finfish and the benthic community is incomplete. Moreover, salmon fishing in deep water (>50m) can be conducted near the bottom, resulting in bycatch of benthic species. Therefore these SMCAs do not have as high protection and conservation value as no-take SMRs, and are less likely to achieve MLPA goals 1, 2, and 4. Moreover, SMRs are needed to evaluate the effects of SMCAs that allow the take of pelagic finfish.
SMCA Moderate Protection – These SMCAs protect the majority of benthic species and their habitats while allowing for the take of pelagic finfish, selected benthic fishes and invertebrates, and giant kelp (hand harvested only; see kelp harvesting section below). It is recommended that proposed SMCAs in central California that prohibit take of all species except pelagic finfish, squid, jacksmelt, butterfish, crab, spot prawn, and giant kelp should be placed in this category (a modified list of species may be appropriate in other parts of the state). These MPAs are considered to provide relatively lower protection than SMRs and SMCAs (high) primarily because they allow the take of species (crab, spot prawn and, to a lesser extent, squid) that have direct interaction, as predator, prey or habitat of those species targeted for protection. Thus, removal of these species can potentially affect the overall ecosystem (Goal 1) as well as particular species targeted for protection that feed on or otherwise interact with these species (Goal 2). In addition, take of crabs and spot prawns that live on the seafloor increases the likelihood of bycatch of those bottom-dwelling species that may be targeted for protection (i.e., rockfishes).
Although bycatch of bottom-dwelling species in market squid landings is considered minimal, the presence of bycatch has been documented through the Department’s port sampling program. The port sampling program records bycatch (i.e., presence or absence evaluations), but actual amounts of bycatch have not been quantified to date. During 2004, bycatch was present in about forty-nine percent of the observed squid landings in central California, but species that constituted bycatch were primarily pelagic finfish. Benthic species targeted for protection by MPAs comprised a very small component of the squid fishery (DFG18). Spawning squid occur near the bottom when attaching their egg masses directly onto sand sediment. Occurrence of squid as bycatch in bottom trawls also indicates their presence on or near the bottom and their co-occurrence with benthic species. Landing receipts from the commercial
17 In 2005, NOAA sponsored a conference, Benthic-pelagic linkages in MPA design: a workshop to explore the
application of science to vertical zoning approaches, held in Monterey, California. Participants considered the nature and magnitude of interactions among benthic and pelagic finfish, and the implications of these interactions for the design of MPAs. At this meeting, scientists and recreational fishing representatives agreed that bycatch is higher in water depths <50m (164 ft) and lower in deeper water. This information, along with incidental catch statistics provided by the Department, formed the basis of categorization of SMCAs into three relative levels of protection of bottom-dwelling species and their habitats. 18 California Department of Fish and Game, P. Reilly, personal communication)
California Department of Fish and Game Master Plan for Marine Protected Areas January 2008 Page R-5
butterfish and jacksmelt fisheries in central California indicate some bycatch of benthic soft-bottom species such as white croaker.
The magnitude of bycatch in the commercial spot prawn trap fishery19 was quantified from a Department observer program in 2000-2001. In central California (Point Conception to Monterey Bay), an average of about 150 pounds of bottom-dwelling fish was taken with every 1000 pounds of spot prawns. Thirty species of finfish were observed as bycatch in the spot prawn trap fishery. The top five species, in decreasing frequency of occurrence, were sablefish, rosethorn rockfish, greenblotched rockfish group (includes greenblotched, greenspotted, and pink rockfish), spotted cusk eel, and filetail catshark, comprising 78% of all fishes in the catch (by weight). Observed bycatch included seventeen species of rockfishes. Sea stars constituted the vast majority of invertebrates taken as bycatch. Other invertebrates included red rock crab, a large sea slug, galatheid crab, urchin, octopus, box crab, hermit crab, decorator crab, brittle star, feather star, and sea cucumber. Most invertebrates and many fish species, other than rockfishes, could be returned to the water alive.
Bycatch associated with the Dungeness crab trap fishery has not been documented. Although some fishes associated with sand sediments are likely caught in this fishery, other crabs (mostly rock crab) are the only species reported in Dungeness crab landings20.
SMCA Low Protection – These SMCAs protect some benthic species and their habitats. These proposed SMCAs allow various forms of commercial and recreational fishing and kelp harvesting. Both the directed take and potential bycatch from those fisheries will greatly limit the conservation value of these MPAs relative to SMRs and SMCAs of high and moderate protection. Also, mechanical harvest of giant kelp and the harvest of bull kelp by any method result in both direct and indirect take of many invertebrate and fish species (see kelp harvesting section below). As such, these SMCAs are least likely to assist in achieving MLPA goals 1, 2, and 4.
Kelp harvesting – Potential impacts of kelp harvesting depend on the species of kelp, the method of harvest (mechanical or hand collection), and the volume of plant material removed. For both methods, take is constrained by regulations to the upper 1.2 m (4 feet) of the forest canopy formed at the surface of the ocean. Harvest of kelp forests is targeted primarily at the giant kelp, Macrocystis pyrifera, and secondarily the bull kelp, Nereocystis luetkeana.Importantly, giant kelp is a perennial (individual plants can live multiple years), and reproduction and new growth occur at the bottom of the plant. In contrast, bull kelp is an annual (individuals live only one year), and reproduction and new growth occur at the top of the plant. In addition the gas-filled bladder responsible for keeping the bull kelp erect is located at the surface. Therefore, kelp harvesting, regardless of method, has a greater negative impact on bull kelp than on giant kelp.
Assessments of the impact of harvest (both mechanical and hand) on giant kelp suggest minimal impact to the kelp plants themselves because the plants are not removed entirely and can re-grow rapidly to replace the removed canopy. Moreover, the reproductive portion of the
19Reilly, P.N. and J. Geibel. 2002. Results of California Department of Fish and Game Spot Prawn Trawl and
Trap Fisheries Bycatch Observer Program 2000-2001. Report prepared for the California Fish and Game Commission (July 2002).20 Department, P. Reilly, personal communication).
California Department of Fish and Game Master Plan for Marine Protected Areas January 2008 Page R-6
plant is left intact at the bottom of the plant. However, harvest near the end of the summer may result in loss of the canopy for the remainder of the growing season. Whereas the amount of harvested bull kelp is much less than that of giant kelp, no impact assessment of harvesting has been conducted for bull kelp in California. However, negative impact to individuals and populations of bull kelp is likely to be much greater than giant kelp because the reproductive and growth capacity of the plants is terminated with harvest.
Of additional, and perhaps greater, concern with the harvesting of kelp is the (1) loss of habitat provided by the forest canopy for other species, (2) loss of production of plant material that is fed on by numerous grazers and detritivores in kelp forests and other habitats where drift kelp contributes to local productivity (e.g., heads of submarine canyons and sandy beaches), and (3) take (i.e., bycatch) of other species closely associated with the canopy habitat. The two harvesting methods differ markedly with respect to these three impacts. Mechanical kelp harvest is conducted by large, specially designed vessels that remove large volumes of the forest canopy and kill many associated species of fishes and invertebrates (including many species of juvenile rockfishes). Loss of habitat and food provided by kelp canopies translates to changes in growth, survival, and reproduction of those species associated with the canopy. The coastwide impact of this mortality on juvenile rockfishes has not been assessed. However, the impact to an individual kelp forest within a proposed MPA is likely to be substantial, with the loss of large numbers (1,000’s) of juveniles. Because of the impacts of mechanical kelp harvest on the well-understood role of kelp to the structure, function, and services provided by kelps to shallow reef ecosystems (Goal 1), and on many species targeted for protection (Goal 2), SMCAs that allow mechanical harvest of kelp, even if no other extractive activities are permitted, should be considered as having low protection and conservation value.
Impacts of hand harvest of kelp in support of the abalone mariculture industry have received less attention, in large part because of the presumed lesser impact of this method compared to mechanical harvest. The reduced impact is based in part on the lower volume of plant material removed and the likelihood that juvenile fishes are less likely to be removed with the canopy. However, experiments by the Department in 1977 indicated that kelp canopy removal might increase the likelihood that young-of-the-year rockfishes are consumed by opportunistic, predatory fishes such as juvenile bocaccio21. Repeated collection of the kelp canopy from the same area likely increases local-scale impacts on habitat and food production. Because the impacts of hand harvest on the well-understood role of kelp to the structure, function and services provided by kelps to shallow reef ecosystems (Goal 1), and on many species targeted for protection by MPAs (Goal 2) are less than the impacts from mechanical harvest, SMCAs that allow hand harvest of kelp should be considered as having moderate protection and conservation value.
21 Houk, J.L. and K. McCleneghan. 1993. Effects of kelp canopy removal on young-of-the-year rockfish abundance, using two census methods. Department, Administrative Report No. 93-5. 29 p
California Marine LifeProtection Act Initiative c/o California Resources Agency 1416 Ninth Street, Suite 1311 Sacramento, CA 95814
Methodology for Staff Evaluation of MLPA Goal 3 and SAT Evaluation of Replication in Proposed Central Coast MPA Packages
March 7, 2006
Staff Evaluation of MLPA Goal 3 in Proposed Central Coast MPA Packages
Goal 3 of the Marine Life Protection Act (MLPA) is:
“To improve recreational, educational, and study opportunities provided by marine ecosystems that are subject to minimal human disturbance, and to manage these uses in a manner consistent with protecting biodiversity.”
MLPA Initiative staff and the Master Plan Science Advisory Team (SAT) central coast evaluation sub-team used some simple metrics to evaluate how well the proposed central coast MPA packages address goal 3 of the MLPA.
The MLPA Initiative staff evaluation of recreational opportunities focused on accessibility of different types of MPAs to the public, specifically:
Distance of proposed MPAs from population centers. The number of MPAs within 0-15 and 15-50 miles of a population center (Santa Cruz, Monterey, San Luis Obispo or Santa Maria) was determined for each package.
Distance of proposed MPAs from major ports. The number of MPAs within 0-5, 5-15, and 15-50 miles of a port or harbor (Santa Cruz, Moss Landing, Monterey, Morro Bay or Port San Luis) was determined for each package. The 0-5mi distance reflects potential use of MPAs by users with small craft.
Stakeholder input. Input from the regional stakeholders at the Central Coast Regional Stakeholders Group meetings, as well as the proponents’ rationales provided with packages, provided qualitative information on how packages and specific MPAs meet different user group needs.
The MLPA Initiative staff and SAT evaluation of educational and study opportunities focused on:
A SAT evaluation of replication of habitats within the study region. The number of proposed MPAs (high protection MPAs and all MPAs) that contain each habitat was determined relative to the MLPA Master Plan Framework guidelines for replication
Staff evaluation of replication of habitats in SMRs. In addition, the MLPA requires replication of all habitats in state marine reserves (SMRs) across the biogeographical
California Marine Life Protection Act Initiative Methodology for Staff Evaluation of MLPA Goal 3 and SAT Evaluation of Replication
March 7, 2006
2
region [Fish and Game Code, Section 2857 (c)(3)]; the contribution of the central coast MPAs toward that biogeographical requirement was also evaluated.
Distance of proposed MPAs from major marine research institutions. The number of MPAs within 0-15 and 15-50 miles of the University of California, Santa Cruz Long Marine Lab; Monterey Bay Aquarium Research Institute; Hopkins Marine Station; or California Polytechnic Univeristy, San Luis Obispo was determined for each package.
Number of established marine research monitoring sites. The number of sites monitored by Partnership for Interdisciplinary Studies of Coastal Oceans (PISCO), Cooperative Research and Assessment of Near-shore Ecosystems (CRANE), and Multi-Agency Rocky Intertidal Network (MARINe) within MPAs was calculated for each package.
Recreational Opportunities
Goal 3 describes recreational opportunities in “ecosystems that are subject to minimal human disturbance” which we chose to interpret as SMRs and high protection SMCAs; these designations of MPAs are often preferable to many non-consumptive users (such as non-consumptive divers, photographers, wildlife viewers, kayakers, etc.). However, it should be noted that for consumptive uses (recreational fishing, including shore-fishing, skiff/kayak fishing, spear-fishing, and commercial party boats), users likely prefer accessible MPAs that allow recreational fishing (state marine parks [SMPs] and many SMCAs) and are considered to offer moderate to low protection. There was also recognition by the Central Coast Regional Stakeholder Group (CCRSG) members that MPAs which restrict fishing may enhance recreational opportunities inside those MPAs for those who like to see large fish, as well as potentially benefiting recreational opportunities in adjacent open areas by providing better fishing through spillover of targeted species.
For recreational opportunities, the issues are not so much overall numbers of accessible MPAs, rather than the types of activities allowed in specific popular sites, such as the Monterey waterfront and Carmel Bay that are highly valued by many different consumptive and non-consumptive user groups.
Educational and study opportunities
The MLPA requires replication of all habitats in SMRs in each biogeographical region (the central coast is included in the Point Conception to Oregon border biogeographical region).Submarine canyon habitat is rare in state waters; the central coast has the vast majority (around 90%) of this habitat in the biogeographical region, and therefore could more easily contribute towards replication of this habitat than other study regions to the north.
Educational and study opportunities are improved by the presence of MPAs near research institutions and MPAs that include established monitoring sites.
California Marine Life Protection Act Initiative Methodology for Staff Evaluation of MLPA Goal 3 and SAT Evaluation of Replication
March 7, 2006
3
SAT Evaluation of Replication of Habitats in Proposed Central Coast MPA Packages
The same criteria for habitat representation were used for this analysis as for the size and spacing analysis for most habitats. The exceptions were for kelp beds and submarine canyons. An MPA with any persistent kelp bed (kelp present in three of four years), no matter how small, was considered to have kelp habitat. Likewise, an MPA with any amount of canyon habitat, no matter how small, was considered to have that canyon type.
The evaluation of replication was conducted using four different groupings of MPAs: (1) state marine reserves (SMR), (2) those with high levels of protection (SMR and SMCA High), (3) those with low levels of protection (SMP-low, SMCA Moderate and SMCA Low), and (4) all MPAs together. Habitats were considered adequately replicated with a minimum of three replicate MPAs.
It should be noted that some MPAs have very small amounts of some habitats (ca. 0.5 sq. mi) but were counted in totals as being equal to MPAs with much larger areas of protected habitat. Also, some MPAs are listed as not having a particular habitat type but that might be found – with higher resolution data sets - to contain it. Significant differences among packages will more likely be found in the areas of habitat protected, and in the localities protected, rather than in number of protective MPAs defined in the fashion allowed by current habitat data.
California Marine Life Protection ActSize and Spacing Analyses
SAT SubteamMarch 9, 2006
Two goals of the Marine Life Protection Act deal primarily with issues related to the persistence of marine populations. Goal 2 focuses explicitly on the dynamics and persistence of marine populations:
MLPA Goal #2: “To help sustain, conserve, and protect marine life populations, including those of economic value, and rebuild those that are depleted.”
Goal 6 focuses on the collective function of the collection of MPAs:
MLPA Goal #6: “To ensure that the state's MPAs are designed and managed, to the extent possible, as a network.
Meeting these two goals was the stimulus for the size and spacing guidelines in the Master Plan Framework (MPF). With respect to MPA size, the MPF specifies two guidelines.
Size Guideline #1: “For an objective of protecting adult populations, based on adult neighborhood sizes and movement patterns, MPAs should have an alongshore span of 5-10 km (3-6 m or 2.5- 5.4 nm) of coastline, and preferably 10-20 km (6-12.5 m or 5.4-11 nm). Larger MPAs would be required to fully protect marine birds, mammals, and migratory fish.”
This size guideline arises primarily from data on the movement of adult and juvenile fishand invertebrates. Since MPAs will be most effective if they are substantially larger than the distance that individuals move, larger MPAs provide benefit to a wider diversity of species. A summary of existing scientific studies of adult movement (See Appendix 1) shows that adult movement varies greatly among California’s marine species (Table 1). Therefore the choice of any MPA size determines the subset of species that could potentially benefit. For species with average movement distances of 100s to 1000s of miles, MPAs are unlikely to be a source of significant protection (except when they protect critical locations, e.g., spawning or nesting grounds). As a result, the MPF guidelines focus on species in the first three movement categories in Table 1. Theminimum size guideline of 5 to 10 km targets species in the first two categories. Thepreferable 10 to 20 km size range attempts to provide substantially more benefit to the important group of species in category 3 (10 - 100 km movement). This group includes a number of important rockfishes from the California coast. Therefore, MPAs that meet the preferable size guideline should protect more biological diversity than MPAs that justmeet the less stringent minimum guideline.
Table 1. Scales of adult movement for California coastal marine species
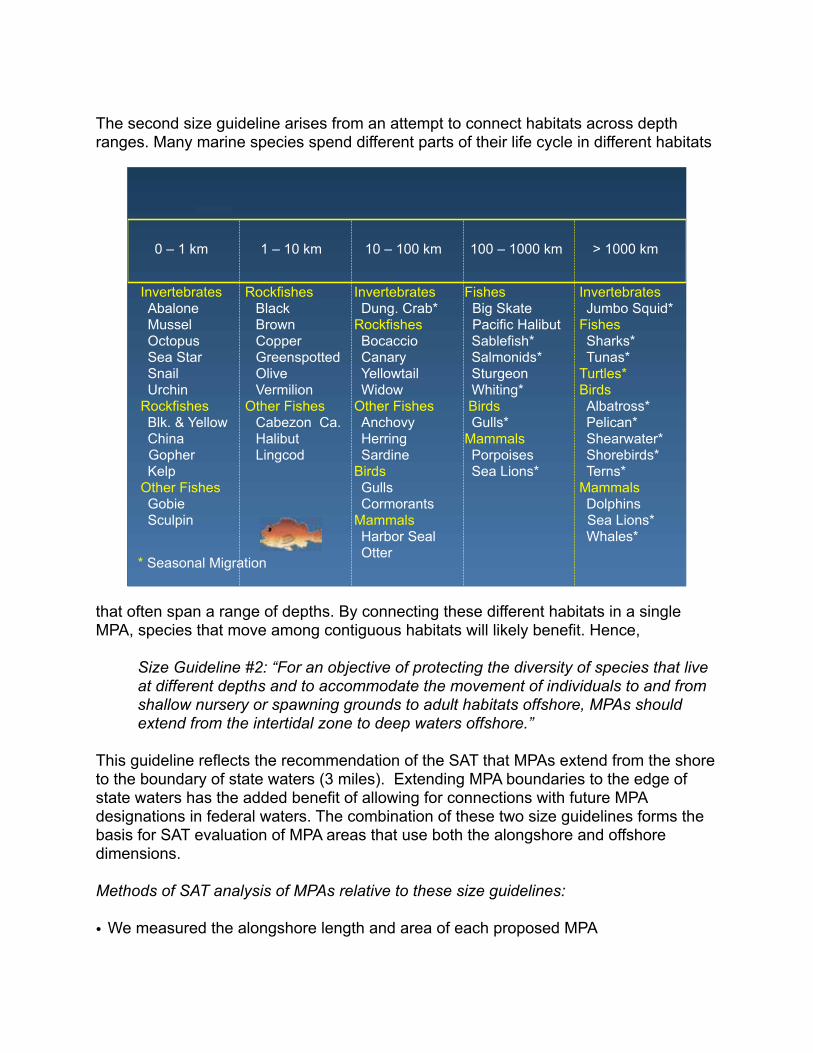
The second size guideline arises from an attempt to connect habitats across depth ranges. Many marine species spend different parts of their life cycle in different habitats
that often span a range of depths. By connecting these different habitats in a single MPA, species that move among contiguous habitats will likely benefit. Hence,
Size Guideline #2: “For an objective of protecting the diversity of species that live at different depths and to accommodate the movement of individuals to and from shallow nursery or spawning grounds to adult habitats offshore, MPAs should extend from the intertidal zone to deep waters offshore.”
This guideline reflects the recommendation of the SAT that MPAs extend from the shoreto the boundary of state waters (3 miles). Extending MPA boundaries to the edge of state waters has the added benefit of allowing for connections with future MPAdesignations in federal waters. The combination of these two size guidelines forms the basis for SAT evaluation of MPA areas that use both the alongshore and offshoredimensions.
Methods of SAT analysis of MPAs relative to these size guidelines:
• We measured the alongshore length and area of each proposed MPA
0 – 1 km 1 – 10 km 10 – 100 km 100 – 1000 km > 1000 km
InvertebratesAbaloneMusselOctopusSea StarSnailUrchin
RockfishesBlk. & YellowChina
GopherKelp
Other FishesGobieSculpin
InvertebratesJumbo Squid*
FishesSharks*Tunas*
Turtles*BirdsAlbatross*Pelican*Shearwater*Shorebirds*Terns*
MammalsDolphins
Sea Lions* Whales*
InvertebratesDung. Crab*
RockfishesBocaccioCanaryYellowtailWidow
Other FishesAnchovyHerringSardine
BirdsGullsCormorants
MammalsHarbor Seal Otter
Fishes Big Skate Pacific Halibut Sablefish*Salmonids*SturgeonWhiting*BirdsGulls*
MammalsPorpoisesSea Lions*
RockfishesBlackBrownCopperGreenspottedOliveVermilion
Other FishesCabezon Ca. HalibutLingcod
* Seasonal Migration
• When MPAs shared boundaries, we combined contiguous MPAs into a single MPAcluster
• We considered the level of protection in each component of an MPA cluster
• We tabulated the sizes of all MPAs and MPA clusters with respect to the MPF minimum and preferable guidelines.
• We considered which habitats were represented in MPA clusters that meet MPF minimum and preferable guidelines.
The MPF has one key spacing guideline related the maximum distance between MPAsfor the diversity of habitats in the Central Coast.
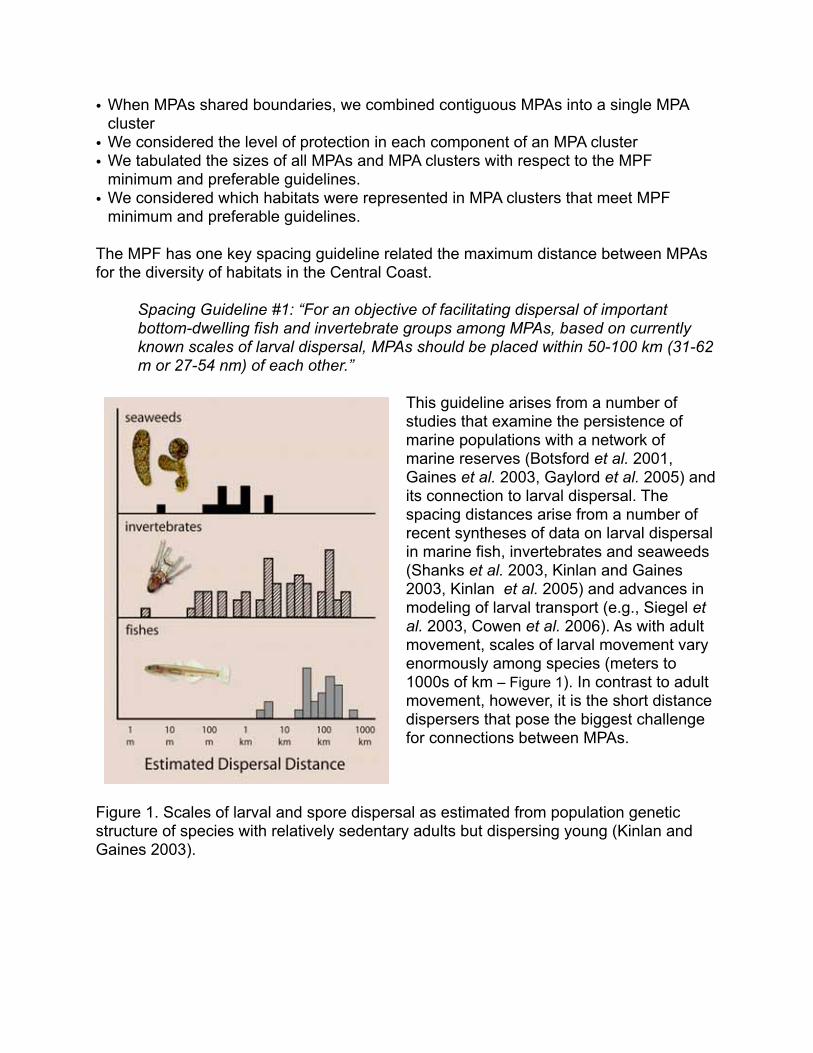
Spacing Guideline #1: “For an objective of facilitating dispersal of important bottom-dwelling fish and invertebrate groups among MPAs, based on currently known scales of larval dispersal, MPAs should be placed within 50-100 km (31-62 m or 27-54 nm) of each other.”
This guideline arises from a number of studies that examine the persistence of marine populations with a network of marine reserves (Botsford et al. 2001, Gaines et al. 2003, Gaylord et al. 2005) andits connection to larval dispersal. Thespacing distances arise from a number of recent syntheses of data on larval dispersal in marine fish, invertebrates and seaweeds (Shanks et al. 2003, Kinlan and Gaines 2003, Kinlan et al. 2005) and advances in modeling of larval transport (e.g., Siegel et al. 2003, Cowen et al. 2006). As with adult movement, scales of larval movement vary enormously among species (meters to 1000s of km – Figure 1). In contrast to adult movement, however, it is the short distance dispersers that pose the biggest challenge for connections between MPAs.
Figure 1. Scales of larval and spore dispersal as estimated from population genetic structure of species with relatively sedentary adults but dispersing young (Kinlan and Gaines 2003).
Methods of SAT analysis of MPAs relative to these spacing guidelines:
• Since the spacing guidelines are targeted at ensuring connectivity among MPAs for different species, MPAs must be characterized by the habitats they contain. An MPAthat does not contain habitat for a particular species (e.g., kelp forest), provides no benefit to that species. Therefore, we calculated the amount of each habitat (i.e., area or linear distance) in each MPA.
• We then calculated the % of the MPA that each habitat represents. For kelp forests, we calculated the % of shallow water habitat (<30m) only, since kelp does not grow in deeper waters.
• An MPA was considered to include a specific habitat if that habitat represented more than a critical fraction of the entire MPA. For common habitats (e.g., rocky intertidal, sandy beach, surfgrass/eelgrass, sand 0 to 30m), we used a threshold of 20% of the MPA. For rarer habitats, we reduced the threshold to either 15% (sand 30 to 100m, rocky reef 0 to 30m) or 10% (kelp forests, sand > 100m, rocky reef 30 to 100m). For the upwelling center habitat category, we counted all MPAs that included shallow and moderate depth habitats in the vicinity of the four major upwelling centers of the central coast – Año Nuevo/Davenport, Pt. Sur, Pt. Buchon, Pt. Arguello/Pt.Conception.
• The use of %s to define which habitats are present in a significant amount presents two problems. First, for small MPAs, even a large fraction of the MPA may represent an insignificant amount of habitat. We believe this problem can be adequately addressed by the MPA size analyses. Second, for large MPAs, even a large area of a particular habitat may represent a small percentage of the MPA. Since larger MPAshave substantial benefits as discussed above, we developed an alternative criterion based upon habitat area per se. We considered any habitat that represents more than 2 square miles of habitat within any MPA to be present in a meaningful amount for spacing analyses. This area was chosen based upon patterns of adult movement (seeAppendix 1).
• For each habitat we determined the spacing between all MPAs that included that habitat.
• We compared these spacings to the maximum spacing guidelines in the MPF.
Citations� (see Appendix 1 for citations on Adult Movement)
Botsford, L.W., Hastings, A., and Gaines, S.D. 2001. Dependence of sustainability on the configuration of marine reserves and larval dispersal distance. Ecology Letters 4: 144-150.
Gaines, S. D., B. Gaylord, and J. Largier. 2003. Avoiding current oversights in marine reserve design. Ecological Applications. 13:S32-46
Kinlan, B. and S. D. Gaines. 2003. Propagule dispersal in marine and terrestrial environments: a community perspective. Ecology. 84:2007-2020.
Shanks, A.L., Grantham, B.A. & Carr, M.H. 2003. Propagule dispersal distance and the size and spacing of marine reserves. Ecological Applications, 13, S159–S169.
Siegel, D., B. P. Kinlan, B. Gaylord and S. D. Gaines. 2003. Lagrangian descriptions of marine larval dispersion. Marine Ecology Progress Series. 260:83-96.
Gaylord, B., S. D. Gaines, D. A. Siegel, M. H. Carr. 2005. Consequences of populationstructure and life history for fisheries yields using marine reserves. Ecological Applications.15:2180-2191.
Kinlan, B. , S. D. Gaines, and S. Lester. 2005. Propagule dispersal and the scales of marine community process. Diversity and Distributions. 11:139-148.2005.
Cowen, R. K., C. B. Paris, A. Srinivasan. 2006 Scaling of connectivity in marinepopulations. Science. 311:522-527.
Appendix 1 – References on Movement of Adults
Bailey, K.M., R.C. Rancis, and P.R. Stevens. 1982. The life history and fishery of Pacific whiting, Merluccius productus. California Cooperative Oceanic and Fishery Investigations, Report 23:81–98.
Barnes, J.T. and D.H. Hanan. 1995. Status of the Pacific mackerel resource and fishery, 1994 and 1995. California Department of Fish & Game, Marine Resources Division, Admin. Report 95–4. 20 pp.
Barnes, J.T., A.D. MacCall, L.D. Jacobson, and P. Wolf. 1992. Recent population trends and estimates for the Pacific sardine (Sardinops sagax). California Cooperative Oceanic Fisheries Investigations, Report 33:60–75.
Baumgartner, T.R., A. Soutar, and V. Ferreira-Bartrina. 1992. Reconstruction of the history of Pacific sardine and northern anchovy populations over the past two millennia from sediments of the Santa Barbara Basin, California. California Cooperative Oceanic and Fisheries Investigations, Report 33:24–40.
Burton, E. J., J. M. Cope, L. A. Kerr, and G. M. Cailliet. 2000. Biological characteristics of nearshore fishes of California: A review of existing knowledge and proposed additional studies for the Pacific Ocean interjurisdictional fisheries management plan coordination and development. Report submitted to the Pacific State Marine Fisheries Commission. http://www.dfg.ca.gov/mrd/lifehistories/report_final.html
Cailliet, G.M. and D.W. Bedford. 1983. The biology of three pelagic sharks from California waters, and their emerging fisheries: A review. California Cooperative Oceanic and Fisheries Investigations, Report 24:57–69.
Cailliet, G.M., E.K. Osada, and M. Moser. 1988. Ecological studies of sablefish in Monterey Bay. California Department of Fish & Game 74(3):132–153.
Carlson, H. R. and R. E. Haight. 1972. Evidence for a home site and homing of adult yellowtail rockfish, Sebastes flavidus. J. Fish. Res. Bd. Canada 29:1011-1014.
Cass, A.J., G.A. McFarlane, M.S. Smith, I. Barber, and K. Rutherford. 1986. Lingcod tagging in the Strait of Georgia, 1983-84. Can. MS Rep. Fish. Aquat. Sci. 1875. 49 pp.
Coombs, C. I. 1979. Reef fishes near Depoe Bay, Oregon: movement and the recreational fishery. MS thesis, Oregon State University, Corvallis.
Culver, B. N. 1987. Results from tagging black rockfish (Sebastes melanops) off the Washington and northern Oregon coast. Pages 231-240 in Proceedings of the international rockfish symposium. University of Alaska Sea Grant Report 87-2, Fairbanks.
Dark, T.A. (ed.). 1985. Pacific whiting: the resource, industry, and management history.Marine Fisheries Review 47(2):1–98.
Hallacher, L. E. 1984. Relocation of original territories by displaced black-and-yellow rockfish, Sebastes chrysomelas, from Carmel Bay, California. Calif. Fish and Game Bull. 70(3):158-162.
Hartman, A. R. 1987. Movement of scorpionfishes (Scorpaenidae: Sebastes and Scorpaena) in the southern California Bight. Calif. Fish and Game Bull. 73(2):68-79.
Haugen, C.W. (ed.). 1990. The California halibut, Paralichthys californicus, resource and fisheries. California Department of Fish & Game Fish Bulletin 174.
Heilprin, D. J. 1992. The role of olfaction in the homing ability of the blue rockfish, Sebastes mystinus, in Carmel Bay, California. MS Thesis, Moss Landing Marine Laboratories, San Jose State University. 63 pp.
Horton, H.F. 1989. Species profiles: Life histories and environmental requirements of coastal fishes and invertebrates (Pacific Northwest) — Dover and rock sole. Biological Report, U.S. Fish and Wildlife Service. 17 pp.
Ianelli, J.N., R. Lauth, and L.D. Jacobson. 1994. Status of the thornyhead (Sebastolobus sp.) resource in 1994. National Marine Fisheries Service, AlaskaFisheries Science Center. 58 pp.
Jagielo, T.H. 1990. Movement of tagged lingcod Ophiodon elongatus at Neah Bay,Washington. Fish. Bull. 88(4):815-820.
Karpov, K. A., D. P. Albin, and W. H. VanBuskirk. 1995. The marine recreational finfishery in northern and central California: Historical comparison (1958-1986), status ofstocks (1980-1986), and effects of changes in the California Current. Bulletin Number 176 of the California Department of Fish and Game.
Kramer, S.H. 1990. Habitat specificity and ontogenetic movements of juvenile California halibut, Paralichthys californicus, and other flatfishes in shallow waters of southern California. Ph.D. thesis, University of California San Diego. 266 pp.
Krygier, E.E. and W.G. Pearcy. 1986. The role of estuarine and offshore nursery areas for young English sole, Parophrys vetulus Girard, off Oregon. U.S. Fisheries Bulletin 84:119–132.
Laurs, R.M. and R.J. Lynn. 1977. Seasonal migration of North Pacific albacore, Thunnus alalunga, into North American coastal waters: Distribution, relative abundance,and association with transition zone waters. U.S. Fishery Bulletin 75(4):795–822.
Lea, R. N., R. D. McAllister, and D. A. VenTresca. 1999. Biological aspects of nearshore rockfishes of the genus Sebastes from Central California, with notes on ecologically related sport fishes. Calif. Fish and Game Fish Bull No. 177. 109 pp.
Leet, W.S., C.M. Dewees, and C. W. Haugen. 1992. California's living marine resources. University of California Sea Grant, Davis. 257 pp.
Leet. W.S., C.M. Dewees, R. Klingbeil, and E. Larson. 2001. California's Living Marine Resources: A Status Report. California Department of Fish and Game. 593 pp.
Love, M. 1996. Probably more than you want to know about the fishes of the Pacific Coast. Really Big Press, Santa Barbara, CA. 381 pp.
Love, M.S., M. Yoklavich, and L. Thorsteinson. 2002. The rockfishes of the Northeast Pacific. University of California Press, Berkeley and Los Angeles, California. 404 pp.
MacCall, A. D., S. Ralston, D. Pearson, and E. Williams. 1999. Status of bocaccio offCalifornia in 1999 and outlook for the next millenium. In Appendix: Status of the Pacific coast groundfish fishery through 1999 and recommended acceptable biological catches
for 2000: Stock assessment and fishery evaluation. Pacific Fishery Management Council, 2130 SW Fifth Avenue, Suite 224, Portland, Oregon.
Matthews, K. R. 1990. An experimental study of the habitat preferences and movement patterns of copper, quillback, and brown rockfishes (Sebastes spp.).Environ. Biol. Fish. 29:161-178.
Matthews, K.R. 1992. A telemetric study of the home ranges and homing routes of lingcod Ophiodon elongatus on shallow rocky reefs off Vancouver Island, British Columbia. Fish. Bull. 90:784-790.
Mathews, S.B. and M. LaRiviere. 1987. Movement of tagged lingcod, Ophiodonelongatus, in the Pacific Northwest. Fish. Bull. 85(1):153-159.
Mathews, S. B., and M. W. Barker. 1983. Movements of rockfish (Sebastes) tagged in northern Puget Sound, Washington. Fishery Bulletin 82:916-922.
Miller, D.J. and J. Geibel. 1973. Summary of blue rockfish and lingcod life histories: Areef ecology study; and giant kelp, Macrocystis pyrifera, experiments in Monterey Bay,California. California Department of Fish & Game Fish Bulletin No. 158. 137 pp.
Pearcy, W. G. 1992. Movements of acoustically-tagged yellowtail rockfish Sebastesflavidus on Heceta Bank, Oregon. Fish. Bull. 90:726-735.
Pereyra, W.T., W.G. Pearcy, and F.E. Carvey, Jr. 1969. Sebastes flavidus, a shelf rockfish feeding on mesopelagic fauna, with consideration of the ecological implications.J. Fish. Res. Bd. Can. 26:2211-2215.
Smith, S.E. and N. Abramson. 1990. Leopard shark Triakis semifasciata distribution, mortality rate, yield, and stock replenishment estimates based on a tagging study in SanFrancisco Bay. U.S. Fishery Bulletin 88(2):371–381.
Stanley, R. D., B. M. Leaman, L. Haldorson, and V. M. O'Connell. 1994. Movements of tagged adult yellowtail rockfish, Sebastes flavidus, off the west coast of North America.Fish. Bull. 92:655-663.
Starr, R.M., V. O’Connell, and S.Ralston. 2004. Movements of lingcod (Ophiodonelongatus) in southeast Alaska: potential for increased conservation and yield from marine reserves. Canadian Journal of Fisheries and Aquatic Sciences, Vol. 61, No. 7. pp.1083 -1094.
Starr, R.M., J.N. Heine, J.M. Felton, and G.M. Cailliet. 2002. Movements of bocaccio (Sebastes paucispinis) and greenspotted (Sebastes chlorostictus) rockfishes in a Monterey submarine canyon: Implications for the design of marine reserves. Fishery Bulletin Vol. 100, No. 2. pp. 324-337.
Starr, R.M., J.N. Heine, and K.A. Johnson. 2000. In situ techniques for tagging and tracking rockfishes. North American Journal of Fisheries Management, Vol. 20:597-609.
Starr, R.M. and R.E. Thorne. 1998. Acoustic assessment of squid stocks. pp. 181-198 in: P.G. Rodhouse, E.G. Dawe, and R.K. O'Dor (eds.): Squid recruitment dynamics: the genus Illex as a model, the commercial Illex species and influences on variability. FAOFish. Tech. Pap. No. 376. Rome, Italy.
Wilkins, M.E. 1996. Long term trends in abundance: Results of triennial bottom trawl surveys of west coast groundfish resources between 1977 and 1995. Alaska Fisheries Science Center, NMFS/NOAA, 7600 Sand Point Way NE, Seattle, Washington 98115.
Yamanaka, K.L. and L.J. Richards. 1993. Movements of transplanted lingcod, Ophiodon elongatus, determined by ultrasonic telemetry. Fish. Bull. 91:582-587.
California Marine Life Protection Act Initiative
DRAFT SAT Evaluation Methods for Goals 1 and 4
23 January 2006
I. Background
Six packages of MPAs were submitted by the MLPA Initiative Staff to the SAT for their evaluation on 15 December 2005. The relative amount of protection afforded to habitats in the study region was evaluated for five of these packages. The SAT did not evaluate the sixth package because it did not address goal 6 of the MLPA and related network provisions of the Master Plan Framework (i.e., size and shape guidelines). Evaluation of the effects of the proposal (a single MPA) would not be possible without sites of comparable habitat outside an MPA. Thus, the single large ubiquitous MPA preempts evaluation. Additionally, the scientific study of relative impacts of fishing and other extractive activities among MPAs with various levels of protection is not possible within a configuration of a single MPA, which was the case in the sixth proposal.
Most of the five packages included information on rationale, regulations, area, habitats, species likely to be protected, boundaries, and goals for each proposed MPA. For each MPA in each of these packages, MLPA Initiative Staff provided estimates of length of shoreline (linear mile) for sandy/gravel beach, rocky intertidal, coastal marsh, tidal flat, and surfgrass habitats and area (mi2) of eelgrass, estuarine, soft sediment (0-30, 30-100, 100-200, >200 m), rock (0-30, 30-100, 100-200, >200 m), kelp, and canyon (0-30, 30-100, 100-200, >200 m) habitats. Kelp coverage was averaged from 1989, 1999, 2002, and 2003. The SAT did not consider pinnacle habitats in this evaluation because of poor data quality (i.e., many pinnacles were not identified in the data sets and therefore it was impossible to accurately estimate percentage of available habitat type being protected). [NOTE: Comments on headlands and
upwelling centers to come.]
Data that were used in this SAT evaluation were estimated from a geographic information system (GIS), which is an extremely valuable tool. However, errors in the estimates from the GIS exist because of the large number of data sources and the wide range in quantity and quality of data. An example of the limitations of these data is that the GIS analysis suggests that some of the proposed MPAs comprise completely soft sediment, whereas rocky habitats are known to occur within those MPAs. The SAT suggests that the overall approach to protection of habitats, replications, and distribution (size and spacing) is more relevant than the actual amount of a particular habitat found in a proposed MPA, because the same data set was used for all packages.
The SAT recognized that the distribution and abundance of the various habitat types are not uniform throughout the central coast study region. Therefore, to evaluate the proposed packages relative to MLPA Goal 4, the study region was divided into seven sub-regions, from north to south: Pigeon Point-Capitola; Capitola-Monterey Breakwater; Monterey Breakwater-Point Sur; Point Sur-San Martin; San Martin-Point Estero; Point Estero-Santa Marine River; and Santa Maria River-Point Conception. These subregions were delineated by comparable length of coastline and by clusters of proposed MPAs. An evaluation of representation of habitats within each MPA relative to availability of habitats at a smaller spatial scale (i.e., subregions) was more relevant than an analysis relative to the entire study region.Additionally, network functionality of the packages (goal 6) is better evaluated at the sub-regional spatial scale rather than across the entire study region. Percentage of available habitat in each habitat type was estimated for each of the seven subregions as well as for the entire study region.
II. Categories of Protection Level of Proposed MPAs
California Marine Life Protection Act Initiative DRAFT SAT Evaluation of Proposed MPA Packages
Page 2
The SAT categorized each MPA in each of the five packages by their relative level of protection.
Why categorize MPAs by levels of protection? The Marine Life Protection Act (MLPA) identifies three types of Marine Protected Areas (MPA): State Marine Reserves (SMR), State Marine Conservation Areas (SMCA), and State Marine Parks (SMP). There is great variation in the type and magnitude of activities that may be permitted within these MPAs, in particular SMPs and SMCAs. This variety purposely provides designers of MPA packages with flexibility in proposing MPAs that either individually or collectively fulfill the various goals and objectives specified in the MLPA. However, this flexibility can result in complex and possibly confusing levels of protection afforded by any individual MPA or collection of MPAs. In particular, SMCAs allow for many possible combinations of recreational and commercial extractive activities. Therefore, MPA proposals with similar numbers and sizes of SMCAs may in fact differ markedly in the type, degree, and distribution of protection throughout the study region. Thus, the purpose of categorizing MPAs by their relative level of protection is to simplify comparisons of the overall conservation value of MPAs within and among proposed packages.
Rationale for categories of protection. The SAT is evaluating the MPA proposals particularly with respect to five MLPA goals: 1, 2, 3, 4, and 6. Goal 1 addresses protection of the natural diversity and abundance of marine life, and the structure, function, and integrity of marine ecosystems. Goal 2 aims to help sustain, conserve, and protect marine life populations, including those of economic value, and rebuild those that are depleted. One aspect of Goal 3 that the SAT will evaluate is the opportunity tostudy marine ecosystems that are subject to minimal human disturbances. The SAT specifically will evaluate these proposals with respect to the replication of appropriate MPA designations, habitats, and control areas. Goal 4 pertains to the protection of marine natural heritage, including protection of representative and unique marine life habitats in central California waters. Goal 6 aims to ensure that the central coast’s MPAs are designed and managed, to the extent possible, as a component of a statewide network.
The likelihood that any particular MPA or collection of MPAs will meet any of these five goals is based in large part on the type and magnitude of removal or mortality (collectively referred to as “take”) of living marine resources that occurs within the MPAs. Three forms of take include (1) direct removal of a species from an MPA, (2) unintended incidental removal of a species in the process of targeting another species (referred to as “bycatch”), and (3) perturbation of the ecosystem in such a way that it leads to increased mortality of a species (e.g., alteration of habitat that leads to reduced refuge from predators). Take is not limited to fishing activities. For example, coastal power generating stations impinge fishes and invertebrates and entrain their larvae in the process of drawing ocean water for cooling systems. Likewise, many minor seawater intakes and sewage outfalls occur along the coast. The impacts of seawater intakes and sewage outfalls can be diffuse in nature, and can affect ecosystems both locally and regionally. The extent of these impacts is largely unknown. At Diablo Canyon Power Generating Station, in particular, differences in adult populations due to intake effects have not been detected. Therefore, the SAT is not including an evaluation of these potential sources of impacts on individual MPAs. Additionally, commercial kelp harvest can reduce habitat availability and may directly and indirectly increase mortality of juvenile fishes. Thus, the level of protection and conservation value afforded by any particular MPA depends very much on the type and magnitude of fishing and other human activities that will be allowed within the marine protected areas.
California Marine Life Protection Act Initiative DRAFT SAT Evaluation of Proposed MPA Packages
Page 3
State Marine Reserves (SMR) provide the greatest level of protection to species and to ecosystems by allowing no take of any kind (with the exception of scientific take for research, restoration, or monitoring). The high level of protection created by an SMR is based on the assumption that no other appreciable level of take or alteration of the ecosystem is allowed (e.g., sewage discharge, seawater pumping, kelp harvest). In particular, SMRs provide the greatest likelihood of achieving MLPA goals 1, 2, and 4.
State Marine Parks (SMP) are designed to provide recreational opportunities and therefore can allow some or all types of recreational take of a wide variety of fish and invertebrate species by various means (e.g., hook and line, spear fishing). Because of the variety of species that potentially can be taken and the potential magnitude of recreational fishing pressure, SMPs that allow recreational fishing provide
low protection and conservation value relative to other, more restrictive MPAs (e.g., SMRs and some SMCAs). Although SMPs have lower value for achieving MLPA goals 1 and 2, they may assist in achieving other MLPA goals.
State Marine Conservation Areas (SMCA) potentially have the most variable levels of protection and conservation of the three MPA designations because they allow any combination of commercial and recreational fishing, as well as other extractive activities (e.g., kelp harvest). Coastal MPAs are most effective at protecting species with limited range of movement and close associations to seafloor habitats. Less protection is afforded to more wide-ranging, transient species like salmon and other coastal pelagics (e.g., albacore, swordfish, pelagic sharks). This has led to proposals of SMCAs that prohibit take of bottom-dwelling species, while allowing the take of transient pelagic species. However, fishing for some pelagic species, like salmon near the bottom or in relatively shallow water, increases the likelihood of taking bottom species that are targeted for protection (e.g., California halibut, lingcod, rockfishes). Rates of bycatch are particularly high in shallow water where bottom fish move close to the surface and become susceptible to the fishing gear. In addition, for recreational salmon fishing, the practice of “mooching” has a potentially higher bycatch rate than that of trolling.
Participants at a recent national conference1 on benthic-pelagic coupling considered the nature and magnitude of interactions among benthic (bottom-dwelling) and pelagic species, and the implications of these interactions for the design of marine protected areas. At this meeting, scientists and recreational fishing representatives agreed that bycatch is higher in water depths <50m (164 ft) and lower in deeper water. This information, along with incidental catch statistics provided by CDFG, formed the basis of categorization of SMCAs into three relative levels of protection of bottom-dwelling species and their habitats.
SMCA High Protection – These SMCAs protect benthic communities, both directly and indirectly, and allow only the take of highly transient pelagic species. Proposed SMCAs that prohibit take of all species except salmon and coastal pelagics in water depth greater than 50m (164 ft) were placed in this category. The exception to this rule is a few proposed SMCAs in several packages that are located offshore of SMRS. We chose to assign a High protection level for those SMCAs whose inshore boundary extends to about 30 m, in primarily sand habitat. SMCAs with High Protection are equivalent to SMRs for protecting many, but not all, species and habitats. However, our understanding of the interactions among pelagic species and the benthic community is incomplete. Moreover, salmon fishing in deep
1 Benthic-pelagic linkages in MPA design: a workshop to explore the application of science to vertical zoning approaches. November 2005. Sponsored by NOAA National Marine Protected Area Center, Science Institute, Monterey, CA.
California Marine Life Protection Act Initiative DRAFT SAT Evaluation of Proposed MPA Packages
Page 4
water (>50m) can be conducted near the bottom, resulting in bycatch of benthic species. Therefore these SMCAs do not have as high protection and conservation value as no-take SMRs, and are less likely to achieve MLPA goals 1,2, and 4. Moreover, SMRs are needed to evaluate the effects of SMCAs that allow the take of coastal pelagics (including salmon).
The SAT also has categorized one proposed MPA as an SMCA with high protection, rather than as an SMR, because of the negative influence of elevated temperature of the cooling water discharged from the Diablo Canyon Power Generating Station. Although thermal impact of the cooling water discharge is constrained largely to Diablo Cove and the intertidal environment roughly 1.4 miles to the north of the Cove, this is sufficient impact to warrant an SMCA-high designation2.
SMCA Moderate Protection – These SMCAs protect the majority of benthic species and their habitats while allowing for the take of transient pelagics, selected benthic fishes and invertebrates, and giant kelp (hand harvested only; see Appendix 1). Proposed SMCAs that prohibit take of all species except salmon, pelagic fishes, squid, crab, spot prawn, and giant kelp were placed in this category. These MPAs are considered to provide relatively lower protection than SMRs and SMCAs (High) primarily because they allow the take of species (crab, spot prawn and, to a lesser extent, squid) that have direct interaction, as predator, prey or habitat of those species targeted for protection. Thus, removal of these species can potentially affect the overall ecosystem (Goal 1) as well as particular species targeted for protection that feed on or otherwise interact with these species (Goal 2). In addition, take of crabs and spot prawns that live on the seafloor increases the likelihood of bycatch of those bottom-dwelling species that are targeted for protection (i.e. rockfishes).
Although bycatch of bottom-dwelling species in market squid landings is considered minimal, the presence of bycatch has been documented through CDFG’s port sampling program. The port sampling program records bycatch (i.e., presence or absence evaluations), but actual amounts of bycatch have not been quantified to date. During 2004, bycatch was present in about forty-nine percent of the observed squid landings, but species that constituted bycatch were primarily other coastal pelagics. Benthic species targeted for protection by MPAs comprised a very small component of the squid fishery (CDFG3). Spawning squid occur near the bottom when attaching their egg masses directly onto sand sediment. Occurrence of squid as bycatch in bottom trawls also indicates their presence on or near the bottom and their co-occurrence with benthic species.
The magnitude of bycatch in the commercial spot prawn trap fishery4 was quantified from a CDFG observer program in 2000-2001. In central California (Pt. Conception to Monterey Bay), an average of about 150 pounds of bottom-dwelling fish was taken with every 1000 pounds of spot prawns. Thirty species of finfish were observed as bycatch in the spot prawn trap fishery. The top five species, in decreasing frequency of occurrence, were sablefish, rosethorn rockfish, greenblotched rockfish group (includes greenblotched, greenspotted, and pink rockfish), spotted cusk eel, and filetail catshark, comprising 78% of all fishes in the catch (by weight). Observed bycatch included seventeen species of
2 Issues and environmental impacts associated with once-through cooling at California’s coastal power plants. 2005. California Energy Commission, CEC-700-2005-013. Sacramento, CA. 81 pp + Appendices.
3 table 7b P. Reilly’s information (need proper citation) 4
Reilly, P.N. and J. Geibel. 2002. Results of California Department of Fish and Game Spot Prawn Trawl and Trap Fisheries
Bycatch Observer Program 2000-2001. Report prepared for the California Fish and Game Commission (July 2002).
California Marine Life Protection Act Initiative DRAFT SAT Evaluation of Proposed MPA Packages
Page 5
rockfishes. Sea stars constituted the vast majority of invertebrates taken as bycatch. Other invertebrates included red rock crab, a large sea slug, galatheid crab, urchin, octopus, box crab, hermit crab, decorator crab, brittle star, feather star, and sea cucumber. Most invertebrates and many fish species, other than rockfishes, could be returned to the water alive.
Bycatch associated with the Dungeness crab trap fishery has not been documented. Although some fishes associated with sand sediments are likely caught in this fishery, other crabs (mostly rock crab) are the only species reported in Dungeness crab landings5.
SMCA Low Protection – These SMCAs protect some benthic species and their habitats. These proposed SMCAs allow various forms of commercial and recreational fishing and kelp harvesting. Both the directed take and potential bycatch from those fisheries will greatly limit the conservation value of these MPAs relative to SMRs and SMCAs of high and moderate protection. Also, mechanical harvest of giant kelp and the harvest of bull kelp by any method result in both direct and indirect take of many invertebrate and fish species. As such, these SMCAs are least likely to assist in achieving MLPA goals 1, 2, and 4.
III. Description of Habitat Protection by Subregions Within Proposed Packages
The relative amount of protection afforded to 20 different habitat types by each of the five packages within the entire study region and within each of the seven subregions was evaluated using the SAT levels of protection assigned to each MPA (i.e., SMR, SMCA-High, SMCA-Moderate, SMCA-Low, and SMP), the amount of habitats available in each subregion, and the amount of habitats protected within the proposed MPAs. We assumed no kelp harvesting occurs in the proposed MPAs unless specifically designated. The estimated area (or linear extent) of habitat in each proposed MPA was divided by the estimated area (or linear extent) of each habitat available in each subregion. These proportions were summed across MPAs of similar protection level within a subregion to estimate percentage of habitat protected at each level within each sub-region for each package.
IV. Summary
We were asked to provide an evaluation of how well each of the proposed MPA packages achieves the statutory requirements of MLPA goals one and four. To evaluate the packages, we first reviewed the information provided by the proponents for each proposed MPA. We then identified levels of protection afforded by each proposed MPA, based on our knowledge of the habitats and species in the proposed MPAs and the types and magnitudes of impacts that we expect would be created by the proposed allowable activities in each MPA. The next step in our analysis included an evaluation of the habitats available in each of seven subregions in the central coast study region, and the percentage of habitats protected by packages in each subregion. We used the percentage of habitat protected as the primary tool to determine the levels of habitat representation and protection for each package. These analyses provided quantitative estimates of the amount of habitats protected in all habitats, depths, and subregions of the central coast study area. This subregion approach provided an indication of how well proposed packages protect representative marine habitats (Goal 4) in central California.
5 Table on crab landings; need proper citation from Paul R.

California Marine Life Protection Act Initiative DRAFT SAT Evaluation of Proposed MPA Packages
Page 6
Scientific models have been developed to provide estimates of the amount of protection needed to protect the diversity and abundance of some habitats and species. There is, however, scientific debate about how much of a particular habitat or combination of habitats is needed to protect a community of species, and preserve the structure and function of ecosystem (MLPA Goal 1). The level of risk that a society is willing to accept is an important concept in the determination of the amount of habitat necessary to achieve MLPA Goal 1, as is an understanding of the magnitude of existing human alterations to biological communities and habitats.
California Marine Life Protection Act Initiative DRAFT SAT Evaluation of Proposed MPA Packages
Page 7
Appendix 1. Other human activities that alter ecosystem protection and conservation value of an MPA
Kelp harvesting – Potential impacts of kelp harvesting depend on the species of kelp, the method of harvest (mechanical or hand collection), and the volume of plant material removed. For both methods, take is constrained by regulations to the upper 1.2 m (4 feet) of the forest canopy formed at the surface of the ocean. Harvest of kelp forests is targeted primarily at the giant kelp, Macrocystis pyrifera, and secondarily the bull kelp, Nereocystis luetkeana. Importantly, giant kelp is a perennial (individual plants can live multiple years), and reproduction and new growth occur at the bottom of the plant. In contrast, bull kelp is an annual (individuals live only one year), and reproduction and new growth occur at the top of the plant. In addition the gas-filled bladder responsible for keeping the bull kelp erect is located at the surface. Therefore, kelp harvesting, regardless of method, has a greater negative impact on bull kelp than on giant kelp.
Assessments of the impact of harvest (both mechanical and hand) on giant kelp suggest minimal impact to the kelp plants themselves because the plants are not removed entirely and can re-grow rapidly to replace the removed canopy. Moreover, the reproductive portion of the plant is left intact at the bottom of the plant. However, harvest near the end of the summer may result in loss of the canopy for the remainder of the growing season. Whereas the amount of harvested bull kelp is much less than that of giant kelp, no impact assessment of harvesting has been conducted for bull kelp in California. However, negative impact to individuals and populations of bull kelp is likely to be much greater than giant kelp because the reproductive and growth capacity of the plants is terminated with harvest.
Of additional, and perhaps greater, concern with the harvesting of kelp is the (1) loss of habitat provided by the forest canopy for other species, (2) loss of production of plant material that is fed on by numerous grazers and detritivores in kelp forests and other habitats where drift kelp contributes to local productivity (e.g., heads of submarine canyons and sandy beaches), and (3) take (i.e. bycatch) of other species closely associated with the canopy habitat. The two harvesting methods differ markedly with respect to these three impacts. Mechanical kelp harvest is conducted by large, specially designed vessels that remove large volumes of the forest canopy and kill many associated species of fishes and invertebrates (including many species of juvenile rockfishes). Loss of habitat and food provided by kelp canopies translates to changes in growth, survival, and reproduction of those species associated with the canopy. The coastwide impact of this mortality on juvenile rockfishes has not been assessed. However, the impact to an individual kelp forest within a proposed MPA is likely to be substantial, with the loss of large numbers (1,000’s) of juveniles. Because of the impacts of mechanical kelp harvest on the well-understood role of kelp to the structure, function, and services provided by kelps to shallow reef ecosystems (Goal 1), and on many species targeted for protection (Goal 2), SMCAs that allow mechanical harvest of kelp, even if no other extractive activities are permitted, are considered to be of
low protection and conservation value.
Impacts of hand harvest of kelp in support of the abalone mariculture industry have received less attention, in large part because of the presumed lesser impact of this method compared to mechanical harvest. The reduced impact is based in part on the lower volume of plant material removed and the likelihood that juvenile fishes are less likely to be removed with the canopy. However, experiments by CDFG in 1977 indicated that kelp canopy removal might increase the likelihood that young-of-the-year
California Marine Life Protection Act Initiative DRAFT SAT Evaluation of Proposed MPA Packages
Page 8
rockfishes are consumed by opportunistic, predatory fishes such as juvenile bocaccio6. Repeated collection of the kelp canopy from the same area likely increases local-scale impacts on habitat and food production. Because the impacts of hand harvest on the well-understood role of kelp to the structure, function and services provided by kelps to shallow reef ecosystems (Goal 1), and on many species targeted for protection by MPAs (Goal 2) are less than the impacts from mechanical harvest, SMCAs that allow hand harvest of kelp are considered to be moderate in their protection and conservation
value.
6 Houk, J.L. and K. McCleneghan. 1993. Effects of kelp canopy removal on young-of-the-year rockfish abundance, using two census methods. California Dept. Fish and Game, Administrative Report No. 93-5. 29 p
California Marine Life Protection Act Initiative Master Plan Science Advisory Team
MLPA Goals and Evaluation of Scientific Elements March 2006
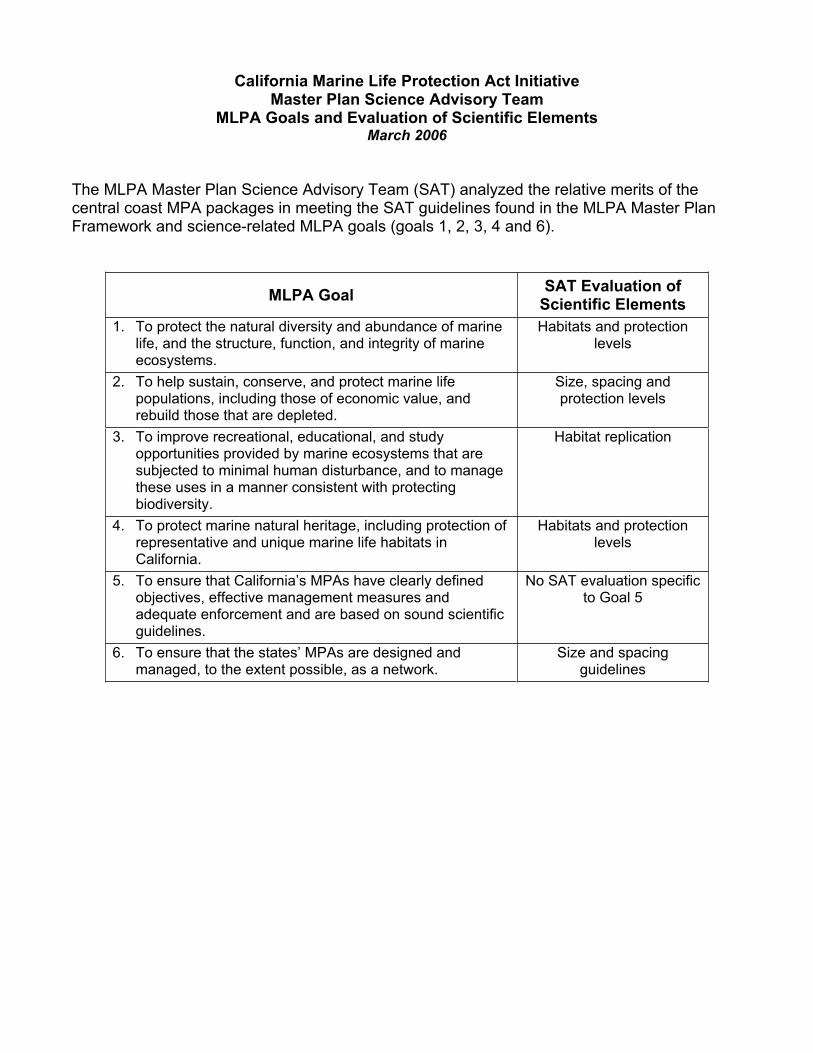
The MLPA Master Plan Science Advisory Team (SAT) analyzed the relative merits of the central coast MPA packages in meeting the SAT guidelines found in the MLPA Master Plan Framework and science-related MLPA goals (goals 1, 2, 3, 4 and 6).
MLPA Goal SAT Evaluation of
Scientific Elements
1. To protect the natural diversity and abundance of marine life, and the structure, function, and integrity of marine ecosystems.
Habitats and protection levels
2. To help sustain, conserve, and protect marine life populations, including those of economic value, and rebuild those that are depleted.
Size, spacing and protection levels
3. To improve recreational, educational, and study opportunities provided by marine ecosystems that are subjected to minimal human disturbance, and to manage these uses in a manner consistent with protecting biodiversity.
Habitat replication
4. To protect marine natural heritage, including protection of representative and unique marine life habitats in California.
Habitats and protection levels
5. To ensure that California’s MPAs have clearly defined objectives, effective management measures and adequate enforcement and are based on sound scientific guidelines.
No SAT evaluation specific to Goal 5
6. To ensure that the states’ MPAs are designed and managed, to the extent possible, as a network.
Size and spacing guidelines
Commercial fishing grounds and their
relative importance off the Central Coast
of California
Report to the California Marine Life Protection Act Initiative
In partial fulfillment of Contract No. 2005-0067M
Astrid Scholz
Charles Steinback
Mike Mertens
Field staff:
Kristi Birney, Kate Bonzon, Corey Chan, Sofia Hamrin, Miller Henderson, Natalie
Hubbard, Sarah Klain, Carissa Klein, Nicole Woodling
20 April 2006
Table of Contents
I. Introduction
II. Background – Why map the fishing grounds?
III. Methods
IV. Results and Deliverables
V. Discussion and Conclusion
VI. References
VII. Appendices:
1. Scope of work
2. English language consent form
3. Vietnamese language consent form
4. Final Executive Summary of impact analyses conducted, forwarded to the Blue Ribbon
Task Force in March 2006, as an example of analyses of proposed packages of MPAs
in the Central Coast.
I. Introduction
Ecotrust was retained by Marine Life Protection Act Initiative (MLPAI) in May of 2005
to collect, compile and analyze fishery data in support of the Central Coast Project (see
Appendix 1, scope of work).
During the summer of 2005, our research team developed and deployed a local
knowledge interview instrument, using an interactive, custom computer interface, to
collect geo-referenced information about the extent and relative importance of central
coast commercial fisheries. In the fall and winter of 2005/06, we compiled these data in a
geographic information system (GIS) that we delivered to the MLPAI for integration into
a central geodatabase housed at the University of California at Santa Barbara. We
analyzed the fishery data and additional data provided to us by the California Department
of Fish and Game to estimate first-order maximum potential impacts of proposed marine
protected area networks developed in the MLPA process.
This report completes our deliverables, complementing the data and analytical
deliverables already forwarded to the MLPAI under the terms of our contract. It details
the approach and methods used for collecting, compiling and analyzing commercial
fisheries data in the central coast. We further discuss the results and deliverables from
this project. It is important to note, however, that the analysis conducted under the scope
of this contract is not the sum total of everything that could be done with the database and
the information contained therein. Indeed, the analysis conducted to date is suggestive of
many more questions and research directions than could be pursued in the timeframe. We
hope that this project not only makes a useful contribution to the MLPA process, but also
opens the door to further inquiry drawing on the expert knowledge of fishermen and other
mariners.
Conducting qualitative research in coastal communities is as challenging as it is
rewarding. Asking sensitive questions about people’s livelihoods, and doing so at the
height of the summer fishing season and during a frequently contentious policy process
should have been daunting. That it wasn’t speaks to the commitment and generosity of
the fishing community. We have learned a tremendous amount from the participants in
this study, and the countless other community members, stakeholders, and observers of
the MLPA process.
We are deeply thankful to the 109 fishermen who participated in the interviews—making
time in their busy schedules, overcoming sometimes considerable reservations, and
sharing their knowledge and experience with us. We thank all the members of the Central
Coast Regional Stakeholder Group and the MLPAI staff, and are especially grateful to
Jeremiah and Trudi O’Brien and Kirk Sturm for facilitating several project meetings in
Morro Bay, Rick Algert, Jay Elder, and Tom Ghio for memorable boat trips, Steve
Scheiblauer for the use of his office for project meetings in Monterey, and Paul Reilly for
countless close readings of our data and results.

We believe that this project makes a significant, new contribution to the knowledge base
on the coast—not just for marine protected area planning, but for enhancing the public’s
and decision-makers’ understanding of the importance of the coastal ocean to coastal
communities and economies.
---------------------------------------------
For questions or comments, please contact Dr. Astrid Scholz, Ecotrust, 721 NW 9th
Avenue, Portland, OR 97206; email: [email protected]; phone: 503 467 0758
In addition to serving as the Principal Investigator on this study, Astrid Scholz is also a
member of the Master Plan Science Advisory Team of the Marine Life Protection Act
Initiative (http://www.dfg.ca.gov/mrd/mlpa/mpsat.html) and serves on the Ecosystem
Protection – Marine Protected Areas working group of the Monterey Bay National
Marine Sanctuary as part of the Joint Management Plan Review process
(http://sanctuaries.noaa.gov/jointplan/mb_mpa.html).
II. Background – why map the fishing grounds?In California as elsewhere on the Pacific Coast, commercial and recreational fisheries
support coastal communities and economies; they are pursued by vessels of all shapes
and sizes, using a variety of gear types and fishing strategies, and covering a large part of
the coastal ocean. In general, this spatial extent of fishing activities is relatively poorly
understood.
While a variety of data are collected by state and federal agencies to monitor and enforce
fisheries and set harvest allocations, the thematic, temporal and spatial resolution of these
data sets varies considerably. Data range from agency observer data in some fisheries to
voluntary reports in others, from mandatory daily logbooks with detailed location
information in some fisheries, to landing receipts using large statistical reporting blocks.
With marine and fisheries management becoming more focused on ecosystem-based
approaches, using tools such as time and area closures, accurate spatial information about
coastal fisheries is central to informing policy decisions.
These spatial information gaps in coastal fisheries can be filled using existing data or
collecting new information, and this report describes one such effort undertaken to
redress the spatial information gaps in commercial fisheries in the context of the Marine
Life Protection Act (MLPA), and its implementation in the Central Coast Study region.
In previous iterations of the MLPA processes, the use of existing data was controversial
since these data are riddled with artifacts. This is especially prevalent in landing receipts,
the only source of data consistently available for all commercial fisheries. Landing
receipts are typically filled out by fish buyers at the point of landing, and the data
collection forms contain a field for statistical reporting blocks. Fishermen report, and
agency staff working with landing receipts confirm, that the block information is
typically filled in by the buyer irrespective of the actual provenance of the catch, making
the spatial information contained in landing receipts unreliable. For example, most of the
catch of Dungeness crab, according to information extracted from landing receipts, would
appear to come from depths greater than 2,000 fathoms—waters well past the reach of
the San Francisco crab fleet—while the grounds of most economic importance to the fleet
look virtually unfished.
Clearly, basing management decisions on the spatial information contained in existing
data sources would be undesirable. The alternative, then, is to collect new information
about the spatial extent of fishing activities. In the absence of comprehensive observer
coverage, vessel monitoring systems or other fishery-independent data collection devices,
by far the best source of information about the fishing grounds is the fleet itself.
In this project, therefore, we built on existing approaches to collect fishermen’s expert
knowledge about the fishing grounds. The goal was to develop maps of the fishing
grounds and characterize their relative importance for various fisheries. The next section
contains a detailed description of the methods used and the analysis conducted.

III. Methods
In this project, we built on methods developed in previous projects on the coast (Scholz et al.
2004; 2005; 2006), using a computer interface to administer a survey, collecting information
from fishermen1 and analyzing the responses in a geographic information system (GIS). The key
innovation in this project was the use of California Department and Fish and Game (CDFG)
landing receipts to structure a representative sample.
While the use of GIS technology and analysis in marine and fishery management has expanded
steadily over the past decade (Meaden 1996; Kruse et al. 2001; Breman 2002; Valavanis 2002;
Fisher and Rahel 2004), its use for socioeconomic research is still somewhat limited. Many of
the applications reviewed in the recent literature focus on urban populations or natural resource
use in developing countries (Gimblett 2002; Goodchild and Janelle 2004; Anselin et al. 2004).
Nevertheless, there are several good examples to build on for improving the spatial specificity of
the West Coast knowledge base and data landscape. Some of the most pertinent applications of
GIS technology to socioeconomic questions in fisheries concern the spatial extent of fishing
effort and intensity (Caddy and Carocci 1999; Green and King 2003), and use participatory
methods similar to the ones employed here (Wedell et al. 2005; St. Martin 2004, 2005, 2006).
We built on these approaches and adapted them for the California context, following best
practices for the use of participatory GIS in natural resource management (Quan et al. 2001), as
described in the remainder of this section.
III.1 The study region
The study region of this project is congruent with the Central Coast Project of the
MLPAI, spanning approximately 200 miles of coast between Pigeon Point, north of Santa
Cruz, to Point Conception northwest of Santa Barbara (for details of the Central Coast
Project, see http://www.dfg.ca.gov/mrd/mlpa/centralcoast.html).
Unlike the Central Coast Project, however, the western extent of our study region is not
bounded by the state water boundary. Rather, we considered the entire Exclusive
Economic Zone (EEZ) in this project, although in reality most fisheries are confined to
within 50 miles offshore. Similarly, we did not impose the southern and northern extent
of the Central Coast Project. Methodologically this means that we did not “cut off” the
area for fishermen to consider, but asked them to draw their fishing grounds irrespective
of political boundaries.
In keeping with the convention adopted by the MLPAI, we stratified our study region
into a Northern and Southern part. The Northern section extends from Pigeon Point to the
southern border of Monterey County, and includes the ports of Santa Cruz, Moss Landing
and Monterey. The Southern section spans the remainder of the coast, from the northern
border of San Luis Obispo County to Point Conception, and includes the ports of Morro
Bay, Port San Luis and Avila. We considered primarily landings made in these ports for
1 In keeping with the usage in the fishing community, we use “fisherman” to talk about both male and
female members of the fishing industry.
identifying fishermen and describing the resulting sample. It is, however, the case that
many fishermen fishing in the study region also make landings outside of it.
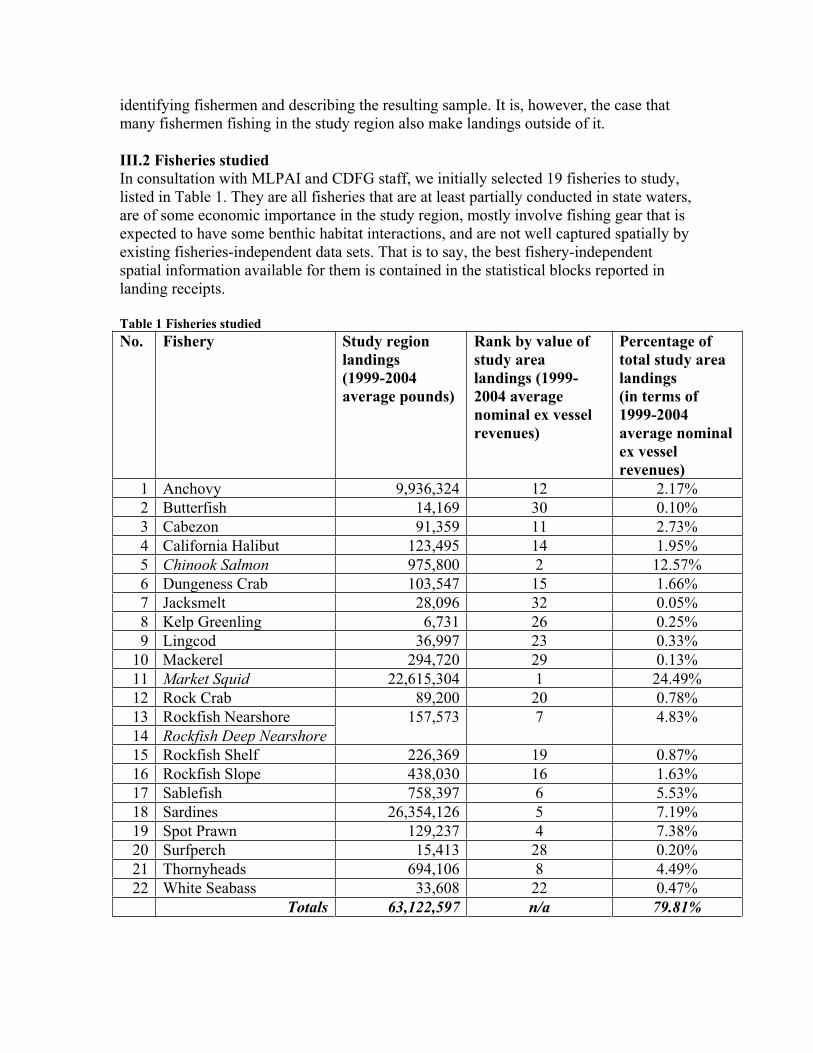
III.2 Fisheries studied
In consultation with MLPAI and CDFG staff, we initially selected 19 fisheries to study,
listed in Table 1. They are all fisheries that are at least partially conducted in state waters,
are of some economic importance in the study region, mostly involve fishing gear that is
expected to have some benthic habitat interactions, and are not well captured spatially by
existing fisheries-independent data sets. That is to say, the best fishery-independent
spatial information available for them is contained in the statistical blocks reported in
landing receipts.
Table 1 Fisheries studied
No. Fishery Study region
landings
(1999-2004
average pounds)
Rank by value of
study area
landings (1999-
2004 average
nominal ex vessel
revenues)
Percentage of
total study area
landings
(in terms of
1999-2004
average nominal
ex vessel
revenues)
1 Anchovy 9,936,324 12 2.17%
2 Butterfish 14,169 30 0.10%
3 Cabezon 91,359 11 2.73%
4 California Halibut 123,495 14 1.95%
5 Chinook Salmon 975,800 2 12.57%
6 Dungeness Crab 103,547 15 1.66%
7 Jacksmelt 28,096 32 0.05%
8 Kelp Greenling 6,731 26 0.25%
9 Lingcod 36,997 23 0.33%
10 Mackerel 294,720 29 0.13%
11 Market Squid 22,615,304 1 24.49%
12 Rock Crab 89,200 20 0.78%
13 Rockfish Nearshore
14 Rockfish Deep Nearshore
157,573 7 4.83%
15 Rockfish Shelf 226,369 19 0.87%
16 Rockfish Slope 438,030 16 1.63%
17 Sablefish 758,397 6 5.53%
18 Sardines 26,354,126 5 7.19%
19 Spot Prawn 129,237 4 7.38%
20 Surfperch 15,413 28 0.20%
21 Thornyheads 694,106 8 4.49%
22 White Seabass 33,608 22 0.47%
Totals 63,122,597 n/a 79.81%
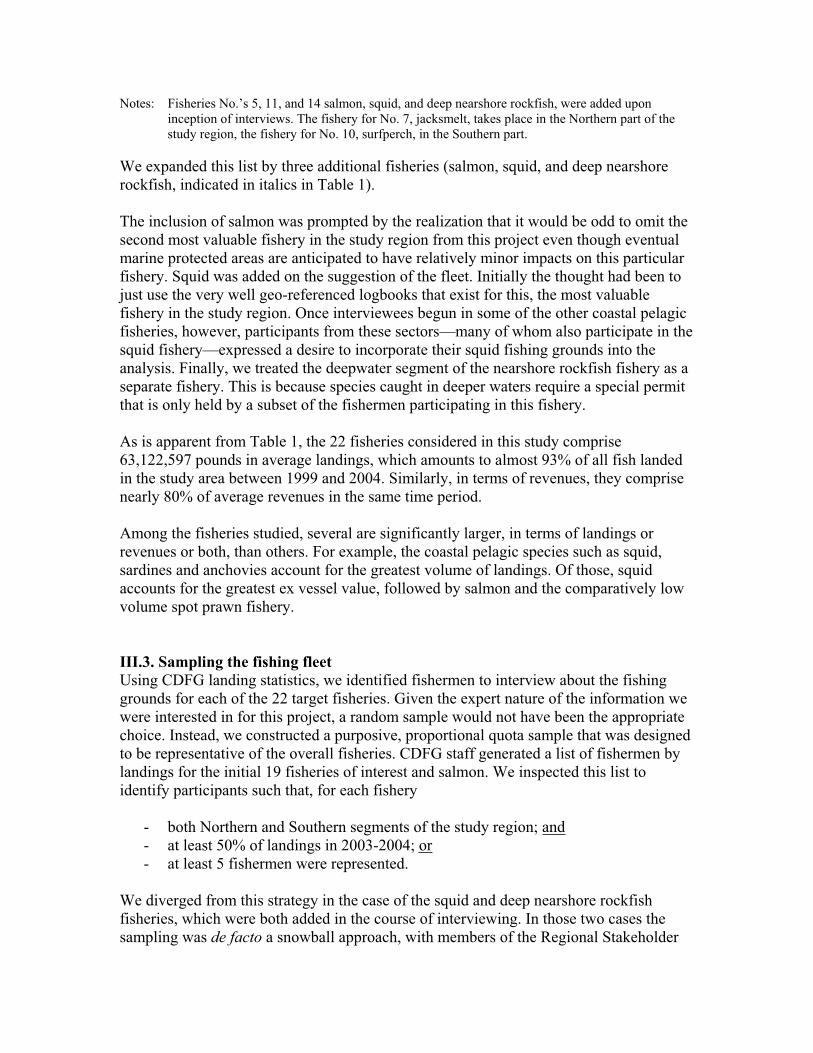
Notes: Fisheries No.’s 5, 11, and 14 salmon, squid, and deep nearshore rockfish, were added upon
inception of interviews. The fishery for No. 7, jacksmelt, takes place in the Northern part of the
study region, the fishery for No. 10, surfperch, in the Southern part.
We expanded this list by three additional fisheries (salmon, squid, and deep nearshore
rockfish, indicated in italics in Table 1).
The inclusion of salmon was prompted by the realization that it would be odd to omit the
second most valuable fishery in the study region from this project even though eventual
marine protected areas are anticipated to have relatively minor impacts on this particular
fishery. Squid was added on the suggestion of the fleet. Initially the thought had been to
just use the very well geo-referenced logbooks that exist for this, the most valuable
fishery in the study region. Once interviewees begun in some of the other coastal pelagic
fisheries, however, participants from these sectors—many of whom also participate in the
squid fishery—expressed a desire to incorporate their squid fishing grounds into the
analysis. Finally, we treated the deepwater segment of the nearshore rockfish fishery as a
separate fishery. This is because species caught in deeper waters require a special permit
that is only held by a subset of the fishermen participating in this fishery.
As is apparent from Table 1, the 22 fisheries considered in this study comprise
63,122,597 pounds in average landings, which amounts to almost 93% of all fish landed
in the study area between 1999 and 2004. Similarly, in terms of revenues, they comprise
nearly 80% of average revenues in the same time period.
Among the fisheries studied, several are significantly larger, in terms of landings or
revenues or both, than others. For example, the coastal pelagic species such as squid,
sardines and anchovies account for the greatest volume of landings. Of those, squid
accounts for the greatest ex vessel value, followed by salmon and the comparatively low
volume spot prawn fishery.
III.3. Sampling the fishing fleet
Using CDFG landing statistics, we identified fishermen to interview about the fishing
grounds for each of the 22 target fisheries. Given the expert nature of the information we
were interested in for this project, a random sample would not have been the appropriate
choice. Instead, we constructed a purposive, proportional quota sample that was designed
to be representative of the overall fisheries. CDFG staff generated a list of fishermen by
landings for the initial 19 fisheries of interest and salmon. We inspected this list to
identify participants such that, for each fishery
- both Northern and Southern segments of the study region; and
- at least 50% of landings in 2003-2004; or
- at least 5 fishermen were represented.
We diverged from this strategy in the case of the squid and deep nearshore rockfish
fisheries, which were both added in the course of interviewing. In those two cases the
sampling was de facto a snowball approach, with members of the Regional Stakeholder
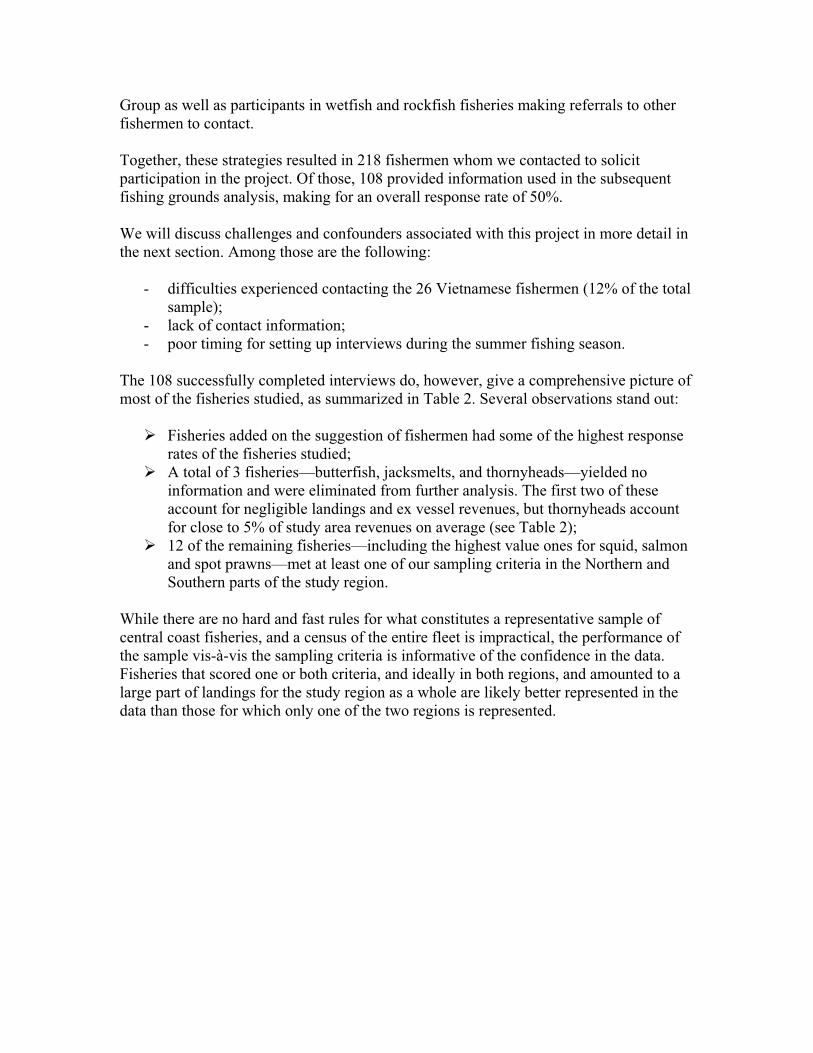
Group as well as participants in wetfish and rockfish fisheries making referrals to other
fishermen to contact.
Together, these strategies resulted in 218 fishermen whom we contacted to solicit
participation in the project. Of those, 108 provided information used in the subsequent
fishing grounds analysis, making for an overall response rate of 50%.
We will discuss challenges and confounders associated with this project in more detail in
the next section. Among those are the following:
- difficulties experienced contacting the 26 Vietnamese fishermen (12% of the total
sample);
- lack of contact information;
- poor timing for setting up interviews during the summer fishing season.
The 108 successfully completed interviews do, however, give a comprehensive picture of
most of the fisheries studied, as summarized in Table 2. Several observations stand out:
Fisheries added on the suggestion of fishermen had some of the highest response
rates of the fisheries studied;
A total of 3 fisheries—butterfish, jacksmelts, and thornyheads—yielded no
information and were eliminated from further analysis. The first two of these
account for negligible landings and ex vessel revenues, but thornyheads account
for close to 5% of study area revenues on average (see Table 2);
12 of the remaining fisheries—including the highest value ones for squid, salmon
and spot prawns—met at least one of our sampling criteria in the Northern and
Southern parts of the study region.
While there are no hard and fast rules for what constitutes a representative sample of
central coast fisheries, and a census of the entire fleet is impractical, the performance of
the sample vis-à-vis the sampling criteria is informative of the confidence in the data.
Fisheries that scored one or both criteria, and ideally in both regions, and amounted to a
large part of landings for the study region as a whole are likely better represented in the
data than those for which only one of the two regions is represented.
A
B
C
D
E
F
G
Per
form
an
ce i
n t
erm
s of
sam
pli
ng
cri
teri
a
++
=
both
cri
teri
a m
et
+ =
on
e cr
iter
ion
met
- =
nei
ther
cri
teri
on
met
0 =
no
in
terv
iew
s
No
. F
ish
ery
F
ish
erm
en
con
tact
ed
Fis
her
men
inte
rvie
wed
Res
pon
se
rate
% o
f to
tal
stu
dy r
egio
n
lan
din
gs
rep
rese
nte
d b
y
fish
erm
en
sam
ple
d
(2003-2
005)
Nort
h
Sou
th
1
An
cho
vy
1
1
8
73
%
50
%
++
N
ot
fish
ed h
ere
2
Bu
tter
fish
4
0
0
%
---
0
0
3
Cab
ezo
n
35
2
4
69
%
46
%
+
++
4
Cal
ifo
rnia
Hal
ibu
t 4
5
32
7
1%
3
2%
+
+
5C
hin
ook
Salm
on
89
5
6
63
%
22
%
+
+
6
Du
ng
enes
s C
rab
2
8
14
5
0%
2
2%
+
+
+
7
Jack
smel
t 5
0
0
%
---
0
0
8
Kel
p G
reen
lin
g
33
1
7
52
%
35
%
+
+
9
Lin
gco
d
50
2
8
54
%
33
%
+
+
10
M
ack
erel
1
1
7
64
%
39
%
- N
ot
fish
ed h
ere
11
Mark
et S
quid
1
7
16
9
4%
3
5%
+
+
+
12
R
ock
Cra
b
21
7
3
3%
5
4%
-
+
13
R
ock
fish
Nea
rsh
ore
4
5
32
7
1%
4
2%
+
+
14
Rock
fish
Dee
p
Nea
rsh
ore
19
1
9
10
0%
3
1%
+
+
15
Rock
fish
Shel
f
16
Rock
fish
Slo
pe
33
6
1
8%
6
%
- -
17
S
able
fish
2
0
7
35
%
7%
-
-
18
S
ard
ines
1
9
8
42
%
46
%
+
No
t fi
shed
her
e
19
S
po
t P
raw
n
9
6
67
%
92
%
++
+
+
20
S
urf
per
ch
11
3
2
7%
6
%
No
t fi
shed
her
e -
21
T
ho
rny
hea
ds
10
0
0
%
---
0
0
22
W
hit
e S
eab
ass
19
6
3
2%
0
%
- -
Tab
le 2
Des
crip
tion
of
the
fish
erm
en s
am
ple
III.4. Collecting and analyzing the fishing ground information
During the summer months of 2005 (June through August) Ecotrust personnel
interviewed 108 fishermen along the central coast. Fishermen were selected based on
CDFG data and recommendations by the Regional Stakeholder Group, as described
above.
Ecotrust personnel contacted fishermen by phone, explained the project and obtained
written consent of participants (see Appendices 2 and 3 for sample consent forms). The
project was also described on a web page, at http://www.ecotrust.org/mlpa, which
included a toll free phone number and on-line form for submitting any questions. Staff at
Ecotrust’s office in Portland arranged for interviews with contracted field staff based in
Santa Cruz, Monterey, Morro Bay and Santa Barbara. The format included one-on-one or
small group interviews, with follow-up meetings by fishery and/or gear group during
which the information collected was validated by fishermen.
Throughout the project we strove to protect the confidentiality of the information
provided by fishermen. In addition to obtaining the explicit consent of individual
participants, we undertook several additional steps for protecting sensitive information.
These include masking all names and identifying characteristics of shapefiles; showing
the aggregated maps for each fishery to no-one outside that fishery; developing a
mechanism for incorporating the information into the MLPAI geodatabase at sufficiently
aggregated levels; and devising a display format that maintains the information content
without making it visible, for use in stakeholder group meetings.
Data were entered into a GIS using a custom-built ArcView interface known as
OceanMap originally developed by Environmental Defense, and modified for the Central
Coast study region. The interface allows field staff to enter fishing grounds identified by
respondents directly into a spatial database, and standardize this information across a
number of respondents or fisheries. It is programmed to allow fishermen to draw shapes
in their natural sizes (polygons) rather than confining responses to a grid. Although data
are summarized to a variety of grids for the subsequent analysis, the raw data are entered
in natural shapes and at whatever spatial scale makes sense to respondents.
All interviews follow a shared protocol:
1. Maximum extent: Using electronic and paper nautical charts of the area,
fishermen are asked to identify, by fishery, the maximum extent north, south, east
and west they would forage or target a specie(s).
2. Scaling: They are then asked to identify, within this maximum forage area, which
areas are of critical economic importance, over their cumulative fishing
experience, and to rank these using a weighted percentage—an imaginary “bag of
100 pennies” that they distribute over the fishing grounds;
3. Port association: Based on the areas the fisherman have identified, they are then
asked about the northern and southern range of ports that they would land their
catch, and specific ports within that range. They are also asked for their license
number.
The first step establishes the maximum extent of the fleet in each fishery. This differs for
all fisheries, some of which range far along the entire West Coast, while others are
confined to inshore waters. In the subsequent analysis this allows us to distinguish
between fisheries that take place wholly in the MLPAI central coast region from others
that take place inside and outside.
The second step serves to scale respondents’ reporting of the relative importance of the
fishing grounds to a common scale. This is important for making inter and intra fishery
comparisons. We chose 100 pennies as an intuitive common sum scale for scoring the
relative importance of subareas identified within the larger fishing grounds. It also
provides us with a convenient accounting unit for aggregating the stated importance per
unit area in the intermediary steps of the various analyses performed.
The port association is relevant for linking the fishing grounds to landing ports, since not
all landings are necessarily made in ports adjacent to the grounds. Indeed, several
fisheries that are conducted within the study area make significant landings outside the
study area. For this project, we had direct use of the fishermen’s license numbers, which
are also recorded in the CDFG landing receipts.
The analysis of the fishing ground information follows a series of discrete steps:
1. Determining the Fishing Grounds
Through a set interviews following the above protocol, fishermen are asked to identify
their fishing grounds for a specific fishery. In order to determine the fishing grounds G
for any given fishery, the fishing grounds identified by the fishermen (i.e. the area of all
the shapes, j) is summarized. Each fisherman f interviewed, identifies his/her fishing
grounds Gf , per fishery as one or more shapes Gf = j, where j = 1,…,…n. The number
of shapes differs for each respondent and by fishery. If there is only one shape, then Gf =
j.
Each shape j in fisherman’s f’s fishing grounds is then converted to a grid with a 100m-
cell size. For example, in the Dungeness crab fishery, each shape identified by a
fisherman now equals some multiple of 100m cells, so the total number of cells in one
shape, Cj = n, where n = 1,…,C. The crab fishing grounds for each fisherman Gf , is now
represented by the total number of cells for all of his\her shapes:
j
Gf = Cjn=1
But, in order to normalize each shape by the total area, the entire crab fishing grounds
Gcrab, need to be determined. This will be used in a later step that effectively weights the
response according to the relative size of the respondent’s fishing footprint to the
composite fishing grounds. The composite fishing grounds Gcrab , is based on all the
shapes provided by all fishermen, and it is necessary to account for the possible overlap
of shapes identified by multiple fishermen. This is done by expressing whether a cell
exists for j in any given location (cell) through the following equation:
G = b
Where b = result of the Boolean expression:
does j exist for any i for location x, y. 1 = true, 0 = false.
If we were to just sum the number of cells of every j, identified by every f, the resulting
sum would not be for a unique x, y location and count multiple occurrences in the same
location. In other words, the fishing grounds of any one fisherman Gf , are smaller or
equal to the total grounds for that fishery.
2. Determining the Relative Importance (RI)
Each respondent allocates a budget, , of 100 “pennies,” representing his or her total
effort for that fishery, by allocating some portion of pennies, P, to each shape, j, on their
fishing grounds, Gf , such that Pj = 100. Each shape j is now associated with a distinct
number of cells, Cj , and a weight, Pj .
The value of each cell in the shape is then the number of pennies allocated to the shape
divided by the number of cells in the shape. So as not to overstate the relative importance
of cells associated with shapes identified by fishermen who reported smaller fishing
grounds (thus concentrating value in a sub-section of the composite grounds, G), we
multiply the value of each cell (Pj ⁄ Cj ), by the number of cells for that fisherman’s
grounds, Gf , divided by the total number of cells in the composite fishing grounds for the
entire shape (Gf ⁄ G). This weights the response according to the relative size of the
respondent’s fishing footprint, Cj , to the composite fishing grounds, G, or normalizes by
the total area.
Each cell for every given shape is now represented by the relative importance value
normalized by the total area, or V.
Vj = (Pj ⁄ Cj ) * (Gf ⁄ G)
Where:
P = the stated importance value
C = the number of cells
j = the shape
G = the total number of cells in the entire fishery
Gf = the total number of cells in the fishing grounds of one fisherman
Consider this example:
For this example there are only two respondents. Collectively they have drawn five
shapes: respondent A has identified three shapes and respondent B has identified two
shapes. They have each allocated their budget of pennies accordingly.
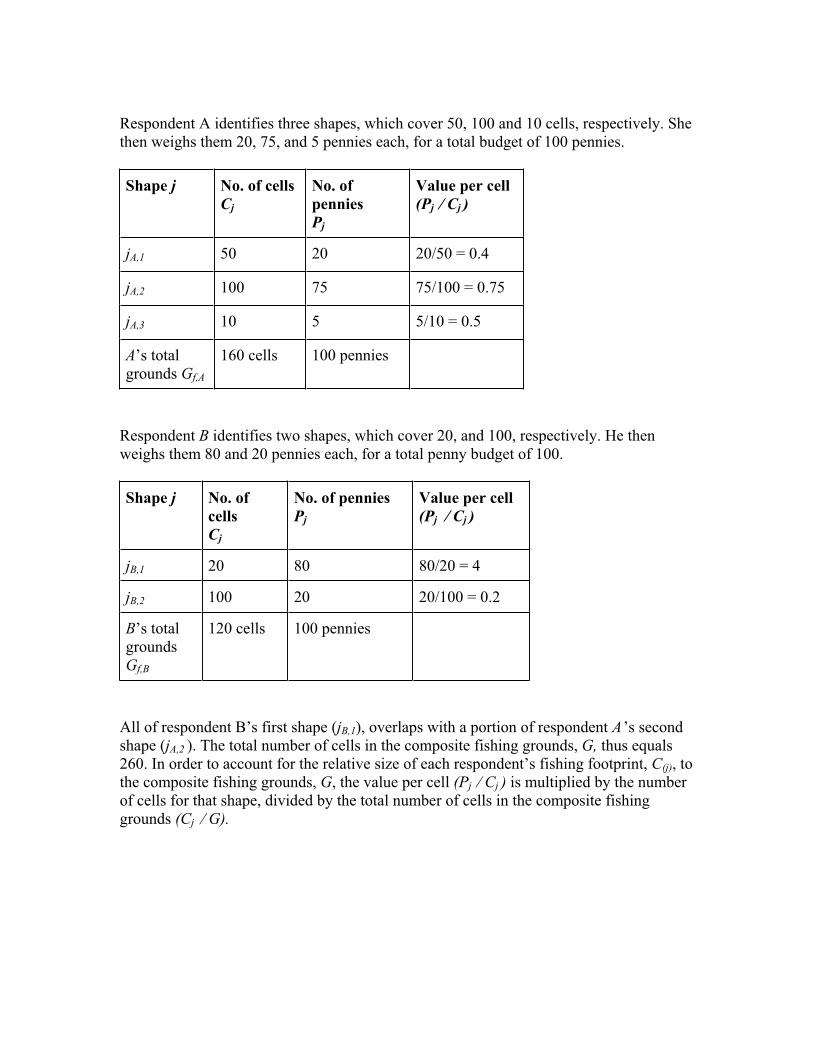
Respondent A identifies three shapes, which cover 50, 100 and 10 cells, respectively. She
then weighs them 20, 75, and 5 pennies each, for a total budget of 100 pennies.
Shape j No. of cells
Cj
No. of
pennies
Pj
Value per cell
(Pj ⁄ Cj )
jA,1 50 20 20/50 = 0.4
jA,2 100 75 75/100 = 0.75
jA,3 10 5 5/10 = 0.5
A’s total
grounds Gf,A
160 cells 100 pennies
Respondent B identifies two shapes, which cover 20, and 100, respectively. He then
weighs them 80 and 20 pennies each, for a total penny budget of 100.
Shape j No. of
cells
Cj
No. of pennies
Pj
Value per cell
(Pj ⁄ Cj )
jB,1 20 80 80/20 = 4
jB,2 100 20 20/100 = 0.2
B’s total
grounds
Gf,B
120 cells 100 pennies
All of respondent B’s first shape (jB,1), overlaps with a portion of respondent A’s second
shape (jA,2 ). The total number of cells in the composite fishing grounds, G, thus equals
260. In order to account for the relative size of each respondent’s fishing footprint, C(j), to
the composite fishing grounds, G, the value per cell (Pj ⁄ Cj ) is multiplied by the number
of cells for that shape, divided by the total number of cells in the composite fishing
grounds (Cj ⁄ G).
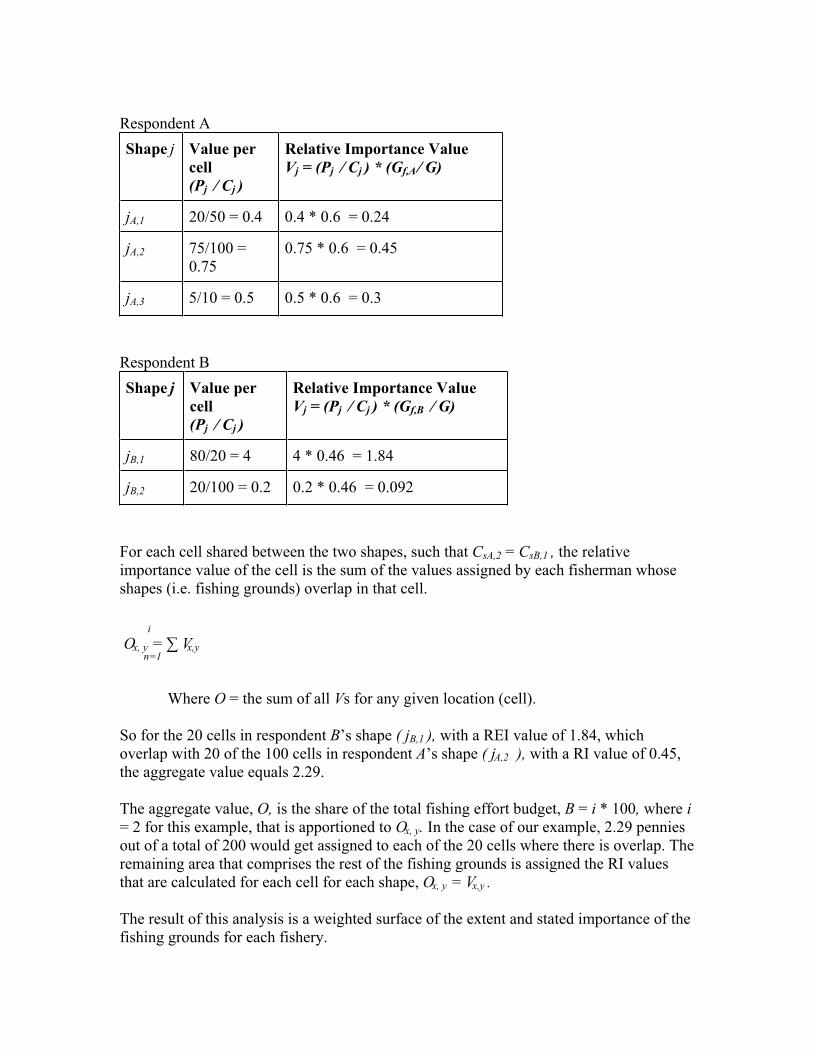
Respondent A
Shape j Value per
cell
(Pj ⁄ Cj )
Relative Importance Value
Vj = (Pj ⁄ Cj ) * (Gf,A ⁄ G)
jA,1 20/50 = 0.4 0.4 * 0.6 = 0.24
jA,2 75/100 =
0.75
0.75 * 0.6 = 0.45
jA,3 5/10 = 0.5 0.5 * 0.6 = 0.3
Respondent B
Shape j Value per
cell
(Pj ⁄ Cj )
Relative Importance Value
Vj = (Pj ⁄ Cj ) * (Gf,B ⁄ G)
jB,1 80/20 = 4 4 * 0.46 = 1.84
jB,2 20/100 = 0.2 0.2 * 0.46 = 0.092
For each cell shared between the two shapes, such that CsA,2 = CsB,1 , the relative
importance value of the cell is the sum of the values assigned by each fisherman whose
shapes (i.e. fishing grounds) overlap in that cell.
i
Ox, y = Vx,yn=1
Where O = the sum of all Vs for any given location (cell).
So for the 20 cells in respondent B’s shape ( jB,1 ), with a REI value of 1.84, which
overlap with 20 of the 100 cells in respondent A’s shape ( jA,2 ), with a RI value of 0.45,
the aggregate value equals 2.29.
The aggregate value, O, is the share of the total fishing effort budget, B = i * 100, where i
= 2 for this example, that is apportioned to Ox, y. In the case of our example, 2.29 pennies
out of a total of 200 would get assigned to each of the 20 cells where there is overlap. The
remaining area that comprises the rest of the fishing grounds is assigned the RI values
that are calculated for each cell for each shape, Ox, y = Vx,y .
The result of this analysis is a weighted surface of the extent and stated importance of the
fishing grounds for each fishery.
In September and October of 2005, we went back to ports in the southern and northern
parts of the study region. There we met with groups of representatives of the fisheries
studied, which included participants in the project as well as other knowledgeable and
longtime fishermen designated by members of the Regional Stakeholder Group. We
reviewed paper maps of the aggregated fishing grounds for each fishery in these groups,
as well as the digital files for any participant who wanted to review and/or make changes
to his or her information. Several revisions resulted from these meetings, and the final
versions of the fishing grounds were used in the subsequent analysis, which we describe
in the following two sections.
IV. Results and deliverables
There are two data products and one analytical product, all of which we forwarded to the
MLPAI, resulting from this research to date.
The data products were conveyed to the MLPAI’s geodatabase housed at UC Santa Barbara. The
first was a shapefile of all fishing grounds information summarized to the 1-minute microblocks
used by CDFG. This was intended for use by staff and/or stakeholders in designing marine
protected area arrays, and the microblocks were chosen as a convenient spatial unit that
maintains consistency with the spatial resolution of the other data layers contained in the
geodatabase. Examples of how this information could be analyzed are elaborated in the next
section.
The other data product was the detailed raster data of all fisheries examined at the 100m cell size,
and which served as the basis for the impact analysis further described below. Both datasets were
accompanied by metadata conforming to the Federal Geographic Data Committee (FGDC)
standards (http://www.fgdc.gov/standards).
During the fall and winter 2005/2006, Ecotrust staff conducted a series of analyses of the first-
order maximum potential impacts of MPA packages under consideration. The goal was to assess
the relative maximum potential impacts of packages, both in terms of the area of the fishing
grounds affected and the stated importance of those areas. Since our research showed that not all
areas are equal, and some are more important to fisheries than others, the effects typically vary:
even a small closure can have a large impact, expressed in units of stated importance. The
summary of these analyses was forwarded to Blue Ribbon Task Force in March 2006, and is
included in Appendix 4.
Ecotrust is committed to keeping as much information about our methods and tools used in the
public domain as possible, and will make available the specific Arc Macro Language (AML)
code used for interpreting and analyzing the data to researchers interested in replicating this
research.
As we will discuss further in the next section, these products do not cover all that can be done
with the fishing grounds information.
V. Discussion and Conclusion
There are several methodological and process lessons that are worth reflecting on, in the
hope of informing future iterations or applications of this approach. We also describe
some opportunities for further analysis.
V.1 Timing
Conducting detailed, fieldwork based, participatory research concurrently with a
sometimes contentious policy process, is ambitious—especially when the work period
coincides with the summer fishing season. Ideally, detailed information about the fishing
grounds and their relative importance would be available to decision-makers prior to the
beginning of a policy process. In the case of this project, the timing between the field,
verification, and data compilation stages of this work and the information needs of the
MLPAI’s Central Coast Project process never fully aligned. For example, the data—
although it was integrated into the geodatabase used in the process and could have been
rendered in formats that maintained confidentiality—was not made available to
stakeholders to inform the design of MPA alternatives directly, contributing to the
palpable frustration of some stakeholders that they did not have desirable information at
their fingertips. Similarly, time constraints and the timing of the project made expanding
the sample to achieve a greater proportion of the local fleet difficult. In the future, timing
can be improved considerably by making explicit arrangements to either conduct research
prior to the policy process and at times more convenient for participants.
V.2 Scale
One issue of key importance in the endeavor to map the fishing grounds is that of scale.
Given the paucity of data about the footprint and spatial behavior of the various fishing
fleets operating in California, there was no logical choice of what scale to use for this
project. We deliberately chose not to restrict respondents to a particular chart of map
scale, but rather opted to let them draw the fishing grounds and the various subareas of
greater importance at whatever level of detail made most sense to them. Not surprisingly,
most respondents opted to draw their grounds at the scale of familiar nautical charts.
Some drew large shapes indicating the relatively equal importance of large areas of the
ocean, for example in the salmon fishery, while others made highly site specific and
localized distinctions between the grounds and their relative importance, for example in
fisheries like that for spot prawns. Based on the 108 interviews, we are now in a position
to analyze the distribution of these natural shapes, allowing an inference about a best
scale to use in subsequent work. This will be particularly helpful for aligning the spatial
scale of research efforts such as this with the spatial scale at which policy measures, in
this case MPAs, are designed. Given the concurrent nature of this work with the Central
Coast Project, it was not possible to align the spatial scales, creating the perception—at
least among some stakeholders—that the fishing ground information is not informative at
the scale of the eventual MPA alternatives whose boundaries sometimes differ by mere
feet.
Another caveat to our analysis is entailed by the geographic extent of the project. The
fishing grounds used by the fleet extend farther north, south, and west than the study
region. Several respondents noted that, for example, the area between Point Arguello and
Point Conception is important for many fisheries, including the Southern Fleet.
Effectively, because of the delineation of our study region in congruence with the
MLPAI’s Central Coast Project, areas on the northern and southern boundary could not
be completely analyzed. Some care would need to be taken to integrate data and
analytical results from this project with subsequent characterizations of fishing grounds
to the north and south.
V.3 Quality assurance and quality control
This project contains valuable lessons for improving quality assurance and control
mechanisms. Two of the most important ones center on questions of confidentiality and
verifying the information collected.
Confidentiality
The protocol we developed for this project conforms to human subject standards used at
the University of California and elsewhere in academic research. Given the sensitive
nature of fishing ground maps and the economic information they contain, at least
implicitly, we took additional measures to mask individual informants, and gave the fleet
control over what, if any, information they wanted to display publicly, in the Central
Coast Project stakeholder meetings.
An incident involving a well-intentioned field staff is illustrative of the special nature of
this information and the extra care required in working with it: wanting to illustrate the
mapping protocol, she showed the anonymized shapes of a previous respondent (A) to a
second respondent (B). Even though no identifying information was shared, respondent B
thought he recognized the fishing grounds, and called A, who promptly called Ecotrust
staff demanding an explanation. We were able to reassure A, and he opted to continue his
participation in the project. Since it is not generally the case that fishermen can recognize
each other’s grounds, we had not foreseen this possibility, and used this incident to
sharpen our protocols for field staff. Specifically, they were instructed to never use actual
shapes for demonstration purposes.
Data verification
The main mechanism for verifying the data collected were individual and group meetings
with respondents and others in each fleet, conducted in both Monterey and Morro Bay
towards the end of the field period. This provided sometimes very detailed verification
and sign-off on the extent and relative importance of the fishing grounds for each fishery.
Internally, at Ecotrust, we employ several QA/QC protocols that are designed to catch
inconsistencies and other problems with the data. For example, we run an automated
check to make sure each respondent’s shapes and weights add up to the 100 pennies.
These protocols notwithstanding, there are several ideas for process improvements
coming out of this project.
There was one instance of the wrong file being used for the impact analysis, a
circumstance we only discovered after the fact. This involved a respondent who had
previously participated in another project, and who edited his previous shapefile for this
project. We inadvertently used the file containing the edits—essentially a small number
of shapes representing both additions and subtractions—rather than the previous file. We
offered, and he accepted, to remove his shapes from the analysis. While this was an
isolated case, in conversation with this participant, we conceptualized a mechanism for
giving each respondent remote access to his or her shapefiles either through an on-line
interface or by email, allowing for individual verification of data even in short
timeframes. We will implement this mechanism in subsequent iterations or applications
of this approach.
V.4 Improving the sample
While our approach of constructing a proportionate quota sample based on the CDFG
landing statistics provided a satisfactory representation of central coast fisheries, there
remain formidable challenges in ensuring all sectors are adequately represented. This is
illustrated by the difficulties we had in engaging what is frequently referred to as “the
Vietnamese fleet” in this project. Every mode of contacting this subset, which constituted
12% of our sample population and represents considerable fishing expertise and success
on the central coast, failed. We tried several modes:
We had the project description and consent form translated in Vietnam, by people
working on coastal management issues (see Appendix 3);
A native speaker on contract contacted all fishermen in the sample by phone, with
very limited success. Typically phone calls, if answered at all, would go
unreturned, or messages left with family members were apparently disregarded;
We worked with a fish buyer who has business relations with a large segment of
the fleet, explained the purpose of the project, and asked him to relay this
information to the fishermen he buys from; we also posted the project information
on his dock, and attempted to talk to fishermen at the receiving dock, to no avail;
Made contact with the president of the Vietnamese Buddhist Association in
Monterey, explained the importance of project and the need to represent the
Vietnamese fleet; left Vietnamese documents with her to post at temple and to
send to fishermen, garnering very little response: the one fisherman whose
number she provided in the hopes that he would make referrals to additional
fishermen did not respond to repeated calls; her overall assessment was that they
would not participate, partially due to the time period, and because it would
require a long time to persuade them to participate; and
An employee of the Monterey Bay Aquarium contacted several fishermen he
knows in the community but they did not want to participate.
The experience with the Vietnamese fleet in this project illustrates the need for a
concerted effort to reach out to various language and cultural groups that participate in
California fisheries, to ensure their effective participation—whether in research projects
such as this or in policy processes such as the MLPAI.
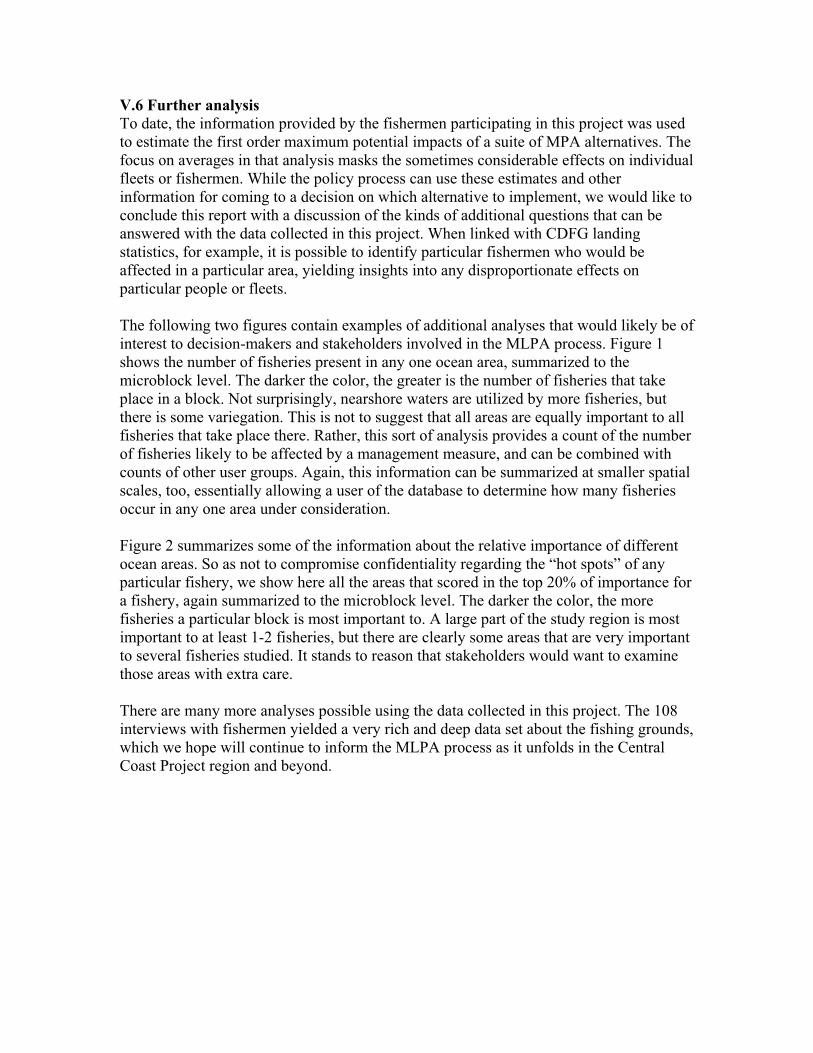
V.6 Further analysis
To date, the information provided by the fishermen participating in this project was used
to estimate the first order maximum potential impacts of a suite of MPA alternatives. The
focus on averages in that analysis masks the sometimes considerable effects on individual
fleets or fishermen. While the policy process can use these estimates and other
information for coming to a decision on which alternative to implement, we would like to
conclude this report with a discussion of the kinds of additional questions that can be
answered with the data collected in this project. When linked with CDFG landing
statistics, for example, it is possible to identify particular fishermen who would be
affected in a particular area, yielding insights into any disproportionate effects on
particular people or fleets.
The following two figures contain examples of additional analyses that would likely be of
interest to decision-makers and stakeholders involved in the MLPA process. Figure 1
shows the number of fisheries present in any one ocean area, summarized to the
microblock level. The darker the color, the greater is the number of fisheries that take
place in a block. Not surprisingly, nearshore waters are utilized by more fisheries, but
there is some variegation. This is not to suggest that all areas are equally important to all
fisheries that take place there. Rather, this sort of analysis provides a count of the number
of fisheries likely to be affected by a management measure, and can be combined with
counts of other user groups. Again, this information can be summarized at smaller spatial
scales, too, essentially allowing a user of the database to determine how many fisheries
occur in any one area under consideration.
Figure 2 summarizes some of the information about the relative importance of different
ocean areas. So as not to compromise confidentiality regarding the “hot spots” of any
particular fishery, we show here all the areas that scored in the top 20% of importance for
a fishery, again summarized to the microblock level. The darker the color, the more
fisheries a particular block is most important to. A large part of the study region is most
important to at least 1-2 fisheries, but there are clearly some areas that are very important
to several fisheries studied. It stands to reason that stakeholders would want to examine
those areas with extra care.
There are many more analyses possible using the data collected in this project. The 108
interviews with fishermen yielded a very rich and deep data set about the fishing grounds,
which we hope will continue to inform the MLPA process as it unfolds in the Central
Coast Project region and beyond.
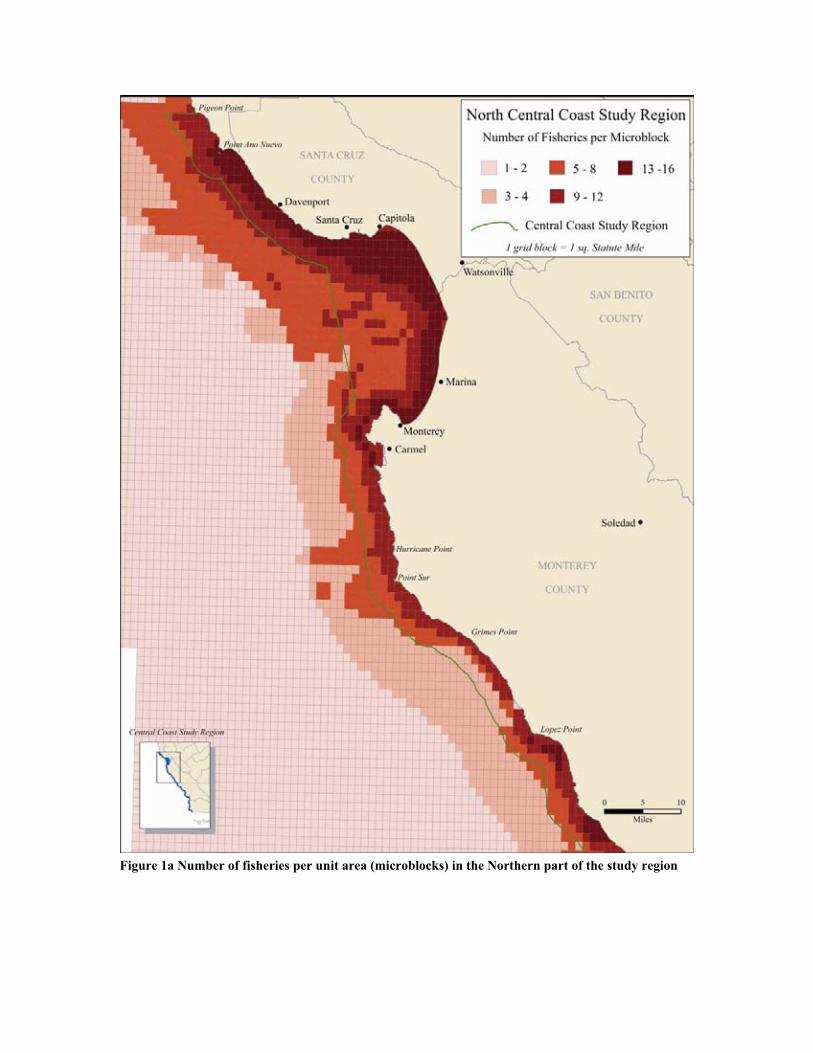
Figure 1a Number of fisheries per unit area (microblocks) in the Northern part of the study region
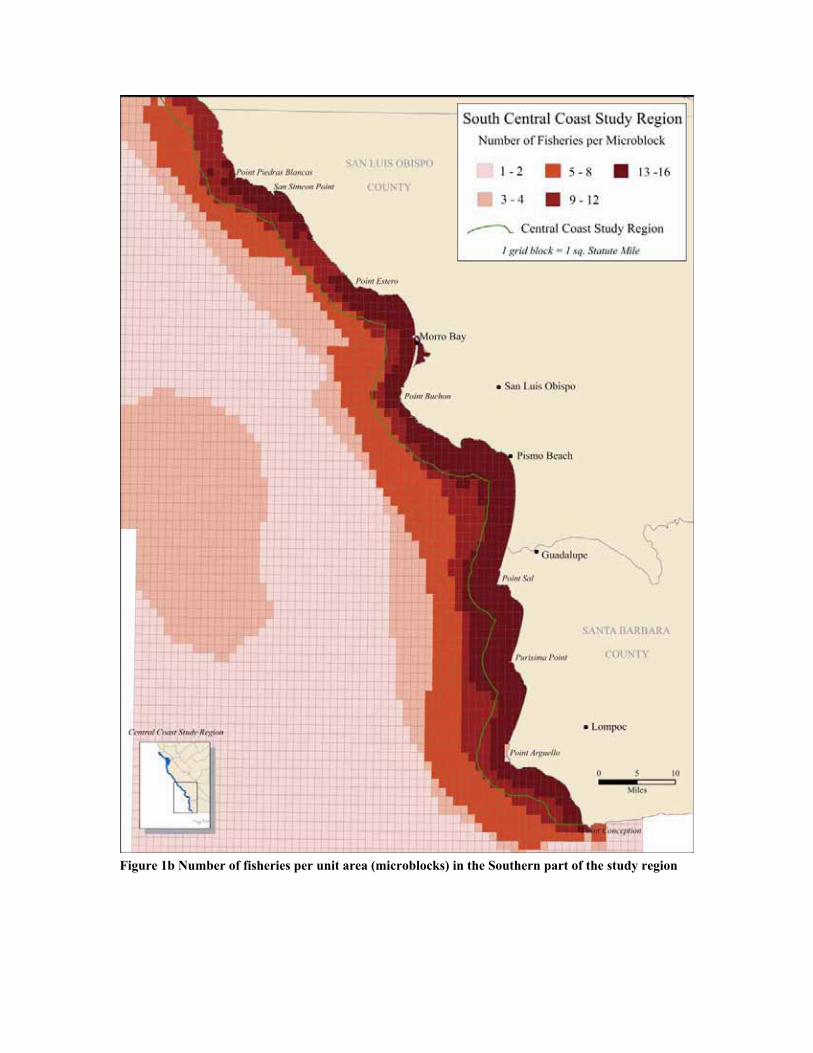
Figure 1b Number of fisheries per unit area (microblocks) in the Southern part of the study region
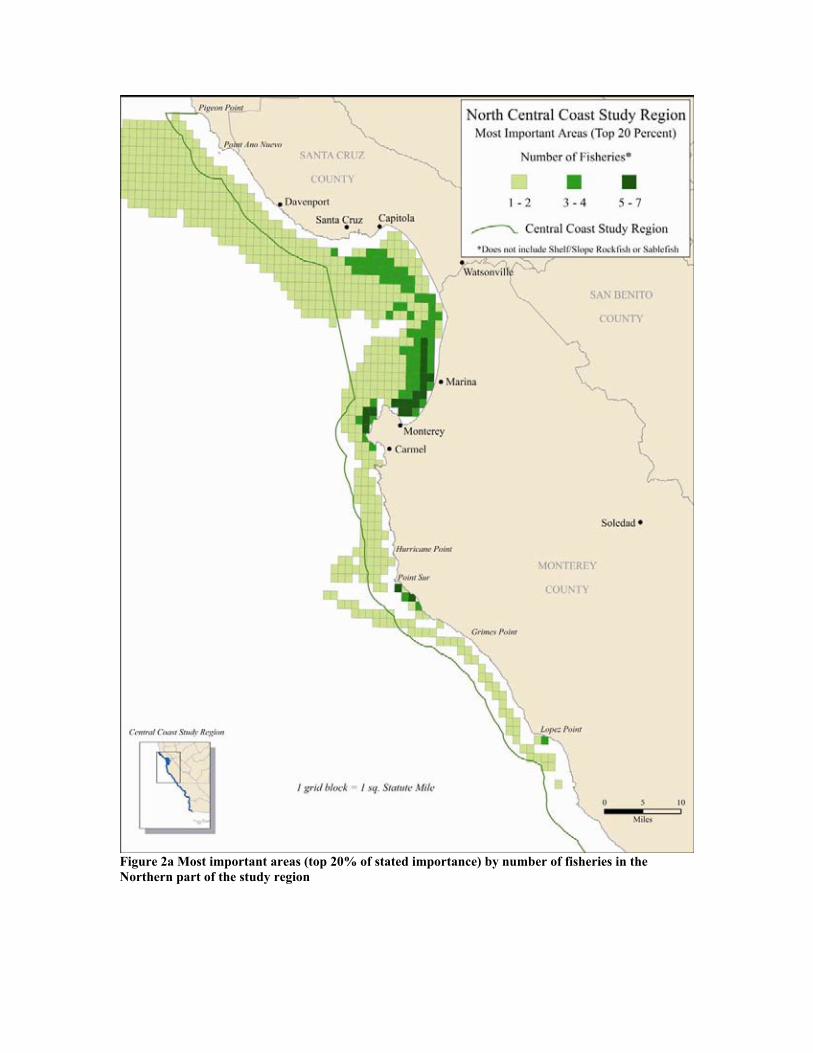
Figure 2a Most important areas (top 20% of stated importance) by number of fisheries in the
Northern part of the study region
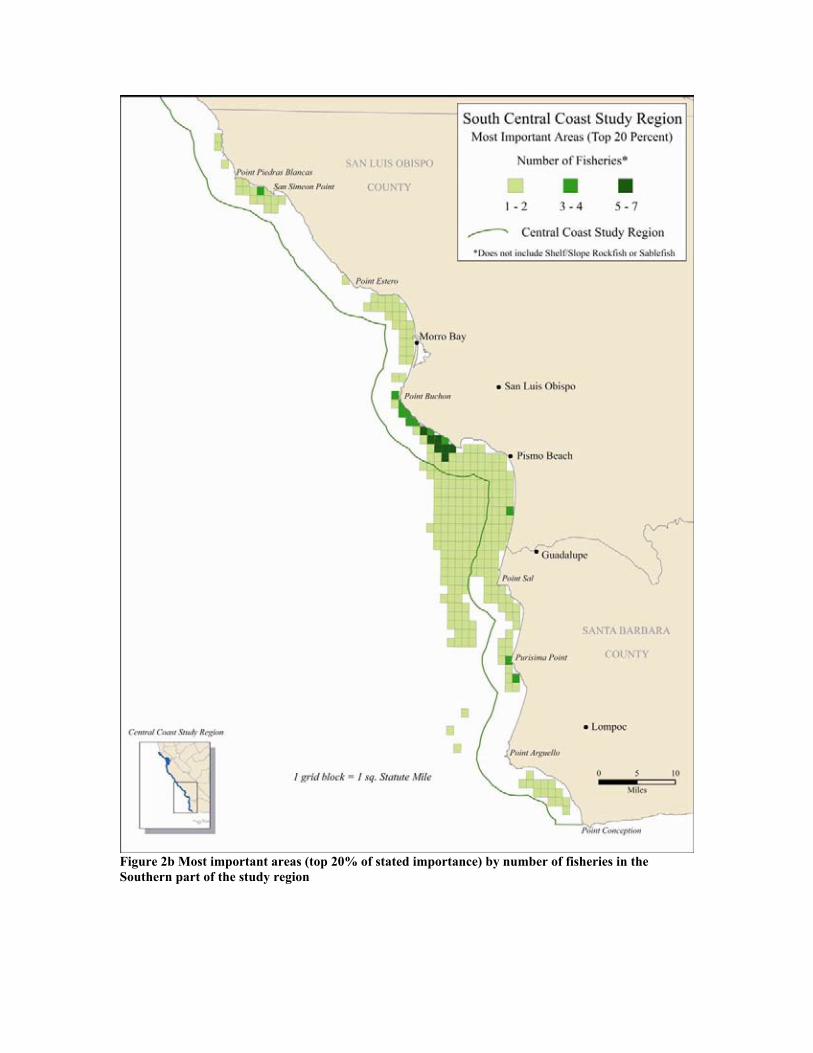
Figure 2b Most important areas (top 20% of stated importance) by number of fisheries in the
Southern part of the study region
VI. References
Anselin, L., R. J. G. M. Florax and S. J. Rey, Eds. (2004). Advances in Spatial
Econometrics: Methodology, Tools and Applications. New York, Springer.
Breman, J., Ed. (2002). Marine geography : GIS for the oceans and seas. Redlands, ESRI Press
Caddy, J. F. and F. Carocci (1999). "The spatial allocation of fishing intensity by port-based
inshore fleets: a GIS application." ICES Journal of Marine Science 56: 388-403.
Fisher, W. L. and F. J. Rahel, Eds. (2004). Geographic Information Systems in Fisheries.
Bethesda, MD, American Fisheries Society.
Kruse, G. H., N. Bez, A. Booth, M. W. Dorn, S. Hills, R. N. Lipcius, D. Pelletier, C. Roy, S. J.
Smith and D. Witherell, Eds. (2001). Spatial processes and management of marine populations.
Fairbanks, University of Alaska Sea Grant.
Gimblett, H. R., Ed. (2002). Integrating geographic information systems and agent-based
modeling techniques for simulating social and ecological processes. New York, Oxford
University Press.
Goodchild, M. F. and D. G. Janelle, Eds. (2004). Spatially integrated social science. New
York, Oxford University Press.
Green, D. R. and S. D. King, Eds. (2003). Coastal and Marine Geo-Information Systems:
Applying the Technology to the Environment. Dordrecht, Kluwer Academic Publishers.
Marine Life Protection Act (MLPA) Initiative (2005). California Marine Life Protection Act
(MLPA) Initiative Regional Profile of the Central Coast Study Region (Pigeon Point to Point
Conception, CA) (v.3.0). Sacramento, Marine Life Protection Act Initiative: 130pp. plus
appendices
Meaden, G. J. (1996). Potential for geographical information systems (GIS) in fisheries
management. Computers in Fisheries Research. B. A. Megrey and E. Moksness. London,
Chapman and Hall: 41-77.
Quan, J., N. Oudwater, J. Pender and A. Martin (2001). GIS and Participatory Approaches in
Natural Resources Research. Socio-economic Methodologies for Natural Resources Research.
Best Practice Guidelines. Chatham, UK, Natural Resources Institute.
St. Martin, K. (2004). GIS in Marine Fisheries Science and Decision Making. Geographic
Information Systems in Fisheries. W. L. Fisher and F. J. Rahel, American Fisheries Society: 237-
258.
St. Martin, K. 2005. “Mapping Economic Diversity in the First World: The
Case of Fisheries,” Environment and Planning A 37: 959-979.
St. Martin, K. forthcoming 2006. “The Impact of ‘Community’ on Fisheries
Management in the U.S. Northeast,” Geoforum.
Scholz, A., K. Bonzon, R. Fujita, N. Benjamin, N. Woodling, P. Black and C. Steinback. 2004.
"Participatory socioeconomic analysis: drawing on fishermen’s knowledge for marine protected
area planning in California." Marine Policy 28(4): 335-349.
Scholz, A., M. Mertens and C. Steinback. 2005. The OCEAN Framework: Modeling the
Linkages between Marine Ecology, Fishing Economy, and Coastal Communities. In D. Wright
and A. Scholz (Eds.) Place Matters: Geospatial Tools for Marine Science, Conservation, and
Management in the Pacific Northwest. Corvallis, OR, Oregon State University Press.
Scholz, A., C. Steinback, S. Klain and A. Boone (2006). Socioeconomic Profile of Fishing
Activities and Communities Associated with the Gulf of the Farallones and Cordell Bank
National Marine Sanctuaries. Portland, OR, Ecotrust: 122pp.
Wedell, V., D. Revell, L. Anderson and L. Cobb (2005). Port Orford Ocean Resources Team:
Partnering Local and Scientific Knowledge with GIS to Create a Sustainable Community in
Southern Oregon. Place Matters: Geospatial Tools for Marine Science, Conservation, and
Management in the Pacific Northwest. D. Wright and A. Scholz. Corvallis, OR, Oregon State
University Press.
Valavanis, V. D., Ed. (2002). Geographic information systems in oceanography and
fisheries. New York, Taylor & Francis.
VII. Appendices
1. Scope of work
2. English language consent form
3. Vietnamese language consent form
4. Final Executive Summary of impact analyses conducted, forwarded to the Blue Ribbon
Task Force in March 2006, as an example of analyses of proposed packages of MPAs
in the Central Coast.
Appendix 1 – Scope of work
EXHIBIT A
SCOPE OF WORK
ACCORDING TO THE SEPARATE MEMORANDUM OF UNDERSTANDING
(“MOU”) BETWEEN THE RESOURCES AGENCY (“AGENCY”), THE
DEPARTMENT OF FISH AND GAME (“DEPARTMENT”) AND RESOURCES
LEGACY FUND FOUNDATION (“RLFF”), RLFF HAS AGREED TO FUND
PROFESSIONAL SERVICES FOR FISHERY DATA COLLECTION AND
ANALYSIS FOR THE MARINE LIFE PROTECTION ACT (MLPA) INITIATIVE, A
PUBLIC-PRIVATE PARTNERSHIP BETWEEN THE AGENCY, THE
DEPARTMENT, AND RLFF.
Professional Services and Deliverables
Identify and collect data using OceanMap through local and knowledge
interviews
o Consult with MLPA science team and Monterey Bay National Marine
Sanctuary staff to identify fisheries to assess in the central coast region
o Define sample population within each fishery and use California
Department of Fish and Game data to target fishermen to represent each
fleet
o Set up interviews with fishermen
o Deploy three teams into the field to collect data
Analyze data collected through local knowledge interviews using existing
socioeconomic information (landing receipts and logbooks, etc.); design a shared
database structure that will house this data and other pertinent data sets
o Develop an automated approach for incorporating new data gathered
through OceanMap
o Provide analysis of data generated from interviews with other
socioeconomic information derived from landing receipts and logbooks
o Develop documentation and quality assurance protocols for analyzing data
with existing confidential datasets (landing receipts and logbooks)
o Design a shared database (clearinghouse) to consolidate data with the
upload and download capability to capture local knowledge. Database to
be housed on the servers at the University of California at Santa Barbara
o Identify, integrate and document additional data layers with input from
MLPA Science Advisory Team GIS subcommittee and Resources Agency
GIS departments
Copies of the final drafts of deliverables, delivered to RLFF and the Central Coast
MLPA Program Manager, with the final invoice at the end of the Professional
Services Period, or, if there are no deliverables, a summary of services provided.
Expenses

Appendix 1 – Scope of work
The total amount for all reimbursable expenses is not to exceed the amount specified in
paragraph 4 of the Agreement.
Reimbursable expenses include reasonable costs for travel from contractor’s principal
place of business, meals and incidentals, lodging, printing/copying (if required), and
other reasonable costs with appropriate documentation.
Key Staff
Michael Mertens
Sarah Klain
Aaron Racicot
Charles Steinback
Point of Contact
Contractor will work at the direction of the MLPA Initiative Central Coast MLPA
Manager for matters pertaining to services and work products. For matters pertaining to
compensation and reimbursement associated with this contract, Contractor will report to
California Coastal and Marine Initiative (CCMI) Program Analyst Robin Jenkins at (916)
442-4880 or [email protected].
Appendix 2 – English language consent form
The Marine Life Protection Act (MLPA) is a state law directing the California Department of Fish and Game
(CDFG) to design and manage an improved network of marine protected areas off California’s coast. To
implement this law, a public-private partnership has been formed between the California Resources Agency,
CDFG, and Resources Legacy Fund Foundation—the MLPA Initiative. As part of this effort, Ecotrust has been
retained to collect, compile and analyze socioeconomic information pertaining to commercial fisheries on the
central coast. The project is designed to provide spatially explicit socioeconomic information for both the
MLPA Initiative and the Monterey Bay National Marine Sanctuary (MBNMS).
The goal of the Fisheries Uses and Values Project is to compile a comprehensive picture of the commercial
fishing use patterns along the central California coast, using the expert knowledge of fishermen themselves. The
purpose of this project is threefold:
1. Incorporate commercial fishermen’s knowledge into the deliberations of the Regional Stakeholder
Group in the MLPA Central Coast Study Region and of the MBNMS Marine Protected Areas Working
Group;
2. Use this information to improve on the spatial resolution and accuracy of CDFG landings and logbook
data; and
3. Develop accurate maps of the local fishing grounds and their economic importance to the local fleets.
This kind of spatially explicit information on commercial fisheries and their value can ensure representation of
socioeconomic values in the design, implementation and management of marine protected areas.
During the summer months of 2005 (June through August) Ecotrust personnel will interview approximately 100
fishermen along the central coast. Fishermen will be selected based on CDFG data and recommendations by the
Regional Stakeholder Group. The sample is designed to capture the majority of landings in 10-12 of the most
significant regional fisheries, as well as the depth of expertise of longtime and successful fishermen.
Results from this project will be made available to CDFG and MBNMS for use in the context of the MLPA
Initiative and the discussion, implementation, and management of marine protected areas in state and federal
waters off California—specifically the Central Coast Regional Stakeholder Group and the Sanctuary’s MPA
Working Group.
Ecotrust personnel will contact fishermen directly, and arrange for interviews with contracted staff based in
Santa Cruz, Monterey, Morro Bay and Santa Barbara. The format includes one-on-one or small group
interviews, with follow-up meetings by fishery and/or gear group. Due to the sensitive nature of commercial
fishing information, only Ecotrust staff (operating under a strict confidentiality protocol) will handle the raw
data generated during the interviews. All information collected in the interviews is anonymous and confidential
on the individual level. All analyses and results will be presented in aggregate form, and will be reviewed in
aggregate form by participating fishermen from each fishery. The information will be used to create a
comprehensive picture of the commercial fishing use patterns and values along California’s central coast, and
may also be written up in a peer-reviewed journal. As a participant, you agree to let your information be used in
this manner.
Your willingness to participate is appreciated. If you have any questions or concerns, please contact Ecotrust at
1-866-872-1333, or [email protected], or Paul Reilly of CDFG at 831.649.2879, [email protected]
If you agree to participate under the conditions described above, please print and sign your name.
Participant’s name Signature
Field Staff signature Date
Appendix 3 – Vietnamese language consent form
Lu t b o v Tài nguyên bi n (MLPA) là lu t c a bang liên quan tr c ti p n c quan ngh cá và vui ch i gi i
trí c a bang California (CDFG) c so n th o ra qu n lý và hoàn thi n h th ng qu n lý các khu b o t n
khu v c bi n c a California. th c hi n c lu t này, m t s h p tác gi a cá nhân và c ng ng ã c
hình thành gi a California Recourse Agency; CDFG và Resource Legacy Fund Foundation v i MLPA
Initiative. M t ph n c a n l c này, Ecotrust ã c thuê thu th p, t p trung và phân tích nh ng thông tin
kinh t xã h i i ôi v i thông tin ngh cá th ng m i vùng b ch y u. D án a ra không gian rõ ràng
thông tin KTXH cho c MLPA Initiative và Khu b o t n bi n (KBTB) Monterey Bay National Marine
Sanctuary (NBNMS).
M c tiêu c a D án S d ng và Giá tr Thu s n là hoàn thi n m t b c tranh toàn di n v vi c ngh cá
th ng m i i n hình vùng ánh b t ch y u c a bi n California, qua vi c s d ng nh ng ki n th c c a các
chuyên gia và nh ng ng dân. Muc ích c a d án t p trung vào 3 i m sau:
1. K t h p ch t ch hi u bi t c a ng dân ngh cá th ng m i vào nh ng cân nh c, suy tính c a Nhóm các
bên liên quan trong khu v c c a MLPA khu v c vùng b nghiên c u ch y u (central coast study
region) và MBNMS nhóm làm vi c c a KBTB.
2. S d ng nh ng thông tin này hoàn thi n v ngh quy t không gian (on the spatial resolution) và s
chính xác c a khu v c CDFG (CDFG landings) và thông tin s li u c a nh t ký hàng h i; và
3. Xây d ng b n phù h p c a nh ng ng tr ng và nh ng ng c ánh cá kinh t quan tr ng c a a
ph ng
Lo i thông tin không gian rõ ràng này v ánh cá th ng m i và nh ng giá tr c a nó có th m b o s có m t
c a nh ng giá tr KTXH, vi c th c hi n và qu n lý KBTB.
Trong mùa hè 2005 (tháng 6 n tháng 8) nhân viên c a Ecotrust s ph ng v n kho ng 100 ng dân khu v c
d a vào d li u CDFG và c gi i thi u n nhóm các bên liên quan khu v c. Ph ng v n d a vào vi c ánh
giá ng c p (peer reviewed), d a vào ph ng pháp khoa h c xã h i thu th p các hi u bi t c a dân a
ph ng. M u c thi t k thu c thông tin c a 10-12 c ng cá chính c a nh ng vùng có ngh cá quan
tr ng, c ng nh chuyên môn sâu trong c a ng dân thành công và trong th i gian dài.
Nhân viên c a Ecotrust s liên l c tr c ti p v i các ng dân, và s p x p các cu c ph ng v n v i các nhân viên
t i Santa Crus, Monteray; Morro Bay và Santa Barbara. Form ph ng v n bao g m cho t ng ng i m t ho c cho
m t nhóm ph ng v n. Cùng v i các cu c h p ti p theo v ngh cá và nhóm ng c mà nh ng thông tin thu th p
c s c công nh n (phê chu n) b i ng dân. Do s nh y c m c a các thông tin ngh cá th ng m i, ch
nhân viên Ecotrust ( c ho t ng d i m t i u l nghiêm ng t) s s d ng nh ng s li u ph ng v n này. T t
c các thông tin thu th p c trong quá trình ph ng v n gi u tên và bí m t m c cá nhân. T t c các phân
tích và k t qu s c xem xét ánh giá b i nh ng ng dân tham gia. Thông tin s c s d ng th hi n
m t b c tranh toàn di n v hình m u và giá tr ngh cá th ng m i c a California Central coast, và c ng có th
c ng vào nh ng T p chí ánh giá ng c p (peer reviewed). Nh m t ng i tham gia, b n ng ý thông
tin c a b n c s d ng cho m c ích này.
S s n lòng tr l i các câu h i c a b n th t quý giá, N u b n mu n bi t thêm thông tin ho c có câu h i gì hãy
liên l c v i chúng tôi theo s : 1-866-872-1333; [email protected]; ho c Paul Reilly of CDFG at 831.649.2879
N u b n ng ý tham gia v i i u ki n nêu trên, hãy ghi danh và ký tên d i ây.
Tên ng i tham gia K ý t ên
Ch ký c a nhân viên th c a Ngày
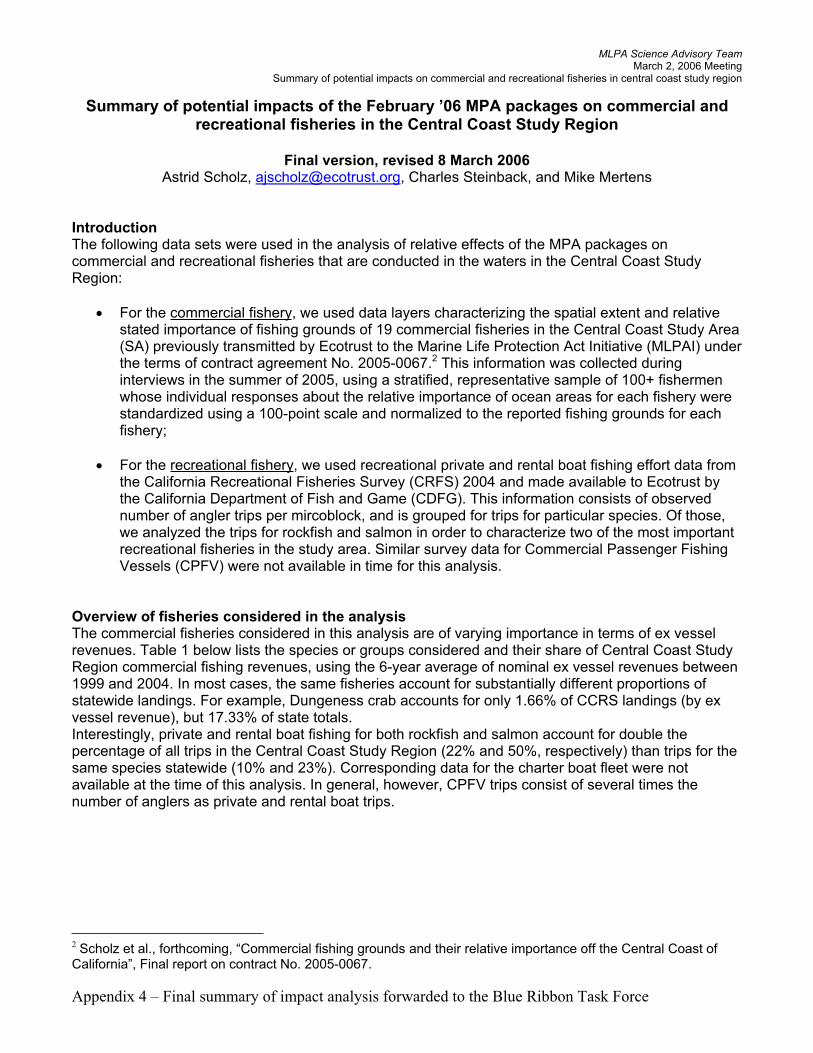
MLPA Science Advisory Team March 2, 2006 Meeting
Summary of potential impacts on commercial and recreational fisheries in central coast study region
Appendix 4 – Final summary of impact analysis forwarded to the Blue Ribbon Task Force
Summary of potential impacts of the February ’06 MPA packages on commercial and recreational fisheries in the Central Coast Study Region
Final version, revised 8 March 2006 Astrid Scholz, [email protected], Charles Steinback, and Mike Mertens
IntroductionThe following data sets were used in the analysis of relative effects of the MPA packages on commercial and recreational fisheries that are conducted in the waters in the Central Coast Study Region:
For the commercial fishery, we used data layers characterizing the spatial extent and relative stated importance of fishing grounds of 19 commercial fisheries in the Central Coast Study Area (SA) previously transmitted by Ecotrust to the Marine Life Protection Act Initiative (MLPAI) under the terms of contract agreement No. 2005-0067.2 This information was collected during interviews in the summer of 2005, using a stratified, representative sample of 100+ fishermen whose individual responses about the relative importance of ocean areas for each fishery were standardized using a 100-point scale and normalized to the reported fishing grounds for each fishery;
For the recreational fishery, we used recreational private and rental boat fishing effort data from the California Recreational Fisheries Survey (CRFS) 2004 and made available to Ecotrust by the California Department of Fish and Game (CDFG). This information consists of observed number of angler trips per mircoblock, and is grouped for trips for particular species. Of those, we analyzed the trips for rockfish and salmon in order to characterize two of the most important recreational fisheries in the study area. Similar survey data for Commercial Passenger Fishing Vessels (CPFV) were not available in time for this analysis.
Overview of fisheries considered in the analysis The commercial fisheries considered in this analysis are of varying importance in terms of ex vessel revenues. Table 1 below lists the species or groups considered and their share of Central Coast Study Region commercial fishing revenues, using the 6-year average of nominal ex vessel revenues between 1999 and 2004. In most cases, the same fisheries account for substantially different proportions of statewide landings. For example, Dungeness crab accounts for only 1.66% of CCRS landings (by ex vessel revenue), but 17.33% of state totals. Interestingly, private and rental boat fishing for both rockfish and salmon account for double the percentage of all trips in the Central Coast Study Region (22% and 50%, respectively) than trips for the same species statewide (10% and 23%). Corresponding data for the charter boat fleet were not available at the time of this analysis. In general, however, CPFV trips consist of several times the number of anglers as private and rental boat trips.
2 Scholz et al., forthcoming, “Commercial fishing grounds and their relative importance off the Central Coast of California”, Final report on contract No. 2005-0067.
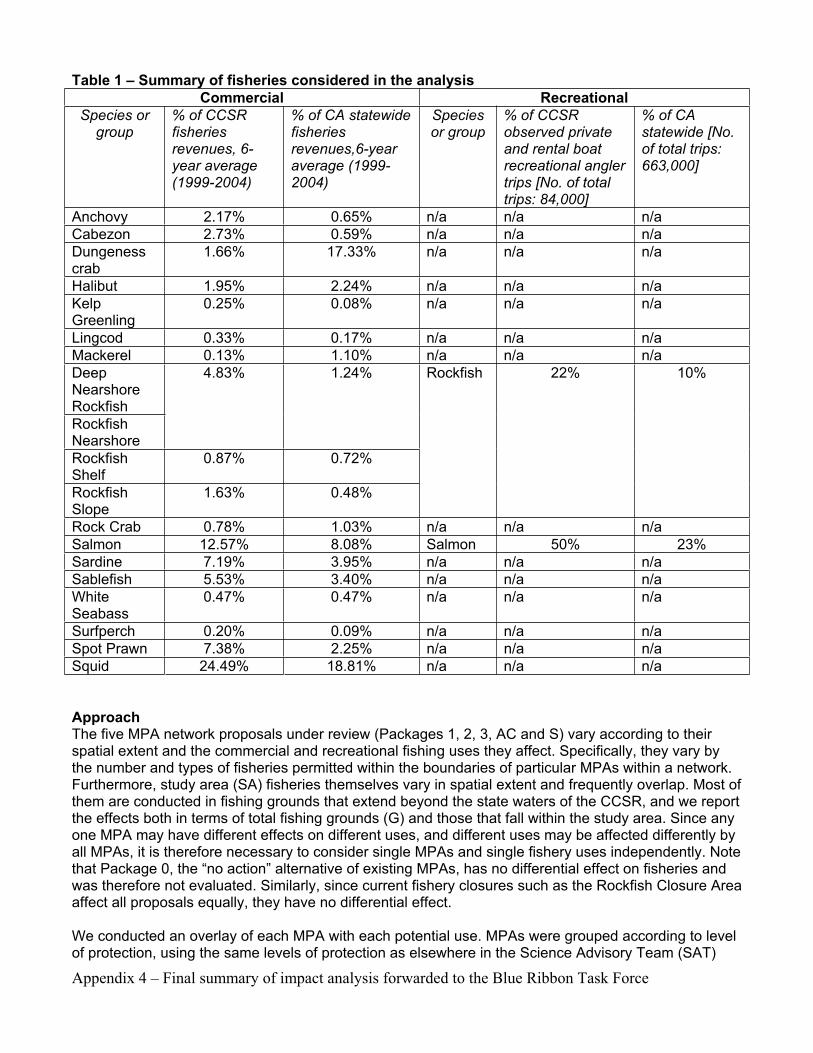
Appendix 4 – Final summary of impact analysis forwarded to the Blue Ribbon Task Force
Table 1 – Summary of fisheries considered in the analysis
Commercial Recreational
Species or group
% of CCSR fisheriesrevenues, 6-year average (1999-2004)
% of CA statewide fisheriesrevenues,6-year average (1999-2004)
Speciesor group
% of CCSR observed private and rental boat recreational angler trips [No. of total trips: 84,000]
% of CA statewide [No. of total trips: 663,000]
Anchovy 2.17% 0.65% n/a n/a n/a
Cabezon 2.73% 0.59% n/a n/a n/a
Dungenesscrab
1.66% 17.33% n/a n/a n/a
Halibut 1.95% 2.24% n/a n/a n/a
KelpGreenling
0.25% 0.08% n/a n/a n/a
Lingcod 0.33% 0.17% n/a n/a n/a
Mackerel 0.13% 1.10% n/a n/a n/a
DeepNearshoreRockfish
RockfishNearshore
4.83% 1.24%
RockfishShelf
0.87% 0.72%
RockfishSlope
1.63% 0.48%
Rockfish 22% 10%
Rock Crab 0.78% 1.03% n/a n/a n/a
Salmon 12.57% 8.08% Salmon 50% 23%
Sardine 7.19% 3.95% n/a n/a n/a
Sablefish 5.53% 3.40% n/a n/a n/a
WhiteSeabass
0.47% 0.47% n/a n/a n/a
Surfperch 0.20% 0.09% n/a n/a n/a
Spot Prawn 7.38% 2.25% n/a n/a n/a
Squid 24.49% 18.81% n/a n/a n/a
ApproachThe five MPA network proposals under review (Packages 1, 2, 3, AC and S) vary according to their spatial extent and the commercial and recreational fishing uses they affect. Specifically, they vary by the number and types of fisheries permitted within the boundaries of particular MPAs within a network. Furthermore, study area (SA) fisheries themselves vary in spatial extent and frequently overlap. Most of them are conducted in fishing grounds that extend beyond the state waters of the CCSR, and we report the effects both in terms of total fishing grounds (G) and those that fall within the study area. Since any one MPA may have different effects on different uses, and different uses may be affected differently by all MPAs, it is therefore necessary to consider single MPAs and single fishery uses independently. Note that Package 0, the “no action” alternative of existing MPAs, has no differential effect on fisheries and was therefore not evaluated. Similarly, since current fishery closures such as the Rockfish Closure Area affect all proposals equally, they have no differential effect.
We conducted an overlay of each MPA with each potential use. MPAs were grouped according to level of protection, using the same levels of protection as elsewhere in the Science Advisory Team (SAT)
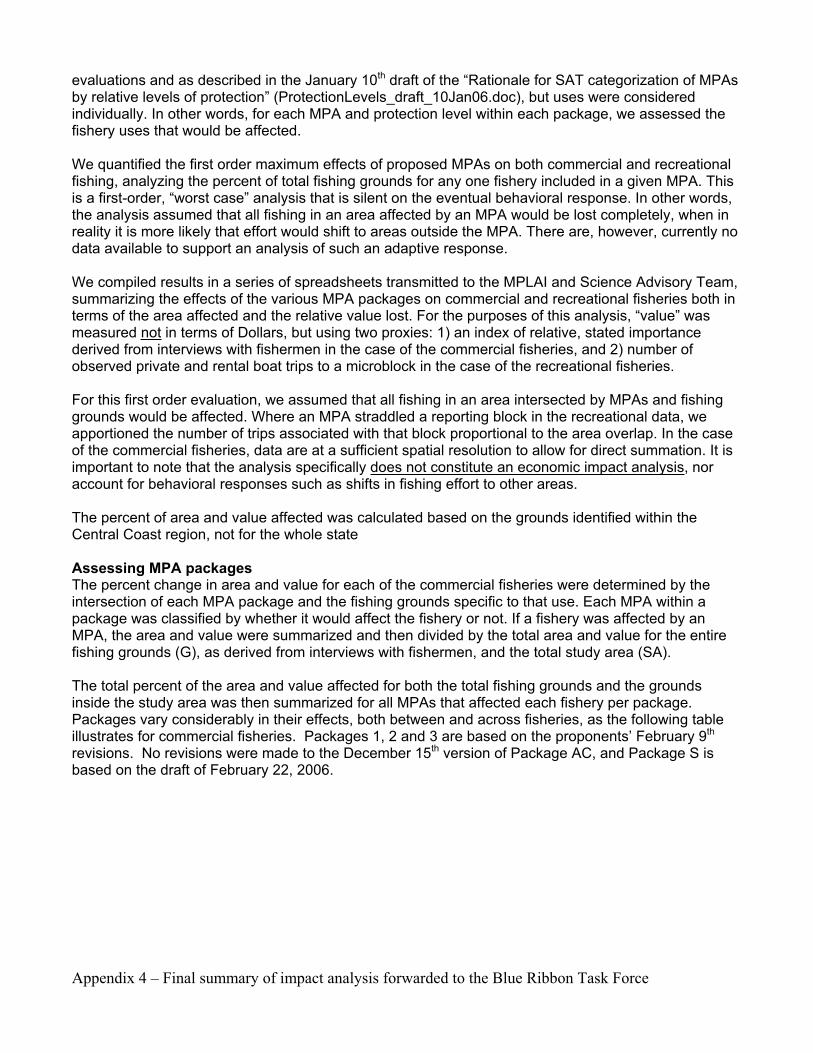
Appendix 4 – Final summary of impact analysis forwarded to the Blue Ribbon Task Force
evaluations and as described in the January 10th draft of the “Rationale for SAT categorization of MPAs by relative levels of protection” (ProtectionLevels_draft_10Jan06.doc), but uses were considered individually. In other words, for each MPA and protection level within each package, we assessed the fishery uses that would be affected.
We quantified the first order maximum effects of proposed MPAs on both commercial and recreational fishing, analyzing the percent of total fishing grounds for any one fishery included in a given MPA. This is a first-order, “worst case” analysis that is silent on the eventual behavioral response. In other words, the analysis assumed that all fishing in an area affected by an MPA would be lost completely, when in reality it is more likely that effort would shift to areas outside the MPA. There are, however, currently no data available to support an analysis of such an adaptive response.
We compiled results in a series of spreadsheets transmitted to the MPLAI and Science Advisory Team, summarizing the effects of the various MPA packages on commercial and recreational fisheries both in terms of the area affected and the relative value lost. For the purposes of this analysis, “value” was measured not in terms of Dollars, but using two proxies: 1) an index of relative, stated importance derived from interviews with fishermen in the case of the commercial fisheries, and 2) number of observed private and rental boat trips to a microblock in the case of the recreational fisheries.
For this first order evaluation, we assumed that all fishing in an area intersected by MPAs and fishing grounds would be affected. Where an MPA straddled a reporting block in the recreational data, we apportioned the number of trips associated with that block proportional to the area overlap. In the case of the commercial fisheries, data are at a sufficient spatial resolution to allow for direct summation. It is important to note that the analysis specifically does not constitute an economic impact analysis, nor account for behavioral responses such as shifts in fishing effort to other areas.
The percent of area and value affected was calculated based on the grounds identified within the Central Coast region, not for the whole state
Assessing MPA packages The percent change in area and value for each of the commercial fisheries were determined by the intersection of each MPA package and the fishing grounds specific to that use. Each MPA within a package was classified by whether it would affect the fishery or not. If a fishery was affected by an MPA, the area and value were summarized and then divided by the total area and value for the entire fishing grounds (G), as derived from interviews with fishermen, and the total study area (SA).
The total percent of the area and value affected for both the total fishing grounds and the grounds inside the study area was then summarized for all MPAs that affected each fishery per package. Packages vary considerably in their effects, both between and across fisheries, as the following table illustrates for commercial fisheries. Packages 1, 2 and 3 are based on the proponents’ February 9th
revisions. No revisions were made to the December 15th version of Package AC, and Package S is based on the draft of February 22, 2006.
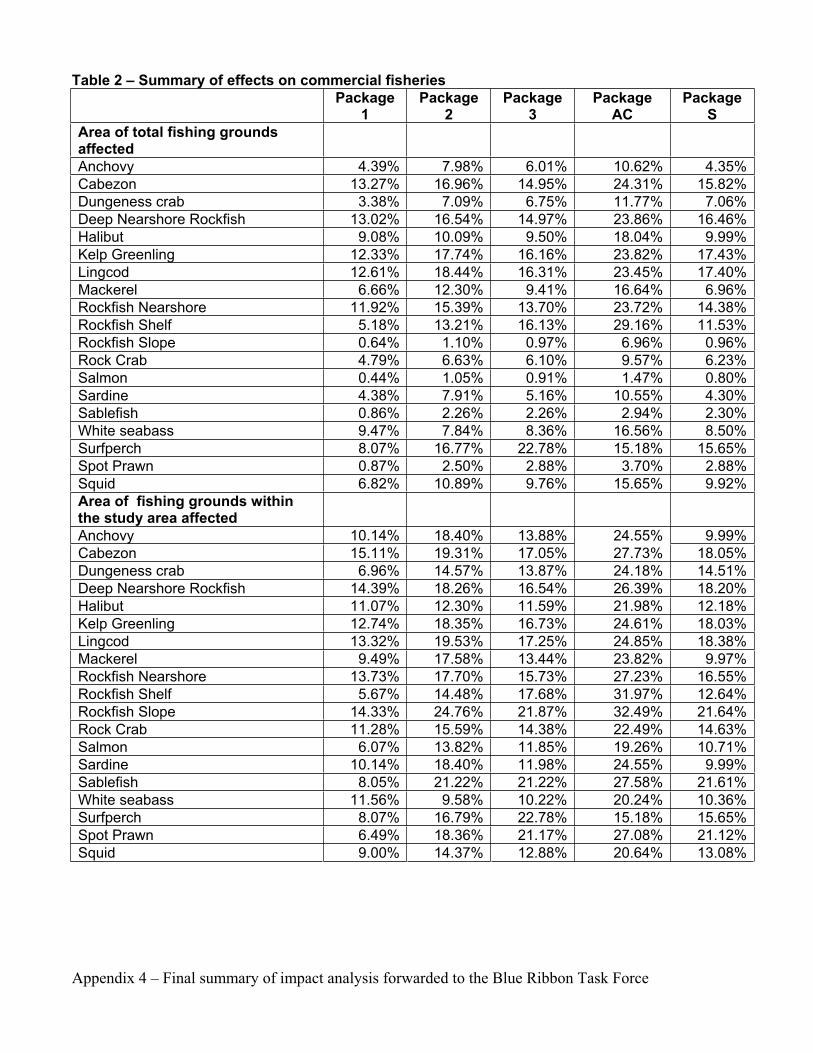
Appendix 4 – Final summary of impact analysis forwarded to the Blue Ribbon Task Force
Table 2 – Summary of effects on commercial fisheries
Package1
Package2
Package3
PackageAC
PackageS
Area of total fishing grounds affected
Anchovy 4.39% 7.98% 6.01% 10.62% 4.35%
Cabezon 13.27% 16.96% 14.95% 24.31% 15.82%
Dungeness crab 3.38% 7.09% 6.75% 11.77% 7.06%
Deep Nearshore Rockfish 13.02% 16.54% 14.97% 23.86% 16.46%
Halibut 9.08% 10.09% 9.50% 18.04% 9.99%
Kelp Greenling 12.33% 17.74% 16.16% 23.82% 17.43%
Lingcod 12.61% 18.44% 16.31% 23.45% 17.40%
Mackerel 6.66% 12.30% 9.41% 16.64% 6.96%
Rockfish Nearshore 11.92% 15.39% 13.70% 23.72% 14.38%
Rockfish Shelf 5.18% 13.21% 16.13% 29.16% 11.53%
Rockfish Slope 0.64% 1.10% 0.97% 6.96% 0.96%
Rock Crab 4.79% 6.63% 6.10% 9.57% 6.23%
Salmon 0.44% 1.05% 0.91% 1.47% 0.80%
Sardine 4.38% 7.91% 5.16% 10.55% 4.30%
Sablefish 0.86% 2.26% 2.26% 2.94% 2.30%
White seabass 9.47% 7.84% 8.36% 16.56% 8.50%
Surfperch 8.07% 16.77% 22.78% 15.18% 15.65%
Spot Prawn 0.87% 2.50% 2.88% 3.70% 2.88%
Squid 6.82% 10.89% 9.76% 15.65% 9.92%
Area of fishing grounds within the study area affected
Anchovy 10.14% 18.40% 13.88% 24.55% 9.99%
Cabezon 15.11% 19.31% 17.05% 27.73% 18.05%
Dungeness crab 6.96% 14.57% 13.87% 24.18% 14.51%
Deep Nearshore Rockfish 14.39% 18.26% 16.54% 26.39% 18.20%
Halibut 11.07% 12.30% 11.59% 21.98% 12.18%
Kelp Greenling 12.74% 18.35% 16.73% 24.61% 18.03%
Lingcod 13.32% 19.53% 17.25% 24.85% 18.38%
Mackerel 9.49% 17.58% 13.44% 23.82% 9.97%
Rockfish Nearshore 13.73% 17.70% 15.73% 27.23% 16.55%
Rockfish Shelf 5.67% 14.48% 17.68% 31.97% 12.64%
Rockfish Slope 14.33% 24.76% 21.87% 32.49% 21.64%
Rock Crab 11.28% 15.59% 14.38% 22.49% 14.63%
Salmon 6.07% 13.82% 11.85% 19.26% 10.71%
Sardine 10.14% 18.40% 11.98% 24.55% 9.99%
Sablefish 8.05% 21.22% 21.22% 27.58% 21.61%
White seabass 11.56% 9.58% 10.22% 20.24% 10.36%
Surfperch 8.07% 16.79% 22.78% 15.18% 15.65%
Spot Prawn 6.49% 18.36% 21.17% 27.08% 21.12%
Squid 9.00% 14.37% 12.88% 20.64% 13.08%
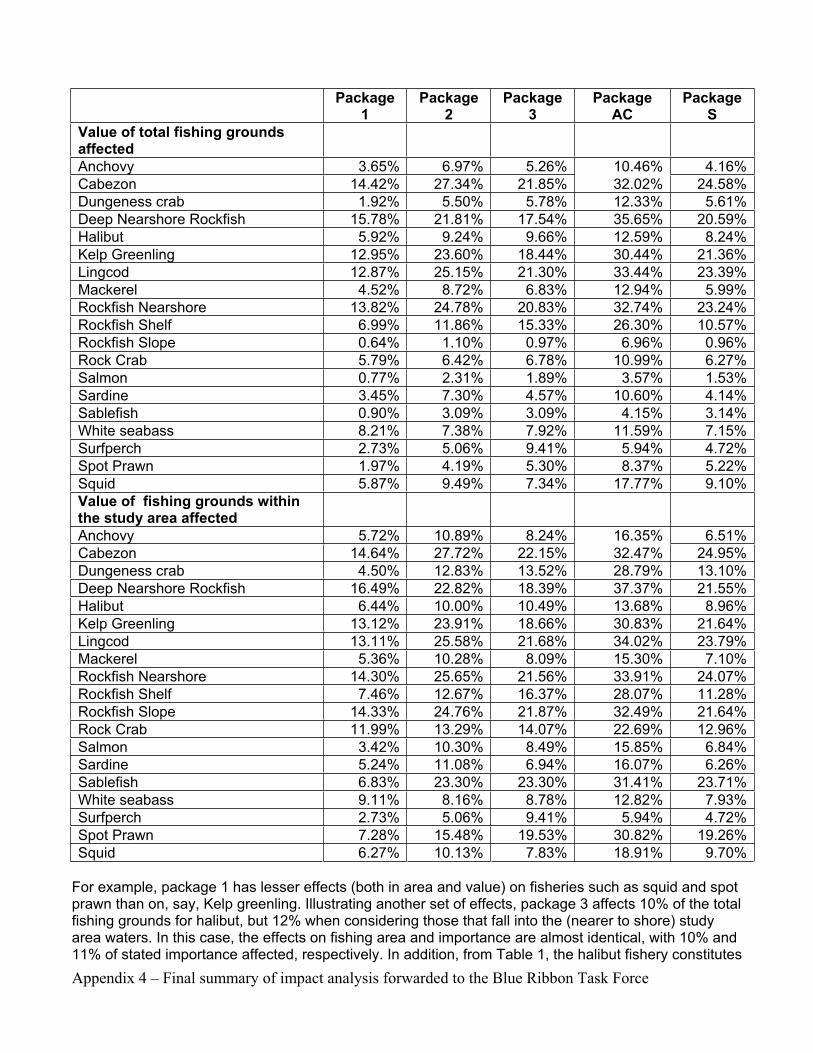
Appendix 4 – Final summary of impact analysis forwarded to the Blue Ribbon Task Force
Package1
Package2
Package3
PackageAC
PackageS
Value of total fishing grounds affected
Anchovy 3.65% 6.97% 5.26% 10.46% 4.16%
Cabezon 14.42% 27.34% 21.85% 32.02% 24.58%
Dungeness crab 1.92% 5.50% 5.78% 12.33% 5.61%
Deep Nearshore Rockfish 15.78% 21.81% 17.54% 35.65% 20.59%
Halibut 5.92% 9.24% 9.66% 12.59% 8.24%
Kelp Greenling 12.95% 23.60% 18.44% 30.44% 21.36%
Lingcod 12.87% 25.15% 21.30% 33.44% 23.39%
Mackerel 4.52% 8.72% 6.83% 12.94% 5.99%
Rockfish Nearshore 13.82% 24.78% 20.83% 32.74% 23.24%
Rockfish Shelf 6.99% 11.86% 15.33% 26.30% 10.57%
Rockfish Slope 0.64% 1.10% 0.97% 6.96% 0.96%
Rock Crab 5.79% 6.42% 6.78% 10.99% 6.27%
Salmon 0.77% 2.31% 1.89% 3.57% 1.53%
Sardine 3.45% 7.30% 4.57% 10.60% 4.14%
Sablefish 0.90% 3.09% 3.09% 4.15% 3.14%
White seabass 8.21% 7.38% 7.92% 11.59% 7.15%
Surfperch 2.73% 5.06% 9.41% 5.94% 4.72%
Spot Prawn 1.97% 4.19% 5.30% 8.37% 5.22%
Squid 5.87% 9.49% 7.34% 17.77% 9.10%
Value of fishing grounds within the study area affected
Anchovy 5.72% 10.89% 8.24% 16.35% 6.51%
Cabezon 14.64% 27.72% 22.15% 32.47% 24.95%
Dungeness crab 4.50% 12.83% 13.52% 28.79% 13.10%
Deep Nearshore Rockfish 16.49% 22.82% 18.39% 37.37% 21.55%
Halibut 6.44% 10.00% 10.49% 13.68% 8.96%
Kelp Greenling 13.12% 23.91% 18.66% 30.83% 21.64%
Lingcod 13.11% 25.58% 21.68% 34.02% 23.79%
Mackerel 5.36% 10.28% 8.09% 15.30% 7.10%
Rockfish Nearshore 14.30% 25.65% 21.56% 33.91% 24.07%
Rockfish Shelf 7.46% 12.67% 16.37% 28.07% 11.28%
Rockfish Slope 14.33% 24.76% 21.87% 32.49% 21.64%
Rock Crab 11.99% 13.29% 14.07% 22.69% 12.96%
Salmon 3.42% 10.30% 8.49% 15.85% 6.84%
Sardine 5.24% 11.08% 6.94% 16.07% 6.26%
Sablefish 6.83% 23.30% 23.30% 31.41% 23.71%
White seabass 9.11% 8.16% 8.78% 12.82% 7.93%
Surfperch 2.73% 5.06% 9.41% 5.94% 4.72%
Spot Prawn 7.28% 15.48% 19.53% 30.82% 19.26%
Squid 6.27% 10.13% 7.83% 18.91% 9.70%
For example, package 1 has lesser effects (both in area and value) on fisheries such as squid and spot prawn than on, say, Kelp greenling. Illustrating another set of effects, package 3 affects 10% of the total fishing grounds for halibut, but 12% when considering those that fall into the (nearer to shore) study area waters. In this case, the effects on fishing area and importance are almost identical, with 10% and 11% of stated importance affected, respectively. In addition, from Table 1, the halibut fishery constitutes
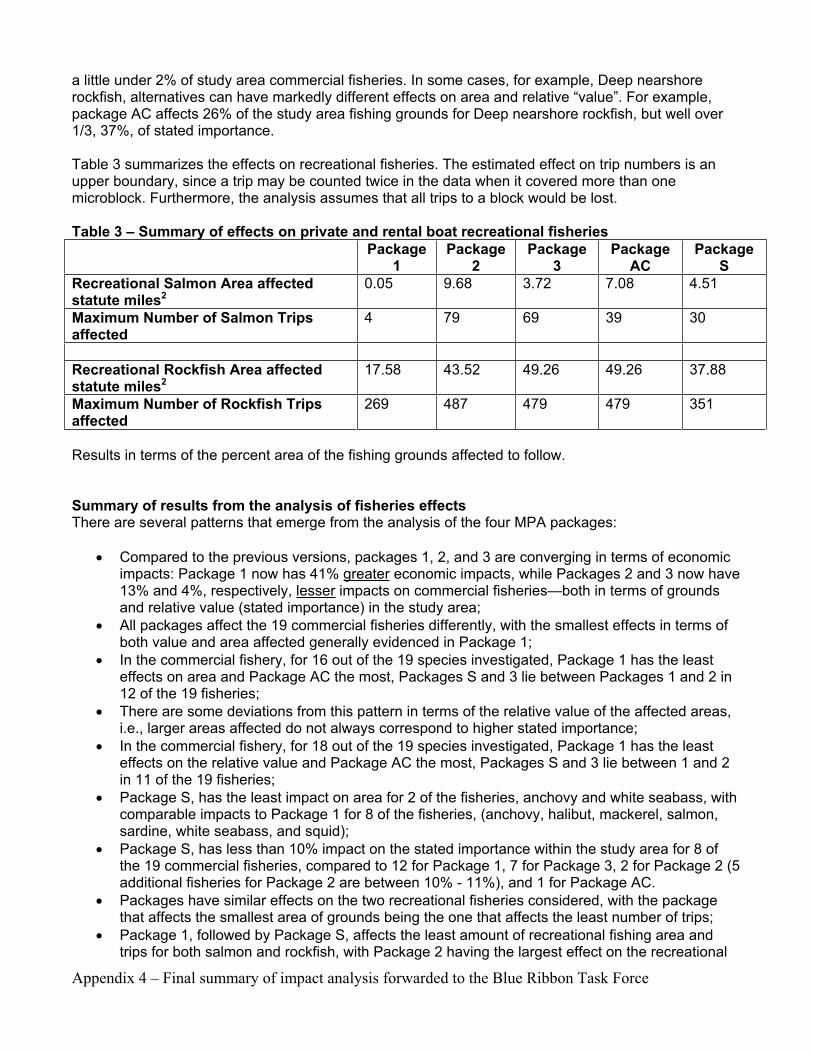
Appendix 4 – Final summary of impact analysis forwarded to the Blue Ribbon Task Force
a little under 2% of study area commercial fisheries. In some cases, for example, Deep nearshore rockfish, alternatives can have markedly different effects on area and relative “value”. For example, package AC affects 26% of the study area fishing grounds for Deep nearshore rockfish, but well over 1/3, 37%, of stated importance.
Table 3 summarizes the effects on recreational fisheries. The estimated effect on trip numbers is an upper boundary, since a trip may be counted twice in the data when it covered more than one microblock. Furthermore, the analysis assumes that all trips to a block would be lost.
Table 3 – Summary of effects on private and rental boat recreational fisheries
Package1
Package2
Package3
PackageAC
PackageS
Recreational Salmon Area affected statute miles2
0.05 9.68 3.72 7.08 4.51
Maximum Number of Salmon Trips affected
4 79 69 39 30
Recreational Rockfish Area affected statute miles2
17.58 43.52 49.26 49.26 37.88
Maximum Number of Rockfish Trips affected
269 487 479 479 351
Results in terms of the percent area of the fishing grounds affected to follow.
Summary of results from the analysis of fisheries effects There are several patterns that emerge from the analysis of the four MPA packages:
Compared to the previous versions, packages 1, 2, and 3 are converging in terms of economic impacts: Package 1 now has 41% greater economic impacts, while Packages 2 and 3 now have 13% and 4%, respectively, lesser impacts on commercial fisheries—both in terms of grounds and relative value (stated importance) in the study area;
All packages affect the 19 commercial fisheries differently, with the smallest effects in terms of both value and area affected generally evidenced in Package 1;
In the commercial fishery, for 16 out of the 19 species investigated, Package 1 has the least effects on area and Package AC the most, Packages S and 3 lie between Packages 1 and 2 in 12 of the 19 fisheries;
There are some deviations from this pattern in terms of the relative value of the affected areas, i.e., larger areas affected do not always correspond to higher stated importance;
In the commercial fishery, for 18 out of the 19 species investigated, Package 1 has the least effects on the relative value and Package AC the most, Packages S and 3 lie between 1 and 2 in 11 of the 19 fisheries;
Package S, has the least impact on area for 2 of the fisheries, anchovy and white seabass, with comparable impacts to Package 1 for 8 of the fisheries, (anchovy, halibut, mackerel, salmon, sardine, white seabass, and squid);
Package S, has less than 10% impact on the stated importance within the study area for 8 of the 19 commercial fisheries, compared to 12 for Package 1, 7 for Package 3, 2 for Package 2 (5 additional fisheries for Package 2 are between 10% - 11%), and 1 for Package AC.
Packages have similar effects on the two recreational fisheries considered, with the package that affects the smallest area of grounds being the one that affects the least number of trips;
Package 1, followed by Package S, affects the least amount of recreational fishing area and trips for both salmon and rockfish, with Package 2 having the largest effect on the recreational

Appendix 4 – Final summary of impact analysis forwarded to the Blue Ribbon Task Force
fishing area and number of trips for salmon, while Packages AC and 3 have the largest effect on the recreational fishing area and number of trips for rockfish.
California Department of Fish and Game Master Plan for Marine Protected Areas January 2008 Page R-7
5. South Coast Region (Point Conception to U.S./Mexico Border)
To be added upon region completion
Related Documents


