1 Appendix E-1 1.1 Fat Saturation Ratio Validation The fat-saturation pulse was applied at the resonance frequency of fat, which is offset about 440 Hz from the water resonance frequency at 3 T. Thus, the fat-saturation pulse had MT properties, and percent difference images calculated from the images without and with the fat saturation pulse showed the expected MT contrast, with greater MTR values in WM than in GM, and variably decreased values in MS lesions. We performed a cross-validation test comparing fat-sat MTR (FSMTR) to conventional MTR images from the same volunteer acquired in the same session. We implemented the BECOME sequences on a 3T Siemens TIM Trio scanner, and added a T1-weighted spin-echo sequence with the standard Siemens off-resonance MT pulse (Gaussian, 1200 Hz off-resonance, 500˚ flip angle). The T1-weighted image without any additional prepulse, the T1-weighted image with the fat sat pulse, and the T1-weighted image with the MT pulse, were acquired consecutively without any intervening scanner preparation. The participant was then repositioned and the acquisitions were

Welcome message from author
This document is posted to help you gain knowledge. Please leave a comment to let me know what you think about it! Share it to your friends and learn new things together.
Transcript
1 Appendix E-1
1.1 Fat Saturation Ratio Validation
The fat-saturation pulse was applied at the resonance frequency of fat, which is offset about 440
Hz from the water resonance frequency at 3 T. Thus, the fat-saturation pulse had MT properties,
and percent difference images calculated from the images without and with the fat saturation
pulse showed the expected MT contrast, with greater MTR values in WM than in GM, and
variably decreased values in MS lesions. We performed a cross-validation test comparing fat-sat
MTR (FSMTR) to conventional MTR images from the same volunteer acquired in the same
session. We implemented the BECOME sequences on a 3T Siemens TIM Trio scanner, and
added a T1-weighted spin-echo sequence with the standard Siemens off-resonance MT pulse
(Gaussian, 1200 Hz off-resonance, 500˚ flip angle). The T1-weighted image without any
additional prepulse, the T1-weighted image with the fat sat pulse, and the T1-weighted image
with the MT pulse, were acquired consecutively without any intervening scanner preparation.
The participant was then repositioned and the acquisitions were repeated to assess reproducibility
of the FSMTR and MTR images. All scans were co-registered and MTR and FSMTR images
computed. Parenchymal brain masks were produced (Brain Extraction Tool, FSL, Oxford) from
the T1-weighted image with no preparation pulse. Masks were additionally eroded by 2 voxels
and voxels with intensity less than 2 or greater than 100 were added to the masks to remove
partial volume and noise voxels. This procedure was repeated for each of three healthy controls
and two volunteers with MS.
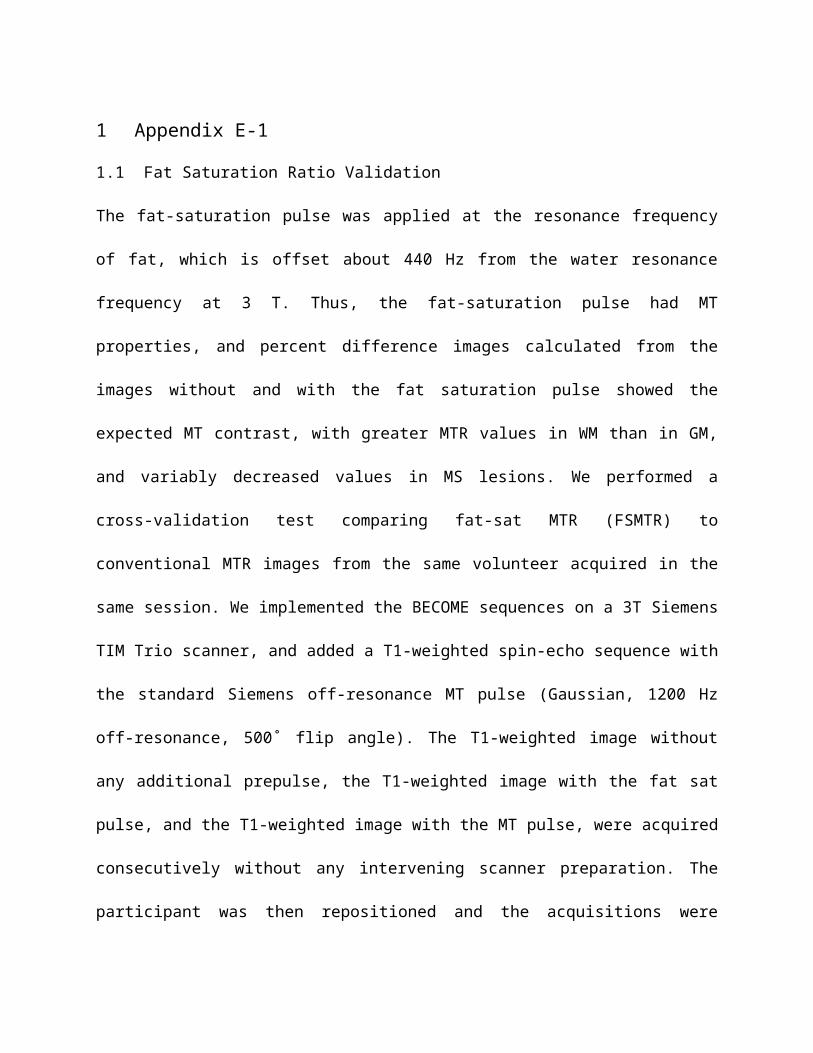
Error: Reference source not found shows the resulting masked images. To assess reproducibility,
voxel-wise Pearson’s correlation of all unmasked voxels was performed in each participant
between MTR or FSMTR acquired in the first group of images (“scan”) and the images acquired
after repositioning (“rescan”). Pearson’s correlation was also calculated between MTR and
FSMTR data. Additionally, joint histograms and Bland-Altman plots were produced for the
MTR vs. FSMTR comparison in each participant, and in the merged data for the whole group.
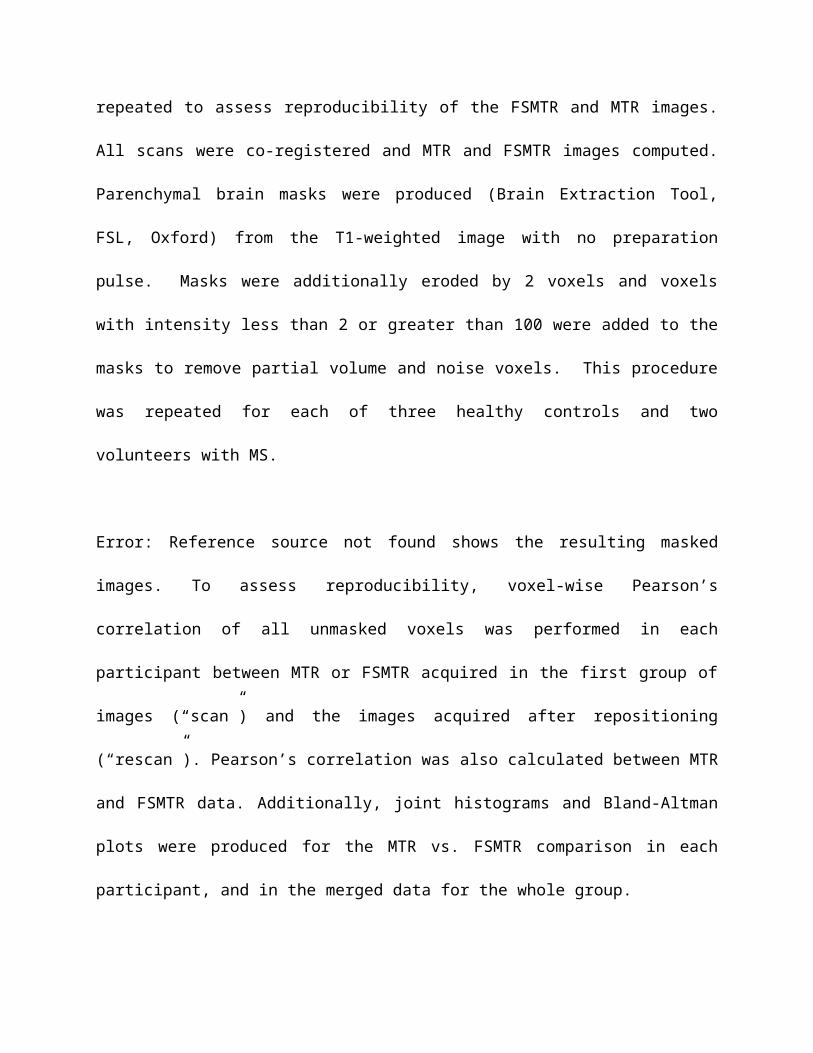
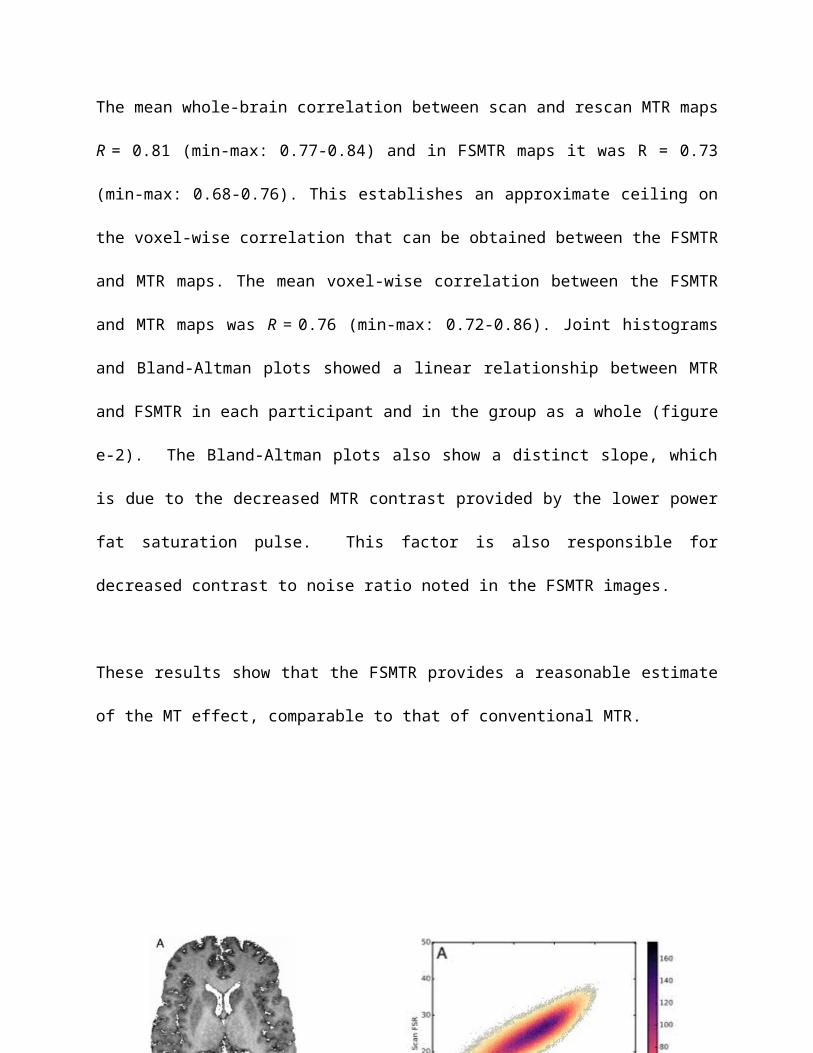
The mean whole-brain correlation between scan and rescan MTR maps R = 0.81 (min-max: 0.77-
0.84) and in FSMTR maps it was R = 0.73 (min-max: 0.68-0.76). This establishes an
approximate ceiling on the voxel-wise correlation that can be obtained between the FSMTR and
MTR maps. The mean voxel-wise correlation between the FSMTR and MTR maps was R = 0.76
(min-max: 0.72-0.86). Joint histograms and Bland-Altman plots showed a linear relationship
between MTR and FSMTR in each participant and in the group as a whole (figure e-2). The
Bland-Altman plots also show a distinct slope, which is due to the decreased MTR contrast
provided by the lower power fat saturation pulse. This factor is also responsible for decreased
contrast to noise ratio noted in the FSMTR images.
These results show that the FSMTR provides a reasonable estimate of the MT effect, comparable
to that of conventional MTR.
1.2 FSMTR Recovery in Participants with both Gd and FSMTR Lesions
Table e-1: Parameter estimates of the statistical model for FSMTR in Gd lesions for the subset of participants with both Gd and FSMTR lesions. The model fit significantly better than the null model (χ2 = 2723; df = 3; p > 0.0001) with marginal R2 = 0.272 and conditional R2 = 0.604.
EffectEstimate (FSMTR
units)
Standard Error
Degrees of freedom f p
Intercept 25.6 0.546 - - -
Treatment (GA) 1.02 0.773 1 / 26 2.52 0.124
PostLesion -3.66 0.0753 1 / 5735 985 < 0.0001
PostLesion : Treatment (GA) 0.272 0.126 1 / 5735 23.0 < 0.0001
Random Effects χ2 = 1681; p < 0.00001
participant variance = 3.97
residual variance = 4.72
Table e-2: Parameter estimates of the statistical model for FSMTR in FSMTR lesions for the subset of participants with both Gd and FSMTR lesions. The model fit significantly better than the null model (χ2 = 307; df = 3; p > 0.0001) with marginal R2 = 0.255 and conditional R2 = 0.535.
EffectEstimate (FSMTR
units)
Standard Error
Degrees of freedom f p
Intercept 27.2 0.704 - - -
Treatment (GA) -1.01 1.00 1 / 27 0.74 0.400
PostLesion -5.66 0.322 1 / 1342 130 < 0.0001
PostLesion : Treatment (GA) 4.31 0.395 1 / 1342 21.1 < 0.0001
Random Effects χ2 = 167; p < 0.00001
participant variance = 4.66
Related Documents