Edinburgh Research Explorer Processing speed and the relationship between Trail Making Test-B performance, cortical thinning and white matter microstructure in older adults Citation for published version: MacPherson, SE, Cox, SR, Dickie, DA, Karama, S, Starr, JM, Evans, AC, Bastin, ME, Wardlaw, JM & Deary, IJ 2017, 'Processing speed and the relationship between Trail Making Test-B performance, cortical thinning and white matter microstructure in older adults', Cortex, vol. 95, pp. 92-103. https://doi.org/10.1016/j.cortex.2017.07.021 Digital Object Identifier (DOI): 10.1016/j.cortex.2017.07.021 Link: Link to publication record in Edinburgh Research Explorer Document Version: Publisher's PDF, also known as Version of record Published In: Cortex General rights Copyright for the publications made accessible via the Edinburgh Research Explorer is retained by the author(s) and / or other copyright owners and it is a condition of accessing these publications that users recognise and abide by the legal requirements associated with these rights. Take down policy The University of Edinburgh has made every reasonable effort to ensure that Edinburgh Research Explorer content complies with UK legislation. If you believe that the public display of this file breaches copyright please contact [email protected] providing details, and we will remove access to the work immediately and investigate your claim. Download date: 11. Apr. 2020

Welcome message from author
This document is posted to help you gain knowledge. Please leave a comment to let me know what you think about it! Share it to your friends and learn new things together.
Transcript

Edinburgh Research Explorer
Processing speed and the relationship between Trail MakingTest-B performance, cortical thinning and white mattermicrostructure in older adults
Citation for published version:MacPherson, SE, Cox, SR, Dickie, DA, Karama, S, Starr, JM, Evans, AC, Bastin, ME, Wardlaw, JM &Deary, IJ 2017, 'Processing speed and the relationship between Trail Making Test-B performance, corticalthinning and white matter microstructure in older adults', Cortex, vol. 95, pp. 92-103.https://doi.org/10.1016/j.cortex.2017.07.021
Digital Object Identifier (DOI):10.1016/j.cortex.2017.07.021
Link:Link to publication record in Edinburgh Research Explorer
Document Version:Publisher's PDF, also known as Version of record
Published In:Cortex
General rightsCopyright for the publications made accessible via the Edinburgh Research Explorer is retained by the author(s)and / or other copyright owners and it is a condition of accessing these publications that users recognise andabide by the legal requirements associated with these rights.
Take down policyThe University of Edinburgh has made every reasonable effort to ensure that Edinburgh Research Explorercontent complies with UK legislation. If you believe that the public display of this file breaches copyright pleasecontact [email protected] providing details, and we will remove access to the work immediately andinvestigate your claim.
Download date: 11. Apr. 2020
https://www.research.ed.ac.uk/portal/en/persons/simon-cox(3e69f295-a17f-4b32-92ab-068205575469).html
https://www.research.ed.ac.uk/portal/en/persons/ian-deary(dafe90e6-757a-429b-8465-6141cbdddd9e).html

www.sciencedirect.com
c o r t e x 9 5 ( 2 0 1 7 ) 9 2e1 0 3
Available online at
ScienceDirect
Journal homepage: www.elsevier.com/locate/cortex
Research report
Processing speed and the relationship betweenTrail Making Test-B performance, cortical thinningand white matter microstructure in older adults
Sarah E. MacPherson a,b,*, Simon R. Cox a,b,c, David A. Dickie c,d,Sherif Karama e,f, John M. Starr a,g, Alan C. Evans e, Mark E. Bastin a,c,d,Joanna M. Wardlaw a,c,d and Ian J. Deary a,b
a Centre for Cognitive Ageing and Cognitive Epidemiology, University of Edinburgh, UKb Department of Psychology, University of Edinburgh, UKc Scottish Imaging Network, a Platform for Scientific Excellence (SINAPSE) Collaboration, Edinburgh, UKd Department of Neuroimaging Sciences, Centre for Clinical Brain Sciences, University of Edinburgh, UKe Department of Neurology and Neurosurgery, McConnell Brain Imaging Center, Montreal Neurological Institute,
McGill University, Montreal, QC, Canadaf Department of Psychiatry, Douglas Mental Health University Institute, McGill University, Verdun, QC, Canadag Alzheimer Scotland Dementia Research Centre, The University of Edinburgh, Edinburgh, UK
a r t i c l e i n f o
Article history:
Received 8 July 2016
Reviewed 5 September 2016
Revised 14 January 2017
Accepted 1 August 2017
Action editor Stefan Schweinberger
Published online 9 August 2017
Keywords:
Aging
Executive function
Neuroimaging
Processing speed
Trail Making Test
* Corresponding author. Department of PsycE-mail address: [email protected]
http://dx.doi.org/10.1016/j.cortex.2017.07.0210010-9452/© 2017 The Authors. Published byorg/licenses/by/4.0/).
a b s t r a c t
Part B of the Trail Making Test (TMT-B) is widely used as a quick and easy to administer
measure of executive dysfunction. The current study investigated the relationships be-
tween TMT-B performance, brain volumes, cortical thickness and white matter water
diffusion characteristics in a large sample of older participants, before and after controlling
for processing speed. Four hundred and eleven healthy, community-dwelling older adults
who were all born in 1936 were assessed on TMT-B, 5 tests of processing speed, and pro-
vided contemporaneous structural and diffusion MRI data. Significant relationships were
found between slower TMT-B completion times and thinner cortex in the frontal, temporal
and inferior parietal regions as well as the Sylvian fissure/insula. Slower TMT-B completion
time was also significantly associated with poorer white matter microstructure of the left
anterior thalamic radiation, and the right uncinate fasciculus. The majority of these as-
sociations were markedly attenuated when additionally controlling for processing speed.
These data suggest that individual differences in processing speed contribute to the as-
sociations between TMT-B completion time and the grey and white matter structure of
older adults.
© 2017 The Authors. Published by Elsevier Ltd. This is an open access article under the CC
BY license (http://creativecommons.org/licenses/by/4.0/).
hology, PPLS, University of Edinburgh, 7 George Square, Edinburgh EH8 9JZ, UK..uk (S.E. MacPherson).
Elsevier Ltd. This is an open access article under the CC BY license (http://creativecommons.

c o r t e x 9 5 ( 2 0 1 7 ) 9 2e1 0 3 93
1. Introduction
The Trail Making Test (TMT) is one of the most commonly
used tests of executive function in clinical neuropsychological
assessment (Delis, Kaplan,&Kramer, 2001; Lezak, 1995; Reitan
&Wolfson, 1993). Part A is administered as a baselinemeasure
of motor and visual search speed, whereas Part B is adminis-
tered as a measure of set-shifting and inhibition (Arbuthnott
& Frank, 2000; Gl€ascher et al., 2012; Kortte, Horner, &
Windham, 2002; Strauss, Sherman, & Spreen, 2006). Poor
performance on TMT-B is often associated with lesions in the
dorsolateral prefrontal cortex (Davidson, Gao, Mason,
Winocur, & Anderson, 2008; Moll, de Oliveira-Souza, Moll,
Bramati, & Andreiuolo, 2002; Stuss et al., 2001; Yochim, Baldo,
Nelson, & Delis, 2007; Zakzanis, Mraz, & Graham, 2005) and
the anterior cingulate (Gl€ascher et al., 2012), although signifi-
cant differences between frontal and non-frontal patients'TMT-B performance are not always found (Reitan & Wolfson,
1995; Tamez et al., 2011; Chan et al., 2015; see Demakis, 2004,
for a meta-analysis).
TMT performance is found to decline, on average, in
healthy aging (Giovagnoli et al., 1996; Hamdan & Hamdan,
2009; Hashimoto et al., 2006; Hester, Kinsella, Ong, &
McGregor, 2005; Peri�a~nez et al., 2007; Seo et al., 2006) with
performance on TMT-B declining significantly more than
TMT-A in older adults (Drane, Yuspeh, Huthwaite, & Klingler,
2002; Rasmusson, Zonderman, Kawas, & Resnick, 1998). Age-
related decline in TMT performance has been associated
with poorer grey matter volume in the dorsolateral and
ventrolateral prefrontal cortex, medial prefrontal cortex,
frontal pole, right inferior frontal gyrus, temporal lobe, insular
cortex, caudate, globus pallidus, posterior parietal lobe, oc-
cipital cortex and the cerebellum (Newman, Trivedi, Bendlin,
Ries, & Johnson, 2007; Pa et al., 2010; Ruscheweyh et al.,
2013). In terms of white matter microstructural integrity and
TMT performance, while Perry et al. (2009) reported a signifi-
cant association between age and TMT-B performance
strongly mediated by the effect of age on white matter
microstructure, Koch et al. (2013) found better white matter
microstructure of the body of the corpus callosum was asso-
ciated with less time needed to complete TMT-A but not
TMT-B.
Research has shown that processing speed is significantly
associated with performance on the TMT-B in older adults
(Oosterman et al., 2010; Salthouse, 2011a). However, process-
ing speed can be assessed in at least three different ways (see
Deary, 2000). In terms of psychometric behavioural tests,
participants must make simple decisions that would be
completed correctly if sufficient time was provided (e.g., Digit
Symbol-Coding subtest from the Wechsler Adult Intelligence
Scales; Wechsler, 1997). In terms of cognitive-experimental
psychology and psychophysics tests, the responses are even
less demanding and made more quickly than psychometric
tests, with cognitive-experimental tests using simple and
choice reaction times to assess processing speed, and psy-
chophysical measures using inspection time. In this study,
TMT-A was not administered; instead we derived a latent
measure of processing speed as the common variance across
five speed of processing tasks including psychometric
behavioural, cognitive experimental and psychophysical
measures (Deary et al., 2007). In addition, given that some of
these processing speed measures might arguably involve
more complex decision-making, more akin to executive abil-
ities, we also derived a simple processing speed factor. We
examine the extent to which these two simple and complex
processing speedmeasures influence the relationship of TMT-
B completion time with cortical thickness and white matter
microstructure.
2. Methods
2.1. Participants
Participants were from the Lothian Birth Cohort 1936
(LBC1936), a longitudinal study of aging of individuals all born
in 1936 and livingmainly in the Edinburgh and Lothians region
of Scotland, UK (Deary, Gow, Pattie, & Starr, 2012; Deary et al.,
2007). Participants first had cognitive and other datameasured
at Wave 1 at age ~70 years between 2004 and 2007. No partic-
ipant had a diagnosis of dementia at entry. Wave 2 testingwas
carried out 3 years later. Wave 1 data are not reported as there
was no neuroimaging at Wave 1, and TMT was not adminis-
tered during Waves 1 or 2. At Wave 3, participants attended
cognitive testing and underwent brain MRI at ~76 years. For
the present study, 411 participants (219 males, 192 females)
were included who had performed the TMT-B, had brain MRI
data, achieved a score of 24 or greater on theMini-Mental State
Examination (MMSE; Folstein, Folstein, & McHugh, 1975), and
had a score of less than 11 on the depression subscale of the
Hospital Anxiety and Depression Scale (Snaith, 2003) at Wave
3. Cognitive testing and MRI scanning were undertaken on
separate occasionswith four participants attending their brain
MRI scan first (lag¼ 39.40 days, SD¼ 30.74, range¼�36 to 320).
No participant self-reported a diagnosis of dementia either at
entry to LBC1936 or Wave 3 (i.e., their current assessment). No
one had a history of traumatic brain injury, stroke, brain
tumour or other neurological conditions. All participants were
healthy older adults who were considered able to live inde-
pendently. Study approval was granted by the Lothian
Research Ethics Committee (LREC/2003/2/39) and the Multi-
Centre Research Ethics Committee for Scotland (MREC/01/0/
56). Written informed consent was obtained from all partici-
pants, and has been kept on file.
2.2. Cognitive testing
Details of the full Lothian Birth Cohort 1936 protocol that
participants completed are reported in Deary et al. (2007).
Here, we describe a subgroup of tasks that were administered
at Wave 3 of the protocol and are examined in the current
study. Part B of the Trail Making Test (TMT-B) was adminis-
tered to cohort members using pen and paper, and standard
administration instructions (Bowie & Harvey, 2006). The only
difference was that all TMT-B completion times were
included, rather than a maximum of 300 sec. The domain of
processing speed was tested using Symbol Search (WAIS-III;
Wechsler, 1997); Digit-Symbol (WAIS-III; Wechsler, 1997);
Simple and 4-Choice Reaction Time (Cox, Huppert, &

c o r t e x 9 5 ( 2 0 1 7 ) 9 2e1 0 394
Whichelow, 1993), and visual Inspection Time (Deary et al.,
2004), which have been reported previously (Deary, Johnson,
& Starr, 2010; Deary et al., 2007). Briefly, in Symbol Search,
participants indicated whether one of two target symbols on
the left of a row was also included among the five symbols
printed on the right. The total score is the number of correct
responses in 120 sec. In Digit-Symbol, participants wrote
down symbols below rows of numbers 1e9, according to a
number-symbol code. The score is the number of correct
symbols written in 120 sec. In the Reaction Time tasks, par-
ticipants had a button box with 5 buttons numbered from left
to right: 1, 2, 0, 3 and 4. For the Simple Reaction Time task, they
pressed zero when a zero appeared on an LCD screen and for
the 4-Choice Reaction Time task, they pressed the corre-
sponding button when a 1, 2, 3 or 4 was presented on the
screen. The scores for both tasks were the mean correct
response reaction times. In the visual Inspection Time task,
individuals indicated using a button press which of two par-
allel, vertical lines was longer. In this task, there was no
measure of response speed; the correctness of the response
was recorded, and there were 15 different stimulus durations,
ranging from 6 to 200 msec. Participants were repeatedly
instructed to respond accurately rather than quickly and the
next stimulus was not presented until a response was made.
The score is the total number of correct responses out of 150.
2.3. Brain MRI acquisition and processing
Full details of the brain MRI acquisition protocol have been
described previously in an open-access article (Wardlaw et al.,
2011). Briefly, MRI acquisition was conducted on the same
1.5 T GE Signa Horizon HDx clinical scanner (General Electric,
Milwaukee, WI, USA). Acquisition comprised T2-, T2*- and
FLAIR-weighted axial scans, and a high-resolution 3D T1-
weighted volume sequence acquired in the coronal plane
(voxel dimensions 1� 1� 1.3 mm). The diffusionMRI protocol
consisted of seven T2-weighted, and set of diffusion-weighted
(b ¼ 1000 sec/mm2) axial single-shot spin-echo echo planar
volumes acquired with diffusion gradients applied in 64 non-
collinear directions (voxel dimensions 2 � 2 � 2 mm).
Intracranial volume, whole brain, grey matter, normal-
appearing white matter and white matter hyperintensity
(WMH) volumes were measured using a previously described
method which exploits multispectral image intensities from
T1-, T2-, T2*- and FLAIR-weighted sequences (Vald�es
Hern�andez, Ferguson, Chappell, & Wardlaw, 2010; Wardlaw
et al., 2011). We explicitly defined WMH as punctate, focal or
diffuse lesions in all subcortical regions, according to Stan-
dards for Reporting Vascular changes on nEuroimaging
(STRIVE; Wardlaw et al., 2013). Periventricular and deepWMH
were not considered separately, as some previous research
has demonstrated they are highly correlated (e.g., DeCarli,
Fletcher, Ramey, Harvey, & Jagust, 2005, reported a correla-
tion around r ¼ .9) and often spatially proximal. Infarcts
(including lacunar infarcts) and enlarged perivascular spaces
were excluded from the WMH masks. WMH are a common
finding in imaging of healthy older adults (seeMu~nozManiega
et al., 2015; Wardlaw, Vald�es Hern�andez, & Mu~noz-Maniega,
2015) and the majority of participants in this study exhibited
at least someWMH volume (395 out of 411). All segmentations
were checked for accuracy and manually edited, blind to all
other participant information.
Cortical thickness was measured using CIVET 1.1.12 based
on participants'Wave 3 MRI scans. CIVET is a fully-automated
pipeline developed at the Montreal Neurological Institute
(http://www.bic.mni.mcgill.ca; Ad-Dab'bagh et al., 2006;
Zijdenbos, Forghani, & Evans, 2002) using the following pro-
cessing steps (Karama et al., 2009, 2015): (1) registration of T1-
weighted volumes to an age-specific template; (2) bias field
(intensity non-uniformity) correction; (3) brain extraction; (4)
segmentation of grey and white matter, and cerebrospinal
fluid; (5) definition of cortical thickness at 81,924 vertices (the
perpendicular distance between grey and white matter sur-
faces) across the cortex via the t-link metric; (6) inverse of
registration at step 1 for cortical thickness measurements in
the native space of each subject; and (7) smoothing with a 20-
mm kernel. Visual inspection of the CIVET outputs was con-
ducted blind to subject characteristics. Four hundred and
three subjects had 3D T1-weighted volume scans for cortical
thickness processing. Of these, 47 subjects (11.7%) failed
processing due to motion artefact/poor scan quality, leaving
356 subjects for cortical thickness statistical analysis. This is
within expected rates of failure in cortical thickness pro-
cessing (Ducharme et al., 2016).
Diffusion MRI data were also available for 389 out of 411
participants at Wave 3. To quantify white matter tract
microstructure, diffusionMRI data was initially pre-processed
to extract brain, remove bulk patient motion and eddy
current-induced artefacts. Parametric maps of fractional
anisotropy (FA) and mean diffusivity (MD) were generated for
every participant using freely-available tools in FSL (FMRIB,
Oxford, UK: http://www.fmrib.ox.ac.uk). While FA and MD are
derived from the same raw water molecular diffusion data,
they are widely perceived to provide different information
about the underlying microstructure of white matter. The
directional coherence of water diffusion is considered to
denote the degree to which factors including (but not
restricted to) myelination impede cross-fibre diffusion,
whereasMDprovides a general index of the overallmagnitude
of water diffusion (irrespective of its direction) and is more
informative of extra-cellular water content which may be
caused by differences in bloodebrain barrier integrity, for
example (Cox et al., 2016). Probabilistic neighbourhood trac-
tography (PNT), as implemented in the TractoR package
(http://tractor-mri.org.uk; Clayden et al., 2011), was used to
segment tracts of interest automatically with the BedpostX/
ProbTrackX algorithm run with a two-fibre model and 5000
streamlines per seed point providing the underlying connec-
tivity data. Tract-averaged FA values (weighted by connection
probability) where then determined for the following 12 tracts:
genu and splenium of the corpus callosum, bilateral anterior
thalamic radiation (ATR), cingulum bundle, arcuate fascic-
ulus, uncinate fasciculus, and inferior longitudinal fasciculus
(ILF). Following visual inspection, blind to participant char-
acteristics, those tract masks that exhibited aberrant or
truncated pathways or were not anatomically plausible rep-
resentations of the tract-of-interest were excluded, leaving
345e388 instances of each tract for analysis.
c o r t e x 9 5 ( 2 0 1 7 ) 9 2e1 0 3 95
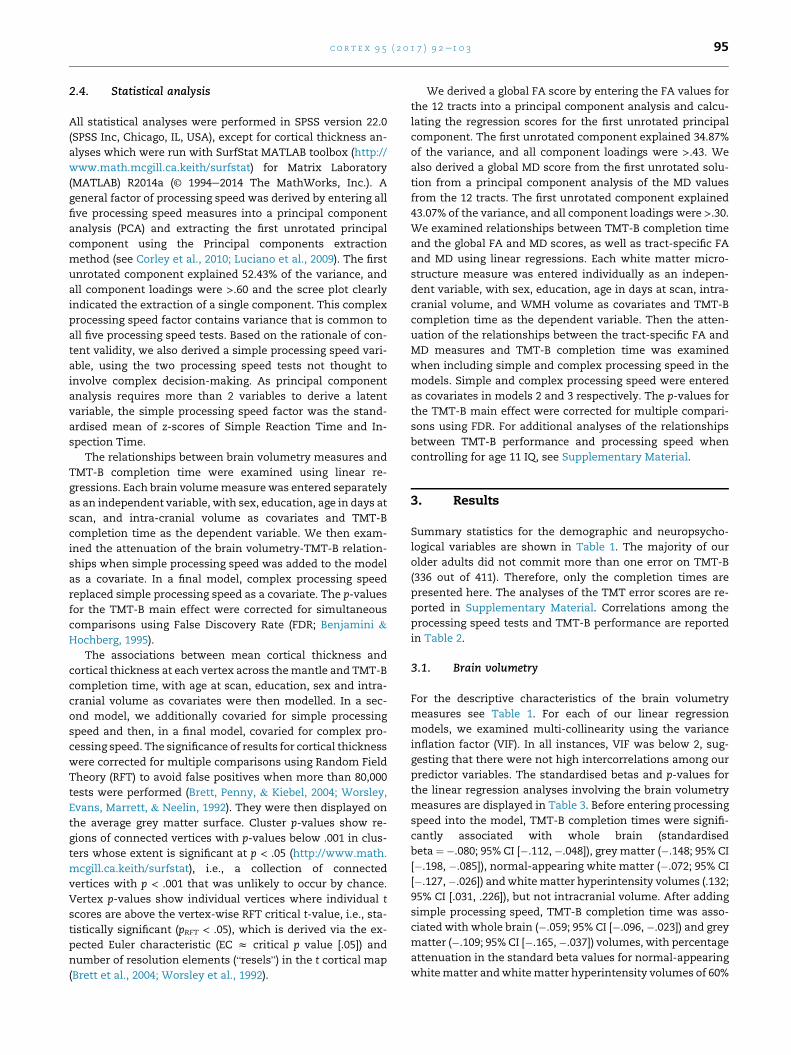
2.4. Statistical analysis
All statistical analyses were performed in SPSS version 22.0
(SPSS Inc, Chicago, IL, USA), except for cortical thickness an-
alyses which were run with SurfStat MATLAB toolbox (http://
www.math.mcgill.ca.keith/surfstat) for Matrix Laboratory
(MATLAB) R2014a (© 1994e2014 The MathWorks, Inc.). A
general factor of processing speed was derived by entering all
five processing speed measures into a principal component
analysis (PCA) and extracting the first unrotated principal
component using the Principal components extraction
method (see Corley et al., 2010; Luciano et al., 2009). The first
unrotated component explained 52.43% of the variance, and
all component loadings were >.60 and the scree plot clearly
indicated the extraction of a single component. This complex
processing speed factor contains variance that is common to
all five processing speed tests. Based on the rationale of con-
tent validity, we also derived a simple processing speed vari-
able, using the two processing speed tests not thought to
involve complex decision-making. As principal component
analysis requires more than 2 variables to derive a latent
variable, the simple processing speed factor was the stand-
ardised mean of z-scores of Simple Reaction Time and In-
spection Time.
The relationships between brain volumetry measures and
TMT-B completion time were examined using linear re-
gressions. Each brain volumemeasure was entered separately
as an independent variable, with sex, education, age in days at
scan, and intra-cranial volume as covariates and TMT-B
completion time as the dependent variable. We then exam-
ined the attenuation of the brain volumetry-TMT-B relation-
ships when simple processing speed was added to the model
as a covariate. In a final model, complex processing speed
replaced simple processing speed as a covariate. The p-values
for the TMT-B main effect were corrected for simultaneous
comparisons using False Discovery Rate (FDR; Benjamini &
Hochberg, 1995).
The associations between mean cortical thickness and
cortical thickness at each vertex across themantle and TMT-B
completion time, with age at scan, education, sex and intra-
cranial volume as covariates were then modelled. In a sec-
ond model, we additionally covaried for simple processing
speed and then, in a final model, covaried for complex pro-
cessing speed. The significance of results for cortical thickness
were corrected for multiple comparisons using Random Field
Theory (RFT) to avoid false positives when more than 80,000
tests were performed (Brett, Penny, & Kiebel, 2004; Worsley,
Evans, Marrett, & Neelin, 1992). They were then displayed on
the average grey matter surface. Cluster p-values show re-
gions of connected vertices with p-values below .001 in clus-
ters whose extent is significant at p < .05 (http://www.math.
mcgill.ca.keith/surfstat), i.e., a collection of connected
vertices with p < .001 that was unlikely to occur by chance.
Vertex p-values show individual vertices where individual t
scores are above the vertex-wise RFT critical t-value, i.e., sta-
tistically significant (pRFT < .05), which is derived via the ex-
pected Euler characteristic (EC z critical p value [.05]) and
number of resolution elements (“resels”) in the t cortical map
(Brett et al., 2004; Worsley et al., 1992).
We derived a global FA score by entering the FA values for
the 12 tracts into a principal component analysis and calcu-
lating the regression scores for the first unrotated principal
component. The first unrotated component explained 34.87%
of the variance, and all component loadings were >.43. We
also derived a global MD score from the first unrotated solu-
tion from a principal component analysis of the MD values
from the 12 tracts. The first unrotated component explained
43.07% of the variance, and all component loadings were >.30.We examined relationships between TMT-B completion time
and the global FA and MD scores, as well as tract-specific FA
and MD using linear regressions. Each white matter micro-
structure measure was entered individually as an indepen-
dent variable, with sex, education, age in days at scan, intra-
cranial volume, and WMH volume as covariates and TMT-B
completion time as the dependent variable. Then the atten-
uation of the relationships between the tract-specific FA and
MD measures and TMT-B completion time was examined
when including simple and complex processing speed in the
models. Simple and complex processing speed were entered
as covariates in models 2 and 3 respectively. The p-values for
the TMT-B main effect were corrected for multiple compari-
sons using FDR. For additional analyses of the relationships
between TMT-B performance and processing speed when
controlling for age 11 IQ, see Supplementary Material.
3. Results
Summary statistics for the demographic and neuropsycho-
logical variables are shown in Table 1. The majority of our
older adults did not commit more than one error on TMT-B
(336 out of 411). Therefore, only the completion times are
presented here. The analyses of the TMT error scores are re-
ported in Supplementary Material. Correlations among the
processing speed tests and TMT-B performance are reported
in Table 2.
3.1. Brain volumetry
For the descriptive characteristics of the brain volumetry
measures see Table 1. For each of our linear regression
models, we examined multi-collinearity using the variance
inflation factor (VIF). In all instances, VIF was below 2, sug-
gesting that there were not high intercorrelations among our
predictor variables. The standardised betas and p-values for
the linear regression analyses involving the brain volumetry
measures are displayed in Table 3. Before entering processing
speed into the model, TMT-B completion times were signifi-
cantly associated with whole brain (standardised
beta ¼ �.080; 95% CI [�.112, �.048]), grey matter (�.148; 95% CI
[�.198, �.085]), normal-appearing white matter (�.072; 95% CI
[�.127,�.026]) andwhitematter hyperintensity volumes (.132;
95% CI [.031, .226]), but not intracranial volume. After adding
simple processing speed, TMT-B completion time was asso-
ciated with whole brain (�.059; 95% CI [�.096, �.023]) and grey
matter (�.109; 95% CI [�.165,�.037]) volumes, with percentage
attenuation in the standard beta values for normal-appearing
whitematter andwhitematter hyperintensity volumes of 60%

Table 1 e Participant characteristics, including brain volumetry measures.
Characteristic N M (SD) Min, max
Age at cognitive testing 411 76.32 (.65) 74.75, 77.75
Age at MRI scan 411 76.43 (.64) 74.90, 77.79
Full-time education 411 10.83 (1.15) 9, 14
MMSE (out of 30) 411 28.80 (1.32) 24, 30
HADS-D (out of 21) 411 2.69 (2.22) 0, 10
Symbol search (total number correct) 410 24.97 (6.28) 5, 53
Digit-symbol substitution (total number correct) 410 55.12 (12.26) 15, 89
Simple reaction time (correct response RTs in seconds) 411 .28 (.05) .19, .58
4-choice reaction time (correct response RTs in seconds) 411 .67 (.10) .46, 1.14
Inspection time (out of 150) 401 110.53 (12.34) 49, 136
Simple processing speed factor 401 0 (1) �2.00, 4.00
Complex processing speed factor 399 0 (1) �3.72, 2.90
TMT-B (time to complete in seconds) 411 99.77 (50.28) 39, 482
TMT-B (errors) 411 .73 (1.05) 0, 6
Intracranial volume (cm3) 396 1440.56 (139.84) 1065.72, 1854.72
Whole brain volume (cm3) 396 977.84 (92.69) 713.42, 1248.63
Grey matter volume (cm3) 392 467.12 (44.33) 361.35, 593.70
NAWM volume (cm3) 392 466.42 (54.38) 280.34, 652.29
WMH volume (cm3) 395 15.12 (14.19) .35, 91.86
Mean cortical thickness 348 3.13 (.16) 2.62, 3.78
MMSE ¼ Mini Mental-State Examination; HADS-D ¼ Hospital Anxiety and Depression Scale-Depression; RTs ¼ response times; TMT-B ¼ Trail
Making Test Part B; NAWM ¼ normal-appearing white matter; WMH ¼ white matter hyperintensity.
Simple processing speed factor ¼ Simple Reaction Time and Inspection Time.
Complex processing speed factor ¼ Symbol Search, Digit-Symbol, Simple and 4-Choice Reaction Time and Inspection Time.
c o r t e x 9 5 ( 2 0 1 7 ) 9 2e1 0 396
and 78% respectively. However, TMT-B completion timeswere
no longer associated with any brain volumes when complex
processing speed was added (with percentage attenuation in
the standard beta values of 73% and 57% for whole brain and
grey matter volumes respectively). These magnitudes were
significantly mediated when introducing complex processing
speed for whole brain volume, normal appearingwhitematter
volume and white matter hyperintensity volume (Z � 2.20,
p < .05).
3.2. Cortical thickness
TMT-B completion times were significantly associated with
mean cortical thickness (�.216, p ¼ .0001; 95% CI [�.315,
�.108]). Even after adding simple (�.184, p ¼ .003; 95% CI
[�.295, �.063]) or complex (�.181, p ¼ .010; 95% CI [�.309,
�.042]) processing speed, TMT-B completion time continued
to be associated with mean cortical thickness.
When controlling for age, gender, education and intra-
cranial volume, significant (RFT-corrected) associations were
found between TMT-B completion time and cortical thickness
Table 2 e Cognitive test score correlations with N in parenthese
1. 2.
1. TMT-B (time to complete in seconds)
2. TMT-B (total errors) .37* (411)
3. Symbol search �.52* (410) �.19* (410
4. Digit-symbol �.59* (410) �.24* (410
5. Simple reaction time .36* (411) .18* (411)
6. 4-choice reaction time .51* (411) .16** (411)
7. Inspection time �.36* (401) �.16** (401
TMT-B ¼ Trail Making Test Part B; *p < .001; **p < .005.
in five large and statistically significant (pRFT cluster < .05)
clusters with a total span of 18,122 vertices; and 2728 indi-
vidually significant vertices (pRFT vertex < .05). These spanned
lateral frontal and temporal regions, the Sylvian fissure/
insula, supramarginal and inferior parietal regions, inferior
motor and sensory areas and the isthmus of the cingulate
gyrus (all bilateral). The thinner the cortex in these regions,
the slower the older adults were to complete the TMT-B (see
Fig. 1, top). When additionally controlling for simple and then
complex processing speed, the majority of these associations
were attenuated to at least some degree. When simple pro-
cessing speed (consisting of only Simple Response Time and
Inspection Time) was included in the model, small and sta-
tistically significant clusters remained across right lateral
frontal and temporal lobe, right inferior parietal cortex, and
right inferior motor and sensory cortex, left isthmus of the
cingulate, and bilateral inferior temporal lobe with a total
span of 2483 vertices (86.30% attenuation) and 173 individually
statistically significant vertices (93.66% attenuation); associa-
tions across the left lateral surface were notably absent (Fig. 1,
middle). When complex processing speed (including all five
s.
3. 4. 5. 6.
)
) .63* (409)
�.26* (410) �.33* (410)
�.47* (410) �.52* (410) .44* (411)
) .34* (400) .35* (400) �.22* (401) �.32* (401)

Table 3 e The results obtained from linear regression models examining the relationship between brain volumetrymeasures and TMT-B completion time with and without simple and complex processing speed.
TMT-B þSimple þComplex
b p b p b p
Intracranial volume (cm3) �.024 .539 �.014 .747 .031 .543
Whole brain volume (cm3) ¡.080 .0001 ¡.059 .001 �.022* .302
Grey matter volume (cm3) ¡.139 .0001 ¡.099 .002 �.060 .107
NAWM volume (cm3) ¡.075 .003 �.030 .283 .039* .218
WMH volume (cm3) .132 .010 .029 .611 �.064* .326
b ¼ standardised regression coefficient; NAWM ¼ normal-appearing white matter; WMH ¼ white matter hyperintensity; Simple ¼ Controlling
for Simple Reaction Time and Inspection Time; Complex ¼ Controlling for Symbol Search, Digit-Symbol, Simple and 4-Choice Reaction Time
and Inspection Time; Bold ¼ significant p-values after FDR correction based on the actual p-values produced; *standardized beta values
significantly attenuated (p < .05).
c o r t e x 9 5 ( 2 0 1 7 ) 9 2e1 0 3 97
processing speed measures) was included in the model, there
was one very small cluster with a span of 129 vertices in the
right inferior sensory cortex (99.29% attenuation), and no
individually significant vertices (100% attenuation; Fig. 1,
bottom); see Supplementary Material for the proportion of the
association between cortical thickness and TMT-B completion
time accounted for by complex processing speed. This sug-
gests that a general measure of processing speed accounts for
most of the associations between TMT-B completion time and
cortical thickness, but that selective, mainly right-sided, re-
gions still exhibit TMT-B completion timeethickness associ-
ations when accounting for only simple processing speed.
3.3. White matter microstructure
Table 4 shows the means and standard deviations for tract-
averaged FA and MD for the 12 white matter tracts. Again,
the VIF for each of our linear regression models was below 2.
The standardised betas and p-values for the linear regres-
sion analyses involving the FA and MD white matter integrity
measures are presented in Table 5. In terms of FA values,
TMT-B completion times were significantly associated with
the integrity of the right uncinate (�.177; 95% CI [-.272,�.070]).
When simple processing speed was added to themodel, TMT-
B completion time remained associated with the integrity of
the right uncinate (�.184; 95% CI [�.294, �.066]) but not when
complex processing speed was added to the model (with a
percentage change in the standardised beta value of 11%).
However, no magnitudes were significantly mediated by pro-
cessing speed (p > .05).
In terms of MD values, TMT-B was significantly associated
with the integrity of the left ATR (.160; 95% CI [.062, .247]).
However, when adding simple processing speed and complex
processing speed to the model, TMT-B was no longer associ-
ated with the white matter microstructure of the left ATR
(percentage attenuation of standardised b of 17% and 43%
respectively). However, these magnitudes for the left arcuate
were not significantly mediated by processing speed.
1 Caution should be taken when considering the corticalthickness/cognition association between the insula and TMT-Bperformance found prior to controlling for processing speed.Cortical thickness estimates of the insula tend not to be veryprecise using automated cortical thickness pipelines, in part dueto a high level of insular gyrification.
4. Discussion
In this study, we have examined the relationships between
TMT-B completion time and brain volumetry measures,
cortical thickness and white matter microstructure in a group
of 411 similar-aged healthy older adults. Differences in TMT-B
completion time were significantly associated with a range of
volumetric, water diffusion and cortical thickness parameters
in this large older sample. Importantly, we demonstrated that
these associations between a test traditionally thought to tap
executive function and various brain MRI biomarkers were
largely reduced when processing speed was entered into the
model, which supports prior suggestions that TMT-B is highly
dependent upon speed in our healthy, community dwelling
sample of older adults (Oosterman et al., 2010; Salthouse,
2011a, 2011b; Salthouse et al., 2000; S�anchez-Cubillo et al.,
2009).
Slower TMT-B completion times were associated with
smaller whole brain, greymatter and normal-appearing white
matter volumes as well as larger white matter hyperintensity
volumes; however, these relationships were no longer signif-
icant when complex processing speed was entered into the
models. In terms of cortical thickness, slower TMT-B
completion times were associated with thinner cortex in the
frontal and temporal regions, the Sylvian fissure/insula,1 and
the inferior parietal lobe. When simple processing speed was
entered into the model, smaller, significant clusters in similar
regions were found but these were no longer significant when
complex processing speed was entered into the model (only a
very small cluster in the right post-central gyrus was signifi-
cant). Finally, in terms of white matter microstructure,
ostensibly ‘healthier’ integrity in the right uncinate (FA) and
left ATR (MD) were associated with faster TMT-B completion
times; however, entering simple (in the case of the left ATR) or
complex (in the case of the right uncinate and left ATR) pro-
cessing speed into themodels resulted in the removal of these
relationships.
When we examined whether these relationships are
significantly attenuated by the inclusion of processing speed,
only the relationships between TMT-B completion time and
certain brain volumetry measures (i.e., whole brain, normal
appearing white matter and white matter hyperintensity
volumes) were significantly reduced by the inclusion of

Fig. 1 e Associations (t-maps [left] and p-maps [right]) between cortical thickness and Trail Making B completion time
corrected for age, education, sex and intracranial volume (Top), age, education, sex, intracranial volume and a latent
processing speed factor including inspection time and simple reaction time only (Middle), and additionally corrected for a
latent factor of processing speed including all five processing speed measures (Bottom). Cluster p-values show regions of
connected vertices with p-values below .001 in clusters whose extent is significant at p < .05 (http://www.math.mcgill.ca.
keith/surfstat), i.e., a collection of connected vertices with p < .001 that was unlikely to occur by chance. Vertex p-values
show individual vertices where individual t scores are above the vertex-wise RFT critical t-value, i.e., statistically significant
(pRFT < .05), which is derived via the expected Euler characteristic (EC ≈ critical p-value [.05]) and number of resolution
elements (“resels”) in the t cortical map (Brett et al., 2004; Worsley et al., 1992).
c o r t e x 9 5 ( 2 0 1 7 ) 9 2e1 0 398
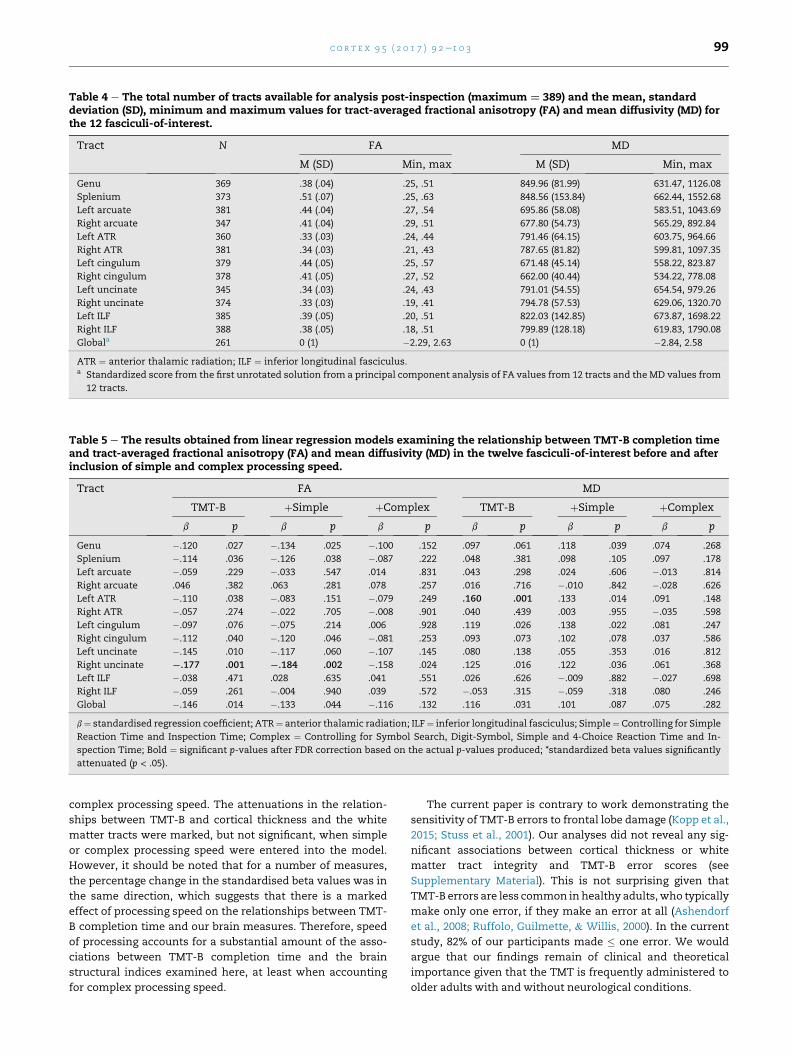
Table 4 e The total number of tracts available for analysis post-inspection (maximum ¼ 389) and the mean, standarddeviation (SD), minimum and maximum values for tract-averaged fractional anisotropy (FA) and mean diffusivity (MD) forthe 12 fasciculi-of-interest.
Tract N FA MD
M (SD) Min, max M (SD) Min, max
Genu 369 .38 (.04) .25, .51 849.96 (81.99) 631.47, 1126.08
Splenium 373 .51 (.07) .25, .63 848.56 (153.84) 662.44, 1552.68
Left arcuate 381 .44 (.04) .27, .54 695.86 (58.08) 583.51, 1043.69
Right arcuate 347 .41 (.04) .29, .51 677.80 (54.73) 565.29, 892.84
Left ATR 360 .33 (.03) .24, .44 791.46 (64.15) 603.75, 964.66
Right ATR 381 .34 (.03) .21, .43 787.65 (81.82) 599.81, 1097.35
Left cingulum 379 .44 (.05) .25, .57 671.48 (45.14) 558.22, 823.87
Right cingulum 378 .41 (.05) .27, .52 662.00 (40.44) 534.22, 778.08
Left uncinate 345 .34 (.03) .24, .43 791.01 (54.55) 654.54, 979.26
Right uncinate 374 .33 (.03) .19, .41 794.78 (57.53) 629.06, 1320.70
Left ILF 385 .39 (.05) .20, .51 822.03 (142.85) 673.87, 1698.22
Right ILF 388 .38 (.05) .18, .51 799.89 (128.18) 619.83, 1790.08
Globala 261 0 (1) �2.29, 2.63 0 (1) �2.84, 2.58
ATR ¼ anterior thalamic radiation; ILF ¼ inferior longitudinal fasciculus.a Standardized score from the first unrotated solution from a principal component analysis of FA values from 12 tracts and the MD values from
12 tracts.
Table 5 e The results obtained from linear regression models examining the relationship between TMT-B completion timeand tract-averaged fractional anisotropy (FA) and mean diffusivity (MD) in the twelve fasciculi-of-interest before and afterinclusion of simple and complex processing speed.
Tract FA MD
TMT-B þSimple þComplex TMT-B þSimple þComplex
b p b p b p b p b p b p
Genu �.120 .027 �.134 .025 �.100 .152 .097 .061 .118 .039 .074 .268
Splenium �.114 .036 �.126 .038 �.087 .222 .048 .381 .098 .105 .097 .178
Left arcuate �.059 .229 �.033 .547 .014 .831 .043 .298 .024 .606 �.013 .814
Right arcuate .046 .382 .063 .281 .078 .257 .016 .716 �.010 .842 �.028 .626
Left ATR �.110 .038 �.083 .151 �.079 .249 .160 .001 .133 .014 .091 .148
Right ATR �.057 .274 �.022 .705 �.008 .901 .040 .439 .003 .955 �.035 .598
Left cingulum �.097 .076 �.075 .214 .006 .928 .119 .026 .138 .022 .081 .247
Right cingulum �.112 .040 �.120 .046 �.081 .253 .093 .073 .102 .078 .037 .586
Left uncinate �.145 .010 �.117 .060 �.107 .145 .080 .138 .055 .353 .016 .812
Right uncinate ¡.177 .001 ¡.184 .002 �.158 .024 .125 .016 .122 .036 .061 .368
Left ILF �.038 .471 .028 .635 .041 .551 .026 .626 �.009 .882 �.027 .698
Right ILF �.059 .261 �.004 .940 .039 .572 �.053 .315 �.059 .318 .080 .246
Global �.146 .014 �.133 .044 �.116 .132 .116 .031 .101 .087 .075 .282
b¼ standardised regression coefficient; ATR¼ anterior thalamic radiation; ILF¼ inferior longitudinal fasciculus; Simple¼Controlling for Simple
Reaction Time and Inspection Time; Complex ¼ Controlling for Symbol Search, Digit-Symbol, Simple and 4-Choice Reaction Time and In-
spection Time; Bold ¼ significant p-values after FDR correction based on the actual p-values produced; *standardized beta values significantly
attenuated (p < .05).
c o r t e x 9 5 ( 2 0 1 7 ) 9 2e1 0 3 99
complex processing speed. The attenuations in the relation-
ships between TMT-B and cortical thickness and the white
matter tracts were marked, but not significant, when simple
or complex processing speed were entered into the model.
However, it should be noted that for a number of measures,
the percentage change in the standardised beta values was in
the same direction, which suggests that there is a marked
effect of processing speed on the relationships between TMT-
B completion time and our brain measures. Therefore, speed
of processing accounts for a substantial amount of the asso-
ciations between TMT-B completion time and the brain
structural indices examined here, at least when accounting
for complex processing speed.
The current paper is contrary to work demonstrating the
sensitivity of TMT-B errors to frontal lobe damage (Kopp et al.,
2015; Stuss et al., 2001). Our analyses did not reveal any sig-
nificant associations between cortical thickness or white
matter tract integrity and TMT-B error scores (see
Supplementary Material). This is not surprising given that
TMT-B errors are less common in healthy adults,who typically
make only one error, if they make an error at all (Ashendorf
et al., 2008; Ruffolo, Guilmette, & Willis, 2000). In the current
study, 82% of our participants made � one error. We would
argue that our findings remain of clinical and theoretical
importance given that the TMT is frequently administered to
older adults with and without neurological conditions.

c o r t e x 9 5 ( 2 0 1 7 ) 9 2e1 0 3100
Recent research has demonstrated the importance of the
medial orbital frontal cortex and rostral anterior cingulate in
TMT-B completion times, but not processing speed (Nestor
et al., 2015; Ohtani et al., 2017). However, processing speed
was based either on TMT-A (Ohtani et al., 2017) or the com-
bination of the Digit Symbol-Coding and Symbol Search sub-
tests of the WAIS (Nestor et al., 2015). Importantly, our study
controlled for different types of processing speed using five
processing speed tests involving three levels of description:
psychometric behavioural, cognitive experimental and psy-
chophysical measures of processing speed (Deary et al., 2007).
The above analyses demonstrated that TMT-B completion
time significantly correlated with all five processing speed
measures (correlation coefficients ranging between .36 and
.59) and all five measures significantly correlated with one
another. However, it may be that some of these processing
speed tasks involve decision-making processes more similar
to executive abilities (e.g., Symbol Search, Digit-Symbol, and
4-Choice Reaction Time), and similar to those specifically
required for TMT-B. For this reason, we controlled for simple
(i.e., Simple Reaction Time and Inspection Time) as well as
complex (i.e., all five measures) processing speed in our ana-
lyses. As the correlation coefficients for the three complex
processing speed measures did not significant differ from one
another (p � .10) but they were significantly higher than the
correlation coefficients for Simple Reaction Time and In-
spection Time (p < .008), it could be argued that our “simple”
processing speed measure (which did not comprise sufficient
manifest variables to employ data reduction) merely provided
a weaker index of the component score using all 5 measures.
However, even controlling for simple processing speed using
these tests with weaker correlations resulted in attenuations
in some of our brainecognition relationships.
While we used an appropriate control for type I error, the
significant relationship between TMT-B completion time and
a small cluster in the right inferior somatosensory cortex
(after controlling for complex processing speed) should be
interpreted with caution, particularly given that it contained
no individually significant vertices. Another explanation may
be that our older adults were articulating their responses
while performing TMT-B, as the inferior somatosensory re-
gion, together with the inferior sensorimotor cortex, are
typically activated during orofacial speech movements
(Grabski et al., 2012). However, it is surprising that this asso-
ciation is lateralized to the right rather than the left hemi-
sphere. Activation in the right primary somatosensory cortex
has been reported in a functional near-infrared spectroscopy
study involving the TMT; however greater activation was
associated with slower rather than faster TMT completion
times in older adults (Hagen et al., 2014). While it is unlikely
that the inferior somatosensory region is associated with the
executive aspects of TMT-B, articulation may be a small
component of TMT-B completion time that is not measured in
processing speed measures; it remains unclear what the role
of the somatosensory region is in TMT-B completion time.
We note that our detailed analysis of tract-specific micro-
structure with respect to TMT-B completion time did not
include estimates of the entire superior longitudinal fascic-
ulus (SLF). It has previously been suggested that this large fibre
bundle may be involved in TMT-B performance (Muir et al.,
2015; Perry et al., 2009). However, our tractography method
allowed us to only focus on the arcuate portion of this
pathway. The arcuate connects the superior temporal lobe
and the dorsolateral prefrontal cortex. While both are cortical
areas implicated in TMT-B performance, the current data do
not allow us to comment on the relative importance of other
constituents of the SLF.
In addition to the limitations discussed above, several
other aspects of our study should be noted. TMT-A was not
administered as part of the LBC1936 protocol and so TMT ratio
or proportion scores, which have been discussed as purer
executive measures (e.g., Stuss et al., 2001) could not be
considered. Also, while there was no self-report of dementia,
we cannot conclude that our sample did not include any
participants with mild cognitive impairment who might be in
the early stages of dementia. Moreover, while the LBC1936
affords access to a large group of healthy older adults, they are
a self-selecting group and probably characterise a somewhat
restricted sample (e.g., Johnson, Brett, Calvin, & Deary, 2016)
and so caution should be takenwhen relating these findings to
the younger andwider older adult population. However, this is
also likely to mean that we have smaller-than-expected effect
sizes than those we would have found had we a wider distri-
bution. Finally, it should be noted that the findings cannot be
directly related to older adults experiencing pathological aging
due to neurodegenerative diseases such as Alzheimer's dis-
ease. For example, our measure of WMH volumes included
both deep and periventricular WMH (because they are very
highly correlated in healthy samples), yet WMH location may
be less collinear in cognitively impaired samples (Smith et al.,
2011), allowing investigation of their differential contributions
to TMT-B performance.
Nevertheless, our study strengths include the large sample
size and the age homogeneity (which largely reduces the
important confounding effect of age). Large birth cohorts
provide the opportunity to examine neural correlates with
increased statistical power to avoid type II error (false nega-
tive) and accurately detect relationships with less need to
statistically control for age (Freedman, Pisani, & Purves, 2007).
Another strength is our comprehensive multi-modal analysis
that allowed us to examine both grey and white matter
structure in relation to TMT-B completion time within the
same group. We were also able to address important previous
criticisms of the TMT-A as an appropriate covariate for pro-
cessing speed, using a wider battery of processing speed tests
and appropriate data reduction techniques. We tentatively
highlight the biologically plausible relationship between
poorer TMT-B completion times and thinner cortex in the
right frontal and lateral temporal lobe as well as the white
matter microstructure of the right uncinate fasciculus, the
white matter tract connecting these two brain regions. This
finding may warrant future study. On the basis of these cur-
rent data, we can conclude that the grey and white matter
correlates of the TMT-B score appear to be highly related to
individual differences in processing speed. Regardless, the
TMT-B remains an important clinical tool in the diagnoses of
different clinical groups, as well as the assessment of disease
severity and progression.

c o r t e x 9 5 ( 2 0 1 7 ) 9 2e1 0 3 101
Acknowledgements
We thank the LBC1936 members who took part in this study,
radiographers at the Brain Research Imaging Centre, and
LBC1936 research associates who collected and entered the
cognitive data used in this manuscript. This research and
LBC1936 phenotype collection were supported by Research
into Ageing and continues as part of The Disconnected Mind
project (http://www.disconnectedmind.ed.ac.uk), funded by
Age UK, with additional funding from the UK Medical
Research Council under grant numbers G0701120, G1001245
and MR/M013111/1. MRI acquisition and analyses were con-
ducted at the Brain Research Imaging Centre, Neuroimaging
Sciences, University of Edinburgh (www.bric.ed.ac.uk) which
is part of SINAPSE (Scottish Imaging NetworkdA Platform for
Scientific Excellence) collaboration (www.sinapse.ac.uk) fun-
ded by the Scottish Funding Council and the Chief Scientist
Office. This work was undertaken within The University of
Edinburgh Centre for Cognitive Ageing and Cognitive Epide-
miology (www.ccace.ed.ac.uk), part of the cross council Life-
long Health and Wellbeing Initiative (MR/K026992/1), for
which funding from the BBSRC and MRC is gratefully
acknowledged. The cortical thickness analysis was funded by
a Scottish Funding Council PECRE grant to SINAPSE (DAD).
Supplementary data
Supplementary data related to this article can be found at
http://dx.doi.org/10.1016/j.cortex.2017.07.021.
r e f e r e n c e s
Ad-Dab'bagh, Y., Lyttelton, O., Muehlboeck, J., Lepage, C.,Einarson, D., Mok, K., et al. (2006). The civet image-processingenvironment: A fully automated comprehensive pipeline foranatomical neuroimaging research. In Proceedings of the 12thannual meeting of the organization for human brain mapping.Florence, Italy (p. S45).
Arbuthnott, K., & Frank, J. (2000). Trail making test, part B as ameasure of executive control: Validation using a set-switchingparadigm. Journal of Clinical and Experimental Neuropsychology,22(4), 518e528.
Ashendorf, L., Jefferson, A. L., O'Connor, M. K., Chaisson, C.,Green, R. C., & Stern, R. A. (2008). Trail making test errors innormal aging, mild cognitive impairment, and dementia.Archives of Clinical Neuropsychology, 23, 129e137.
Benjamini, Y., & Hochberg, Y. (1995). Controlling the falsediscovery rate: A practical and powerful approach to multipletesting. Journal of the Royal Statistical Society. Series B(Methodological), 57(1), 289e300.
Bowie, C. R., & Harvey, P. D. (2006). Administration andinterpretation of the trail making test. Nature Protocols, 1,2277e2281.
Brett, M., Penny, W. D., & Kiebel, S. J. (2004). Introduction torandom field theory. In R. S. J. Frackowiak, K. J. Friston,C. Frith, R. Dolan, C. J. Price, S. Zeki, et al. (Eds.), Human brainfunction (pp. 867e879). Amsterdam: Elsevier Academic Press.
Chan, E., Shallice, T., MacPherson, S. E., Robinson, G., Lecce, F.,Turner, M., et al. (2015). Limitations of the trail making test
Part-B in assessing frontal executive dysfunction. Journal of theInternational Neuropsychological Society, 21(2), 169e174.
Clayden, J. D., Mu~noz Maniega, S., Storkey, A. J., King, M. D.,Bastin, M. E., & Clark, C. A. (2011). TractoR: Magneticresonance imaging and tractography with R. Journal ofStatistical Software, 44(8), 1e18.
Corley, J., Jia, X., Kyle, J. A., Gow, A. J., Brett, C. E., Starr, J. M., et al.(2010). Caffeine consumption and cognitive function at age 70:The Lothian birth cohort 1936 study. Psychosomatic Medicine,72(2), 206e214.
Cox, B. D., Huppert, F. A., & Whichelow, M. J. (1993). The health andlifestyle survey: Seven years on. Aldershot, UK: Dartmouth.
Cox, S. R., Ritchie, S. J., Tucker-Drob, E. M., Liewald, D. C.,Hagenaars, S. P., Davies, G., et al. (2016). Ageing and brainwhite matter structure in 3,513 UK Biobank participants.Nature Communications, 7, 13629.
Davidson, P. S. R., Gao, F. Q., Mason, W. P., Winocur, G., &Anderson, N. D. (2008). Verbal fluency, trail making, andWisconsin card sorting test performance following rightfrontal lobe tumor resection. Journal of Clinical and ExperimentalNeuropsychology, 30(1), 18e32.
Deary, I. J. (2000). Looking down on human Intelligence: Frompsychometrics to the brain. Oxford: Oxford University Press.
Deary, I. J., Gow, A. J., Pattie, A., & Starr, J. M. (2012). Cohort profile:The Lothian birth cohorts of 1921 and 1936. International Journalof Epidemiology, 41, 1576e1584.
Deary, I. J., Gow, A. J., Taylor, M. D., Corley, J., Brett, C., Wilson, V.,et al. (2007). The Lothian birth cohort 1936: A study to examineinfluences on cognitive ageing from age 11 to age 70 andbeyond. BMC Geriatrics, 7, 28.
Deary, I. J., Johnson, W., & Starr, J. M. (2010). Are processing speedtasks biomarkers of cognitive ageing? Psychology and Aging, 25,219e228.
Deary, I. J., Simonotto, E., Meyer, M., Marshall, A., Marshall, I.,Goddard, N., et al. (2004). The functional anatomy ofinspection time: An event-related fMRI study. NeuroImage, 22,1466e1479.
DeCarli, C., Fletcher, E., Ramey, V., Harvey, D., & Jagust, W. J.(2005). Anatomical mapping of white matter hyperintensities(WMH): Exploring the relationships between periventricularWMH, deep WMH, and total WMH burden. Stroke, 36, 50e55.
Delis, D. C., Kaplan, E., & Kramer, J. H. (2001). Delis-kaplan executivefunction system (D-KEFS). San Antonio, TX: The PsychologicalCorporation.
Demakis, G. J. (2004). Frontal lobe damage and tests of executiveprocessing: A meta-analysis of the category test, stroop test,and trail-making test. Journal of Clinical and ExperimentalNeuropsychology, 26(3), 441e450.
Drane, D. L., Yuspeh, R. L., Huthwaite, J. S., & Klingler, L. K. (2002).Demographic characteristics and normative observations forderived-trail making test indices. Neuropsychiatry,Neuropsychology, and Behavioral Neurology, 15(1), 39e43.
Ducharme, S., Albaugh, M. D., Nguyen, T. V., Hudziak, J. J.,Mateos-P�erez, J. M., Labbe, A., et al., Brain DevelopmentCooperative Group. (2016). Trajectories of cortical thicknessmaturation in normal brain development e the importance ofquality control procedures. NeuroImage, 125, 267e279.
Folstein, M. F., Folstein, S. E., & McHugh, P. R. (1975). “Mini-mentalstate”: A practical method for grading the cognitive state ofpatients for the clinician. Journal of Psychiatric Research, 12,189e198.
Freedman, D., Pisani, R., & Purves, R. (2007). Statistics. New York:WW Norton.
Giovagnoli, A. R., Del Pesce, M., Mascheroni, S., Simoncelli, M.,Laiacona, M., & Capitani, E. (1996). Trail making test:Normative values from 287 normal adult controls. ItalianJournal of Neurological Sciences, 17, 305e309.

c o r t e x 9 5 ( 2 0 1 7 ) 9 2e1 0 3102
Gl€ascher, J., Adolphs, R., Damasio, H., Bechara, A., Rudrauf, D.,Calamia, M., et al. (2012). Lesion mapping of cognitive controland value-based decision making in the prefrontal cortex.Proceedings of the National Academy of Sciences of the United Statesof America, 109(36), 14681e14686.
Grabski, K., Lamalle, L., Vilain, C., Schwartz, J. L., Vall�ee, N.,Tropres, I., et al. (2012). Functional MRI assessment oforofacial articulators: Neural correlates of lip, jaw, larynx, andtongue movements. Human Brain Mapping, 33, 2306e2321.
Hagen, K., Ehlis, A. C., Haeussinger, F. B., Heinzel, S., Dresler, T.,Mueller, L. D., et al. (2014). Activation during the trail makingtest measured with functional near-infrared spectroscopy inhealthy elderly subjects. NeuroImage, 85, 583e591.
Hamdan, A. C., & Hamdan, E. L. R. (2009). Effects of age andeducation level on the trail making test in a healthy Braziliansample. Psychology and Neuroscience, 2(2), 199e203.
Hashimoto, R., Meguro, K., Lee, E., Kasai, M., Ishii, H., &Yamaguchi, S. (2006). Effect of age and education on the trailmaking test and determination of normative data for Japaneseelderly people: The Tajiri project. Psychiatry and ClinicalNeurosciences, 60, 422e428.
Hester, R. L., Kinsella, G. J., Ong, B., & McGregor, J. (2005).Demographic influences on baseline and derived scores fromthe trail making test in healthy older Australian adults. TheClinical Neuropsychologist, 19(1), 45e54.
Johnson, W., Brett, C. E., Calvin, C., & Deary, I. J. (2016). Childhoodcharacteristics and participation in Scottish mental survey1947 6-day sample follow-ups: Implications for participationin aging studies. Intelligence, 54, 70e79.
Karama, S., Ad-Dab'bagh, Y., Haier, R., Deary, I. J., Lyttelton, O. C.,Lepage, C., et al., Brain Development Cooperative Group.(2009). Positive association between cognitive ability andcortical thickness in a representative US sample of healthy 6to 18 year-olds. Intelligence, 37, 145e155.
Karama, S., Ducharme, S., Corley, J., Chouinard-Decorte, F.,Starr, J. M., Wardlaw, J. M., et al. (2015). Cigarette smoking andthinning of the brain's cortex. Molecular Psychiatry, 20,778e785.
Koch, K., Wagner, G., Schachtzabel, C., Schultz, C. C., Gullmar, D.,Reichenbach, J. R., et al. (2013). Age-dependent visuomotorperformance and white matter structure: A DTI study. BrainStructure and Function, 218(5), 1075e1084.
Kopp, B., R€osser, N., Tabeling, S., Sturenburg, H. J., de Haan, B.,Karnath, H. O., et al. (2015). Errors on the trail making test areassociated with right hemispheric frontal lobe damage instroke patients. Behavioural Neurology, 309235.
Kortte, K. B., Horner, M. D., & Windham, W. K. (2002). The trailmaking test, part B: Cognitive flexibility or ability to maintainset? Applied Neuropsychology, 9(2), 106e109.
Lezak, M. D. (1995). Neuropsychological assessment. New York:Oxford University Press.
Luciano, M., Gow, A. J., Harris, S. E., Hayward, C., Allerhand, M.,Starr, J. M., et al. (2009). Cognitive ability at age 11 and 70 years,information processing speed, and APOE variation: TheLothian birth cohort 1936 study. Psychology and Aging, 24(1),129e138.
Moll, J., de Oliveira-Souza, R., Moll, F. T., Bramati, I. E., &Andreiuolo, P. A. (2002). The cerebral correlates of set-shifting:An fMRI study of the trail making test. Arquivos de Neuro-psiquiatria, 60(4), 900e905.
Muir, R. T., Lam, B., Honjo, K., Harry, R. D., McNeely, A. A.,Gao, F. Q., et al. (2015). Trail making test elucidates neuralsubstrates of specific poststroke executive dysfunctions.Stroke, 46(10), 2755e2761.
Mu~noz Maniega, S. M., Vald�es Hern�andez, M. C., Clayden, J. D.,Royle, N. A., Murray, C., Morris, Z., et al. (2015). White matterhyperintensities and normal-appearing white matter integrityin the aging brain. Neurobiology of Aging, 36(2), 909e918.
Nestor, P. G., Nakamura, M., Niznikiewicz, M., Levitt, J. J.,Newell, D. T., Shenton, M. E., et al. (2015). Attentional controland intelligence: MRI orbital frontal gray matter andneuropsychological correlates. Behavioural Neurology, 354186.
Newman, L. M., Trivedi, M. A., Bendlin, B. B., Ries, M. L., &Johnson, S. C. (2007). The relationship between gray mattermorphometry and neuropsychological performance in a largesample of cognitively healthy adults. Brain Imaging andBehavior, 1(1e2), 3e10.
Ohtani, T., Nestor, P. G., Bouix, S., Newell, D., Melonakos, E. D.,McCarley, R. W., et al. (2017). Exploring the neural substratesof attentional control and human intelligence: Diffusiontensor imaging of prefrontal white matter tractography inhealthy cognition. Neuroscience, 341, 52e60.
Oosterman, J. M., Vogels, R. L. C., van Harten, B., Gouw, A. A.,Poggesi, A., Scheltens, P., et al. (2010). Assessing mentalflexibility: Neuroanatomical and neuropsychologicalcorrelates of the trail making test in elderly people. The ClinicalNeuropsychologist, 24(2), 203e219.
Pa, J., Possin, K. L., Wilson, S. M., Quitania, L. C., Kramer, J. H.,Boxer, A. L., et al. (2010). Gray matter correlates of set-shiftingamong neurodegenerative disease, mild cognitiveimpairment, and healthy older adults. Journal of theInternational Neuropsychological Society, 16(4), 640e650.
Peri�a~nez, J. A., Rıos-Lago, M., Rodrıguez-S�anchez, J. M., Adrover-Roig, D., S�anchez-Cubillo, I., Crespo-Facorro, B., et al. (2007).Trail making test in traumatic brain injury, schizophrenia,and normal ageing: Sample comparisons and normative data.Archives of Clinical Neuropsychology, 22(4), 433e447.
Perry, M. E., McDonald, C. R., Hagler, D. J., Jr., Gharapetian, L.,Kuperman, J. M., Koyama, A. K., et al. (2009). White mattertracts associated with set-shifting in healthy aging.Neuropsychologia, 47, 2835e2842.
Rasmusson, D. X., Zonderman, A. B., Kawas, C., & Resnick, S. M.(1998). Effects of age and dementia on the trail making test.The Clinical Neuropsychologist, 12(2), 169e178.
Reitan, R., & Wolfson, D. (1993). The Halstead-Reitanneuropsychological test battery: Theory and clinical interpretation.Tucson, AZ: Neuropsychology Press.
Reitan, R. M., & Wolfson, D. (1995). The category test and the trailmaking test as measures of frontal lobe functions. The ClinicalNeuropsychologist, 9, 50e56.
Ruffolo, L. F., Guilmette, T. J., & Willis, W. G. (2000). Comparison oftime and error rates on the trail making test among patientswith head injuries, experimental malingerers, patients withsuspect effort on testing, and normal controls. The ClinicalNeuropsychologist, 14, 223e230.
Ruscheweyh, R., Deppe, M., Lohmann, H., Wersching, H.,Korsukewitz, C., Duning, T., et al. (2013). Executiveperformance is related to regional gray matter volume inhealthy older individuals. Human Brain Mapping, 34(12),3333e3346.
Salthouse, T. A. (2011a). What cognitive abilities are involved intrail-making performance? Intelligence, 39(4), 222e232.
Salthouse, T. A. (2011b). Cognitive correlates of cross-sectionaldifferences and longitudinal changes in trail makingperformance. Journal of Clinical and ExperimentalNeuropsychology, 33(2), 242e248.
Salthouse, T. A., Toth, J., Daniels, K., Parks, C., Pak, R.,Wolbrette, M., et al. (2000). Effects of aging on the efficiency oftask switching in a variant of the trail making test.Neuropsychology, 14, 102e111.
S�anchez-Cubillo, I., Peri�a~nez, J. A., Adrover-Roig, D., Rodrıguez-S�anchez, J. M., Rıos-Lago, M., Tirapu, J., et al. (2009). Constructvalidity of the trail making test: Role of task-switching,working memory, inhibition/interference control, andvisuomotor abilities. Journal of the InternationalNeuropsychological Society, 15(3), 438e450.

c o r t e x 9 5 ( 2 0 1 7 ) 9 2e1 0 3 103
Seo, E. H., Lee, D. Y., Kim, K. W., Lee, J. H., Jhoo, J. H., Youn, J. C.,et al. (2006). A normative study of the trail making test inKorean elders. International Journal of Geriatric Psychiatry, 21(9),844e852.
Smith, E. E., Salat, D. H., Jeng, J., McCreary, C. R., Fischl, B.,Schmahmann, J. D., et al. (2011). Correlations between MRIwhite matter lesion location and executive function andepisodic memory. Neurology, 76(17), 1492e1499.
Snaith, R. P. (2003). The hospital anxiety and depression scale.Health and Quality of Life Outcomes, 1, 29.
Strauss, E., Sherman, E. M. S., & Spreen, O. (2006). A compendium ofneuropsychological tests: Administration, norms, and commentary(3rd ed.). New York: Oxford University Press.
Stuss, D. T., Bisschop, S. M., Alexander, M. P., Levine, B., Katz, D.,& Izukawa, D. (2001). The trail making test: A study in focallesion patients. Psychological Assessment, 13(2), 230e239.
Tamez, E., Myerson, J., Morris, L., White, D. A., Baum, C., &Connor, L. T. (2011). Assessing executive abilities followingacute stroke with the trail making test and digit span.Behavioural Neurology, 24, 177e185.
Vald�es Hern�andez, M. C., Ferguson, K. J., Chappell, F. M., &Wardlaw, J. M. (2010). New multispectral MRI data fusiontechnique for white matter lesion segmentation: Method andcomparison with thresholding in FLAIR images. EuropeanRadiology, 20, 1684e1691.
Wardlaw, J. M., Bastin, M. E., Vald�es Hern�andez, M. C., MunozManiega, S., Royle, N. A., Morris, Z., et al. (2011). Brain aging,
cognition in youth and old age and vascular disease in theLothian Birth Cohort 1936: Rationale, design and methodologyof the imagingprotocol. International Journal of Stroke, 6, 547e559.
Wardlaw, J. M., Smith, E. E., Biessels, G. J., Cordonnier, C.,Fazekas, F., Frayne, R., et al. (2013). Neuroimaging standardsfor research into small vessel disease and its contribution toageing and neuro-degeneration. Lancet Neurology, 12, 822e838.
Wardlaw, J. M., Vald�es Hern�andez, M. C., & Mu~noz-Maniega, S.(2015). What are white matter hyperintensities made of?Relevance to vascular cognitive impairment. Journal of theAmerican Heart Association, 4, e001140.
Wechsler, D. (1997). WAIS-III UK administration and scoring manual.London, UK: Psychological Corporation.
Worsley, K. J., Evans, A. C., Marrett, S., & Neelin, P. (1992). A three-dimensional statistical analysis for cbf activation studies inhuman brain. Journal of Cerebral Blood Flow and Metabolism, 12,900e918.
Yochim, B., Baldo, J., Nelson, A., & Delis, D. C. (2007). D-KEFS trailmaking test performance in patients with lateral prefrontalcortex lesions. Journal of the International NeuropsychologicalSociety, 13(4), 704e709.
Zakzanis, K. K., Mraz, R., & Graham, S. J. (2005). An fMRI study ofthe trail making test. Neuropsychologia, 43(13), 1878e1886.
Zijdenbos, A. P., Forghani, R., & Evans, A. C. (2002). Automatic“pipeline” analysis of 3-D MRI data for clinical trials:Application to multiple sclerosis. IEEE Transactions on MedicalImaging, 21, 1280e1291.
Related Documents