ANNUAL REPORT PRESENTED BY THE CASTER FAMILY CENTER FOR NONPROFIT AND PHILANTHROPIC RESEARCH UNIVERSITY OF SAN DIEGO JUNE 2013 2013

Welcome message from author
This document is posted to help you gain knowledge. Please leave a comment to let me know what you think about it! Share it to your friends and learn new things together.
Transcript
ANNUAL REPOR T
P R E S E N T E D B Y T H E C A S T E R F A M I L Y C E N T E R F O R N O N P R O F I T A N D P H I L A N T H R O P I C R E S E A R C HU N I V E R S I T Y O F S A N D I E G OJ U N E 2013
2013

AuthorsL AU R A D E I T R I C K
Ph.D., Director
TAY LO R P E Y TO N R O B E R T S
M.S., Research Associate
J E N N I F E R A . J O N E S
M.A., Research Assistant
S V E T L A N A K R A S Y N S K A
M.A., Research Assistant
E L A I N E L E W I S
M.A., Research Assistant
S U E C A R T E R K A H L
M.S.W., Research Consultant
PAT L I B BY
M.S., Clinical Professor
Copyright ©2013
Caster Family Center for Nonpro!t and
Philanthropic Research
University of San Diego
School of Leadership and Education Sciences
All Rights Reserved
www.sandiego.edu/npresearch

3
STATE OF NONPROFITS A
NN
UA
L REPO
RT
Acknowledgements The State of Nonpro!ts Quarterly Index is made possible through the collaboration of more than 125 nonpro!t
organizations that serve as Trend Reporters. We are indebted to them for their willingness to share both the insights
of their Chief Executive O"cers and key data from their organizations.
This report and the State of Nonpro!ts Quarterly Index were made possible through the generous support of:
2-1-1 San Diego Advancing Students Forward (formerly Augustinian Scholarship Fund)All for God Catholic Youth (Totus Pro Deo)American Academy of Pediatrics, CA Chapter 3Amor MinistriesAVID CenterBalboa Park Cultural PartnershipBIOCOM InstituteBoy Scouts of AmericaCalifornia Center for Sustainable EnergyCambridge SchoolCasa de AmparoCatholic Answers, Inc.Catholic CharitiesCenter for Community SolutionsChicano Federation of San Diego County, Inc.Christian Community TheaterChristian Unified Schools of San DiegoCity Heights Community Development CorporationCommunity HousingworksCommunity Interface ServicesConsumer Advocates for RCFE ReformCygnet Theatre CompanyDevelopmental Services Continuum, Inc.Dreams for ChangeEducational Enrichment SystemsEmployment and Community OptionsEscondido Humane SocietyFeeding America San DiegoFloresta USA, Inc.Francis Parker SchoolFriends of the Chula Vista Nature CenterGerson InstituteGirl Scouts San DiegoGoodwill Industries of San Diego CountyGrid AlternativesHarmonium, Inc.Home of Guiding Hands CorporationHome Start, Inc.Hospice of the North CoastI Love a Clean San Diego County, Inc.Indian Health Council
Trend ReportersInstitute for Public StrategiesJacobs & Cushman San Diego Food BankJapanese Friendship Garden Society of San DiegoJewish Family Service of San DiegoJewish Federation of San Diego CountyJust in Time for Foster YouthKids Included TogetherLa Jolla Country Day SchoolLa Jolla Historical SocietyLegal Aid Society of San DiegoMAAC ProjectMake-a-Wish Foundation San DiegoMalashock DanceMetro United Methodist Urban MinistryMingei International, Inc.Museum of Photographic ArtsNature and Culture InternationalNeighborhood HealthcareNeighborhood House AssociationNonprofit Management SolutionsNorth County Interfaith Council, Inc.North County LifelineOld GlobeOutdoor OutreachParent Institute for Quality Education, Inc.Planned Parenthood of San Diego and Riverside CountiesPlaywrights ProjectPoint Loma Nazarene UniversityProject WildlifeRancho Coastal Humane SocietyRegional Task Force on the HomelessReuben H. Fleet Science CenterSan Diego Archeology CenterSan Diego Blood BankSan Diego CoastkeeperSan Diego Council on LiteracySan Diego Dance TheaterSan Diego Hebrew HomesSan Diego Humane Society and SPCASan Diego Hunger CoalitionSan Diego Imperial Counties Developmental Services, Inc.
San Diego Museum of ArtSan Diego Museum of ManSan Diego Natural History MuseumSan Diego Opera AssociationSan Diego Theatres, Inc.San Diego Youth ServicesSan Diego Youth SymphonySan Diego Nonprofits (SANDAN)Social Advocates for Youth San Diego, Inc.South Bay Community ServicesSt. Madeleine Sophie’s CenterSt. Vincent De Paul Village, Inc.Stepping Stone San DiegoSurvivors of TortureTERI, Inc.The Aja ProjectThe Arc of San DiegoThe Boys and Girls Clubs of San DieguitoThe Elizabeth HospiceThe Larry English LEAD FoundationThe New Children’s MuseumThomas Jefferson School of LawToward Maximum IndependenceUnited Through ReadingUnited Way of San Diego CountyUNYEWAY, Inc.Urban Corps of San DiegoUrban League of San DiegoUS- Mexico Border Philanthropy PartnershipUSS Midway MuseumVista Community ClinicVista Hill FoundationVoice of San DiegoVoices for ChildrenWakeland Housing and Development CorporationWalden EnvironmentWalkSanDiegoWiLDCOASTWildlife Research InstituteWomen’s Resource CenterYMCA of San Diego CountyYoung Audiences of San DiegoYWCA of San Diego County
Sponsors

4
STAT
E OF
NON
PROF
ITS
AN
NU
AL
REP
OR
T Table of Contents
1. INTRODUC TION Key Findings
2. SPOTLIGHT ON SAN DIEGO ’S THIRD SEC TOR Measuring the Scope of the Sector
Financial Capacity and Economic Impact of the Sector
Nonpro!t Revenue Sources
Nonpro!t Employment
Grantmaking
Volunteerism
3. DATA FROM THE FIELD 2011- PRESENT The State of Nonpro!ts Quarterly Index
Findings Q2 2011 – Q1 2013
What Our Trend Reporters Have to Say
From the Desk of San Diego Nonpro!t CEOs
Economic Trends
Resulting Challenges for Nonpro!ts
Strategies for Economic Resilience
4. OBSER VATIONS AND QUESTIONS FOR THE FUTURE
5. APPENDIX
5
6
8
10
11
12
13
14
15
18
22
22
24
25
27
29

5
STATE OF NONPROFITS A
NN
UA
L REPO
RT
Introduction: Key Findings It is hard to believe, but prior to the Caster Center’s !rst publication in 2006, A Spotlight on San Diego’s Third Sector,
nobody knew how many nonpro!ts were located in San Diego County, let alone anything about their major activities,
capacity, or contributions to our larger economy. Since that time, the Caster Center team has been pushing the
boundaries of nonpro!t data collection to tell the sector’s story in a more timely, complete, and meaningful way. This
report represents a new milestone in these ongoing e#orts.
Much has transpired since the publication of the Center’s !rst report, not only in the nonpro!t sector, but also in the
lives of the 3 million San Diegans served by these organizations. Together we have weathered the most challenging
economic conditions since the Great Depression and are adapting to its myriad and lasting e#ects. And, although it
appears that the worst is behind us, our community and its organizations are forever changed as a result.
This report chronicles the economic health and well-being of San Diego’s nonpro!t sector over that time and
documents the current state of the sector as expressed by its leaders.
Major !ndings include:
Nonpro!ts are a growing component of San Diego’s Economic Engine:
People employed by nonpro!ts account for over 6% of San Diego
County’s Quarterly Wages
Nonpro!t expenses represent 7% of San Diego’s Gross Regional Product
Nonpro!ts brought over $200 million in foundation grants to the region
in 2010
Despite severe funding challenges, nonpro!t revenue, expenses, and total
assets have experienced positive growth over the last !ve years (albeit at
a much slower rate than in the years before the recession)
Nonpro!t CEOs tell us they are:
Facing continued !nancial challenges and shifting revenue sources
Adapting and creating new models for doing business
Moderately con!dent in the overall economic health of the sector
Planning to hire new sta" in the coming year
The sector still faces challenges including:
Fewer private grantmaking dollars available here than in other cities
The instability of California’s state budget and other economic uncertainties
An overreliance on volunteers without su#cient mechanisms for their oversight and risk mitigation
The need for nonpro!ts to be educated about how they can be more fully engaged in policy-making that a"ects
their organizations and the individuals they serve
This report summarizes the state of the sector at this particular moment in time. It identi!es current trends and
raises important questions about how we as a community can consider ways of strengthening the organizations that
comprise the core of our civil society.
SAN DIEGO BY THE NUMBERS`�9,700 THE NUMBER OF 501$c%$3% NONPROFITS IN SAN DIEGO COUNTY
`�1,864 THE NUMBER OF NONPROFITS WITH PAID EMPLOYEES
`�48 THE PERCENT OF HOUSEHOLDS THAT MADE A FINANCIAL CONTRIBUTION TO A NONPROFIT
`�34 THE PERCENT OF HOUSEHOLDS THAT VOLUNTEER
6
STAT
E OF
NON
PROF
ITS
AN
NU
AL
REP
OR
T
Measuring The Scope Of San Diego’s Nonprofit Sector
TABLE 1 | Growth of 501(c) Organizations 2008–2012
San Diego County California2008 2012 2008 v.
20122012 2008 2012 2008 v.
20122012
501(c) ClassNumber of
NPOsNumber of
NPOsPercent Change
Total NPOs per 1,000 People
Number of NPOs
Number of NPOs
Percent Change
Total NPOs per 1,000 People
(c)(3) 9,095 9,688 7% 3.13 116,902 118,884 2% 3.19
(c)(4) 733 564 -23% 0.18 9,105 7,133 -22% 0.19
(c)(5) 217 194 -11% 0.06 4,812 4,303 -11% 0.12
(c)(6) 515 500 -3% 0.16 6,725 6,075 -10% 0.16
(c)(7) 513 412 -20% 0.13 5,591 4,642 -17% 0.12
TOTAL 11,073 11,358 3% 3.67 143,135 141,037 -1% 3.79
Data Source: National Center for Charitable Statistics, Urban Institute, 2008 and 2012 Business Master Files.
2 | SPOTLIGHT ON SAN DIEGO ’S THIRD SEC TOR
The Internal Revenue Service recognizes nearly 30 di#erent subsections of
nonpro!t organizations; Table 1 describes the !ve most common. Of these,
the 501(c)(3) subsection was the only classi!cation to experience positive
growth over the last !ve years in both San Diego County and the State
of California, with 7 percent and 2 percent growth in the total number of
organizations respectively. The number of nonpro!ts per 1,000 people is
relatively the same in both areas (additional data for Orange County may be
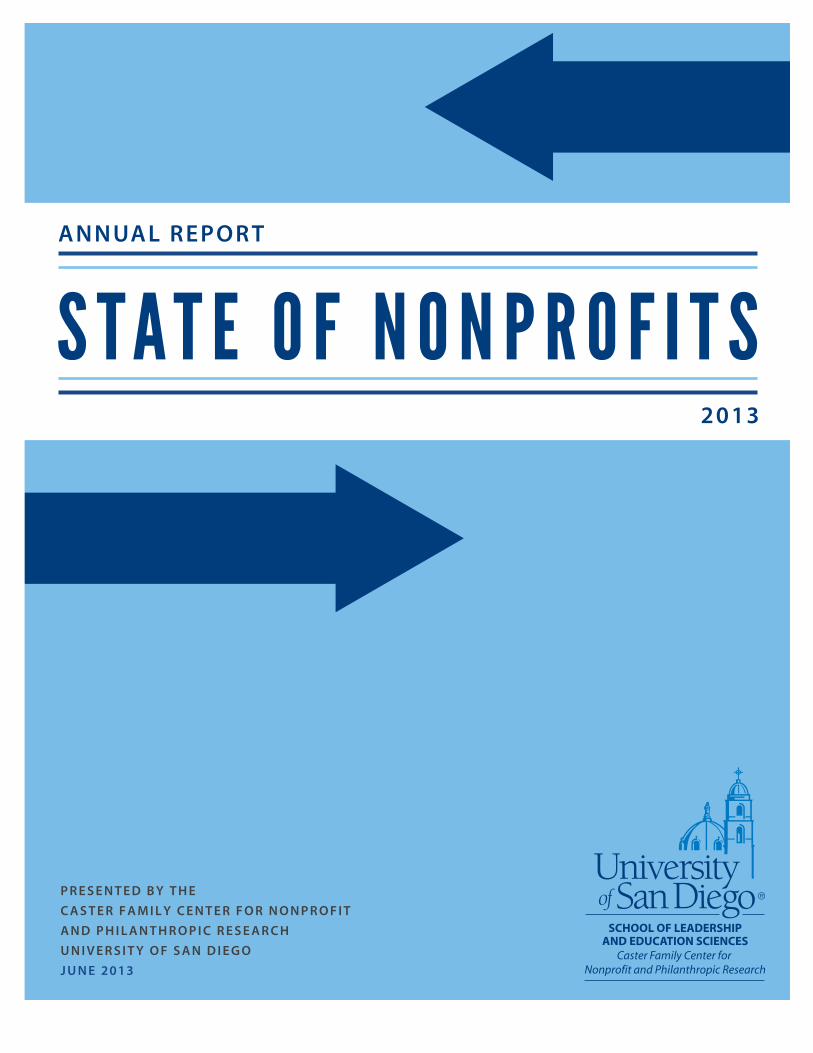
found in the Appendix). Figure 1 further illustrates that the vast majority of San Diego nonpro!ts
(74%) fall into the 501(c)(3) subsection, which includes public charities and foundations. The remainder of this report
focuses only on 501(c)(3) organizations.
FIGURE 1 | Nonprofit Organizations by Subsector
NEARLY 9,700 REGISTERED 501$c%$3% PUBLIC CHARITIES AND FOUNDATIONS ARE LOCATED IN SAN DIEGO
74.2%
4.3%1.5%
3.2%
13.0%(c)(3)
(c)(4)
(c)(5)
(c)(6)
(c)(7)
ALL OTHER
3.8%
Data Source: National Center for Charitable Statistics, Urban Institute, 2012 Business Master Files.
7
STATE OF NONPROFITS A
NN
UA
L REPO
RT
2 | SPOTLIGHT ON SAN DIEGO ’S THIRD SEC TOR
TABLE 2 | Nonprofit Organizations by Subsector
San Diego County California2008 2012 2008 v.
20122012 2008 2012 2008 v.
20122012
SubsectorNumber of NPOs
Number of NPOs
Percent Change
% of Total NPOs
Number of NPOs
Number of NPOs
Percent Change
% of Total NPOs
Arts and Culture 926 930 0% 10% 12,373 11,269 -9% 9%
Education 1,445 1,532 6% 16% 17,445 17,570 1% 15%
Health 721 661 -8% 7% 8,492 7,578 -11% 6%
Environment and Animals 340 432 27% 4% 4,081 4,721 16% 4%
Human Services 2,037 2,090 3% 22% 27,384 26,391 -4% 22%
International 173 247 43% 3% 1,848 2,684 45% 2%
Mutual, Public, and Societal Bene!t* 1,737 1,639 -6% 17% 21,363 19,666 -8% 17%
Religion 1,716 2,157 26% 22% 23,916 29,005 21% 24%
TOTAL 9,095 9,688 7% 100% 116,902 118,884 2% 100%
* = Includes unclassified nonprofits. Data Source: National Center for Charitable Statistics, Urban Institute, 2008 and 2012 Business Master Files.
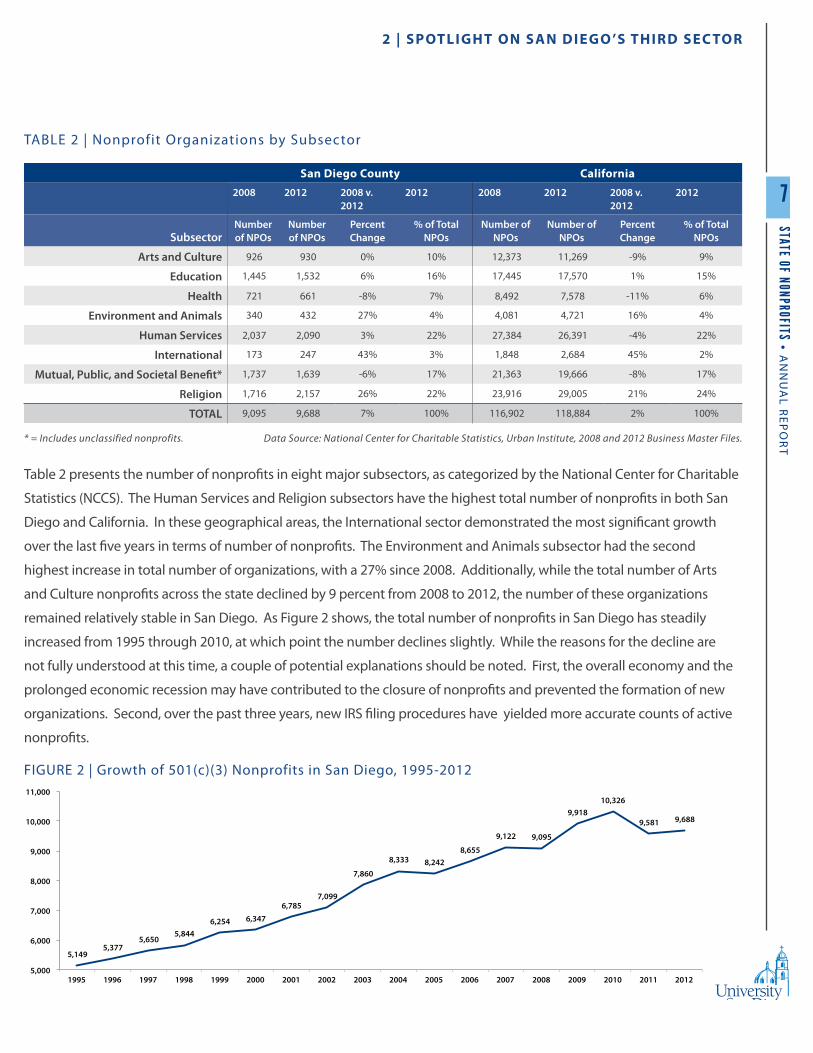
Table 2 presents the number of nonpro!ts in eight major subsectors, as categorized by the National Center for Charitable
Statistics (NCCS). The Human Services and Religion subsectors have the highest total number of nonpro!ts in both San
Diego and California. In these geographical areas, the International sector demonstrated the most signi!cant growth
over the last !ve years in terms of number of nonpro!ts. The Environment and Animals subsector had the second
highest increase in total number of organizations, with a 27% since 2008. Additionally, while the total number of Arts
and Culture nonpro!ts across the state declined by 9 percent from 2008 to 2012, the number of these organizations
remained relatively stable in San Diego. As Figure 2 shows, the total number of nonpro!ts in San Diego has steadily
increased from 1995 through 2010, at which point the number declines slightly. While the reasons for the decline are
not fully understood at this time, a couple of potential explanations should be noted. First, the overall economy and the
prolonged economic recession may have contributed to the closure of nonpro!ts and prevented the formation of new
organizations. Second, over the past three years, new IRS !ling procedures have yielded more accurate counts of active
nonpro!ts.
5,149 5,377
5,650 5,844
6,254 6,347 6,785
7,099
7,860
8,333 8,242 8,655
9,122 9,095
9,918 10,326
9,581 9,688
5,000
6,000
7,000
8,000
9,000
10,000
11,000
1995 1996 1997 1998 1999 2000 2001 2002 2003 2004 2005 2006 2007 2008 2009 2010 2011 2012
FIGURE 2 | Growth of 501(c)(3) Nonprofits in San Diego, 1995-2012
Data Source: National Center for Charitable Statistics, Urban Institute, 1995-2012 Business Master Files.
8
STAT
E OF
NON
PROF
ITS
AN
NU
AL
REP
OR
T2 | SPOTLIGHT ON SAN DIEGO ’S THIRD SEC TOR
Financial Capacity and Economic Impact of the Sector
TABLE 3 | Nonprofit Assets
San Diego County California
Subsector Total AssetsPercent of Total
Sector Assets Total AssetsPercent of Total
Sector Assets
Arts and Culture $687,021,561 4% $12,001,461,053 5%
Higher Education $1,665,805,838 9% $53,470,656,592 20%
Education $2,097,070,562 12% $23,835,364,374 9%
Hospitals $6,447,982,637 36% $70,854,817,900 27%
Environment and Animals $553,527,436 3% $4,637,167,911 2%
Health $2,315,568,767 13% $36,244,258,161 14%
Human Services $1,945,402,425 11% $31,573,017,128 12%
International $74,094,286 0.4% $1,450,981,156 1%
Mutual, Public, and Societal Bene!t* $1,847,827,408 10% $26,114,615,848 10%
Religion $112,790,889 1% $3,241,750,403 1%
TOTAL $17,747,091,809 100% $263,431,285,540 100%
* = For California, this category includes unclassified nonprofits. Data Source: National Center from Charitable Statistics, Urban Institute, 2010 Core Files.
1% 1% 5%
93%
68%
14% 10% 7%
0% 10% 20% 30% 40% 50% 60% 70% 80% 90%
100%
Under $250K $250K - Under $1 Million
$1 Million - $5 Million
Over $5 Million
Organizational Size Based on Total Assets
% of Total Sector Assets
% of Total Sector Nonprofits
Data Source: National Center for Charitable Statistics, Urban Institute, 2010 Business Master Files and 2010 Core Files.
FIGURE 3 | Comparison of Number of Nonprofits and Assets by Organizational Size
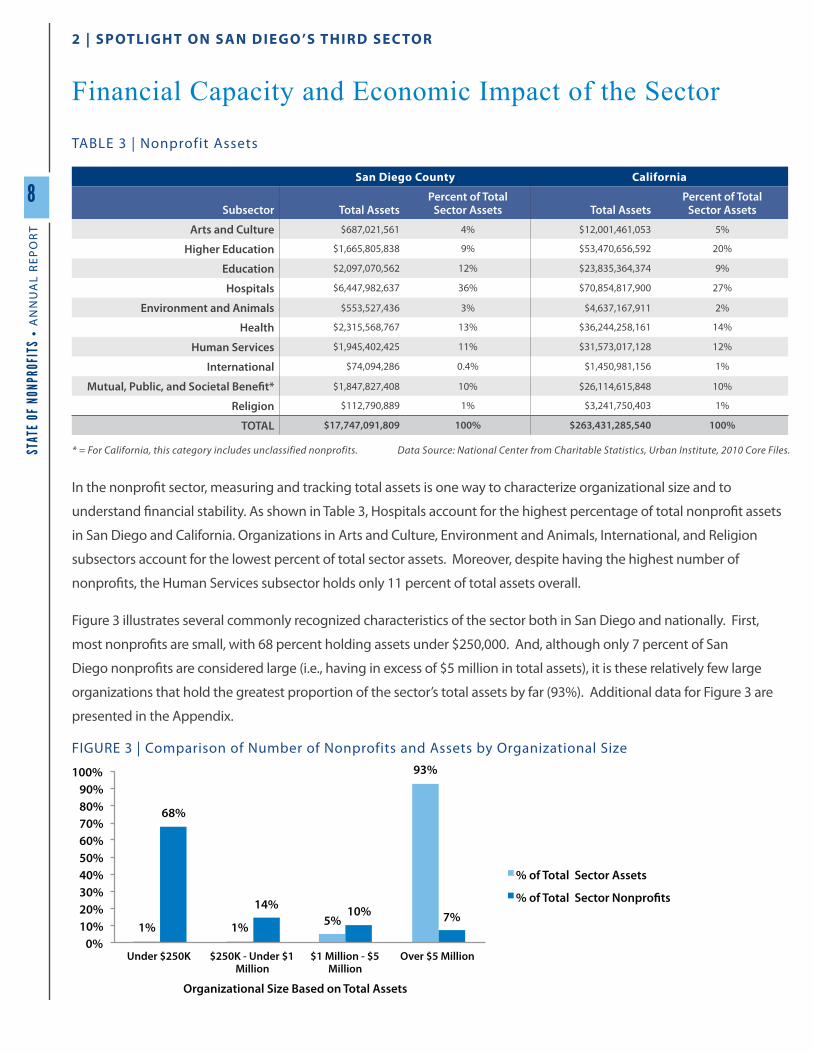
In the nonpro!t sector, measuring and tracking total assets is one way to characterize organizational size and to
understand !nancial stability. As shown in Table 3, Hospitals account for the highest percentage of total nonpro!t assets
in San Diego and California. Organizations in Arts and Culture, Environment and Animals, International, and Religion
subsectors account for the lowest percent of total sector assets. Moreover, despite having the highest number of
nonpro!ts, the Human Services subsector holds only 11 percent of total assets overall.
Figure 3 illustrates several commonly recognized characteristics of the sector both in San Diego and nationally. First,
most nonpro!ts are small, with 68 percent holding assets under $250,000. And, although only 7 percent of San
Diego nonpro!ts are considered large (i.e., having in excess of $5 million in total assets), it is these relatively few large
organizations that hold the greatest proportion of the sector’s total assets by far (93%). Additional data for Figure 3 are
presented in the Appendix.

9
STATE OF NONPROFITS A
NN
UA
L REPO
RT
2 | SPOTLIGHT ON SAN DIEGO ’S THIRD SEC TOR
Table 4 provides a !nancial snapshot showing that San Diego County has roughly the same population as Orange
County but produces a higher level of nonpro!t activity as measured by expenditures per capita. However, both
counties lag behind statewide levels. Furthermore, median levels for both revenue and expenses are higher for
California than they are for San Diego or Orange County, potentially indicating a smaller economic footprint for the
nonpro!t sector in these two counties relative to other parts of California. Nonpro!ts spend funds in pursuit of their
social mission. Since 2004, nonpro!t expenditures have generally represented about 6 percent of San Diego’s gross
regional product (GRP). However, in 2010 this number climbed to 7 percent.
A longitudinal assessment of the sector’s !nances, presented in Figure 4, !nds a slow but progressive upward trend
in assets, revenue, and expenses. The sector’s revenues exceed expenses, an indication of economic stability as the
sector overall did not experience a de!cit over this time period.
TABLE 4 | Comparison of Nonprofit Revenue and Expenses by Region and State
San Diego County Orange County California
Total Population 3,095,313 3,010,232 37,253,956
Total Revenue $12,458,082,593 $10,229,306,064 $175,329,181,866
Total Expenses $11,723,961,571 $9,628,557,950 $169,782,724,665
Expenditures Per Capita $3,788 $3,199 $4,557
Median Revenue $106,160 $98,112 $119,560
Median Expenses $101,868 $92,438 $114,096
Total Number of Organizations 3,503 3,552 42,473
Data Source: National Center from Charitable Statistics, Urban Institute, 2010 Core Files and 2010 US Census.
NONPROFIT EXPENSES = 7% OF SAN DIEGO GRP
FIGURE 4 | Growth of San Diego Nonprofit Assets, Revenues, and Expenses 2004-2011
0
5
10
15
20
25
2004 2005 2006 2007 2008 2009 2010 2011
Assets Revenue Expenses

10
STAT
E OF
NON
PROF
ITS
AN
NU
AL
REP
OR
T2 | SPOTLIGHT ON SAN DIEGO ’S THIRD SEC TOR
Nonprofit Revenue SourcesFigure 5 breaks down sources of nonpro!t revenue. On the whole, the highest amount of revenue is generated by
programs (67%) followed by donations (28%). Additional revenue is derived from the sale of goods, investments, and
other activities. Hospitals account for 44 percent of all nonpro!t revenue in San Diego, with 95 percent of revenues
coming from programs.
FIGURE 5 | Percentage of Nonprofit Revenue by Source
67%
28%
5%
Program Revenue
Dues Revenue Goods Revenue
Donations
Investment Revenue Other Revenue
TABLE 5 | San Diego Nonprofit Revenue from Programs, Dues, Donations, and Investments
SubsectorNumber of Filers
Percentage of NPOs Total Revenue
Percent of Revenue
Percent of Program Revenue
Percent of Dues Revenue
Percent of Goods Revenue
Percent of Donations Revenue
Percent of Investment Revenue
Percent of Other Revenue
Arts and Culture 404 12% $270,588,168 2% 42% 0.6% 3% 50% 2% 3%
Higher Education 19 1% $701,829,670 6% 90% 0.0% 0.1% 6% 1% 2%
Education 743 21% $1,000,145,091 8% 40% 0.2% 3% 53% 2% 2%
Hospitals 10 0.3% $5,489,311,951 44% 95% 0% 0% 3% 1% 2%
Environment and Animals
167 5% $310,522,291 2% 59% 0.1% 4% 32% 1% 3%
Health 326 9% $1,843,809,579 15% 40% 0.1% 1% 54% 1% 4%
Human Services 1052 30% $1,816,657,823 15% 43% 0.3% 1% 52% 1% 3%
International 123 4% $120,682,523 1% 15% 0.1% 0.1% 83% 1% 2%
Mutual, Public, and Societal Bene!t
408 12% $793,575,954 6% 35% 0.2% 1% 52% 4% 8%
Religion 251 7% $110,733,651 1% 15% 0.1% 1% 80% 1% 3%
TOTAL 3,503 100% $12,457,856,701 100%
Data Source: National Center for Charitable Statistics, Urban Institute, 2010 Core Files. Percents rounded to the nearest tenth.
However, as shown in Table 5, there are notable di#erences in sources of revenue across the other subsectors. For
instance, many rely more on donations than on program revenue. Speci!cally, this is the case for Arts, Education,
Health, Human Services, and Mutual/Public Bene!t nonpro!ts. In particular, Religious and International nonpro!ts
rely primarily on donations with well over three-quarters of revenue generated from this source.
11
STATE OF NONPROFITS A
NN
UA
L REPO
RT
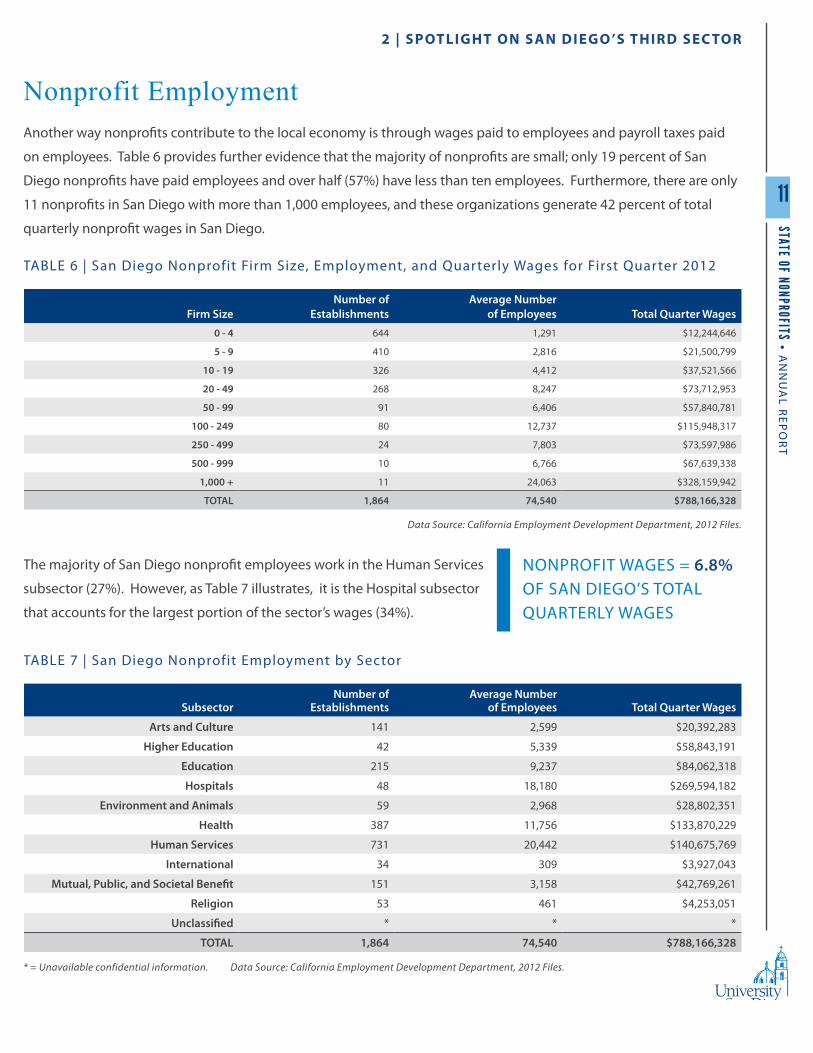
Nonprofit EmploymentAnother way nonpro!ts contribute to the local economy is through wages paid to employees and payroll taxes paid
on employees. Table 6 provides further evidence that the majority of nonpro!ts are small; only 19 percent of San
Diego nonpro!ts have paid employees and over half (57%) have less than ten employees. Furthermore, there are only
11 nonpro!ts in San Diego with more than 1,000 employees, and these organizations generate 42 percent of total
quarterly nonpro!t wages in San Diego.
TABLE 6 | San Diego Nonprofit Firm Size, Employment, and Quarterly Wages for First Quarter 2012
Firm SizeNumber of
EstablishmentsAverage Number
of Employees Total Quarter Wages0 - 4 644 1,291 $12,244,646
5 - 9 410 2,816 $21,500,799
10 - 19 326 4,412 $37,521,566
20 - 49 268 8,247 $73,712,953
50 - 99 91 6,406 $57,840,781
100 - 249 80 12,737 $115,948,317
250 - 499 24 7,803 $73,597,986
500 - 999 10 6,766 $67,639,338
1,000 + 11 24,063 $328,159,942
TOTAL 1,864 74,540 $788,166,328
Data Source: California Employment Development Department, 2012 Files.
The majority of San Diego nonpro!t employees work in the Human Services
subsector (27%). However, as Table 7 illustrates, it is the Hospital subsector
that accounts for the largest portion of the sector’s wages (34%).
TABLE 7 | San Diego Nonprofit Employment by Sector
SubsectorNumber of
EstablishmentsAverage Number
of Employees Total Quarter Wages
Arts and Culture 141 2,599 $20,392,283
Higher Education 42 5,339 $58,843,191
Education 215 9,237 $84,062,318
Hospitals 48 18,180 $269,594,182
Environment and Animals 59 2,968 $28,802,351
Health 387 11,756 $133,870,229
Human Services 731 20,442 $140,675,769
International 34 309 $3,927,043
Mutual, Public, and Societal Bene!t 151 3,158 $42,769,261
Religion 53 461 $4,253,051
Unclassi!ed * * *
TOTAL 1,864 74,540 $788,166,328
* = Unavailable confidential information. Data Source: California Employment Development Department, 2012 Files.
2 | SPOTLIGHT ON SAN DIEGO ’S THIRD SEC TOR
NONPROFIT WAGES = 6.8% OF SAN DIEGO’S TOTAL QUARTERLY WAGES
12
STAT
E OF
NON
PROF
ITS
AN
NU
AL
REP
OR
T
Grantmaking in San Diego
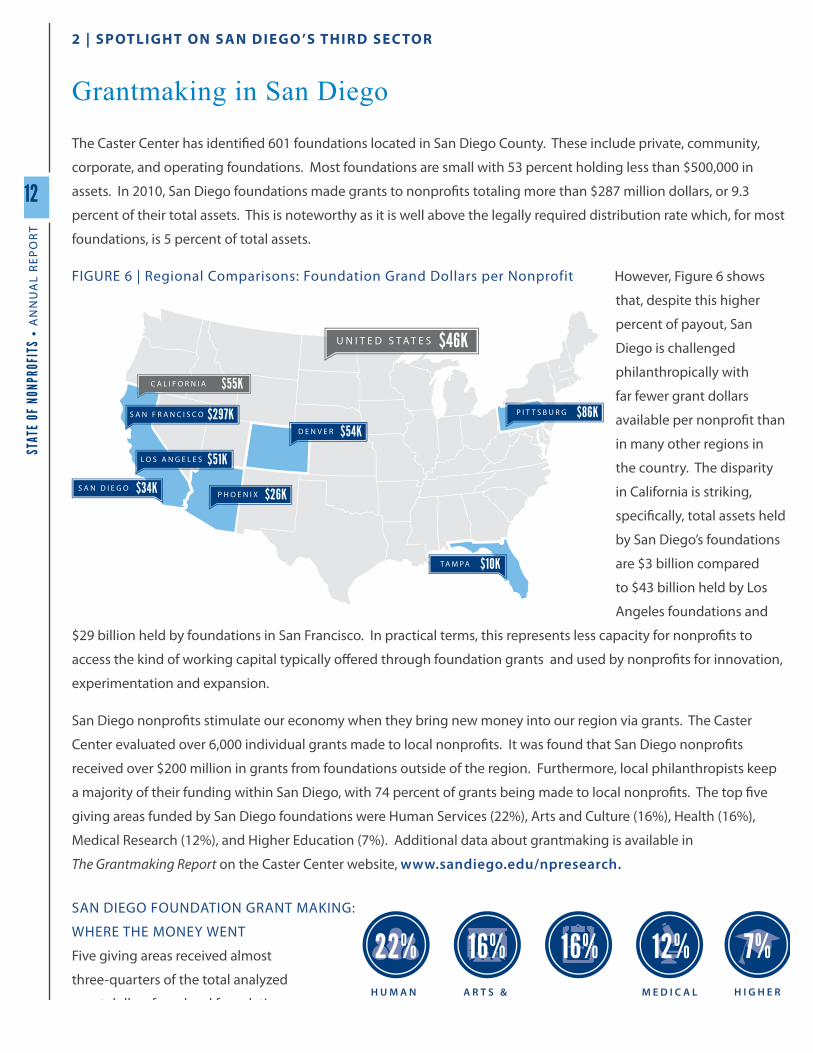
The Caster Center has identi!ed 601 foundations located in San Diego County. These include private, community,
corporate, and operating foundations. Most foundations are small with 53 percent holding less than $500,000 in
assets. In 2010, San Diego foundations made grants to nonpro!ts totaling more than $287 million dollars, or 9.3
percent of their total assets. This is noteworthy as it is well above the legally required distribution rate which, for most
foundations, is 5 percent of total assets.
However, Figure 6 shows
that, despite this higher
percent of payout, San
Diego is challenged
philanthropically with
far fewer grant dollars
available per nonpro!t than
in many other regions in
the country. The disparity
in California is striking,
speci!cally, total assets held
by San Diego’s foundations
are $3 billion compared
to $43 billion held by Los
Angeles foundations and
$29 billion held by foundations in San Francisco. In practical terms, this represents less capacity for nonpro!ts to
access the kind of working capital typically o#ered through foundation grants and used by nonpro!ts for innovation,
experimentation and expansion.
San Diego nonpro!ts stimulate our economy when they bring new money into our region via grants. The Caster
Center evaluated over 6,000 individual grants made to local nonpro!ts. It was found that San Diego nonpro!ts
received over $200 million in grants from foundations outside of the region. Furthermore, local philanthropists keep
a majority of their funding within San Diego, with 74 percent of grants being made to local nonpro!ts. The top !ve
giving areas funded by San Diego foundations were Human Services (22%), Arts and Culture (16%), Health (16%),
Medical Research (12%), and Higher Education (7%). Additional data about grantmaking is available in
The Grantmaking Report on the Caster Center website, www.sandiego.edu/npresearch.
2 | SPOTLIGHT ON SAN DIEGO ’S THIRD SEC TOR
FIGURE 6 | Regional Comparisons: Foundation Grand Dollars per Nonprofit
SAN DIEGO FOUNDATION GRANT MAKING:
WHERE THE MONEY WENT
Five giving areas received almost
three-quarters of the total analyzed
grant dollars from local foundations.

13
STATE OF NONPROFITS A
NN
UA
L REPO
RT
Volunteerism in San Diego
According to nonpro!t leaders surveyed as part on an ongoing needs assessment 1, volunteers create organizational
impact by helping deliver programs and services (62%), fundraising (51%), and serving as ambassadors (40%). These
local !ndings are consistent with national studies that identify the value that volunteers have to organizations.
However, many organizations report that they have not considered the full
value of volunteers and, therefore, have a vague notion of the potential return
on volunteer investment. As a result, these organizations do not properly
invest in volunteer engagement. For example, local nonpro!ts report that
they lack sta"ng (39%), funding (39%), and systems (26%) to support internal
volunteerism. In fact, 35 percent of survey respondents indicate they do not
have any sta# dedicated to engaging volunteers.
What is more, the research thus far shows that there often is a mismatch between what volunteers desire and what
nonpro!ts express that they need from volunteers. Until there is a strong connection to the organization, most
volunteer prospects seek one-time, hands-on activities convenient to their schedules (79%) and locations (61%).
Fortunately, many of these types of opportunities are readily available. However, 66 percent of organizations
are looking for a longer-term relationship that justi!es their investment of time in recruiting and supporting the
volunteers. Respondents !nd it most di"cult to recruit board (49%), pro bono/professionally experienced (25%), and
administrative (25%) volunteers who have time available and relevant skills.
Confusion about how to best connect volunteer prospects with the
organizations that need them hinders the volunteer and nonpro!t
matchmaking process. Thirty-three percent of volunteer respondents
indicate one of their top challenges to serving is that they are not sure
where to !nd volunteer opportunities. At the same time, 21 percent of
organizations surveyed cite challenges !nding the volunteers they need.
While there is a number of volunteer-connecting resources operating
in San Diego to facilitate the volunteer matching process, they do
not appear to su"ciently meet local needs. At this time, it is unclear
as to why these services are not fully-utilized. Low awareness of the
services available and lack of resources to fully scale and manage these
organizations are plausible explanations. Currently, both nonpro!ts and volunteer prospects who participated in
this study report that word of mouth and an organization’s website are the most powerful tools for sharing and !lling
volunteer positions with the right person in the right role.
NONPROFITS FIND THE BEST VOLUNTEER MATCHES THROUGH WORD OF MOUTH "73%# AND THEIR WEBSITES "43%#
VOLUNTEERS FIND THE BEST OPPORTUNITY MATCHES THROUGH THE NONPROFITS’ WEBSITES "35%# AND WORD OF MOUTH "29%#
35% OF NONPROFITS DO NOT HAVE ANY STAFF DEDICATED TO ENGAGING VOLUNTEERS
1 Additional data about volunteering in San Diego presented in this report were gathered through a separate needs assessment research project conducted by the Caster Center in the spring of 2013. This study included focus groups, interviews, and surveys of nonpro!ts and individuals. The study was designed to assess opportunities for better matching volunteers with nonpro!t organizations. Some, but not all, of the !ndings from that study are included in this report. The full !ndings from the needs assessment will be available on the Caster Center website in summer 2013.
2 | SPOTLIGHT ON SAN DIEGO ’S THIRD SEC TOR
14
STAT
E OF
NON
PROF
ITS
AN
NU
AL
REP
OR
T3 | DATA FROM THE FIELD: FINDINGS FROM THE STATE OF NONPROFITS QUAR TERLY INDEX
The State of Nonprofits Quarterly Index
In December 2011, the Caster Center launched the State of Nonpro!ts Quarterly Index (SONP Index), the only index
of its kind designed to monitor the economic health of nonpro!ts. The SONP Index is published quarterly and tracks
seven distinct indicators that have a direct impact on San Diego nonpro!t organizations. The !ndings presented here
represent the culmination of data collected to date.
A detailed systematic data collection process is used to generate each of the index components. What follows is a brief
description of each of the data sources.
Caster Center Quarterly Individual Giving and Volunteering Survey
The Giving and Volunteering Survey is electronically administered, on a quarterly basis, to a panel of San Diego County
residents. The survey is generated by Luth Research. The survey includes questions about public con!dence in the
local nonpro!t sector and household-level giving and volunteering. Approximately 500 panelists participate per
quarter. To generate the public con!dence !gures, data are weighted by race and ethnicity to better represent San
Diego’s population.
2-1-1 San Diego Call Data
The Demand for Services component of the index originates from 2-1-1 San Diego call data, which, per quarter,
includes approximately 40,000 calls indicating the expressed need of individuals for a variety of social services. The
three areas of need analyzed for this index include Food, Housing/Shelter, and Income Support/Employment.
Trend Reporters Survey
Trend Reporters are a select group of San Diego nonpro!t leaders that volunteer to participate regularly in a brief
online survey, which is administered quarterly. Trend Reporters also complete an annual electronic survey pertaining
to HR and Finance. Currently there are 125 active Trend Reporters providing quarterly data for the index. At this time
hospitals, higher education, and foundations are not represented in the Trend Reporters Survey.
Nonprofit Job Postings
This component of the index involves calculating the monthly average change in the number of San Diego nonpro!t
job postings across quarters. Nonpro!t job postings are collected from NPWorks (www.npworks.org) which is hosted
by Nonpro!t Management Solutions.
San Diego County Unemployment
Unemployment data for the index originate from the California Employment Development Department’s (EDD) San
Diego County Unemployment numbers. These !gures are not exclusive to nonpro!ts.

15
STATE OF NONPROFITS A
NN
UA
L REPO
RT
3 | DATA FROM THE FIELD: FINDINGS FROM THE STATE OF NONPROFITS QUAR TERLY INDEX
Findings Q2 2011–Q1 2013A full methodology for each index component may be retrieved online at www.stateofnonprofits.org.
Additional longitudinal data are presented for index components Individual Giving and Volunteerism in the Appendix.
Public Confidence
Public con!dence is the foundation upon which nonpro!ts function. Although
previous national studies showed a decline in public con!dence 2 after September
11, 2001 more recent research studies dispute this !nding and show, in fact, that
the public has high con!dence in nonpro!t leaders 3 and nonpro!t organizations. 4
The SONP Index re&ects these more positive !ndings as San Diegans regularly
express either a fair amount or great deal of con!dence in San Diego County
nonpro!ts. Public con!dence remained strong over the last eight quarters,
ranging from a high of 88.8 percent in the third quarter of 2012 to a low of 86.1
percent in the !rst quarter of 2013.
Individual Giving
While the percentage of households that reported giving in
any capacity did not &uctuate notably (giving ranged from
45.5 percent to 50.8 percent), on the whole, the number of
dollars given did. Speci!cally, giving ranged from $205.64
to $299.40 average dollars per household. Perhaps, most
importantly, there has been a slight upward trend for giving
after the third quarter of 2012.
Volunteerism
The percentage of households in San Diego volunteering ranged from
30.7 percent to 39.6 percent over the last eight quarters. In comparison, these
numbers are similar to the average rate of volunteering in San Diego estimated for
the previous year by the Corporation for National and Community Service (31.1%). 5
The State of Nonpro!t Index found that San Diegans varied with regard to the
average number of hours their households volunteered per quarter (ranging
from 17.4 hours to 29.0 hours). At the early stages of this project it is uncertain
whether or not this range of &uctuation is normal; however, other studies have
also found signi!cant &uctuation in volunteering patterns. 6
2 Light, P. (2008). How Americans view charities: A report on charitable con!dence. The Brookings Institution, Washington, D.C.3 Rosenthal, S. A. (2012). National Leadership Index 2012: A national study of con!dence in leadership. Center for Public Leadership, Harvard Kennedy School, Harvard University, Cambridge, Massachusetts.4 O’neil, M. (2009). Public con!dence in charitable nonpro!ts. Nonpro!t and Volunteer Sector Quarterly, 38(2), 237-269. 5 Volunteering and Civic Life. (2012). Corporation for National & Community Service. 6 Volunteering and Civic Life. (2012). Corporation for National & Community Service.
ON AVERAGE 48% OF SAN DIEGO HOUSEHOLDS MAKE FINANCIAL
CONTRIBUTIONS TO A NONPROFIT
THE AVERAGE GIFT WAS $245
ON AVERAGE 88% OF SAN DIEGANS EXPRESS CONFIDENCE IN THE NONPROFIT SECTOR
ON AVERAGE THEYVOLUNTEERED 23 HOURS PER QUARTER
ON AVERAGE 34% OF SAN DIEGO HOUSEHOLDS VOLUNTEERED

16
STAT
E OF
NON
PROF
ITS
AN
NU
AL
REP
OR
T
86.2
127.9 132.8
143.4
120.9 120.5 126.4
118
86.1 89.5 93.9
99.6 98.2 103.5 105.7
97
59
71.1 78.8
85.6
53.2 55.6 64.7 66.2
0
20
40
60
80
100
120
140
160
Q1-2011 Q2-2011 Q3-2011 Q4-2011 Q1-2012 Q2-2012 Q3-2012 Q4-2012
Housing/Shelter (Average # of Need Calls Per Day)
Income Support and Employment (Average # of Need Calls Per Day)
Food (Average # of Need Calls Per Day)
3 | DATA FROM THE FIELD: FINDINGS FROM THE STATE OF NONPROFITS QUAR TERLY INDEX
Demand for Services
To approximate demand for nonpro!t services, the SONP Index tracks three speci!c areas of need:
Food, Housing/Shelter, and Income Support/Employment. Collectively, each of these areas were
on the rise from the second quarter of 2011 through the fourth quarter of 2011. Then, a decline
in Food calls and Housing/Shelter calls occurred between the fourth quarter of 2011 and the !rst
quarter of 2012. For this period, the average number of Food calls per day decreased from 85.6
calls to 53.2 calls, and the average number of Housing/Shelter calls per day fell from 143.4 calls to 120.9 calls.
Income Support and Employment calls did not drop signi!cantly for this same time frame; rather, they remained
relatively steady. For the !rst quarter of 2012 through the fourth quarter of 2012, the number of Food calls rose slowly
and somewhat consistently, beginning at 53.2 calls and ending at 66.2 calls per day. For the same period, calls for
Housing/Shelter remained around 120 calls per day on average (with the exception of the third quarter of 2012, which
increased slightly at 126.4 calls). Overall, despite Income Support and Employment calls holding steady between the
fourth quarter of 2011 and the !rst quarter of 2012, the average number of calls for this type of need increased steadily
from the second quarter of 2011 through the third quarter of 2012. Figure 7 illustrates these call trends over time.
Data Source: 2-1-1 San Diego Call Data, Quarter 3 2010 through Quarter 4 2012.
FIGURE 7 | Quarterly Demand for Services:
Average Number of Calls (Expressed Need) Per Day Across all 3 Types of Need
It’s important to note that 2-1-1 call data may be sensitive to seasonal &uctuations in need, caller di#erences in familiarity with the County’s needs-based distribution system, and internal operator knowledge of available resources. Despite these complexities, 2-1-1 San Diego call data remains one of the most valuable publicly available indicators of expressed need in San Diego.
17
STATE OF NONPROFITS A
NN
UA
L REPO
RT
118
96 95
138 157 157
0 20 40 60 80
100 120 140 160 180
Q3-2011 Q4-2011 Q1-2012 Q2-2012 Q3-2012 Q4-2012
3 | DATA FROM THE FIELD: FINDINGS FROM THE STATE OF NONPROFITS QUAR TERLY INDEX
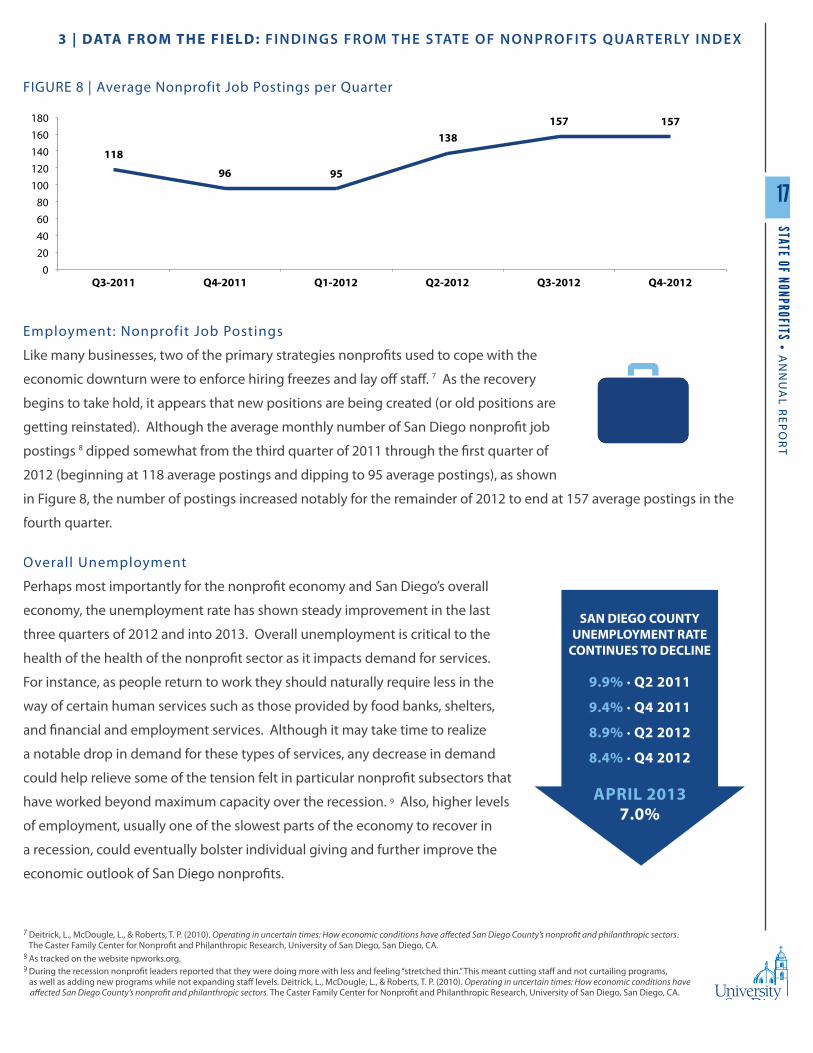
Employment: Nonprofit Job Postings
Like many businesses, two of the primary strategies nonpro!ts used to cope with the
economic downturn were to enforce hiring freezes and lay o# sta#. 7 As the recovery
begins to take hold, it appears that new positions are being created (or old positions are
getting reinstated). Although the average monthly number of San Diego nonpro!t job
postings 8 dipped somewhat from the third quarter of 2011 through the !rst quarter of
2012 (beginning at 118 average postings and dipping to 95 average postings), as shown
in Figure 8, the number of postings increased notably for the remainder of 2012 to end at 157 average postings in the
fourth quarter.
7 Deitrick, L., McDougle, L., & Roberts, T. P. (2010). Operating in uncertain times: How economic conditions have a"ected San Diego County’s nonpro!t and philanthropic sectors. The Caster Family Center for Nonpro!t and Philanthropic Research, University of San Diego, San Diego, CA.8 As tracked on the website npworks.org.9 During the recession nonpro!t leaders reported that they were doing more with less and feeling “stretched thin.” This meant cutting sta# and not curtailing programs, as well as adding new programs while not expanding sta# levels. Deitrick, L., McDougle, L., & Roberts, T. P. (2010). Operating in uncertain times: How economic conditions have a"ected San Diego County’s nonpro!t and philanthropic sectors. The Caster Family Center for Nonpro!t and Philanthropic Research, University of San Diego, San Diego, CA.
Overall Unemployment
Perhaps most importantly for the nonpro!t economy and San Diego’s overall
economy, the unemployment rate has shown steady improvement in the last
three quarters of 2012 and into 2013. Overall unemployment is critical to the
health of the health of the nonpro!t sector as it impacts demand for services.
For instance, as people return to work they should naturally require less in the
way of certain human services such as those provided by food banks, shelters,
and !nancial and employment services. Although it may take time to realize
a notable drop in demand for these types of services, any decrease in demand
could help relieve some of the tension felt in particular nonpro!t subsectors that
have worked beyond maximum capacity over the recession. 9 Also, higher levels
of employment, usually one of the slowest parts of the economy to recover in
a recession, could eventually bolster individual giving and further improve the
economic outlook of San Diego nonpro!ts.
SAN DIEGO COUNTY UNEMPLOYMENT RATE
CONTINUES TO DECLINE
9.9% · Q2 2011
9.4% · Q4 2011
8.9% · Q2 2012
8.4% · Q4 2012
APRIL 20137.0%
FIGURE 8 | Average Nonprofit Job Postings per Quarter
18
STAT
E OF
NON
PROF
ITS
AN
NU
AL
REP
OR
T
10 To supplement the regular pool of Trend Reporters for this report, Caster Center solicited additional nonpro!t leaders to provide input regarding various trends described in this section. On average, each question received approximately 150 responses from this pool of Trend Reporters.11 Nonpro!t Finance Fund, 2013 State of the Nonpro!t Sector Survey National Results (p. 11). The !nding is based on 1,451 national responses regarding federal funding and 2,421 regarding state/local funding.
3 | DATA FROM THE FIELD: FINDINGS FROM THE STATE OF NONPROFITS QUAR TERLY INDEX
What our Trend Reporters Have to SayOne way to understand and verify the numbers presented in the SONP Index is to ask for primary data directly from
nonpro!t leaders. To get this perspective, the Caster Center recruited local nonpro!t leaders, known here as Trend
Reporters, to provide quantitative data on a quarterly basis and on a lengthier annual survey. Trend Reporters
represent 125 San Diego-based nonpro!t organizations, with collectively more than $1.8 billion in assets and $1.6
billion in annual revenue. These 125 nonpro!ts account for approximately 28 percent of all 501(c)(3) revenue in
San Diego. Subsectors include Arts, Culture, and Humanities; Education; Environment and Animals; Health; Human
Services; International; Public and Societal Bene!t; and Religious organizations. Quarterly surveys have an average 40
percent response rate. 10
Much like the larger economy where recovery is slow, the nonpro!t economic climate is still presenting challenges to
local agencies. The data presented here will report on some of the most notable trends, as expressed by our reporters’
overall con!dence in the economic health of the sector, change in various types of funding, availability of unrestricted
operating reserves, demand for services, as well as intent to hire for new positions.
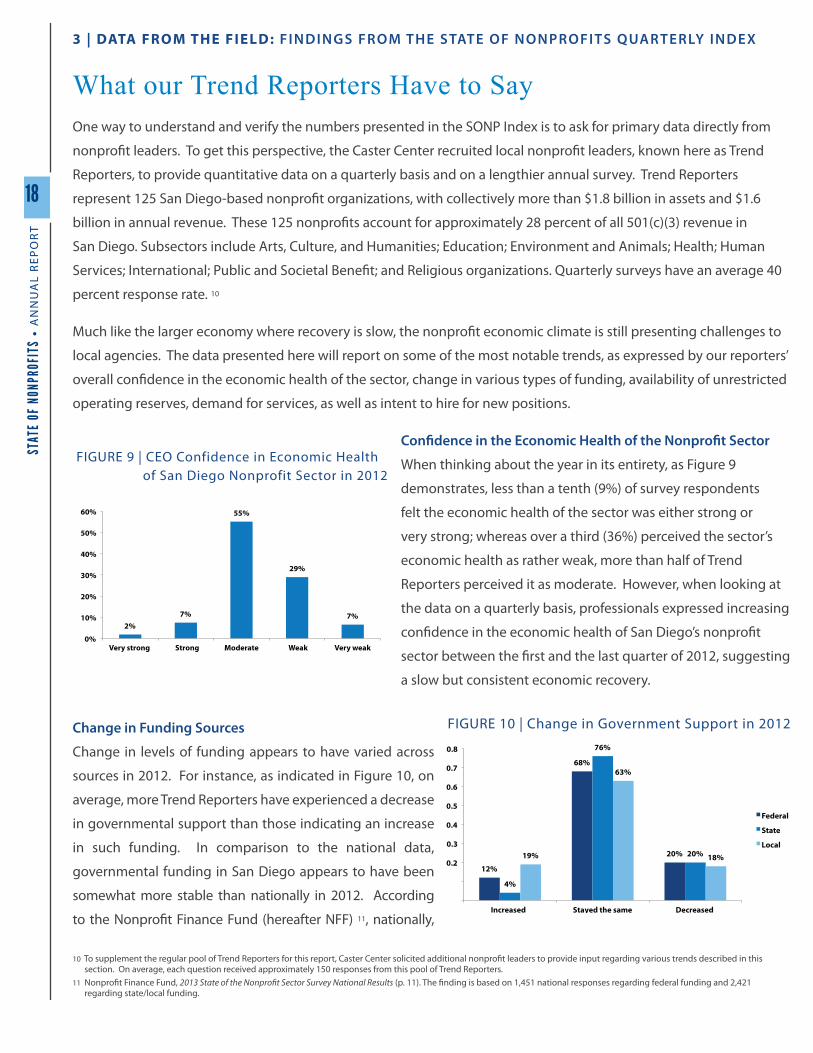
Con!dence in the Economic Health of the Nonpro!t Sector
When thinking about the year in its entirety, as Figure 9
demonstrates, less than a tenth (9%) of survey respondents
felt the economic health of the sector was either strong or
very strong; whereas over a third (36%) perceived the sector’s
economic health as rather weak, more than half of Trend
Reporters perceived it as moderate. However, when looking at
the data on a quarterly basis, professionals expressed increasing
con!dence in the economic health of San Diego’s nonpro!t
sector between the !rst and the last quarter of 2012, suggesting
a slow but consistent economic recovery.
Change in Funding Sources
Change in levels of funding appears to have varied across
sources in 2012. For instance, as indicated in Figure 10, on
average, more Trend Reporters have experienced a decrease
in governmental support than those indicating an increase
in such funding. In comparison to the national data,
governmental funding in San Diego appears to have been
somewhat more stable than nationally in 2012. According
to the Nonpro!t Finance Fund (hereafter NFF) 11, nationally,
2% 7%
55%
29%
7%
0%
10%
20%
30%
40%
50%
60%
Very strong Strong !Moderate Weak Very weak
12%
68%
20%
4%
76%
20% 19%
63%
18% 0.2
0.3
0.4
0.5
0.6
0.7
0.8
Increased Stayed the same Decreased
Federal
State
Local
FIGURE 10 | Change in Government Support in 2012
FIGURE 9 | CEO Confidence in Economic Health of San Diego Nonprofit Sector in 2012

19
STATE OF NONPROFITS A
NN
UA
L REPO
RT
3 | DATA FROM THE FIELD: FINDINGS FROM THE STATE OF NONPROFITS QUAR TERLY INDEX
33%
48%
19% 23%
49%
27% 24%
53%
23%
0%
10%
20%
30%
40%
50%
60%
Increased Stayed the Same Decreased
Individuals
Corporations
Foundations
22%
68%
9% 14%
76%
10%
23%
66%
11%
0%
10%
20%
30%
40%
50%
60%
70%
80%
Increased Stayed the Same Decreased
Investments
Bequests
Earned Income
36 percent of nonpro!ts experienced a decrease in federal support and 38 percent in state/local government support.
This compares to 23 percent of nonpro!ts experiencing an increase in federal and 22 percent in state and local funds.
Interestingly, as Figure 11 demonstrates, a third of Trend Reporters (33%) indicate that there has been an increase
in individual giving in 2012, which is encouraging especially as revenues from other sources have been in decline.
However, almost a quarter (24% and 23%, respectively) experienced either an increase or a decrease in foundation
giving, and more than half (53%) felt that the foundation giving has stayed unchanged. Still, corporate funding
appears to paint a slightly di#erent picture: more respondents (27%) report experiencing a decrease in corporate
funding than those seeing an increase (23%).
Most notably, the greatest increase appears to be observed in special events and fees for service: Figure 12 and 13 show
that more than a third (34%) of Trend Reporters reported an increase in these types of revenues. Earned income from
various sources, either related or unrelated to nonpro!t missions, as well as investments/endowments and bequests, on
the other hand, have experienced the slightest change in all of the reported sources of revenues: as Figure 14 indicates,
between 66 percent and 76 percent of respondents have reported no change in these sources in 2012.
FIGURE 14 | Change in Revenues from Investments, Bequests and Earned Income in 2012
FIGURE 12 | Change in Revenues from Special Events in 2012
34%
58%
7%
0%
10%
20%
30%
40%
50%
60%
70%
Increased Stayed the Same Decreased
FIGURE 13 | Change in Revenues from Fees for Service in 2012
FIGURE 11 | Change in Individual, Corporate and Foundation Giving in 2012
34%
46%
20%
0%
10%
20%
30%
40%
50%
60%
70%
Increased Stayed the Same Decreased

20
STAT
E OF
NON
PROF
ITS
AN
NU
AL
REP
OR
T
12 Nonpro!t Finance Fund, 2013 State of the Nonpro!t Sector Survey National Results (p. 7). The !nding is based on 5,336 valid responses by nonpro!ts organizations nationally.
Operating Reserves
Another way of estimating the
health of the nonpro!t economy
is by assessing whether the sector
possesses su"cient operating reserves.
Although 15 percent of survey
respondents indicated having no or
less than 30 days of cash reserves, it is
encouraging to report that more than
half (56%) of Trend Reporters attested
to having four or more months of
unrestricted operating reserves, as
shown in Figure 15. These numbers
are more promising than those reported by the Nonpro!t Finance Fund (NFF) 12, which indicated that almost a quarter
(24%) of nonpro!ts nationally have zero to one months of cash available and only 44 percent have over four months’
worth of operating reserves. This disparity, however, could be due to sampling di#erences.
Change in Demand for Service
While the economic recovery
has been slow for the nonpro!t
sector, the demand for services
in most parts of the sector has
not eased up. As shown in
Figure 16, over half of Trend
Reporters experienced an
increase in demand for their
agencies’ services (to varying
degrees); whereas only 15
percent indicated a decrease
in demand. It is important to
distinguish that the demand
for service measured by Trend Reporters is a broader measure than what is presented in the SONP Index, which uses
2-1-1 call data for three speci!c types of need (Food, Housing/Shelter, and Income Support and Employment) to
approximate a measure of demand for service.
9%
6%
29%
24%
32%
0%
5%
10%
15%
20%
25%
30%
35%
None Less than 30 days
1 - 3 months 4 - 6 months More than 6 months
3 | DATA FROM THE FIELD: FINDINGS FROM THE STATE OF NONPROFITS QUAR TERLY INDEX
18%
38%
29%
9%
6%
Greatly Increased
Moderately Increased
Stayed the Same
Moderately Decreased
Greatly Decreased
FIGURE 15 | Unrestricted Operating Reserves
FIGURE 16 | Change in Demand for Service in 2012

21
STATE OF NONPROFITS A
NN
UA
L REPO
RT
Nonprofit Job Creation
In order to meet the increasing demand for services, it appears that nonpro!ts are beginning to hire additional
personnel. Thus, after years of downsizing and hiring freezes during the peak of the economic recession, the nonpro!t
sector appears to be slowly turning the corner toward recovery. Forty-!ve percent of Trend Reporters say that they
plan to hire for new positions in 2013. This !nding is consistent with that of Nonpro!t HR Solutions 13, which reports
that 44 percent of nonpro!ts intend to hire for new positions in 2013; however, this number is somewhat higher than
that reported nationally by the NFF 14, where 35 percent of nonpro!ts indicated intent to create new positions in 2013.
This could be a noteworthy development for the overall economic recovery, considering that nonpro!t employment
accounts for over 10 percent of total private employment in the U.S., making the nonpro!t sector the third largest
among U.S. industries. 15
In particular, the 74 nonpro!t leaders who responded positively about hiring in
2013 projected creating between 438 and 442 new full-time equivalent positions.
This !nding is particular to the organizations that responded to the survey and
therefore, is not generalizable to the overall nonpro!t sector. Additionally, these
projected new jobs may be a combination of newly created positions, seasonal
worker rotation and/or positions previously kept on hold because of budgetary restrictions. Overall, however, there
appears to be a positive trend in nonpro!t job creation in San Diego.
Although detailed data on the speci!cs of the projected new positions are not available, it is still possible to estimate
the potential economic impact of these jobs. For example, taking into account California’s minimum wage of $8.00
per hour, these jobs, at the very minimum, could collectively result in almost $5,000,000 of new wages for San Diego’s
economy. In a di#erent example, using the average annual nonpro!t salary of $49,000 16, these 442 additional jobs
could result in roughly $21,500,000 in wages for the San Diego economy. Thus, according to these 74 Trend Reporters
alone, 2013 may see an increase between approximately $5 and $21 million in newly created wages in San Diego.
13 Nonpro!t HR Solutions, 2013 Nonpro!t Employment Trends Survey™ (p. 4). The !nding is based on 588 valid responses by nonpro!t organizations nationally.14 Nonpro!t Finance Fund, 2013 State of the Nonpro!t Sector Survey National Results (p. 8). The !nding is based on 5,983 valid responses by nonpro!ts organizations nationally.15 Salamon, L.M, Sokolowski, S.W., & Geller, S.L. (2012), Holding the Fort: Nonpro!t Employment During the Decade of Turmoil, John Hopkins University Center for Civil Society Studies.16 Simply Hired, Inc., Average Nonpro!t Salaries, as of May 17, 2013, available at: http://www.simplyhired.com/a/salary/search/q-nonpro!t. The average of $49,000 was calculated using the average salary for all posted jobs with the term “nonpro!t” in the job listing. This calculation may be in&uenced by the inclusion of larger nonpro!t employers, such as healthcare and higher education organizations.
45% OF NONPROFITS INTEND TO HIRE FOR NEW POSITIONS IN 2013
3 | DATA FROM THE FIELD: FINDINGS FROM THE STATE OF NONPROFITS QUAR TERLY INDEX

22
STAT
E OF
NON
PROF
ITS
AN
NU
AL
REP
OR
T
From the Desk of San Diego Nonprofit CEOs
The CEO’s Desk component of the SONP Index
provides nonpro!t CEOs the opportunity
to o#er an immediate on-the-ground
perspective about nonpro!t economic trends.
Contributing CEOs and Executive Directors that participate in
the panel of Trend Reporters are asked quarterly to answer the
question, “What emerging or notable trends do you currently see
in San Diego’s nonpro!t sector?” Data were analyzed quarterly
using a narrative analysis. At the end of the year, this process was
again conducted to solidify key themes and better understand the story behind the data. CEOs were asked at the end
of the year if the preliminary themes identi!ed by researchers re&ected their experience.
It is no surprise that a survey of nonpro!t Chief Executive O"cers designed to measure economic trends identi!ed
funding as one of the top challenges; however, the responses tell a compelling, nuanced story about the turbulence,
reinvention and renewal occurring in nonpro!t organizations every day. This analysis provided evidence of larger
macro-economic trends, resulting challenges for nonpro!ts, and key strategies employed for economic resilience.
E CO N O M I C T R E N D S In 2012, almost half (47%) of all survey responses throughout the year cited !nancial and fundraising challenges.
CEOs identi!ed several key macro-economic trends driving this concern: the residual e#ects of the economic
recession, political issues (i.e., budget cuts and legislation regarding charitable tax donations), and shifts in funder
priorities. These trends cannot be considered in isolation.
ECONOMIC RECESSION: Looking back at 2012, four full years after the stock market crash of fall 2008, the e#ects
of the recession were still being felt throughout the world and in San Diego. Unemployment in San Diego varied
slightly over the year, decreasing from 9.4 percent in January to 8.4 percent in December; however, this is still higher
than normal.
“jobs and money are scarce, which [means] people give less cash donations to nonprofits.”
TRENDS OBSERVED IN 201247% FINANCIAL CHALLENGES29% CHANGES TO THE MODEL16% POLITICS14% GENERAL ECONOMY 11% DEMAND FOR SERVICES10% EMPLOYMENT AND STAFFING5% LEADERSHIP $BOARD AND CEO%
3 | DATA FROM THE FIELD: FINDINGS FROM THE STATE OF NONPROFITS QUAR TERLY INDEX
“

23
STATE OF NONPROFITS A
NN
UA
L REPO
RT
PHILANTHROPY: Nationally, reports on giving during the recession have been varied. According to CEOs, local
funders are reacting in various ways.
“Foundations are changing their priorities, giving less, giving less often, skipping years of giving, alternating years of giving, while dealing with the demand of responding to the diverse nonprofits service demands.”
Some foundations shift funding priorities during a recession to cope with the foundation’s own economic losses and,
at the same time, continue to provide critical support to nonpro!ts. As previously mentioned, foundations in San Diego
have a smaller pool of assets from which to draw for grantmaking purposes ($3 billion). For example, Los Angeles ($43
billion) has more than 14 times the assets of San Diego and San Francisco ($28 billion) has almost ten times the amount
of foundation assets. 16 Several CEOs recognized this and at the same time urged funders to do more.
One CEO enouraged foundations “be open to differences between evidence practice and promising practice . . . related to programs/services that serve ethnically diverse communities. . . where research has not been designed for these populations.”
POLITICS: Beyond philanthropy, politics was a theme manifest in 16 percent of all responses throughout the year.
Trend Reporters speci!cally mentioned the Federal budget crisis, legislation regarding charitable tax deductions,
changes to the marginal tax rates, the e#ects of healthcare reform, the loss of American Recovery and Reinvestment
funding, changes to the payroll tax, the California State budget crisis, the e#ects of Proposition 30, San Diego City and
Transient Occupancy Tax (TOT) funding, and redevelopment funding. This list further illustrates the deep connection
between nonpro!ts and government.
“The uncertainty in government policy, particularly in regard to tax policy and healthcare costs creates risks in planning for the future.”
16 Deitrick, L. (2013). The grantmaking report: Foundation giving in the San Diego region. The Caster Family Center for Nonpro!t and Philanthropic Research, University of San Diego, San Diego, CA.
3 | DATA FROM THE FIELD: FINDINGS FROM THE STATE OF NONPROFITS QUAR TERLY INDEX
“
“
“
24
STAT
E OF
NON
PROF
ITS
AN
NU
AL
REP
OR
T
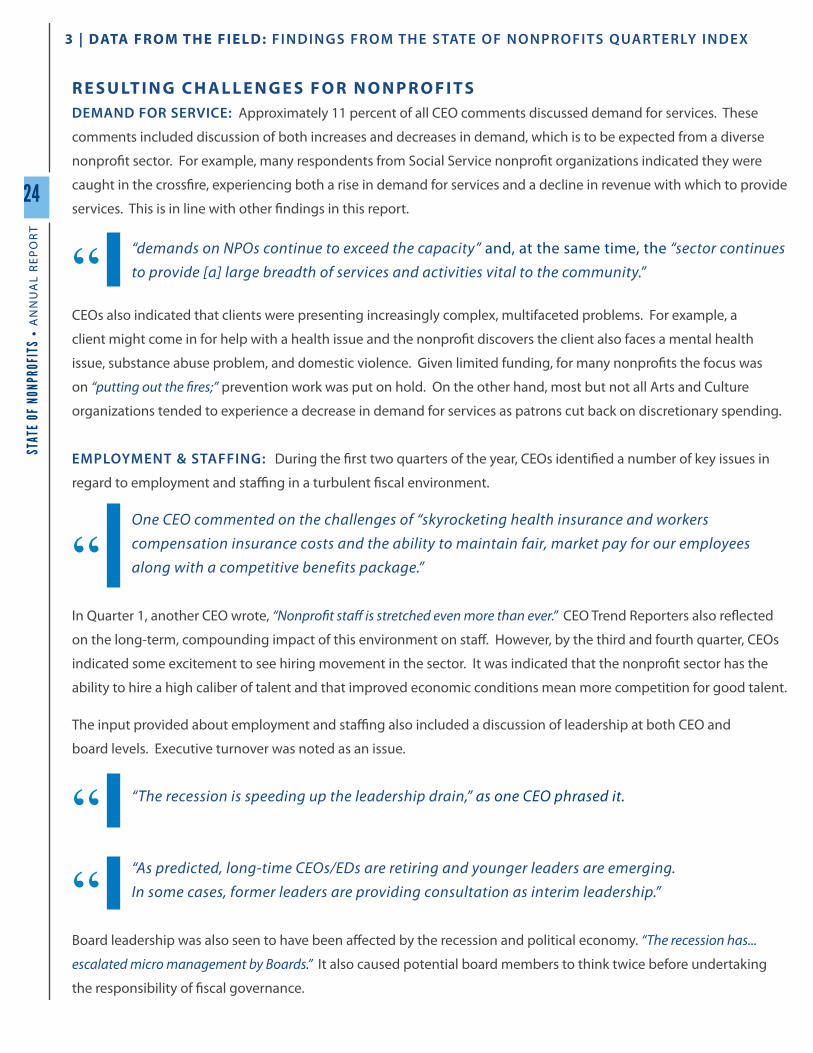
R E S U LT I N G C H A L L E N G E S F O R N O N P R O F I T S DEMAND FOR SERVICE: Approximately 11 percent of all CEO comments discussed demand for services. These
comments included discussion of both increases and decreases in demand, which is to be expected from a diverse
nonpro!t sector. For example, many respondents from Social Service nonpro!t organizations indicated they were
caught in the cross!re, experiencing both a rise in demand for services and a decline in revenue with which to provide
services. This is in line with other !ndings in this report.
“demands on NPOs continue to exceed the capacity” and, at the same time, the “sector continues to provide [a] large breadth of services and activities vital to the community.”
CEOs also indicated that clients were presenting increasingly complex, multifaceted problems. For example, a
client might come in for help with a health issue and the nonpro!t discovers the client also faces a mental health
issue, substance abuse problem, and domestic violence. Given limited funding, for many nonpro!ts the focus was
on “putting out the !res;” prevention work was put on hold. On the other hand, most but not all Arts and Culture
organizations tended to experience a decrease in demand for services as patrons cut back on discretionary spending.
EMPLOYMENT & STAFFING: During the !rst two quarters of the year, CEOs identi!ed a number of key issues in
regard to employment and sta"ng in a turbulent !scal environment.
One CEO commented on the challenges of “skyrocketing health insurance and workers compensation insurance costs and the ability to maintain fair, market pay for our employees along with a competitive benefits package.”
In Quarter 1, another CEO wrote, “Nonpro!t sta" is stretched even more than ever.” CEO Trend Reporters also re&ected
on the long-term, compounding impact of this environment on sta#. However, by the third and fourth quarter, CEOs
indicated some excitement to see hiring movement in the sector. It was indicated that the nonpro!t sector has the
ability to hire a high caliber of talent and that improved economic conditions mean more competition for good talent.
The input provided about employment and sta"ng also included a discussion of leadership at both CEO and
board levels. Executive turnover was noted as an issue.
“The recession is speeding up the leadership drain,” as one CEO phrased it.
“As predicted, long-time CEOs/EDs are retiring and younger leaders are emerging. In some cases, former leaders are providing consultation as interim leadership.”
Board leadership was also seen to have been a#ected by the recession and political economy. “The recession has...
escalated micro management by Boards.” It also caused potential board members to think twice before undertaking
the responsibility of !scal governance.
3 | DATA FROM THE FIELD: FINDINGS FROM THE STATE OF NONPROFITS QUAR TERLY INDEX
“
“
““

25
STATE OF NONPROFITS A
NN
UA
L REPO
RT
S T R AT E G I E S F O R E CO N O M I C R E S I L I E N C E CEOs noted many positive trends and strategies for economic resilience.
Approximately a third of all comments throughout the year identi!ed
strategies nonpro!ts were adopting to strengthen economic resilience.
The top three strategies observed by CEOs were: collaboration (54%),
business-orientation (22%), and consolidation (15%).
COLLABORATION: Cross-sectoral collaboration was by far the predominant strategy observed by CEOs throughout
the year. This strategy can potentially increase program impact, attract new funders, and/or prevent the nonpro!t
from closing its doors.
“I've witnessed an increased interest in developing partnerships. More representatives from other organizations are requesting meetings to determine ways to collaborate to increase marketing appeal, reach new patrons/donors, and brainstorm ways to leverage resources.”
Collaboration may be a key strategy but it is not an easy one. Collaboration takes time, sta# resources, and long-term
commitment. Several CEOs spoke to the di"culties of inter-agency collaboration:
“Collaboration continues to be a hot topic for funders and organizations that want to leverage limited resources. The missing ingredient sometimes is the time to do it well... This isn't new, but it is a lesson we can carry forward even as the economy improves.”
STRATEGIES IDENTIFIED BY CEO TREND REPORTERS
54% COLLABORATION 22% BUSINESS'ORIENTATION 15% CONSOLIDATION5% NEW, INNOVATIVE
PROGRAMS
3 | DATA FROM THE FIELD: FINDINGS FROM THE STATE OF NONPROFITS QUAR TERLY INDEX
“
“

26
STAT
E OF
NON
PROF
ITS
AN
NU
AL
REP
OR
T3 | DATA FROM THE FIELD: FINDINGS FROM THE STATE OF NONPROFITS QUAR TERLY INDEX
BUSINESS ORIENTATION: CEOs also noted a shift toward a business orientation including the creation of income-
generating enterprise models. It was observed that nonpro!t organizations with fee-for-service models tended to fare
better during the last few years. Business orientation is also taking the form of a change in language and perspective:
“More and more nonprofits are focusing on impact and return on investment (ROI) for donors and other funders.”
CONSOLIDATION: Consolidation, including both internal restructuring, and mergers between nonpro!ts, although
not mentioned as prevalently by CEO Trend Reporters, was observed as a common strategy. It was observed that
nonpro!ts have continued, over the last year, to lay o# sta# members, combine sta# member duties, and add more
responsibilities to existing sta# members.
“There's always a struggle between revenue and services provided - need always grows more quickly than contributed or earned income... Do we skimp on administrative salaries in order to pay [staff ]? Do we cut subsidized services in order to balance our ledger - and if so, do we undercut our ability to raise contributed and earned income? We run the risk of decreasing our income further even as we try to cut costs.”
It was also noted several times that some nonpro!ts, particularly smaller ones, had merged with larger, more
economically stable organizations.
“
“
27
STATE OF NONPROFITS A
NN
UA
L REPO
RT
Observations and Questions for the Future
As can be expected, reports such as this one often times raise more questions than they answer. It is our hope that
this dilemma will be remedied in part as the State of Nonpro!ts Quarterly Index compiles additional data and as
trends become more evident in the ensuing months and years.
The !ndings presented in this report were gathered through a variety of sources and represent di#erent perspectives.
Taken together, several themes emerge that are worthy of additional discussion as follows:
As documented in the !ndings of this report, when the economy is improving, people give more generously.
However, on the whole, support from individuals pales in comparison to the level of support nonpro!ts receive
from government in the form of fee-for-service payments and direct contracts. In fact, one third of nonpro!t
revenue is derived from government. 17 As pressure increases for governments at all levels to reduce spending, more
responsibility is placed on nonpro!ts to take up the slack when services that are still needed are reduced or eliminated
through budget cuts. It is all the more important then, to have a better understanding of how nonpro!ts and
government interrelate and for nonpro!ts to understand their role as shapers of government policy.
Nonpro!t leaders recognize that political forces are at play that a#ect their work yet only 2% lobby the government as
a way to further their organizational mission. 18 Perhaps now more than ever, nonpro!ts need to be civically engaged
on behalf of their constituencies. To do this nonpro!t leaders and donors need to be educated on what they can do
legally and e#ectively to in&uence their governmental partners.
It is evident in the report that the overall philanthropic climate in San Diego is under-resourced as nonpro!ts are
highly dependent -- actually, disproportionately dependent compared to their counterparts throughout California and
the nation -- on government support and earned revenue. For nonpro!ts in San Diego, a leg of the revenue stool is
essentially, weak. The absence of comparable capital from private foundations means that San Diego’s nonpro!ts are
at a distinct disadvantage in their ability to take risks with new types of programs and initiatives.
Another key !nding of this research is the sector as a major and unrecognized economic engine for San Diego. In our
Trend Reporter panel alone we see that organizations plan to hire new employees in the coming year. Additionally,
nonpro!ts bring new money into the local economy through grants and contracts with foundations and government
entities. More work needs to be done to convey to the business community and general public the important role
nonpro!ts play in contributing to the economy and to the health of the region as a whole. For example, San Diego
businesses are able to attract talent to their ventures in no small part because of the educational, cultural and health
care services provided by many di#erent nonpro!t organizations.
4 | CONCLUSIONS: OBSER VATIONS AND QUESTIONS FOR THE FUTURE
17 This percentage &uctuates by subsector. See: The Nonpro!t Sector in Brief: Public Charities, Giving and Volunteering, 2012.18 Suarez, D., Hwang, H. (2008). Civic engagement and nonpro!t lobbying in California, 1998-2003. Nonpro!t and Voluntary Sector Quarterly 2008 37:93 originally published online 11 September 2007. Sage Publications.
28
STAT
E OF
NON
PROF
ITS
AN
NU
AL
REP
OR
T
In addition to the aforementioned, the report makes clear that volunteers are willing to give their time to nonpro!ts
but, there needs to be a better mechanism for connecting them to organizations that desire their services. Moreover,
there is a danger in the overuse of volunteers without adequate training and oversight which poses serious risks
to organizations and the people they serve. The lack of properly trained volunteer supervisors within San Diego’s
nonpro!t organizations is notable and concerning.
Finally, the report documents the complex issues confronting nonpro!t leaders. In particular, unpredictable funding
streams and a slow economic recovery extend the impacts of the recession for nonpro!ts, more so than for the
corporate sector. In response, new models of working collaboratively and across sectors are emerging. At the same
time, the face of nonpro!t leadership is changing in San Diego as long tenured CEOs and Executive directors are
transitioning into retirement. On the horizon, policy changes, especially in healthcare, have the potential to further
impact and shape the sector and the way it carries out its business in the future.
This is the state of San Diego’s nonpro!t sector in 2013. Flux, uncertainty, and adaptation are the new norm. Yet, the
overall economic health of the sector is stable and appears to be growing and the public’s con!dence in nonpro!ts
remains high. The long term sustainability of the sector, and its ability to thrive and innovate in order to address the
challenges and opportunities in our society that are outside the realm of the public and private sectors, will require
new thinking and new partnerships. Therefore this study is a call to action for all of us who care deeply about quality
of life in San Diego.
4 | CONCLUSIONS: OBSER VATIONS AND QUESTIONS FOR THE FUTURE
29
STATE OF NONPROFITS A
NN
UA
L REPO
RT
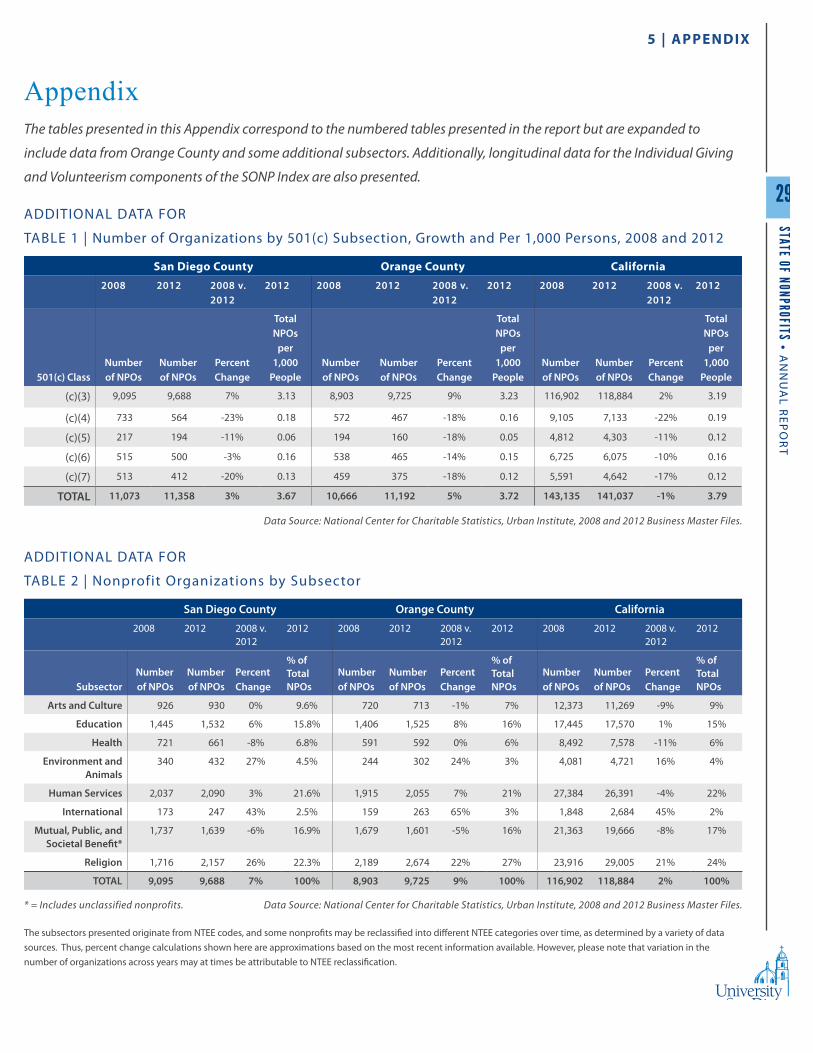
The tables presented in this Appendix correspond to the numbered tables presented in the report but are expanded to
include data from Orange County and some additional subsectors. Additionally, longitudinal data for the Individual Giving
and Volunteerism components of the SONP Index are also presented.
ADDITIONAL DATA FOR
TABLE 1 | Number of Organizations by 501(c) Subsection, Growth and Per 1,000 Persons, 2008 and 2012
San Diego County Orange County California2008 2012 2008 v.
20122012 2008 2012 2008 v.
20122012 2008 2012 2008 v.
20122012
501(c) ClassNumber of NPOs
Number of NPOs
Percent Change
Total NPOs
per 1,000
PeopleNumber of NPOs
Number of NPOs
Percent Change
Total NPOs
per 1,000
PeopleNumber of NPOs
Number of NPOs
Percent Change
Total NPOs
per 1,000
People
(c)(3) 9,095 9,688 7% 3.13 8,903 9,725 9% 3.23 116,902 118,884 2% 3.19
(c)(4) 733 564 -23% 0.18 572 467 -18% 0.16 9,105 7,133 -22% 0.19
(c)(5) 217 194 -11% 0.06 194 160 -18% 0.05 4,812 4,303 -11% 0.12
(c)(6) 515 500 -3% 0.16 538 465 -14% 0.15 6,725 6,075 -10% 0.16
(c)(7) 513 412 -20% 0.13 459 375 -18% 0.12 5,591 4,642 -17% 0.12
TOTAL 11,073 11,358 3% 3.67 10,666 11,192 5% 3.72 143,135 141,037 -1% 3.79
Data Source: National Center for Charitable Statistics, Urban Institute, 2008 and 2012 Business Master Files.
ADDITIONAL DATA FOR
TABLE 2 | Nonprofit Organizations by Subsector
San Diego County Orange County California2008 2012 2008 v.
20122012 2008 2012 2008 v.
20122012 2008 2012 2008 v.
20122012
SubsectorNumber of NPOs
Number of NPOs
Percent Change
% of Total NPOs
Number of NPOs
Number of NPOs
Percent Change
% of Total NPOs
Number of NPOs
Number of NPOs
Percent Change
% of Total NPOs
Arts and Culture 926 930 0% 9.6% 720 713 -1% 7% 12,373 11,269 -9% 9%
Education 1,445 1,532 6% 15.8% 1,406 1,525 8% 16% 17,445 17,570 1% 15%
Health 721 661 -8% 6.8% 591 592 0% 6% 8,492 7,578 -11% 6%
Environment and Animals
340 432 27% 4.5% 244 302 24% 3% 4,081 4,721 16% 4%
Human Services 2,037 2,090 3% 21.6% 1,915 2,055 7% 21% 27,384 26,391 -4% 22%
International 173 247 43% 2.5% 159 263 65% 3% 1,848 2,684 45% 2%
Mutual, Public, and Societal Bene!t*
1,737 1,639 -6% 16.9% 1,679 1,601 -5% 16% 21,363 19,666 -8% 17%
Religion 1,716 2,157 26% 22.3% 2,189 2,674 22% 27% 23,916 29,005 21% 24%
TOTAL 9,095 9,688 7% 100% 8,903 9,725 9% 100% 116,902 118,884 2% 100%
* = Includes unclassified nonprofits. Data Source: National Center for Charitable Statistics, Urban Institute, 2008 and 2012 Business Master Files.
5 | APPENDIX
Appendix
The subsectors presented originate from NTEE codes, and some nonpro!ts may be reclassi!ed into di#erent NTEE categories over time, as determined by a variety of data sources. Thus, percent change calculations shown here are approximations based on the most recent information available. However, please note that variation in the number of organizations across years may at times be attributable to NTEE reclassi!cation.
30
STAT
E OF
NON
PROF
ITS
AN
NU
AL
REP
OR
T
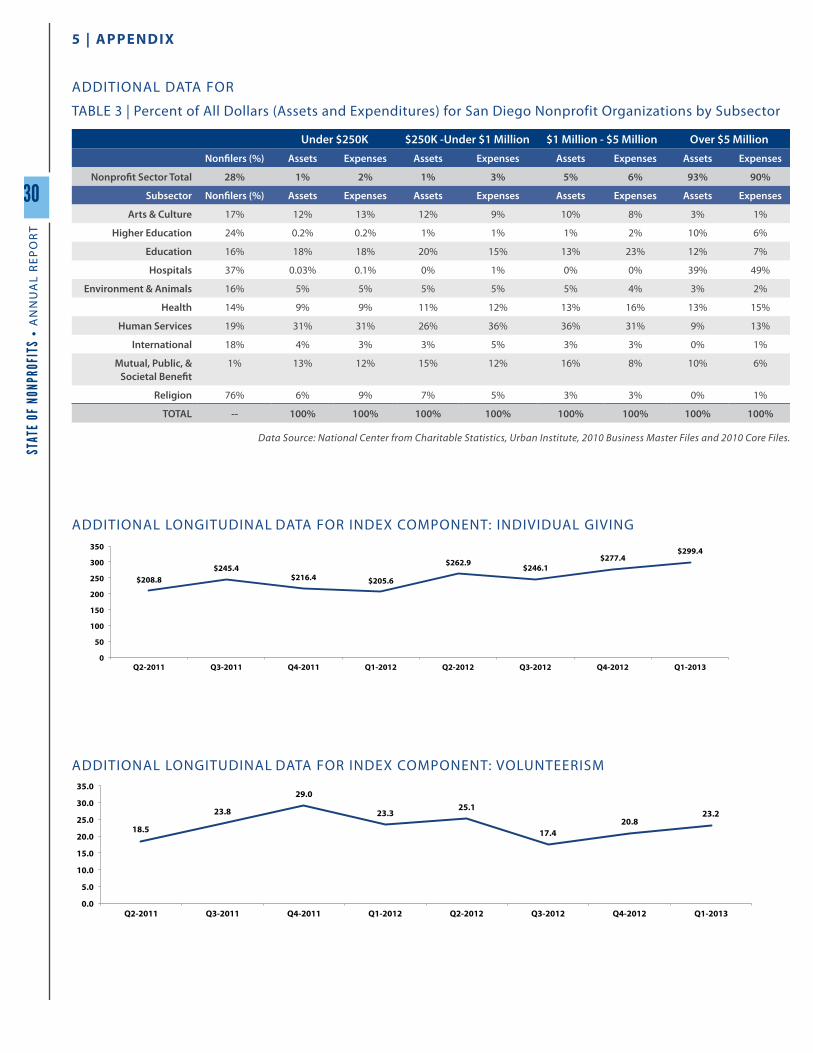
ADDITIONAL DATA FOR
TABLE 3 | Percent of All Dollars (Assets and Expenditures) for San Diego Nonprofit Organizations by Subsector
Under $250K $250K -Under $1 Million $1 Million - $5 Million Over $5 MillionNon!lers (%) Assets Expenses Assets Expenses Assets Expenses Assets Expenses
Nonpro!t Sector Total 28% 1% 2% 1% 3% 5% 6% 93% 90%
Subsector Non!lers (%) Assets Expenses Assets Expenses Assets Expenses Assets Expenses
Arts & Culture 17% 12% 13% 12% 9% 10% 8% 3% 1%
Higher Education 24% 0.2% 0.2% 1% 1% 1% 2% 10% 6%
Education 16% 18% 18% 20% 15% 13% 23% 12% 7%
Hospitals 37% 0.03% 0.1% 0% 1% 0% 0% 39% 49%
Environment & Animals 16% 5% 5% 5% 5% 5% 4% 3% 2%
Health 14% 9% 9% 11% 12% 13% 16% 13% 15%
Human Services 19% 31% 31% 26% 36% 36% 31% 9% 13%
International 18% 4% 3% 3% 5% 3% 3% 0% 1%
Mutual, Public, & Societal Bene!t
1% 13% 12% 15% 12% 16% 8% 10% 6%
Religion 76% 6% 9% 7% 5% 3% 3% 0% 1%
TOTAL -- 100% 100% 100% 100% 100% 100% 100% 100%
Data Source: National Center from Charitable Statistics, Urban Institute, 2010 Business Master Files and 2010 Core Files.
5 | APPENDIX
18.5
23.8
29.0
23.3 25.1
17.4 20.8
23.2
0.0
5.0
10.0
15.0
20.0
25.0
30.0
35.0
Q2-2011 Q3-2011 Q4-2011 Q1-2012 Q2-2012 Q3-2012 Q4-2012 Q1-2013
Volunteerism (Average Hours per Household) ADDITIONAL LONGITUDINAL DATA FOR INDEX COMPONENT: VOLUNTEERISM
87.9% 86.7% 88.1% 87.8% 87.0% 88.8% 87.4% 86.1%
50%
60%
70%
80%
90%
100%
Q2-2011 Q3-2011 Q4-2011 Q1-2012 Q2-2012 Q3-2012 Q4-2012 Q1-2013
Public Con dence (Percent Con dent)
$208.8 $245.4
$216.4 $205.6
$262.9 $246.1 $277.4
$299.4
0
50
100
150
200
250
300
350
Q2-2011 Q3-2011 Q4-2011 Q1-2012 Q2-2012 Q3-2012 Q4-2012 Q1-2013
Individual Giving (Average Dollars per Household) ADDITIONAL LONGITUDINAL DATA FOR INDEX COMPONENT: INDIVIDUAL GIVING

This report and the State of
Nonpro!ts Quarterly Index
were designed by:
Report DesignBRANDING + MARKE TING STUDIO
ONLINE AT thedesignstylist.com
Related Documents