Q2 11 HALF YEAR REPORT JANUARY–JUNE 2011 • Comparable sales 1) for the second quarter increased by 3 percent to 2,944 MSEK (2,849) and by 11 percent in local currencies. Sales for the second quarter of 2010 including businesses transferred to STG amounted to 3,701 MSEK • Comparable operating profit 2) for the second quarter increased by 5 percent to 829 MSEK (793) and by 13 percent in local currencies • Operating profit including businesses transferred to STG last year, share of net profit from STG and larger one time items 3) for the second quarter amounted to 904 MSEK (945) • EPS (basic) for the second quarter amounted to 2.94 SEK (2.78) 1) Sales excluding businesses transferred to STG on October 1, 2010. 2) Operating profit excluding businesses transferred to STG on October 1, 2010, share of net profit from STG and larger one time items. 3) Larger one time items include reversals of amortizations and depreciations relating to assets held for sale in 2010.

Welcome message from author
This document is posted to help you gain knowledge. Please leave a comment to let me know what you think about it! Share it to your friends and learn new things together.
Transcript

Q2 11 HALF YEAR REPORT JANUARY–JUNE 2011
• Comparable sales1) for the second quarter increased by 3 percent to 2,944 MSEK (2,849) and by 11 percent
in local currencies. Sales for the second quarter of 2010 including businesses transferred to STG amounted
to 3,701 MSEK
• Comparable operating profi t2) for the second quarter increased by 5 percent to 829 MSEK (793) and by
13 percent in local currencies
• Operating profit including businesses transferred to STG last year, share of net profit from STG and larger
one time items3) for the second quarter amounted to 904 MSEK (945)
• EPS (basic) for the second quarter amounted to 2.94 SEK (2.78)
1) Sales excluding businesses transferred to STG on October 1, 2010.
2) Operating profi t excluding businesses transferred to STG on October 1, 2010, share of net profi t from STG and larger one time items.
3) Larger one time items include reversals of amortizations and depreciations relating to assets held for sale in 2010.
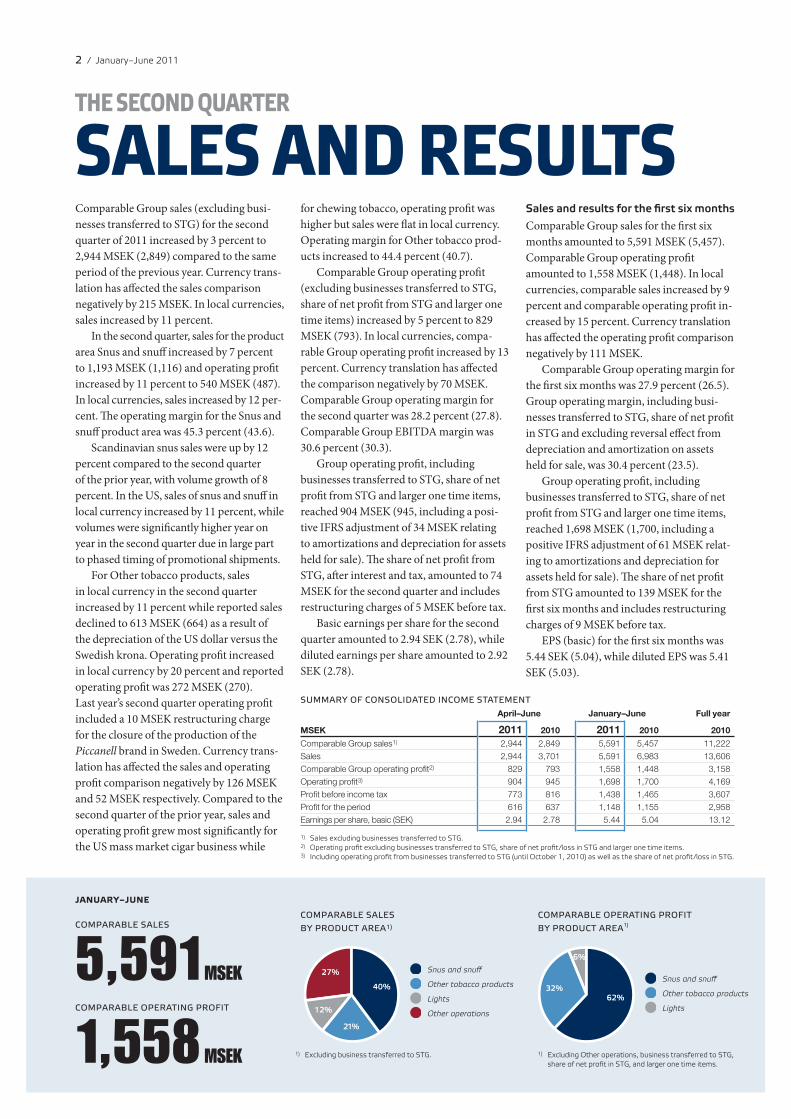
COMPARABLE SALES
BY PRODUCT AREA1)
40%
27%
21%
12%
Snus and snuff
Other tobacco products
Lights
Other operations
1) Excluding business transferred to STG.
COMPARABLE OPERATING PROFIT
BY PRODUCT AREA1)
62%
6%
32% Snus and snuff
Other tobacco products
Lights
1) Excluding Other operations, business transferred to STG,
share of net profit in STG, and larger one time items.
2 / January–June 2011
THE SECOND QUARTER
SALES AND RESULTS Comparable Group sales (excluding busi
nesses transferred to STG) for the second
quarter of 2011 increased by 3 percent to
2,944 MSEK (2,849) compared to the same
period of the previous year. Currency trans
lation has affected the sales comparison
negatively by 215 MSEK. In local currencies,
sales increased by 11 percent.
In the second quarter, sales for the product
area Snus and snuff increased by 7 percent
to 1,193 MSEK (1,116) and operating profi t
increased by 11 percent to 540 MSEK (487).
In local currencies, sales increased by 12 per
cent. The operating margin for the Snus and
snuff product area was 45.3 percent (43.6).
Scandinavian snus sales were up by 12
percent compared to the second quarter
of the prior year, with volume growth of 8
percent. In the US, sales of snus and snuff in
local currency increased by 11 percent, while
volumes were significantly higher year on
year in the second quarter due in large part
to phased timing of promotional shipments.
For Other tobacco products, sales
in local currency in the second quarter
increased by 11 percent while reported sales
declined to 613 MSEK (664) as a result of
the depreciation of the US dollar versus the
Swedish krona. Operating profi t increased
in local currency by 20 percent and reported
operating profit was 272 MSEK (270).
Last year’s second quarter operating profi t
included a 10 MSEK restructuring charge
for the closure of the production of the
Piccanell brand in Sweden. Currency trans
lation has affected the sales and operating
profit comparison negatively by 126 MSEK
and 52 MSEK respectively. Compared to the
second quarter of the prior year, sales and
operating profit grew most signifi cantly for
the US mass market cigar business while
JANUARY–JUNE
COMPARABLE SALES
5,591MSEK
COMPARABLE OPERATING PROFIT
1,558MSEK
for chewing tobacco, operating profi t was
higher but sales were flat in local currency.
Operating margin for Other tobacco prod
ucts increased to 44.4 percent (40.7).
Comparable Group operating profi t
(excluding businesses transferred to STG,
share of net profit from STG and larger one
time items) increased by 5 percent to 829
MSEK (793). In local currencies, compa
rable Group operating profit increased by 13
percent. Currency translation has aff ected
the comparison negatively by 70 MSEK.
Comparable Group operating margin for
the second quarter was 28.2 percent (27.8).
Comparable Group EBITDA margin was
30.6 percent (30.3).
Group operating profi t, including
businesses transferred to STG, share of net
profit from STG and larger one time items,
reached 904 MSEK (945, including a posi
tive IFRS adjustment of 34 MSEK relating
to amortizations and depreciation for assets
held for sale). The share of net profi t from
STG, after interest and tax, amounted to 74
MSEK for the second quarter and includes
restructuring charges of 5 MSEK before tax.
Basic earnings per share for the second
quarter amounted to 2.94 SEK (2.78), while
diluted earnings per share amounted to 2.92
SEK (2.78).
Sales and results for the first six months
Comparable Group sales for the fi rst six
months amounted to 5,591 MSEK (5,457).
Comparable Group operating profi t
amounted to 1,558 MSEK (1,448). In local
currencies, comparable sales increased by 9
percent and comparable operating profi t in
creased by 15 percent. Currency translation
has affected the operating profi t comparison
negatively by 111 MSEK.
Comparable Group operating margin for
the first six months was 27.9 percent (26.5).
Group operating margin, including busi
nesses transferred to STG, share of net profi t
in STG and excluding reversal eff ect from
depreciation and amortization on assets
held for sale, was 30.4 percent (23.5).
Group operating profi t, including
businesses transferred to STG, share of net
profit from STG and larger one time items,
reached 1,698 MSEK (1,700, including a
positive IFRS adjustment of 61 MSEK relat
ing to amortizations and depreciation for
assets held for sale). The share of net profi t
from STG amounted to 139 MSEK for the
first six months and includes restructuring
charges of 9 MSEK before tax.
EPS (basic) for the first six months was
5.44 SEK (5.04), while diluted EPS was 5.41
SEK (5.03).
SUMMARY OF CONSOLIDATED INCOME STATEMENT
April–June January–June Full year
MSEK 2011 2010 2011 2010 2010
Comparable Group sales1) 2,944 2,849 5,591 5,457 11,222
Sales 2,944 3,701 5,591 6,983 13,606
Comparable Group operating profi t2) 829 793 1,558 1,448 3,158
Operating profi t3) 904 945 1,698 1,700 4,169
Profi t before income tax 773 816 1,438 1,465 3,607
Profi t for the period 616 637 1,148 1,155 2,958
Earnings per share, basic (SEK) 2.94 2.78 5.44 5.04 13.12
1) Sales excluding businesses transferred to STG. 2) Operating profit excluding businesses transferred to STG, share of net profit/loss in STG and larger one time items. 3) Including operating profit from businesses transferred to STG (until October 1, 2010) as well as the share of net profit/loss in STG.

April–June January–June Full year
Percent 2011 2010 2011 2010 2010
Snus and snuff 45.3 43.6 44.6 42.4 46.0
Other tobacco products 44.4 40.7 43.2 37.9 38.6
Lights 13.9 19.6 15.7 19.2 19.5
Comparable Group operating margin2) 28.2 27.8 27.9 26.5 28.1
Group operating margin, including businesses transferred to STG and share of net profi t/loss in STG 30.7 24.6 30.4 23.5 25.2
April–June January–June Full year
Percent 2011 2010 2011 2010 2010
Snus and snuff 48.4 46.9 47.9 45.8 49.2
Other tobacco products 47.6 44.0 46.5 41.3 42.3
Lights 17.2 22.6 18.8 22.1 22.4
Comparable Group EBITDA margin1) 30.6 30.3 30.4 29.1 30.7
Group EBITDA margin, including businesses transferred to STG and share of
net profit/loss in STG 33.1 27.4 32.8 26.4 28.0
CEO Lars Dahlgren comments:
For the second quarter of 2011,
Swedish Match continued to deliver
strong comparable sales and profi t
growth in local currency terms.
Comparable sales in local currencies
increased by 11 percent and com
parable operating profit increased by
13 percent, driven by our Snus and
snuff and Other tobacco products
segments.
In Snus and snuff, we achieved
gains in sales and shipment volumes
for both snus in Scandinavia and snus
and snuff in the US. T e Scandinavian
snus business delivered strong profi t
growth, and we are particularly
pleased with the strong volume devel
opment in the quarter. Te US snuff
business increased profits on stronger
shipments, and we continue to see
good trends in our expansion of
Swedish snus in the US. Test market
activities for snus through SMPM
International continued in Taiwan
and Canada, and we are planning to
add at least one additional test market
during the year.
Our US mass market cigar busi
ness continued to excel during the
quarter, with solid market share gains
for our recent product introductions.
Overall we managed to grow volumes
by 42 percent in the quarter compared
to the prior year, and sales by more
than 20 percent in local currency.
Scandinavian Tobacco Group
continued its integration activities in
the quarter, with some synergies
already being realized. T e recently
acquired Lane business delivered
according to plan, and total operating
profit grew, both versus the fi rst
quarter and prior year.
Our Group strategy is to position
Swedish Match as the global smoke-
free leader, to leverage our strong
platforms in Other tobacco products
(US mass market cigars and chewing
tobacco) to maximize long term profi t-
ability, to continue our operational
excellence for Lights, and, through
active ownership, realize the potential
of Scandinavian Tobacco Group.
Restated reportable segments On October 1, 2010, when the transaction
between Swedish Match and Scandinavian
Tobacco Group to form a new company was
closed, the reportable segments of the Group
changed. For comparison purposes, the
financials of prior periods have been restated
to separate the operations transferred to the
new STG.
3
SALES BY PRODUCT AREA April–June Change January–June Change Full year
MSEK 2011 2010 % 2011 2010 % 2010
Snus and snuff 1,193 1,116 7 2,261 2,170 4 4,522
Other tobacco products 613 664 –8 1,196 1,252 –4 2,440
Lights 313 347 –10 649 698 –7 1,429
Other operations 826 722 14 1,484 1,337 11 2,831
Comparable Group sales 2,944 2,849 3 5,591 5,457 2 11,222
Businesses transferred to STG1) – 852 – 1,526 2,385
Total 2,944 3,701 5,591 6,983 13,606
1) Sales relating to businesses transferred to STG (until October 1, 2010), net of inter-company sales eliminations.
OPERATING PROFIT BY PRODUCT AREA
April–June Change January–June Change Full year
MSEK 2011 2010 % 2011 2010 % 2010
Snus and snuff 540 487 11 1,010 921 10 2,080
Other tobacco products 272 270 1 517 474 9 942
Lights 44 68 –36 102 134 –24 279
Other operations –26 –32 –70 –81 –142
Comparable Group operating profi t 829 793 5 1,558 1,448 8 3,158
Share of net profi t/loss in STG1) 74 – 139 – –60
Businesses transferred to STG2) – 118 – 191 334
Subtotal 904 911 –1 1,698 1,639 4 3,433
Net gain from pension settlements – – – – 59
Capital gain from transfer of businesses to STG – – – – 585
Reversal of depreciation and amortization relating to assets held for sale3) – 34 – 61 93
Total larger one time items – 34 – 61 737
Total 904 945 –4 1,698 1,700 0 4,169
1) Te share of net profit in STG for the first six months of 2011 includes restructuring charges of 9 MSEK before tax. Te share of net
loss in STG in 2010 (fourth quarter) includes restructuring charges, other transaction costs and IFRS acquisition adjustments
amounting to 175 MSEK before tax. 2) Operating profit for businesses transferred to STG (until October 1, 2010). 3) During 2010, operating profit by product area was presented including depreciation and amortization for operations relating to
assets held for sale. In order to arrive at the Group’s operating profit, depreciation and amortization related to assets held for sale
have been added back to the operating profit of reportable segments.
In order to reconcile to the Group’s profit before income tax amounting to 773 MSEK (816) for the second quarter and
1,438 MSEK (1,465) for the first six months, the Group’s net finance cost needs to be deducted from operating profi t
with an amount of 131 MSEK (129) for the second quarter and 259 MSEK (235) for the first six months.
OPERATING MARGIN BY PRODUCT AREA1)
1) Excluding larger one time items. 2) Excluding businesses transferred to STG and share of net profit/loss in STG.
EBITDA BY PRODUCT AREA April–June Change January–June Change Full year
MSEK 2011 2010 % 2011 2010 % 2010
Snus and snuff 577 524 10 1,083 994 9 2,225
Other tobacco products 292 292 0 557 517 8 1,033
Lights 54 78 –32 122 154 –21 320
Other operations –23 –31 –64 –79 –137
Comparable Group EBITDA1) 900 863 4 1,697 1,586 7 3,441
Share of net profi t/loss in STG2) 74 – 139 – –60
Businesses transferred to STG – 151 – 257 432
Total 974 1,015 –4 1,836 1,843 0 3,813
1) Excluding businesses transferred to STG and share of net profit/loss in STG. 2) Te share of net profit in STG for the first six months of 2011 includes restructuring charges of 9 MSEK before tax. Te share of net
loss in STG in 2010 (fourth quarter) includes restructuring charges, other transaction costs and IFRS acquisition adjustments
amounting to 175 MSEK before tax.
EBITDA MARGIN BY PRODUCT AREA
1) Excluding businesses transferred to STG and share of net profit/loss in STG.
SHARE OF GROUP TOTAL
Comparable
sales
Comparable
operating profit1)
40% 62%
1) Excluding Other operations.
4 / January–June 2011
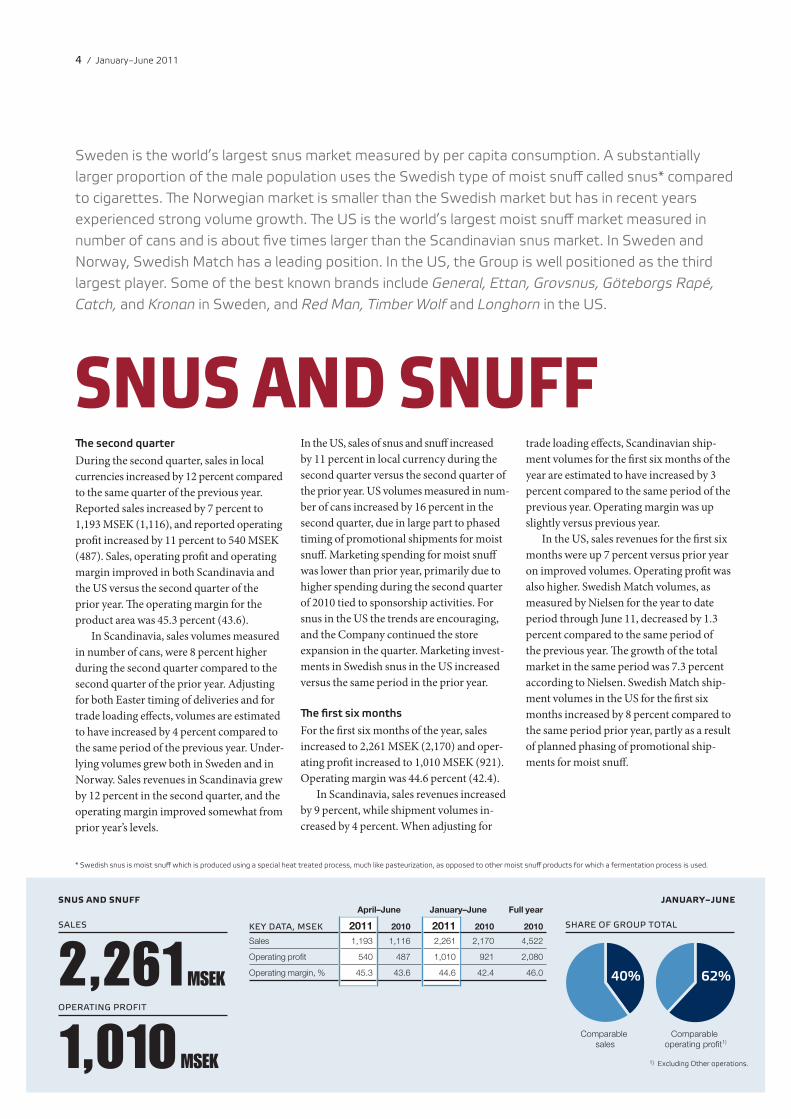
Sweden is the world’s largest snus market measured by per capita consumption. A substantially
larger proportion of the male population uses the Swedish type of moist snuff called snus* compared
to cigarettes. Te Norwegian market is smaller than the Swedish market but has in recent years
experienced strong volume growth. Te US is the world’s largest moist snuff market measured in
number of cans and is about five times larger than the Scandinavian snus market. In Sweden and
Norway, Swedish Match has a leading position. In the US, the Group is well positioned as the third
largest player. Some of the best known brands include General, Ettan, Grovsnus, Göteborgs Rapé,
Catch, and Kronan in Sweden, and Red Man, Timber Wolf and Longhorn in the US.
SNUS AND SNUFF Te second quarter
During the second quarter, sales in local
currencies increased by 12 percent compared
to the same quarter of the previous year.
Reported sales increased by 7 percent to
1,193 MSEK (1,116), and reported operating
profit increased by 11 percent to 540 MSEK
(487). Sales, operating profit and operating
margin improved in both Scandinavia and
the US versus the second quarter of the
prior year. The operating margin for the
product area was 45.3 percent (43.6).
In Scandinavia, sales volumes measured
in number of cans, were 8 percent higher
during the second quarter compared to the
second quarter of the prior year. Adjusting
for both Easter timing of deliveries and for
trade loading effects, volumes are estimated
to have increased by 4 percent compared to
the same period of the previous year. Under
lying volumes grew both in Sweden and in
Norway. Sales revenues in Scandinavia grew
by 12 percent in the second quarter, and the
operating margin improved somewhat from
prior year’s levels.
In the US, sales of snus and snuff increased
by 11 percent in local currency during the
second quarter versus the second quarter of
the prior year. US volumes measured in num
ber of cans increased by 16 percent in the
second quarter, due in large part to phased
timing of promotional shipments for moist
snuff. Marketing spending for moist snuff
was lower than prior year, primarily due to
higher spending during the second quarter
of 2010 tied to sponsorship activities. For
snus in the US the trends are encouraging,
and the Company continued the store
expansion in the quarter. Marketing invest
ments in Swedish snus in the US increased
versus the same period in the prior year.
T e first six months
For the first six months of the year, sales
increased to 2,261 MSEK (2,170) and oper
ating profit increased to 1,010 MSEK (921).
Operating margin was 44.6 percent (42.4).
In Scandinavia, sales revenues increased
by 9 percent, while shipment volumes in
creased by 4 percent. When adjusting for
trade loading effects, Scandinavian ship
ment volumes for the first six months of the
year are estimated to have increased by 3
percent compared to the same period of the
previous year. Operating margin was up
slightly versus previous year.
In the US, sales revenues for the fi rst six
months were up 7 percent versus prior year
on improved volumes. Operating profi t was
also higher. Swedish Match volumes, as
measured by Nielsen for the year to date
period through June 11, decreased by 1.3
percent compared to the same period of
the previous year. The growth of the total
market in the same period was 7.3 percent
according to Nielsen. Swedish Match ship
ment volumes in the US for the fi rst six
months increased by 8 percent compared to
the same period prior year, partly as a result
of planned phasing of promotional ship
ments for moist snuff .
* Swedish snus is moist snuff which is produced using a special heat treated process, much like pasteurization, as opposed to other moist snuff products for which a fermentation process is used.
2,261MSEK
SALES
JANUARY–JUNE
1,010MSEK
OPERATING PROFIT
SNUS AND SNUFF April–June January–June Full year
KEY DATA, MSEK 2011 2010 2011 2010 2010
Sales 1,193 1,116 2,261 2,170 4,522
Operating profi t 540 487 1,010 921 2,080
Operating margin, % 45.3 43.6 44.6 42.4 46.0

5
General, Göteborgs Rapé, and Catch are some of Scandinavia’s most popular snus brands. In the US,
Timber Wolf is one of the Company’s best known brands of moist snuff , while General is increasing its
presence in the growing snus category.
Comparable
sales
Comparable
operating profit1)
21% 32%
1) Excluding Other operations.
SHARE OF GROUP TOTAL
6 / January–June 2011
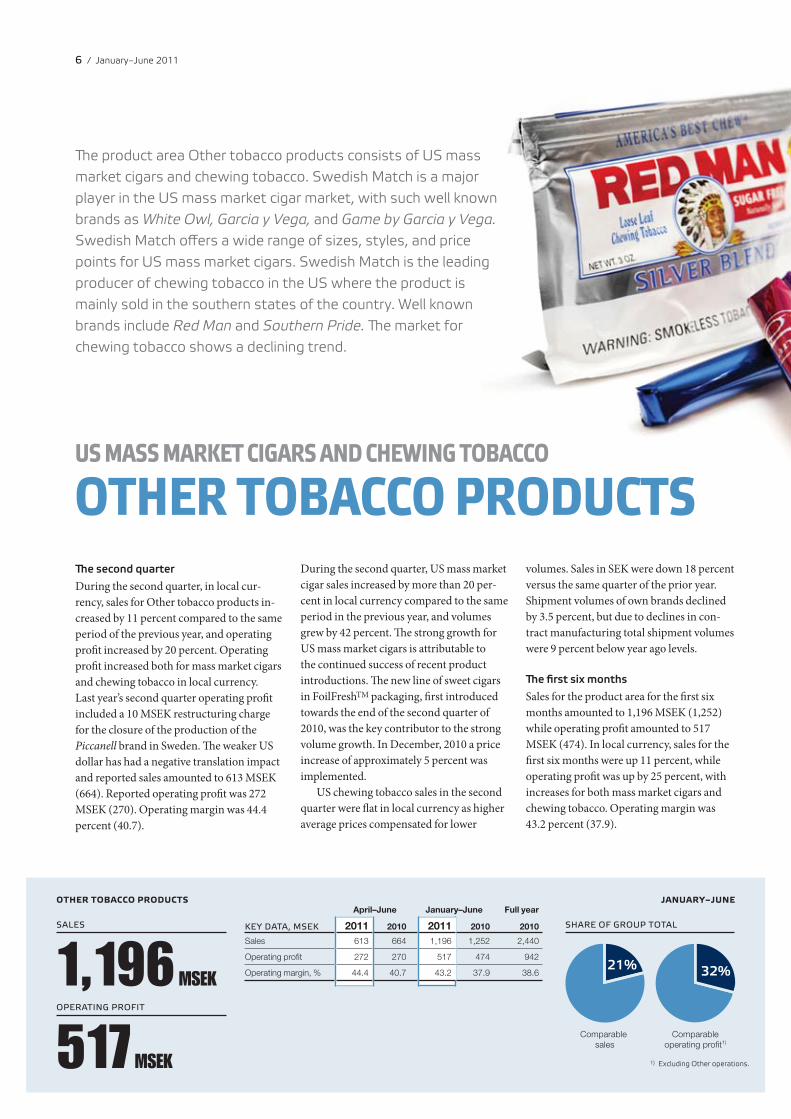
Te product area Other tobacco products consists of US mass
market cigars and chewing tobacco. Swedish Match is a major
player in the US mass market cigar market, with such well known
brands as White Owl, Garcia y Vega, and Game by Garcia y Vega.
Swedish Match offers a wide range of sizes, styles, and price
points for US mass market cigars. Swedish Match is the leading
producer of chewing tobacco in the US where the product is
mainly sold in the southern states of the country. Well known
brands include Red Man and Southern Pride. Te market for
chewing tobacco shows a declining trend.
US MASS MARKET CIGARS AND CHEWING TOBACCO
OTHER TOBACCO PRODUCTS
1,196MSEK
SALES
517MSEK
OPERATING PROFIT
OTHER TOBACCO PRODUCTS JANUARY–JUNE April–June January–June Full year
KEY DATA, MSEK 2011 2010 2011 2010 2010
Sales 613 664 1,196 1,252 2,440
Operating profi t 272 270 517 474 942
Operating margin, % 44.4 40.7 43.2 37.9 38.6
Te second quarter
During the second quarter, in local cur
rency, sales for Other tobacco products in
creased by 11 percent compared to the same
period of the previous year, and operating
profit increased by 20 percent. Operating
profit increased both for mass market cigars
and chewing tobacco in local currency.
Last year’s second quarter operating profi t
included a 10 MSEK restructuring charge
for the closure of the production of the
Piccanell brand in Sweden. The weaker US
dollar has had a negative translation impact
and reported sales amounted to 613 MSEK
(664). Reported operating profit was 272
MSEK (270). Operating margin was 44.4
percent (40.7).
During the second quarter, US mass market
cigar sales increased by more than 20 per
cent in local currency compared to the same
period in the previous year, and volumes
grew by 42 percent. The strong growth for
US mass market cigars is attributable to
the continued success of recent product
introductions. The new line of sweet cigars
in FoilFreshTM packaging, fi rst introduced
towards the end of the second quarter of
2010, was the key contributor to the strong
volume growth. In December, 2010 a price
increase of approximately 5 percent was
implemented.
US chewing tobacco sales in the second
quarter were flat in local currency as higher
average prices compensated for lower
volumes. Sales in SEK were down 18 percent
versus the same quarter of the prior year.
Shipment volumes of own brands declined
by 3.5 percent, but due to declines in con
tract manufacturing total shipment volumes
were 9 percent below year ago levels.
T e first six months
Sales for the product area for the fi rst six
months amounted to 1,196 MSEK (1,252)
while operating profit amounted to 517
MSEK (474). In local currency, sales for the
first six months were up 11 percent, while
operating profit was up by 25 percent, with
increases for both mass market cigars and
chewing tobacco. Operating margin was
43.2 percent (37.9).

Comparable
sales
Comparable
operating profit1)
12% 6%
1) Excluding Other operations.
SHARE OF GROUP TOTAL
649SALES
MSEK
102OPERATING PROFIT
MSEK
LIGHTS JANUARY–JUNE April–June January–June Full year
KEY DATA, MSEK 2011 2010 2011 2010 2010
Sales 313 347 649 698 1,429
Operating profi t 44 68 102 134 279
Operating margin, % 13.9 19.6 15.7 19.2 19.5
Te Swedish Match mass market cigar
portfolio includes the brands White Owl
and Game by Garcia y Vega. T e cigars
are presented in FoilFreshTM packaging
which guarantees freshness. Red Man
is the best selling brand of chewing
tobacco in the US. Red Man Silver Blend
has all of the great flavor of regular Red
Man, but without the sugar.
7
MATCHES AND LIGHTERS
LIGHTS Swedish Match is the market leader in a number of mar
kets for matches. Te match brands are mostly local, with
leading positions in their home countries. Larger brands
include Solstickan, Fiat Lux, Swan, Tres Estrellas, Feudor,
and Redheads. Te Group’s main brand for disposable light
ers is Cricket. Swedish Match’s largest market for lighters
is Russia.
Te second quarter
During the second quarter sales amounted to 313 MSEK (347). In local curren
cies, sales declined by 2 percent. Operating profit amounted to 44 MSEK (68).
Operating margin was 13.9 percent (19.6).
Sales and operating profit declined for both matches and lighters in the
second quarter despite higher volumes, due to mix effects, higher raw material
prices and negative currency eff ects.
T e first six months
Sales for the first six months amounted to 649 MSEK (698), while operating
profit amounted to 102 MSEK (134). Operating margin was 15.7 percent (19.2).
Tres Estrellas is one of the Company’s best known match brands and is sold on the
Spanish market. Cricket, one of the best known brands for quality disposable lighters,
is popular in Europe, Russia, Brazil, Malaysia, among other markets.

8 / January–June 2011
Other operations
Other operations are primarily the distribu
tion of tobacco products on the Swedish
market, and corporate overhead costs.
Te second quarter
Sales in Other operations for the second
quarter amounted to 826 MSEK (722).
Operating loss for Other operations was 26
MSEK (32).
T e first six months
Sales for the first six months amounted to
1,484 MSEK (1,337). Operating loss for the
first six months was 70 MSEK (81). During
the first six months of 2011 the operating
loss includes redundancy costs following
an organizational change and the operating
loss in 2010 included costs related to the
transaction with STG.
Scandinavian Tobacco Group
Swedish Match holds 49 percent of the
shares in Scandinavian Tobacco Group.
On March 1, 2011, Scandinavian To
bacco Group acquired Lane Limited in the
US (Lane) from Reynolds American, Inc.,
for 205 MUSD. Lane produces pipe tobacco,
fine cut tobacco, and little cigars.
Te second quarter
Swedish Match’s share of Scandinavian
Tobacco Group’s net profi t after interest and
tax amounted to 74 MSEK for the second
quarter. The share of net profit from Scandi
navian Tobacco Group includes restructur
ing charges amounting to 5 MSEK before
tax for the second quarter.
For premium cigars, operating profi t in
the second quarter declined versus prior
year mainly as a result of a weaker US dollar
against the Danish krone. For mass market
cigars, operating profit in the second quarter
grew significantly as a result of realized
synergies. For pipe/fine cut tobacco, exclud
ing Lane effects, operating profit was in line
with the second quarter of the prior year. Th e
Lane business delivered operating profi t and
EBITDA according to the acquisition plan.
Total Scandinavian Tobacco Group
net sales for the second quarter amounted
to 1,301 MDKK. EBITDA for total Scan
dinavian Tobacco Group in the second
quarter amounted to 279 MDKK. Excluding
restructuring charges, EBITDA amounted
to 287 MDKK for the second quarter. Th e
operating profit, excluding restructuring
charges, amounted to 208 MDKK for the
second quarter. Excluding Lane and re
structuring costs, operating profi t increased
by 14 percent and EBITDA increased by
10 percent compared to the estimated pro
forma in the second quarter of 2010.
T e first six months
Swedish Match’s share of Scandinavian
Tobacco Group’s net profi t after interest and
tax amounted to 139 MSEK for the fi rst six
months. The share of net profit from Scandi
navian Tobacco Group includes restructur
ing charges amounting 9 MSEK before tax
for the first six months. Total Scandinavian
Tobacco Group net sales for the fi rst six
months amounted to 2,595 MDKK. EBITDA
for total Scandinavian Tobacco Group in the
first six months amounted to 514 MDKK.
Excluding restructuring charges, EBITDA
amounted to 530 MDKK for the fi rst six
months. The operating profit, excluding re
structuring charges, amounted to 377 MDKK
for the first six months. Excluding Lane and
restructuring costs, operating profi t increased
by 17 percent and EBITDA increased by 15
percent compared to the estimated pro forma
for the first six months of 2010.
Taxes
For the first half of the year, the reported
tax expense amounted to 290 MSEK (309),
corresponding to a tax rate of 20.1 percent
(21.1). The reported tax rate excluding one
time items as well as profit and loss impact
from associated companies and joint ven
tures was approximately 22 percent (22).
Earnings per share
Basic earnings per share (EPS) for the sec
ond quarter amounted to 2.94 SEK (2.78),
while diluted EPS was 2.92 SEK (2.78). EPS
for the first six months of the year amounted
to 5.44 SEK (5.04), while diluted EPS was
5.41 SEK (5.03).
Depreciation and amortization
In the second quarter, total depreciation and
amortization amounted to 70 MSEK (70), of
which depreciation on property, plant and
equipment amounted to 56 MSEK (57) and
amortization of intangible assets amounted
to 14 MSEK (13).
In the first six months, total depreciation
and amortization amounted to 139 MSEK
(143), of which depreciation on property,
plant and equipment amounted to 111
MSEK (116) and amortization of intangible
assets amounted to 28 MSEK (28).
Financing and cash fl ow
Cash flow from operating activities for the
first six months amounted to 1,228 MSEK
compared with 1,116 MSEK for the same
period previous year. The main reasons for
the increase in cash flow from operations in
the first half of 2011 compared to the same
period 2010 are somewhat lower taxes paid,
improved cash flow from changes in work
ing capital and timing of interest payments.
Investments in property, plant and
equipment during the first six months
amounted to 132 MSEK (197, whereof 25
MSEK pertained to businesses transferred
to STG).
Net finance cost for the first six months
increased to 259 MSEK (235). Th e net
finance cost of 2010 includes bondholder
consent fees of 21 MSEK related to the STG
transaction. The underlying increase in the
finance cost was mainly a result of a higher
net debt and higher interest rates. During
the period a loan repayment of 140 MSEK
was received from STG following fi nal
transaction adjustments.
The net debt as per June 30, 2011
amounted to 8,699 MSEK compared to
7,650 MSEK at December 31, 2010.
In the first half of the year, Swedish
Match paid dividends totaling 1,152
MSEK and repurchased shares, net, in the
amount of 1,114 MSEK. During the fi rst six
months new bond loans of 133 MSEK were
issued. Repayment of loans for the same
period amounted to 497 MSEK including
repurchase of 141 MSEK of bond loans
with shorter maturities. As at June 30, 2011
Swedish Match had 9,524 MSEK of interest
bearing debt excluding retirement benefi t
obligations compared to 9,885 MSEK at
December 31, 2010. During the remainder
of 2011, 187 MSEK of this debt falls due for

9
repayment. As of June 30, 2011, Swedish
Match had 1,468 MSEK in unutilized com
mitted credit lines.
Cash and cash equivalents amounted
to 1,801 MSEK at the end of the period,
compared with 3,275 MSEK at December
31, 2010.
Average number of employees
The average number of employees in the
Group during the first half of 2011 was 3,902
compared with 3,908 for the full year 2010,
excluding employees transferred to STG.
Share structure
During the first quarter, Swedish Match
repurchased 5.9 million shares for 1,180
MSEK at an average price of 199.60 SEK,
following authorization from the Annual
General Meeting held in 2010. No shares
were repurchased during the second quarter.
During the first quarter the Company sold
0.5 million treasury shares at an average
price of 127.10 SEK, totaling 67 MSEK, as
a result of option holders exercising op
tions. No options were exercised during the
second quarter. Total shares bought back by
Swedish Match since the buyback program
started have been repurchased at an average
price of 96.55 SEK. In accordance with the
resolution at the Annual General Meeting on
May 2, 2011, 18 million shares held in trea
sury have been cancelled. The total number
of registered shares in the Company aft er the
cancellation of shares is 213.0 million.
As per June 30, 2011 Swedish Match held
3.6 million shares, corresponding to 1.69
percent of the total number of shares. Th e
number of shares outstanding, net as per June
30, 2011, amounted to 209.4 million. Th e
Company has issued call options of which an
amount corresponding to 5.0 million shares
exercisable in gradual stages from 2011-2015
were outstanding as of June 30, 2011.
Outlook
During the remainder of 2011 Swedish
Match will continue to invest for growth.
During the second half of the year
Swedish Match will increase its invest
ments in Swedish snus in new markets, in
the US, as well as in our joint venture with
PMI for other geographies. We expect both
the snus market in Scandinavia and the
snuff market in the US to continue to grow
versus prior year in volume terms.
In our US mass market cigar business we
expect continued strong momentum, with
increased sales and profits in local currency
driven by innovative product introductions.
The trend for US chewing tobacco of declin
ing volumes is expected to continue.
The tax rate from continuing operations
for 2010, excluding one time items and STG
effects, was 22 percent and is expected to be
at a similar level in 2011.
The Company maintains its long term
financial strategy and dividend policy, and
remains committed to returning cash not
needed in operations to shareholders.
Risk factors
Swedish Match faces intense competition in
all of its markets and for each of its products
and such competition may increase in the
future. In order to be successful the Group
must promote its brands successfully and
anticipate and respond to new consumer
trends. Restrictions on advertising and
promotion may, however, make it more dif
ficult to counteract loss of consumer loyalty.
Competitors may develop and promote
new products which could be successful,
and could thereby have an adverse eff ect on
Swedish Match results of operations.
Swedish Match has a substantial part of
its production and sales in the US as well
as in Brazil, Norway and EMU member
countries. Consequently, changes in
exchange rates of euro, Norwegian krona,
Brazilian real and in particular the US dollar
may adversely affect the Group’s results of
operations, cash fl ow, fi nancial condition
or relative price competitiveness in the
future. Such effects may occur both in local
currencies and when such local currencies
are translated into Swedish currency for
purposes of fi nancial reporting.
Regulatory and fiscal changes related
to tobacco and other taxes, as well as to the
marketing, sale and consumption of tobacco
products, in the countries where the Group
is operating may have an adverse eff ect on
Swedish Match results of operations.
For a further description of risk factors
affecting Swedish Match, see the Report
of the Board of Directors in the published
Swedish Match annual report for 2010.
Swedish Match AB (publ)
Swedish Match AB (publ) is the Parent
Company of the Swedish Match Group.
Sales in the Parent Company, for the
first six months amounted to 26 MSEK (29).
Profit before income tax amounted to 231
MSEK (630) and net profit for the fi rst six
months amounted to 390 MSEK (766).
The main sources of income for the
Parent Company are dividends and Group
contributions from subsidiaries. During the
period the Parent Company received divi
dends amounting to 2,091 MSEK (1,152).
An impairment loss on shares in subsidiaries
of 1,143 MSEK was recognized during the
second quarter as a result of dividends paid
out of retained earnings from subsidiaries.
Part of the Group’s treasury operations
are included in the operations of the Parent
Company and include the major part of the
Group’s external borrowings. Th e majority
of these loans have fixed interest rates and
hence any changes in interest rates would
have an immaterial impact on the result of
the Parent Company.
No capital expenditures on tangible
fixed assets have been recognized during the
first six months of 2011, nor during 2010.
During the period 9 MSEK (13) have been
capitalized in intangible assets as an invest
ment in software development on an ERP
system for the Group.
A shareholder contribution was provid
ed to the joint venture, SMPM International,
in the amount of 15 MSEK. Since the joint
venture company is in a phase of build up
and therefore not generating any profi t, an
impairment loss of 9 MSEK was recognized
during the period.
The total cash flow for the fi rst six
months was zero (0) as the Parent Company
does not hold any cash and bank balances.
During the first six months, new bond
loans of 133 MSEK were issued and repay
ment of loans amounted to 497 MSEK. Dur
ing the period the Parent Company made
share repurchases of 1,180 MSEK (556) and
sold 0.5 million (0.5) treasury shares for
67 MSEK (53). Dividend of 1,152 MSEK
(1,089) have been paid during the period.

10 / January–June 2011
Forward-looking information
This report contains forward-looking infor
mation based on the current expectation of
the Swedish Match Group’s management.
Although management deems that the
expectations presented by such forward-
looking information are reasonable, no
guarantee can be given that these expecta
tions will prove correct. Accordingly, the ac
tual future outcome could vary considerably
compared to what is stated in the forward-
looking information, due to such factors
as changed market conditions for Swedish
Match’s products and more general condi
tions regarding business cycles, market and
competition, changes in legal requirements
and other political measures, and fl uctua
tion in exchange rates.
Additional information
This report has not been reviewed by
the Company’s auditors. Th e January–
September 2011 report will be released on
October 26.
The Board of Directors and the CEO declare that the half year report gives a true and fair view of the operations, position and result of
the Company and the Group and describes the major risks and uncertainties of the Company and the companies in the Group.
Stockholm, July 20, 2011
Conny Karlsson Chairman
Andrew Cripps Deputy Chairman
Kenneth Ek Board member
Karen Guerra Board member
Eva Larsson Board member
Joakim Lindström Board member
Robert F. Sharpe Board member
Meg Tivéus Board member
Joakim Westh Board member
Lars Dahlgren President and CEO
Key data All key data for 2010, with the exception of share data, have been calculated reversing all effects from reporting assets and liabilities as held for sale between January 15, 2010 and October 1, 2010 and excluding larger one time items .
January–June 12 months Full yearended
2011 2010 June 30, 2011 2010
25.2 Operating margin, % 30.4 23.5 28.6
Operating capital, MSEK 7,024 8,928 7,024 7,099
Return on operating capital, % 43.8 44.0
EBITDA, MSEK1) 1,836 1,843 3,806 3,813
EBITA, MSEK2) 1,725 1,693 3,559 3,527
Net debt, MSEK 8,699 8,185 8,699 7,650
Net debt/EBITA2) 2.4 2.2
Investments in property, plant and equipment, MSEK3) 132 197 246 311
EBITA interest cover 7.0 8.5 6.4 7.0
Excluding businesses transferred to STG and share of net profi t/loss in STG
EBITA, MSEK2) 1,586 1,473 3,322 3,209
Net debt/EBITA2) 2.6 2.4
Share data
Earnings per share, basic, SEK 5.44 5.04 13.64 13.12
Earnings per share, diluted, SEK 5.41 5.03 13.58 13.09
Number of shares outstanding at end of period 209,408,074 228,317,500 209,408,074 214,797,106
Average number of shares outstanding, basic 211,107,994 229,075,760 216,347,952 225,331,835
Average number of shares outstanding, diluted 212,264,437 229,588,580 217,343,211 225,969,047
1) Operating profit adjusted for depreciation, amortization and write-downs of tangible and intangible assets. 2) Operating profit adjusted for amortization and write-downs of intangible assets. 3) Including investments in forest plantations of 13 MSEK (12).
April–June Change January–June Change 12 months Full year Change
ended MSEK 2011 2010 % 2011 2010 % June 30, 2011 2010 %
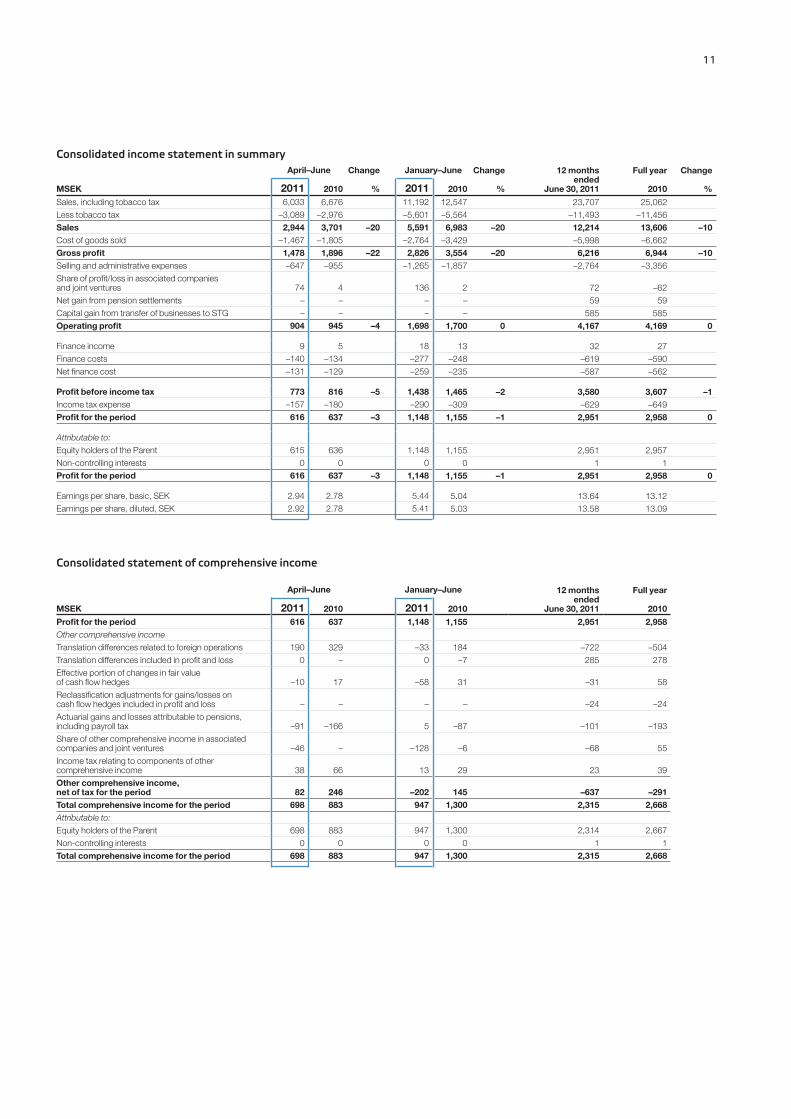
Sales, including tobacco tax 6,033 6,676 11,192 12,547 23,707 25,062
Less tobacco tax –3,089 –2,976 –5,601 –5,564 –11,493 –11,456
Sales 2,944 3,701 –20 5,591 6,983 –20 12,214 13,606 –10
Cost of goods sold –1,467 –1,805 –2,764 –3,429 –5,998 –6,662
Gross profi t 1,478 1,896 –22 2,826 3,554 –20 6,216 6,944 –10
Selling and administrative expenses –647 –955 –1,265 –1,857 –2,764 –3,356
Share of profi t/loss in associated companies and joint ventures 74 4 136 2 72 –62
Net gain from pension settlements – – – – 59 59
Capital gain from transfer of businesses to STG – – – – 585 585
Operating profi t 904 945 –4 1,698 1,700 0 4,167 4,169 0
Finance income 9 5 18 13 32 27
Finance costs –140 –134 –277 –248 –619 –590
Net fi nance cost –131 –129 –259 –235 –587 –562
Profit before income tax 773 816 –5 1,438 1,465 –2 3,580 3,607 –1
Income tax expense –157 –180 –290 –309 –629 –649
Profit for the period 616 637 –3 1,148 1,155 –1 2,951 2,958 0
Attributable to:
Equity holders of the Parent 615 636 1,148 1,155 2,951 2,957
Non-controlling interests 0 0 0 0 1 1
Profit for the period 616 637 –3 1,148 1,155 –1 2,951 2,958 0
Earnings per share, basic, SEK 2.94 2.78 5.44 5.04 13.64 13.12
Earnings per share, diluted, SEK 2.92 2.78 5.41 5.03 13.58 13.09
April–June January–June 12 months Full year ended
MSEK 2011 2010 2011 2010 June 30, 2011 2010
Profit for the period 616 637 1,148 1,155 2,951 2,958
Other comprehensive income
Translation differences related to foreign operations 190 329 –33 184 –722 –504
Translation differences included in profi t and loss 0 – 0 –7 285 278
Effective portion of changes in fair value of cash fl ow hedges –10 17 –58 31 –31 58
Reclassifi cation adjustments for gains/losses on cash fl ow hedges included in profi t and loss – – – – –24 –24
Actuarial gains and losses attributable to pensions, including payroll tax –91 –166 5 –87 –101 –193
Share of other comprehensive income in associated companies and joint ventures –46 – –128 –6 –68 55
Income tax relating to components of other comprehensive income 38 66 13 29 23 39
Other comprehensive income, net of tax for the period 82 246 –202 145 –637 –291
Total comprehensive income for the period 698 883 947 1,300 2,315 2,668
Attributable to:
Equity holders of the Parent 698 883 947 1,300 2,314 2,667
Non-controlling interests 0 0 0 0 1 1
Total comprehensive income for the period 698 883 947 1,300 2,315 2,668
11
Consolidated income statement in summary
Consolidated statement of comprehensive income

12 / January–June 2011
Consolidated balance sheet in summary
MSEK June 30, 2011 December 31, 2010
Intangible assets 968 1,027
Property, plant and equipment 2,084 2,097
Investments in associated companies and joint ventures 4,183 4,085
Other non-current fi nancial receivables1) 1,336 1,368
Current operating assets 2,869 2,886
Other current investments and current fi nancial assets 1 1
Cash and cash equivalents 1,801 3,275
Total assets 13,242 14,739
Equity attributable to equity holders of the Parent –1,803 –484
Non-controlling interests 2 2
Total equity –1,801 –482
Non-current provisions 1,029 1,050
Non-current loans 8,374 9,209
Other non-current fi nancial liabilities2) 1,344 1,478
Current provisions 86 98
Current loans 1,108 525
Other current liabilities3) 3,103 2,861
Total equity and liabilities 13,242 14,739
1) Includes pension assets of 113 MSEK (117) and derivative financial instruments of 73 MSEK (88) used to hedge the Parent Company’s bond
loans denominated in euro. 2) Includes pension liabilities of 1,090 MSEK (1,158) and derivative financial instruments of 108 MSEK (222) used to hedge the Parent
Company’s bond loans denominated in euro. 3) Includes current financial derivatives of 7 MSEK (18) used to hedge the Parent Company’s bond loans denominated in euro.
Consolidated cash flow statement in summary January–June
MSEK 2011 2010
Operating activities
Profit before income taxes 1,438 1,465
Adjustment for share of net profi t/loss in associated companies and joint ventures –136 –2
Adjustments for other non-cash items and other 214 63
Income tax paid –332 –354
Cash flow from operating activities before changes in working capital 1,185 1,171
Cash fl ow from changes in working capital 43 –55
Net cash from operating activities 1,228 1,116
Investing activities
Purchase of property, plant and equipment –132 –197
Proceeds from sale of property, plant and equipment 1 6
Purchase of intangible assets –9 –20
Investments in associated companies and joint ventures1) –15 –110
Investments in other companies2) –4 –
Proceed from sale of subsidiaries, net of cash disposed of3) 143 –
Changes in fi nancial receivables etc. 1 0
Net cash used in investing activities –14 –322
Financing activities
Changes in loans –364 –392
Dividend paid to equity holders of the Parent –1,152 –1,089
Repurchase of own shares –1,180 –556
Stock options exercised 67 53
Other –7 12
Net cash used in fi nancing activities –2,636 –1,971
Net decrease in cash and cash equivalents –1,422 –1,177
Cash and cash equivalents at the beginning of the period 3,275 2,530
Effect of exchange rate fl uctuations on cash and cash equivalents –52 –25
Less cash and cash equivalents reclassifi ed as assets held for sale – –87
Cash and cash equivalents at the end of the period 1,801 1,242
1) 2011 pertains to additional investment of 15 MSEK in SMPM International. 2010 pertains to acquisition of 20 percent of the shares in
Caribbean Cigar Holdings Group, S.A. in an amount of 110 MSEK. Te holding in Caribbean Cigars Holdings Group, S.A. was transferred to
STG on October 1, 2010. 2) 2011 pertains to acquisition of 13 percent of the shares in Green Cross Europe AB in an amount of 4 MSEK. 3) Te cash flows from sale of subsidiaries during the first half of 2011 pertain to the repayment of loans from STG of 140 MSEK following fi nal
transaction adjustments. Furthermore, in the beginning of June 2011, Swedish Match sold Swedish Match Plam Bulgaria DA to Euro Fire
Products Ltd. for a total purchase price of 12 MSEK. Divested net assets, including accumulated translations reserve, amounted to 12 MSEK,
whereof cash and cash equivalents amounted to 3 MSEK. At completion of the transaction, 6 MSEK of the purchase price was received in cash.

Parent Company income statement in summary January–June
MSEK 2011 2010
Sales 26 29
Selling and administrative expenses –102 –152
Operating loss –76 –123
Result from participation in Group companies 849 1,152
Result from participation in joint ventures –9 –7
Net fi nance cost –533 –392
Profit before income tax 231 630
Income tax 159 136
Profit for the period 390 766
Parent Company statement of comprehensive income January–June
MSEK 2011 2010
Profit for the period 390 766
Other comprehensive income
Effective portion of changes in fair value of cash fl ow hedges –58 31
Income tax relating to components of other comprehensive income 15 –8
Other comprehensive loss/income, net of tax for the period –43 23
Total comprehensive income for the period 347 789
Parent Company balance sheet in summary
13
Change in shareholders’ equity Equity attributable to Non-controlling
MSEK holders of the Parent interests Total equity
Equity at January 1, 2010 899 4 903
Profi t for the period 1,155 0 1,155
Other comprehensive income, net after tax for the period 145 0 145
Total comprehensive income for the period 1,300 0 1,300
Dividend –1,089 0 –1,089
Repurchase of own shares –556 – –556
Stock options exercised 53 – 53
Cancellation of shares –31 – –31
Bonus issue 31 – 31
Equity at June 30, 2010 606 5 611
Equity at January 1, 2011 –484 2 –482
Profi t for the period 1,148 0 1,148
Other comprehensive income, net after tax for the period –202 0 –202
Total comprehensive income for the period 947 0 947
Dividend –1,152 0 –1,152
Repurchase of own shares –1,180 – –1,180
Stock options exercised 67 – 67
Cancellation of shares –30 – –30
Bonus issue 30 – 30
Equity at June 30, 2011 –1,803 2 –1,801
MSEK June 30, 2011 June 30, 2010 Dec 31, 2010
Intangible and tangible fi xed assets 51 15 45
Non-current fi nancial assets 49,524 50,723 50,667
Current assets 297 260 2,353
Total assets 49,872 50,998 53,064
Equity 19,660 22,426 21,578
Untaxed reserves 1 0 1
Provisions 113 36 114
Non-current liabilities 26,707 25,676 27,606
Current liabilities 3,391 2,859 3,765
Total liabilities 30,211 28,571 31,485
Total equity and liabilities 49,872 50,998 53,064
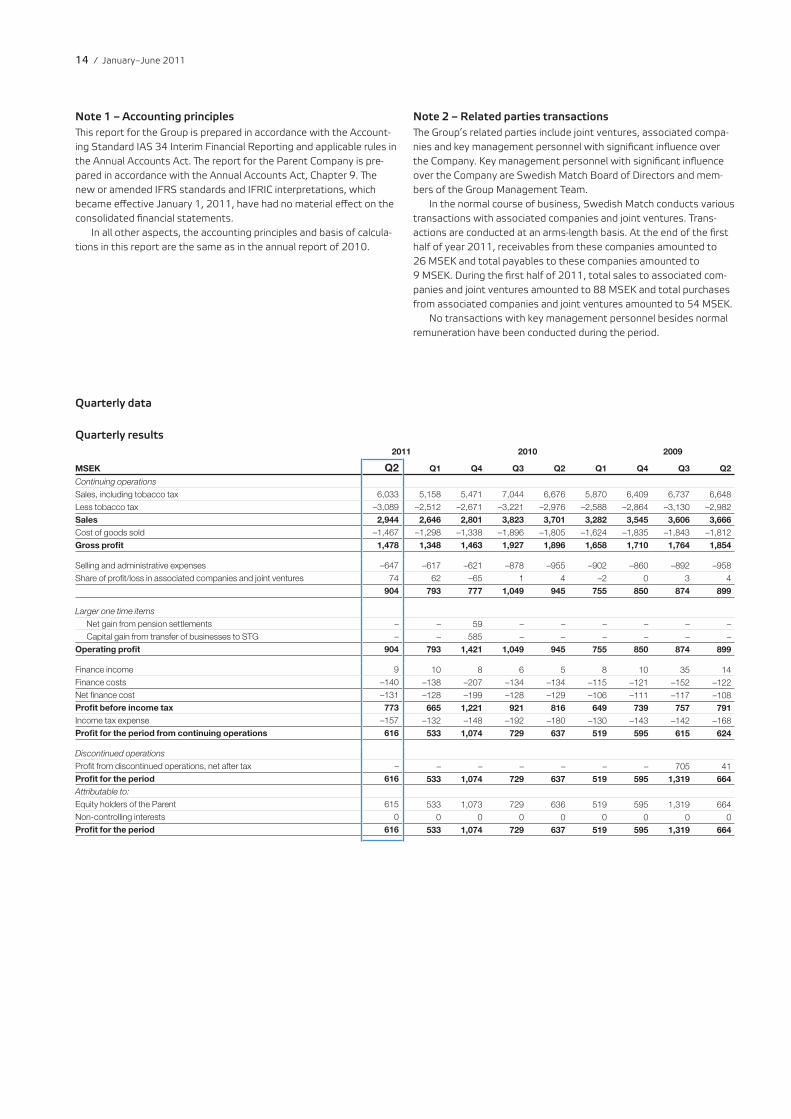
Quarterly results 2011 2010 2009
MSEK Q1 Q4 Q3 Q2 Q1 Q4 Q3 Q2
Continuing operations
Sales, including tobacco tax 6,033 5,158 5,471 7,044 6,676 5,870 6,409 6,737 6,648
Less tobacco tax –3,089 –2,512 –2,671 –3,221 –2,976 –2,588 –2,864 –3,130 –2,982
Sales 2,944 2,646 2,801 3,823 3,701 3,282 3,545 3,606 3,666
Cost of goods sold –1,467 –1,298 –1,338 –1,896 –1,805 –1,624 –1,835 –1,843 –1,812
Gross profi t 1,478 1,348 1,463 1,927 1,896 1,658 1,710 1,764 1,854
Selling and administrative expenses –647 –617 –621 –878 –955 –902 –860 –892 –958
Share of profi t/loss in associated companies and joint ventures 74 62 –65 1 4 –2 0 3 4
904 793 777 1,049 945 755 850 874 899
Larger one time items
Net gain from pension settlements – – 59 – – – – – –
Capital gain from transfer of businesses to STG – – 585 – – – – – –
Operating profi t 904 793 1,421 1,049 945 755 850 874 899
Finance income 9 10 8 6 5 8 10 35 14
Finance costs –140 –138 –207 –134 –134 –115 –121 –152 –122
Net fi nance cost –131 –128 –199 –128 –129 –106 –111 –117 –108
Profit before income tax 773 665 1,221 921 816 649 739 757 791
Income tax expense –157 –132 –148 –192 –180 –130 –143 –142 –168
Profit for the period from continuing operations 616 533 1,074 729 637 519 595 615 624
Discontinued operations
Profi t from discontinued operations, net after tax – – – – – – – 705
Profit for the period 616 533 1,074 729 637 519 595 1,319 664
Attributable to:
Equity holders of the Parent 615 533 1,073 729 636 519 595 1,319 664
Non-controlling interests 0 0 0 0 0 0 0 0 0
Profit for the period 616 533 1,074 729 637 519 595 1,319 664
14 / January–June 2011
Note 1 – Accounting principles Tis report for the Group is prepared in accordance with the Account
ing Standard IAS 34 Interim Financial Reporting and applicable rules in
the Annual Accounts Act. Te report for the Parent Company is pre
pared in accordance with the Annual Accounts Act, Chapter 9. T e
new or amended IFRS standards and IFRIC interpretations, which
became effective January 1, 2011, have had no material effect on the
consolidated fi nancial statements.
In all other aspects, the accounting principles and basis of calcula
tions in this report are the same as in the annual report of 2010.
Quarterly data
Q2
Note 2 – Related parties transactions Te Group’s related parties include joint ventures, associated compa
nies and key management personnel with signifi cant infl uence over
the Company. Key management personnel with signifi cant infl uence
over the Company are Swedish Match Board of Directors and mem
bers of the Group Management Team.
In the normal course of business, Swedish Match conducts various
transactions with associated companies and joint ventures. Trans
actions are conducted at an arms-length basis. At the end of the fi rst
half of year 2011, receivables from these companies amounted to
26 MSEK and total payables to these companies amounted to
9 MSEK. During the first half of 2011, total sales to associated com
panies and joint ventures amounted to 88 MSEK and total purchases
from associated companies and joint ventures amounted to 54 MSEK.
No transactions with key management personnel besides normal
remuneration have been conducted during the period.
41

2011 2010 2009
Percent Q2 Q1 Q4 Q3 Q2 Q1 Q4 Q3 Q2
Snus and snuff 45.3 44.0 48.1 50.4 43.6 41.2 47.5 48.8 42.6
Other tobacco products 44.4 41.9 37.4 41.0 40.7 34.7 29.9 29.6 40.9
Lights 13.9 17.3 23.0 16.3 19.6 18.7 26.6 21.3 20.4
Comparable Group operating margin2) 28.2 27.5 29.9 29.5 27.8 25.1 28.3 27.3 27.1
Group operating margin, including businesses transferred to STG and share of net profit/loss in STG3) 30.7 30.0 27.7 26.6 24.6 22.2 24.0 24.2 24.5
15
Quarterly data, cont.
Sales by product area 2011 2010 2009
MSEK Q2 Q1 Q4 Q3 Q2 Q1 Q4 Q3 Q2
Snus and snuff 1,193 1,068 1,178 1,174 1,116 1,054 1,101 1,093 1,087
Other tobacco products 613 583 557 631 664 588 456 571 617
Lights 313 336 379 352 347 351 373 341 337
Other operations 826 659 687 806 722 615 690 742 711
Comparable Group sales 2,944 2,646 2,801 2,964 2,849 2,608 2,620 2,747 2,752
Businesses transferred to STG1) – – – 859 852 674 925 859 914
Total 2,944 2,646 2,801 3,823 3,701 3,282 3,545 3,606 3,666
1) Sales for businesses transferred to STG for 2009 and in the first nine months of 2010, net of inter-company sales eliminations.
Operating profit by product area 2011 2010 2009
MSEK Q2 Q1 Q4 Q3 Q2 Q1 Q4 Q3 Q2
Snus and snuff 540 469 567 592 487 434 523 534 463
Other tobacco products 272 245 208 259 270 204 136 169 252
Lights 44 58 87 58 68 66 100 72 69
Other operations –26 –43 –26 –35 –32 –48 –18 –25 –39
Comparable Group operating profi t 829 729 836 874 793 655 740 750 745
Share of net profi t/loss in STG1) 65 –60 – – – – – –
Businesses transferred to STG2) – – – 143 118 73 109 124 155
Subtotal 904 793 777 1,017 911 728 850 874 899
Net gain from pension settlements – – 59 – – – – – –
Capital gain from transfer of businesses to STG – – 585 – – – – – –
Reversal of depreciation and amortizations relating to assets held for sale – – – 32 34 27 – – –
Total larger one time items – – 644 32 34 27 – – –
Total 904 793 1,421 1,049 945 755 850 874 899
74
1) Te share of net profit in STG for the first six months 2011 includes restructuring charges of 9 MSEK before tax. Te share of net loss in STG in 2010 (fourth quarter) includes restructuring charges,
other transaction costs and IFRS acquisition adjustments amounting to 175 MSEK before tax. 2) Operating profit for businesses transferred to STG for 2009 and in the first nine months of 2010.
Operating margin by product area1)
1) Excluding larger one time items. 2) Excluding businesses transferred to STG and share of net profit/loss in STG, but including a restructuring charge of 45 MSEK for Other tobacco products in the third quarter of 2009. 3) Including restructuring charges of 45 MSEK in the third quarter of 2009 and 29 MSEK in the fourth quarter of 2009.

GÖTEBORGS RAPÉ
Swedish Match develops, manufactures and sells market-leading brands in the product areas Snus and snuff, Other tobacco products (US mass
market cigars and chewing tobacco) and Lights (matches and lighters). Te Group sells products across the globe, with production units in seven
countries. In addition, Swedish Match holds a 49 percent ownership of Scandinavian Tobacco Group. Swedish Match also has an independent
distribution company in Sweden. Te world market for Swedish snus and US snuff has grown significantly in value terms over the past several years.
Swedish Match generates more than a third of its sales and more than half of its operating profit from snus and snuff. Markets for other product
categories in which Swedish Match participates have been stable or declining. Te Swedish Match share is listed on the NASDAQ OMX Stockholm.
Pro
ductio
n: S
wedis
h M
atch
AB
in co
opera
tion w
ith H
allv
ars
so
n &
Halv
ars
so
n |
Pho
to: M
ag
nus F
ond a
nd S
wedis
h M
atch
|
Prin
ting: P
rint O
ne, H
alm
sta
d, 2
01
1
Swedish Match AB (publ) Box 7179
SE-103 88 Stockholm, Sweden
Visiting address: Västra Trädgårdsgatan 15
Telephone: +46 8-658 02 00
Corporate Identity Number: 556015-0756
www.swedishmatch.com
Related Documents