Welcome message from author
This document is posted to help you gain knowledge. Please leave a comment to let me know what you think about it! Share it to your friends and learn new things together.
Transcript


Hydrological and Environmental Aspects of Wetlands
“Analytical Tools for Wetlands Management in the Nile Basin”
By
Amel Azab Japhet Joel Kashaigili
Richard Oyoo Mohamed Saeed
Mohamed Bahgat Al-Sayed Diwedar Ernest Munyambi
Salumo Salmon Nagandu Balekelayi
Hategekimana Sylvere Hoda Soussa
Scientific Advisors
Prof. Ronald K. Price, (UNESCO-IHE) Dr. Zoltan Vekerdy, (ITC)
2010

Produced by the Nile Basin Capacity Building Network (NBCBN-SEC) office Disclaimer The designations employed and presentation of material and findings through the publication don’t imply the expression of any opinion whatsoever on the part of NBCBN concerning the legal status of any country, territory, city, or its authorities, or concerning the delimitation of its frontiers or boundaries. Copies of NBCBN publications can be requested from: NBCBN-SEC Office Hydraulics Research Institute 13621, Delta Barrages, Cairo, Egypt Email: [email protected] Website: www.nbcbn.com Images on the cover page are property of the publisher © NBCBN 2010

Project Title Knowledge Networks for the Nile Basin Using the innovative potential of Knowledge Networks and CoP’s in strengthening human and institutional research capacity in the Nile region. Implementing Leading Institute UNESCO-IHE Institute for Water Education, Delft, The Netherlands (UNESCO-IHE) Partner Institutes Ten selected Universities and Ministries of Water Resources from Nile Basin Countries. Project Secretariat Office Hydraulics Research Institute – Cairo - Egypt Beneficiaries Water Sector Professionals and Institutions in the Nile Basin Countries Short Description
The idea of establishing a Knowledge Network in the Nile region emerged after encouraging experiences with the first Regional Training Centre on River Engineering in Cairo since 1996. In January 2002 more than 50 representatives from all ten Nile basin countries signed the Cairo Declaration at the end of a kick-off workshop was held in Cairo. This declaration in which the main principles of the network were laid down marked the official start of the Nile Basin Capacity Building Network in River Engineering (NBCBN-RE) as an open network of national and regional capacity building institutions and professional sector organizations. NBCBN is represented in the Nile basin countries through its nine nodes existing in Egypt, Sudan, Ethiopia, Tanzania, Uganda, Kenya, Rwanda, Burundi and D. R. Congo. The network includes six research clusters working on different research themes namely: Hydropower, Environmental Aspects, GIS and Modelling, River Morphology, flood Management, and River structures. The remarkable contribution and impact of the network on both local and regional levels in the basin countries created the opportunity for the network to continue its mission for a second phase. The second phase was launched in Cairo in 2007 under the initiative of; Knowledge Networks for the Nile Basin. New capacity building activities including knowledge sharing and dissemination tools specialised training courses and new collaborative research activities were initiated. The different new research modalities adopted by the network in its second phase include; (i) regional cluster research, (ii) integrated research, (iii) local action research and (iv) Multidisciplinary research. By involving professionals, knowledge institutes and sector organisations from all Nile Basin countries, the network succeeded to create a solid passage from potential conflict to co-operation potential and confidence building between riparian states. More than 500 water professionals representing different disciplines of the water sector and coming from various governmental and private sector institutions selected to join NBCBN to enhance and build their capacities in order to be linked to the available career opportunities. In the last ten years the network succeeded to have both regional and international recognition, and to be the most successful and sustainable capacity building provider in the Nile Basin.


1 INTRODUCTION ............................................................................................................................................ 1 1.1 Introduction and Background ............................................................................................................. 1 1.2 Problem Statement ............................................................................................................................. 1 1.3 Research Objectives ........................................................................................................................... 2 1.4 Research Expected Outputs................................................................................................................ 2
2 BACKGROUND .............................................................................................................................................. 3 2.1 Concepts and Definitions ................................................................................................................... 3 2.2 Importance and Functions of Wetlands .............................................................................................. 4 2.3 Classification of Wetlands ................................................................................................................. 4 2.4 Functions and Values of Wetlands ................................................................................................... 11 2.5 Wetlands Losses and Degradation ................................................................................................... 22
3 Wetlands in the Nile Basin ............................................................................................................................. 26 3.1 Wetland Types in the Basin ............................................................................................................. 26 3.2 Distribution of the Nile wetlands ..................................................................................................... 27 3.2.1 Equatorial lakes wetland systems..................................................................................................... 27 3.2.2 Upper White Nile wetlands .............................................................................................................. 28 3.2.3 Lower Nile wetlands and ―others‖ ................................................................................................... 28 3.3 Wetland values in the Nile Basin ..................................................................................................... 28 3.4 Wetland Fisheries ............................................................................................................................. 29 3.5 Research Needs on Wetlands in the Nile Basin ............................................................................... 30 3.6 Focus on Wetlands in the Basin Countries ...................................................................................... 30 3.7 Assessment of Wetlands Degradation and Losses ........................................................................... 47 3.8 Practices for Wetlands Conservation and Restoration ..................................................................... 48
4 GIS, REMOTE SENSING AND MODELLING FOR WETLANDS MANAGEMENT ........................ 50 4.1 Review on GIS, Remote Sensing of Wetlands ................................................................................. 50 4.2 Applications of Ecological Models for Wetlands Management ...................................................... 53
4.2.1 Introduction.................................................................................................................................. 53 4.2.2 General Model Design ................................................................................................................. 53 4.2.3 Wetland Model Components ....................................................................................................... 53
5 APPLICATION OF DIFFERENT TOOLS FOR WETLANDS MANAGEMENT ................................ 60 5.1 Burullus Wetland ............................................................................................................................. 60 5.2 Nakivubo Wetlands .......................................................................................................................... 96
6 ONLINE WETLANDS MAPPING APPLICATION ............................................................................ 107
6.1 A Review on Wetlands Mapping Tools .................................................................................................. 107
Introduction ..................................................................................................................................................... 107
6.2 Importance of Developing an Online GIS Application for the Nile Basin ............................................. 110
6.3 Online Wetlands Mapper for the Nile Basin........................................................................................... 110
7 RESULTS AND RECOMMENDATIONS ............................................................................................ 121
8 REFERENCES ....................................................................................................................................... 123 List of Research Group Members

LIST OF FIGURES
Figure 2-1: The US Fish and Wildlife Service Wetlands Classification ............................................... 7 Figure 3-1: Major wetlands of Tanzania .............................................................................................. 39 Figure 4-1: The spatial design of the hydrologic component of wetland models largely determines the questions that can be addressed ........................................................................................................... 54 Figure 4-2: Nutrients are transported across space with water flows, while their fate is mediated by biological and chemical processes ....................................................................................................... 55 Figure 4-3: Plant growth, mortality, and other ecological processes respond strongly to water levels, with varying species responses leading to transitions among dominant plants in space and time ...... 55
Figure 4-4: Particulate soil matter may be differentially eroded and deposited, depending on water velocities; soils accumulate mass and height with plant mortality, but are oxidized at rates that vary significantly with water depth in the soil profile ................................................................................. 56 Figure 4-5: Motile animals can disperse to habitats with more favorable hydrologic conditions, the quality of which may affect animals physiology and their susceptibility to predation or other interactions ........................................................................................................................................... 57 Figure 4-6: Interactions among each model component are shown as process-oriented feedback (of information or matter) within an integrated wetland model ................................................................ 58 Figure 5-1: Burullus Lake and one of its fifty islands ......................................................................... 61 Figure 5-2: Reclamation activity ......................................................................................................... 61 Figure 5-3: Lake water level with respect to MSL .............................................................................. 63
Figure 5-4: Lake Inlet (El-Bughaz)...................................................................................................... 63 Figure 5-5: Drains locations................................................................................................................. 64 Figure 5-6: Fishing boats inside the fishing port ................................................................................. 68 Figure 5-7: Fish farm ........................................................................................................................... 69 Figure 5-8: Ship Yard .......................................................................................................................... 69 Figure 5-9: Measuring Instruments ...................................................................................................... 71 Figure 5-10: Sampling points in Burullus Lake ................................................................................... 73 Figure 5-11: PH concentration ............................................................................................................ 75 Figure 5-12: Analysis of PH ................................................................................................................ 75 Figure 5-13: Analysis of Hco3 ............................................................................................................. 76 Figure 5-14: Analysis of TS ................................................................................................................. 76 Figure 5-15: Analysis of EC ................................................................................................................ 77
Figure 5-16: Analysis of TDS .............................................................................................................. 78 Figure 5-17: Analysis of total hardness ............................................................................................... 79
Figure 5-18: Analysis of Ca& Mg ....................................................................................................... 79 Figure 5-19: Analysis of Cl.................................................................................................................. 80 Figure 5-20: Analysis of Na ................................................................................................................. 81
Figure 5-21: Analysis of So4 ................................................................................................................ 81 Figure 5-22: Analysis of TSS .............................................................................................................. 82
Figure 5-23: Analysis of Turbidity ...................................................................................................... 82 Figure 5-24: Turbidity in the Lake....................................................................................................... 83 Figure 5-25: Impact of Turbidity on aquatic organisms ...................................................................... 83 Figure 5-26: Analysis of BOD ............................................................................................................. 84
Figure 5-27: Analysis of COD ............................................................................................................. 84 Figure 5-28: Analysis of Cu ................................................................................................................. 85 Figure 5-29: Model validation ............................................................................................................. 92 Figure 5-30: Case 1 .............................................................................................................................. 93 Figure 5-31: Case 2 .............................................................................................................................. 93

Figure 5-32: Case 3 .............................................................................................................................. 94 Figure 5-33: Case 4 .............................................................................................................................. 94 Figure 5-34: Case 5 .............................................................................................................................. 95 Figure 5-35: Case 6 .............................................................................................................................. 95 Figure 5-36: Upstream developments and encroachment of Nakivubo wetland ................................. 98 Figure 5-37: Settlements on the fringes of the Nakivubo wetlands ..................................................... 98 Figure 5-38: Diffuse pollution from settlement along the channel ...................................................... 99 Figure 5-39: Location map of Nakivubo wetland, its major inflows and Inner Murchison Bay ....... 101 Figure 5-40: Surface water quality of Nakivubo channel at the rail culvert ...................................... 102 Figure5- 41: Water quality of Nakivubo channel at the inlet to IMB ................................................ 102 Figure 5-42: Water quality within the Inner Murchison Bay along the points M1, M5, M9, M11, M16, M18, M22, M23 ................................................................................................................................. 103
Figure 5-43: Aluminium sulphate doses at Gaba water works from 1993 to 2008 ........................... 105 Figure 6-1: Examples of the developed products for the two case studies. .......................................107 Figure 6-2: Queensland online interactive wetlands mapping database ............................................108 Figure 6-3: Wetlands international-Ramsar, Web Mapper online wetlands mapping tool ...............109 Figure 6-4:Shows the web interface of the online FWS Wetlands Mapper. .....................................110 Figure 6-5: Three levels of scales included in the developed wetlands geodatabase ........................111 Figure 6-6: the regional scale level of Wetlands geo-=database .......................................................112 Figure 6-7: Local Scale, (Example, Egypt) ......................................................................................112 Figure 6-8: The existing layers in wetland area of Burullus on northern coastal zone of Egypt .......113 Figure 6-9: The developed open source online wetlands mapping version .......................................114 Figure 6-10: selection of country .......................................................................................................114
Figure 6-11: selection of wetlands locations within the country .......................................................115 Figure 6-12: selection of wetlands locations within the country .......................................................115 Figure 6-13: The main new interface of the NBWM version 2 .........................................................117 Figure 6-14: Online Editing Tool ......................................................................................................117 Figure 6-15: SQL Map Query Tool ...................................................................................................118 Figure 6-16: Simplified pan, Zoom and navigation of maps .............................................................118 Figure 6-17: distance and length measuring tool ...............................................................................119 Figure 6-18: Navigation through Maps..............................................................................................119 Figure 6-19: Layers manager tool ......................................................................................................120
LIST OF TABLES
Table 2-1Estimate area of wetlands in the world by climatic zone .......................................................5 Table 2-2 IUCN/Ramsar Convention classification ............................................................................10 Table 2-3The IUCN/Ramsar Classification and the IUCN Wetland Directory Classification merged..............................................................................................................................................................11 Table 3-1The potential wetlands areas in the Democratic Republic of Congo ...................................35 Table 5-1: Mean monthly and annual rainfall (mm) on protected area for 1912-1992 with the volume (in 106 m3) of water added to the lake.................................................................................................. 62
Table 5-2: Estimated average daily (mm) and monthly (mm/month) evaporation and monthly volume (million m3) of water loss from lake Burullus ..................................................................................... 62 Table5-3: Mean monthly air temperature (c0) and relative humidity (R.H.%) at lake Burullus. ........ 62 Table 5-4: Average water quality in the drainage for 2000/2001 ........................................................ 65
Table 5-5: average water qualities in the drainage for 2001/2002 ....................................................... 66

Table 5-6:Hotels capacity .................................................................................................................... 67 Table 5-7: Distribution of tourism in the summer months .................................................................. 67 Table 5-8: Fish production for sea and Lake ....................................................................................... 68 Table 5-9: Annual catchments per fishermen and boats for the Lake ................................................. 68 Table 5-10: Industries near Burullus Lake........................................................................................... 70 Table 5-11: measured parameters in the field and the used equipments ............................................. 71 Table 5-12: Measured parameters ........................................................................................................ 72 Table 5-13: Water Quality Parameters for 2002/2008 ......................................................................... 74 Table 5-14: PH concentration ............................................................................................................. 74 Table 5-15: Relation index ................................................................................................................... 91 Table 6-1: GIS Layers ........................................................................................................................111 Table 6-2: Comparison between the SuperMap IS VS Open Source software .................................116

This report is one of the final outputs of the research activities under the second phase of the Nile Basin Capacity Building
Network (NBCBN). The network was established with a main objective to build and strengthen the capacities of the Nile basin
water professionals in the field of River Engineering. The first phase was officially launched in 2002. After this launch the
network has become one of the most active groupings in generating and disseminating water related knowledge within the Nile
region. At the moment it involves more than 500 water professionals who have teamed up in nine national networks (In-country
network nodes) under the theme of “Knowledge Networks for the Nile Basin”. The main platform for capacity building adopted
by NBCBN is “Collaborative Research” on both regional and local levels. The main aim of collaborative research is to strengthen
the individual research capabilities of water professionals through collaboration at cluster/group level on a well-defined
specialized research theme within the field of River and Hydraulic Engineering.
This research project was developed under the “Cluster Research Modality”. This research modality is activated through
implementation of research proposals and topics under the NBCBN research clusters: Hydropower Development, Environmental
Aspects of River Engineering, GIS and Modelling Applications in River Engineering, River Morphology, flood Management, and
River structures.
This report is considered a joint achievement through collaboration and sincere commitment of all the research teams involved
with participation of water professionals from all the Nile Basin countries, the Research Coordinators and the Scientific Advisors.
Consequently the NBCBN Network Secretariat and Management Team would like to thank all members who contributed to the
implementation of these research projects and the development of these valuable outputs.
Special thanks are due to UNESCO-IHE Project Team and NBCBN-Secretariat office staff for their contribution and effort done
in the follow up and development of the different research projects activities.


Fish and Wildlife Services (FWS) Part Per Thousands (PPT) Aluminium (Al) Iron (Fe) Biological Oxygen demand (BOD) Bulogobi sewage treatment works (BSTW) National Water and Sewerage Corporation (NWSC) Electrical Conductivity (EC) Dissolved oxgen (DO) Total Nitrogin (TN) Total phosphorus (TP) Total suspended solids (TSS) Chemical oxygen demand (COD) Biological oxygen demand (BOD) National Environmental Management Authority (NEMA) Integrated coastal zone management (ICZM) Egyptian Environmental Affairs Agency (EEAA) Decision support system (DSS) Conservation on biological diversity (CBD) Global wetlands inventory mapping (GWIM) Digital image processing (DIP) Geographic information system (GIS) Global positioning systems (GPS) Relative humidity (R. H%) Mean Sea Level (MSL) Nile Basin Wetlands Mapper (NBWM)


GIS and Modelling Research Cluster 2010
Nile Basin Capacity Building Network ( NBCBN ) 1
1 INTRODUCTION
1.1 Introduction and Background
Wetlands are among the Earth‘s most productive ecosystems. The features of the system may be grouped into components, functions and attributes. Wetland systems directly support millions of people and provide goods and services to the world outside the wetland. People use wetland soils for agriculture, they catch wetland fish to eat, and they cut wetland trees for timber and fuel wood and wetland reeds to make mats and to thatch roofs. Direct use may also take the form of recreation, such as bird watching or sailing, or scientific study. For example, peat soils have preserved ancient remains of people and track ways which are of great interest to archaeologists.
Apart from using the wetlands directly, people benefit from wetland functions or services. As flood water flows out over a floodplain wetland, the water is temporarily stored; this reduces the peak river level and delays the time to peak, which can be a benefit to riparian dwellers downstream. As mangrove wetlands reduce wave energy, they protect coastal communities, and as wetlands recycle nitrogen, they improve water quality downstream. By benefiting in this way, people are making indirect use of the wetland functions. These functions may be performed by engineering schemes such as dams, sea walls or water treatment plants, but such technological solutions are normally more expensive than when performed by wetlands.
1.2 Problem Statement
The view that wetlands are wastelands, resulting from ignorance or misunderstanding of the value of the goods and services available, has led to their conversion to intensive agricultural, industrial or residential uses. Individual desires of farmers or developers have been supported by government policy and subsidies. In addition to direct action on the land, river engineering schemes have diverted water away from wetlands, as it has been believed that this water is wasted in the wetland or at least has a lower value than its use for rice irrigation upstream. Some views still look upon wetlands only in terms of their potential to provide farm land to feed an ever-expanding population, which normally requires alteration of the natural system. Wetlands may also be lost by pollution, waste disposal, mining or groundwater. Therefore there is a need to conserve and manage wetlands to retain their importance and their economic values. Management strategies and environmental policies should be developed regarding this aspect. Development of analytical tools for management of wetlands is an important part needed in the management process. This project aims at understanding the wetlands from the hydrologic and environmental point of view and the impact of human interventions on wetlands loss, pollution and degradation. The projet will study the different best management practices of wetlands applied in different Nile Basin countries. Also the project focus on applications of analytical tools for environmental management and conservation of wetlands including GIS, remote sensing and mathematical modeling. This research aims through detailed studies of wetlands in the Nile basin to develop a functional web-based mapping tool for better understanding of the different characteristics and uses of wetlands in the basin and also for dissemination of the developed knowledge for the professional communities working on wetlands.

GIS and Modelling Research Cluster 2010
Nile Basin Capacity Building Network ( NBCBN ) 2
1.3 Research Objectives
This research project aims to create a knowledge base for better understanding of the wetlands cheracteristcis in the Nile Basin, their benefits and values and the different degradation causes that threats these valuable resources. The project also focuses on highlighting the important role of GIS, Remote sensing and modeling as tools for manageing wetlands. One of the impotant main objectives was to develop a comprehensive geo-database for wetlands mapping and management purposes for the Nile basin. This database is the basic component of a developed online mapper for the Nile Basin wetlands.
The following are the specific research objectives:
1. Comprehensive literature Review on wetlands covering different aspects (types and uses , Economic values, Degradation and loss ,Practices for conservation and restoration)
2. Definition of wetlands types and uses in the Nile Basin a. Identification of wetlands in different Nile basin countries b. Identification of the benefit and values of these wetlands.
3. Development of a comprehensive geo-database for the Nile basin wetlands systems, covering the variety of classes.
4. Application of different management tools including GIS and simplified analytical tools for assessment of wetlands degradation
5. Development of an online wetlands mapper for the Nile basin, to be a part of a wetlands portal that will be developed for the Nile basin.
1.4 Research Expected Outputs
The expected outputs from the research could be summarized as follows:
Development of a comprehensive assessment study on wetlands current conditions in the Nile Basin Better understanding of the hydrological and environmental characteristics of wetlands in the basin
based on the classification system of the wetlands in the Nile basin. Identification of pollution impacts on the hydrological and environmental conditions of wetlands in
the basin based on selected case studies. Developing an online information system (wetlands mapper) as a tool for management and
conservation of wetlands. Creating a web-based platform as a wetlands portal for the Nile basin, based on developed
information system Raising awareness on importance of wetlands conservation for ecosystem equilibrium in the basin.

GIS and Modelling Research Cluster 2010
Nile Basin Capacity Building Network ( NBCBN ) 3
2
BACKGROUND
2.1 Concepts and Definitions
Wetlands are defined as lands that are flooded or saturated at or near the ground surface for varying periods of time during the year. Water comes from rainfall, snowmelt, river overflow, ocean-driven tides, rising lake levels, or ground water coming from beneath the soil surface. There are many wetland definitions - some are technical definitions used by scientists to describe and inventory wetlands, while other are regulatory definitions that define lands covered by government regulations and zoning ordinances.
1890 wetland definition One of the earliest wetland definitions used in the United States comes from an 1890 federal government report on wetlands "General Account of the Freshwater Morasses of the United States" (Nathaniel Shaler): "all wetlands in which the natural declivity is insufficient, when the forest cover is removed, to reduce the soil to the measure of dryness necessary for agriculture. Wherever any form of engineering is necessary to secure this desiccation, the area is classified as swamp." So, for a long time, wetlands have been recognized as areas that are too wet to farm or too wet to build upon without draining or filling.
Presently, there are two definitions in wide use in the United States. One is the U.S. Fish and Wildlife Service's (FWS) definition used for conducting the National Wetlands Inventory, a government program that is mapping wetlands across the country. The other is the federal regulatory wetland definition used to identify wetlands subject to federal regulations under the Clean Water Act. These definitions are given below.
FWS definition Note that the FWS definition includes both vegetated and non-vegetated habitats in its definition, while the federal regulatory definition emphasizes vegetation and therefore only includes vegetated wetlands. FWS definition: "Wetlands are lands transitional between terrestrial and aquatic systems where the water table is usually at or near the surface or the land is covered by shallow water. For purposes of this classification wetlands must have one or more of the following three attributes: (1) at least periodically the land supports predominantly hydrophytes; (2) the substrate is predominantly undrained hydric soil; and (3) the substrate is non-soil and is saturated with water or covered by shallow water at some time during the growing season of each year‖. Hydrophytes are plants capable of growing in water or waterlogged soils/substrates; hydric soils are waterlogged soils that support plant growth; non-soil is a non-vegetated substrate like a mudflat or rock outcrop. Federal Regulatory definition The Federal Regulatory definition states that: Wetlands are "those areas that are inundated or saturated at a frequency and duration sufficient to support, and that under normal circumstances do support, a prevalence of vegetation typically adapted for life in saturated soil conditions. Wetlands generally include swamps, marshes, bogs and similar areas."
Despite the recognition of the role that wetlands play, losses continue at global level. This has led wetlands to being described as most threatened of ecosystems. One main reason of wetlands loss is the lack of awareness of the value of these systems and this may result in unrecognized social costs (Clouston EM, 2002,

GIS and Modelling Research Cluster 2010
Nile Basin Capacity Building Network ( NBCBN ) 4
Hategekimana, 2005). Wetland loss and degradation through hydrologic alteration by man has occurred historically through such actions as: drainage, dredging, stream channelization, ditching, levees, and deposition of fill material, stream diversion, ground water withdrawal, and impoundment.
2.2 Importance and Functions of Wetlands
Wetlands perform a number of very important functions in the hydrological cycle of this planet. They have a role in flood management and groundwater recharge, they are important determinants of water quality in coastal areas and in rivers and lakes, and they affect the carbon dioxide balance through their vegetation and have micro-climatic effects. Furthermore, many wetlands harbour a rich biodiversity in the form of, e.g., populations of birds, but also other animals and plants. All these functions are related to wetlands as natural ecosystems.
2.2.1. Socio-economic values and functions
Apart from these natural functions, wetlands are also important for the millions of people who depend on wetlands for their food and income. They harvest wetland products like plants or fish, or they produce food crops through wetland agriculture. Some people living in or close to wetlands derive an income from tourists visiting the wetland. Therefore, the importance of wetlands results from their ecological and their socio-economic functions.
2.2.2. Human interference with wetlands
Whenever human beings interfere in natural systems like wetlands, there is a risk that damage is done to the wetland. Especially in the past, when wetlands were often considered as wastelands with little value, a lot of damage to wetlands was done. It is estimated that about 50% of the wetlands originally present on the earth by now have disappeared. Growing populations, producing a wide range of waste products and pollution have increasingly put pressure on wetlands. This has led to the deterioration of natural wetland ecosystems, e.g., through eutrophication and introduction of exotic species. Global climate change has also had an effect on the integrity of wetland ecosystems. The Millennium Ecosystem Assessment shows that approximately 20% of the World‘s coral reefs were lost and an additional 20% were degraded in the last several decades of the 20th century. Approximately 35% of mangrove area was lost during this time. Since data are only available from countries with sufficient information, these figures are probably a low estimate. More land was converted to agricultural land since 1945 than in the 18th and 19th centuries combined. Biodiversity, expressed in the size of populations and range of taxonomic groups is declining. The distribution of species is becoming more homogeneous, while the number of species is declining. Currently, some 10 to 30% of mammal, bird and amphibian species are threatened by extinction. Also genetic diversity is declining.
2.3 Classification of Wetlands
Wetlands are generally defined as areas of submerged or saturated land, whether natural or artificial, permanent or temporary, whether the water is static or flowing, fresh, brackish or salt. They include marshes, sloughs, bogs, mires, fens, peat lands, rivers, floodplains, inner-deltas, lakes, reservoirs, ponds, potholes, estuaries, bays, deltas, Lakes. Where marine or coastal waters are involved, waters up to a depth of 15 m. (sometimes 50 m.) are included. The total area of wetlands (forested and non-forested) is estimated to be between 200-8558 106 ha or about 3%-6.4% of the land surface. Some 60% are thought to be forested. It appears that the tropical region contains many more wetlands than the temperate and boreal region together, 160-189 106 ha versus 50-90 106 ha respectively, see table (2-1). A wide variety of classification systems and criteria has been developed over the past decades. Most systems do not show any major differences, and are

GIS and Modelling Research Cluster 2010
Nile Basin Capacity Building Network ( NBCBN ) 5
all based on the same general criteria for hydrology and water characteristics, such as salt/freshwater, water level fluctuations and triggering forcing factors. The lack of criteria for climatic zones and tropical/non-tropical wetlands is remarkable. The differences in and between classifications systems can be regarded as the differences between the priorities given to the criteria for which the classification takes place. All general classification systems have their own advantages and disadvantages. A classification system which meets the requirements for which it is designed should be drawn up with care. In general, classification serves the purpose of inventories and overviews or state-of-the-art assessments. Problem identification can be initiated from inventories and overviews. We should keep in mind, however, that in some classification systems the final problem identification can be hampered by the type of classification chosen. If, for example, we would wish to get an overview of the formal protected status versus the actual practice of protection of wetlands, a classification based on water types and water resource types would be rather futile. A major drawback of all classification systems is that they never fit a particular wetland exactly. A general problem is that some users of the classification system regard their wetland area as one unit to be classified, whereas the classification system distinguishes between various units. A coastal wetland area can, for instance, include marine parts, palustrine parts, subtidal and intertidal parts. So, although the user who is interested in classification sees his/her wetland as an integral unit, the classification system may, by criteria priority, split up the unit in various systems, sub-systems and classes. Secondly, it should be understood that other users of the classification may regard different criteria important. In the next three paragraphs, a classification system will be described which aims to be as objective as possible. We realize, however, that this system also has its drawbacks. The IUCN/RAMSAR classification could be used as the central classification, which can be taken as an attempt to improve and to adapt the US Fish and Wildlife Service Classification for world-wide use.
Table 2-1: Estimate area of wetlands in the world by climatic zone (Source: based on data from Maltby and Turner, 1983)
Zoon Climate Wetland area Km2 * 1000
Percent of total Land area
Polar Humid; semi-humid 200 2.5 Boreal Humid; semi-humid 2558 11 Subboreal Humid 539 7.3 Semi-Arid 342 4.2 Arid 136 1.9 Subtropical Humid 1077 17.2 Semi-Arid 629 7.6 Arid 439 4.5 Tropical Humid 2317 8.7 Semi-Arid 221 1.4 Arid 100 0.8 World Total 8558 6.4
Us Fish and Wildlife Service Classification
In order to make a world-wide classification, a set of rather general criteria has to be selected. The US Fish and Wildlife Service Wetlands Classification figure (2-1) gives the most objective elements for such a classification. This classification was developed in 1979 as a comprehensive classification system of wetlands and deepwater habitats for the U.S. Fish and Wildlife Service (Cowardin et al. 1979). Under this system, wetlands are of two basic types: coastal (also known as tidal or estuarine wetlands) and inland (also known as non-tidal, freshwater, or palustrine wetlands).

GIS and Modelling Research Cluster 2010
Nile Basin Capacity Building Network ( NBCBN ) 6
Although it was mainly drawn up for the US, it serves well for a first inventory of continental wetlands, and distinguishes principal wetland groups which share similar hydrological, geomorphologic, chemical and biological influences. This leads to the differentiation of marine, estuarine, riverine, lacustrine and palustrine systems. Within these systems, subsystems are drawn up according to the characteristics of the water resources. Water dynamics or 'hydroperiod' is one of the main selection criteria. Without any further regional or climatic division, the subsystems are divided into classes in terms of either the dominant vegetation or the substrate type according to the appearance of the ecosystem. If the vegetation cover is more than 30% a vegetation class is used. Otherwise the substrate class is used. By adding descriptions about dominance types of vegetation and other key-organisms or by adding 'modifiers' to the classes, subclasses can be made. It is especially these environmental modifiers, such as pH, climate, soil, water regime, etc. which add a great deal of information to the wetland classification. The following is a brief description of the major classes of wetlands under the Cowardin system.
Marine - Open ocean overlying the continental shelf and coastline exposed to waves and currents of the open ocean shoreward to (1) extreme high water of spring tides; (2) seaward limit of wetland emergents, trees, or shrubs; or (3) the seaward limit of the Estuarine System, other than vegetation. Salinities exceed 30 parts per thousand (ppt).
Estuarine - Deepwater tidal habitats and adjacent tidal wetlands that are usually semi-enclosed by land but have open, partly obstructed, or sporadic access to the ocean, with ocean-derived water at least occasionally diluted by freshwater runoff from the land. The upstream and landward limit is where ocean-de rived salts measure less than 0.5 ppt during the period of average annual low flow. The seaward limit is (1) an imaginary line closing the mouth of a river, bay, or sound; and (2) the seaward limit of wetland emergents, shrubs, or trees when not included in (1).
Riverine - All wetlands and deepwater habitats contained within a channel except those wetlands (1) dominated by trees, shrubs, persistent emergents, emergent mosses, or lichens, and (2) which have habitats with ocean-derived salinities in excess of 0.5 ppt.
Lacustrine - Wetlands and deepwater habitats (1) situated in a topographic depression or dammed river channel; (2) lacking trees, shrubs, persistent emergents, emergent mosses, or lichens with greater than 30% areal coverage; and (3) whose total area exceeds 0.081 km2; or area less than 0.081 km2 if the boundary is active wave-formed or bedrock or if water depth in the deepest part of the basin exceeds 2 m at low water. Ocean-derived salinities are always less than .5 ppt.
Palustrine - All nontidal wetlands dominated by trees, shrubs, persistent emergents, emergent mosses, or lichens, and all such tidal wetlands where ocean-derived salinities are below .5 ppt. This category also includes wetlands lacking such h vegetation but with all of the following characteristics: (1) area less than 0.081 km2; (2) lacking an active wave-formed or bedrock boundary; (3) water depth in the deepest part of the basin less than 2 m at low water; and (4) ocean-derived salinities less than .5 ppt.
GIS and Modelling Research Cluster 2010
Nile Basin Capacity Building Network ( NBCBN ) 7
Figure 2-1: The US Fish and Wildlife Service Wetlands Classification
MARINE
ESTUARINE
RIVERINE
LACUSTRINE
PLUSTRINE
SUBTIDAL
INTERTIDAL
Rock BottomUnconsolidated BottomAquatic BedRoof
Aquatic BedRoofRocky ShareUnconsolidated Share
SUBTIDALRock BottomUnconsolidated BottomAquatic BedRoof
INTERTIDAL
Aquatic BedRoof
Rocky ShareUnconsolidated Share
Stream Bed
Emergent WetlandScrub-Shrub WetlandForested Wetland
TIDAL
Rock BottomUnconsolidated BottomAquatic Bed
Rocky Share
LOWER PERPENNIAL
Emergent WetlandUnconsolidated Share
Streamland
Rock BottomUnconsolidated BottomAquatic BedRocky Share
Emergent WetlandUnconsolidated Share
UPPER PERPENNIAL
Rock BottomUnconsolidated BottomAquatic BedRocky ShareUnconsolidated Share
INTER MITTENT Stream Bed
Rock BottomUnconsolidated BottomAquatic Bed
LITTORAL
LIMNETIC
Rock BottomUnconsolidated BottomAquatic BedRocky Share
Emergent WetlandUnconsolidated Share
Unconsolidated ShareMass-Lichen WetlendEmergent WetlandScrub-Shrub WetlandForested Wetland
Rock BottomUnconsolidated BottomAquatic Bed
WET
LAND
S AN
D DE
EP W
ATER
HAB
ITAT
S
SYSTEM SUBSYTEM CLASS

GIS and Modelling Research Cluster 2010
Nile Basin Capacity Building Network ( NBCBN ) 8
Iucn/Ramsar Convention Classification The IUCN has developed a less complex classification for the RAMSAR Convention, which partly follows the US Fish and Wildlife Service down to the level of the Subsystems. But some modifications have been made (table2-2). First, the Super systems of Salt water, Freshwater, and Man-made Wetlands have been distinguished. Secondly, the System of Lakear and Salt Lakes has been added to the list of Systems. This is clearly an improvement to the US classification, which is clearly based on the North American situation where these types of wetlands hardly exist. Thirdly, the Subsystem of Riverine Tidal wetlands, which the US Fish and Wildlife classification uses, has been added to the Estuarine or Marine Systems. Whereas the US Fish and Wildlife classification uses the criteria of an excess of 0.5 part per thousand of ocean-derived salts, the IUCN classification takes the influence of tidal movement as the main criteria. Finally, the IUCN classification splits up the System of Palustrine into two Subsystems; Emergent and Forested table (2-2). The codes are based upon the Ramsar Classification System for Wetland Type as approved by Recommendation 4.7 and amended by Resolutions VI.5 and VII.11 of the Conference of the Contracting Parties. The categories listed herein are intended to provide only a very broad framework to aid rapid identification of the main wetland habitats represented at each site. To assist in identification of the correct Wetland Types to list in section 19 of the RIS, the Secretariat has provided below tabulations for Marine/Coastal Wetlands and Inland Wetlands of some of the characteristics of each Wetland Type.
Marine/Coastal Wetlands
A -- Permanent shallow marine waters in most cases less than six meters deep at low tide; includes sea bays and straits. B -- Marine subtidal aquatic beds; includes kelp beds, sea-grass beds, tropical marine meadows. C -- Coral reefs. D -- Rocky marine shores; includes rocky offshore islands, sea cliffs. E -- Sand, shingle or pebble shores; includes sand bars, spits and sandy islets; includes dune systems and humid dune slacks. F -- Estuarine waters; permanent water of estuaries and estuarine systems of deltas. G -- Intertidal mud, sand or salt flats. H -- Intertidal marshes; includes salt marshes, salt meadows, saltings, raised salt marshes; includes tidal brackish and freshwater marshes. I -- Intertidal forested wetlands; includes mangrove swamps, nipah swamps and tidal freshwater swamp forests. J -- Coastal brackish/saline Lakes; brackish to saline Lakes with at least one relatively narrow connection to the sea. K -- Coastal freshwater Lakes; includes freshwater delta Lakes. Zk(a) - Karst and other subterranean hydrological systems, marine/coastal
Inland Wetlands
L -- Permanent inland deltas. M -- Permanent rivers/streams/creeks; includes waterfalls. N -- Seasonal/intermittent/irregular rivers/streams/creeks. O -- Permanent freshwater lakes (over 8 ha); includes large oxbow lakes. P -- Seasonal/intermittent freshwater lakes (over 8 ha); includes floodplain lakes. Q -- Permanent saline/brackish/alkaline lakes. R -- Seasonal/intermittent saline/brackish/alkaline lakes and flats. Sp -- Permanent saline/brackish/alkaline marshes/pools. Ss -- Seasonal/intermittent saline/brackish/alkaline marshes/pools. Tp -- Permanent freshwater marshes/pools; ponds (below 8 ha), marshes and swamps on inorganic soils;

GIS and Modelling Research Cluster 2010
Nile Basin Capacity Building Network ( NBCBN ) 9
with emergent vegetation water-logged for at least most of the growing season. Ts -- Seasonal/intermittent freshwater marshes/pools on inorganic soils; includes sloughs, potholes, seasonally flooded meadows, sedge marshes. U -- Non-forested peatlands; includes shrub or open bogs, swamps, fens. Va -- Alpine wetlands; includes alpine meadows, temporary waters from snowmelt. Vt -- Tundra wetlands; includes tundra pools, temporary waters from snowmelt. W -- Shrub-dominated wetlands; shrub swamps, shrub-dominated freshwater marshes, shrub carr, alder thicket on inorganic soils. Xf -- Freshwater, tree-dominated wetlands; includes freshwater swamp forests, seasonally flooded forests, wooded swamps on inorganic soils. Xp -- Forested peatlands; peatswamp forests. Y -- Freshwater springs; oases. Zg -- Geothermal wetlands Zk(b) - Karst and other subterranean hydrological systems, inland
Note: "floodplain" is a broad term used to refer to one or more wetland types, which may include examples from the R, Ss, Ts, W, Xf, Xp, or other wetland types. Some examples of floodplain wetlands are seasonally inundated grassland (including natural wet meadows), shrublands, woodlands and forests. Floodplain wetlands are not listed as a specific wetland type herein.
Constructed wetlands
1 -- Aquaculture (e.g., fish/shrimp) ponds 2 -- Ponds; includes farm ponds, stock ponds, small tanks; (generally below 8 ha). 3 -- Irrigated land; includes irrigation channels and rice fields. 4 -- Seasonally flooded agricultural land (including intensively managed or grazed wet meadow or pasture). 5 -- Salt exploitation sites; salt pans, salines, etc. 6 -- Water storage areas; reservoirs/barrages/dams/impoundments (generally over 8 ha). 7 -- Excavations; gravel/brick/clay pits; borrow pits, mining pools. 8 -- Wastewater treatment areas; sewage farms, settling ponds, oxidation basins, etc. 9 -- Canals and drainage channels, ditches. Zk(c) - Karst and other subterranean hydrological systems, human-made

GIS and Modelling Research Cluster 2010
Nile Basin Capacity Building Network ( NBCBN ) 10
Table 2-2: IUCN/Ramsar Convention classification
Marine / Coastal Wetlands
Saline Water
Permanent < 6 m deep A Underwater vegetation B Coral reefs C
Shores Rocky D Sand, Shingle or pebble E
Saline or Brackish water
Intertidal
Flats (mud, sand or salt) G
marshes H Forested I
Lakes J Estuarine Waters F
Saline, Brackish or fresh water
Subterranean ZJ(a)
fresh water Lakes K Inland Wetlands
Flowing Water Permanent Rivers, streams, creeks M Deltas L Springs, oases Y
Seasonal/intermittent Rivers, streams, creeks N
Lakes and pools
Permanent > 8 ha O < 8 ha Tp
Seasonal/intermittent > 8 ha P < 8 ha Ts
Marshes on inorganic soils
Permanent Herb-dominated Tp
Permanent/Seasonal/intermittent Shrub-dominated W Tree-dominated Xf
Seasonal/intermittent Herb-dominated Ts Marshes on peat soil Permanent Non-forested U
Forested Xp Marshes on inorganic or peat soils
High altitude (alpine) Va
Tundra Vt
Saline, brackish or alkaline water
Lakes Permanent Q Seasonal/intermittent R
Marshes & Pools
Permanent Sp Seasonal/intermittent Ss
Fresh, saline, brackish or alkaline water
Geothermal Zg
Subterranean Zk(b)

GIS and Modelling Research Cluster 2010
Nile Basin Capacity Building Network ( NBCBN ) 11
Classification in the IUCN wetland directories Although the IUCN has developed the above mentioned classification, which is rather good, the Directory (handbook) on tropical wetlands uses a slightly different classification. Nevertheless, if the major Super systems and Systems are added to this classification, the two systems will match rather well see table (2-3). Table 2-3: The IUCN/Ramsar Classification and the IUCN Wetland Directory Classification merged
IUCN / RAMSAR Classification IUCN wetland Directory Classification
Salt Water
Marine Subtidal Shallow sea bays and straits
Small offshore islands and islets
Intertidal Rocky sea coasts, sea cliffs Sea beaches (sand and pebbles)
Estuarine Subtidal Non
Intertidal Estuarine, deltas, Mudflates, sand flats Mangrove swamps and mangrove forest
Lakear Coastal brackish and saline Lakes and marshes, salt pans
Salt Lake Salt Lakes, Solar (inland system)
Freshwater
Riverine Perennial Slow flowing rivers, streams Fast flowing rivers, systems Riverine lakes (incl oxbows), riverine marshes
Tempor Non
Lacustrine Freshwater lakes, and associates marshes
Plustrine Emergent
Freshwater Ponds, marshes, swamps Seasonally flooded grassland, savannah, palm
savanna Peat bogs, wet Andean meadows, snow melt
bogs Forested Swamp forest, temporarily flooded forest
Man-Made Reservoirs, dams, Rice paddies, flooded arable land, irrigated lad
2.4 Functions and Values of Wetlands
Wetlands are important components of watershed and provide many valuable functions to the environment and to society (Richardson 1994, NRC 1995, Mitsch and Gosselink 2000). Wetland ecosystem functions

GIS and Modelling Research Cluster 2010
Nile Basin Capacity Building Network ( NBCBN ) 12
include the transfer and storage of water, biochemical transformation and storage, the production of living plants and animals, the decomposition of organic materials, and the communities and habitats for living creatures (Richardson 1994). Based on these and other ecological functions, wetlands provide ―values‖ to humans and naturally functioning ecosystems. Important values include, but are not limited to, flood control, filtering and cleansing water, erosion control, food production (shrimp, ducks, fish, etc.), timber production, recreation (boating, fishing, bird watching, etc.), winter deer yards, and habitat for plants and animals, including many rare or endangered species.
Many people use the terms functions and values interchangeably when discussing wetlands, even though functions and values are different. Functions are the physical, chemical, and biological processes occurring in and making up an ecosystem. Processes include the movement of water through the wetland into streams or the ocean; the decay of organic matter; the release of nitrogen, sulfur, and carbon into the atmosphere; the removal of nutrients, sediment and organic matter from water moving into the wetland; and the growth and development of all the organisms that require wetlands for life.
Values are "an estimate, usually subjective, of worth, merit, quality, or importance" (Richardson 1994). Wetland "values" may derive from outputs that can be consumed directly, such as food, recreation, or timber; indirect uses which arise from the functions occurring within the ecosystem, such as water quality, and flood control; possible future direct outputs or indirect uses such as biodiversity or conserved habitats; and from the knowledge that such habitats or species exist (known as existence value) (Serageldin 1993).
The difficulty with determining the value of a wetland is that valuation can be a subjective assessment, particularly the valuation of indirect use, future use, or existence values. Some wetlands may have multiple uses or worth. Wetlands that are remote may not directly benefit any humans but may be critical, for instance, to the existence of a type of salamander. People may value the intangible fact that wetlands exist, but would not be able to place a price on them, perhaps feeling offended by the concept. In contrast, the value of estuaries in producing shrimp can be calculated based on the price of shrimp.
Conflicts may also arise between public and private valuation. For example, although an individual landowner may not receive the financial benefits of the wetland on his or her property, it may have worth to the town or county in improving public water quality or quantity. In such a case, the town or county could pay the landowner to preserve a wetland. In more complex cases involving endangered wetland species found on private property, the government attributes a value to the preservation of the species and regulates the development of the private property, although the property owner may not value the organism at all or values it less than he does other possible land uses.
Within watersheds and ecosystems, human activities can cause depletion or pollution. The watershed and its ecosystems sustain our way of life, regardless of our understanding of the biology, chemistry, and geology involved. However, when decision makers do not understand the basics of ecosystem functions and values, they may make choices that prevent ecosystems from fully functioning. The result may be long term and possibly irreversible changes. Such changes reduce the value of the ecosystem. They can even affect the economy. A familiarity with the functions and values of an ecosystem such as a wetland can improve decision making today and protect values that may be held by future generations as well.
2.4.1. Wetlands Functions
1. Hydrologic Flux and Storage
A. Water balance
Wetlands play a critical role in regulating the movement of water within watersheds as well as in the global water cycle (Richardson 1994; Mitsch and Gosselink 1993). Wetlands, by definition, are characterized by

GIS and Modelling Research Cluster 2010
Nile Basin Capacity Building Network ( NBCBN ) 13
water saturation in the root zone, at, or above the soil surface, for a certain amount of time during the year. This fluctuation of the water table (hydroperiod) above the soil surface is unique to each wetland type.
Wetlands store precipitation and surface water and then slowly release the water into associated surface water resources, ground water, and the atmosphere. Wetland types differ in this capacity based on a number of physical and biological characteristics, including: landscape position, soil saturation, the fiber content/degree of decomposition of the organic soils, vegetation density and type of vegetation (Taylor et al. 1990):
Landscape position
Landscape position affects the amount and source of water in a wetland. For example, wetlands that are near a topographical height, such as a mountain bog, will not receive as much runoff as a marsh in a low area amidst fields. Wetlands can be precipitation dominated, ground water dominated, or surface flow dominated. Wetlands on local topographic heights are often precipitation dominated. Precipitation dominated wetlands may also be in flat or slightly elevated areas in the landscape, where they receive little or no surface runoff. Generally such wetlands have a clay and peat layer that retains the precipitation and also prevents discharge from ground water. Wetlands also form in landscape positions at which the water table actively discharges, particularly at the base of hills and in valleys. Such groundwater dominated wetlands may also receive overland flow but they have a steady supply of water from and to groundwater. Most wetlands in low points on the landscape or within other water resources are dominated by overland flow. Such riverine, fringe (marsh), and tidal wetlands actively play a role in the landscape since they come in contact with, store, or release large quantities of water and act upon sediments and nutrients. These wetlands may be recharged by ground water as well, but surface water provides the major source of water.
Soil saturation and fiber content
Soil saturation and fiber content are important factors in determining the capacity of a wetland in retaining water. Like a sponge, as the pore spaces in wetland soil and peat become saturated by water, they are able to hold less additional water and are also able to release the water more easily. Clay soils retain more water than loam or sand, and hold the water particles more tightly through capillary action since pore spaces are small and the water particles are attracted to the negatively charged clay. Pore spaces between sand particles are large and water drains more freely since less of the water in the pore is close enough to be attracted to the soil particle.
Water drains more freely from the least decomposed (fibric) peat because pore spaces are large and the surface area for capillary action is small. Sapric peat (most decomposed, fibers unrecognizable) and hemic peat (intermediate) have very small pores. Water moves very slowly in such peats. Water in wetlands, as a result, flows over the surface or close to the surface in the fibric layer and root zone (acrotelm) (Boelter and Verry 1977). Thus wetlands with sapric peat and clay substrate will store water but will have no ground water discharge (inflow) or outflow (recharge).
Vegetation density and type
Stems cause friction for the flow of the water, thus reducing water velocity. As density of vegetation increases, velocity decreases. Plants that are sturdy, such as shrubs and trees are more important in this function than grasses. During the growing season, plants actively take up water and release it to the atmosphere through evapotranspiration. This process reduces the amount of water in wetland soil and increases the capacity for absorption of additional precipitation or surface water flow. As a result, water levels and outflow from the wetland are less than when plants are dormant. Larger plants and plants with more surface area will transpire more.
GIS and Modelling Research Cluster 2010
Nile Basin Capacity Building Network ( NBCBN ) 14
B. Ground water recharge
Wetlands help maintain the level of the water table and exert control on the hydraulic head (O'Brien 1988; Winter 1988). This provides force for ground water recharge and discharge to other waters as well. The extent of ground water recharge by a wetland is dependent upon soil, vegetation, site, perimeter to volume ratio, and water table gradient (Carter and Novitzki 1988; Weller 1981). Ground water recharge occurs through mineral soils found primarily around the edges of wetlands (Verry and Timmons 1982) The soil under most wetlands is relatively impermeable. A high perimeter to volume ratio, such as in small wetlands, means that the surface area through which water can infiltrate into the ground water is high (Weller 1981). Ground water recharge is typical in small wetlands such as prairie potholes, which can contribute significantly to recharge of regional ground water resources (Weller 1981). Researchers have discovered ground water recharge of up to 20% of wetland volume per season (Weller 1981).
C. Climate control
Climate control is another hydrologic function of wetlands. Many wetlands return over two-thirds of their annual water inputs to the atmosphere through evapotranspiration (Richardson and McCarthy 1994). Wetlands may also act to moderate temperature extremes in adjacent uplands (Brinson 1993).
D. Oxidation-Reduction
The fluctuating water levels (also known as hydrologic flux) that are characteristic of wetlands control the oxidation-reduction (redox) conditions that occur. These redox conditions governed by hydroperiod play a key role in: nutrient cycling, availability, and export; pH; vegetation composition; sediment and organic matter accumulation; decomposition and export; and metal availability and export.
When wetland soil is dry, microbial and chemical processes occur using oxygen as the electron acceptor. When wetland soil is saturated with water, microbial respiration and biological and chemical reactions consume available oxygen. This shifts the soil from an aerobic to an anaerobic, or reduced, condition. As conditions become increasingly reduced, other electron acceptors than oxygen must be used for reactions. These acceptors are, in order of microbial preference, nitrate, ferric iron, manganese, sulfate, and organic compounds.
Wetland plants are adapted to changing redox conditions. Wetland plants often contain arenchymous tissue (spongy tissue with large pores) in their stems and roots that allows air to move quickly between the leaf surface and the roots. Oxygen released from wetland plant roots oxidizes the rhizosphere (root zone) and allows processes requiring oxygen, such as organic compound breakdown, decomposition, and denitrification, to occur (Steinberg and Coonrod 1994).
E. Hydrologic flux and life support
Changes in frequency, duration, and timing of hydroperiod may impact spawning, migration, species composition, and food chain support of the wetland and associated downstream systems (Crance 1988). Normal hydrologic flux allows exchange of nutrients, detritus, and passage of aquatic life between systems. Values of wetlands as a result of the functions of hydrologic flux and storage include: water quality, water supply, flood control, erosion control, wildlife support, recreation, culture, and commercial benefits.

GIS and Modelling Research Cluster 2010
Nile Basin Capacity Building Network ( NBCBN ) 15
2. Biogeochemical Cycling and Storage
Wetlands may be a sink for, or transform, nutrients, organic compounds, metals, and components of organic matter. Wetlands may also act as filters of sediments and organic matter. A wetland may be a permanent sink for these substances if the compounds become buried in the substrate or are released into the atmosphere; or a
wetland may retain them only during the growing season or under flooded conditions. Wetland processes play a role in the global cycles of carbon, nitrogen, and sulfur by transforming them and releasing them into the atmosphere.
The values of wetland functions related to biogeochemical cycling and storage include: water quality and erosion control.
Nitrogen (N)
The biological and chemical process of nitrification/denitrification in the nitrogen cycle transforms the majority of nitrogen entering wetlands, causing between 70% and 90% to be removed (Reilly 1991; Gilliam 1994).
In aerobic substrates, organic nitrogen may mineralize to ammonium, which plants and microbes can utilize, adsorb to negatively charged particles (e.g., clay), or diffuse to the surface. As ammonia diffuses to the surface, the bacteria Nitrosomonas can oxidize it to nitrite. The bacteria Nitrobacter oxidizes nitrite to nitrate. This process is called nitrification. Plants or microorganisms can assimilate nitrate, or anaerobic bacteria may reduce nitrate (denitrification) to gaseous nitrogen (N2) when nitrate diffuses into anoxic (oxygen depleted) water. The gaseous nitrogen volatilizes and the nitrogen is eliminated as a water pollutant. Thus, the alternating reduced and oxidized conditions of wetlands complete the needs of the nitrogen cycle and maximize denitrification rates (Johnston 1991).
Phosphorus (P)
Phosphorus can enter wetlands with suspended solids or as dissolved phosphorus. Significant quantities of phosphorus associated with sediments are deposited in wetlands (Walbridge and Struthers 1993). Phosphorus removal from water in wetlands occurs through use of phosphorus by plants and soil microbes; adsorption by aluminum and iron oxides and hydroxides; precipitation of aluminum, iron, and calcium phosphates; and burial of phosphorus adsorbed to sediments or organic matter (Richardson 1985; Johnston 1991; Walbridge and Struthers 1993). Wetland soils can, however, reach a state of phosphorus saturation, after which phosphorus may be released from the system (Richardson 1985). Phosphorus export from wetlands is seasonal, occurring in late summer, early fall, and winter as organic matter decomposes and phosphorus is released into surface water.
Dissolved phosphorus is processed by wetland soil microorganisms, plants, and geochemical mechanisms. (Walbridge and Struthers 1993) Microbial removal of phosphorus from wetland soil or water is rapid and highly efficient, however, following cell death, the phosphorus is released again. Similarly, for plants, litter decomposition causes a release of phosphorus. Burial of litter in peat can, however, provide long term removal of phosphorus. Harvesting of plant biomass is needed to maximize biotic phosphorus removal from the wetland system.
The potential for long-term storage of phosphorus through adsorption to wetland soil is greater than the maximum rates of phosphorus accumulation possible in plant biomass (Walbridge and Struthers 1988; Johnston 1991). In alkaline wetlands, such as found in the West, phosphorus precipitates with calcium as calcium phosphate (Novotony and Olem 1994; Walbridge and Struthers 1988). However, the presence of aluminum is the significant predictor of dissolved phosphorus sorption and removal from water in most

GIS and Modelling Research Cluster 2010
Nile Basin Capacity Building Network ( NBCBN ) 16
wetland systems (Richardson 1985; Gale et al. 1994; Walbridge and Struthers 1993). The capacity for phosphorus adsorption by a wetland, however, can be saturated in a few years if it has low amounts of aluminum and iron or calcium (Richardson 1985).
Wetlands along rivers have a high capacity for phosphorus adsorption because as clay is deposited in the floodplain, aluminum (Al) and iron (Fe) in the clay accumulate as well (Gambrell 1994). Thus floodplains tend to be important sites for phosphorus removal from the water column, beyond that removed as sediments are deposited (Walbridge and Struthers 1993).
Carbon
Wetlands store carbon within peat and soil. Storing carbon is an important function within the carbon cycle, particularly given observations of increasing levels of carbon dioxide in the atmosphere and concerns about global warming. When wetlands are drained, the oxidizing conditions increase organic matter decomposition, thus increasing the release of carbon dioxide. When wetlands are preserved or restored, the wetlands act as a sink for carbon since organic matter decomposition is stable or slowed.
Sulfur (S)
Wetlands are capable of reducing sulfate to sulfide. Sulfide is released to the atmosphere as hydrogen, methyl, and dimethyl sulfides or is bound in insoluble complexes with phosphate and metal ions in wetland sediments (Mitsch and Gosselink 1993). Dim ethyl sulfide released from wetlands may act as a seed for cloud formation (Hader et al. 1991). Sulfate may exist in soils or may enter wetlands through tidal flow or atmospheric deposition.
Suspended solids
Wetlands filter suspended solids from water that comes into contact with wetland vegetation. Stems and leaves provide friction for the flow of the water, thus allowing settling of suspended solids and removal of related pollutants from the water column (Johnston 1991). Wetlands may retain sediment in the peat or as substrate permanently (Johnston 1991). Sediment deposition is variable across individual wetlands and wetland types, as deposition depends upon the rate and type of water flow (channelized or sheet flow), particulate size, and vegetated area of the wetland (Aust et al. 1991;Johnston 1991; Crance 1988; USEPA 1993c; Hemond and Benoit 1988).
Metals
All soils contain at least a low concentration of metals but in some locations human activities have resulted in metal levels high enough to cause health or ecological risks in water resources. Metals may exist in wetland soils or enter wetlands through surface or ground water flow.
Wetlands can remove metals from surface and ground water as a result of the presence of clays, humic materials (peats), aluminum, iron, and/or calcium (Gambrell 1994). Metals entering wetlands bind to the negatively ionized surface of clay particles, precipitate as inorganic compounds (includes metal oxides, hydroxides, and carbonates controlled by system pH), complex with humic materials, and adsorb or occlude to precipitated hydrous oxides. Iron hydroxides are particularly important in retaining metals in salt marshes. Wetlands remove more metals from slow flowing water since there is more time for chemical processes to occur before the water moves out of the wetland. Burial in the wetland substrate will keep bound metals immobilized. Neutral pH favors metal immobilization in wetlands (Gambrell 1994). With the exception of very low pH peat bogs, as oxidized wetland soils are flooded and reduced, pH converges toward neutrality (6.5 to 7.5) whether the wetland soils were originally acidic or alkaline (Ponnamperuna 1972).

GIS and Modelling Research Cluster 2010
Nile Basin Capacity Building Network ( NBCBN ) 17
3. Biological Productivity
Wetlands are among the most productive ecosystems in the world (Mitsch and Gosselink 1993). Immense varieties of species of microbes, plants, insects, amphibians, reptiles, birds, fish, and other wildlife depend in some way on wetlands. Wetlands with seasonal hydrologic pulsing are the most productive.
Wetland plants play an integral role in the ecology of the watershed. Wetland plants provide breeding and nursery sites, resting areas for migratory species, and refuge from predators (Crance 1988). Decomposed plant matter (detritus) released into the water is important food for many invertebrates and fish both in the wetland and in associated aquatic systems (Crance 1988). Physical and chemical characteristics such as climate, topography, geology, hydrology, and inputs of nutrients and sediments determine the rate of plant growth and reproduction (primary productivity) of wetlands (Brinson 1993; Mitsch and Gosselink 1993; Weller 1981; Crance 1988).
A wetland with more vegetation will intercept more runoff and be more capable of reducing runoff velocity and removing pollutants from the water than a wetland with less vegetation (Demissie and Khan 1993; Richardson and McCarthy 1994; NC DEM 1993). Wetland plants also reduce erosion as their roots hold the streambank, shoreline, or coastline.
Values associated with biological productivity of wetlands include: water quality, flood control, erosion control, community structure and wildlife support, recreation, aesthetics, and commercial benefits.
4. Decomposition
Decomposition rates vary across wetland types, particularly as a function of climate, vegetation types, available carbon and nitrogen, and pH (Johnston 1991).
A pH above 5.0 is necessary for bacterial growth and survival (Richardson 1995). Liming, to increase pH, accelerates decomposition, causing the release of carbon dioxide from wetlands and land subsidence (Richardson 1995).
The nutrients and compounds released from decomposing organic matter may be exported from the wetland in soluble or particulate form, incorporated into the soil, or eventually transformed and released to the atmosphere. Decomposed matter (detritus) forms the base of the aquatic and terrestrial food web.
Decomposition requires oxygen and thus reduces the dissolved oxygen content of the water. High rates of decomposition -- such as occur after algae has bloomed -- can reduce water quality and impair aquatic life support.
5. Community structure and wildlife support
The inundated or saturated conditions occurring in wetlands limit plant species composition to those that can tolerate such conditions. Beaver, muskrat and alligators create or manipulate their own wetland habitat that other organisms, such as fish, amphibians, waterfowl, insects, and mammals can then use or inhabit (Weller 1981; Mitsch and Gosselink 1993).
Wetland shape and size affect the wildlife community and the wetland's function as suitable habitat (Kent 1994b; Brinson 1993; Harris 1988). The shape of the wetland varies the perimeter to area ratio. The amount of perimeter versus area has importance for the success of interior and edge species (Kent 1994b). Shape is also important for the possibility of movement of animals within the habitat and between habitats. Wetland size is particularly important for larger and wide ranging animals that utilize wetlands for food and refuge, such as black bear or moose, since in many locations wetlands may be the only undeveloped and undisturbed areas

GIS and Modelling Research Cluster 2010
Nile Basin Capacity Building Network ( NBCBN ) 18
remaining. Values associated with community structure and wildlife support in wetlands include: fish and wildlife support, recreation, aesthetics, and commercial benefits.
6. Coastal Protection
Coastal marshes, mangrove swamps and other estuarine wetlands act as effective storm buffers. Studies have concluded that more than half of normal wave energy is dissipated within the first 3meters of encountering marsh vegetation such as cordgrass. The erosive nature of tides is also dampened by wetland plants because their roots hold soil in place and their stalks reduce the destructive energy of waves and wind.
2.4.2. Wetlands Values
If something has "value," then it is worthwhile, beneficial, or desirable. The value of a wetland lies in the benefits that it provides to the environment or to people, something that is not easily measured. Wetlands can have ecological, social, or economic values. Wetland products that have an economic value, such as commercial fish or timber, can be assigned a monetary value. True wetland value, however, goes beyond money. How much value does one place on the beauty of a wetland or its archeological significance? Wetland values are not absolute. What is valuable and important to one person may not be valuable to another person. As an example, the value of a wetland as duck habitat may be important to the hunter or birdwatcher but not to the farmer who owns the land. Wetland functions have value on several levels-internal, local, regional, and global. All wetland functions are internal, but the values or benefits of wetland functions can be internal or external to the wetland.. Functions that provide internal values are the functions that maintain or sustain the wetland and are essential to the continued existence of the wetland. Conversely, many functions have external values that extend beyond the wetland itself. On a local scale, wetlands affect adjacent or nearby ecosystems, for example, by reducing flooding in downstream communities or by removing nutrients from wastewater. However, the broadest influence of wetland functions is global. Wetlands are now thought to have a significant effect on air quality, which is influenced by the nitrogen, sulfur, methane, and carbon cycles. In addition, migrating birds are dependent upon wetlands as they travel. While wetland functions are natural processes of wetlands that continue regardless of their perceived value to humans, the value people place on those functions in many cases is the primary factor determining whether a wetland remains intact or is converted for some other use" (National Audubon Society, 1993). In addition, values assigned to wetland functions may change over time as societys perceptions and priorities change. The values that benefit society as a whole tend to change slowly; however, the values assigned by individuals or small groups are arbitrary, and most are subject to rapid and frequent change and may even conflict. For example, timber production may be improved by draining a wetland site, whereas waterfowl production may be improved by impounding more water. Society may have to resolve conflicts regarding the management or preservation of wetlands and their functions. Furthermore, society may have to choose among wetland functions that benefit individuals or small groups, that are of value to most of society, or that are important to the maintenance of the wetland itself. The values that benefit society as a whole tend to change slowly; however, the values assigned by individuals or small groups are arbitrary, and most are subject to rapid and frequent change and may even conflict. For example, timber production may be improved by draining a wetland site, whereas waterfowl production may be improved by impounding more water. Society may have to resolve conflicts regarding the management or preservation of wetlands and their functions. Furthermore, society may have to choose among wetland functions that benefit individuals or small groups, that are of value to most of society, or that are important to the maintenance of the wetland itself. The following section shows some of the values associated with wetlands functions; 1. Water Quality

GIS and Modelling Research Cluster 2010
Nile Basin Capacity Building Network ( NBCBN ) 19
Wetlands help maintain and improve the water quality of streams, rivers, lakes, and estuaries. Since wetlands are located between uplands and water resources, many can intercept runoff from the land before it reaches open water. As runoff and surface water pass through, wetlands remove or transform pollutants through physical, chemical, and biological processes. For example, the Congaree Bottomland Hardwood Swamp in South Carolina removes a quantity of pollutants from watershed water resources equivalent to that which would be removed by a $5 million water treatment plant (USEPA 1995). In another case, scientists estimate that a 2,500 acre wetland in Georgia saves $1 million in water pollution control costs annually (OTA 1993).
Nutrient Removal
Scientists have estimated that wetlands may remove between 70% and 90% of entering nitrogen (Reilly 1991; Gilliam 1994). Riparian forests can reduce nitrogen concentrations in runoff and floodwater by up to 90% and phosphate concentrations by 50% (Gilliam 1994). The estimated mean retention of phosphorus by wetlands is 45% (Johnston 1991). Wetlands with high soil concentrations of aluminum may remove up to 80% of total phosphorus (Peterjohn and Correll 1984; Richardson 1985; Gale et al. 1994; Walbridge and Struthers 1993).
Ranchers and watershed managers in the West are utilizing beaver-created wetlands to improve water quality (USEPA 1993b; SCS 1989). Beaver impoundments can be extremely useful in agricultural watersheds because they may retain up to 1000 times more nitrogen than streams that are not impounded (Whigham et al. 1988).
Removal of Biological Oxygen Demand from Surface Water
Biological oxygen demand (BOD) is a measure of the oxygen required for the decomposition of organic matter and oxidation of inorganics such as sulfide. BOD is introduced into surface water through inputs of organic matter such as sewage effluent, surface runoff, and natural biotic processes. If BOD is high, low dissolved oxygen levels result. Low dissolved oxygen
levels can lead to mortality of aquatic life. Wetlands remove BOD from surface water through decomposition of organic matter or oxidation of inorganics (Hemond and Benoit 1988). BOD removal by wetlands may approach 100% (Hemond and Benoit 1988). Removal of Suspended Solids and Associated Pollutants from Surface Water
Suspended solids (such as sediment and organic matter) may enter wetlands in runoff, as particulate litterfall, or with inflow from associated water bodies. Sediment deposition in wetlands depends upon water velocity, flooding regimes, vegetated area of the wetland, and water retention time (Gilliam 1994; Johnston 1991). Sediment deposition in wetlands prevents a source of turbidity from entering downstream ecosystems. Typically wetland vegetation traps 80-90% of sediment from runoff (Gilliam 1994; Johnston 1991). Less than 65% of the sediment eroded from uplands exits watersheds that contain wetlands (Johnston 1991).
Other pollutants that impact water quality such as nutrients, organics, metals and radionuclides are often adsorbed onto suspended solids. Deposition of suspended solids, to which such substances are adsorbed, removes these pollutants from the water. Thus sediment deposition provides multiple benefits to downstream water quality (Johnston 1991; Hemond and Benoit 1988; Hupp et al. 1993; Puckett et al. 1993).
Removal of Metals
Certain wetlands play an important role in removing metals from other water resources, runoff, and ground water (Owen 1992; Gambrell 1994; Puckett et al. 1993). Wetlands remove 20% - 100% of metals in the water,

GIS and Modelling Research Cluster 2010
Nile Basin Capacity Building Network ( NBCBN ) 20
depending on the specific metal and the individual wetland (Taylor et al. 1990). Forested wetlands play a critical role in removing metals downstream of urbanized areas (Hupp et al. 1993).
Delfino and Odum (1993) found that lead leaking from a Florida hazardous waste site was retained at high levels by a wetland; less than 20 - 25% of the total lead in the soil and sediments was readily bioavailable. The majority of the lead was bound to soil and sediments through adsorption, chelation, and precipitation. Bioavailable lead was absorbed primarily by eel grass, which had bioaccumulated the majority of the lead. In another case, researchers found that wetland vegetation and organic (muck) substrate retained 98% of lead entering the wetland (Gambrell 1994 ).
Removal of Pathogens
Fecal coliform bacteria and protozoans, which are indicators of threats to human health, enter wetlands through municipal sewage, urban stormwater, leaking septic tanks, and agricultural runoff. Bacteria attach to suspended solids that are then trapped by wetland vegetation (Hemond and Benoit 1988). These organisms die: after remaining outside their host organisms, through degradation by sunlight, from the low pH of wetlands, by protozoan consumption, and from toxins excreted from the roots of some wetland plants (Hemond and Benoit 1988; Kennish 1992). In this way wetlands have an important role in removing pathogens from surface water.
2. Water Supply
Wetlands act as reservoirs for the watershed. Wetlands release the water they retain (from precipitation, surface water, and ground water) into associated surface water and ground water. In Wisconsin watersheds composed of 40% lakes and wetlands, spring stream outflows from the watersheds were 140% of those in watersheds without any wetlands or lakes (Mitsch and Gosselink 1993). Forested wetlands, kettle lakes and prairie potholes have significant water storage and ground water recharge (Brown and Sullivan 1988; Weller 1981). Forested wetlands overlying permeable soil may release up to 100,000 gallons/acre/day into the ground water (Anderson and Rockel 1991). Verry and Timmons (1982) studied a Minnesota bog which released 55% of the entering water to stream and ground water.
Ground water can be adversely affected by activities that alter wetland hydrology (Winter 1988). Drainage of wetlands lowers the water table and reduces the hydraulic head providing the force for ground water discharge (O'Brien 1988; Winter 1988). If a recharge wetland is drained, the water resources into which ground water discharges will receive less inflow, potentially changing the hydrology of a watershed (Brinson 1993; Winter 1988). Ewel (1990) calculated that if 80 percent of a 5-acre Florida cypress swamp were drained, available ground water would be reduced by an estimated 45 percent.
3. Flood Protection
Wetlands help protect adjacent and downstream properties from potential flood damage. The value of flood control by wetlands increases with: (1) wetland area, (2) proximity of the wetland to flood waters, (3) location of the wetland (along a river, lake, or stream), (4) amount of flooding that would occur without the presence of the wetlands, and, (5) lack of other upstream storage areas such as ponds, lakes, and reservoirs (Mitsch and Gosselink 1993). The cost of replacing the flood control function of the 5,000 acres of wetlands drained each year in Minnesota was determined to be $1.5 million (USEPA 1995).
Wetlands within and upstream of urban areas are particularly valuable for flood protection. The impervious surface in urban areas greatly increases the rate and volume of runoff, thereby increasing the risk of flood damage. The drainage of wetlands, the diversion of the Mississippi and Missouri Rivers from their original

GIS and Modelling Research Cluster 2010
Nile Basin Capacity Building Network ( NBCBN ) 21
floodplains, and the development allowed in the floodplains over the past 100 years were partly responsible for the billions of dollars in damage to businesses, homes, crops, and property that occurred as a result of the Midwest flood of 1993 (OEP 1993).
4. Erosion Control
By virtue of their place in the landscape, riparian wetlands, salt marshes, and marshes located at the margin of lakes protect shorelines and streambanks against erosion. Wetland plants hold the soil in place with their roots, absorb wave energy, and reduce the velocity of stream or river currents. Coastal wetlands buffer shorelines against the wave action produced by hurricanes and tropical storms (Mitsch and Gosselink 1993). The ability of wetlands to control erosion is so valuable that states and landowners are restoring wetlands to control shoreline erosion in coastal areas (Lewis 1990).
5. Fish and Wildlife Habitat
Diverse species of plants, insects, amphibians, reptiles, birds, fish, and mammals depend on wetlands for food, habitat, or temporary shelter. Coastal and estuarine wetlands provide food and habitat for estuarine and marine fish and shellfish, bird species, and some mammals (NOAA 1990a; NOAA 1990b). Most commercial and game fish breed, and their young develop, in coastal marshes and estuaries. Menhaden, flounder, salmon, sea trout, and striped bass are among the more familiar fish that depend on estuaries during their life cycles. Shrimp, oyster, clams, and blue and Dungeness crabs likewise rely on coastal wetlands and estuaries for food and habitat.
6. Recreation, Aesthetics, Culture, and Science
Wetlands have archeological, historical, cultural, recreational, and scientific values. Societies have traditionally formed along bodies of water and artifacts found in wetlands provide information about these societies. The culture of the Louisiana bayou and the Chesapeake Bay formed as a result of their wetland ecosystems.
Historically, painters and writers have used wetlands as their subject matter. Today, such artists are often joined by others with cameras and camcorders.
Scientists value the processes of wetlands individually, particularly the role of wetlands in the global cycles of carbon, nitrogen, and water. Many scientists consider the removal of carbon dioxide from the atmosphere into plant matter and its burial as peat (sequestration) the most valuable function of wetlands (OTA 1993). Carbon sequestration is thought to be an important process in reducing the greenhouse effect and the threat of global warming.
7. Commercial Benefits
Commercially important products harvested from wetlands include fish, shellfish, cranberries, timber, and wild rice, as well as some medicines derived from wetland soils and plants. Arguably the most important product on a global scale, fish form the primary source of protein for nearly 1 billion people and constitute a significant part of the diet for many, many more. The majority are marine species, which supply 20% of all animal protein consumed globally. Two thirds of all fish consumed are dependent on coastal wetlands at some

GIS and Modelling Research Cluster 2010
Nile Basin Capacity Building Network ( NBCBN ) 22
stage in their life cycle, a globally important function that far surpasses the actual area covered by these wetlands. Similarly, coral reefs, although covering only a small area of the Earth, are critical sources of fish in developing countries. Productivity levels in wetlands are high. It has been estimated that well managed reefs can produce 15 tonnes of fish and other seafood per square kilometre per year. Annual protein production in swamps and marshes has been estimated at an average of 9 tonnes per square kilometre, and estuaries are thought to be twice as productive. In summary, wetlands provide many ecological functions that are valuable to our quality of life, including recreational opportunities, flood storage, erosion control, and water quality maintenance. For many reasons, as with other natural resources, the monetary value of wetland functions is difficult to quantify. As we continue to lose wetlands, the functions that they provide will continue to increase in value.
2.5 Wetlands Losses and Degradation
Wetlands are impacted by land use activities that occur in or near wetlands, and within the watersheds that drain to them. Historically, wetland impacts have been regulated on a site-bysite basis by federal and state authorities. However, local governments have a very important role to play in wetland protection because they are responsible for the land use decisions that can impact wetlands, and can take a proactive approach that extends beyond individual sites to include the larger watershed. In addition, local governments can protect small or isolated wetlands or other natural resources that might not be regulated under the federal and state permitting programs. Impacts to wetlands can greatly affect watershed health because wetlands are such an integral part of watershed hydrology as mentioned in the last section, and provide many watershed benefits, such as pollutant removal, flood storage, erosion control, wildlife habitat, and groundwater recharge. Despite the strong connection between wetlands and watersheds, few communities comprehensively manage their wetland inventory in the context of local watershed plans. A watershed approach to local wetland management is needed so that wetlands are no longer managed separately from other water resources or on a site-by-site basis. Wetland loss" is the loss of wetland area, due to the conversion of wetland to non- wetland areas, as a result of human activity. "Wetland degradation" is the impairment of wetland functions as a result of human activity. In practice, wetland loss is rarely independent of wetland degradation, since loss of part of a wetland is likely to impair the functions of the remaining wetland area. Conversely, wetland degradation frequently occurs without the loss of wetland area, through upstream impacts on hydrology and water quality, etc. Generally, wetland loss is difficult and costly to reverse, although wetland restoration (the reinstatement of some, or all, pre-existing functions to "lost" wetlands (Hollis 1993) and wetland creation (the introduction of some wetland functions to formerly non-wetland areas) are increasingly popular applied sciences and conservation tools. Changes resulting from wetland degradation are more easily reversed through rehabilitation (the enhancement of the remaining functions and the reintroduction of past functions to degraded wetlands) than is wetland loss. Thus, both wetland loss and degradation relate to the change in quantity and/or quality of the wetland resource around a baseline.
2.5.1. Principal Causes of Wetland Loss and Degradation
The vast majority of the world's wetlands are being used by people in a broad spectrum of activities. Through these activities, and factors emanating from activities occurring outside the sites, wetlands are subject to a range of factors which can lead to loss of wetland area and degradation of wetland quality. Not all activities performed in a wetland or its catchment are necessarily wise or sustainable, and it is these activities which can lead to loss and degradation. Whenever human beings interfere in natural systems like wetlands, there is a risk that damage is done to the wetland. Especially in the past, when wetlands were often considered as wastelands with little value, a lot of damage to wetlands was done. It is estimated that about 50% of the wetlands

GIS and Modelling Research Cluster 2010
Nile Basin Capacity Building Network ( NBCBN ) 23
originally present on the earth by now have disappeared. Growing populations, producing a wide range of waste products and pollution have increasingly put pressure on wetlands. This has led to the deterioration of natural wetland ecosystems, e.g., through eutrophication and introduction of exotic species. Global climate change has also had an effect on the integrity of wetland ecosystems. The Millennium Ecosystem Assessment shows that approximately 20% of the World‘s coral reefs were lost and an additional 20% were degraded in the last several decades of the 20th century. Approximately 35% of mangrove area was lost during this time. Since data are only available from countries with sufficient information, these figures are probably a low estimate. More land was converted to agricultural land since 1945 than in the 18th and 19th centuries combined. Biodiversity, expressed in the size of populations and range of taxonomic groups is declining. The distribution of species is becoming more homogeneous, while the number of species is declining. Currently, some 10 to 30% of mammal, bird and amphibian species are threatened by extinction. Also genetic diversity is declining.. Apparent and underlying causes While it is important that the proximate causes of wetland loss and degradation are identified, the underlying causes are largely socio-economic and political (Kotze, Breen and Quinn 1995, Hollis 1992, Anon. 1996). These include: poverty and economic inequality; population pressures from growth, immigration and mass tourism; social and political conflicts; sectoral demands on water resources; centralized planning processes; and financial policies. The apparent causes are merely the outward expression of the underlying causes. It should be remembered that success in addressing the proximate issues of ecological change is unlikely if the underlying processes are not also addressed. Types of ecological change At a workshop on ecological change in 1992, IWRB (1993) found that the main categories of processes producing ecological change were:
loss of wetland area changes in the water regime changes in water quality unsustainable over-exploitation of wetland products introduction of new species
Analyses of the causes of wetland loss and degradation must be considered at two levels: the direct loss and degradation that occurs to the wetland itself; and the indirect loss and degradation which occur as a result of changes outside (upstream) of the wetland. It should be noted that while a protected area or an effective management plan may be able to tackle those threats occurring within the wetland; such measures will be totally ineffective for threats whose origins are outside the wetland. The types and frequency of ecological change factors leading to wetland loss and degradation vary in relation both to region and to wetland type. Scott and Poole (1989) in their Status Overview of Asian Wetlands analysed the frequency of major threats recorded in wetlands of international importance in Asia, and similar data were presented by Scott and Carbonell (1985), based on the Directory of Neotropical Wetlands. In the Asian study, threats were recorded at 85% of the 734 sites for which information was available, and in the Neotropics the figure was 81% of 620 wetlands. Hunting, pollution, drainage and settlements/urbanization all occurred within the top five major threat categories in both regions. Dugan and Jones (1993) calculated that data provided by the Ramsar Contracting Parties showed that 84% of Ramsar sites had undergone or were threatened by ecological change. Since Ramsar sites are probably better protected against wetland loss and degradation than most other wetlands with a lower conservation status, there can be few wetlands today which are not under some form of anthropogenic threat.

GIS and Modelling Research Cluster 2010
Nile Basin Capacity Building Network ( NBCBN ) 24
The analysis of Frazier (1996) (based on the Ramsar Database) shows that the frequency of occurrence of ecological change factors at Ramsar sites varies between each Ramsar region. In every region, agricultural and pollution impacts, and factors adversely affecting habitats (general habitat loss, conversion, certain species invasions/infestations) figured prominently, albeit at different positions within the top categories. Extent and rates of loss and degradation While the threats of change or potential change in ecological character described above affect most of the remaining wetlands in the world, this is just a "snapshot" of the current situation. Current threats very rapidly turn into wetland loss, and in a historical perspective, these losses have occurred on a massive scale. In most industrialized countries, extensive losses have already occurred; as a consequence, public awareness of wetland values is increasing, and legislative and policy measures to reduce wetland loss are being introduced. In certain parts of the developing world, particularly those with lower population densities, the losses have been less extensive, but the potential for future loss and degradation remains great. Measuring loss and degradation of wetlands Unfortunately, much of the published information on wetland loss and degradation cannot be compared because of the different definitions and techniques employed by the various studies. There is an urgent need to adopt criteria which will enable standard measures of wetlands. For example, where does a wetland start and finish? How often must an area be flooded before it is classified as wetland? The most comprehensive study is that of the US National Wetlands Inventory, on account of its rigorous scientific approach to the identification and description of wetland habitats, standardized protocols for data collection and interpretation, and comprehensive coverage of all wetland habitats across the entire country. This system has been developed over two decades and has cost millions of dollars, an investment outside the immediate reach of most other countries. Satellite remote sensing techniques, data management based on Geographical Information Systems, and improved international communication systems for data exchange and dissemination continue to make advances. However, the most recent studies (Silveira 1996) still suggest that the complexity of wetlands means that satellite data alone is usually not adequate for detecting change in wetlands, and that extensive ground truth data or mapping from aerial photographs is required. These problems in assuring comparability between studies are even more severe when it comes to comparing regional and temporal differences in wetland quality.
2.5.2. Consequences of wetland loss and degradation
The processes of loss and degradation reduce the ability of wetlands to provide goods and services to humankind and to support biodiversity. Examples of the impacts of the loss and degradation of wetlands have been graphically portrayed by Davies & Claridge 1993, and these may include impaired or reduced:
water supply directly to people, to an aquifer, or to another wetland; water flow regulation and flood control; prevention of saline intrusion to both ground and surface water; protection against natural forces (coastal erosion and hurricanes and flooding); ability to retain sediments and nutrients; ability to remove toxins from effluents/polluted water; availability of natural wetland products; opportunity for water transport; gene bank for future commercial exploitation or maintenance of wildlife populations;

GIS and Modelling Research Cluster 2010
Nile Basin Capacity Building Network ( NBCBN ) 25
significance for conservation of species, landscapes or habitats; recreation and tourism opportunity; socio-cultural significance; opportunity for research and education; contribution to the maintenance of existing processes and natural systems at global, regional and local
levels (e.g. microclimate, carbon cycling, etc.).
In industrialized countries, the consequences of the loss and degradation of wetlands have often been mitigated with expensive artificial constructions, such as major flood protection schemes or water purification plants. However, losses of wetlands in developing countries are likely to have a more direct impact than in richer countries, because mitigatory measures are less likely to be implemented due to financial and technical constraints. In addition, the consequences of wetland loss and degradation are likely to be more severe in arid and semi-arid countries (Kotze, Breen and Quinn 1995) because of the scarcity of wetland resources.
2.5.3. Wetlands Losses in Africa
The situation concerning wetland losses in Africa is characterized by an extreme paucity of published quantitative studies, similar to South America. This may reflect both the generally lower rates of losses than in industrialized regions, but also the lack of capacity to undertake such studies in many countries. A review of wetland inventories in Southern Africa (Taylor et al. 1995), gives some information on the extent of wetland resources in 10 countries in the region. Loss figures are given for two areas in Natal – the Tugela Basin, where over 90% of the wetland resources have been lost in parts of the basin; and the Mfolozi catchment (10,000 km2), where 58% of the original wetland area (502 km2) had been lost. The only other quantitative information arises from the wetland inventory of Tunisia, which reports an overall loss of 15% of wetland area, and 84% loss in the Medjerdah catchment (Hollis 1992).

GIS and Modelling Research Cluster 2010
Nile Basin Capacity Building Network ( NBCBN ) 26
3
Wetlands in the Nile Basin
Wetlands are valuable ecosystems that depend on the supply of water for their continued functioning (Kashaigili, 2006). In addition to supporting immense biodiversity, they play an important role in maintaining environmental quality and sustaining livelihoods. In Africa millions of people depend on wetlands for livelihood benefits derived from the ecological functions they perform (Denny, 1991).
Wetlands vary widely because of regional and local differences in soils, topography, climate, hydrology, water chemistry, vegetation, and other factors, including human disturbance. Indeed, wetlands are found from the tundra to the tropics and on every continent except Antarctica. Wetlands have not always been appreciated for their many benefits. Historically, wetlands were perceived as potentially valuable agricultural land, impediments to development and progress, and harbors of vermin and disease (Fischer 1989, NRC 1995, Dahl and Alford 1996, Mitsch and Gosselink, 2000). Prior to the mid-1970s, drainage and destruction of wetlands were accepted practices and even encouraged by public policies. Some people today still hold many of these beliefs in different parts of the world.
The presence of water is the unifying factor behind all wetland ecosystems, providing the conditions under which unique soils, vegetation and fauna are developed. The nutrients are transported to and from wetlands by precipitation, surface runoff, ground water and flooding rivers. Water depth, flow patterns and the duration and frequency of flooding influence the biochemistry of the soils (Mitsch and Gosselink, 1986).
African wetlands are a very important source of natural resources upon which many rural economies depend. Despite their importance, wetlands throughout Africa are being modified and reclaimed. A major factor contributing to these activities is that decision-makers often have insufficient understanding of the economic values of wetlands, so the protection of wetlands is not a serious alternative. Wetlands, however, have numerous goods and services that have an economic value, and economic valuation of wetlands can be applied to highlight this value to decision-makers. Although many economic valuation studies of wetlands around the world have been carried out, most of these studies have focused on wetlands in developed countries, while in those studies carried out for developing countries Africa is seriously underrepresented (Günther Fischer, 2002).
The coming section gives first an overview of wetlands in the Nile Basin in general according to research conducted by (Howard, 2003) then a focus on wetlands in each of the basin countr ies.
3.1 Wetland Types in the Basin The wetlands of the Nile Basin are mostly riverine in origin and many are still dependent on the river for their water needs. However Some are lacustrine and connected to the lakes of the basin while others are truly palustrine – originating from impeded drainage of the watershed or ground water discharge to the surface. The main types of the wetlands in the Nile system are: Swamps, marshes, seasonally inundated grasslands and sedgelands, Isolated swamp forests, Fens, tarns and other montane wetlands, Deltaic/estuarine wetlands and lakes Small (shallow) lakes – both fresh and saline and/or sodic.

GIS and Modelling Research Cluster 2010
Nile Basin Capacity Building Network ( NBCBN ) 27
With swamps and seasonally-flooded grasslands/sedgelands in the majority, wetlands cover more than 200,000 km2 of the Nile River Basin amongst the ten riparian countries. This figure does not include the vast areas of the larger lakes and reservoirs which themselves cover more than 90,000 km2 of open and deeper waters.
3.2 Distribution of the Nile wetlands The Nile River system covers parts of ten countries (and may include some tributaries in an eleventh, Central African Republic). Following is a listing of the more important or extensive wetlands of the Nile River Basin – detailed descriptions of each of these are beyond the scope of this summary paper. Man-made wetlands associated with reservoirs and irrigation schemes are also not described here. It is helpful to divide the natural wetlands of the Nile into four areas for better understanding of their relationships to the main river channels. Wetland types can be further detailed by referring to the common on dominant wetland vegetation they support. This has been described for Africa in some detail by Denny (1985) and for the Nile Basin countries by Hughes & Hughes (1992: 104-109). Reference to the vegetation of some of the Nile wetlands is given below where it is known to the author or described elsewhere – but a description for each wetland would be repetitive and lengthy. 1. Blue Nile wetlands The Blue Nile (Abbay Wenz) arises from the watershed of Lake Tana in Ethiopia which is at 1,830 m.a.m.s.l. There are five main wetland areas in the catchment of the Blue Nile and its surrounds: Lake edge swamps of Lake Tana with mixtures of Typha domingensis, Cyperus spp., Vossia cuspidata,
Ipomoea aquatica, water lilies, etc. and the wetland ―waterberry tree‘, Syzygium cordatum. Upper catchment swamps dominated by cheffe (Cyperus latifolius) and small wetland-edge herbs, Lower catchment riverine swamps dominated by papyrus (Cyperus papyrus), The Dinder/Rahad riverine grass-dominated Lake-like wetlands or mayas, The Dabus swamps – dominated by Typha and Phragmites. The middle level catchment of the Blue Nile has a generally steep gradient with consequent fast-flows and water turbulence which does not encourage the development of wetland vegetation – hence there are very few wetlands in that area. There is a set of wetlands in the catchment of the White Nile which are near the Blue Nile system in south-western Ethiopia and south-eastern Sudan – especially the following associated with the Sobat River system: The Gambela floodplain of the Akobo River (+ Gila and Bara Rivers) - in Ethiopia and Sudan (currently
threatened by invading Mimosa pigra – see Threats, below), The Marchar Marshes (sometimes as large as 6,500 km2 [Sutcliffe & Parks,1999]) that are flooded from
the Sobat River and dominated by reeds (Typha and Phragmites), Southern floodplains of the Pibor River system in the area of Boma National Park in Sudan.
3.2.1 Equatorial lakes wetland systems The term ―equatorial lakes‖ refers to the lakes of the Western Rift Valley in the Nile Basin and the catchment of Lake Victoria. These all have attendant wetland systems which can be characterised as follows: Lake-edge swamps of Lake Victoria and its satellite lakes (e.g. Bisina, Olpeta, Nabugabo, Kanyaboli) –
mostly dominated by papyrus but with other swamp associations such as the tall grass Miscanthidium violaceum and the hippo grass Vossia cuspidata – well-described by Denny (1985),
Lake–edge wetlands of Lakes Albert, George and Edward together with the linking Kazinga Channel,

GIS and Modelling Research Cluster 2010
Nile Basin Capacity Building Network ( NBCBN ) 28
Lake Victoria catchment river wetlands and middle catchment swamps with many species of sedges – e.g. Saiwa swamp in Kenya,
Marshes and swamps of the Mara River system, including the Masurua (or Mara) Swamp in Tanzania, Lake-level floodplains in the Victoria catchment such as that of the Nzoia, Ahero and Sondu-Miriu Rivers
in Kenya and the delta of the Kagera in Sango Bay, Uganda/Tanzania, The 25 lakes and associated swamps of the upper and middle Kagera River system in Burundi and
Rwanda, The Lake Kyoga lacustrine/riverine wetland system, The floodplain swamps of the Semliki River in Uganda/DRC.
3.2.2 Upper White Nile wetlands The White Nile stems from Lake Victoria (1,134,m.a.m.s.l.), passes through Lake Kyoga and then, after a stretch termed the ―Albert Nile‖, descends some 500 m before reaching the Uganda/Sudan border. Notable wetlands in the upper section of the White Nile (all at, or below, 500 m.a.m.s.l.) are: Bahr el Jebel riverine swamps, The ―Sudd‖, Bahr el Ghazal (and Bahr el Arab) swamps and small lakes (e.g. Lake No), White Nile main channel riverine swamps from Malakal to Khartoum. Most notable of these is the extensive Sudd – a vast area of at least 16,200 km2 of permanent swamp and 13,600 km2 of seasonally-flooded grasslands and small water bodies. Its vegetation is dominated by tall grasses, reeds such as Typha domingensis, Phragmites karka and papyrus together with emergent, submerged and floating wetland herbs (e.g. Denny, 1985: 79. The Sudd is probably the largest wetland in Africa which supports millions of people (mainly pastoralists), their livestock, vast herds and flocks of wildlife and a very significant fishery – which is reported to be capable of yielding at least 100,000 tonnes annually but often has much reduced catches as low as a few thousand tonnes (Vanden Bossche & Berncsek, 1991).
3.2.3 Lower Nile wetlands and “others” Lower Nile riverine swamps (from Khartoum northwards to the Aswan/Nubia Lake and then north from
the dam) dominated by papyrus (and irrigation offtakes) and island wetlands – there are >150 islands in the main channel of the Nile River,
The Atbara River system – rising in Ethiopia and Eritrea, traversing eastern Sudan and joining the main Nile channel as the most downstream tributary,
Nile Delta lakes – totaling more than 2,300 km2 in area, Nile Delta estuarine wetlands – becoming increasingly saline since the closing of the Aswan Dams.
3.3 Wetland values in the Nile Basin The wetlands of the Nile Basin (Crafter et al., 1992; Kamukala & Crafter, 1993) share many of the accepted values and benefits of wetlands worldwide (Dugan, 1990) – although no single wetland has all these attributes. Of primary interest are the hydrological characteristics as these have direct impact on the ability of a wetland system to support fish and so fisheries. Such water-related ecological functions include:
Water supply and water storage, Buffering of stream flows to modify seasonal streams to more permanent water sources, Flood amelioration by absorbing flood energy through resistance of wetland vegetation, Erosion control through slowing of sheet and stream flows, Sediment retention and so water quality maintenance,

GIS and Modelling Research Cluster 2010
Nile Basin Capacity Building Network ( NBCBN ) 29
Absorption of dissolved and suspended substances (by wetland vegetation) and consequent improvement of ―water quality‖,
Groundwater discharge and the protection of springs and other subsurface water sources, Groundwater recharge from slowed or standing water, Evapotranspiration as an integral part of the hydrological cycle and as the ―engine of plant
productivity‖ in herbaceous wetlands.
Other wetland values of importance across the Nile Basin are:
Supply of food and medicines (mostly to local people), Sites for agriculture – both immersed (rice, yams, water plants) and mounded (staples and vegetables), Grazing and browse for livestock Fuel for cooking, heating and fish-drying, Fibre from wetland plants for many purposes – from baskets to fences and building materials – but
also as a source of materials for fish traps of many types, Hunting of wetland animals Support of biodiversity – both wetland dependent and wetland independent, Fisheries – both wild and managed.
3.4 Wetland Fisheries With around 100 species of fish in the White Nile system, more than 300 in Lake Victoria and around 25 in the Blue Nile, fish are abundant and diverse in the open waters, rivers and wetlands of the Nile Basin. Many are found in wetlands as adults and even more in immature stages and many are utilised by the numerous fishing communities in the basin. Wetland fisheries can be very productive both for wild (catch) fishing and for the development of aquaculture and modified natural systems. The main species for the Nile wetlands are in the genera Clarias (catfish) and Barbus (barbels) together with several tilapias (Oreochromis spp.). Other notable genera with wetland representatives are Alestes, Labeo, Mormyrus, Schilbe and Synodontis with species of Distichodus, Citharinus, Heterotis and Gymnarchus caught in the Sudd (Bailey, 1987 in Vanden Bossche & Bernacsek, 1991). The African Lungfish, Protopterus aethiopicus, is an inhabitant of wetlands (as well as more open waters) but is well-known in some seasonal wetlands where it aestivates in the dried soil and so is ―hunted‖ during the dry season. A characteristic of wetland fisheries is the variety of traps and ―fences‖ that are used to catch fish that live in situations dominated by submerged or emergent vegetation. Many of these have ―traditional‖ designs adapted to local conditions and most are made from local plant materials – often from the wetlands themselves. Fish ponds are prevalent in some of the Nile wetlands but not widespread throughout the basin. Experiments with modified ponds and excavations in floodplains are proving quite productive – with such ideas as ―finger ponds‖ (which increase the area of fishpond ―edges‖) and the addition of brushwood (masakasaka) to increase feeding and breeding sites. One great advantage of the wetland fisheries in many places is that they can be an alternate use (or one of many uses) of a wetland without the need for wetland conversion. For example inundated agriculture, grazing, plant collection and hunting are all compatible with wetland fisheries – either concurrently or in different seasons. Also the movement of fish from wetlands to and from open waters provides both changing habitats and shelter for fish while offering different fishing opportunities for fishers.
Threats to wetland fisheries Wetlands, and the fisheries they support, are the subject of many threats worldwide – but in the Nile Basin the following are current:

GIS and Modelling Research Cluster 2010
Nile Basin Capacity Building Network ( NBCBN ) 30
Reduction of wetland water supply, wetland water quality and quantity which reduces the productivity of fisheries – usually through wetland alteration for other purposes,
Complete conversion of wetlands and deleterious changes in their catchments – sometimes due to agricultural and forestry practices – also as a result of climate change,
Limiting access to wetland fisheries through increasing number of fishers and general fishing pressures and conflicts,
Increasing pressure for food supply through fishing as other options are removed from the livelihoods of wetland inhabitants,
Deleterious impacts from alien invasive species. Invasive species include the infamous floating water weeds water hyacinth (Eichhornia crassipes), water fern (Salvinia molesta) and water lettuce (Pistia stratiotes) (Howard & Harley, 1998) which are all prevalent in the Nile Basin. There are also invasive emergent and submerged wetland plants – both alien and native – and such invasive animals as crustaceans, mollusks and alien species of fish (Howard & Matindi, 2003). These invaders have arrived in the Nile system through both intentional and unintentional introductions and can cause significant changes in fish habitats through crowding, shading, outright competition, alteration of feeding and breeding sites and vegetation and through the introduction of parasites, pathogens and predators of favoured fish species.
3.5 Research Needs on Wetlands in the Nile Basin Needs for research are endless as the more we learn the more we discover that we do not know – especially of the unseen conditions of fish habitats below the water surface! Nevertheless, in relation to wetlands and fisheries in the Nile Basin, the following are suggested as contemporarily relevant research needs:
To determine the needs of people in the Nile Basin for wetland fish and the supply thereof – especially in wetlands threatened with conversion: this is because we often assume to know the needs of local populations for fish but are not always aware of their preferences, requirements, needs in relation to storage and nutrition, local alternatives and market possibilities,
To assess local threats to wetlands and their component fisheries so as to formulate strategies for the future – this would include wetland catchment considerations, climate change and invasive species likely to impact on wetland fisheries,
To investigate the possible roles for local communities (fishing communities – if these actually exist) in fisheries management and in increasing access to sustainable fisheries,
To examine the status of fish species diversity in the wetlands of the Nile Basin – especially those threatened with conversion through planned developments: this to work towards integrated wetland and fisheries management across the basin ecosystems.
3.6 Focus on Wetlands in the Basin Countries 3.6.1 Uganda
In Uganda, there are two broad distributions of wetland ecosystems, notably the natural lake and lacustrine wetlands, and the riverine and flood plain wetlands associated with the river systems (Reint and Lucy, 2000). The National Environmental Management Authority (NEMA) characterised wetlands of Uganda as swamp wetlands, riverine wetlands, lake edges, flood plains, dambos and artificial wetlands (NEMA report, 1996).
The wetland types based on dominant plants includes freshwater emergent grass swamps dominated by single species (Papyrus, Miscanthus sp., Phragmites sp. Vossia sp.); seasonally flooded herbaceous wetlands where species composition is variable, seasonally flooded wooded grassland; freshwater palustrine forest and freshwater riverine forests. The swamp wetlands have emergent vegetation that usually extends more than 1 m

GIS and Modelling Research Cluster 2010
Nile Basin Capacity Building Network ( NBCBN ) 31
above the mean water level. They are either permanently or seasonally flooded and have extensive area of open water. Where grasses dominate they are called herbaceous swamps, and where woody vegetation dominates they are called swamp forests. The dominant swamp wetlands in Uganda are the fresh-water herbaceous swamps dominated by Papyrus, Typha, Phragmites mauritianus, Cladium mariscus, and Miscanthus (Kaggwa et al., 2001; Maclean et al., 2006).
An inventory of all wetlands in Uganda has been carried out and wetlands in 10 districts have been mapped. This include Bushenyi (250 Km2), Kabale (97 Km2), Kisoro (25 Km2), Ntungamo (101 Km2) and Rukungiri (154 Km2) (MWLE, 1999).
The wetlands in the southern and western part of the country are low gradient drainage system in steep V-shaped valley bottoms with a permanent wetland core, and relatively narrow seasonal wetland edges. This is supported by the high and relatively well distributed rainfall resulting in a heavily vegetated wetland covered mainly by Cyperus papyrus, Typha, Phragmites, or swamp forest. In the north, where rainfall is less abundant and unreliable, the permanently wet plains are covered with grasses like vossia and oryza species, and the seasonal wetland plains consist mainly of natural grasslands. In the east a network of small, vegetated valley bottoms exist in a slightly undulating landscape largely dominated with grass vegetation (Reint and Lucy, 2000; Tindamanyire, 2002). The distribution of wetlands in Uganda can be summarised as follows:
Lake-edge swamps of Lake Victoria and its satellite lakes such as the Nabugabo dominated by papyrus but associated with tall grasses species like Miscanthidium, violaceum, Loudetia
phragmitoides, and Vossia cuspidate (Denny, 1985; Kansiime and Nalubega, 1999; Okot-Okumu, 2004);
Lake edge wetlands of Lakes Albert, George and Edward together with the Kazinga channel; Lake-level floodplains in the Lake Victoria, which include the delta of the Kagera in Sango Bay
(Fuller et al., 1998); The Lake Kyoga lacustrine/riverine wetland system and; The floodplain swamps of the River Semliki.
The Uganda‘s wetlands have intrinsic attributes, perform many biophysical functions, produce goods and services, and play a significant role in the socio-economics of the country as well as habitat for the wildlife.
According to Luwun and Ucuba (1998), 66% of the communities around wetlands prefers the immediate economic benefits of the wetlands and 22% are in favour of the wetlands services. Generally, wetlands in Uganda are not perceived as a key-resource by the majority of Ugandans, even by those who live right on their edge. For specialised groups a certain product from a wetland may be essential for their income, and those are the groups that may have an immediate interest in wetland resource. On the other hand, some adjacent communities are not willing to invest in wetland resource unless value can be added to existing products (Reint and Lucy, 2000).
Wetlands of Uganda harbour a substantial population of fish, which are caught as an important food item for the rural communities. Apart from the provision of the food, cooking oil is also extracted from the fish (Alexia, 2002). Some fish products provide an important source of foreign exchange to the government.
Apart from Lake Victoria, Lake Kyoga, and the Rift Valley lakes, most of Uganda‘s surface water is absorbed and stored in wetlands. The stored fresh water is slowly release either to the underground, or laterally towards the major drainage basins. The slow release of water increases water availability during the dry season for domestic use, edge cultivation and livestock watering (Kyambadde, 2005). This makes wetlands to be an important source of water for human, livestock, agriculture and industry. Wetlands helps maintains/improves the water quality, making it possible for rural communities in Uganda to obtain clean drinking water at no cost. The water supply source for Masaka and Bushenyi towns are wetlands. The Nakivubo wetlands, also perform the same role for Kampala water supply (Emerton et al., 1999).

GIS and Modelling Research Cluster 2010
Nile Basin Capacity Building Network ( NBCBN ) 32
Wetlands contain abundant wildlife ranging from mammals, birds and reptiles that are hunted for meat, skins and eggs. Wild game and bird constitute an important sources of protein for many rural communities and are also valued as commercial products (Mafabi, 2000). For instance, Sango Bay and Lutembe Bay are known for habituating white-winged black tern, which attracts tourists for bird watching (Huising, 2000). The local people mentioned that permanent wetlands in the Lake Victoria still have plenty of sitatunga and otter. African elephants and buffalos exist in Sango bay wetlands. Hippos are in various bays along the shores of Lake Victoria and Katonga wetlands. Monkeys mostly of Red-tailed and Black and White Colobus are also found in the swamp wetlands. Site that have many wetlands birds include Mabamba, Lutembe bay (have grey-headed gulls and terns), Sango bay, Kasensero, Diimo, Kasenyi, Lake Nabugabo, Kyogya and Nabajuzi; Majanji.
As reservoirs of moisture during the dry periods, wetlands are potential agricultural land, and many have been used in the past on a small scale to cultivate maize, sorghum, millet, beans, and other traditional crops. The cultivation of seasonal wetland edges is carried out throughout the country. In eastern Uganda, many wetlands have been converted into agricultural land for rice production and sugar plantation. Large scale rice schemes such as Kibimba, Doho and Olweny, were originally wetland areas in the Lake Kyoga Basin (Tindamanyire, 2002). The communities around these rice schemes carries out small holder rice cultivation in the wetland, and derive a large portion of their cash income from rice cultivation (Reint and Lucy, 2000).
The function of wetlands in water purification is well known. As water passes through wetlands, the combination of reduced current velocities and the biochemical interactions of wetland soils and plants acts as a natural filter, removing silt, nutrients, pathogens, metals, hydrocarbons and other pollutants (Christine, 1998; Kansiime and Nalubega, 1999). Papyrus is instrumental in the fixing of nutrients (Huising, 2000). Many urban towns including Kampala are dependent on wetlands for polishing sewage effluent. For instance, the Nakivubo wetland treats wastewaters which do not pass through the sewage treatment plant and the partially treated sewage effluent from the sewage plant (Emerton et al., 1999).
Hydrological and environmental properties of wetlands in Uganda
In Uganda, the water regime of wetlands is determined by many factors, of which rainfall is the most important. Most part of Uganda has a bimodal rainfall regime. The southern half of the country receives between 1200 and 2000 mm of rain, the drier areas in the north-east may receive up to 600 mm in one rainy season (Kyambadde, 2005)
In the central part of the country (area around Lake Kyoga) ground water recharge occurs during monsoonal rainfall. This occurs twice each year as a consequence of the bimodal rainfall distribution. The region receives an average rainfall of 1400 mm year that falls primarily during two distinct rainy seasons. The first season (short rain) occurs between April and May, and the second season (long rains) falls between August and October (Taylor and Howard, 1996). In south-western Uganda, groundwater recharge result from monsoonal precipitation but, this occurs only in years of exceptionally high rainfall. Surface runoff occurs primarily during the two rainy seasons each year and amounts to 34 mm/a (Taylor and Howard, 1999).
The Central and Eastern parts of Uganda are heavily endowed with both permanent and seasonal wetland types. The wetlands in Central Uganda are multi-resourced, a number of them integrated with forest resources, while those in Eastern Uganda are largely dominated with grass vegetation. They are both rich in biodiversity including bird species, wild animals and butterflies.
3.6.2 Rwanda (Rugezi marshes)
The Rwanda is a country whose geological history has permitted a succession of valleys, hills and mountains. The current geological aspects have inherited from tectonic activities and erosion. Therefore it is clear to make distinction between highland marsh and lowland marshes. The highlands marshes mostly peaty are located in

GIS and Modelling Research Cluster 2010
Nile Basin Capacity Building Network ( NBCBN ) 33
para-appalachian relief, while lowland marsh is sometimes made up of mineral soils and peat. The latter originated from the reorientation of drainage network due uplift of volcanic chain in the North of country.
In the Rwandan context, the term "marsh" is often used to define all types of wetlands, either peat bogs of high altitude like Rugezi, or complexes of the big valleys of peaty soils of Bugesera or Akagera or group of valleys of mineralized soils used for the agriculture or the pasture (MINITERE, 2003).
The lack of distinction about wetlands types in Rwandan context has complicated their management in terms of their resources allocation; agriculture, conservation, tourism etc. In this context, the wetland management, since the independence period was a responsibility of Ministry of Agriculture whose objective was the drainage to avail land as response to demographic pressure and food security (Hategekimana, 2005); In that period the hydrological and ecological importance in term of water quality and quantity management and plants and wildlife habitat were unknown. The term marsh drainage prevailed until it became replaced by marsh development. The MINAGRI with support from international donors adopted the marsh development schemes equipped with water regulation structures to avoid the drying up of soils.
Wetlands degradation in Rwanda is closely linked to development in urban centers countrywide. Many construction activities being carried out require inputs from wetlands such bricks and sand, a factor that has led to over exploitation of the resource.
High demand for brick making coupled with sand-mining due to current development construction in the country has led to misuse of wetlands in the country. Such commercial gains are practiced by people to make ends meet regardless of environmental degradation. Location of industries within the wetlands such as Gikondo industrial area, Utexrwa greatly affects the normal functioning of the resource to clean waste- water and siltation of streams.
The ecological agro zone of Buberuka in which the Marsh of Rugezi is integrated constitutes a geographical set of high mountains culminating at an altitude ranging from 1900 to 2500 m above sea level. It is a relief of the Appalachian type where the quartzitic assembly lines alternate with steep-sided valleys of 300 to 400 m and laying on schistose hills from 50 to 100 m relative heights (Jost C, 1987). The slopes, as a whole convex, and with slopes often higher than 50 %, are dissected by transverse small valleys which make locally them concave. A dissymmetry with weak slope towards the east is noticed often, in particular towards the Buhita sector and the Kivuye sector. Altitudes vary from 2050 to 2550 m, that is to say a unevenness of 500m. The mean altitude is of 2325m. The majority of the tops culminate between 2375 and 2400. Only the tops of Kivuye and Kindoyi (northern west subcatchment) and of Kivuye Bassin pouring (north-eastern) culminate to 2500 m.
This high altitude swamp is situated immediately east of Lakes Bulera and Luhondo below the high peaks of the Virunga volcanoes. It is 30 km long, oriented NW-SE in the valley of the Hondo River, and reaches a maximum width of 6 km at the southeastern end. It drains via the Hondo River, from its northwestern end, over two waterfalls, into Lake Bulera. It contains Cyperus papyrus, Miscanthidium violaceum, and several lesser species of Cyperus and Scirpus. Part of it has been drained and cultivated in recent years, and it is not protected. The fauna includes an abundance of amphibians, a variety of water birds including , egrets, ducks, warblers and weavers, and Aonyx capensis, Lutra inaculicollis and some rodents among the mammals. It is an important reservoir, buffering inflows to lake Bulera to which it drains.
The catchment of the Marsh of Rugezi presents extremely steep slopes which are in general of more than 25% and often exceed 55% (MINAGRI, 2001). A summary analysis of the topography of this catchment was established by the report of RRAM (1987). The slopes of the marsh varies from 1 to 2%; the slope of the sides of the spurs which skirt the marsh of the two with dimensions ones is about 2 to 7%; this category is more located on the northern slope of the marsh in the sector of Buhita. These spurs located with the bottom of the slope are overhung by mountainous slopes whose slope varying from 20 to 30% seems most dominant in the catchment area. The strongest slopes from 30 to 60% are characteristic of the quartzitic summit peaks.

GIS and Modelling Research Cluster 2010
Nile Basin Capacity Building Network ( NBCBN ) 34
They are presented in small islands more at the south in the sectors Kivuye and in western north on the peak of Kayange.
The Rugezi Marsh and its catchment lay on a geological substrate of the Precambrian base of the Burundian Geologic system (Rossi G, 1980). The Precambrian rocks are of argillaceous, sandy and conglomeratic origins and which were métamorphized. This metamorphism gave rise to rocks like the quarzites, the quartzophyllades, and phyllites passing at the base sandstones with schists with muscovites by the metamorphism of contact. This Burundian orogeny, dated between 1600 MY and 40MY resulted with overall fold North West and South East which took place in the North-West of Rwanda and being prolonged towards Uganda. The quartzitic bars seem to be leveled by a phase of para-Appalachian erosion before being carried in relief by the post tertiary tectonic movements, that where the name of erosion surface of Byumba took place.
Hydrological and environmental properties of wetlands in Rwanda
In 2001, thanks to ADB funds, the ministry of agriculture carried out a master plan of marshlands development, soils conservation and watersheds protection. This scheme led to wetland classification in accordance with their hydrological aspects, their level of degradation and recommended the conservation of highland wetlands. In 2003, the Ministry of Environment, Lands and Mines (MINITERE, 2003) with support from GEF, finalised the action plans on environment and biodiversity conservation. This study showed that, although the wetland plays an important role in water management and biodiversity conservation, they were still threatened by agricultural encroachment, plants and fish resources overexploitation.
In May 2003, the same ministry recommended a study on the assessment of biological diversity of wetlands. This study came up with a classification of wetlands worthy as Ramsar sites. It recommended that those sites should get the status of conservation by implementation of an ecosystem approach. These observation have shown that the knowledge, consciences, political and public awareness in wetlands management have been late. As results, the wetland degradation reached to a catastrophic level.
The hydrographic network of the Rugezi Marsh catchment is not very dense (0,12km/km 2). It is a hydrographic network adapted because it is controlled by parallel structures of the valleys and quartzitic bars (Jost C, 1987). The rivers, with favor the lithological weakness, recut the quartzitic bars in transverse valleys. This hydrographic network is slightly arranged hierarchically because of its localization in the higher stage of the catchment of Mukungwa (headwaters of Kagera River). In sub-catchment of the main valley of Rugezi, the rivers present an aspect in bayonet; the effluents are perpendicular to the main river: Rugezi. Only the small brooks and the torrents dominate there. On the other hand, subcatchment of Kamiranzovu branch possesses a more arranged hierarchically hydrographic network.
The Rugezi Marsh catchment presents soils derived from the schistous and quartzitic rocks. According to the Rwanda soil map, the soils on the slopes bordering the Marsh of Rugezi are soil often less deep of predominance to a degree of mean deterioration and an argillaceous texture with muddy. The soils of the tops of hills are generally not very deep. On the strongly eroded tops, like on the downward quartzitic peaks, the soil layer is well drained with a degree of minimal deterioration, very shallow ( 50 cm) of a clayey texture, silty and clayey sandy and silty-sandy (MINAGRI, 2001).
At the station of Rwerere-hill, annual average precipitations are there about 1200 mm, the most rainy month is April with an average of 192, 4 mm. The dry months correspond to July and August with an average rainfall of 27, 5 m the annual average temperature at the station of Rwerere hill is of 18°C, the relative humidity is 80 % (MINAGRI, 2001).
The station of Rwerere-Marsh, which represents better the ecology of the marsh, records little lower precipitation; the annual average rainfall is of 1100 mm the monthly average temperature varies from 8 to 15, 3°C. The hottest month is April with a monthly average of the maximum temperature of 26, 9°C. The coldest
GIS and Modelling Research Cluster 2010
Nile Basin Capacity Building Network ( NBCBN ) 35
month is July with a monthly average of the minimal temperature of 0°C. This situation confers on the marsh a temperature pattern fresh and very stable known as isomesic: the annual average temperature up to 50 cm lies between 8 and 15° C and the difference between the hottest month and coldest is of less 5°C (MINALOC, 2004). Indeed, the role of altitude is dominating in the distribution as of these climatic parameters.
3.6.3 D. R. Congo
Congo covers 342 000 km2, and with a population of 1 660 000 (1983) has a mean population density of 4.9 persons/km2. It lies between 3°34'N and 5°00'S, and 11°11' and18°35'E. By far the largest wetland in Congo covers the Cuvette Congolaise, the large low lying area between the Oubangui/Congo Rivers and the western hills. Here well over 6 500 000 ha are subject to permanent or seasonal inundation. Another important wetland system occurs in the headwater basin of the Ivindo/Djoua River in the northwest, between 470-600 m asl. In the southwest, wetlands occur on the tributaries of the Kouilou River leaving the Massif du Chaillu, and on the Plain of Dihesè. Other wetlands occur on all river systems of the coastal plain, and mangroves occur in Conkouati Lake and in the estuaries of the Ngouniè, Kouilou and Loeme Rivers. Wetland Flora About 65 % of Congo is covered by rain forest and 25 % by savanna, with areas of short grassland, various types of herb swamp and gallery forest comprising the remaining 10%. Much of the rain forest is swamp forest, and this covers some 25 % of the total land surface. The savannas are almost entirely situated south of the equator. Large areas of floating grassland occur in the swamp forest along river courses in permanently inundated situations in the Cuvette Congolaise and on M'Bamou Island in Malebo Pool. These are dominated by Echinochloa pyramidalis, Leersia hexandra, Oryza barthii, Vossia cuspidata, and some large sedges. These species all root in the mud, but generally emerge above the water surface. The vegetation is dense and often develops into free-floating rafts containing other hygrophilous plants, principally species of Laurembergia, Ludwigia, Polygonunz, Stipularia and Utricularia, with Cyclosorus striatus and occasional plants of Cyrtosperma senegalense.
Table (3-1) illustrates the potential wetlands areas in the Democratic Republic of Congo (After Thompson 1985, Howard-Williams &Thompson 1985), W= extent during wet season, D= extent during dry season (permanent).
Table 3-1: The potential wetlands areas in the Democratic Republic of Congo
Area Countries Wetlands type Extent (in Km2)
Upemba DR Congo Swamps 8,500 (W)
4,500(D)
Kamulondo depression DR Congo Shallow
lakes,swamps and floodplain
11,800(W)
7,040(D) Tumba DR Congo Shallow lake 767 Chesi DR Congo Shallow lake 41
Mai Ndombe DR Congo Shallow lake 2,300 Kifukula depression DR Congo, Zambia Swamps, floodplain 1,502
Mweru (Luapula river) DR Congo, Zambia Shallow lake (Mweru) 4,580
Middle Congo swamps DR Congo, Congo Riverine swamps and floodplains 40,550
Malebo Pool DR Congo, Congo Shallow riverine 600

GIS and Modelling Research Cluster 2010
Nile Basin Capacity Building Network ( NBCBN ) 36
lake
Ruzizi river DR Congo, Rwanda, Burundi
Floodplain and swamps ?
Semliki delta Uganda, DR Congo Floodplain, delta ? Parc national des
Mangroves. DR Congo Swamplands 6600
Parc national des Virunga. D R Congo Swamps 80000
Parc national des Mangroves: Bas-Zaïre; 660 km2 ; 05º45‘S 012º45‘E
Two plateaus bordered by swamplands along the Zaire River, including coastal and riverine waters, inland ponds, and swamps. Vegetation consists of wet grassland interspersed with forest savanna, grassland savanna, swamp and mangroves. The site supports important fish and crustacean reserves for local fisheries. Nine species of rare or endangered mammals occur, including the manatee; six bird and eight reptile species, including marine turtles, are at risk from habitat destruction. Human activities include fishing, the gathering of medicinal plants, and subsistence cropping.Threats include extensive fuelwood cutting, refinery pollution, and uncontrolled urban development.
Parc national des Virunga: Nord-Kivu; 8000 km2; 01º15‘S 029º30‘E
Lying astride the equator and situated in the African Rift Valley, the site contains most tropical biotopes and boasts some of the most substantial concentrations of wild mammals in Africa, or indeed in the world. The Park fringes several biogeographical regions, includes volcanoes recent in origin and still active, and two large lakes. The area is important feeding and wintering ground for migratory birds and is one of the few places where mountain gorilla can be studied in their natural environment. The large mammals include endangered and endemic species. Archaeologically important, the oldest stone tools in the world have been discovered along the lake shores. Human activities include tourism, conservation education, fishing, hunting, subsistence farming and agroforestry (fuelwood). There is a research center in the park.
The Pool Malebo:
It is a lake-like widening in the lower reaches of the Congo River. Facing each other on opposite banks of the Pool are the national capitals of "the two Congos". The Pool Malebo is about 35 km (22 mi) long, 23 km (14 mi) wide and 600 km². Its central part is occupied by M'Bamou or Bamu Island (180 km²), which is Republic of the Congo territory. The pool is shallow with depths of 3 to 10 m, while water levels vary by as much as 3 m over the course of a year at an average altitude of 272 m. The capital of the Democratic Republic of the Congo, Kinshasa, and the capital of the Republic of the Congo, Brazzaville, are located on opposite shores of Pool Malebo which makes them the two closest capitals in the world. The Pool is the beginning of the navigable part of the Congo River upstream to Mbandaka, Kisangani and Bangui. Downstream below it, the river descends hundreds of meters in a series of rapids known as the Livingstone Falls to reach sea level at Boma, Congo after a trajectory of 300 km.
The Virunga National Park: (formerly Albert National Park)
It lies from the Virunga Mountains, to the Rwenzori Mountains, in the eastern Democratic Republic of Congo, bordering Volcanoes National Park in Rwanda and Rwenzori Mountains National Park in Uganda. Covering 7,800 square kilometres (3,000 sq mi) it was established in 1925 as Africa's first national park. It was classified as a World Heritage Site in 1979. In later years it has become known for its mountain gorillas, although poaching and the Congo Civil War have seriously damaged its wildlife population. The park is

GIS and Modelling Research Cluster 2010
Nile Basin Capacity Building Network ( NBCBN ) 37
managed by the Congolese National Park Authorities, the Institut Congolais pour la Conservation de la Nature (ICCN).
The national park covers the western shores of Lake Edward, known for its hippopotamuses (depleted by more than 95 percent in 2006) while elsewhere, marshland, grassland plateau and plains dominate the park. The Ruwenzori Mountains lie on the Ugandan border and rise to alpine meadows and a glacier, while Nyiragongo and Nyamuragira are both active volcanoes with substantial associated lava plains. Although mountain gorillas are now extremely rare, successful conservation work has secured the remaining populations. In fact, they increased during the years of political upheaval in the region (1994-2004). It is believed that both savanna and forest elephants and chimpanzees can still be found in Virunga, along with Okapi, giraffes, buffaloes and many endemic birds. The neighbouring Mount Hoyo area was managed with the park and is home to a population of Bambuti Pygmy people, caves and waterfalls, but since the civil wars, the park has suffered somewhat. Land invasions and intense poaching have challenged the park authorities to the limit, but most rangers have remained active.
Livingstone Falls:
Livingstone Falls ('Chutes Livingstone') named for the explorer David Livingstone, are a succession of rapids on the lower course of the Congo River in west equatorial Africa, downstream from Malebo Pool in the Democratic Republic of Congo. The falls consist of a series of rapids dropping 270 meters in 350 kilometers. It ends in Matadi in Bas-Congo. The Congo River has the second largest flow rate in the world after the River Amazon, which has no falls or rapids (except near its sources). The lowest rapids of the Livingstone Falls therefore are the world's largest waterfall in terms of flow rate, provided one accepts rapids as being a waterfall. Though he explored the upper Congo, David Livingstone never travelled to this part of the river; the falls were named in his honour by Henry Morton Stanley.
Since the falls are a barrier to navigation on the lower part of the river, the Matadi-Kinshasa Railway was constructed to by-pass them. On an expedition known as 'Africa-Raft', Philippe de Dieuleveult and six members of his party disappeared during a descent of these rapids around Inga on August 6, 1985.
Lake Mai-Ndombe:
Lake Mai-Ndombe (French: Lac Mai-Ndombe) is a large freshwater lake in Bandundu Province in western Democratic Republic of Congo, at 2° S 18.3333333° E. It drains to the south through the Fimi River into the Kwa and Congo Rivers. Known until 1972 as Lake Leopold (after king Leopold II of Belgium); Mai-Ndombe means ―black water‖ in Lingala. The lake is of irregular shape and ranges in depth from only 5 meters (mean) to 10 meters (maximum). Covering approximately 2,300 square km, it is known to double or triple in size during the rainy season. Its waters are oxygenated throughout their depth and the pH ranges from 4.2 to 5.5. Low, forested shores surround it with dense, humid equatorial rainforest prevailing to the north and a mosaic of forest and savanna to the south.
Thysville Caves:
The Thysville Caves are a cave complex in the Democratic Republic of the Congo, located near the town of Mbanza-Ngungu (formerly Thysville). The cave complex is fed by tributaries of the Lower Congo River, and extends across an area of 750 square kilometers. Flowing water carries nutrients from the surface into the caves, which nourishes aquatic life adapted to the lightless environment. The caves are home to an endemic blind cyprinid fish, Caecobarbus geertsii, listed as endangered in the IUCN Red List. The caves are relatively unknown scientifically, and may be home to other endemic fish and invertebrate species.

GIS and Modelling Research Cluster 2010
Nile Basin Capacity Building Network ( NBCBN ) 38
Lake Tumba:
Lake Tumba is a shallow lake in northwestern part of the Democratic Republic of the Congo. It is located at around 0°50′S, 18°0′E and has an area of 500.00 km² and is from 2 to 6 m deep. It is the part of the Congo River basin. Lake Tumba hosts 114 species of fish. Lake Tumba was explored in 1883 by Henry Morton Stanley.
Western Congolian swamp forests:
The Western Congolian swamp forests are an ecoregion of the Republic of the Congo and Democratic Republic of the Congo. Together with the adjacent Eastern Congolian swamp forests, it forms one of the largest continuous areas of freshwater swamp forest in the world. It is a flooded forest with a high canopy, dense undergrowth and has a muddy floor. It has not been disturbed very much by outside influences and so remains largely pristine as getting through this forest is called "almost impossible". The ecoregion contains areas of permanently flooded swamp forest, seasonally flooded swamp forest, and flooded grassland. The permanently flooded swamp forests are home to extensive stands of Raphia palm. Trees in the seasonally flooded forests include species of Garcinia and Manilkara. The ecoregion is home to the endangered Western Lowland Gorilla (Gorilla gorilla gorilla) and African Forest Elephant (Loxodonta cyclotis).
Hydrological and environmental properties of wetlands in Congo (Pool Malebo)
The Pool Malebo is a swampy depression of circular shape east of the city of Kinshasa which lines the left bank of the river. It is an overflow for the river system which drains hills situated in the South of Kinshasa and establishes(constitutes) the littoral part of the municipalities of Limete ( Kingabwa), Masina and Not N‘sele. The exact surface is not well known, It is being on a length about 30 km and on a width of 5km at most. Different studies led before within the framework of the projects of frame allowed to identify about 6000ha aménageables. The perimeter of the Pool Malebo is situated in about of 4°23 ' of and south latitude 15°25 ' and of longitude is and more or less 277m of height (IGERHA, on 2005).
Kingabwa's swampy site joins in the region of the Pool Malebo, one of the four subdivisions géomorphologiques of the city of Kinshasa the side of the plain of Kinshasa, the terrace of 325m and of the zone of hills (FLOURIOT J. and al. On1975). The sandbank of the Pool Malebo is a low swampy plain which outlines and drawing change ceaselessly.
The technical index card of the Pool indicates:
A substratum of will can (soft stoneware) having a light pendage general towards the Northeast. A maximal width of 25km. A weak average depth; the main channel varying between 5m and 14 m in the right of the river not N‘djili. Level variations of 3,25m in the right of the river Not djili. Level variations of 4,35m, in the port(bearing) of the ONATRA, in the mouth of the river FUNA. A weak power érosif.
The geologic context on the scale of the Pool Malebo appears in the following way (MBEMBA, on 2004). The recent alluviums of the river and the rivers sablo clayey are situated in the swampy extensions of the low plain of Kinshasa in the wet valleys of which the Pool Malebo; So, the base or the pedestal is established (constituted) by cliffs gréseuses of the précambrien knew under the name of series of Inkisi.
The change of stonewares ending mainly in the forming (training) of sands, the grounds of Kinshasa are essentially established (constituted) average sands and unrefined sands. In valleys and swampy depressions, these grounds are richer in clays resulting at the same moment from the change of stonewares feldspathiques in environment (middle) hydromorphe, of the alluvionnement and the colluvionnement.

GIS and Modelling Research Cluster 2010
Nile Basin Capacity Building Network ( NBCBN ) 39
The pond in which is situated the Pool Malebo is that of the release of the river Congo; but to Kingabwa our experimental site, it is not the river N‘djili which is the main stream. It divides the Pool into 2 big hydrographic areas according to the direction (management) of rivers. However, the waters of the swamp are in touch with those of the river Congo. The average of annual precipitation is 1559,2 mm over a period of 10 years (on 1995 - 2005). The behavior of ―the regime pluviométrique‖ can be also described as: A dry period of 4 months which extends of in the middle of May in the end of September; A rainy season of 8 months, of the end of September in in the middle of May and the biggest volumes of precipitation fall in April with 229,6 mm of rains on average.
The Pool Malebo abounds in potentialities for the extension of surfaces in the fault organizations hydro agricultural. It is mainly the culture of the rice which is in cause here. The extension of ―surfaces rizicoles‖,
the improvement of the return and the institution of two harvests a year due to suited organizations, can contribute to reduce appreciably the dependence of Kinshasa to imported rice.
One of the first conditions of this organization remains to protect the 60 km2 from swampy lands against the inconvenient invasion of the wild waters, wherever from they come. Wished protection is possible only with organizations which lead (drive) the total mastery of the waters of irrigation and drainage. The quantity of these waters on the lands of culture must be able to be regulated according to speculations and according to periods. There are two models of organization hydro agricultural which one can apply to the Pool Malebo: there is a summary organization and an organization with total mastery of waters (PNUD / UNOPS, on 1998).
3.6.4 Tanzania
Tanzania has an area of 945,000 km2 (population of 33 million people (2002)), and thus a mean population density of 34.9 persons/km2. It stretches approximately 1200 km from north to south between latitudes 1°00' and 11°36'S, and 1230 km from west to east between longitudes 29°21' and 40°29'E (Figure 3-1). It is bounded by Mozambique in the south, by Malawi, Zambia, Zaire, Burundi and Rwanda in the west, by Uganda and Kenya in the north, and by the Indian Ocean in the east. The country includes the islands of Zanzibar and Pemba and other offshore islands in the Indian Ocean. The Indian Ocean coast is highly indented and some 1300 km long, excluding offshore islands, while in the southwest there is a frontage of 305 km to Lake Malawi and another of 650 km to Lake Tanganyika in the central west. In the northwest there is a frontage of 1420 km on to Lake Victoria.
Figure 3-1: Major wetlands of Tanzania
Source: Modified from Kamukala and Crafter (1993)

GIS and Modelling Research Cluster 2010
Nile Basin Capacity Building Network ( NBCBN ) 40
Geographical Features Tanzania is the biggest of the East Africa countries (i.e. Kenya, Uganda and Tanzania). It has a spectacular landscape of mainly three physiographic regions namely the Islands and the coastal plains to the east; the inland saucer-shaped plateau; and the highlands. The Great Rift Valley that runs from north east of Africa through central Tanzania is another landmark that adds to the scenic view of the country. The rift valley runs to south of Tanzania spliting at Lake Nyasa; one branch runs down beyond Lake Nyasa to Mozambique; and another branch to north-west alongside Burundi, Rwanda, Tanzania and western part of Uganda. The valley is dotted with unique lakes which include Lakes Rukwa, Tanganyika, Nyasa, Kitangiri, Eyasi and Manyara. The uplands include the famous Kipengere, Udzungwa, Matogoro, Livingstone, and the Fipa plateau forming the southern highlands. The Usambara, Pare, Meru, Kilimanjaro, the Ngorongoro Crater and the Oldonyo Lengai, all form the northern highlands. From these highlands and the central saucer plateau flow the drainage system to the Indian Ocean, Atlantic Ocean, Mediterranean Sea and the inland drainage system. Climate Tanzania has a tropical type of climate. In the highlands, temperatures range between 10oC and 20oC during cold and hot seasons respectively. The rest of the country has temperatures never falling lower than 20oC. The hottest period spreads between November and February (25oC – 31oC) while the coldest period occurs between May and August (15oC – 20oC). Two rainfall regimes exist over Tanzania. One is unimodal (December - April) and the other is bimodal (October -December and March - May). The former is experienced in southern, south-west, central and western parts of the country, and the later is found to the north and northern coast. In the bimodal regime the March - May rains are referred to as the long rains or Masika, whereas the October - December rains are generally known as short rains or Vuli. Wetlands Wetlands in Tanzania have been classified into three categories (Mwanukuzi, 1991):
1. Coastal wetlands including mud flats, marshes, mangrove swamps, estuaries and deltas. They dominate in Tanga region towards the Kenyan border and support 16.2 km2 of mangrove swamps in Mtwara and 62 km2 in Lindi in the south. They are characterized by heavy saline soils.
2. Rift valley wetlands in the rift depressions and characterized by salt lakes, plays, swamps and short streams with inland drainage. Soils are heavy and are affected by salinity.
3. Wetlands of the highlands drainage basins, results from rivers originating in the highlands and meandering through the plains forming lakes, swamps and flood plains. They are characterized by fertile alluvial soils of varying textures.
The important wetland systems of Tanzania include the Upper Kagera River lakes and floodplain (240 km2 shared with Burundi and Rwanda), the Lower Kagera River lakes and floodplain (180 km2 shared with Rwanda), the Usangu floodplain and swamp (518km2), the kilombero floodplain (6,647 km2), the floodplains and swamps of Malagarasi (7,357km2) and Wembere, and the swamps of Moyowosi and Lake Victoria. Tanzanian wetlands are mostly utilized for crop production especially rice and grazing. Wetlands have been, and are, the basis of community economic activities. They generate many benefits and spread risks especially during periods of water scarcity by providing a source of arable land and grazing. In this way they contribute to sustaining rural livelihoods and increasing food security. However, wetlands are sensitive ecosystems that are subject to stress as a result of changes in land use, resources extraction, water regulation, drainage and pollution (van den Bergh et al., 2001). Reducing the stress on wetlands requires a spatial matching between physical planning (land use and water management), hydrological and ecological process, and economic processes (van den Bergh et al., 2001).
The global climate changes that result in the rising of sea water level have also some impacts on wetland resources (Day, 2000). To conserve and protect the remained wetlands, thoughtful planning and regular monitoring are required. The primary indirect drivers of degradation and loss of rivers, lakes, freshwater marshes, and other inland wetlands (including loss of species or reductions of populations in these systems) have been population growth and increasing economic development (Millennium Ecosystem Assessment,
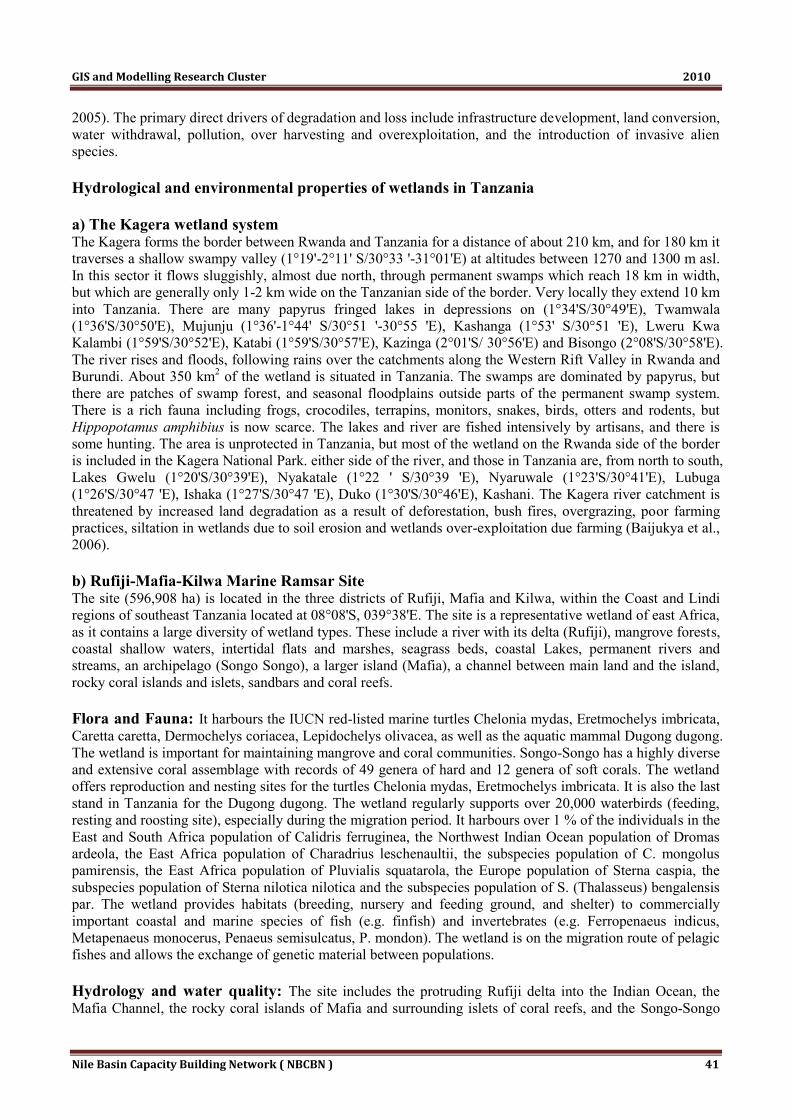
GIS and Modelling Research Cluster 2010
Nile Basin Capacity Building Network ( NBCBN ) 41
2005). The primary direct drivers of degradation and loss include infrastructure development, land conversion, water withdrawal, pollution, over harvesting and overexploitation, and the introduction of invasive alien species.
Hydrological and environmental properties of wetlands in Tanzania a) The Kagera wetland system The Kagera forms the border between Rwanda and Tanzania for a distance of about 210 km, and for 180 km it traverses a shallow swampy valley (1°19'-2°11' S/30°33 '-31°01'E) at altitudes between 1270 and 1300 m asl. In this sector it flows sluggishly, almost due north, through permanent swamps which reach 18 km in width, but which are generally only 1-2 km wide on the Tanzanian side of the border. Very locally they extend 10 km into Tanzania. There are many papyrus fringed lakes in depressions on (1°34'S/30°49'E), Twamwala (1°36'S/30°50'E), Mujunju (1°36'-1°44' S/30°51 '-30°55 'E), Kashanga (1°53' S/30°51 'E), Lweru Kwa Kalambi (1°59'S/30°52'E), Katabi (1°59'S/30°57'E), Kazinga (2°01'S/ 30°56'E) and Bisongo (2°08'S/30°58'E). The river rises and floods, following rains over the catchments along the Western Rift Valley in Rwanda and Burundi. About 350 km2 of the wetland is situated in Tanzania. The swamps are dominated by papyrus, but there are patches of swamp forest, and seasonal floodplains outside parts of the permanent swamp system. There is a rich fauna including frogs, crocodiles, terrapins, monitors, snakes, birds, otters and rodents, but Hippopotamus amphibius is now scarce. The lakes and river are fished intensively by artisans, and there is some hunting. The area is unprotected in Tanzania, but most of the wetland on the Rwanda side of the border is included in the Kagera National Park. either side of the river, and those in Tanzania are, from north to south, Lakes Gwelu (1°20'S/30°39'E), Nyakatale (1°22 ' S/30°39 'E), Nyaruwale (1°23'S/30°41'E), Lubuga (1°26'S/30°47 'E), Ishaka (1°27'S/30°47 'E), Duko (1°30'S/30°46'E), Kashani. The Kagera river catchment is threatened by increased land degradation as a result of deforestation, bush fires, overgrazing, poor farming practices, siltation in wetlands due to soil erosion and wetlands over-exploitation due farming (Baijukya et al., 2006). b) Rufiji-Mafia-Kilwa Marine Ramsar Site The site (596,908 ha) is located in the three districts of Rufiji, Mafia and Kilwa, within the Coast and Lindi regions of southeast Tanzania located at 08°08'S, 039°38'E. The site is a representative wetland of east Africa, as it contains a large diversity of wetland types. These include a river with its delta (Rufiji), mangrove forests, coastal shallow waters, intertidal flats and marshes, seagrass beds, coastal Lakes, permanent rivers and streams, an archipelago (Songo Songo), a larger island (Mafia), a channel between main land and the island, rocky coral islands and islets, sandbars and coral reefs. Flora and Fauna: It harbours the IUCN red-listed marine turtles Chelonia mydas, Eretmochelys imbricata, Caretta caretta, Dermochelys coriacea, Lepidochelys olivacea, as well as the aquatic mammal Dugong dugong. The wetland is important for maintaining mangrove and coral communities. Songo-Songo has a highly diverse and extensive coral assemblage with records of 49 genera of hard and 12 genera of soft corals. The wetland offers reproduction and nesting sites for the turtles Chelonia mydas, Eretmochelys imbricata. It is also the last stand in Tanzania for the Dugong dugong. The wetland regularly supports over 20,000 waterbirds (feeding, resting and roosting site), especially during the migration period. It harbours over 1 % of the individuals in the East and South Africa population of Calidris ferruginea, the Northwest Indian Ocean population of Dromas ardeola, the East Africa population of Charadrius leschenaultii, the subspecies population of C. mongolus pamirensis, the East Africa population of Pluvialis squatarola, the Europe population of Sterna caspia, the subspecies population of Sterna nilotica nilotica and the subspecies population of S. (Thalasseus) bengalensis par. The wetland provides habitats (breeding, nursery and feeding ground, and shelter) to commercially important coastal and marine species of fish (e.g. finfish) and invertebrates (e.g. Ferropenaeus indicus, Metapenaeus monocerus, Penaeus semisulcatus, P. mondon). The wetland is on the migration route of pelagic fishes and allows the exchange of genetic material between populations. Hydrology and water quality: The site includes the protruding Rufiji delta into the Indian Ocean, the Mafia Channel, the rocky coral islands of Mafia and surrounding islets of coral reefs, and the Songo-Songo

GIS and Modelling Research Cluster 2010
Nile Basin Capacity Building Network ( NBCBN ) 42
Archipelago with reefs and sandbars. The delta spreads over 1,400 square km. The tides may influence the river up to 40 km upstream. The watercourses and the salt level in the water bodies are ever changing, due to the dynamics of floods. The Rufiji catchment has a great influence on the floods and loads of sediments and nutrients in the delta. The drainage basin of the Rufiji river includes important catchment areas and inland deltas. It is mainly fed by the rivers Ruaha (22%) and Kilombero (62%), which originate from the Kipengere and Livingstone mountain ranges. There are two dams on the Ruaha river, which generate up to 50% of Tanzania's electricity. The mangroves stabilize the shoreline, act as windbreaker toward inland pastures and villages, and trap the loads of sediments and nutrients. The accumulations of sediments, and the physical barrier of Mafia Island, result in the growth of delta and mangroves seawards. Mangroves and seagrasses (also sediment trappers and shoreline stabilizers) allow corals to be free of sediments; while the corals help preventing coastal erosion. Mafia Channel is about 20 km wide, with most water depths comprised between 0 and 9 m. The climate of the coastal zone is strongly influenced by the trade winds, the northeast and the southeast monsoons. The southeast monsoon (April-September) is the colder dry season, with low tidal ranges. The northeast monsoon (November-March) is less windy, with higher tidal ranges and more humidity. Assessment of threats Adverse factors threatening the wetlands in this site include bad rice farming methods, clear felling of mangrove, overgrowth of abandoned rice areas with weeds/grasses, extensive use of pesticides, illegal mangrove harvesting, ineffective fishery laws enforcement, illegal fishing methods (dynamite), over- and non-selective fishing by trawlers, disturbances to marine turtles at their nesting sites, collection of turtle eggs, persecution of turtles, hunting and incidental catches of dugongs. Others include the plan of a large-scale prawn farming project in the delta, the Songo-Songo gas field and oil exploration activities, and a potential hydropower plan at Stiegler's gorge, which could have devastating consequences on the site's ecology. c) Malagarasi-Muyovozi Wetlands The Malagarasi-Muyovozi Wetlands (32,500 km2) are located in the administrative regions of Kigoma, Shinyanga and Tabora, in northwest Tanzania at about 05°00'S, 031°00'E. Flora and Fauna: The wetland provides an important dry season refuge and feeding area for migratory animals including many waterbirds and large mammal species. The wetland supports a number of vulnerable or endangered species. For example, it is one of the few areas in Tanzania where the antelope species Tragelaphus spekei occurs. Loxodonta africana (elephants) and Crocodylus cataphractus are also found in small numbers. Other large fauna associated with the wetland include the mammals Hippopotamus amphibius, Syncerus caffer, Redunca sp., Damaliscus korrigum, Equus burchelli, Kobus defassa and Panthera leo, and the crocodile Crocodylus niloticus. Aerial and ground surveys of the site have indicated that there are more than 20,000 waterbirds utilising the area. The site regularly supports more than 1% of the individuals of several waterbird species including Balaeniceps rex (10-20%), Grus (Bugeranus) carunculatus (5-10%), Ardea goliath (1-2%), and Egretta alba (2%). The wetland is an important nursery and feeding ground for a wide variety of fish species (at least 51 indigenous fish species). Pollimyrus nigricans and Bryconaethiops boulengeri are two of the rare fish species. In addition, there are a number of endemic fish species. Hydrology and water quality: The Malagarasi-Muyovozi wetland ecosystem plays an important hydrological role in western Tanzania. The main hydrological functions of the system are water storage, flood control, groundwater recharge, sediment retention and water purification. Flood storage in the wetland reduces downstream flooding in towns. During the dry season the steady discharge of water, supplements dry season river flow. The floodplains play a role in trapping sediments carried by the major rivers in times of peak flow, hence reducing the levels of sediments carried into Lake Tanganyika. The average annual rainfall is 800-1,000 mm. Temperatures range from 12 - 20°C between November and April (main rainy season) and from 20 - 26°C in August and September (main dry season). Assessment of threats Major threats include pastoral activities, refugees‘ influx and fires have caused a dramatic decline in tree cover. The fire damage becomes particularly severe in very dry years when it can penetrate into the permanent

GIS and Modelling Research Cluster 2010
Nile Basin Capacity Building Network ( NBCBN ) 43
swamp. Another concern is the insecticides and pesticides used to control large locust outbreaks and Tsetse fly populations. The human impact is increasing rapidly as the human population grows through high birth rates, and local and refugee migration. Many exploitative activities are uncontrolled, due to a lack of resources of the management agencies. Heavy poaching has been recorded in the area and populations of some large mammal species have been significantly reduced. The extra demands for food for the refugees in the camps around the site has led to intensified cultivation of forest land and wetlands in surrounding areas, and to increasing fishing and poaching pressure in the reserves. Farming practices cause siltation and pollution of the rivers. Wildlife outside the game reserves and forest reserves are experiencing considerable habitat destruction. Miombo woodland and groundwater forest continues to be cleared for tobacco and shifting cultivation of subsistence crops. The hills to the northwest of the site adjacent to the border with Burundi have been deforested in recent years from shifting agriculture and refugee pressure. d) Lake Natron Basin Lake Natron basin (2247.81 km2) located at 02°21'S, 036°00'E; is situated in Ngorongoro and Monduli districts within the Arusha region, in northern Tanzania contiguous with the Kenyan border. The lake is a representative example of a Rift Valley soda lake in East Africa. Flora and Fauna: The Lake contains the highly specialised flamingo community. It is the only regular breeding area for the 2-4 million Phoeniconaias minor in East Africa. In addition, it supports over 100,000 individuals of other waterbird species, including large numbers of migrant species. In January 1995, a total of 105,730 waterbirds were estimated on the lake. In addition to Phoeniconaias minor, another nine waterbird species are expected to meet the 1% population threshold: Ciconia ciconia, Plegadis falcinellus, Platalea alba, Himantopus himantopus, Charadrius pallidus, Vanellus armatus, Calidris minuta, Tringa stagnatilis, and Chlidonias leucopterus. The fish species Oreochromis alcalicus appears to be endemic to Lake Natron and Kenya‘s Lake Magadi. The lake supports blue-green algae Spirulina platensis that in turn is essential for the Phoeniconaias minor population. Hydrology and water quality: Lake Natron is situated in a closed basin and acts as a sink for numerous seasonal and a few perennial streams, and about 28 mainly saline springs. Most water to the lake basin comes from rainfall; however, the arid conditions prevail due to a negative precipitation/evaporation balance. The permanent freshwater source in the basin is essential for people and wildlife in the dry season. The lake is shallow with a maximum depth of about 2m. It is surrounded by Rift Valley escarpments and volcanic mountains including the active Oldonyo Lengai volcano in the south. Assessment of threats Two large potential threats to the Lake Natron ecosystem are hydropower plans for Ewaso Ngiro River in Kenya, and soda ash exploitation in the lake itself. Mining activities would require large amounts of water, which would have to be taken from the area. The water would heat up and would risk becoming polluted before it was pumped back into the lake. The proposed activities would require the building of dikes in the lake to a pumping area, the settlement of 250 workers in the Natron Basin, and improved infrastructure. The Ewaso Ngiro project in Kenya implies a change in hydrology and water inflow of the principal freshwater river to Natron, and the need for creation of a freshwater Lake of about 50 km2 area in the north. Both food (supply) and nest construction of flamingos are negatively correlated with flooding. Plans for expanded irrigation and subsequently risk of contamination of Natron with agrochemicals and pesticides, through the Ewaso Ngiro swamps is also a threat. Additionally, there are plans for logging the Mau catchment forests in Kenya for community development that may severely affect the lake ecosystem, e.g. in form of increased general siltation and freshwater dilution of the soda lake in the wet season. A further potential threat comes from the increase in air traffic over the lake and the likelihood of the flamingo breeding population being continually disturbed by low flying aircraft. Overgrazing might pose a threat and should be investigated.

GIS and Modelling Research Cluster 2010
Nile Basin Capacity Building Network ( NBCBN ) 44
e) Kilombero Valley Floodplain Kilombero Valley Floodplain (7967.35 km2) located at 08°40'S, 036°10'E ; falls in Kilombero and Ulanga districts located in Morogoro region in southern central Tanzania. The site is dominated by an extensive floodplain including a mosaic of permanent and seasonal swamps, permanent and seasonal rivers and their tributaries, ponds and lakes, riverine forest and grassland habitats. Flora and Fauna: The valley is a key feature in the Selous-Kilombero seasonal wildlife migrations. The valley contains almost 75% of the world's population of the wetland dependent Puku antelope Kobus vardonii. This antelope is now only found in 18 locations in Africa and its survival, as a species, is dependent on the Kilombero Valley population. The Crocodile population of the Kilombero also links with that of the Selous, recognised as having one of the most significant populations of Crocodylus niloticus. Moreover, vulnerable populations of the endemic Colobus monkey Procolobus gordonorum exist in two fragments of forest in the site. The valley also provides an important dry season habitat for large mammals, particularly Loxodonta africana, Hippopotamus amphibius and Syncerus caffer. Three endemic birds are known the weaverbird Ploceus burnieri and two undescribed species of Cisticola. In the wet season it is an essential spawning area for many kinds of fish in the Rufiji River system of which two endemic species Citharinus congicus and Alestes stuhlmanni are dependent on the Kilombero floodplain. Due to the size of the Kilombero Floodplain, there is little doubt that it holds more than 20,000 waterbirds in the wet season. All Tanzanian species of egrets and herons occur in the floodplain. The site regularly supports over 1% of the eastern (&southern) African population of the waterbirds Vanellus albiceps and Rhynchops flavirostris. Vegetation follows a distinct graduation from river channel to mountain. The floodplain vegetation is dominated by 1-3 metre high Panicum maximum and Pennisetum spp. Small areas of flood resistant woodland contain species such as Kigelia pinnata, Longocarpus capassa and Combretum spp. Permanent swamps contain Cyperus papyrus. In the Kibasira Swamp, a new plants species has been discovered Vigna sp., it is being described and named (2002). Other rare species include Grauanthus parviflorus, Crotalaria polygaloides and Aframomum alpinum. Rare trees include Swertia madagascariensis, Dalbergia melanoxylon, Sorindeia madagascariensis and Manilkara sp. Fish species include Oreochromis niloticus, Clarias gariepinus, Mormyrus kannume, Schilbe moebiusii, Anguilla bengalensis, Bagrus docmak, Distichodus petersii, Citharinus latus, Labeo congoro and Synodontis livingstonii. Hydrology and water quality: The site receives water from a number of important rivers in the south such as Ruhudji, Mnyera and Pitu and then divides into a myriad of tributaries in the central part of the floodplain. The seasonal change in water dynamic is huge and the plains may become totally flooded during the wet season, while it dries up during the dry season with the exception of rivers and river margins as well as the areas with permanent swamps and water bodies. The site is situated between the forested escarpments of the Udzungwa Mountains at the northwestern side and the Mahenge mountains on the southeastern side which are important catchment areas crucial to the hydrology of the wetland. Soils of the wetland complex are mainly heavy black cotton or montimoronlite soils that retain water over relatively long periods with isolated patches of lighter sandy soils. Rainfall tends to be unimodal and very heavy. Annual flooding is a crucial factor in the maintenance of the wetland habitats and the fertility of the soils for vegetation and fisheries. Flood peaks tend to occur during March-April. Assessment of threats There are several farms in the surrounding area that have cleared and drained floodplain areas for agriculture. The Kilombero Valley Teak Company is a Commonwealth Development Corporation that aims to plant at least 130 km2 of teak in a series of plantations in both Kilombero and Ulanga Districts. Some of these plantations are inside the wetland. The Government of Tanzania identified Kilombero District as a model agricultural district and aims to the utilisation of wetland areas to ensure sufficient national food production. In the surrounding area the Kilombero Sugar Company has fields lying just north of the ramsar site. A number of external growers for the Sugar Company are based within the site. The Kihansi River was dammed for generating hydropower in the beginning of the 1990's.

GIS and Modelling Research Cluster 2010
Nile Basin Capacity Building Network ( NBCBN ) 45
3.6.5 Egypt
Egypt has an area of 1,000,250 km2, a population of 46,000,000 (1984), and thus a mean population density of 46 persons/km2. This however is very misleading, since some 70% of the people live in Cairo and the Nile Delta, and most of the remaining 30% in the Nile Valley. Population densities exceed 20 100/km2 in some urban areas. Egypt is bounded by Libya in the west, Sudan in the south, and Israel in the east. The Mediterranean coast is almost 1100 km long, and the east coast, which includes the west coast of the Gulf of Aqaba, both coasts of the Gulf of Suez, and a length of Red Sea coast, is some 1780 km long. The country stretches 1095 km from north to south between latitudes 21°47' and 31°38'N, and about 1140 km from west to east between longitudes 24°42'E on the Libya/Egypt border and 35°47'E at Ras Binas on the Red. The Nile divides the plateau across which it flows into two regions, the Western Desert and the Eastern Desert. The Western Desert, between Libya and the Nile, is arid and without wadis. In the west it comprises a great sea of blown sand, but nearer to the Nile it is rocky. It sinks to a number of large depressions in which there are oases, and rises to heights over 1000m in the extreme SW on the Gilf Kebir Plateau. This towers over the surrounding desert from which it ascends by cliffs and scarps. The lower Nile Valley is a verdant strip across the desert, demarked by steep valley sides, except on the wet bank above Cairo, where land, after rising a little, slopes down to the depression and lake of Qârûn, 45 m below sea level. Below Cairo the valley flattens out and the river enters the delta which is criss-crossed by canals and distributaries. The delta is 300 km wide, 175 km deep and covers 26 000 km2. A number of swampy lakes and large Lakes line its seaward face. A discontinuous range of mountains in the Eastern Desert, orientated NNW-SSE separates the Nile Valley from the Gulf of Suez and the Red Sea, and reaches a high point of 2187 m at Gebel Shiyib el Banat (26°59'N/33°29'E). The Eastern Desert is extensively dissected by deep wadis which run down from these gullied mountains to the Nile, while to the east, other wadis lead to the sea across a narrow coastal plain. Parallel to the shore there is an almost continuous line of coral reefs. Sinai is another desert. The hills along its two gulf coasts rise and converge southwards to form a sharply serrated range of a mountains near the tip of the peninsula. Here, Gebel Katherina (28°30'N/33°57'E) is the highest point in Egypt (2637 m asp. All of Sinai is gullied, with wadis leading directly to the gulfs on either side, or into the centre, to the anastomosing system of the Wadi el Arish which runs north to reach the Mediterranean Sea (31°08'N/33°52'E) near the town of El Arish. Climate The Tropic of Cancer runs through southern Egypt, 94.6% of which is true desert. Precipitation over the Western Desert is minimal and many consecutive years may be completely rainless. Mean annual rainfall at Cairo is only 25 mm. However, the Mediterranean coast and the mountains along the Red Sea attract some winter rain. Alexandria (31°12'N/29°58'E) on the Nile Delta has a mean annual rainfall of 147 mm, but Hurghada (27°18'N/33°47'E) on the Red Sea coast receives only 3 mm/yr. Precipitation in the hills of the Eastern Desert and Sinai is very variable. In these places a stream may flow as a torrent for a day or so after a storm, during which over 100 mm of rain may fall, but it may thereafter remain dry for several years. There are two seasons. Winter lasts from November to March, and summer from April to October. Winters are cool and mild, but summers are hot and dry. Then, in the deserts, daytime temperatures may reach 48°C but may fall to 10°C at night. Temperatures may also reach 48°C along the Red Sea, but seldom fall below 14°C at night. NE winds predominate in winter, but it is the occasional westerly winds that bring rain. In summer, winds are from the SW, off the Sahara. January is the coolest month throughout the country, when mean monthly minima and maxima are 9.3 and 18°C at Alexandria, 8.6 and 19.1°C at Cairo, 11.3 and 18°C at Port Said and 8 and 23.8°C at Aswan. August is generally the hottest month, and at this time mean monthly minima and maxima are 22.9 and 30.4°C at Alexandria, 21.6 and 34.8°C at Cairo, 24.9 and 30.9°C at Port Said and 24.7 and 41.3°C at Aswan.

GIS and Modelling Research Cluster 2010
Nile Basin Capacity Building Network ( NBCBN ) 46
There are some important wetlands on the Mediterranean coast, and others of lesser size and importance on the eastern coasts. In Sinai, and on the Red Sea, some small swamps exist in the lower valleys of intermittent watercourses and there are extensive saltmarshes along the littoral. Mangroves have a discontinuous distribution from the tip of Sinai southwards. There are lakes in some depressions of the Western Desert. The Nile has a floodplain and a delta, and it is impounded at Aswan to form Lake Nasser. List of Wetlands in Egypt
1. Wetlands of the Nile Delta (a) The Delta Proper (b) Bahra el Maryut (c) Bahra el Idku (d) Bahra el Burullus (e) Bahra el Manzala (f) Sabkhet el Bardawil 2. The Lower Nile Valley 3. The Suez Canal & Associated Lakes 4. The Gulfs of Aqaba & Suez, & the Red Sea 5. Oases
a) The Siwa Depression b) The Qattara Depression c) Wadi el Natrun d) Lake Qarim e) The 'New Valley' Oases
7. Lake Nasser/Nubia
Hydrological and environmental properties of wetlands in Egypt (Burulus Lake) Lake burulus is one of the Delta wetlands. This is a shallow brackish Lake with numerous small islands. It is open to the sea through a narrow mouth at the northern extremity near the town of El Burg. Depths vary from 0.7-2.4 m, and changes in water level expose large areas of shoreline. The northern shore is separated from the sea by a long dune covered spit. The bottom is muddy along the southern shore, but sandy on the northern side. Hydrology & Water Quality: Inflows from the land occur from 7 major drains along the southern shore, and discharges from these, together with rainfall and seepage from the Rosetta branch of the Nile, cause the lake level to rise and induce a net discharge to the sea in summer. However, seawater may enter in winter. Water temperatures range from 11°C in winter to 30°C in summer. The water is well mixed and well oxygenated, although turbid, with Secchi depths of only 8-37 cm. Chloride ion concentrations range from 0.3-14 mg/1, while silicate levels may reach 400 mg/l. Flora & Fauna: This is essentially as described in the regional introduction. There are extensive reed beds dominated by Phragmites australis, with Potamogeton spp. Dominant in the lake. Ceratophyllum demersum, Eichhornia crassipes and Lemna gibba are also present; Lemna forms scums on stagnant backwaters while Eichhornia is dominant in the drains. About 30 different fishes have been recorded from the lake including species of Anguilla, Mugil and Solea. There is a fishery on the lake. The lake is Unprotected.

GIS and Modelling Research Cluster 2010
Nile Basin Capacity Building Network ( NBCBN ) 47
3.7 Assessment of Wetlands Degradation and Losses
Wetlands are a major feature of the landscape in almost all parts of the world. However, the extent of wetlands is decreasing in many countries due to human-generated stresses such as urban development, resource extraction, toxic chemicals pollution, and non-native species introduction (Mitsch and Gosselink, 1993). The global climate changes that result in the rising of sea water level have also some impacts on wetland resources (Day, 2000).
To conserve and protect the remained wetlands, thoughtful planning and regular monitoring are required. The primary indirect drivers of degradation and loss of rivers, lakes, freshwater marshes, and other inland wetlands (including loss of species or reductions of populations in these systems) have been population growth and increasing economic development (Millennium Ecosystem Assessment, 2005). The primary direct drivers of degradation and loss include infrastructure development, land conversion, water withdrawal, pollution, over harvesting and overexploitation, and the introduction of invasive alien species.
Case of Uganda
With exception of a few areas, evidence has shown that there is widespread of wetland modification in the country. The causes of wetland drainage and conversion include population growth, economic reforms and inadequate information, legislation and inter-sectoral co-ordination (Mafabi, 2000). The current environmental conditions of wetlands delineated as below:
Large scale clearance of wetlands for cultivating sugarcanes, rice, yams and vegetables. For instance, the original vegetation of the upper part of Nakivubo wetlands is totally cleared and replaced with extensive yams cultivation (Tumusiime and Mijumbi, 1999). Similarly, in eastern and western Uganda, large portion of wetlands are reclaimed for sugarcane plantations, cabbages, and Irish potatoes. In areas where agriculture fields are sited on or near wetlands, water sources that feed wetlands are diverted for irrigation impacting the wetland hydrology and the bio-diversity (Tindamanyire, 2002).
Discharge of partially treated and untreated domestic wastewater, agricultural runoff and industrial effluent into urban wetlands. Untreated sewage from slum areas, where sanitation facilities are inadequate to support the population is discharge directly into the wetlands or water channel which eventually ends up in the wetland. More than 200 large, medium and small-scale manufacturing and processing enterprises in Kampala are neighbouring Nakivubo wetland and some discharges their effluent in surface waters flowing directly into the wetlands. These industries include distillers, soft drink manufacturers, oil and soap factories, dairy producers, abattoirs and meat processors, fish processors, paint producers, tanneries, bakeries, metal works and garages, plastic and foam industries, saw mills, battery manufactures, shoe makers and paper (Kyambadde, 2005). The increasing discharges from the industries into the wetlands have resulted in the dominance of blue green algae in Lake Victoria.
Rapid economic growth, rehabilitation and urban expansion in the last decade has resulted in a growing demand for housing and construction of commercial and industrial facilities (Kyambadde, 2005). Where open lands are not available wetlands are reclaimed for building sites and road construction (Christine, 1998). This is evident with the current construction of the Northern bypass and the building sites near Nakivubo wetland in Kampala city. A similar situation is also being observed in urban towns having wetlands in the proximity to town centre.
Decline in biodiversity and apparent disappearance of vital species in water bodies. For example, in the Lake Victoria where changes in the fish sizes and species composition have been noted. Also noted is the increasingly exploitation of unique wetlands vegetation species like rattan cane and rapphia palms to support the increasingly growing urban market of craft products. It is expected that other changes in bio-diversity may exist but are probably not documented.

GIS and Modelling Research Cluster 2010
Nile Basin Capacity Building Network ( NBCBN ) 48
Wetlands are continuously being drained for sand excavation and brick-making by the youth to support the booming housing construction business. For example, on the fringes of Lake Victoria, Katonga system and some seasonal wetlands, sand extraction have left a degraded environment with large open pits. Brick making is common in riverine wetlands associated with Raphia dominated swamp forests. The brick making and sand extraction are intensive on the wetlands located in Kampala, Entebbe, Jinja, Mukono and Mpigi.
Wetlands in drier areas such as parts of Rakai, Iganga, Busia, Masaka and Mpigi are generally used for grazing. The surrounding of the wetlands in most of the catchments is being used for subsistence agriculture and settlements.
Rattan canes that are restricted in distribution to mainly Mpigi and Mukono swamp forests in central Uganda is being over harvested because of their importance in the craft industry. There is also a notable over harvesting of Phoenix palms wherever they occur for fencing poles.
Frequent burning of the wetlands in the catchment is increasingly affecting the growth of papyrus. In many cases Miscanthus sp. is increasing at the expense of papyrus. This succession could be attributed to the lowering of the water level in the lake and low nutrients, which do not favour the growth of papyrus.
(This case study is explained in details in chapter 6)
3.8 Practices for Wetlands Conservation and Restoration
In the past, wetlands were virtually considered as "waste lands" or areas that only served for breeding mosquitoes. They were dredged to facilitate drainage of the water, reclaimed for other uses, or simply considered as dumping grounds for all types of refuse. Wetlands resources, such as fish, reeds, mangroves and thatch materials were harvested indiscriminately without any attempt to regulate their exploitation (MLF, 1999). Regulation of exploitation is important for the sustainability of wetland resources.
To protect wetland resources, managers should conduct a ‗status and trends‘ assessment of wetlands involving the analysis of the past, current and future landscape changes. The assessment needs ancillary information and data, such as maps or field surveys, for decision making. Inventory and monitoring are the key elements for effective implementation of wetland management programs, policies and sustainable development indicators (Milton and Hélie, 2003). The common objective of compiling wetland inventories is to determine wetland locations, to delineate the extent of various types of wetlands in a region, and to identify important habitats for wildlife, economic interests and other functions. An inventory can be made either for a small watershed or an entire nation. Whatever the size of the area to be surveyed, the inventory must provide information on wetlands to meet the needs of specific users.
The need for effective wetland mapping and inventory has been raised in many forums and by many organizations over the past 3 decades. Past mapping and inventory included the production of continental-scale inventories in the late 1980s and early 1990s. Spatial analysis of remote sensing data assumed a greater role in the 1990s and now provides improved capabilities. Reviews of the extent of wetland mapping and inventory and suitable methods have been undertaken, including those by the Ramsar Convention on Wetlands (Ramsar), the Wetlands Inventory, Assessment and Monitoring Specialist Group, and the International Geosphere-Biosphere Programme (IGBP), that looked at global and national coverage and identified inconsistencies, gaps and inaccuracies in global-scale maps (Chiu, 2005).
GIS and Modelling Research Cluster 2010
Nile Basin Capacity Building Network ( NBCBN ) 49
Wetland mapping is a prerequisite for wetland inventory. Aerial photography, satellite imaging, or maps can be utilized as an alternative to collect field data in order to map wetlands. A mapping approach that relies upon remote-sensing technology holds the promise of greater efficiency, lower costs, and ease of repeatability (Kashaigili, 2006). Because the remotely sensed images provide a synoptic view of wetlands and their surrounding terrain, they facilitate rapid boundary determination. The use of remote sensing platforms may include aircraft at various altitudes, and satellites (Chiu, 2005). The choice of which platforms to use depends on the spatial resolution required, the area to be covered, and the cost of the data.

GIS and Modelling Research Cluster 2010
Nile Basin Capacity Building Network ( NBCBN ) 50
4
GIS, REMOTE SENSING AND MODELLING FOR WETLANDS MANAGEMENT
4.1 Review on GIS and Remote Sensing of Wetlands
While traditional use of wetlands maintained the resource, modern use eliminates or degrades their existence. Changing human systems have, directly or indirectly, driven changes in wetland distribution, pattern, ecology and biodiversity. Multiple pressures (natural, anthropogenic and socio-economic) to convert wetlands for agriculture and aquaculture requirements (for food and livelihood), especially in developing countries, have aggravated wetland loss. Taylor et al. support that resource inventories provide indication of location, biological productivity, potential multiple uses, and biodiversity profiles of wetland ecosystems. Finlayson designed a wetland monitoring program including methodology and data reporting steps also addressing the issue of scale. The accelerating rate of climate change, global warming, and fluctuations in rainfall pattern, have been a cause of concern for these biologically productive and hydrologically stabilizing wetlands demanding a comprehensive strategy and work plan for global wetland activities. International organizations along with regional and local support were actively participating to strengthen the knowledge base on wetland systems. Wetlands International, in global, regional and national conservation initiatives, has developed some guidelines for sustainable use. Environmental attribute assessments of wetland ecosystems were considered the essential component for inventory and change dynamics. Galatowitsch supported that knowledge on water regime, groundwater flow system, organic carbon soil, land use pattern, agriculture expansion, ecological, hydrological, economical, and socioeconomic benefits provides a holistic picture of these complex systems. Sahagian and John Melack explain the understanding of the role of wetlands in biogeochemical and hydrologic cycles is significant to map global wetland distribution. As an example on the existing wetlands information systems, the Global Wetland Inventory and Mapping (GWIM) program initiated by the International Water Management Institute takes into account the existing inventory data, digital elevation models, multiscalar data, and environmental attributes in a geospatial domain. Global inventory planned using satellite data, processing geospatial software and integrating ancillary data and ground details, would recognize factors that influence the sustainability of wetland ecosystems. Potential and systematic use of spatial data will assess global inventory of natural and anthropogenic wetlands, and the study of wetland dynamics (seasonal and spatial), thereby leading to the formation of global data sets that can be used by wetland managers and scientific researchers. The functional methodology developed would provide a platform to inventory, map and classify wetlands taking into account the associated functional parameters. The data sets incorporated in GIS-Map server interface would provide an interactive online geospatial analysis for multiple users. Though the journey to define, inventory, assess and monitor the systems started long back, actors initially concentrated on large-scale projects. Ramsar Convention‘s ‗wetland monitoring programme‘ design involved a series of steps: problem identification, objective definition; hypothesis derivation, variable identification and feasibility and cost analysis. The main target of these efforts was permanent wetland area, while seasonally inundated areas were not taken into consideration in a significant way. Further, Ramsar defined eight priorities towards global wetland studies and sustainable use; with the multi-fold global conservation approach emphasizing wetland dynamics, change analysis, widespread inventory to generate a database for location, characteristics, spatial distribution, ecology and economic analysis and prioritization. Traditional methods for mapping involve intensive and time-consuming fieldwork. Several efforts to document the knowledge base on wetland resources and the profile of their ecosystems services was initiated;
GIS and Modelling Research Cluster 2010
Nile Basin Capacity Building Network ( NBCBN ) 51
Finlayson et al. summed up the global overview of the wetlands emphasizing status, resources and future priorities in seven regions; Wong emphasized wetland management strategies in Asian countries, including Philippines, Thailand, Hong Kong and China. Hughes and Hughes focused on the fauna, flora, human impact and utilization of African wetlands. Wigham et al. described wetlands across three major rivers— the Amazon, Orinoco and Magdalena. Along with a detailed inventory on type, flora and fauna of the wetlands, the causes of disturbance (mining; forest exploitation, sewage disposal) were also listed. The directory of Azov-Black Sea coastal wetlands documented by Gennadiy Marushevsky, by Wetlands International, lists all details with map illustrations of six countries covering an area of 422,000 km2. It provides details on location, type, hydrology, ecology and disturbance factors. The approach is mainly based on wetland inventory sheets, available ancillary datasets and ground surveys. The compilations were based on ground explorations, existing literature and topographic maps. In most cases, wetland inventory is based on ground-survey, but studies also utilize aerial photography and topographic maps and, more recently, satellite imagery. Wetland inventory details at the global level were summarized by Finlayson and Valk, covering the United States, Canada, Australia and some European countries. National wetland inventories have sets of databases whereas in Asian and African countries the database reflects certain gaps, and until 1995 there was no database of wetland ecosystems, although some information on mangroves was available. Zalidis et al. worked on photo interpretation and cartographic conventions in Mediterranean wetlands to support mapping of wetlands using a process of transferring information to the base map, including border definition of the mapped area, presentation of non-wetland habitats and the use of graphical techniques. A spatial approach provides a means for repetitive monitoring and also aids in identifying the indicators of change in natural systems. Studies on ‗Wetlands in Space‘ started back in the 1970‘s; perhaps the case studies reported were sufficient. First was the epoch of aerial photography. Bendjoudi et al. explored the riparian wetlands in France using thermographic aerial survey and electromagnetic prospecting. The potential for remote sensing to create wetland maps using color infrared aerial photography at different scales was practiced along with field studies, review of soil maps, and integration of existing information. Geospatial technology (multi-spectral, hyper-spectral, optical and microwave sensors) and tools (digital image processing [DIP] and Geographic Information Systems [GIS]), opened new vistas for wetland inventory at multiple scales. Application of remotely-sensed data for wetland mapping, classification and characterization gained momentum in the past two decades. Associated attributes, namely definition, scale, boundaries, evaluations, and methodology were analyzed and modeled using Geo-Arc interface. Support tools of geospatial analysis, namely Global Positioning Systems (GPS), meta-database and developing query tools and internet GIS, added further dimension to the overall approach of wetland inventory and management. The raster/vector data sets having information on area, boundary, location, geomorphology, soil characteristics, water regime, water quality, and vegetation pattern were prepared using both spatial and non-spatial domains and were linked with the meta-database. Many regional and local-level studies were executed to inventory and map wetland types. Kelly documented changes in the landscape pattern and landscape-scale wetland fragmentation of coastal North Carolina wetlands using Landsat Thematic Mapper data. The results highlight the lack of agreement between management and landscape-scale wetland structure, function and change. The Salim Ali Centre for Ornithology and Natural History, India, enlisted 199 wetlands for conservation prioritization describing the anthropogenic pressure in terms of heavy pollution, risking the niche of threatened bird species, based on remote sensing analysis and geospatial modeling. Further development of optical and microwave sensing systems and algorithm modeling brought measurable advancements in the understanding of wetlands. GIS advanced spatial analysis and modeling methods are tools used to analyze and understand a variety of ecosystem issues, such as wetland ecosystem restoration, distributions of wildlife populations, and disturbances in coastal natural resources. Management systems are used in wetland restoration planning, risk assessment, ecosystem modeling, landscape ecology, biodiversity studies, and sensitivity analyses. These

GIS and Modelling Research Cluster 2010
Nile Basin Capacity Building Network ( NBCBN ) 52
studies primarily use GIS-based spatial data, but include remotely sensed imagery, field measurements, and planning information from resource managers. In most contemporary land use studies, which employ remote sensing imagery from multispectral sensors, the foremost task is the observation of spectral characteristics of measured electromagnetic radiation from a target or landscape. Analysts develop signatures based upon the detected energy‘s measurement and position in the electromagnetic spectrum. A signature is a set of statistics that defines the spectral characteristic of a target phenomenon or training-sites. Image analysts determine the measurement of signature separability by determining quantitatively the relation between class signatures. Signatures are refined by improved ground-truth and accuracy assessment analysis. By utilizing the developed signatures in mulitspectral classification and thematic mapping, the analyst generates new data for analysis (ERDAS, 1999). Historically Landsat MSS, Landsat TM, and SPOT satellite systems have been used to study wetlands (Shepherd et al., 1999; Shaikh et al., 2001). Other studies have included AVHRR, IRS, JERS-1, ERS-1, SIR-C and RADARSAT (Alsdorf et al., 2001; Chopra et al., 2001). There has been some research done on wetlands using radar data (Rio and Lozano-García, 2000; Alsdorf et al., 2001) as well as LIDAR (MacKinnon, 2001) but the majority has been concentrated on Landsat TM, MSS, SPOT, and airborne CIR photos. As far as classification of these images is concerned, most of the earliest work included visual interpretation of aerial photographs (Suguraman et al., 2004). Unsupervised classification or clustering is the most commonly used digital classification to map wetlands and the Maximum Likelihood algorithm with a supervised method (Özesmi, 2000) is commonly used. Low wetland accuracy percentages usually accompany these classification methods (30 – 60% accuracies). Several researchers increased the accuracy with other methods, for example, using multi-temporal and ancillary data along with various GIS models and non-parametric classifiers such as rule-based classifiers (using multi-spectral imagery) (Özesmi, 2000). Other work has been done using multi-sensor assessment (Töyrä et al., 2001), neural networks (Özemi, 2000; Han et al., 2003), hyperspectral data (Schmidt and Skidmore, 2003) and ancillary data (Houhoulis and Michener, 2000). Ancillary data provides a practical solution to solve the problem of distinguishing between spectral similarities in wetlands, agricultural fields, and forests.
Change detection is one of the used tools to trace the temporal changes in land use. The goal of change detection is to discern those areas on digital images that depict change features of interest (e.g. forest clearing or land cover/land use change) between two or more image dates (Hayes and Sader, 1999). With rapid changes in land cover occurring over large areas, remote sensing technology has become an essential tool for monitoring (Sader et al., 1999). The remote and inaccessible nature of many places (i.e. tropical forest regions, large inundated wetlands) limits the feasibility of ground-based inventory and monitoring methods for extensive land areas (Hayes and Sader, 1999). Initiatives to monitor land cover and land use change are increasingly reliant on information derived from remotely sensed data. Numerous change detection techniques are available which achieve various levels of success (Kaufmann and Seto, 2001) and details on various methods are provided in (Jensen, 1996; Gopal and Woodcock, 1996). The method used depends largely on the landscape of the study area, the types of land-cover changes, and the temporal and spatial resolution of the data. However, there is no consensus regarding the ‗best‘ technique (Kaufmann and Seto, 2001). Despite that, the post-classification comparison technique is widely used in detecting the land cover change (Wickware and Howarth, 1981). The Millennium Ecosystem Assessment confirmed earlier statements that the extent of wetland mapping and inventory was inadequate and that the most recent estimates of wetland extent were under-estimates with significant gaps regionally and for various types of wetland ecosystems (as defined under the Ramsar Wetlands Convention). The conservation, management and prioritization initiatives in wetland study need to be designed on a basic framework to concentrate on the Ramsar baseline by assessing current inventory status, identifying gaps in wetland data and the status of wetland functions, and establishing a reliable methodology for wetland research study. Not all the wetland areas in the Nile basin are identified as Ramsar sites and therefore still a lot of work and investigations need to be done to cover these areas.

GIS and Modelling Research Cluster 2010
Nile Basin Capacity Building Network ( NBCBN ) 53
4.2 Applications of Ecological Models for Wetlands Management
4.2.1 Introduction Ecological models of wetlands are a diverse assemblage of tools for better understanding the wide range of wetland types distributed throughout the globe. However, these models generally share a common characteristic: they are conceptual and quantitative tools that consider the responses of some part of the ecosystem to varying magnitudes and frequencies of flooding. For some purposes, this may be as simple as an assessment of the suitability of specific ranges of water levels for different biological communities. More complex ecological modeling tools may investigate nutrient dynamics with changing surface and ground water flows. Further details in an ―integrated‖ model may link those nutrients to plants and animals within a wetland. Regardless of the model objectives, a principal driver of wetland models involves the hydrology of flooding and associated soil saturation. These wetland physics influence the selection of the ecological processes to be considered in model development. Assuming an introductory level understanding of ecology, this article summarizes the types of ecological models that are used to better understand ―natural‖ wetland ecology. In particular, intermittent flooding is a definitive characteristic of wetlands, and is an important consideration in modeling those systems.
4.2.2 General Model Design Defining the objectives is an important first step in modeling of any system, wetlands or otherwise. Serving an important role in this process are conceptual models, which often take the form of diagrams that indicate the relationships within the system of interest. In this article, we use some generalized conceptual models to highlight the important wetland dynamics that are implemented as mathematical simulation models at various scales of space, time, and complexity. The development of an ecological model involves decisions on how to best aggregate (or simplify) real-world ecosystem processes such as plant or animal growth–while still capturing the essence of the overall system dynamics. Associated with such simplification are broad-reaching assumptions: a point to keep in mind is that simple ecological models tend to make complex assumptions in aggregating complex system dynamics. More complex models involve more equations, and more data is required to supply parameters to those equations. The intent of such designs is presumably to increase the realism as constraining assumptions are lifted. In the design process, the model developer must choose which are the most important components to consider in order to meet the objectives for the wetland study. An overview of the physics, chemistry, and biology of these wetland ecological model components are summarized below.
4.2.3 Wetland Model Components
Water ―Getting the water right‖ is a primary consideration in understanding the dynamics of wetlands, and the phrase is a driving principal behind an ambitious restoration effort in the remnants of the vast Everglades wetlands of Florida. Physical hydrology becomes the foundation for most wetland models. At the simplest level, one may consider only the above-ground surface water in a homogenous area (i.e., without variation in land elevation or other variables in horizontal space). This concept can be extended to consider horizontal variation in land elevation and water depths in a 2-dimensional surface water model. In one of the more comprehensive spatial frameworks, a 3-dimensional model tracks water flows both above- and below- land surface, along with horizontal fluxes across space Figure (4-1). Regardless of the spatial design, a principal hydrologic characteristic that should be considered is the timing and duration of the surface water flooding or soil saturation. One of the more common design constraints for wetland ecological models is that of matching space and time scales of the hydrologic and biological processes. Water flows are often modeled with a time resolution of minutes to days, whereas upper trophic (food web) level responses of plant and animal communities operate at time scales that are orders of

GIS and Modelling Research Cluster 2010
Nile Basin Capacity Building Network ( NBCBN ) 54
magnitude greater. Thus, the selection of the hydrologic characteristics to drive wetland ecological models can become a crucial factor in the endeavor's scope and objectives. The fluctuations of the water table above and below the land surface are simply fundamental to the hydrologic component of wetland ecological models.
Figure 4-1: The spatial design of the hydrologic component of wetland models largely determines the questions that can be addressed
Nutrients Wetland modeling of nutrients not only involves a strong degree of coupling to hydrologic flows for nutrient transport, but nutrient chemistry is highly dependent on biological processes. This dependence, however, is again directly related to the hydrology via intermittent flooding or saturation of the wetland soil, which largely determines the relative degree to which aerobic (oxygenated) or anaerobic rates and processes are operative. Rarely is surface water very deep, if present at all in a generalized wetland. This results in a high surface area of soil and vegetative biological interactions relative to the water volume, compared to systems such as lakes, for example. Modeling wetland nutrients involves determining the most useful combination of the physical hydrologic drivers and the biological mediation of nutrient transformations. Because of the potential assimilative capacity of wetlands for nutrients due to the high biological activity, ―water quality‖ modeling in these systems has been of interest in a variety of nutrient management contexts. The efficiency of engineered/constructed wetlands in assimilating nutrient runoff from farms or urban areas has investigated using a range of modeling techniques. Some of these efforts are based on single equations of highly-aggregated nutrient losses from surface water storages Figure (4-2). The residence time of a water parcel as it flows through the wetland biological sieve becomes a primary consideration in determining nutrient assimilation of the wetland.

GIS and Modelling Research Cluster 2010
Nile Basin Capacity Building Network ( NBCBN ) 55
Figure 4-2: Nutrients are transported across space with water flows, while their fate is mediated by biological and chemical processes
Habitat-Plants For the purposes of this modeling overview, wetland habitats are simply considered to be combinations of soil and plant community characteristics. Principal characteristics of a generalized wetland habitat include the function of soil accretion and the related structure of the macrophyte and algal/periphyton communities. Water and nutrients are two primary drivers of the development of wetland habitats. Modeling those dynamics over short time scales of months to years provides a snapshot of insight into the ecological interactions within given habitat types. However, the succession of macrophyte communities and accretion of soils tend to become observable at multi-year or decadal time periods, with infrequent disturbances being a third major driver of the long-term habitat trajectories. Plant communities are a conspicuous component of wetland habitat structure, and processes associated with their population dynamics comprise an important part of wetland function. The extent to which nutrient dynamics interact to limit plant growth varies widely among model objectives. One of the more characteristic components of wetland plant models involves the need to develop response mechanisms for hydrology that may range from flooded to very dry, multiple times within a plant generation Figure (4-3). Beyond such relatively brief time scales, models of wetland vegetative succession provide insight into long-term habitat trajectories. The most appropriate time scales range across multiple decades (to perhaps centuries), particularly for long-lived trees in mangrove, cypress, or riparian bottomland forests. Depending on the objectives, these models vary along a continuum of spatial and ecological process complexity. Implied or explicit equations of competition for space and/or resources are commonly employed.
Figure 4-3: Plant growth, mortality, and other ecological processes respond strongly to water levels, with varying species responses leading to transitions among dominant plants in space and time

GIS and Modelling Research Cluster 2010
Nile Basin Capacity Building Network ( NBCBN ) 56
Habitat-Soils Whatever the method of simulation, habitat change in wetlands is strongly affected by the cumulative effects of water depth and duration – which are directly linked to changes in land surface elevation. Land elevation patterns are modified naturally by water velocity and associated erosion or Wetland Ecological Models 4 deposition. With such physical dynamics operating in very short time-scales, further challenges remain in effectively aggregating their effects within models that consider multi-decadal soil dynamics. A significant component of elevation changes in wetlands is due to positive feedback from the\ accumulation of above- and below- ground plant detritus. Root growth and mortality accumulate organic matter in the soils, and above-ground plant dynamics add to that elevation potential. Countering this potential increase is the oxidation of the soil's organic matter. Rates of this microbially-mediated decomposition are dependent on the quality of carbon (e.g., the lability of the carbon detritus), available\ nutrients, and the degree of oxygenation of the soil matrix. Flooded soils typically are characterized by anaerobic pathways of microbial metabolism, while lowered water tables expose the soils to increased oxygen availability and increased oxidation rate Figure (4-4). Directly affected by water levels, water flows (erosion and deposition), and plant dynamics (growth and mortality), soils are integrated indicators of the relative ―health‖ of wetlands- modeling these soil dynamics is a valuable approach to understanding long term, integrated wetland function. Directly affected by water levels, water flows (erosion and deposition), and plant dynamics (growth and mortality), soils are integrated indicators of the relative ―health‖ of wetlands- modeling these soil dynamics is a valuable approach to understanding long term, integrated wetland function.
Figure 4-4: Particulate soil matter may be differentially eroded and deposited, depending on water velocities; soils accumulate mass and height with plant mortality, but are oxidized at rates that vary significantly with water depth in the soil profile
Animals Beyond their effect on habitat structure itself, water level fluctuations are a fundamental determinant of the temporal and spatial availability of habitat to animal populations. The periodicity of this availability ranges from the daily flooding of intertidal wetlands to slower recession of water levels in flooded wetlands with the onset of a dry season Figure (4-5). Particularly in wetlands, the challenge of modeling animal trophic dynamics becomes one of representing the interactions within and among populations in the context of habitats that may be dynamically varying with hydrology.

GIS and Modelling Research Cluster 2010
Nile Basin Capacity Building Network ( NBCBN ) 57
Figure 4-5: Motile animals can disperse to habitats with more favorable hydrologic conditions, the quality of which may affect animals physiology and their susceptibility to predation or other interactions
A modeling approach that is increasingly being used for such purposes is that of Individual Based Models. As with simulations of forest succession due to interactions among individual trees, such models incorporate individual variation in the quest for understanding dynamics of larger populations. Relaxing some of the broader assumptions of population homogeneity, these modeling approaches explicitly incorporate some aspect of how individuals respond to dynamics of biological and/or physical changes in their environment. In understanding such potential interactions through the collective response of individuals, potential emergent properties of the population(s) can be explored in a highly dynamic wetland environment. An integrated simulation model can take on a range of definitions. Largely dependent on the specific objectives, this may involve the interplay among physical, chemical, biological, and socioeconomic sciences. As indicated in the discussion above, a comprehensive understanding of wetland ecology involves a rather complex suite of properties. Integral with these ―natural‖ properties are the effects of anthropogenic drivers–the human degradation or restoration of wetland systems. In planning for projects involving wetland modifications, data is usually limited, and comprehensive understanding of long-term, fully integrated wetland dynamics is elusive. Simple, statistically-oriented models based on past wetland behaviour may serve to guide initial plans for some wetland management goals. However, as noted previously, such relatively simple models tend to make complex assumptions regarding long term wetland landscape trajectories. Outside of the envelope of past observations, the uncertainty of such models can become problematic (depending on the goals). Moreover, such models tend to lack explanatory power. Relative to a project's goals, it is desirable to determine the minimum set of ecosystem properties that will interact to lead to long-term trajectories of wetland structure and function. Understanding the fundamental physical, chemical, and biological interactions–at some minimal level–becomes a goal for ecological simulations of wetland dynamics in this context. From the perspective of systems dynamics theory, there is a core suite of variables and processes the integration of which into simulated models may provide insight into understanding long term wetland dynamics. The preceding overviews of the modeling at varying trophic levels outline the basic nature of some desirable levels of integration, shown in conceptual form in Figure (4-6). The emergent characteristics revealed by integrated simulated models reflect the unique character of wetland dynamics and further our understanding of the physical drivers of intermittent flooding, and the chemical and biological interactions that lead to varying trajectories of habitats and resident animals.

GIS and Modelling Research Cluster 2010
Nile Basin Capacity Building Network ( NBCBN ) 58
Figure 4-6: Interactions among each model component are shown as process-oriented feedback (of information or matter) within an integrated wetland model
The following is a summary inventory on some of the available ecological models used for managing wetlands from different aspects, mainly focusing on wetlands pollution modeling and control: a. Storm water pollution control ponds and wetlands: this model is used for pond and wetland water quality. It is developed by CRC (Research Cooperative Center) for Freshwater Ecology 1998, it comprise a number of sub-models or component processes, as follows: - Catchment runoff and pollutant mass balance–washout sub-model - Dissolved nutrient uptake by epiphytes attached to macrophytes sub-model - Adsorption of organic colloids (inflow and epiphytes) on the biofilm, and their transfer to the
sediments sub-model The two major applications of this model are: i to decide on a size and design of pond and wetland, in response to targeted pollutants and
interception levels ii to assess existing pond or wetland performance Reference: http://freshwater.canberra.edu.au b. The SET-WET model: this is a user-friendly, dynamic, simulation model for design and evaluation of constructed wetlands in order to optimize NPS pollution control measures. It is written in Fortran 77 to facilitate linking with existing NPS models. The SET-WET model simulates the hydrologic, N, C, bacteria, DO, vegetative, P and sediment cycles within a wetland system. The model allows for either free water surface (FWS) or subsurface flow (SSF) wetland simulations, and is designed in a modular manner; thus it gives the user the flexibility to concentrate on simulation of specific cycles and processes. The season/time period breakdown accounts for seasonal variation by allowing the user to change parameter values in the middle of a simulation run. It allows two forms of data input, one based on measured daily values and another based on estimates from the SCS curve method in conjunction with runoff concentration coefficients. Designed as a continuously stirred tank reactor, the model assumes that all incoming constituents are evenly mixed throughout its entire volume. Parameter input values were based on previous research and site data. Nonparametric statistical analyses of the validated results indicated that the predicted hydrologic, NO3 -, NH4 +, organic N, BOD5, TSS, dissolved and total P concentrations were not statistically different from the measured observations. The Wilcoxon-Rank statistical analyses indicate that the confidence in the organic N, TSS, and DP predictions were high as

GIS and Modelling Research Cluster 2010
Nile Basin Capacity Building Network ( NBCBN ) 59
the respective p-values approached 1.0. Predictions for DO were consistently higher than observed values, which are a cause for concern as the DO concentration directly affects many of the bacteria processes. The Nomini Creek watershed is used for simulation with the SET-WET model, it is located in Westmoreland County, Virginia, and is 80-km northeast of Richmond. Reference: Erik Ryan Lee September 15, 1999. SET-WET: a wetland simulation model to optimize NPS pollution control, Master of Science in Biological Systems Engineering, Faculty of the Virginia Polytechnic Institute and State University. c. A generic wetland ecosystem model WETMOD: It was built using the dynamic simulation software STELLA v.6 which has been widely applied in ecological modelling [Costanza and Gottlieb, 1998]. Mass balance models can be created through differential equations, which consider source and sink relationships typical of ecological systems WETMOD was developed based on the Patuxent Landscape Model (Pat_GEM) [Boumans et al., 2000] and the lake ecosystem model SALMO [Recknagel and Benndorf, 1982]. The current structure of WETMOD considers nutrient loadings, water temperature, turbidity, secchi depth and solar radiation as driving variables, and dissolved inorganic phosphorous and nitrogen, macrophytes, phytoplankton, and zooplankton as state variables. The model has been validated by means of data from one restored and 4 degraded wetlands which occur typically in the Lower River Murray floodplains. In the context of a scenario analysis WETMOD realistically predicted the response of degraded wetlands to feasible restoration measures.

GIS and Modelling Research Cluster 2010
Nile Basin Capacity Building Network ( NBCBN ) 60
5 APPLICATION OF DIFFERENT TOOLS FOR WETLANDS MANAGEMENT
CASE STUDIES FROM THE NILEBASIN
Case Study- Egypt
5.1 Burullus Wetland (Water Quality Assessment and ICZM Application)
The view that wetlands are wastelands, resulting from ignorance or misunderstanding of the value of the goods and services available, has led to their conversion to intensive agricultural, industrial or residential uses. Individual desires of farmers or developers have been supported by government policy and subsidies. Some views still look upon wetlands only in terms of their potential to provide farm land to feed an ever-expanding population, which normally requires alteration of the natural system. Wetlands may also be lost by pollution, waste disposal, mining or groundwater. Therefore there is a need to conserve and manage wetlands to retain their importance and their economic values. Management strategies and environmental policies should be developed regarding this aspect. Development of analytical tools for management of wetlands is an important part needed in the management process.
5.1.1 Description of Pilot Area
Lake Burullus is the second largest lake and most productive wetland in the Egyptian Nile Delta. It is also considered among the most important wetlands in the Mediterranean region. Lake Burullus was designated as a Protected Area in 1998 under the law 102/1983 for the natural protectorates. The lake was included on the Montreux Record of priority sites for conservation action in 1990. A Management Guidance Procedure mission (now called Ramsar Advisory Mission) was carried out in 1991. The report of this mission recommended that the Government of Egypt submitted an application to the Ramsar Wetland Conservation Fund (now Small Grants Fund) to facilitate the initiation of a number of urgently required surveys and management actions. The lake is a nursery for Mediterranean fisheries but several globally threatened species occur at the lake. Burullus Lake is located on the north coast of Kafer El Sheikh, northeast of Egypt. Its coordinate is 310 30/ to the north and 300 50/ to the east. The Lake is connected to the Mediterranean along its length by long sand dune bar, while it is connected to the open sea through a narrow channel near the village of El Burge, in the east. This results in a salinity difference from the east to west. The Lake is a fresh to brackish coastal Lake, shallow, and saline Lake. It has a length of about 65 km and width varying from 16 to 6 km. The Lake has an average depth of 0.8 m with maximum of about 1.6 m, and minimum of 0.5m. Within the Lake there are around 50 islands and islets figure (5-1).

GIS and Modelling Research Cluster 2010
Nile Basin Capacity Building Network ( NBCBN ) 61
Figure 5-1: Burullus Lake and one of its fifty islands
The surface area of the Lake has decreased by about 20% due reclamation activities figure (5-2). It decreased from about 544,76 km2 in 1953 to about 404.50 km2, it is decreased again due to construction of the international road over the northern coastal bar, this includes a bridge of 3km and at the same time a channel will be excavated to connect the Lake to the open sea.
Figure 5-2: Reclamation activity
Climate National climate: Egypt has the Mediterranean dry climate. It is hot in summer, and cool in winter, by going far from coast it get hotter. Regional climate Burullus Lake lay on the Mediterranean coast, so its climate is typical Mediterranean climate, but the sea reduces the temperature. Sea and delta contribute to relatively high humidity. Rainfall Summer months are almost rainless, while winter months are the wettest. Max Annual of mean Rainfall is 187 mm for Egypt main land as recorded over Burullus Lake in the table (5-1).

GIS and Modelling Research Cluster 2010
Nile Basin Capacity Building Network ( NBCBN ) 62
Table 5-1: Mean monthly and annual rainfall (mm) on protected area for 1912-1992 with the volume (in 106 m3) of water added to the lake
Month Jan Feb Mar Apr May Jun Jul Aug Sep Oct Nov Dec Annual Mean 48.06 32.07 16.72 4.45 1.45 0 0 0 0.61 7.80 27.95 48.78 187.37 Max. 153.7 220.8 197.0 30.0 12.00 0 0 0 16.5 86.0 138.0 256.5 598.10 Volume 19.71 13.14 6.85 1.88 1.59 0 0 0 0.25 3.20 11.46 20.0 77.35
Evaporation: Maximum evaporation value was recorded in summer month of May, while minimum values were recorded in winter months from November-February as indicated in table (5-2).
Table 5-2: Estimated average daily (mm) and monthly (mm/month) evaporation and monthly volume (million m3) of water loss from lake Burullus
Month Jan Feb Mar Apr May Jun Jul Aug Sep Oct Nov Dec Daily 3.57 3.89 4.23 4.62 4.9 4.77 4.75 4.66 4.66 4.33 3.95 3.7 Monthly 110.7 108.9 131.1 138.6 151.9 143.1 147.3 144.5 139.8 134.3 118.5 114.7 Monthly volume
45.39 44.65 53.75 54.37 62.28 58.67 60.39 59.23 57.32 55.03 48.59 47.03
Temperature: The air temperature has a mean value of 14.4o in winter, increasing to 26.2o in summer.
Relative humidity:
Max. Value of 75 R.H.% was recorded in august and min. value of 65 R.H.% was recorded in spring months. Table (5-3) indicates these data, as reported by the drainage institute. Table5-3: Mean monthly air temperature (c0) and relative humidity (R.H.%) at lake Burullus.
Month Jan Feb Mar Apr May Jun Jul Aug Sep Oct Nov Dec Temp. 14.4 16.1 17.4 19.4 21.5 25.6 26.2 26.2 25.0 23.7 20.5 15.0 R.H. 70 68 65 65 65 65 70 75 73 70 70 70
5.1.2 Hydrology
Burullus Lake system:
The present area of the Lake is 410 km2, where 370 km2 is open water. The Lake water volume is 328 million cubic meters at mean sea level; annual volume about 3.9 million cubic meter enters the Lake from the drainage system, which discharges into the Lake. This is the main fresh water source of the Lake. Water level is fluctuating through the year as illustrated in figure (5-3). The drainage water forms 97% of the total water resources of the Lake. Without the winter closure (2-3 weeks with no flow of water in the network of irrigation canals), the water level in the Lake is higher than mean sea water level through out the year. When the policy of winter closure is adopted, water level in the Lake is 26 cm lower than mean sea water level, and this is allowing 110 million m3 of seawater to enter the Lake. Subsequently increasing the Lake salinity.

GIS and Modelling Research Cluster 2010
Nile Basin Capacity Building Network ( NBCBN ) 63
Figure 5-3: Lake water level with respect to MSL
Lake water:
In the past, the Lake was a brackish water Lake due to the sea water entering during summer months with marine condition near the inlet, and in the north of the Lake balanced by winter flooding of the Nile. After building the High dam in Aswan, and the agriculture system in the delta zone, more fresh water enters the Lake during all months. As a result the Lake characteristics changed. Fresh water of the drainage system enters the Lake all the year, which forms 97% of the Lake water volume; this prevents any salt water to enter especially in rice season. In the winter closure no fresh water flows into the irrigation system, and this lowers the Lake water level, consequently seawater enters the Lake, and this results in more saline water. The government is planning to reduce the rice agriculture in this zone, so freshwater inflow will reduce, this will have an impact on the Lake water and make it more saline.
Tides and Tidal inlet:
There is only one connection to the open sea through El Bughaz inlet as in figure(5-4). It is 250 m long and has minimum width of about 50 m and depth of about 50 to 200 cm. There is high rate of silting up in this inlet, so there is always dredging operation to keep the connection to the sea open. The Tidal range recorded in 2001 through the inlet varies from 5 cm min to 27 cm max.
Figure 5-4: Lake Inlet (El-Bughaz)
0
0.1
0.2
0.3
0.4
0.5
0.6
0.7
0 2 4 6 8 10 12
Wate
r le
vel above M
SL
Month

GIS and Modelling Research Cluster 2010
Nile Basin Capacity Building Network ( NBCBN ) 64
Sand Barrier:
The Lake is separated from the Mediterranean Sea by a sand bar. This bar extend between latitudes 310 23‘ 26‘‘ to 310 34‘ 48‘‘ N and longitudes 310 2‘ 48‘‘ to 310 7‘ 30‘‘E. It have an area of 165km2, the surface of the bar is flat. It has a different geomorphological feature, some of which are related to sediment process as sand dunes, while others such as tidal flats and salt marshes, are related to sea level changes and coastal erosion (Bayomi, 1999). Groundwater inflow and outflow: The groundwater flux enters the Lake is 63.141 m3/day, while 25.761 m3/day is the net seepage through the Lake‘s boundaries. Drainage system into the Lake: There are six drains, which ends to the Lake as in figure (5-5). They are the main freshwater sources of the Lake. These are irrigation drainage, but also sewerage and industrial waste exists, which increase the pollution level in the Lake.
Figure 5-5: Drains locations
The Lake water quality is highly affected by the drainage water. Table (5-4) and table (5-5) introduce the quality parameters depending on the yearly reported data in a report done by Drainage Research Institute about drainage water in Nile delta for 2000/2001 and 2001/2002.

GIS and Modelling Research Cluster 2010
Nile Basin Capacity Building Network ( NBCBN ) 65
Table 5-4: Average water quality in the drainage for 2000/2001 Location P.s. No.11 P.s. No.7 P.s No.8 Burullus P.s. Tira P.s Nashrat
Drain Anv. C.v Anv. C.v Anv. C.v Anv. C.v Anv. C.v Anv. C.V
Bod (mg/l) 48 0.31 56 0.43 45 0.72 50 0.54 54 0.81 53 0.52 Cod (mg/l) 76 0.38 81 0.43 60 0.60 74 0.44 79 0.69 78 0.46
Turbidity FTu 58 0.39 114 0.43 93 0.23 14 0.78 82 0.38 27 0.48 Tss (mg/l) 68 0.33 68 0.34 80 0.2 84 0.23 93 0.33 74 0.35 Tvs (mg/l) 7 0.30 7 0.30 8 0.19 8 0.26 9 0.35 7 0.35 No3 (mg/l) 1.063 0.32 0.801 0.35 1.189 0.37 1.125 0.41 1.464 0.36 0.842 0.43 Nh4 (mg/l) 1.953 0.36 1.523 0.35 1.513 0.41 1.748 0.61 1.467 1.02 1.822 0.34 Tp (mg/l) 1.352 0.54 1.319 0.55 1.183 0.59 1.088 0.38 0.983 0.61 1.098 0.48 TN (mg/l) 5.6 0.28 5.103 0.28 5.507 0.33 8.745 0.33 5.558 0.46 6.182 0.34 Cd (mg/l) .003 0.98 0.002 1.04 .002 0.96 0.003 1.07 .001 0.08 0.002 0.91 Cu (mg/l) 0.068 0.39 0.042 0.43 0.048 0.60 0.079 1.07 0.208 0.57 0.068 1.00 Fe (mg/l) 0.568 0.60 0.74 0.92 0.698 0.53 0.72 0.45 0.671 0.40 0.958 0.67
Mn (mg/l) 0.121 0.63 0.085 0.40 0.217 0.86 0.213 0.69 0.327 0.49 0.161 0.47
Zn (mg/l) 0.042 1.01 0.021 0.78 0.018 0.78 0.141 1.17 0.113 1.16 0.041 1.25
Ni (mg/l) 0.019 1.09 0.029 1.10 0.02 1.16 0.018 1.04 0.021 1.07 0.022 1.02
Pd (mg/l) 0.07 0.99 0.033 0.50 0.074 0.99 0.117 1.40 0.128 0.90 0.055 1.25
Boron (mg/l) 0.279 0.44 0.389 0.29 0.329 0.43 0.484 0.20 0.279 0.46 0.356 0.43
Do (mg/l) 3.33 0.24 5.63 0.24 5.54 0.18 7.82 0.34 3.96 0.23 4.09 0.81
PH 7.42 0.03 7.61 0.04 7.50 0.04 7.61 0.03 7.55 0.03 7.39 0.04
EC Ds/m 1.42 0.29 3.96 0.34 3.26 0.42 7.36 0.19 5.96 0.20 1.75 0.35
TDS (mg/l) 1287 0.66 2478 0.34 1872 0.44 4686 0.19 3889 0.20 1227 0.33
Ca Meq/l 5.08 0.71 9.16 0.45 7.78 0.40 16.04 0.34 12.49 0.39 4.55 0.44
Mg Meq/l 4.49 0.75 8.79 0.46 7.34 0.50 14.72 0.33 12.55 0.33 4.16 0.35
Na Meq/l 9.85 0.66 22.03 0.44 15.61 0.58 41.88 0.31 32.97 0.36 9.04 0.33
k Meq/l 0.63 0.70 0.89 0.47 0.69 0.48 1.73 0.39 1.30 0.42 0.56 0.44
Co3 Meq/l 0 0 0 0 0 0 0 0 0 0 0 0
Hco3 Meq/l 0.02 0.74 0.12 0.58 6.39 0.53 14.80 0.63 11.52 0.58 5.28 0.45
So4_m Meq/l 6.71 0.77 9.86 0.47 6.88 0.54 20.00 0.19 14.86 0.26 5.57 0.50
So4 Meq/l 6.76 0.61 11.94 0.41 9.71 0.49 18.99 0.59 16.02 0.48 6.18 0.34
Ci Meq/l 8.27 0.73 20.77 0.49 16.32 0.62 40.58 2.38 31.76 0.43 6.85 2.48
SAR 4.49 0.31 7.52 0.48 1.14 0.62 11.20 0.38 9.61 0.40 4.35 0.22
Adj_SAR 10.97 0.48 20.14 0.41 14.43 0.51 32.47 0.26 27.12 0.50 10.56 0.27
RSC 0 0 0 0 0 0 0 0 0 0 0 0

GIS and Modelling Research Cluster 2010
Nile Basin Capacity Building Network ( NBCBN ) 66
Table 5-5: average water qualities in the drainage for 2001/2002
Location P.s. No.11 P.s. No.7 P.s No.8 Burullus P.s. Tira P.s Nashrat Drain
Anv. C.v Anv. C.v Anv. C.v Anv. C.v Anv. C.v Anv. C.V
Bod (mg/l) 55 0.3 64 0.58 51 0.48 34 0.25 58 0.77 64 0.41
Cod (mg/l) 81 0.27 87 0.43 81 0.35 56 0.19 82 0.61 91 0.36
Turbidity FTu 64 0.45 97 0.37 112 0.38 17 0.65 75 0.43 31 0.79
Tss (mg/l) 57 0.28 59 0.33 94 0.19 81 0.18 89 0.21 115 0.16
Tvs (mg/l) 5 0.53 6 0.62 8 0.34 6 0.24 8 0.28 9 0.30
No3 (mg/l) 1.958 1.28 1.704 0.27 1.278 0.37 1.32 0.12 1.305 0.18 0.868 0.54
Nh4 (mg/l) 1.467 0.23 2.276 0.38 1.879 0.19 1.932 0.4 0.769 0.17 1.659 0.34
Tp (mg/l) 1.158 0.15 1.523 0.4 1.007 0.38 1.022 0.30 0.459 0.23 1.093 0.37
TN (mg/l) 5.710 0.08 5.978 0.15 5.457 0.08 6.298 0.12 5.285 0.17 5.623 0.16
Cd (mg/l) 0.001 0.45 0.002 0.50 0.004 0.60 0.003 0.54 0.001 0.75 0.002 0.67
Cu (mg/l) 0.013 0.38 0.042 0.55 0.087 0.72 0.092 0.5 0.184 0.92 0.037 0.57
Fe (mg/l) 0.473 0.92 0.914 0.25 0.475 0.65 0.747 0.48 0.709 1.14 0.902 0.65
Mn (mg/l) 0.170 0.86 0.259 0.52 0.297 0.36 0.307 0.45 0.254 0.56 0.161 0.47
Zn (mg/l) 0.132 0.80 0.103 0.91 0.018 0.66 0.476 0.85 0.043 1.57 0.045 1.13
Ni (mg/l) 0.035 0.52 0.031 0.55 0.040 0.50 0.041 0.63 0.059 1.04 0.124 2.23
Pd (mg/l) 0.012 1.43 0.013 0.50 0.010 0.64 0.013 1.02 0.011 0.90 0.012 0.76
Boron (mg/l) 0.233 0.41 0.41 0.30 0.350 0.76 0.397 0.06 0.187 0.41 0.325 0.5
Do (mg/l) 2.75 0.62 4.40 0.48 5.26 0.28 7.53 0.21 4.15 0.32 4.3 0.5
PH 7.19 0.02 7.38 0.04 7.32 0.04 7.39 0.03 7.44 0.05 7.3 0.03
EC Ds/m 1.52 0.43 4.24 0.37 3.83 0.39 5.49 0.86 5.72 0.13 1.84 0.39
TDS (mg/l) 1028 0.45 2746 0.38 2549 0.40 3696 0.86 3901 0.18 1374 0.37
Ca Meq/l 3.87 0.37 12.43 0.50 11.95 0.54 14.22 0.88 15.46 0.22 4.72 0.41
Mg Meq/l 3.90 0.45 10.96 0.46 9.00 0.43 13.78 0.88 14.26 0.25 4.36 0.41
Na Meq/l 5.88 0.48 14.50 0.40 14.70 0.42 20.12 0.87 22.85 0.20 7.78 0.42
k Meq/l 0.39 0.51 1.09 0.37 1.03 0.39 1.56 0.87 1.72 0.17 0.54 0.39
Co3 Meq/l 0 0 0 0 0 0 0 0 0 0 0 0
Hco3 Meq/l 4.31 0.44 11.90 0.39 10.9 4.31 15.77 0.87 17.13 0.18 5.32 0.43
So4_m Meq/l 4.02 0.41 10.37 0.40 9.26 0.40 14.16 0.87 15.22 0.18 4.6 0.46
So4 Meq/l 3.99 0.45 11.05 0.51 10.72 0.48 12.76 0.87 15.27 0.25 4.97 0.44
Ci Meq/l 5.74 0.45 16.03 0.41 15.05 0.43 21.15 0.87 21.89 0.22 7.11 0.43
SAR 2.92 0.27 4.29 0.27 4.47 0.24 4.72 0.63 5.95 0.13 3.61 0.21
Adj_SAR 6.88 0.39 12.85 0.35 13.24 0.35 14.64 0.85 19.15 0.15 8.92 0.31
RSC 0 0 0 0 0 0 0 0 0 0 0 0

GIS and Modelling Research Cluster 2010
Nile Basin Capacity Building Network ( NBCBN ) 67
5.1.3 Human activity within Burullus watershed area
Diwedar 2005 in his master thesis collected information on burulls lake and specified the running activities within Burullas lake watershad area, this activities are described below: Agriculture: Total farmlands within the area is 1218.16 km2, 75.90 km2 inside the protected area. The soil near shoreline of the Lake is not good for agriculture. Land reclamation activity is continuing on the western side of the inlet, where the soil is sand. Agriculture on the western side of the inlet is rain-fed. On the eastern side of the inlet near Baltime city, it is intensively cultivated, mainly with date palms and guava. Other crops within the area are tomatoes, grapes, clover, cabbage, cauliflower, watermelons, broad beans, wheat, rice, and maize. The winter crops produce about 500*103 kg/km2, with revenue 3750 Egyptian pound/ha. While the summer crops have an average production of about 650 *103 kg/km2, with revenue 5000 Egyptian pound /ha. There are now two new agriculture projects; the General Authority of Reclamation and agriculture development implements these two projects with association of Ministry of Agriculture. The first one covers an area of about 24 km2 north of the international highway (east of the Lake) close to villages El-Sayed El-Badawi and Ibrahim El-Desouki. The second covers an area of about 19 km2 on the southern part of the international highway (west of the Lake).
Tourism:
The tourism activity is mainly concentrated on the seaside of Baltim city. It depends only on the Egyptian tourists coming from Cairo and Nile delta cities in summer months and high tourism in August. There are three hotels in Baltim inside Kafer El-Sheikh provision. Through an interview with responsible in the Local Unit of Burullus, data in table (5-6) and (5-7) were collected.
Table 5-6:Hotels capacity
Hotel name Capacity Number of room % Occupying Kelobatra 126 42 98
Gold 78 26 78 Eyzes 36 12 90
Table 5-7: Distribution of tourism in the summer months
Month Jun Jul Aug Sep Number of
tourist 95 195 270 125
Fishery:
Fishing is the main activity in Burullus Lake. Fish production for the Lake increased from 7,273*103kg in 1982 to 52,343*103 kg in 2000. In 2002 it reached 58,384*103 kg and it remain the same in 2003. Fig (5-6) shows the fishing port.
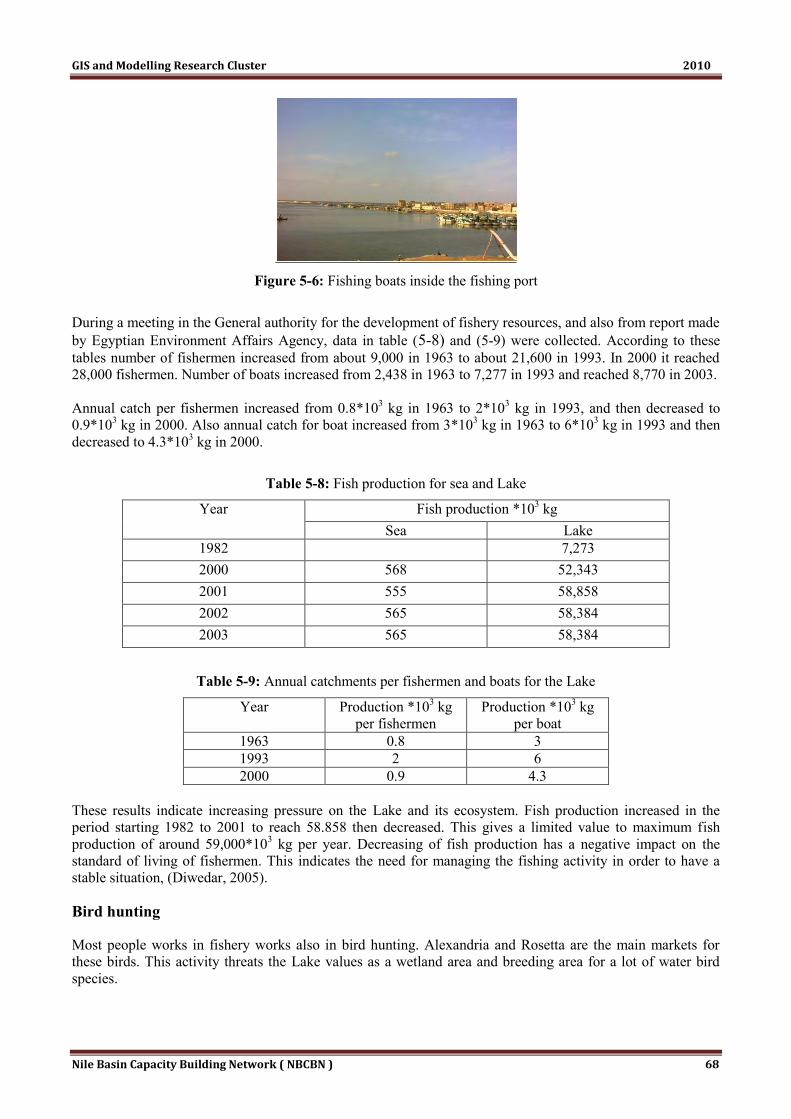
GIS and Modelling Research Cluster 2010
Nile Basin Capacity Building Network ( NBCBN ) 68
Figure 5-6: Fishing boats inside the fishing port
During a meeting in the General authority for the development of fishery resources, and also from report made by Egyptian Environment Affairs Agency, data in table (5-8) and (5-9) were collected. According to these tables number of fishermen increased from about 9,000 in 1963 to about 21,600 in 1993. In 2000 it reached 28,000 fishermen. Number of boats increased from 2,438 in 1963 to 7,277 in 1993 and reached 8,770 in 2003. Annual catch per fishermen increased from 0.8*103 kg in 1963 to 2*103 kg in 1993, and then decreased to 0.9*103 kg in 2000. Also annual catch for boat increased from 3*103 kg in 1963 to 6*103 kg in 1993 and then decreased to 4.3*103 kg in 2000.
Table 5-8: Fish production for sea and Lake
Year Fish production *103 kg Sea Lake
1982 7,273 2000 568 52,343 2001 555 58,858 2002 565 58,384 2003 565 58,384
Table 5-9: Annual catchments per fishermen and boats for the Lake
Year Production *103 kg per fishermen
Production *103 kg per boat
1963 0.8 3 1993 2 6 2000 0.9 4.3
These results indicate increasing pressure on the Lake and its ecosystem. Fish production increased in the period starting 1982 to 2001 to reach 58.858 then decreased. This gives a limited value to maximum fish production of around 59,000*103 kg per year. Decreasing of fish production has a negative impact on the standard of living of fishermen. This indicates the need for managing the fishing activity in order to have a stable situation, (Diwedar, 2005).
Bird hunting
Most people works in fishery works also in bird hunting. Alexandria and Rosetta are the main markets for these birds. This activity threats the Lake values as a wetland area and breeding area for a lot of water bird species.

GIS and Modelling Research Cluster 2010
Nile Basin Capacity Building Network ( NBCBN ) 69
Fish farm
Fish farms are concentrated on the southern shore of the Burullus Lake (figure 5-7). There is a high rate of turning the unused land or reclaimed to fish farm in this area, due to the poor land quality and high rate of return of fish farm. The fish species used in fish farm activity is almost all the species of the Lake, and this harm the Lake production as the small fishes are taken for the fishponds. On 1980 a farm project started by the government, it is estimated that fish farm occupy 13.46 km2, with annual production rate of 115,335*103 kg. The productivity is estimated to be 5-6.25 *105 kg/km2. Revenue of one hectare is around 9000 Egyptian pound/cycle. It is recognised that there is a rapidly increasing of this activity, which should be managed, as any uncontrolled development in this activity has negative impact on Lake fish production as well as on the Lake area and Lake water quality, (Diwedar 2005).
Figure 5-7: Fish farm
Industry
Now only shipyard industry (figure 5-8) is going on in this area, but in future a fish industry will be established attached with the new fishing port, which is under construction now. South of Baltim city and 5 kilometres from the international road, there is an industrial area, contain different industries, these industries has an impact on the Lake water quality by the waste going to the Lake through the drains. Table (5-10) introduces the industries that already had begun working and production.
Figure 5-8: Ship Yard
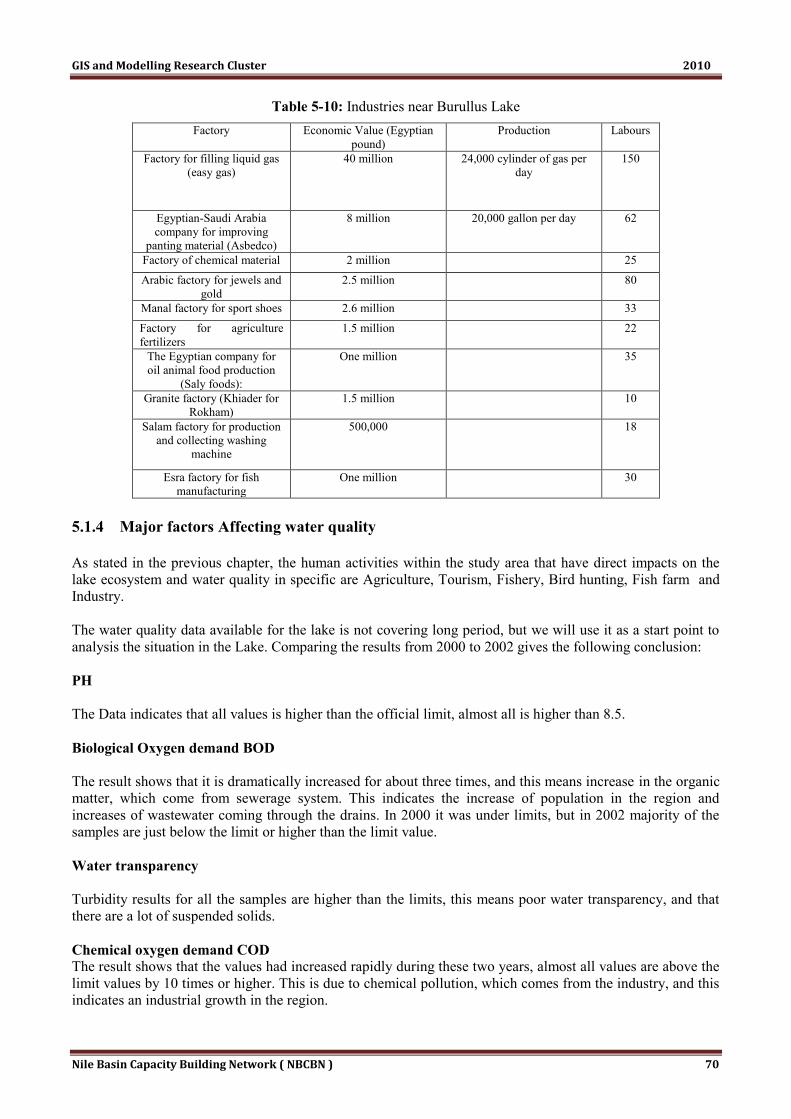
GIS and Modelling Research Cluster 2010
Nile Basin Capacity Building Network ( NBCBN ) 70
Table 5-10: Industries near Burullus Lake Factory Economic Value (Egyptian
pound) Production Labours
Factory for filling liquid gas (easy gas)
40 million 24,000 cylinder of gas per day
150
Egyptian-Saudi Arabia company for improving
panting material (Asbedco)
8 million 20,000 gallon per day 62
Factory of chemical material 2 million 25
Arabic factory for jewels and gold
2.5 million 80
Manal factory for sport shoes 2.6 million 33
Factory for agriculture fertilizers
1.5 million 22
The Egyptian company for oil animal food production
(Saly foods):
One million 35
Granite factory (Khiader for Rokham)
1.5 million 10
Salam factory for production and collecting washing
machine
500,000 18
Esra factory for fish manufacturing
One million 30
5.1.4 Major factors Affecting water quality
As stated in the previous chapter, the human activities within the study area that have direct impacts on the lake ecosystem and water quality in specific are Agriculture, Tourism, Fishery, Bird hunting, Fish farm and Industry. The water quality data available for the lake is not covering long period, but we will use it as a start point to analysis the situation in the Lake. Comparing the results from 2000 to 2002 gives the following conclusion: PH The Data indicates that all values is higher than the official limit, almost all is higher than 8.5. Biological Oxygen demand BOD The result shows that it is dramatically increased for about three times, and this means increase in the organic matter, which come from sewerage system. This indicates the increase of population in the region and increases of wastewater coming through the drains. In 2000 it was under limits, but in 2002 majority of the samples are just below the limit or higher than the limit value. Water transparency Turbidity results for all the samples are higher than the limits, this means poor water transparency, and that there are a lot of suspended solids. Chemical oxygen demand COD The result shows that the values had increased rapidly during these two years, almost all values are above the limit values by 10 times or higher. This is due to chemical pollution, which comes from the industry, and this indicates an industrial growth in the region.

GIS and Modelling Research Cluster 2010
Nile Basin Capacity Building Network ( NBCBN ) 71
Total suspended solids TSS The results of the samples are very high, which means high pollution of organic and non-organic material from industrial and agriculture waste. Heavy metals Concentration of Zinc had reduced, while concentration of copper (cu) has increased significantly, but also still under the limit value. Iron concentration had increased rapidly and some sample exceeded the limit value, which indicates increasing of agriculture and industrial waste.
5.1.5 Field Work
Due to the lack of existing data field work was conducted to overcome this problem. The field data collection was undertaken in 31 July 2008 and extended for 2 days. In the field campaign we try to capture the sample at the same points that were collected previously at 2002 and then we capture the additional points according to the preset sample plan. The GPS was used in order to reach the predefined points location of 2002, and in order to determine the new point's location according to the sample plan. For all the points some parameters were measured during the field and the other had been get after finalizing the lab analysis, the table (5-11) summarizes the measured parameters in the field and the used equipments as in figure (5-9).
Table 5-11: measured parameters in the field and the used equipments
Parameter Equipment used Unite Temperature WTW Electrical conductivity meter Celsius EC WTW Electrical conductivity meter Mmhos/cm pH WTW pH meter DO WTW Dissolved Oxygen meter Mg/l Depth Staff Meter
Figure 5-9: Measuring Instruments
Knowledge of the background quality is necessary to assess the suitability of water for use and to detect future human impacts. The selection of variables to be included in a water quality assessment must be related to the objectives of the programme. In this research we aim to monitor the lake quality according to the following objectives:
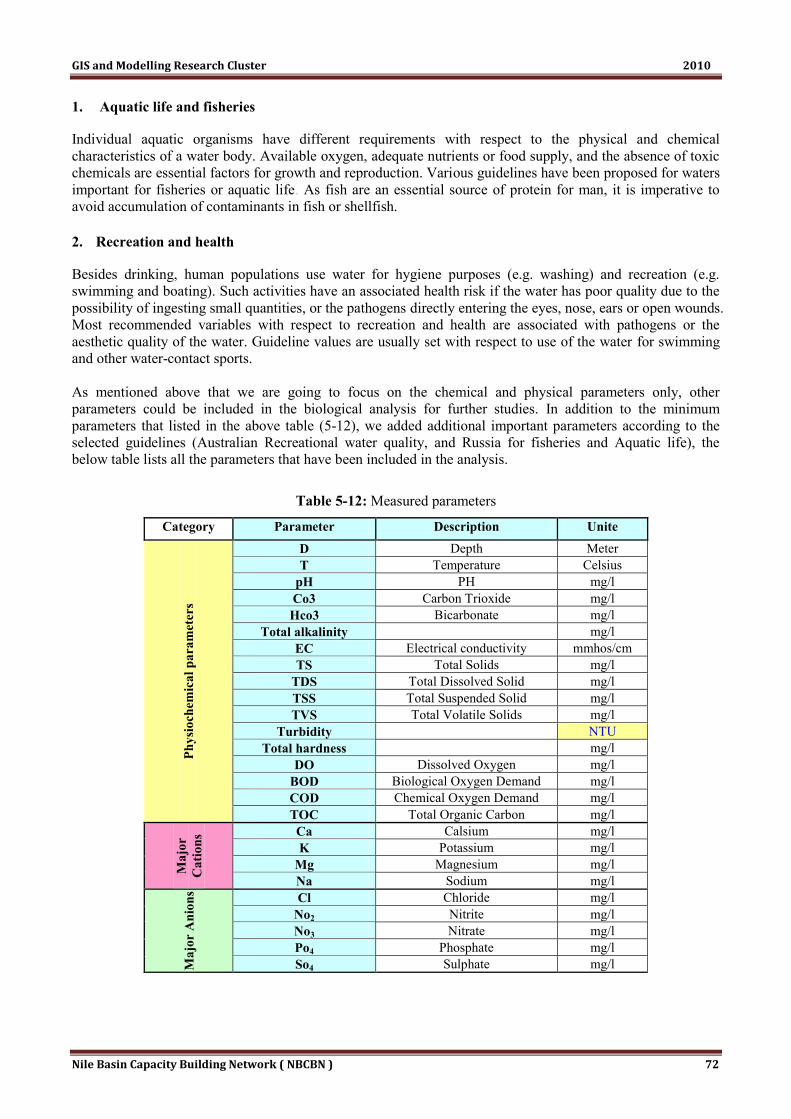
GIS and Modelling Research Cluster 2010
Nile Basin Capacity Building Network ( NBCBN ) 72
1. Aquatic life and fisheries
Individual aquatic organisms have different requirements with respect to the physical and chemical characteristics of a water body. Available oxygen, adequate nutrients or food supply, and the absence of toxic chemicals are essential factors for growth and reproduction. Various guidelines have been proposed for waters important for fisheries or aquatic life. As fish are an essential source of protein for man, it is imperative to avoid accumulation of contaminants in fish or shellfish. 2. Recreation and health
Besides drinking, human populations use water for hygiene purposes (e.g. washing) and recreation (e.g. swimming and boating). Such activities have an associated health risk if the water has poor quality due to the possibility of ingesting small quantities, or the pathogens directly entering the eyes, nose, ears or open wounds. Most recommended variables with respect to recreation and health are associated with pathogens or the aesthetic quality of the water. Guideline values are usually set with respect to use of the water for swimming and other water-contact sports. As mentioned above that we are going to focus on the chemical and physical parameters only, other parameters could be included in the biological analysis for further studies. In addition to the minimum parameters that listed in the above table (5-12), we added additional important parameters according to the selected guidelines (Australian Recreational water quality, and Russia for fisheries and Aquatic life), the below table lists all the parameters that have been included in the analysis.
Table 5-12: Measured parameters
Category Parameter Description Unite
Phys
ioch
emic
al p
aram
eter
s
D Depth Meter T Temperature Celsius
pH PH mg/l Co3 Carbon Trioxide mg/l Hco3 Bicarbonate mg/l
Total alkalinity mg/l EC Electrical conductivity mmhos/cm TS Total Solids mg/l
TDS Total Dissolved Solid mg/l TSS Total Suspended Solid mg/l TVS Total Volatile Solids mg/l
Turbidity NTU Total hardness mg/l
DO Dissolved Oxygen mg/l BOD Biological Oxygen Demand mg/l COD Chemical Oxygen Demand mg/l TOC Total Organic Carbon mg/l
Maj
or
Cat
ions
Ca Calsium mg/l K Potassium mg/l
Mg Magnesium mg/l Na Sodium mg/l
Maj
or A
nion
s Cl Chloride mg/l No2 Nitrite mg/l No3 Nitrate mg/l Po4 Phosphate mg/l So4 Sulphate mg/l

GIS and Modelling Research Cluster 2010
Nile Basin Capacity Building Network ( NBCBN ) 73
Category Parameter Description
Tra
ce M
etal
s
Al Aluminum mg/l Bo Barium mg/l Cd Cadmium mg/l Co Cobolt mg/l Cr Chromium mg/l Cu Copper mg/l Fe Iron mg/l Mn Maganese mg/l Nl Nickel mg/l Pb Lead mg/l Sb Antimony mg/l Sn Tin mg/l V Vanadium mg/l
Zn Zinc mg/l Ar Arsenic mg/l Se Selenium mg/l
3. Sampling Plan
At the pre-fieldwork stage a sampling design was formulated to insure that there are enough data samples to portray an accurate representation of the surface. The sample methodology is to take the same points for 2002 (in order to make comparison between 2002 and 2008) and then take additional points covering all the lake patterns, this is to insure good distribution of the points and consequently grantee the results accuracy. For the new points (additional points) a stratified random plan was adopted based on patterns on satellite images which indicated high possibilities to reach the predefined points. The total number of samples for the lake is 24 samples. The 24 samples represent total of three sections: Eastern: 6, Central: 13, Western: 5 An overview of the scheme is depicted in Figure (5-10).
Figure 5-10: Sampling points in Burullus Lake
5.2 Water Quality Assessment
For the data collected in the year 2002 descriptive statistical analysis was conducted and the this analysis is shown in the table (5-13) below.
0

GIS and Modelling Research Cluster 2010
Nile Basin Capacity Building Network ( NBCBN ) 74
Table 5-13: Water Quality Parameters for 2002/2008
From the descriptive analysis, we can find that most of the parameters in 2008 has bigger variation than the one present in 2002 ( ex. TS, TDS, Total Hardness, …). The next pages conclude the lake status and problems. 1. Ph:
Table 5-14: PH concentration
Category Parameter 2002 2008 Min. Max. Mean Variation Min. Max. Mean Variance
Phys
ioch
emic
al p
aram
eter
pH 3.8 3.38 3.6538 0.0. 5 . .. 0 3.. 8 3.885. 0.3888 Co3 .8 306.5 6. .5 303. .3. 8 0.00 . 8.00 . 3.. 888 . . 5.. 330
Hco3 3. 8.88 850 . 8. .. 8 8353.563 . 5. .00 88. .00 8. 8.80 6. 85.68. 8
Total alkalinity
. . 5.6. 836 . 80.88 . 386.083 800.00 88. .00 808.3888 8. 00.8086
EC 3.3. 8.83 6.. 35. . .8. . . .80 8. .. 0 3.080. 83.88. 5
TS . . 8.8 6833.8 88. 5.3 8088. 83.00 3300.00 83560.00 50. 8.00 6683. 083.. 600
TDS 68. .8 . 0. 6 33. 5.3 358508.30 3686.00 . . 003.00 6363.355. 8036. 856.586.
TSS 38 350 . . .. 88 38. 8.05. . 0.00 3. 8.00 . . .30 3350.8388
TVS . 33 3.3888 . 8.3. 8 8.00 38.00 3.3888 . 3.3833
Turbidity .8 . . 8 3. 0.. 8 . 83. 8.05. 35.. 0 . 03.00 68.3888 . 006.8. 58
Total hardness
. . 5 3380 588.8. 3. 380.. 5. 830.33 . 586.. 833 . 8. .68. 8 803883.388.
BOD 8 .8 3. .8 65.3. 8 8.00 . 8.00 8.80 88.3388
COD 86 386 338.38 . . 66.. 5. . 8.00 33. .00 3. 3.50 35. .3. 35
Maj
or A
nion
s
TOC 8.. . 65.. . 8.. 58 308.368 0.833 3.033 0.83. 8 0.0035
Cl 368.36 . . 35 3863.8 . . 3. 83.80 630.00 38033.00 . . . . .. 55. 835. 333.055.
No2 0 0.3. 0.088888 0.003 Data has no variation
No3 0.0. 8.8. 0.8835. 3.663 0.30 3.00 0.. 8. 8 0.0583
Tra
ce M
etal
s
Po4 0.3 0.8. 0.3. 688 0.006 Data has no variation
Cu 0.003 3.3. 0.388. 8 0.. 88 0.008 0.8. 8 0.38688 0.0. 03
Fe 0.0. 3 6.0. 3.8533 3.858 0.008 0.. 88 0.03868 0.0058
Zn 0.008 3.8. 0.336. . 0.338 0.008 0.085 0.00. 88 0.0003

GIS and Modelling Research Cluster 2010
Nile Basin Capacity Building Network ( NBCBN ) 75
Figure 5-11: PH concentration Table (5-14) highlighted the records that has high values in 2008 than that recorded in 2002, also figure (5-11) shows the sample point and its recorded value for year 2002 (blue curve) and year 2008 (green curve).
Figure 5-12: Analysis of PH
Figure (5-12) shows that the pH values has homogenous data for both 2002 and 2008, most of the data values for 2008 has less values than 2002 (especially near the southeast drains), accordingly attention should be given to this issues as Metals tend to be more toxic at lower pH because they are more soluble and will be more available for the aquatic life. The pH of water determines the solubility (amount that can be dissolved in the water) and biological availability (amount that can be utilized by aquatic life) of chemical constituents such as nutrients (phosphorus, nitrogen, and carbon) and heavy metals (lead, copper, cadmium, etc.), it has a direct impact on aquatic life asthey greatly influence the availability and solubility of all chemical forms in the lake and may aggravate nutrient problems. The pH may increase the solubility of phosphorus, making it more available for plant growth and resulting in a greater long-term demand for dissolved oxygen and this could consequently lead to increase in pH levels as allowed by the buffering capacity of the lake. 2. Hco3: The Hco3 values has homogenous data for both 2002 and 2008, all the data values for 2008 has bigger values than 2002 as in figure (5-13), accordingly attention should be given soluble bicarbonates could lead to the
pH 2002 pH 2008

GIS and Modelling Research Cluster 2010
Nile Basin Capacity Building Network ( NBCBN ) 76
increase of the concentration of free carbonic acids in the water causes corrosive to metals and concrete, which disturb the structure of these materials.
Figure 5-13: Analysis of Hco3
3. TS:
The TS values in 2008 has higher values than in 2002, but some values in 2002 are bigger than 2008, see figure (5-14).
Figure 5-14: Analysis of TS
TS 2002 TS 2008
Hco3 2002 Hco3 2008
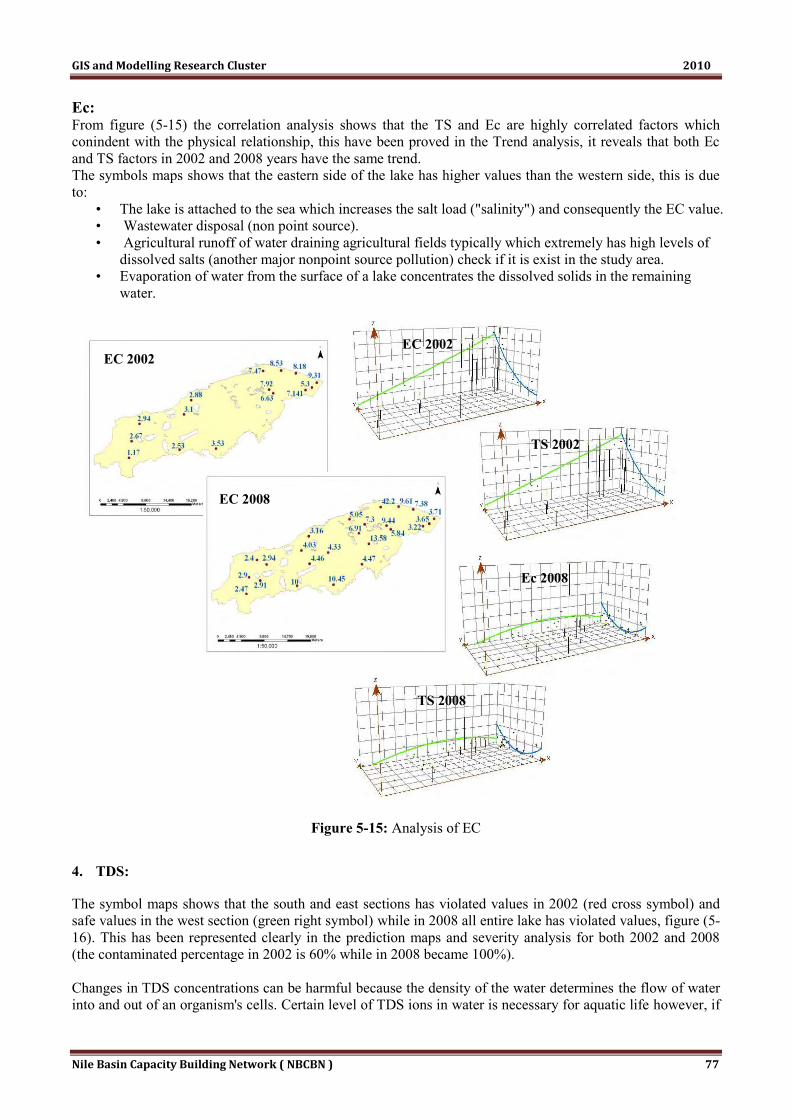
GIS and Modelling Research Cluster 2010
Nile Basin Capacity Building Network ( NBCBN ) 77
Ec: From figure (5-15) the correlation analysis shows that the TS and Ec are highly correlated factors which conindent with the physical relationship, this have been proved in the Trend analysis, it reveals that both Ec and TS factors in 2002 and 2008 years have the same trend. The symbols maps shows that the eastern side of the lake has higher values than the western side, this is due to:
• The lake is attached to the sea which increases the salt load ("salinity") and consequently the EC value. • Wastewater disposal (non point source). • Agricultural runoff of water draining agricultural fields typically which extremely has high levels of
dissolved salts (another major nonpoint source pollution) check if it is exist in the study area. • Evaporation of water from the surface of a lake concentrates the dissolved solids in the remaining
water.
Figure 5-15: Analysis of EC
4. TDS:
The symbol maps shows that the south and east sections has violated values in 2002 (red cross symbol) and safe values in the west section (green right symbol) while in 2008 all entire lake has violated values, figure (5-16). This has been represented clearly in the prediction maps and severity analysis for both 2002 and 2008 (the contaminated percentage in 2002 is 60% while in 2008 became 100%). Changes in TDS concentrations can be harmful because the density of the water determines the flow of water into and out of an organism's cells. Certain level of TDS ions in water is necessary for aquatic life however, if
EC 2002 EC 2002
EC 2008
Ec 2008
TS 2008
TS 2002

GIS and Modelling Research Cluster 2010
Nile Basin Capacity Building Network ( NBCBN ) 78
TDS concentrations are too high or too low, the growth of many aquatic lives can be limited, and death may occur. In our case the lake suffer from high values of TDS, similar to TSS, high concentrations of TDS may also reduce water clarity, contribute to a decrease in photosynthesis, combine with toxic compounds and heavy metals, and lead to an increase in water temperature. Water with high TDS (like our case) often has a bad taste and/or high water hardness, and could result in a laxative effect.
Figure 5-16: Analysis of TDS
5. Total Hardness:
Due to their significant correlation the TDS reflected on the Total Hardness, so we can notice that the south and east sections has violated values in 2002 while the lake status in 2008 became more significant as seen below in figure (5-17).
TDS 2002 TDS 2008
TDS 2002 TDS 2008

GIS and Modelling Research Cluster 2010
Nile Basin Capacity Building Network ( NBCBN ) 79
Figure 5-17: Analysis of total hardness 6. Ca & Mg:
Figure 5-18: Analysis of Ca& Mg
The salts of calcium, together with those of magnesium, are responsible for the hardness of water they are correlated parameters therefore they have the same spatial trend like present in the trend analysis, also the prediction maps (figure 5-18) shows that the lake has high Total Harndesss values which indicate high Ca and Mg values, by investigation we found out that the lake has high values due to its connection to the sea as the semevariogram analysis shows that the 3 parameters has point 1 as a global outlier near the sea, industrial as well as water and wastewater treatment processes also contribute calcium to surface waters. Acidic rainwater
Total Hardness 2002 Total Hardness 2008
Total Hardness 2002 Total Hardness 2008
T.H 2008 T.H 2008
Ca 2008
Mg 2008
Ca 2008
Mg 2008

GIS and Modelling Research Cluster 2010
Nile Basin Capacity Building Network ( NBCBN ) 80
can increase the leaching of calcium from soils. Although magnesium is used in many industrial processes, these contribute relatively little to the total magnesium in surface waters. 7. Cl:
The entire lake has high values in both 2002 and 2008 as seen in figure (5-19), especially at the eastern side, this is seems reasonable as most of the agriculture lands and industrial sewage located there. concentrations of chloride can make waters unpalatable and, therefore, unfit for drinking or livestock watering. Free chlorine (chlorine gas dissolved in water) is toxic to fish and aquatic organisms, even in very small amounts. However, its dangers are relatively short-lived compared to the dangers of most other highly poisonous substances. If water contains a lot of decaying materials, free chlorine can combine with them to form compounds called trihalomethanes or THMs. Some THMs in high concentrations are carcinogenic to people. It is important to realize chlorine becomes more toxic as the pH level of the water drops. And it becomes even more toxic when it is combined with other toxic substances such as cyanides, phenols and ammonia. Chloride is frequently associated with sewage; it is often incorporated into assessments as an indication of possible faecal contamination or as a measure of the extent of the dispersion of sewage discharges in water bodies.
Figure 5-19: Analysis of Cl
8. Na:
All natural waters contain sodium since sodium salts are highly water soluble and it is one of the most abundant elements on earth. it is an essential element for living organisms. The symbol map reveals that the entire lake has violated values in 2008 (figure 5-20), the trend analysis shows that the data values increase form the west to the east side, which confirmed by the prediction and probability maps as both show that the eastern side has higher values than the western side, this is seems reasonable as most of the agriculture lands and industrial sewage located there.
Cl 2008
Cl 2002 Cl 2002
Cl 2008

GIS and Modelling Research Cluster 2010
Nile Basin Capacity Building Network ( NBCBN ) 81
Figure 5-20: Analysis of Na
9. So4:
The different analysis shown that the entire lake has violated values in 2008, this is due to the industrial sewage that discharge to the lake, see figure (5-21).
Figure 5-21: Analysis of So4
10. TSS:
The TSS values has non homogenous data for both 2002 and 2008, this is because the values are differ from station point to another depending upon the amount and quality of drainage water discharge to the lake. Even we cannot judge which year has higher values than another, as some values in 2008 are bigger than 2002 and others have less values than in 2002, figure (5-22).
Na 2008
So4 2008

GIS and Modelling Research Cluster 2010
Nile Basin Capacity Building Network ( NBCBN ) 82
Figure 5-22: Analysis of TSS
11. Turbidity:
The plotting maps reavaled that the Turbidity has non homogenous data for both 2002 and 2008 same as the TSS values, this is due to the significant correlation between the two factors as shown in the correlation analysis, figure (5-23). In lakes and streams, there are 3 major types of particles: algae, detritus (dead organic material), and silt (inorganic, or mineral, suspended sediment). The algae grow in the water and the detritus comes from dead algae, higher plants, fungi, etc. The pictures from the field trip revealed that there are plant and dead algae spread widely in the lake, which caused high Turbidity as could be seen in figure (5-24).
Figure 5-23: Analysis of Turbidity
Turbidity 2002
Turbidity 2008
TSS 2002 TSS 2008

GIS and Modelling Research Cluster 2010
Nile Basin Capacity Building Network ( NBCBN ) 83
Figure 5-24: Turbidity in the Lake
This can cause light penetration to be reduced significantly, which will critically influences the productivity of light dependent organisms. Since these organisms form the base of the food chain a nutrient and energy source for higher trophic levels their productivity is crucial to the structure and functioning of the wetland. Also when amount of light passing through the water is reduced, photosynthesis slows down. If light is completely blocked from bottom dwelling plants, the plants will stop producing oxygen and will die. As the plants are decomposed, bacteria will use up even more oxygen from the water. Low dissolved oxygen can lead to fish kills, also the decrease in water clarity affect the ability of fish to see and catch food. Attention should be paid as very high levels of turbidity for a short period of time may not be significant and may even be less of a problem than a lower level that persists longer. The figure below (figure 5-25) shows how aquatic organisms are generally affected (http://lakeaccess.org/russ/turbidity.htm). Turbidity also adds real costs to the treatment of surface water supplies used for drinking water since the turbidity must be virtually eliminated for effective disinfection (usually by chlorine in a variety of forms) to occur.
Figure 5-25: Impact of Turbidity on aquatic organisms

GIS and Modelling Research Cluster 2010
Nile Basin Capacity Building Network ( NBCBN ) 84
12. BOD:
BOD, is a measure of the quantity of oxygen consumed by microorganisms during the decomposition of organic matter. It is also used as an indirect measure of biodegradable organic compounds in water. The severity analysis shown that the entire lake has high values in both 2002 and 2008, this is due to the increases of wastewater coming through the drains, figure (5-26). The higher the BOD levels the lower the concentration of dissolved oxygen in a water body, and therefore there is a potential for profound effects on the water body itself, and the resident aquatic life. Also it indicates that a lot of oxygen is consumed by microorganisms for decomposing the plant that present widely in the lake.
Figure 5-26: Analysis of BOD
13. COD:
The east and south sides of the lake has higher values than in the west side for both 2002 and 2008 which indicate that the water receiving effluents mainly comes from the industry figure (5-27), also it also indicates an industrial growth in the region.
Figure 5-27: Analysis of COD
BOD 2002 BOD 2008
COD 2002
COD 2008

GIS and Modelling Research Cluster 2010
Nile Basin Capacity Building Network ( NBCBN ) 85
14. Trace metals:
The assessment of metal pollution is an important aspect of most water quality assessment programmes. The ability of a water body to support aquatic life, as well as its suitability for other uses, depends on many trace elements. Some metals, such as Mn, and Cu, when present in trace concentrations are important for the physiological functions of living tissue and regulate many biochemical processes. The same metals, however, discharged into natural waters at increased concentrations in sewage, industrial effluents or from mining operations can have severe toxicological effects on humans and the aquatic ecosystem.
The different analysis explored the state of the trace metals, the entire lake has high values for Mn, Pb, Cu, due to the industrial discharge, this is can cause serious ecological problems, also as a result of adsorption and accumulation, the concentration of metals in bottom sediments would be much higher than in the water above and this sometimes causes secondary pollution problems. . Attention should be given as the situation get worse in 2008 which indicate industrial growth in the area, figure (5-28).
Figure 5-28: Analysis of Cu
5.3 Application of ICZM on Burulus Wetland
The concept of coastal zone management (ICZM) was presented in ―Integrated Coastal and Ocean Management Concepts and Practices‖ (Cicin-Sain and Knecht, 1997) As follow ―Integrated coastal management can be defined as a constantly realized decision-making process with a view of sustainable use, development and protection of seaside terrestrial and coastal marine areas and their resources‖. It is agreed that ICZM is a continuous process with the general aim of implementing sustainable use in coastal zones and maintaining their overall diversity. More effective management aims to establish and maintain optimum sustainable levels of use, development and activity in coastal zones and, eventually, to improve the state of the coastal environment (Alan, 2003).
Mn 2008
Cu 2008
Pb 2008
Cu 2002
Cu 2008 Cu 2002

GIS and Modelling Research Cluster 2010
Nile Basin Capacity Building Network ( NBCBN ) 86
In implementing ICZM there is number of important principles that should be taking into account. According to the recommendation in UNCED1992 (agenda 21, chapter 17):
The precautionary principle. The polluter pays principle. Use of proper resource accounting. Principle of trans boundary responsibility. Principle of intergenerational equity.
The coastal zone in Egypt is defined as ―the domain of land use interface. It encompasses the territorial water and extends landward to areas of active interactions with the marine environment for at least 30 km in the desert areas, unless major topographical features interrupt this stretch, in the lower Nile delta region the terrestrial part would extend up to contour +3.0m‖. Due to increasing pressure on the coastal zone in addition to activities development in this zone, with the great impacts on the environment, the Egyptian Environmental Affairs Agency (EEAA) after passing the environmental law (no. 4/1994) had taken the responsibility to initiate a national integrated coastal zone management plan. A national committee for ICZM was established (National committee, 1996). This committee consists of sixteen members representing different ministries. The committee members are as below:
Egyptian Environmental Affairs Agency (2 members) Ministry of public work and water resources (1 member) Ministry of housing (2 member) Ministry of agriculture (1 member) Ministry of maritime transportation (1 member) Ministry of tourism (1 member) Ministry of planning (1 member) Ministry of Scientific research and technology (1 member) Ministry of defence (1 member) Ministry of local government (1 member) Ministry of electricity and energy (1 member) National water research center representative (1 member) NGO representative (2 member)
This committee has the responsibility for:
Coordination of different coastal activities between different authorities towards integrated coastal zone management through general guidelines for all activities, including environmental impact assessment.
To make sure that all land use plans and development activities in the coastal areas takes into account contingency arrangement.
To arrange between the proposed development activities and the carrying capacity of an ecosystem towards sustainable use of available resources.
To ensure the active participation in drafting and preparing an ICZM plan. To ensure efficient implementation of the commitments of Egyptian government to the
regional and international conventions concerning the protection of marine environment and coastal areas.
To approve programme and plans aiming to restore and rehabilitation of coastal ecosystem. To coordinate and specify mandates for different authorities in coastal areas. To approve national arrangements related to the protection of the environment in the
coastal area and contingency plans. To study and evaluate all major projects to be executed in the coastal zone, especially
projects which may lead to conflict of interest between ministries and other governmental bodies while reaching a final decision.
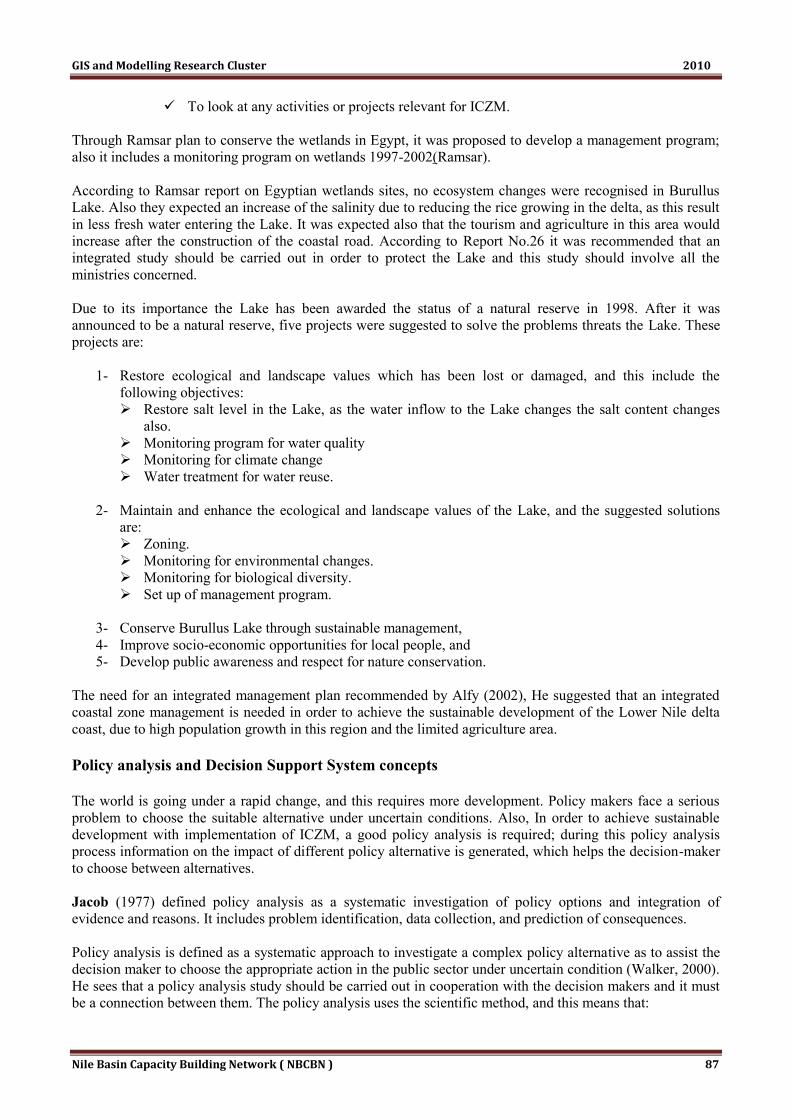
GIS and Modelling Research Cluster 2010
Nile Basin Capacity Building Network ( NBCBN ) 87
To look at any activities or projects relevant for ICZM. Through Ramsar plan to conserve the wetlands in Egypt, it was proposed to develop a management program; also it includes a monitoring program on wetlands 1997-2002(Ramsar). According to Ramsar report on Egyptian wetlands sites, no ecosystem changes were recognised in Burullus Lake. Also they expected an increase of the salinity due to reducing the rice growing in the delta, as this result in less fresh water entering the Lake. It was expected also that the tourism and agriculture in this area would increase after the construction of the coastal road. According to Report No.26 it was recommended that an integrated study should be carried out in order to protect the Lake and this study should involve all the ministries concerned. Due to its importance the Lake has been awarded the status of a natural reserve in 1998. After it was announced to be a natural reserve, five projects were suggested to solve the problems threats the Lake. These projects are:
1- Restore ecological and landscape values which has been lost or damaged, and this include the following objectives: Restore salt level in the Lake, as the water inflow to the Lake changes the salt content changes
also. Monitoring program for water quality Monitoring for climate change Water treatment for water reuse.
2- Maintain and enhance the ecological and landscape values of the Lake, and the suggested solutions
are: Zoning. Monitoring for environmental changes. Monitoring for biological diversity. Set up of management program.
3- Conserve Burullus Lake through sustainable management, 4- Improve socio-economic opportunities for local people, and 5- Develop public awareness and respect for nature conservation.
The need for an integrated management plan recommended by Alfy (2002), He suggested that an integrated coastal zone management is needed in order to achieve the sustainable development of the Lower Nile delta coast, due to high population growth in this region and the limited agriculture area. Policy analysis and Decision Support System concepts The world is going under a rapid change, and this requires more development. Policy makers face a serious problem to choose the suitable alternative under uncertain conditions. Also, In order to achieve sustainable development with implementation of ICZM, a good policy analysis is required; during this policy analysis process information on the impact of different policy alternative is generated, which helps the decision-maker to choose between alternatives. Jacob (1977) defined policy analysis as a systematic investigation of policy options and integration of evidence and reasons. It includes problem identification, data collection, and prediction of consequences. Policy analysis is defined as a systematic approach to investigate a complex policy alternative as to assist the decision maker to choose the appropriate action in the public sector under uncertain condition (Walker, 2000). He sees that a policy analysis study should be carried out in cooperation with the decision makers and it must be a connection between them. The policy analysis uses the scientific method, and this means that:

GIS and Modelling Research Cluster 2010
Nile Basin Capacity Building Network (NBCBN ) 88
The work is open and explicit, The work is objective and empirically based, Work is consistence with existing knowledge, and The result is variable and reproducible.
Policy analysis aims to provide comprehensive, balanced information and analysis to all sides of policy issues rather than by advancing the ideas of a single decision (Guide 2002). Policy analysis process uses framework for analysis approach, which analyses the problem, then study the different solutions. Also it is iterative process. The policy analyses framework consists of three main parts Helms (2002), which are:
1. Problem analysis Problem identification Goal analysis
2. Assessing and selecting option Criteria Scenarios Strategy
Case is developed after that through combination between strategy and scenario. 3. Supporting and evaluate the different policies
Communication Evidence Convey intent Monitor and evaluate
Diwedar, 2005 in his master study applied the following policy analysis framework, which is presented in this research consisting of different steps as follows:
Problem analysis, Developing Possible alternatives, Objective and criteria, Scenarios, Policy options (Strategies), Cases (compare influence of different scenarios on different strategies), and Evaluation.
Using a computer based tool in the decision-making process is strongly recommended, because it enables the decision maker to better observe the result of any action taken on the hole system and this results in better decisions. The first decision support system (DSS) has emerged in early 1960‘ and by late 1980‘s it became more complete, understood and implementation had taken place. This was executive information system (EIS), which used for companies for easy communication. There is two type of DSS, one is for the network communication like EIS, the other one is the desktop DSS, which to be used by one user only. According to Engelen (1993), DSS consists of three components, which are: user interface, database, and tool base with different analytical and mathematical methods. (DSS) are computer-based information systems developed to assist decision makers to find answers for problems that, due to their specific nature and complexity lack an explicit solution method. DSS is a class of information systems, which supports decision-making activities. It was seen as a computer-based system to help the decision maker use communication technology, data, documents, knowledge and model to improve decision-making process.

GIS and Modelling Research Cluster 2010
Nile Basin Capacity Building Network (NBCBN ) 89
Cross impact model (ICMAM) as a DSS tool has been identified as an important tool to achieve the objectives of Conservation on biological diversity (CBD), which are conservation of biodiversity, the sustainable use of biodiversity‘s components and equitable sharing of benefits arising out of the utilization of genetic resources (Sadacharan, Van der Valk, Harkes, 2001). This case study represents the use of ICMAM model in developing a managing plan for the different activities of Lake Burullus through the different scenarios. Main activities From the data analysed above, we can conclude that the main activities in the Burullus wetland area are:
Fishery, Agriculture, and Aquaculture.
Main problems According to Diwedar, 2005 the Lake suffers from some problems, as discussed below:
1. Conflict in land use: The land area around the Lake is used for three main activities. First activity is agriculture, which forms an important source of income for the region. Second activity is fish farm. Big part of agriculture land has been converted to fish farms due to high return of fish farms and poor land quality. Third activity is using the land for public services and housing. The main problem is the rapid increasing of fish farm activity. Also an important issue in Lake is land reclamation of the Lake itself in order to increase the available land for all activities; agriculture, fish farm, and reclamation project. This results in decreasing Lake area, impact on its aquatic system, and reduction of its importance as a wetland area and an important breeding area for many migration birds. 2. Water pollution The Egyptian drainage system in the Nile Delta ends into the northern Lakes then to the sea. As a result Burullus Lake receives a huge amount of drainage water that forms the main fresh water source of the Lake. This drainage water is mixed with sewerage waste and industrial waste from all districts around the Lake, also from Middle Delta cities. Consequently, Burullus Lake water quality declined significantly. . 3. Excess fishery/over fishing
Burullus Lake is considered an important source of fish production for the Egyptian market. There is an excess fishing activity, consequently the government is trying to face this by laws to manage number of boats, and fish production of the Lake. This excess fishing activity threats the Lake ecosystem and may cause degradation of fishing resources. Another problem is bird hunting which result in reducing water birds species in the Lake, consequently a negative impact on the Lake wetlands importance. Developing of Managing Strategies This part discusses the development of different managing strategies and the analyses of the different alternatives to formulate the strategic plan using two models. The first model is the rapid appraisal model, which assists to set up a system analysis and policy analysis in a qualitative way. The second model is the cross impact model, which uses the system set-up of the rapid appraisal model to come to a quantitative approach of the system. Cross impact model is considered as a decision support system.

GIS and Modelling Research Cluster 2010
Nile Basin Capacity Building Network (NBCBN ) 90
Through the System analysis Model the problem is identified, the main components of the system (main activities in the study area) are defined. After that the relation between these activities are determined through survey and literature. Consequently after identifying the main components and the general relations between them, these components are defined by variables and with defining the direct relation between them. For example fishery is identified by fish production, Fish revenue, Number of fishermen, Number of boats and Income per fisherman per month. This step is repeated for all activities. After that the criteria is selected to measure the system performance under the different strategies and scenarios. The chosen criteria are: are selected as below: 1. Economy Fish production Fish revenue Agriculture production Agriculture revenue Agriculture land Fish farm production Fish farm revenue Fish farm land Fish manufacturing industry Ship yard industry Number of tourist
2. Society Number of fishermen Number of farmer Number of worker in fish farm Health index Population Income/fishermen Income/farmer Income/worker Income/year/region
3. Environment Water quality (BOD) Water quality (COD) Water quality (TSS) Water discharge Water Salinity Lake area Fish species (number of species) Water bird species (number of species)
Policy interventions that could be implemented to obtain the sustainable management of the lake burullus are represented through three strategies including different measures are represented below
1. Restore ecological values Sewerage treatment Industrial waste treatment Water quality program and treatment for irrigation waste water Natural salinity gradient restoration Dredging the inlet
2. Manage of Lake ecosystem Management of Lake fishery

GIS and Modelling Research Cluster 2010
Nile Basin Capacity Building Network (NBCBN ) 91
Prohibit land reclamation Prohibit bird hunting Increase awareness among citizen.
3. Improve socio-economic level of local people Develop in industry. Cultivate the available land Enhance the services around the Lake. Development the eco-system tourism Fish farm projects
Two main scenarios are set; the expected Impacts of these variables on the system must be indicated as shown below:
1. Optimistic scenario; in this scenario the population growth is expected to be low while high economic growth is the expected case for the different activities.
2. Pessimistic scenario; high population growth is expected, while low economic growth is expected for the different activities.
Based on the above scenarios, five cases are analysed, which are:
1. Optimistic scenario and manage the Lake ecosystem. 2. Pessimistic scenario and improve socio-economic level. 3. Pessimistic scenario and manage the Lake ecosystem. 4. Optimistic scenario and restore ecological values. 5. Pessimistic scenario and restore ecological values.
The cross impact analysis is a decision support system that aims to enhance the manager‘s ability in solving decision-making process problems and capture better decision. The rapid appraisal model was used first in order to build the system relation and analysis the different policies by qualitative way. Decision-maker needs to know by quantitative way what are the impacts of different alternatives on the different set of system variables, this is the role of the cross impact model. It predicts what will happen with time and according to the results, decision makers can choose among the different alternatives. It uses the same system build above and the problem is structured through a matrix, this matrix represents the relation between different attributes, and this is the main element of the cross impact model.
Development of attributes matrix:
This is the main step in developing the cross impact model. Relation between attributes is determined through symmetric matrix. This matrix according to model equation represents the net impact of variables in the row of the matrixes on the variables in the column of the matrix. A value between 0 to 1 represents the relation between the attributes as illustrated in Table (5-15).
Table 5-15: Relation index
Trend Nature of relationship Value
+++++ - - - - -
Absolute 1
++++ - - - -
Very high 0.8
+++ - - -
High 0.6
++ - -
Moderate 0.4
+ -
Mild 0.2
0 No impact 0

GIS and Modelling Research Cluster 2010
Nile Basin Capacity Building Network (NBCBN ) 92
These attributes are measurable indication; data collected represents the initial values of these attributes. Two matrixes are generated as a result of simulation, one of these matrixes represents the negative impact while the other one represents the positive impacts. Relation between suggested measures and attributes is formulated in another matrix. This is to connect any action that can take place to the system and illustrate its impact.
Model validation
This step is the baseline for the model, as seen in figure (5-29). This step forms the prototype model, which describes the present state of the system. Neither scenario nor strategy is accounted in model verification.
Figure 5-29: Model validation
Strategies Impacts
This section discusses the simulation results of the model. First the impact of different strategies on the different attributes is discussed, followed by discussing the impact of the different scenarios on the suggested strategies (case). Strategies impacts: From suggested strategies analysis, it was found that improving the socio-economic level of the local people strategy has almost positive to very positive impact from the economic and social point of view while it has clear negative impact from environmental point of view. On the other hand restore the ecological values strategy has a balanced impacts from economic, social, and environmental point of view, and its impact on the system varying from nothing to positive impacts. On the contrary managing the Lake eco-system strategy has clear positive impact from environmental point of view, while an impact varying between positive to negative from both economical and social point of view. Scenarios impact on strategies: Based on the generated system of the lake and its components and variables, the impact of the suggested strategies and the different scenarios on the lake statues were predicted on the long run as discussed below.
0.00
0.10
0.20
0.30
0.40
0.50
0.60
0.70
0.80
0.90
1.00
1 2 3 4 5 6 7 8 9 10 11 12 13 14 15 16 17 18 19 20 21 22 23 24 25
Frac
tion
of M
ax. v
alue
Years
Eco-bird species
Eco-fish species
Eco-lagoon area
Pol-BOD
Pol-Cod
Pol-TSS
Water salinity
Water Discharge
Fis-fish production
Fis-number of boats
Fis-number of fishermen
fis- income / fisherman
Ind-development in industryFis farm-available land
Fis farm production
Fis farm worker
fish farm income/worker
Tou-number of tourist
Agr-land area
Agr-number of farmer
Agr-production
agr- income/farmer

GIS and Modelling Research Cluster 2010
Nile Basin Capacity Building Network (NBCBN ) 93
Case 1: Optimistic scenario and manage of the Lake eco-system. Optimistic scenario has almost
positive impact on this strategy from economic and social point of view, while it has negative impact from environmental point of view as in figure (5-30).
Figure 5-30: Case 1
Case 2: Optimistic scenario and restore ecological values. Impact of optimistic scenario on restore ecological values strategy is positive impact from economic and social point of view but less than cas1, while the impact from environmental point of view is varying from positive to negative impact. See figure (5-31).
Figure 5-31: Case 2
0.00
0.10
0.20
0.30
0.40
0.50
0.60
0.70
0.80
0.90
1.00
1 2 3 4 5 6 7 8 9 10 11 12 13 14 15 16 17 18 19 20 21 22 23 24 25
Frac
tion
of M
ax. v
alue
Years
Eco-bird species
Eco-fish species
Eco-lagoon area
Pol-BOD
Pol-Cod
Pol-TSS
Water salinity
Water Discharge
Fis-fish production
Fis-number of boats
Fis-number of fishermen
fis- income / fisherman
Ind-development in industryFis farm-available land
Fis farm production
Fis farm worker
fish farm income/worker
Tou-number of tourist
Agr-land area
Agr-number of farmer
Agr-production
agr- income/farmer
0.00
0.10
0.20
0.30
0.40
0.50
0.60
0.70
0.80
0.90
1.00
1 2 3 4 5 6 7 8 9 10 11 12 13 14 15 16 17 18 19 20 21 22 23 24 25
Frac
tion
of M
ax. v
alue
Years
Eco-bird species
Eco-fish species
Eco-lagoon area
Pol-BOD
Pol-Cod
Pol-TSS
Water salinity
Water Discharge
Fis-fish production
Fis-number of boats
Fis-number of fishermen
fis- income / fisherman
Ind-development in industryFis farm-available land
Fis farm production
Fis farm worker
fish farm income/worker
Tou-number of tourist
Agr-land area
Agr-number of farmer
Agr-production

GIS and Modelling Research Cluster 2010
Nile Basin Capacity Building Network (NBCBN ) 94
Case 3: Optimistic scenario and improve the socio-economic level of the local people. The impact in this case is almost the same as case 2, but it has less positive impact from economic and social point of view, and an impact varying from positive to negative from environmental point of view, see figure (5-32).
Figure 5-32: Case 3
Case 4: Pessimistic scenario and manage the Lake eco-system. The impact of the pessimistic scenario on managing the Lake strategy is positive on all economic and social parameter except fish production, but it has negative impact from environmental point of view, see figure (5-33).
Figure 5-33: Case 4
Case 5: Pessimistic scenario and restore ecological values. Pessimistic scenario has almost the same impact like case 4 from economic and social point of view, but it has less negative influences from environmental point of view as in figure (5-34).
0.00
0.10
0.20
0.30
0.40
0.50
0.60
0.70
0.80
0.90
1.00
1 2 3 4 5 6 7 8 9 10 11 12 13 14 15 16 17 18 19 20 21 22 23 24 25
Frac
tion
of M
ax. v
alue
Years
Eco-bird species
Eco-fish species
Eco-lagoon area
Pol-BOD
Pol-Cod
Pol-TSS
Water salinity
Water Discharge
Fis-fish production
Fis-number of boats
Fis-number of fishermen
fis- income / fisherman
Ind-development in industryFis farm-available land
Fis farm production
Fis farm worker
fish farm income/worker
Tou-number of tourist
Agr-land area
Agr-number of farmer
Agr-production
agr- income/farmer
0.00
0.10
0.20
0.30
0.40
0.50
0.60
0.70
0.80
0.90
1.00
1 2 3 4 5 6 7 8 9 10 11 12 13 14 15 16 17 18 19 20 21 22 23 24 25
Frac
tion
of M
ax. v
alue
Years
Eco-bird species
Eco-fish species
Eco-lagoon area
Pol-BOD
Pol-Cod
Pol-TSS
Water salinity
Water Discharge
Fis-fish production
Fis-number of boats
Fis-number of fishermen
fis- income / fisherman
Ind-development in industryFis farm-available land
Fis farm production
Fis farm worker
fish farm income/worker
Tou-number of tourist
Agr-land area
Agr-number of farmer
Agr-production
agr- income/farmer

GIS and Modelling Research Cluster 2010
Nile Basin Capacity Building Network (NBCBN ) 95
Figure 5-34: Case 5
Case 6: Pessimistic scenario and improve socio-economic level of local people. The impact on this strategy is the same like the two past cases from economic and social point of view, but it has almost the same or less negative impact from environmental point of view, see figure (5-35)
Figure 5-35: Case 6
Results & Recommendations of ICZM The analysis of managing the Lake eco-system strategy under optimistic scenario shows that only prohibit bird hunting, prohibit land reclamation, and increase awareness have pure positive impact, while other variables have an impact varying from positive to negative. Also the same results was found for manage of the Lake eco-system under pessimistic scenario, with different impact values.
0.00
0.10
0.20
0.30
0.40
0.50
0.60
0.70
0.80
0.90
1.00
1 2 3 4 5 6 7 8 9 10 11 12 13 14 15 16 17 18 19 20 21 22 23 24 25
Frac
tion
of M
ax. v
alue
Years
Eco-bird species
Eco-fish species
Eco-lagoon area
Pol-BOD
Pol-Cod
Pol-TSS
Water salinity
Water Discharge
Fis-fish production
Fis-number of boats
Fis-number of fishermen
fis- income / fisherman
Ind-development in industryFis farm-available land
Fis farm production
Fis farm worker
fish farm income/worker
Tou-number of tourist
Agr-land area
Agr-number of farmer
Agr-production
agr- income/farmer

GIS and Modelling Research Cluster 2010
Nile Basin Capacity Building Network (NBCBN ) 96
Analysis of improving the socio-economic level of local people under pessimistic scenario shows that all variables have impact varying between positive to negative. Analysis of restoring the ecological values under optimistic shows that only sewerage, industrial, drainage water treatment and dredging the Lake have pure positive impacts and natural salinity restoration has negative impact, while others have negative to positive impacts. The same was recognised under pessimistic scenario with different impact values. Evaluation of different cases showed that to restore ecological values strategy performed well under both the optimistic and pessimistic scenario. Under optimistic scenario it has the highest positive impact on the different variables, while it has the least negative impact especially from environmental point of view, its impact is varying between negative to positive while others have mainly negative impacts from environmental point of view. Under pessimistic scenario this strategy also has the highest positive impacts or the same like others, while it has the least negative impact from environmental point of view, its impact is varying from negative to positive, while others have mainly negative from environmental point of view. As a conclusion restoring ecological values strategy has almost highest positive impacts and less negative impact on the Lake Burullus and its watershad area. Therefore, the actions below are recommended to sustain the lake and its area and to protect its biodiversity:
1. Restoring ecological values strategy is highly recommended in order to reach the sustainable
development of the Lake. 2. A monitoring program is recommended with the following objective:
Water treatment of the point source of pollution and introducing new treatment measures such as, aeration, wetlands, planting, and bio film.
To control the drainage water discharge to balance the salinity level in the Lake. A water quality program for drainage water is necessary to control the inflow water quality.
3. Enforcing legal framework for land reclamation, and bird hunting is highly recommended. 4. Enforcing legal framework for fishery, and fish farm is highly recommended to:
Manage fishing activity and conserve the Lake eco-system. Control fish farm developments.
Case Study- Uganda
5.2 Nakivubo Wetlands (Degradation Impacts On The Water Quality And Drinking Water Treatment)
Introduction
The Uganda natural wetlands cover about 13% of the land surface area (Kansiime and Nalubega, 1999; Huising, 2000). These wetlands provide a wide variety of biophysical and socio-economic functions to the surrounding environment and to the well-being of the million of people (Howard, 1999). For instance, they provide raw materials for construction, crafts, furniture, and as well as serves as grounds for hunting, fishing, grazing cattle and growing crops. However, in spite of these benefits associated to the wetlands, generally, wetlands in Uganda are regarded as "wastelands". As consequent, approximately 7% of the wetlands in
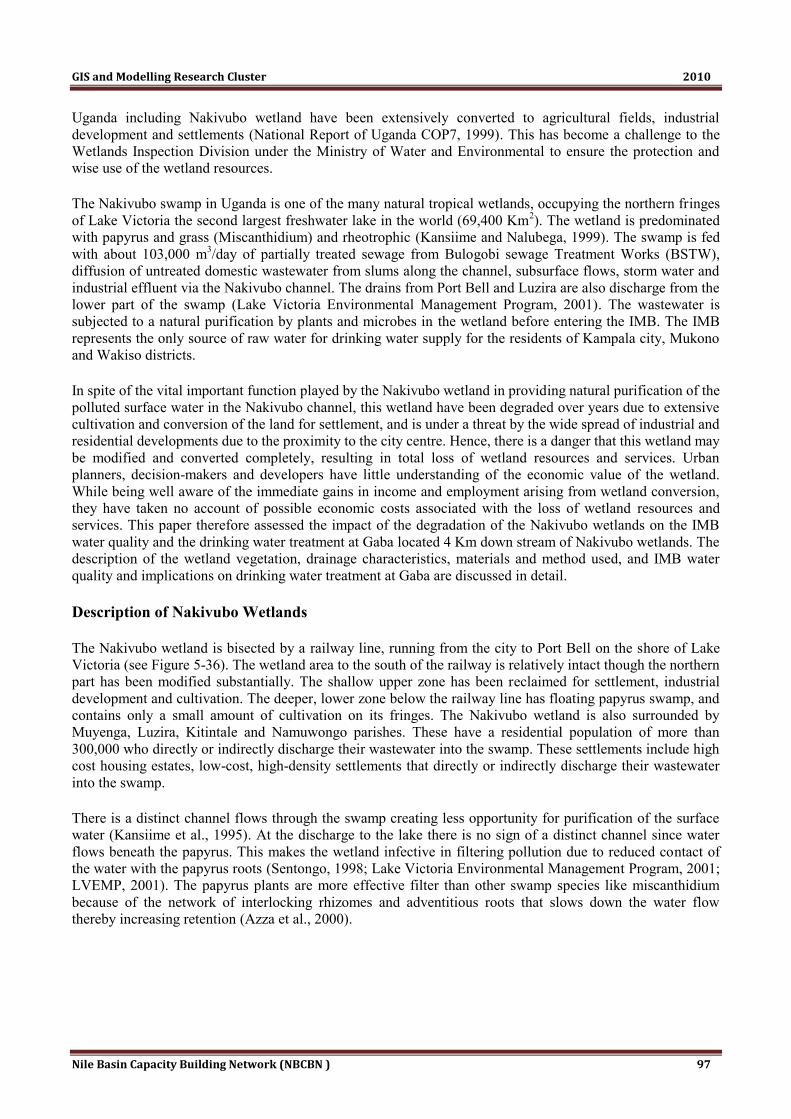
GIS and Modelling Research Cluster 2010
Nile Basin Capacity Building Network (NBCBN ) 97
Uganda including Nakivubo wetland have been extensively converted to agricultural fields, industrial development and settlements (National Report of Uganda COP7, 1999). This has become a challenge to the Wetlands Inspection Division under the Ministry of Water and Environmental to ensure the protection and wise use of the wetland resources.
The Nakivubo swamp in Uganda is one of the many natural tropical wetlands, occupying the northern fringes of Lake Victoria the second largest freshwater lake in the world (69,400 Km2). The wetland is predominated with papyrus and grass (Miscanthidium) and rheotrophic (Kansiime and Nalubega, 1999). The swamp is fed with about 103,000 m3/day of partially treated sewage from Bulogobi sewage Treatment Works (BSTW), diffusion of untreated domestic wastewater from slums along the channel, subsurface flows, storm water and industrial effluent via the Nakivubo channel. The drains from Port Bell and Luzira are also discharge from the lower part of the swamp (Lake Victoria Environmental Management Program, 2001). The wastewater is subjected to a natural purification by plants and microbes in the wetland before entering the IMB. The IMB represents the only source of raw water for drinking water supply for the residents of Kampala city, Mukono and Wakiso districts.
In spite of the vital important function played by the Nakivubo wetland in providing natural purification of the polluted surface water in the Nakivubo channel, this wetland have been degraded over years due to extensive cultivation and conversion of the land for settlement, and is under a threat by the wide spread of industrial and residential developments due to the proximity to the city centre. Hence, there is a danger that this wetland may be modified and converted completely, resulting in total loss of wetland resources and services. Urban planners, decision-makers and developers have little understanding of the economic value of the wetland. While being well aware of the immediate gains in income and employment arising from wetland conversion, they have taken no account of possible economic costs associated with the loss of wetland resources and services. This paper therefore assessed the impact of the degradation of the Nakivubo wetlands on the IMB water quality and the drinking water treatment at Gaba located 4 Km down stream of Nakivubo wetlands. The description of the wetland vegetation, drainage characteristics, materials and method used, and IMB water quality and implications on drinking water treatment at Gaba are discussed in detail.
Description of Nakivubo Wetlands
The Nakivubo wetland is bisected by a railway line, running from the city to Port Bell on the shore of Lake Victoria (see Figure 5-36). The wetland area to the south of the railway is relatively intact though the northern part has been modified substantially. The shallow upper zone has been reclaimed for settlement, industrial development and cultivation. The deeper, lower zone below the railway line has floating papyrus swamp, and contains only a small amount of cultivation on its fringes. The Nakivubo wetland is also surrounded by Muyenga, Luzira, Kitintale and Namuwongo parishes. These have a residential population of more than 300,000 who directly or indirectly discharge their wastewater into the swamp. These settlements include high cost housing estates, low-cost, high-density settlements that directly or indirectly discharge their wastewater into the swamp.
There is a distinct channel flows through the swamp creating less opportunity for purification of the surface water (Kansiime et al., 1995). At the discharge to the lake there is no sign of a distinct channel since water flows beneath the papyrus. This makes the wetland infective in filtering pollution due to reduced contact of the water with the papyrus roots (Sentongo, 1998; Lake Victoria Environmental Management Program, 2001; LVEMP, 2001). The papyrus plants are more effective filter than other swamp species like miscanthidium because of the network of interlocking rhizomes and adventitious roots that slows down the water flow thereby increasing retention (Azza et al., 2000).

GIS and Modelling Research Cluster 2010
Nile Basin Capacity Building Network (NBCBN ) 98
Figure 5-36: Upstream developments and encroachment of Nakivubo wetland
The catchment area into the lower Nakivubo swamp is 1.1 Km2 from Luzira watershed, 2.5 Km2 for the Bukasa watershed and about 50 Km2 from the city centre via the Nakivobo channel and the upper Nakivubo swamp. The drains from the swamp flow into the Inner Murchison Bay, upstream of the drinking water supply station located at Gaba.
The Inner Murchison Bay is small water body with limited volume of (113 x106 m3). It is semi enclosed basin off the main part of Lake Victoria. The total catchment area of the bay is about 279 Km2 of which 52 Km2 is fringing swamps. The bay-city interaction is fundamental for the health and well being of Kampala‘s population.
Vegetation structure of Nakivubo wetland
Over the years, the Nakivubo swamp vegetation has been greatly modified by cultivation and settlement replacing about 60% of the natural wetland (see Figure 5-37). The areas surrounding Nakivubo, and the wetland itself, are regarded as prime sites for urban expansion due to their proximity to the city centre and industrial district, as a result of land shortage in higher areas of Kampala and because land prices are relatively cheap as compared to other parts of the municipality. The wetland has been encroached upon by settlement and industry, and small-scale cultivation on its fertile fringes has expanded. The Upper wetland is dominated by Vossia cuspidate on the North-Eastern. Sugarcanes and yam are cultivated on the South-Western. Small patches of floating mats of Cyperus papyrus L are also localized in the Upper portion. Cyperus papyrus, palm trees and typha plants are visible on the East.
The Lower Nakivubo swamp is dominated by yam on the upper portion, but relatively interspersed with Vossia cuspidate. The Cyperus papyrus is on the lower portion of the shore of the IMB interspersed with Phragmites mauritanus, Miscanthidium violaceum, Robyns and climbers. The Phragmites mauritanus are visible on the wetland fringes. The open water areas of the Nakivubo swamp are covered by community of floating Eichhornia, crassipes, cyperus, mundtii (Nees) and Kunth (Kansiime and Nalubega, 1999).
Figure 5-37: Settlements on the fringes of the Nakivubo wetlands

GIS and Modelling Research Cluster 2010
Nile Basin Capacity Building Network (NBCBN ) 99
Point and diffuse sources in Nakivubo wetlands
Point sources are discrete in origins and flows into a system via specific outlets. Such sources include drains, outfalls from sewage treatment plants and industrial effluent discharge points. The point sources flowing into the Nakivubo wetlands via the Nakivubo channel include industries such as House of Eden, Sameer agriculture, Shell Uganda, Phenix logistics, Mukwano industries, Meat packers, Top cuts and Uganda Baati, and the sewerage treatment plant.
The non point sources enter the aquatic ecosystem via several pathways that include urban runoff, atmospheric deposition, and seepage from groundwater (ARMS, 1994). The non-point sources come from the settlement along the channels and the wetland fringes including the surface run off in the city centre (see Figure 5-38).
Figure 5-38: Diffuse pollution from settlement along the channel
Wetland functions and values
The Nakivubu wetland provides vital functions and values to the communities living along wetland fringes, and as well as providing the function of purifying the polluted surface water before discharge into the Lake Victoria at the IMB. The wetland ecosystems adsorb metal ions and retain sediments stabilizing these components. The swamp plants such as macrophytes, cyperus papyrus, typha, spies and phragmites have high biomass productivity and are largely responsible for the water retention properties of wetland. The sponge nature and filtering capacity of macrophytes stabilizes water availability, flood attenuation and supply water. Listed below are some of the selected Nakivubo wetland plants of ecological and economic values.
Cyperus papyrus
This is the largest plant in the sedge family Cyperaceous. It is the most prolific emergent macrophytes in Nakivubo wetland (Azza et al., 2000). The papyrus is a perennial plant composed of roots, rhizome, umbel and culm that grows approximately 5-9 m. The emergent plants obtain nutrients from the sediment while the floating plants obtain nutrients from the water (Kansiime et al., 1993). The papyrus plant is tolerant to periodic inundation and have a high potential sink for nutrients (Kansiime et al., 2005). The papyrus is used by the communities for making mats, baskets and thatching roof. The papyrus also provides the function of natural purifying the polluted surface water in Nakivubo channel as discussed earlier. Papyrus is instrumental in the fixing of nutrients (Huising, 2000). The Nakivubo wetland treats wastewaters which do not pass through the sewage treatment plant and the partially treated sewage effluent from the sewage plant (Emerton et al., 1999).

GIS and Modelling Research Cluster 2010
Nile Basin Capacity Building Network (NBCBN ) 100
Commelina Africana
belong to the family of commelinaceae and is widely distributed in Uganda (Katende et al., 1999). The plant is herbaceous growing in sunny places with creeping stems along the ground and some erect branches. In Eastern Uganda, the Japadhola and Teso communities cook the herbs is cooked with simsim or groundnuts paste. The leaves are used for feeding rabbits, cattle and pigs.
Commelina benghalensis
This plant also belongs to commelinaceae and is widely distributed in Uganda and Nakivubo inclusive. It has long creeping succulent stem and ascending jointed branches and fibrous rooting where nodes touches the ground. The leaves can be boiled or mixed with beans or peas, and simsim or ground nuts. It is used in cultural cleansing rituals in Madi communities in Northern Uganda. The plant is used in eye element, sore throat and burn treatment (Katende et al., 1999).
Colocasia asculenta (L) schot
It belongs to the family of Araceae originated from East Asia. It is a robust herbaceous plant, with leaves up to 1-2 m tall, underground starch stem reduced to a tuber (Purseglove, 1972). It is cultivated in tropical rain forest with annual rainfall of 2500 mm or swampy places.
Cynodon dactylon L
This belong to the family graminea that are ubiquitous cosmopolitan weed but variable in the wild. The grass is rhizomatous or stoloniferous sward-forming perennial (Ibrahin and Kabuye, 1987; Lowe, 1989). The grass is used as lawns grass, grazing grass or hay livestock.
Sugarcane (saccharum L)
This is a genus of 6-37 species of tall course growing woody, perennial grasses, cultivated in tropical and sub-tropical regions with minimum annual moisture of 60 0mm. They have stout, jointed, fibrous stalks that are rich in sugar and measure 2-6 m tall that grow in clumps of solid stalks. The grass is planted vegetative and a stand of cane can be harvested 2-10 times. Sugarcane is used to produce product such as sugar, molasses, alcohol and biogas.
The ecological and health risks The disposal of wastewater and industrial effluents into the wetlands or water systems are potential sources of elevated heavy metal concentrations in urban wetland ecosystem (Nyangababo et al., 2005a). The Nakivubo channel contributes a very significant organic pollution load from solid waste, wastewater discharge from many slums that receives much untreated domestic (Kizito, 1986; Sentongo, 1998; Lake Victoria Environmental Management Program, 2001; LVEMP, 2001), silt (Matagi, 1998) and heavy metals (Nyangababo et al., 2005a). Along the Nakivubo channel zinc, copper and chromium have been detected in water (Kyambadde et al., 2004) implying the wetland is loaded with heavy metals. This is evident with the changes in vegetation structure of Nakivubo wetlands. Material and Methods Study area
Shown in Figure (5-39) is the map of Nakivubo swamp and its major inflows in Kampala city with respect to the IMB open water. The lies about 5 Km South-East of Kampala (COWI/VKI, 1998) in Nakawa division,

GIS and Modelling Research Cluster 2010
Nile Basin Capacity Building Network (NBCBN ) 101
bordered by Luzira and Butabika in the Eastern and Western, and Bugolobi in the North (Kansiime and Nalubega, 1999). The swamp is situated between latitudes 00o 17‘ and 00o 19‘N, and longitudes 32o 37‘and 32o 39‘E at an altitude of 1135m above mean sea level. The climate is tropical due to high altitude, proximity to Lake Victoria and long distance from the sea (Matagi, 2002). The temperature is warm and ranges form 23oC to 32oC, and, characterized by a bi-modal annual rainfall pattern of about 1260 mm (Campbell, 2001). The wetland covers a surface area of 5.29 km2 and is fed by the Nakivubo channel and its tributaries the Katunga, Kitante, Lugogo and Nakulabye. The total area draining into the swamp is about 50 Km2 (Kansiime and Nalubega, 1999).
Figure 5-39: Location map of Nakivubo wetland, its major inflows and Inner Murchison Bay
Sampling and Analysis
Established points in the bay and channel used to assess the impact of the degradation of the wetlands on the IMB water quality and drinking water treatment at Gaba. Samples were picked from the established points (M1, M2….M23 shown in Fig. 5-39). Within the IMB, the depth of sampling point was put into consideration with samples being picked from surface, middle and bottom of the same point. The samples were picked using a Van Don deep sampler.
The samples were analyzed at the National Water and Sewerage Corporation (NWSC) laboratory using standard procedure. Parameters such as transparency, electrical conductivity (EC), dissolved oxygen (DO), pH and temperature were measured on-site. The total nitrogen (TN), total phosphorus (TP), total suspended solids (TSS), chemical oxygen demand (COD) and biological oxygen demand (BOD) were measured in the laboratory.
The average water quality data for the Nakivubo Channel and the points along the red line (M1, M9, M19 and M23) within the bay were used to assess the variation of the water quality from the point of the Nakivubo Channel inlet to open water body (M23).
Results and Discussions
Generally the degradation of the Nakivubo wetland has negatively impacted on the IMB water quality and the drinking water treatment at Gaba as discussed in the proceeding subsections.
Nakivubo Channel water quality

GIS and Modelling Research Cluster 2010
Nile Basin Capacity Building Network (NBCBN ) 102
From the water samples data analysed over the years, the surface water in Nakivubo Channel is grossly polluted. This is attributed to the discharge of untreated and partially treated wastewater and solid waste (about 74% readily biodegradable organic)(Kampala City Council, 2006). The water quality trends of the surface water in the Nakivubo Channel at the rail way culverts from 1999 to 2008 with respect to BOD, TSS and COD are displayed in Figure (5-40) Figure (5-41) showed the plots for the same parameters but at the discharge inside the bay.
Figure 5-40: Surface water quality of Nakivubo channel at the rail culvert
Figure5- 41: Water quality of Nakivubo channel at the inlet to IMB
From 1999 to 2009, the BOD, COD and TSS concentrations in the Nakivubo Channel surface water showed a gradual increased. A rapid increased occurred in 2005 due to the widening and cementing of the upper section of the Nakvubo Channel with the view of quickly carrying flood water away from the city to prevent local flood. This increased flow acted like flushing system pushing the organic matter that settled within the wetlands. This also indicated that the retention with the wetland have been reduced due to the decreased in wetlands vegetation. This decreased retention time in the channel affected the self purification capacity of the surface water within the channel. Thus, an increased in organic load discharged by the channel into the IMB. Also the resuspension of settled particles into the water column along the channel explained the increased concentrations of these pollutants. The decreased concentration from 2007 to 2008 at the railway culvert is attributed to the growth of weeds and sedimentation of particles along the channel. This subsequently, reduced the BOD, COD and TSS levels in the water column. The decreased in pollutants levels in the water column also explains the lack of routine maintenance of the drainage by the city authority. The plot also demonstrated a seasonal variation of the water quality in the channel. In rainy season the observed concentrations are low owing to dilution of the channel water with rain water.
The observed concentrations over the years in the Nakivubo channel are higher than the recommended effluent discharge standard by the National Environment Management Authority (NEMA)(National Environmental Management Authority, 1999). These high concentrations showed an increased discharge of partially treated and untreated sewage and organic solid waste dumped into the storm water drains.
The BOD level in the channel is over 5mg/l, indicating serious pollution of the surface water in the channel. The high BOD can result in low dissolved oxygen (DO) level in the water, and can subsequently, result in anaerobic condition producing ammonia and hydrogen sulphide. High level of ammonia or hydrogen sulphide in water can kill fish. Additionally, the high organic loads in Nakivubo channel showed that the self-purification capacity of the Nakivubo channel is greatly impaired by the numerous point and non-point pollution sources. The polluted water in the drains partly stagnates and hence has a synergistic impact on the quality of the shallow groundwater sources (Niwagaba, 2002).
IMB water quality
The polluted surface water discharged into the IMB has impacted negatively on the water quality within the bay. Fig. 5-42 showed the plots for the average BOD, TP, EC and ammonium concentrations in the water
0
20
40
60
80
100
120
140
160
1999 2000 2001 2002 2003 2004 2005 2006 2007 2008
Years
Co
nce
ntr
ati
on
s (m
g/
l)
BOD5 Total COD Total Suspended Solids (TSS)
0
100
200
300
400
500
600
1999 2000 2001 2002 2003 2004 2005 2006 2007 2008
Years
Co
nce
ntr
ati
on
(m
g/
l)
TSS (mg/l) BOD (mg/l) COD (mg/l)

GIS and Modelling Research Cluster 2010
Nile Basin Capacity Building Network (NBCBN ) 103
column as the water flows from the inlet of Nakivubo Channel (M1) via the raw water abstraction point (M19) to the outer bay (M23).
Figure 5-42: Water quality within the Inner Murchison Bay along the points M1, M5, M9, M11, M16, M18, M22, M23
The plots showed poor water quality at the inlet of the channel and improving as you move towards the outer bay. The poor quality at the inlet point is explained by the increased organic loads via the channel. At the Nakivubo discharge point, the BOD is above 3.5 mg/l showing moderately polluted water with respect to organic loading. The decrease in concentrations for BOD, COD, TN and TP towards the outer bay indicates that the water is getting cleaner (BOD value below 2.0 mg/l). High level of organic matter in water can result in a depletion of oxygen from the aquatic system through chemical or biological oxygen consumption. Exposure to low DO level below 6 mg/l may not directly kill an organism, but will increase its susceptibility to other environmental stresses. Exposure to DO concentration below 2 mg/l for one to four days may kill most of the biota in a system (Straskraba and Tundisi, 1999). If all oxygen is depleted, aerobic decomposition ceases and organic process is accomplished through anaerobic reactions. Anaerobic microbes obtain energy from oxygen bound to other molecules like sulphate and can result in the mobilization of insoluble compounds. The breakdown of sulphate compound will often impart a "rotten-egg" smell to the water, affecting its aesthetic value and preventing recreational use.
The pH values observed in the bay ranges from 6.6 to 8.4. The pH values varies due to the diel changes in photosynthetic rates (Williams, 1998). A low pH value may allow the release of toxic metals that would otherwise be absorbed to sediment to become liberated into the water column. Once mobilized, these metals are available for uptake by organisms. Metal uptake can cause extreme physiological damage to aquatic life (Nyangababo et al., 2005b). Aluminium concentrations of 0.1 - 0.3 mg/l will increase mortality, retard growth and egg production of fish. Even if the aluminium availability is low, acidity alone may cause mortality in developing brook trout.
0
0.5
1
1.5
2
2.5
3
3.5
M1
M5
M9
M11
M16
M18
M22
M23
Monitoring points
BO
D (
mg
/l)
0
0.5
1
1.5
2
2.5
3
M1
M5
M9
M11
M16
M18
M22
M23
Monitoring points
TP
(m
g/l
)
0
50
100
150
200
250
300
350
M1
M5
M9
M11
M16
M18
M22
M23
Monitoring points
Ele
ctr
ical C
on
du
cti
vit
y (
uS
/cm
)
0
1
2
3
4
5
6
M1
M5
M9
M11
M16
M18
M22
M23
Monitoring points
Am
mo
niu
m (
mg
/l)

GIS and Modelling Research Cluster 2010
Nile Basin Capacity Building Network (NBCBN ) 104
The phosphorus concentrations in all the points except M23 in the outer bay were above the recommended maximum level for surface water (0.1 mg/l). Points near the influent area showed phosphorus ranging from 1.0 mg/l to 4.0 mg/l. The phosphorus level from M1 up to abstraction point (M19) is higher than the maximum permissible level of 0.1 mg/l explaining the presence of intensive algal bloom (chlorophyll a concentrations above 20 g/l) within the inner bay. The green algae, especially, Cladophora species, is considered as the best indicators of aquatic body contamination by nutrients and heavy metals (Chmielewska and Medven, 2001). Phosphorus serves as an essential nutrient for algae growth (Arthur, 1983; Bekithemba, 2005). It accelerates the growth of cyanobacteria. According to Okello (2004), the IMB have conditions that highly promote cyanobacteria proliferation in addition to the draining of wetlands.
Cyanobacteria are commonly known as blue-green algae. But they are most closely related to bacteria, like plants and capable of photosynthesis. Their pigmentation gives them their characteristic color. They reproduce rapidly in shallow lakes, adequate amounts of sunlight, warm temperatures, calm winds, and sufficient amounts of the nutrients like phosphorus and nitrogen (Straskraba and Tundisi, 1999). Cyanobacteria toxins are natural toxins both from the chemical and the toxicological aspects, and occur as cyclic peptides, alkaloids and lipopolysaccharides (Chorus and Bartram, 1999). When these algae die and decompose, toxins are released into the water. If animals ingest the toxin, they can be quickly paralyzed and die. The presence of this in toxic in water pose a major challenge to the production of safe drinking water from such surface water source (Okello et al., 2004). Water pollution by nutrients resulting from anthropogenic processes causes serious ecological problems and severe toxicological effects on humans. Sufficient accumulation of metals in the biota occurs through food chain transfer, which increases toxicological risks to man. The heavy metals of concern to human health are cadmium, copper, zinc and lead though some heavy metals are essential for human body at trace levels (Ardelt et al., 2005).
With respect to internal lake processes, the importance of phosphorus and nitrogen for eutrophication is quite different. The phosphorus load is mostly triggered by entry and remobilisation from sediments whereas the nitrogen load is influenced by internal metabolic processes. Thus, the reduction of nutrients in a lake is best possible by reduction of phosphorus entry, which can be effectively done through the use of the wetlands. The reduction of nitrogen entry will not have the same positive effect. This is valid especially if blue-green algae occur in considerable amount as the case now. The blue-green algae can fix atmospheric nitrogen and contribute to the nitrification of the lake. The reduction of phosphorus entries will directly reduce the biomass of green algae and blue-green algae. Significant improvement can be expected if concentration of total phosphorus is below 0.04 mg/l (National Water and Sewerage Corporation, 2008). Above this value mass growth of blue-green algae occurs.
The water transparency in IMB measured range from 0.15 m to 0.8 m. At the discharge point of Nakivubo Channel, the transparency is very low and increases towards the outer bay (M23). The transparency correlates to the turbidity of the lake. Turbidity measure the amount of light intercepted by a given volume of water due to the presence of suspended particles, dissolved matter and microscopic biota. Increasing the turbidity of the water decreases the amount of light that penetrates the water column causing changes in the aquatic ecosystem. These changes could result in a reduction in photosynthetic activity of phytoplankton, algae and macrophytes. This reduces the primary productivity of the system. Turbidity can also result in the reduced level of DO, destroys the habitat for macro invertebrates, and cause gill damage.
The concentration of ammonia in the water column within the bay is above the recommended standard for surface water (0.06mg/l). At the Nakivubo discharge point, the concentration of ammonia is about 6mg/l indicating discharge of domestic wastewater. Ammonia level is high as far as 16mg/l at some points. But in the outer bay (M23), the ammonia concentration conformed to the standard. Chronic exposure to elevated ammonia levels can reduce natural fish spawning and restrict migration patterns. Levels above 0.3mg/l can be lethal to fish. Ammonia concentration of 0.06mg/l can cause gill damage. Also chlorine reacts with ammonia to form chloramines, which is not a strong oxidant but provide longer-lasting residual free chlorine. Water distribution system with chloramines may experience nitrification, wherein ammonia is used as nutrient for
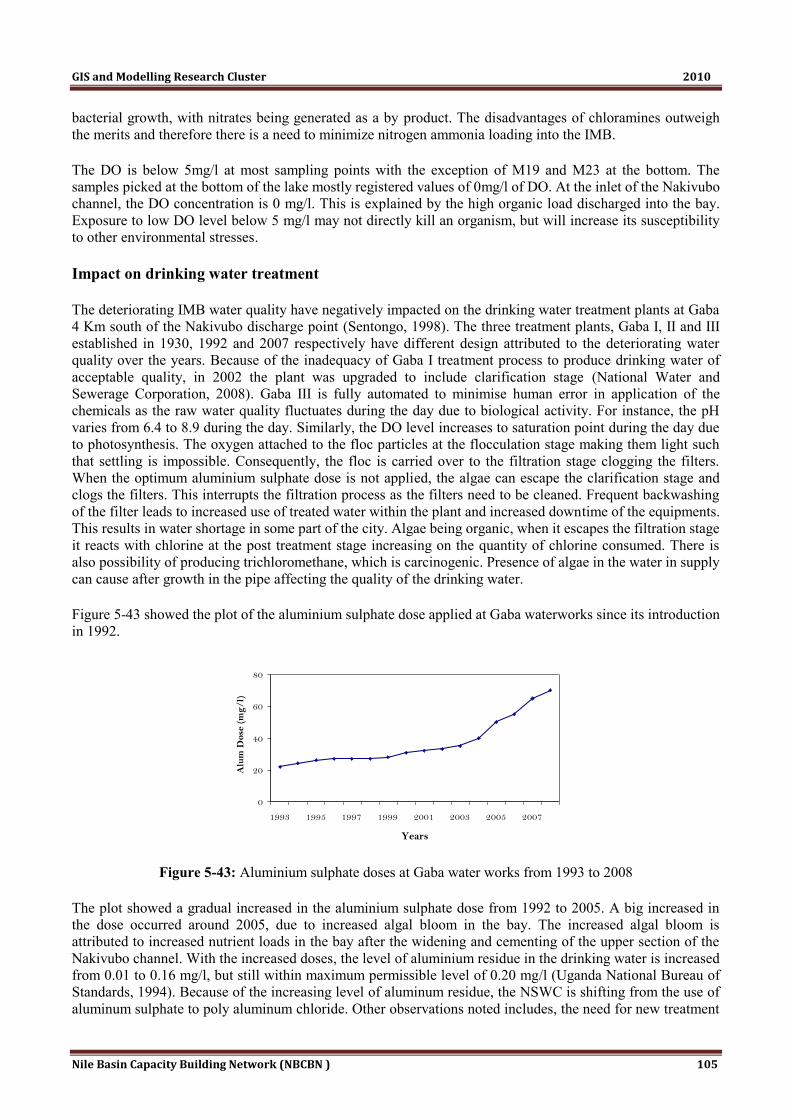
GIS and Modelling Research Cluster 2010
Nile Basin Capacity Building Network (NBCBN ) 105
bacterial growth, with nitrates being generated as a by product. The disadvantages of chloramines outweigh the merits and therefore there is a need to minimize nitrogen ammonia loading into the IMB.
The DO is below 5mg/l at most sampling points with the exception of M19 and M23 at the bottom. The samples picked at the bottom of the lake mostly registered values of 0mg/l of DO. At the inlet of the Nakivubo channel, the DO concentration is 0 mg/l. This is explained by the high organic load discharged into the bay. Exposure to low DO level below 5 mg/l may not directly kill an organism, but will increase its susceptibility to other environmental stresses.
Impact on drinking water treatment
The deteriorating IMB water quality have negatively impacted on the drinking water treatment plants at Gaba 4 Km south of the Nakivubo discharge point (Sentongo, 1998). The three treatment plants, Gaba I, II and III established in 1930, 1992 and 2007 respectively have different design attributed to the deteriorating water quality over the years. Because of the inadequacy of Gaba I treatment process to produce drinking water of acceptable quality, in 2002 the plant was upgraded to include clarification stage (National Water and Sewerage Corporation, 2008). Gaba III is fully automated to minimise human error in application of the chemicals as the raw water quality fluctuates during the day due to biological activity. For instance, the pH varies from 6.4 to 8.9 during the day. Similarly, the DO level increases to saturation point during the day due to photosynthesis. The oxygen attached to the floc particles at the flocculation stage making them light such that settling is impossible. Consequently, the floc is carried over to the filtration stage clogging the filters. When the optimum aluminium sulphate dose is not applied, the algae can escape the clarification stage and clogs the filters. This interrupts the filtration process as the filters need to be cleaned. Frequent backwashing of the filter leads to increased use of treated water within the plant and increased downtime of the equipments. This results in water shortage in some part of the city. Algae being organic, when it escapes the filtration stage it reacts with chlorine at the post treatment stage increasing on the quantity of chlorine consumed. There is also possibility of producing trichloromethane, which is carcinogenic. Presence of algae in the water in supply can cause after growth in the pipe affecting the quality of the drinking water.
Figure 5-43 showed the plot of the aluminium sulphate dose applied at Gaba waterworks since its introduction in 1992.
Figure 5-43: Aluminium sulphate doses at Gaba water works from 1993 to 2008
The plot showed a gradual increased in the aluminium sulphate dose from 1992 to 2005. A big increased in the dose occurred around 2005, due to increased algal bloom in the bay. The increased algal bloom is attributed to increased nutrient loads in the bay after the widening and cementing of the upper section of the Nakivubo channel. With the increased doses, the level of aluminium residue in the drinking water is increased from 0.01 to 0.16 mg/l, but still within maximum permissible level of 0.20 mg/l (Uganda National Bureau of Standards, 1994). Because of the increasing level of aluminum residue, the NSWC is shifting from the use of aluminum sulphate to poly aluminum chloride. Other observations noted includes, the need for new treatment
0
20
40
60
80
1993 1995 1997 1999 2001 2003 2005 2007
Years
Alu
m D
ose
(m
g/l)

GIS and Modelling Research Cluster 2010
Nile Basin Capacity Building Network (NBCBN ) 106
processes to cope up with the fluctuating water quality, and the need for highly trained manpower to run the complex water treatment plant.
Conclusions
From the water quality data generated over the years, there is increased evidence that the degradation of the Nakivubo wetlands deteriorated the IMB water quality in the past 4 decades. The suitability of the IMB as the raw water source for drinking water supply will not be sustainable in the near future. The water treatment now demands for both chemical and physical treatment processes. The use of aluminium sulphate as the major coagulant for treating the water to level acceptable for drinking is soon reaching the maximum allowable limit for human consumption. The water treatment process will continue to rise significantly if the abstraction point for raw water is maintained. The need for novel technology to be used and the overall increase in costs are passed on to the consumers. To reduce the water treatment cost at Gaba, there is a need to reallocate the raw water abstraction point to the outer bay. Measures to reduce pollution loads in the bay require an integrated approach such that the waste reduction should start from the upper section of Nakivubo channel including the treatment of heavily polluted surface water in the channel. The Nakivubo wetlands need to be sustainably protected. Thus, a multisectoral approach in restoration of the wetland and protection of IMB to be instituted and operationalized, need for coordinated urban planning. The solid waste collection in the city has to improve significantly to prevent flushing of solid waste into the drains.
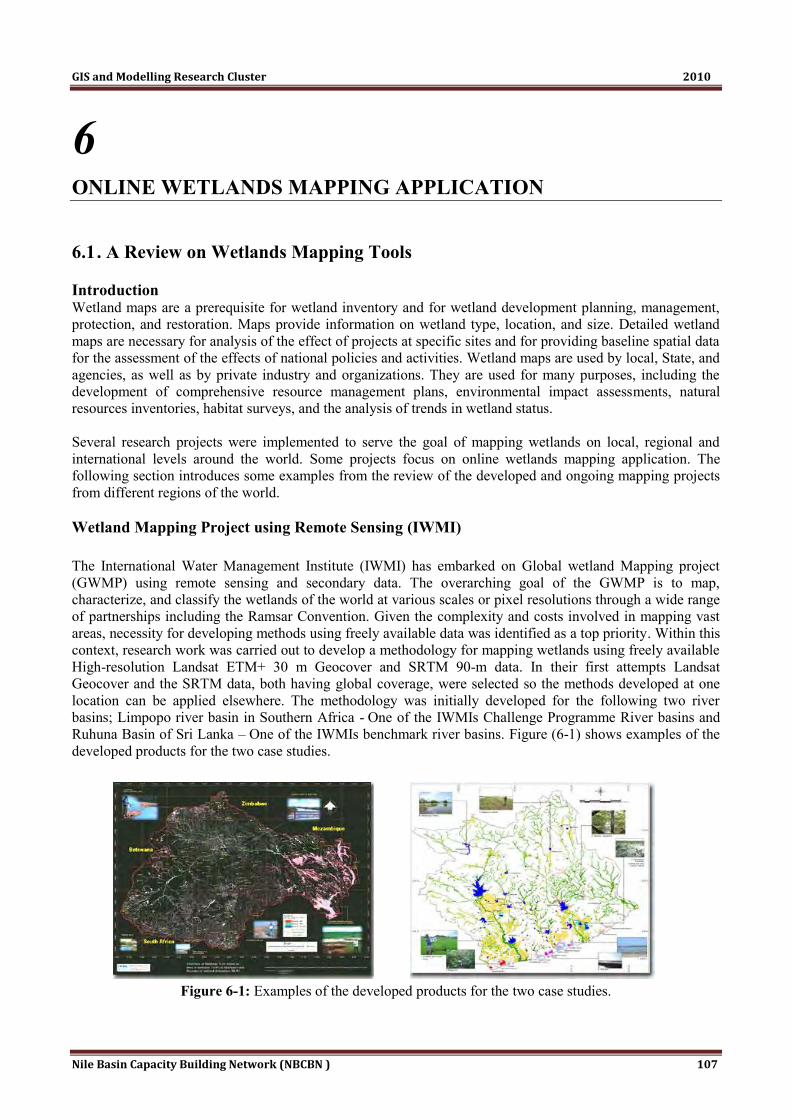
GIS and Modelling Research Cluster 2010
Nile Basin Capacity Building Network (NBCBN ) 107
6 ONLINE WETLANDS MAPPING APPLICATION
6.1 . A Review on Wetlands Mapping Tools Introduction Wetland maps are a prerequisite for wetland inventory and for wetland development planning, management, protection, and restoration. Maps provide information on wetland type, location, and size. Detailed wetland maps are necessary for analysis of the effect of projects at specific sites and for providing baseline spatial data for the assessment of the effects of national policies and activities. Wetland maps are used by local, State, and agencies, as well as by private industry and organizations. They are used for many purposes, including the development of comprehensive resource management plans, environmental impact assessments, natural resources inventories, habitat surveys, and the analysis of trends in wetland status. Several research projects were implemented to serve the goal of mapping wetlands on local, regional and international levels around the world. Some projects focus on online wetlands mapping application. The following section introduces some examples from the review of the developed and ongoing mapping projects from different regions of the world. Wetland Mapping Project using Remote Sensing (IWMI)
The International Water Management Institute (IWMI) has embarked on Global wetland Mapping project (GWMP) using remote sensing and secondary data. The overarching goal of the GWMP is to map, characterize, and classify the wetlands of the world at various scales or pixel resolutions through a wide range of partnerships including the Ramsar Convention. Given the complexity and costs involved in mapping vast areas, necessity for developing methods using freely available data was identified as a top priority. Within this context, research work was carried out to develop a methodology for mapping wetlands using freely available High-resolution Landsat ETM+ 30 m Geocover and SRTM 90-m data. In their first attempts Landsat Geocover and the SRTM data, both having global coverage, were selected so the methods developed at one location can be applied elsewhere. The methodology was initially developed for the following two river basins; Limpopo river basin in Southern Africa - One of the IWMIs Challenge Programme River basins and Ruhuna Basin of Sri Lanka – One of the IWMIs benchmark river basins. Figure (6-1) shows examples of the developed products for the two case studies.
Figure 6-1: Examples of the developed products for the two case studies.

GIS and Modelling Research Cluster 2010
Nile Basin Capacity Building Network (NBCBN ) 108
Mapping Classification and Inventory of Queensland, Australia
A comprehensive coverage of wetlands, mapped at an appropriate scale and level of detail, is a fundamental requirement for wetland management and decision making. Queensland‘s wetlands have been mapped digitally by building on existing information, including water body mapping derived from satellite imagery, regional ecosystem mapping and a springs database. Wetlands have been classified according to a range of criteria, including the type of ecological system (riverine, estuarine etc), their degree of water permanency, and salinity. The result is a consistent wetland map at a scale of 1:100,000, with finer detail in some parts of Queensland (mainly coastal regions) where appropriate mapping data exists. Several wetland mapping and classification products have been developed and delivered through the Queensland Wetland Program. The information below provides a history of the versions provided to date. Wetland mapping is a key element of wetland inventory. Wetland inventory can describe the listing and storage of wetland information from a range of sources. This listing or storehouse of wetland information may be generated from available data sources (tenure, climate, population, land use etc) or it may be collected in the field. Wetland inventory can also describe one of the types of field data collection. This process is referred to here as on-ground inventory. A wetland inventory database has been developed to bring data from Queensland together in one place. It is being developed as a project under the Queensland Wetlands Program. The aim is to make it easier for users to access and synthesise information from a variety of sources. All data is spatially referenced (latitudes and longitudes) so it can be viewed and queried in a spatial context in conjunction with (WetlandMaps), a simplified interactive online mapping tool.
The wetland inventory database is designed to store data from on-ground inventories collected on an associated field survey proforma as well as a range of other datasets and spatial layers. Examples of these datasets include state agency water quality data, river basin boundaries, regional fauna surveys. All data in the database are consistent with the themes described in the Australian wetlands inventory. The wetland inventory database is a work in progress and scoping of additional datasets is underway. Figure (6-2) shows the interface of this developed system.
Figure 6-2: Queensland online interactive wetlands mapping database

GIS and Modelling Research Cluster 2010
Nile Basin Capacity Building Network (NBCBN ) 109
The Ramsar Sites Information Service
The Ramsar Sites Information Service (RSIS) provides access to information on wetlands designated as internationally important under the Convention on Wetlands (Ramsar, 1971). These wetlands are commonly known as Ramsar sites. Wetlands International delivers the RSIS for the Ramsar Convention, under a contractual arrangement with the Ramsar Secretariat. The RSIS includes the searchable Ramsar Sites Database, and a number of other utilities, including a WebGIS displaying spatial information on Ramsar sites, downloadable GIS data of the Ramsar sites (spatial boundary and/or location). The RSIS provides on-line access to all official Information Sheets on Ramsar Wetlands (RIS), and increasingly it also includes links to other relevant but unofficial information sources concerning Ramsar sites in different countries, such as external Web sites, publications and management plans. All such links are clearly indicated as not being part of the official Ramsar site information provided by Administrative Authorities. Figure (6-3) shows an example from the developed GIS web mapping tool.
Figure 6-3: Wetlands international-Ramsar, Web Mapper online wetlands mapping tool
US- FWS Wetlands National Inventory (Wetlands Mapper)
The U.S. Fish and Wildlife Service's strategic plan for digital wetland data is focused on the development, revision, and dissemination of wetlands data and information to Service resource managers and the public. The present goal of the Service is to provide the citizens of the United States and its Trust Territories with current geospatially referenced information on the status, extent, characteristics and functions of wetlands, riparian, deepwater and related aquatic habitats in priority areas to promote the understanding and conservation of these resources. Updates to the Wetlands Mapper are in direct response to the need to integrate digital map data with other resource information to produce timely and relevant management and decision support tools. The Wetlands Mapper integrates digital map data with other resource information to produce timely and relevant management and decision support tools. This system is a geospatial wetlands digital online database that could be accessed online with full options of data download. Detailed in formation on this system are on the mapper website http://www.fws.gov/wetlands/Data/Mapper.html. Figure (6-4) shows the web interface of the online FWS wetlands mapper.

GIS and Modelling Research Cluster 2010
Nile Basin Capacity Building Network (NBCBN ) 110
Figure 6-4: the web interface of the online FWS Wetlands Mapper.
6.2 Importance of Developing an Online GIS Application for the Nile Basin This research showed a variety of wetlands types in the Nile Basin based on the simplified classification presented in this report. The developments of mapping methodologies and online tools for wetlands, shows the important need to develop a specific online mapping system for wetlands in the Nile basin, as a step forward to complement the developed and existing methodologies and tools. A comprehensive coverage of wetlands of the Nile basin, mapped at an appropriate scale and level of detail, is a fundamental requirement for wetland management and decision making for both regional and local levels. Therefore this research project is considered an attempt to put the basic components of this system, based on experiences gained from conducted research and existing tools, and adapting these tools to map the Nile basin wetlands with a focus on regional, local and pilot areas scales. 6.3 Online Wetlands Mapper for the Nile Basin The Developed online mapping system for the Nile Basin is designed to cover the whole basin wetlands areas on three levels of scales and details; the basin or regional scale, the countries or local scale and the detailed or wetlands pilot areas scale. The online mapper depends on a developed Wetlands geo-database that covers the three mentioned levels. Geo-referenced Data was collected based on these three scales including GIS layers, Attribute data and satellite images, the following section shows the different levels of scales and the collected data within each scale. Figure (6-5) shows the three levels of scales included in the GIS developed geodatabase.
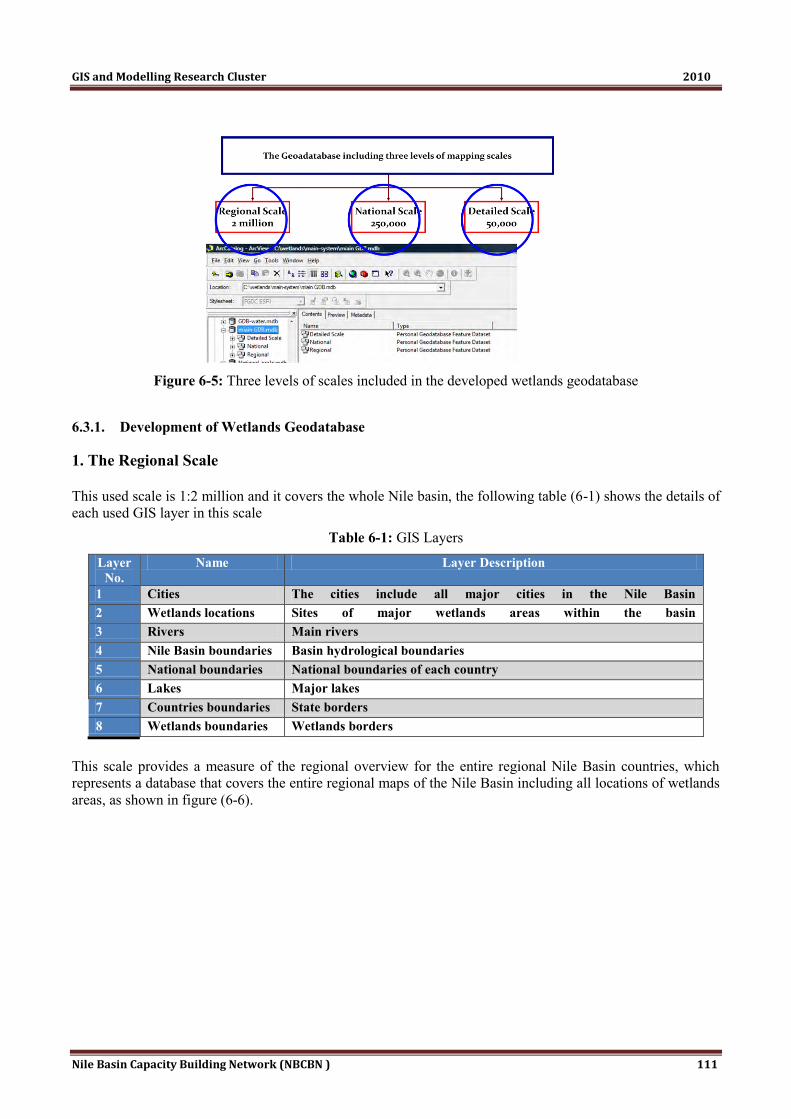
GIS and Modelling Research Cluster 2010
Nile Basin Capacity Building Network (NBCBN ) 111
Figure 6-5: Three levels of scales included in the developed wetlands geodatabase
6.3.1. Development of Wetlands Geodatabase
1. The Regional Scale This used scale is 1:2 million and it covers the whole Nile basin, the following table (6-1) shows the details of each used GIS layer in this scale
Table 6-1: GIS Layers Layer
No. Name Layer Description
1 Cities The cities include all major cities in the Nile Basin 2 Wetlands locations Sites of major wetlands areas within the basin 3 Rivers Main rivers
4 Nile Basin boundaries Basin hydrological boundaries 5 National boundaries National boundaries of each country 6 Lakes Major lakes 7 Countries boundaries State borders 8 Wetlands boundaries Wetlands borders
This scale provides a measure of the regional overview for the entire regional Nile Basin countries, which represents a database that covers the entire regional maps of the Nile Basin including all locations of wetlands areas, as shown in figure (6-6).

GIS and Modelling Research Cluster 2010
Nile Basin Capacity Building Network (NBCBN ) 112
Figure 6-6: The regional scale level of Wetlands geo-database
2. The local Scale This used scale is equal to 1: quarter of a million and it is developed to cover the whole basin on countries level. The current developed system includes maps covering Egypt, Uganda, Sudan D.R. Congo, based on the available collected data sets , all other countries are planned to be included in the full version. The following figure (6-7) shows an example of this scale on Egypt.
Figure 6-7: Local Scale, (Example, Egypt)
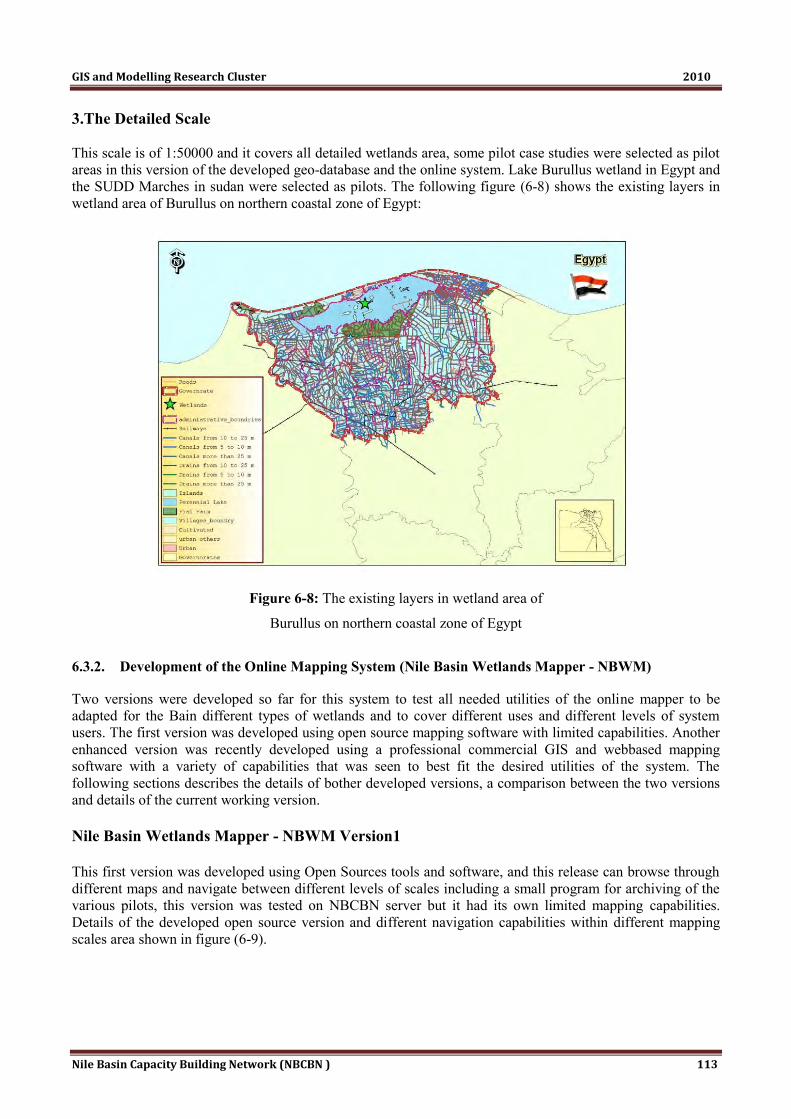
GIS and Modelling Research Cluster 2010
Nile Basin Capacity Building Network (NBCBN ) 113
3.The Detailed Scale
This scale is of 1:50000 and it covers all detailed wetlands area, some pilot case studies were selected as pilot areas in this version of the developed geo-database and the online system. Lake Burullus wetland in Egypt and the SUDD Marches in sudan were selected as pilots. The following figure (6-8) shows the existing layers in wetland area of Burullus on northern coastal zone of Egypt:
Figure 6-8: The existing layers in wetland area of
Burullus on northern coastal zone of Egypt
6.3.2. Development of the Online Mapping System (Nile Basin Wetlands Mapper - NBWM)
Two versions were developed so far for this system to test all needed utilities of the online mapper to be adapted for the Bain different types of wetlands and to cover different uses and different levels of system users. The first version was developed using open source mapping software with limited capabilities. Another enhanced version was recently developed using a professional commercial GIS and webbased mapping software with a variety of capabilities that was seen to best fit the desired utilities of the system. The following sections describes the details of bother developed versions, a comparison between the two versions and details of the current working version. Nile Basin Wetlands Mapper - NBWM Version1 This first version was developed using Open Sources tools and software, and this release can browse through different maps and navigate between different levels of scales including a small program for archiving of the various pilots, this version was tested on NBCBN server but it had its own limited mapping capabilities. Details of the developed open source version and different navigation capabilities within different mapping scales area shown in figure (6-9).
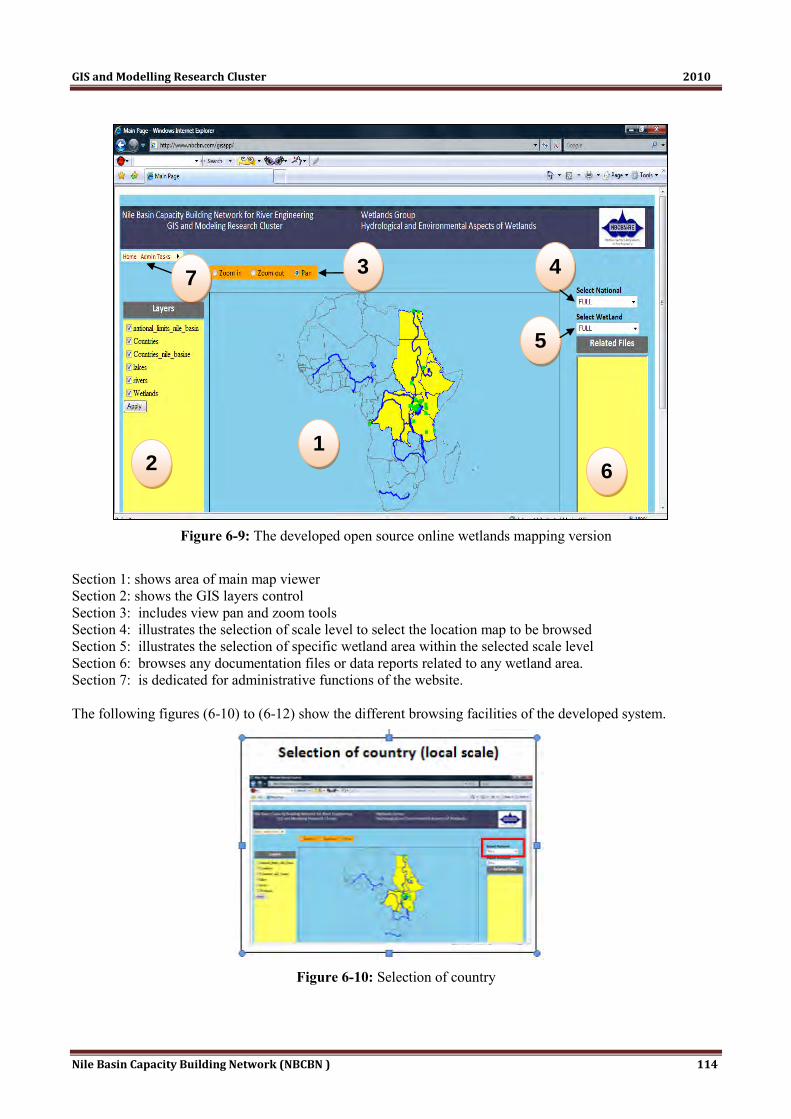
GIS and Modelling Research Cluster 2010
Nile Basin Capacity Building Network (NBCBN ) 114
Figure 6-9: The developed open source online wetlands mapping version
Section 1: shows area of main map viewer Section 2: shows the GIS layers control Section 3: includes view pan and zoom tools Section 4: illustrates the selection of scale level to select the location map to be browsed Section 5: illustrates the selection of specific wetland area within the selected scale level Section 6: browses any documentation files or data reports related to any wetland area. Section 7: is dedicated for administrative functions of the website. The following figures (6-10) to (6-12) show the different browsing facilities of the developed system.
Figure 6-10: Selection of country
1
3 4
5
6 2
7
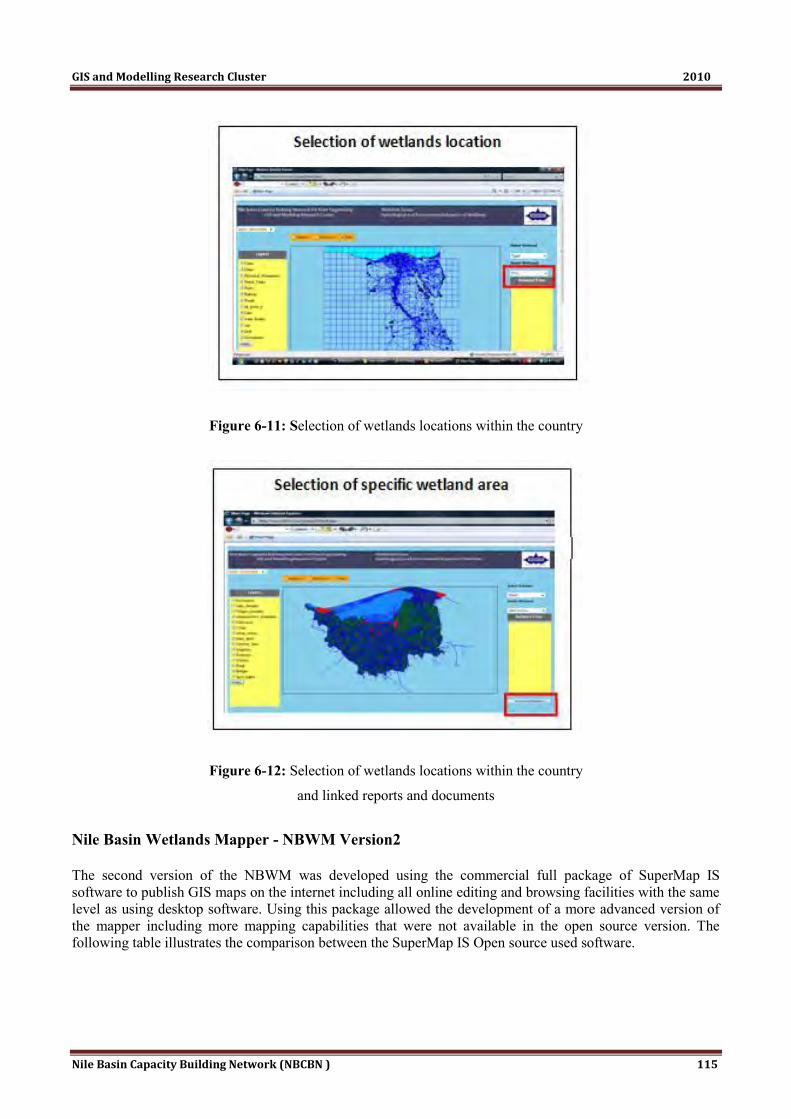
GIS and Modelling Research Cluster 2010
Nile Basin Capacity Building Network (NBCBN ) 115
Figure 6-11: Selection of wetlands locations within the country
Figure 6-12: Selection of wetlands locations within the country
and linked reports and documents
Nile Basin Wetlands Mapper - NBWM Version2 The second version of the NBWM was developed using the commercial full package of SuperMap IS software to publish GIS maps on the internet including all online editing and browsing facilities with the same level as using desktop software. Using this package allowed the development of a more advanced version of the mapper including more mapping capabilities that were not available in the open source version. The following table illustrates the comparison between the SuperMap IS Open source used software.

GIS and Modelling Research Cluster 2010
Nile Basin Capacity Building Network (NBCBN ) 116
Table 6-2: Comparison between the SuperMap IS VS Open Source software
paSrep uS Open Source Comparison Item No. Poor and viewing the GIS by converting it into images
Powerful and viewing the layers in GIS format Development Capabilities 1
Building a spatial query or attribute table query Null Querying Capabilities 2
Working with DEM and building analysis such as (profile Graph)
Null D analysis3 3
Working with Network analyst and building analysis such as ( )
Null Network analyst 4
Working with Spatial analysis Null Spatial analyst 5
Available Null Editing and drawing availability on GIS layers
6
Available Null Building & importing a new layers
7
Available Null Converting GPS points to GIS point layer
8
Available Null Distances and Area Calculation
9
Available Null Thematic maps 11
Available Null Layouts 11
Available Null Reports & Charts 12
Available Null Simulate A GIS software’s With all powerful tools
13
Working with Windows Unix - Linux Working with Windows only Operating system 14
Available Null Technical support 15
Powerful Poor System stability 16
Support Visual Basic .net Java
Support one language “Visual Basic .net” Language support 17
The following new function and tools are introduced through the commercial software used which enhanced the capabilities of browsing 1. Added editing, and drawing through the Internet (online editing) 2. Ability to search inside any layer 3. Development tools, zoom and move within the site 4. The possibility of measurement of distances and dimensions 5. The possibility of switching between maps (Navigation thought Maps) easily 6. The possibility of a mini-map view of the area from which to move the entire map 7. The possibility of making a selection of any element on the map 8. The possibility of control and data management by adding a layer or delete the layer and build a database. 9. Access to any kind of databases such as unlimited capacitance SQL Server, oracle 10. The possibility to control the show and hide layers 11. The possibility of displaying search results and display the result of the possibility of measuring the dimensions and areas

GIS and Modelling Research Cluster 2010
Nile Basin Capacity Building Network (NBCBN ) 117
The following figures describe the new components of the second version of the NBWM;
Figure 6-13: The main new interface of the NBWM version 2
Research Results and Outputs
Figure 6-14: Online Editing Tool

GIS and Modelling Research Cluster 2010
Nile Basin Capacity Building Network (NBCBN ) 118
Figure 6-15: SQL Map Query Tool
Figure 6-16: Simplified pan, Zoom and navigation of maps

GIS and Modelling Research Cluster 2010
Nile Basin Capacity Building Network (NBCBN ) 119
Figure 6-17: Distance and length measuring tool
Figure 6-18: Navigation through Maps

GIS and Modelling Research Cluster 2010
Nile Basin Capacity Building Network (NBCBN ) 120
Figure 6-19: Layers manager tool
The developed second version of the NBWM is still under testing and modification plans to accommodate all the exsiting data within the different wetlands areas. The system is proposed to inlclude more pilots from all the Nile basin countries. The third modified version will be developed within the framework of the the NBCBN research project working under the TIGER II Initiative. The current version demonstration site is on the following URL; www.nbcbn.com/NBWM.

GIS and Modelling Research Cluster 2010
Nile Basin Capacity Building Network (NBCBN ) 121
7 RESULTS AND RECOMMENDATIONS
7.1. Results
Wetlands play an important role in watershed ecology and hydrology. The functional value, or benefits, provided by wetlands include floodwater storage, pollutant removal, fish and wildlife habitat, bank and shore protection, and surface and ground water recharge. These benefits can be compromised by land use alterations that occur as part of the development process. These alterations and their associated impacts may be caused by polluted or excessive stormwater runoff, fragmentation, invasive species introduction, etc. As part of a comprehensive approach to watersheds planning and wetland management, communities may need to rapidly assess individual wetlands in the field to identify sources of impairment(s) and make preliminary wetland management designations. The focus of this research project is on the Nile basin wetlands. A comprehensive review on wetlnads classifications was done. This classification addressed the wetlands type, location or distribution, values, degradation and hydrological characteristics. The different types of wetlands in the basin were identified to be the basis for further detailed assessment. Based on the collected information; a Geo-database for the Nile basin wetlands was developed. The collected data covers the environmental and hydrological aspects of these wetlands from the Nile basin countries including; Egypt, Tanzania, D. R. Congo, Rwanda and Uganda. The research also highlighted rthe importance of GIS and remote sensing and ecological modelling as tools for wetlands management Two case studies from the Niel basin were selected to apply the different management tools, including simplified DSS tools and GIS modelling tools. The two casew studies were selected to cover different types of wetlands from the Nile Basin,; Coastal wetland area on northern coast of Egypt (Burullus Lake) and tropical wetland region on Victoria Lake (Nakivubo Wetlands). The first case study in Egypt focused water quality assessment of the lake burullus, and the application of ICZM concept as a tool for wetland management. The other case study in Uganda, presented a detailed analysis of the impact of wetlands degradion on the water quality and drinking water. To provide an easy access tool for wetlands management and to dessiminate the knowledge gathered on the Nile Basin wetlands, a online Nile basin wetlands Mapper (NBWM) was developed based on the wetlands geo-database, where the professionals can access the available data and information online. This system covers different mapping scales from the regional scale to local scale and detailed pilots scale. The NBWM application includes the two developed case studies, and it is designed to include all the basin countries in the future developments versions. 7.2. Recommendations
This research project managed to achieve several important outputs which are considered an added knowledge for better understanding of Nile Basin wetlands characteristics, uses, values and thtreatening degradation and losses problems. It is considered a step towards detailed mapping analysis of wetlands for management and restoration purposes as it includes detailed information

GIS and Modelling Research Cluster 2010
Nile Basin Capacity Building Network (NBCBN ) 122
regarding the different wetlands characteristics in the basin, with detailed varying case studies that shows the different types of wetlands and associated types of problems. This study is considered a starting point for more detailed studies regarding wetlands in the Nile basin. Therefore the research group recommends that there is still a need to continue this research in a future phase. The future studies should focus on and include the following topics:
Completing the wetlands geo-database for the Nile basin Developing more case studies to be included in the online mapping system Developing more detailed geo-database for wetlands zones (attributes) Applying hydrodynamic and ecological modelling for wetlands management Usinng remote sensing methodologies for wetlands mapping and management Developing a wetlands monitoring plan for different case studies Developing best management practices and guidelines for wetlands uses, restoration and
protection. Applying climate change scenarios for stydying the impacts of climate change on wetlands. Linking the developed (NBWM) with an online portal fro wetlands professional groups in
the basin.
To achieve the future proposed research, the group also recommends that NBCBN being linked under the Tiger Research Facility II, there should be joint future support from both NBCBN and TIGER II to accomplish the porposed activites.

GIS and Modelling Research Cluster 2010
Nile Basin Capacity Building Network (NBCBN ) 123
8 REFERENCES Alan pickaver, 2003, a common approach to the implementation of ICZM in the Baltic region: the principles underlying such an approach. The fifth HELCOM-HABITAT meeting, Finland. Alfy Morcos Fanos, 2002. Report on the Modified Mega Delta Workshop. [online], http://194.171.38.9/delta/reports/Summaries_of_background_papers.pdf [2002, September 6] . Alsdorf, D., Birkett, C., Dunne, T., Melack, J. and Hess, L. (2001). Water level changes in a large Amazon lake measured with spaceborne radar interferometry and altimetry. Geophysical Research Letters 28(14): doi: 10.1029/2001GL012962. issn: 0094-8276. Anderson R. & Rockel, M. (1991). Economic Valuation Of Wetlands. Discussion Paper #065. American Petroleum Institute: Washington, D.C. Anon (1996). "Commercial Wetlands Hits Milestones." Civil Engineering 12-14(April 1996).
Ardelt D., P. Ivanon and O. Schulz, 2005. "Analysis of Wastewater, soil and sewage sludge by ICP OES." LabPlus International Kleve. Arms K., 1994. Environmental Science. New York, Saunder College. Arthur J. P., 1983. Notes on the design and operation of waste stabilization ponds in warm climates of developing countries, Urban development. Washington. Aust, W.M., R. Lea, J.D. Gregory (1991). ―Removal Of Floodwater Sediments By A Clearcut Tupelo-Cypress Wetland.‖ Water Resource Bull. Vol. 27(1):111-117. Available Through EPA Wetlands Hotline.1-800-832-7828.
Azza N. G. T., F. Kansiime, M. Nalubega and P. Denny, 2000. "Differential permeasbility of papyrus and Miscanthidium roots mats in Nakivubo swamp, Uganda." Aquatic Botany 67: 169-178.
Baijukya, F., Kaihura, F. and Thomas, J. (2006). Land Degradation and Opportunities for Sustainable Management of Kagera River Basin-Tanzania. Kagera TAMP, Tanzania.
Bayomi.M.G., 1999. Lake Burullus a Geomorphological study. Thesis of PhD degree, department of geography, Helwan University. Bekithemba G., 2005. "Short-cutting the Phosphorus cycle in Urban Ecosystems, PhD Thesis."
Boelter, D.H., And E.S. Verry (1977). Peatland And Water In The Northern Lake States. USDA, Forest Service, North Central Forest Experiment Station, St Paul, MN. General Technical Report NC-31. 26 Pp.
Brinson, M. (1993). A Hydrogeomorphic Classification For Wetlands. Technical Report WRP-DE-4, US Army Corps Of Engineers, Wetlands Research Program, Washington DC.

GIS and Modelling Research Cluster 2010
Nile Basin Capacity Building Network (NBCBN ) 124
Brown, M. T. And Sullivan, M.F. (1988). ―The Value Of Wetlands In Low Relief Landscapes.‖ Ch. 11 In Hook, P.D. Et Al. 1988. The Ecology And Management Of Wetlands. Vol. 1. Timber Press, Portland, OR.
Campbell L. M., 2001. Mercury in Lake Victoria (East Africa): Another emerging issue for a beleaguered lake. Ontario, Canada, Waterloo. PhD. Carter,V. And Novitzki, R.P. (1988) Some Comments On The Relation Between Groundwater And Wetlands, Ch. 7. In: Hook, D.D. (Ed.), The Ecology And Management Ofwetlands,Vol. 1, The Ecology Ofwetlands. London: Croom-Helm.
Chmielewska E. and J. Medven, 2001. "Bioaccumulation of Heavy metals by Green Algae Cladophora gramerata in a Refinery Sewage Lake." Christine, Coughanowr (1998). Wetlands Of The Humid Tropics. Water-Related Issues and Problems Of The Humid Tropics And Other Warm Humid Regions. International Hydrological Programme Humid Tropics Programme Series No. 12. UNESCO. 48p. Chopra, R., Verma, V.K., & Sharma, P.K. (2001). Mapping, monitoring and conservation of Harike wetland ecosystem, Punjab, India, through remote sensing, International Journal of Remote Sensing, Vol. 22, No. 1, pp. 89-98. Chorus I. and J. Bartram, 1999. Toxic cyanobacteria in water. A guide to their public health consequences, monitoring and management. London, WHO. Clouston E. M. (2002). Linking The Ecological And Economic Values Of Wetlands: A Case Study Of Wetlands In Moreton Bay. Phd Dissertation, School Of Australian Environmental Studies, Griffith University. Costanza, R. and Gottlieb, S. (1998). Modeling ecological and economic systems with Stella: Part II. Special issue of Ecological Modelling 112: 81-247 Cowardin, L. M. V. Carter, F. C. Golet, And E. T. Laroe (1979). Classification of Wetlands and Deepwater Habitats Of The United States. U.S. Dep. Interior, Fish and Wildl. Serv. FWS/OBS - 79/31. Cowi/Vki, 1998. Kampala water quality monitoring programme: Murchison Bay water quality project. Kampala, National Water and Sewerage Corporation. Crafter, S. A., Njuguna, S. G., Et Al. (1992). "Proceedings of a Seminar on Wetlands of Kenya, National Museums of Kenya, Nairobi, Kenya" Gland, Switzerland: IUCN. Crance, J.H. (1988). Relationships Between Palustrine Wetlands of Forested Riparian Floodplains and Fishery Resources: A Review: U.S. Fish and Wildlife Service, Biological Report 88(32), 27 P. Cicin-Sain B. and Knecht R.W, 1997. Integrated Coastal and Ocean Management: Concepts and Practices, Island Press. Dahl TE, Alford GJ. (1996). History Of Wetlands In The Conterminous United States. In: Fretwell JD, Williams JS, Redman PJ, Eds. National Water Summary On Wetland Resources. U.S. Geological Survey, Water- Supply Paper 2425, Washington, DC. Pp. 19-26. Davies, J., And C.F. Claridge (Eds.) (1993). Wetland Benefits. The Potential For Wetlands To Support And Maintain Development. Asian Wetland Bureau, International Waterfowl And Wetlands Research Bureau, And Wetlands For The Americas.

GIS and Modelling Research Cluster 2010
Nile Basin Capacity Building Network (NBCBN ) 125
Day J.W, Jr. Psuty, N.P, and Perez, B.C. (2000). The role of pulsing events in the functioning of coastal barriers and wetlands: implications for human impact, management and the response to sea level rise. In Concept and Controversies in Tidal Marsh Ecolog. eds MP Weinstein and DA Kreeger. Kluwer Academic Publishers, pp. 633-659. Delfino, J.J. And H.T. Odum (1993). ―Wetland Retention Of Lead From A Hazardous Waste Site.‖ Bull. Environ. Contam. Toxicol. Vol 51(3):430. Demissie, M. And A. Khan (1993). Influence Of Wetlands On Streamflow In Illinois. Illinois Department Of Conservation. Illinois State Water Survey, Hydrology Division: Champaign, Il. Denny, P. (1991). Wetlands. International Waterfowl And Wetlands Research Bureau. Facts On File, Oxford, UK. Africa. Pages 115-148 In M. Finlayson And M. Moser, Editors. Denny P. (1985). The Ecology And Management Of African Wetland Vegetation. Geobotany 6. (Dordrecht: Dr W. Junk Publishers). Dianeetha Sadacharan, Frank van der Valk and Ingvild Harkes, 2001. IMCAM and the CBD: An analysis of Integrated Marine and Coastal Area Management documents in relation to CBD objective. Diwedar. AL. Ibrahim (2005). Integrated Coastal Zone Management And System Analysis-Case Study Burullus Lake, Egypt. Msc Thesis, UNESCO-IHE. Doyle, R., T. Scott, T. Conry, And R. Howard (2003). "Can The Wetland Save The Lake? The Lake Waco Wetlands: Habitat, Water Quality, And Environmental Education." Society Of Wetland Scientists 24th Annual Meeting, June 9-13, 2003, New Orleans, Louisiana. Dugan PJ & Jones TA (1993). Ecological Change In Wetlands: A Global View. In Waterfowl And Wetland Conservation In The 1990s – A Global Perspective, Eds M Moser, RC Prentice & J Van Vessem, IWRB Special Publication No 26, Slimbridge UK, 34–38. Dugan, P.J. (Ed.) (1990). Wetland Conservation: A Review Of Current Issues And Required Action. IUCN, Gland, Switzerland. 96 Pp. Emerton L., L. Lyango, P. Luwum and A. Malinga, 1999. The presence Economic Value of Nakivubo Urban Wetland, Uganda Engelen, G.; White, R. & Uljee, I., 1993. ‗Exploratory Modeling of Socio-Economic Impacts of Climatic Change‘ In: Climate Change in the Intra-America‘s Sea, G.Maul, (ed.), Edward Arnold, London, pp. 306-324. Ewel, K. (1990). ―Multiple Demands On Wetlands; Florida Cyprus Swamps Can Serve As A Case Study.‖ Bioscience 40: 660-666. E. J. Huising (2000). Wetland Monitoring In Uganda, Institute Of Environment And Natural Resources, Makerere University, P.O. Box 7298, Kampala, Uganda. ERDAS (1999). ERDAS Imagine Version 8.4 Field Guide. ERDAS Inc, Atlanta, Georgia USA. Frazier S., 1996. Directory Of Wetlands Of International Importance - An Update. Ramsar Convention Bureau, Gland, Switzerland. Fischer, D. H. (1989). Albion's Seed. New York: Oxford University Press.
GIS and Modelling Research Cluster 2010
Nile Basin Capacity Building Network (NBCBN ) 126
Fuller K, Wong B, Fox S, Choi Y, Chambers TJ (1998). TRANCE Is Necessary And Sufficient For Osteoblast-Mediated Activation Of Bone Resorption In Osteoclasts. J Exp Med 188:997–1001. Gale, P.M., K.R. Reddy, D.A. Graetz. (1994). Phosphorus Retention By Wetland Soils Used For Treated Wastewater Disposal. J Environ Qual. Vol 23(2):370-378. Gambrell, R.P. (1994). Trace And Toxic Metals In Wetlands - A Review. J. Environ. Qual. Vol. 23(5) 883-892. Gilliam, J. W. (1994). Riparian Wetlands And Water Quality. J. Environ. Qual 23:896–900. CSA. Gunther Fischer, 2002. The role of land in economic theory, IIASA report IR-02-037. GOPAL, S., and WOODCOCK, C. E., (1996). Remote sensing of forest change using artificial neural networks. IEEE Transactions on Geoscience and Remote Sensing, 34, 398–403. Guide, 2002. GRADE-EVALUATION GUIDE FOR POLICY ANALYSIS G. Randy Milton, Robert Hélie (2003). Wetland Inventory and Monitoring: Partnering To Provide A National Coverage. Report No. 03-2 North American Wetlands Conservation Council (Canada), Conference On Canadian Wetlands Stewardship. Hader, D.-P., R.C. Worrest, H.D. Kumar (1991). ―Aquatic Ecosystems.‖ Ch. 4 In United Nations Environmental Programme, 1991. Environmental Effects Of Ozone Depletion: 1991 Update. UNEP: Nairobi, Kenya Han, Q. W. (2003). Deposition in Reservoirs (in Chinese), 643 pp., Sci. Press, Beijing Harris, L.D. (1988). ―The Nature Of Cumulative Impacts On Biotic Diversity Of Wetland Vertebrates.‖
Environ Manag Vol. 12(5):675-693. Hategekimana S. (2005). La Dégradation Actuelle Du Marais De Rugezi: Une Catastrophe Écologique. Mémoire De Licence, Université Nationale Du Rwanda.115. Helms WD, 2002. Policy Analysis Framework. Presented at: AHRQ Workshop, Using Policy Analysis and Research More Effectively in Decisionmaking; July 29, 2002; Rensselaerville, NY. Hemond, H.F. , J. Benoit (1988). ―Cumulative Impacts On Water Quality Functions Of Wetlands.‖ Envir Manag. Vol 12(5) Pp 639-653. Hupp, C.R. , M.D. Woodside, T.M. Yanosky (1993). ―Sediment And Trace Element Trapping In A Forested Wetland, Chickahominy River, Virginia.‖ Wetlands Vol 13(2) Pp 95-104. Hickley, P. And R.G. Bailey (1987). Food And Feeding Relationships Of Fish In The Sudd Swamps (River Nile, Southern Soudan). Journal Of Fish Biology 30:147-160. Hollis, G.E., W.M. Adams, And M. Aminu-Kano (1993). The Hadejia-Nguru Wetlands: Environment, Economy And Sustainable Development. IUCN, Gland And Switzerland. Hollis, G.E. (1992). The Causes Of Wetland Loss And Degradation In The Mediterranean. In .Managing Mediterranean Wetlands And Their Birds, Eds C. M. Finlayson, G. E. Hollis And T. J. Davis, IWRB Special Publication No. 20, 281.5. Pp. 83-90.

GIS and Modelling Research Cluster 2010
Nile Basin Capacity Building Network (NBCBN ) 127
Houhoulis, P. F. and W. K. Michener (2000). Detecting wetland change: a rule-based approach using NWI and SPOT-XS data. Photogrammetric Engineering and Remote Sensing 66:205–11. Howard, G.W. & Matindi, S.W. (2003). Alien Invasive Species In Africa‘s Wetlands. Some Threats And Solutions. IUCN Eastern Africa Regional Programme. Kul Graphics Ltd., Nairobi, Kenya.
Howard G. W., 1999. The Nile River IUCN EARO Nairobi. Howard, G.W. And Harley, K.L.S. (1998). How Do Floating Aquatic Weeds Affect Wetland Conservation And Development? How Can These Effects Be Minimised?, Wetlands Ecology And Management 5: 215 - 225. Hughes, R. H.,Hughes, J. S., (1992). "A directory of African wetlands" Gland, Switzerland, Nairobi, Kenya, and Cambridge, UK: IUCN, UNEP, and WCMC. Huising E. J. E., 2000. "Wetland Monitoring in Uganda." Ibrahin K. M. and C. Kabuye, 1987. An illustrated manual of Kenya grasses. .Rome, Food and Agriculture organisation. Jacob B.Ukeles, 1977. policy analysis:Myth or reality? Public Administration Review 37, no.3 (May/July 1977),223 Jensen J.R. (1996). Introductory Digital Image Processing – A Remote Sensing Perspective, p. 316. Prentice-Hall, New York. Johnston, C.A. (1991). Sediment And Nutrient Retention By Freshwater Wetlands: Effects on Surface Water Quality. Critical Reviews In Environmental Control 21:491-565. Jost c., 1987. Contraints d‘amenagement en region volcanique tropicale, la chaine central des birunga au Rwanda. Universite Louis Pasteur, Strasbourg, 288pp. Kaggwa, R. C, Mulalelo, C. I., Denny, P. And Okurut, T.O. (2001). The Impact Of Alum Discharges On A Natural Tropical Wetlands In Uganda, Water Res., 35 (3): 795-807. Kashaigili, J. J., M.P. Mccartney, H.F. Mahoo, B.A. Lankford, B.P. Mbilinyi, D.K. Kashaigili, J. J. B. P. Mbilinyi, M. Mccartney, F. L. Mwanuzi (2006). Dynamics Of Usangu Plains Wetlands: Use Of Remote Sensing And GIS As Management Decision Tools. Physics And Chemistry Of The Earth, 31, 967-975.
Kampala City Council, 2006. Revised Solid Waste Management Strategy for Kampala. Kampala, Kampala City Council.
Kansiime F., H. Oryem-Origa and S. Rukwago, 2005. "Comparative assessment of the value of papyrus and cocoyams for the restoration of the Nakivubo wetland in Kampala, Uganda." Physics and Chemistry of the Earth, Parts A/B/C 30(11-16): 698-705. Kansiime, F. & Nalubega, M (1999). Wastewater Treatment By A Natural Wetland: The Nakivubo Swamp, Uganda. IHE Delft And Wageningen University, The Netherlands, 300 Pp. (Phd Thesis).
Kansiime F., E. Kateyo and J. Okot Okumu, 1995. Effects of pollution on Inner Murchison Bay (Lake Victoria-Uganda) on the distribution and abundance of plankton. Kampala, Makerere Institute of Environment and Natural Resource.

GIS and Modelling Research Cluster 2010
Nile Basin Capacity Building Network (NBCBN ) 128
Kansiime F., M. Nalubega, Bugeny, F.W.B, and E. M. Tukahirwa,1993. The role of Nakivubo Channel in maintaining the quality of Inner Murchison Bay- Lake Victoria. International Workshop on Fisheries, Environment and Socio-economic changes in the Lake Victoria basin, Jinja.
Katende A. B., P. Ssegawa and A. Birnie, 1999. Wild food plants and mushrooms of Uganda. . Kampala. Kaufmann RK, Seto KC. Change detection, accuracy,and bias in a sequential analysis of Landsat imagery in the Pearl River Delta, China: Econometric techniques. Agriculture, Ecosystems and Environment.2001; 85: 95–105. Kennish, M.J. (1992). Ecology Of Estuaries: Anthropogenic Effects. CRC Press, Inc., Boca Raton, FL. Kent, D.M. (1994b). ―Designing Wetlands For Wildlife.‖ Chapter 13 In D.M. Kent. 1994. Applied Wetlands Science And Technology. CRC Press: Boca Raton, Fl. Kotze, D.C., Breen, C.M. And Quinn, N. (1995). Wetland Losses In South Africa. P 263-272 In: Cowan, G.I. (Ed.) Wetlands Of South Africa. Department Of Environmental Aff Airs And Tourism, Pretoria, South Africa. Kizito S. Y., 1986. The Evaluation of pollution levels of Nakivubo Channel. Kampala, Makerere University. MSc. Kyambadde, J., Kansiime, F. And Dalhammar, G. (2005). Nitrogen And Phosphorus Removal In Subsurface-Free Pilot Constructed Wetlands With Horizontal Surface Flow In Uganda. Water, Air And Soil Pollution, 165: 37-59 Kyambadde J., F. Kansiime and G. Dalhammar, 2004. "Hydraulic loading, stability and water quality of Nakivubo Wetlands, Uganda." African Journal of Aquatic Science 29(2): 213-220. Lake Victoria Environmental Management Program, 2001. "Final Report on Management of Industrial and Municipal Effluent and Urban Run off on the Lake Victoria Basin, Uganda, Volume 1 Main Report and Volume III Report on Hydro 3-D Model." Lewis, R. R. (1990). Creation And Restoration Of Coastal Wetlands In Puerto Rico And The U.S. Virgin Islands. Pp.103-123 In J. A. Kusler And M. E. Kentula (Eds.), Wetland Creation And Restoration: The Status Of The Science. Island Press, Washington, D.C. Xxv + 595 Pp.
Lowe J., 1989. The flora of Nigeria. Grasses. 2nd, Ibadan University: 91-95.
Lvemp, 2001. "Final Report on Management of Industrial and Municipal Effluent and Urban Run off on the Lake Victoria Basin, Uganda, Volume 1 Main Report and Volume III Report on Hydro 3-D Model." Maclean, I.M.D., Burton, N.H.K., & Austin, G.E. (2006). Declines In Over-Wintering Diving Ducks At Lough Neagh: Comparisons Of Within Site, Regional, National And European Trends. BTO Research Report No. 432 To Environment Heritage Service. BTO, Thetford. Musgrove, A.J., Pollitt. MacKinnon, Frances. (2001). Wetland Application of LIDAR Data: Analysis of Vegetation Types and Heights in Wetlands. Prepared for the Nova Scotia Geomatics Centre, Nova Scotia, Canada. Mafabi, P. (2000). The Role of Wetland Policies In The Conservation Of Waterbirds: The Case Of Uganda. Ostrich, 71: 96-98.
Matagi S., Vivian, 1998. Environmental Technology Assessment in Uganda. A counting synopsis in Environmental Technology, Assessment (EnTA) in sub-Saharan Africa. Osaka/Shiga, UNEP-IETC: 259-277.

GIS and Modelling Research Cluster 2010
Nile Basin Capacity Building Network (NBCBN ) 129
Matagi S., Vivian 2002. "Some issues of environmental concerns in Kampala the capital city of Uganda." Environmental monitoring and assessment 77. Millennium Ecosystem Assessment, (2005). Ecosystems and Human Well-Being: Wetlands and Water Synthesis. World Resources Institute, Washington, DC. MINAGRI (2001). Schéma Directeur D‘aménagement Des Marais. De Protection Des Bassins Versants Et De La Conservation Des Sols. Rapport Global Définitif. HYDROPLAN Ingénieurs Gesellschaft Mbh.Kigali.38. MINALOC (2004). Mission D‘étude De Conservation Et De Gestion Intégrée Du Marais De Rugezi. Rapport Provisoire. Helpage-Rwanda, Kigali.112. Ministry Of Water, Lands and Environment (Mwle) 1999. The National Water Policy. Kampala, Uganda: Government Of Uganda, Mwle. MINITERE (2003). Etudes Relatives À La Protection Intégrée Et Conservation Des Ressources Naturelles Des Zones Humides Critiques Du Rwanda. Évaluation De La Diversité Biologique Des Zones Humides, Experco Des Grands Lacs.Kigali.78. Mitsch, William J., And James G. Gosselink (1986). Wetlands, New York: Van Nostrand Reinhold, 1986, P. 539. Mwanukuzi, P.P.K. (1991). Origin and geomorphology of wetland of Tanzania. In: Proceedings of a Seminar on Wetland of Tanzania. Morogoro Tanzania. pp 28-30. National Audubon Society (1993). Saving Wetlands-A Citizens Guide For Action In The Mid-Atlantic Region: Camp Hill, Pa., National Audubon Society, 130 P.
National Committee for Integrated Coastal Zone Management, 1996. Integrated Coastal Zone Management in Egypt. Towards an Egyptian Framework ICZM Programme. Results from the Hurghada Workshop.
National Environmental Management Authority, 1999. The National Environment Act (Standards for Discharge of Effluent into Water or on Land). 153. Uganda. National Environment Management Authority (Nema) (1996). State of the Environment Report National Research Council (NRC), Subcommittee On Ammonia (1979). Ammonia. University Park Press, Baltimore, MD.
National Report of Uganda Cop7, 1999. National Report prepared for the 7th Meeting of the Conference of the Contracting Parties to the Convention on Wetlands (Ramsar, Iran, 1971)
National Water and Sewerage Corporation, 2008. Annual Report 2006-2007. Kampala, National Water & Sewerage Corporation.
National Water and Sewerage Corporation, 2008. Draft Feasibility Study Project Concept Report for Kampala Sanitation Program/Uganda. Kampala, National Water and Sewerage Corporation. NCDEM North Carolina Department Of Environmental Management Water Quality Section (1993). Indicators of Freshwater Wetland Functions and Values For Protection and Management. North Carolina Department Of Environment, Health, And Natural Resources: Raleigh, NC. NOAA. National Oceanic and Atmospheric Administration (1990a). Coastal Wetlands of The United States. National Oceanic And Atmospheric Administration:Washington, DC.

GIS and Modelling Research Cluster 2010
Nile Basin Capacity Building Network (NBCBN ) 130
NOAA. National Oceanic and Atmospheric Administration (1990b). Estuaries of The United States. National Oceanic and Atmospheric Administration: Washington, DC. Novotony, V. And H. Olem (1994). Water Quality Prevention. Identification, and Management Of Diffuse Pollution. Van Nostrand Reinhold: New York, NY.
Niwagaba B. C., 2002. An assessment of point source pollution and its effect on the self-purification capacity of Nakivubo channel, Kampala. Technology. Kampala, Makerere University. Master. NRC (1995). Wetlands: Characteristics And Boundaries. National Research Council, National Academy Press, Washington, DC, USA.
Nyangababo J. T., E. Henry and E. Omutunge, 2005a. "Lead, Cadmium, Copper, Manganese and Zince in Wetland Waters of Victoria Lake Basin, East Africa." Bull. Environ. Contam. Toxicol 74: 1003-1010.
Nyangababo J. T., Henry. E. and E. Omutunge, 2005b. "Heavy Metal Contamination in plants, sediments and air precipitation of Katonga, Simiyu and Nyando Wetlands of Lake Victoria Basin, East Africa." Bull. Environ. Contam. Toxicol 75: 189-196. O'Brien, A.L. (1988). ―Evaluating the Cumulative Effects On New England Wetlands.‖ Environ Manag Vol. 12(5):627-636. O'Brien, G. E. (1988, January). [Review of Arizona Wetlands and Waterfowl]. School Science and Mathematics, 88(1), 75. OEP. White House Office of Environmental Policy (1993). Protecting America's Wetlands, A Fair, Flexible Approach.
Okello W. O., J.S. Barilrwa, F.W.B. Bugenyi and R. Kurmayer, 2004. "Toxic cyanobacteria occurance in Lake Victoria-Uganda." Okot-Okumu,J. (2004). Primary Production and Decomposition of Loudetia Phragmitoides (A.Peter) In The Littoral Wetland of a Small Satellite Lake (L.Nabugabo,Uganda). Afr.J. Ecol. 42 (Suppl.1). 108-113. OTA. U.S. Congress, Office Of Technology Assessment (1993). Preparing For An Uncertain Climate - Vol. II, OTA-O-568 Washington, DC: U.S. Government Printing Office, October 1993. Owen, D.E. (1992). Uranium and Other Elements In Colorado Rocky Mountain Wetlands: A Reconnaissance Study. USGS: Denver, Co. Özesmi, SL. (2000). Satellite Remote Sensing of Wetlands and a Comparison of Classification Methods. Ph.D. Dissertation. University of Minnesota, Department of Forest Resources, St. Paul, MN Peterjohn, W.T. And D.L. Correll (1984). ―Nutrient Dynamics In an Agricultural Watershed: Observations on The Role of a Riparian Forest.‖ Ecology Vol. 65:1466. Ponnamemperuna, F.N. (1972). ―The Chemistry Of Submerged Soils.‖ Adv. Agron. Vol. 24:29-96. Puckett, L.J. , M.D. Woodside, B. Libby, M.R. Schening (1993). ―Sinks For Trace Metals, Nutrients And Sediments In Wetlands Of The Chickahominy River Near Richmond, Virginia.‖ Wetlands Vol. 13(2):105-114. Ramsar convention on wetland. National Report of Egypt for COP7 [online], http://www.ramsar.org/cop7_nr_egypt.htm

GIS and Modelling Research Cluster 2010
Nile Basin Capacity Building Network (NBCBN ) 131
Ramsar convention on wetland, 1991. Ramsar Advisory Missions: Report No. 26, Lakes Bardawil and Burullus, Egypt. [online] http://www.ramsar.org/ram_rpt_26e.htm Reilly, W. K. (1991). A New Way with Wetlands. Journal of Soil and Water Conservation 46:192-194. Reint J. Bakema And Lucy Iyango (2000). Engaging Local Users In The Management Of Wetland Resources : The Case Of The National Wetlands Programme, Uganda. R.G. Taylora,, K.W.F. Howard (1999). The Influence of Tectonic Setting on the Hydrological Characteristics of Deeply Weathered Terrains: Evidence From Uganda, Journal of Hydrology, 218 (1999) 44–71 Richardson, C.J. (1994). Ecological Functions and Human Values In Wetlands: A Framework For Assessing Impact. Wetlands 14:1-9. Richardson, C.J. (1995). ―Wetlands Ecology.‖ In Encyclopedia of Environmental Biology, Vol. 3. Academic Press, Inc. Richardson, C.J. and E.J. Mccarthy (1994). Effect of Land Development and Forest Management on Hydrologic Response In Southeastern Coastal Wetlands: A Review. Wetlands 14:56-71. Richardson, C. J. (1985). ―Mechanisms Controlling Phosphorus Retention Capacity In Freshwater Wetlands.‖
Science 228:1424-1427. Rio, J. N. and Lozano-Garcia, F. D. (2000) Spatial filtering of radar data (RADARSAT) for wetlands (brackish marshes) classification.2, pp. 143-151. RRAM (1988). Ruhengeri and Its Resources. An Environmental Profile of Ruhengeri Prefecture, USAID, Kigali.92. Scott, D.A. And Poole, C. (1989). A Status Overview of Asian Wetlands. Asian Wetland Bureau, Kuala Lumpur. Scott, D.A. & Carbonell, M. (1985). A Directory of Neotropical Wetlands. Gland, Switzerland, IUCN. Shaikh, M., Green, D., & Cross, H. (2001) A remote sensing approach to determine environmental flows for wetlands of the Lower Darling River, New South Wales, Australia, International Journal of Remote Sensing, Vol. 22, No. 9, pp. 1737-1751. Shepherd, B., D. Harper, and A. Millington (1999). Modelling catchment-scale nutrient transport to watercourses in the U.K. Hydrobiologia 395-396: 227-237.
Sentongo J., 1998. Assessment of pollution to Lake Victoria by Industrial and Municipal Activities around Lake Victoria in Uganda. Institute of Environment and Natural Resources. Kampala, Makerere University. MSc.
Serageldin, 1993. Making Development Sustainable. Finance and Development. December 1993. Vol 30:(4):6.
Silveira, J. E. (1996). Landscape Dynamics In The Everglades: Vegetation Pattern and Disturbance In Water Conservation Area 1. Ph.D. Dissertation, University Of Florida, Gainsville, Florida, 177 Pp. Steinberg, S. L. And H.S. Coonrod (1994). Oxidation of The Root Zone By Aquatic Plants Growing In Gravel-Nutrient Solution Culture. J. Environ. Qual. Vol. 23: 907-

GIS and Modelling Research Cluster 2010
Nile Basin Capacity Building Network (NBCBN ) 132
Straskraba M. and J. G. Tundisi, 1999. "Guidelines of Lake Management: Reservoir Water Quality Management." International Lake Environment Committee Foundation 9.
Sutcliffe, J. V. and Parks, Y. P., 1999. The Hydrology of the Nile, IAHS Special Publication no. 5, IAHS Press, Institute of Hydrology, Wallingford, Oxfordshire OX10 8BB, UK, 1999. Taylor, R.G., Howard, K.W.F. (1999). Lithological Evidence for Then Evolution of Deeply Weathered Landsurfaces In Uganda By Tectonically Controlled Cycles of Deep Weathering and Stripping. Catena 35 (1), 65–94. Taylor, R.G., Howard, K.W.F. (1996). Groundwater Recharge In The Victoria Nile Basin Of East Africa: Support For The Soil Moisture Balance Approach Using Stable Isotope Tracers and Flow Modelling. Journal of Hydrology 180, 31–53. Taylor ARD, Howard GW & Begg GW (1995). Developing Wetland Inventories In Southern Africa: A Review. In Classification and Inventory of The World‘s Wetlands, Eds CM Finlayson & AG Van Der Valk, Advances In Vegetation Science 16, Kluwer Academic Publishers, Dordrecht, The Netherlands, 57–79. Taylor, J.R. M.A. Cardamone, W.J. Mitsch (1990). ―Bottomland Hardwood Forests: Their Functions and Values,‖ Ch 2 In Gosselink Et Al. 1990. Ecological Processes and Cumulative Impacts. Lewis Publishers: Chelsea, MI T¨oyr¨a, J., A. Pietroniro, and L. W. Martz (2001). Multisensor hydrologic assessment of a freshwater wetland. Remote Sensing of Environment 75(2), 162–173. Tumusiime, M. And Mijumbi, J. (1999). Socio-Economic Survey of Nakivubo Wetland, Report Prepared for National Wetlands Conservation and Management Programme, Ministry of Lands Water and Environment, Kampala.
Uganda National Bureau of Standards, 1994. Standard Specification For Drinking (Potable) Water. US201:1994. Uganda. UDC 543.341. UNCED, 1992. The Rio Declaration on environment and development, UN Conference on Environment and Development, Rio de Janeiro, Brazil. UNOPS (1998). La Gestion De L'environnement En Haiti. Réalités Et Perspectives. Edition Spéciale, UNOPS/PNUD/HAI/92/001 USDA-SCS. 1989. National Resource Inventory (1987). USDA-Soil Conservation Service. USEPA. U.S. Environmental Protection Agency (1995). Wetlands Fact Sheets. EPA: Washington DC. Available Through EPA Wetlands Hotline. 1-800-832-7828. USEPA. U.S. Environmental Protection Agency (1993b). Livestock Grazing On Western Riparian Areas. EPA: Washington DC. Available Through EPA Wetlands Hotline. 1-800-832-7828. USEPA. 1993c. Memorandum from William H. Farland, Director of the Office of Health and Environmental Assessment and Henry L. Longest, II, Director of the Office of Emergency and Remedial Response to: Directors of the Waste Management Divisions, Emergency and Remedial Response Divisions, Hazardous Waste Management Division and Hazards Waste Division. Subject: Use of IRIS Values in Superfund Risk Assessment. OSWER Directive #9285.7-16. December 21.

GIS and Modelling Research Cluster 2010
Nile Basin Capacity Building Network (NBCBN ) 133
Van Den Bergh, J., Barendregt, A. Gilbert, A., Herwijnen, M. Van, Horssen, P. Van, Kandelaars, P. & Lorenz, C. (2001). Spatial Economic-Hydrological Modeling and Evaluation of Land Use Impacts In The Vecht Wetlands Area. Environmental Modeling and Assessment 6, 87-100. Vanden Bossche, J.-P. & Bernacsek, G.M. (1991). Source Book for The Inland Fishery Resources of Africa: 3. CIFA Technical Paper, No. 18.3. Rome, FAO. 219 Pp. Verry, Elon S. and D. R. Timmons (1982). Waterborne Nutrient Flow Through an Upland-Peatland Watershed In Minnesota. Ecology 63(5): 1456-1467. Yawson And S.D.Tumbo (2006). Use of A Hydrological Model For Environmental Management Of The Usangu Wetlands, Tanzania. IWMI Research Report 104. Colombo, Sri Lanka: International Water Management Institute. 48p. Y. D. Abebe & K. Geheb, Eds. (2003). Wetlands of Ethiopia: Proceedings of a Seminar on The Resources and Status of Ethiopia's Wetlands. Nairobi, Kenya: IUCN, 2003. WALKER W.E, 2000. Policy Analysis: A Systematic Approach to Supporting Policymaking in the Public Sector, JOURNAL OF MULTI-CRITERIA DECISION ANALYSIS, J. Multi-Crit. Decis. Anal. 9: 11–27. Walbridge, M.R., and J.P. Struthers (1993). Phosphorus Retention In Non-Tidal Palustrine Forested Wetlands Of The Mid-Atlantic Region. Wetlands 13:84–94. Weller, M.W. (1981). Freshwater Marshes: Ecology and Wildlife Management. University of Minnesota Press: Minneapolis, Minn. 147pp. Whigham, D.F., C. Chitterling, and B. Palmer. 1988. Impacts of freshwater wetlands on water quality: A landscape perspective. Environmental Management 12(5):663-671 William J. Mitsch, James G. Gosselink (2000). Wetlands:; Third Ed., Wiley, Newyork. Williams W. D., 1998. Guidelines of Lake Management "Management of Inland Saline Waters" Winter, T.C. (1988). ―A Conceptual Framework for Assessing Cumulative Impacts on the Hydrology of Nontidal Wetlands.‖ Environ Manag. Vol. 12(5): 605-620. Winter, Thomas C. (1988). A Conceptual Framework for Assessing Cumulative Impacts on the Hydrology of Nontidal Wetlands. Environmental Management. V12, N5, 605-620. World Bank (1993). Water Resources Management, a World Bank Policy Paper. Washington, DC: The World Bank. World Wetlands Day (2000). In Anatidae Key Sites, Http://Ramsar.Org/Wwd2000_Rpt_Russia1.Htm W.J. Mitsch And J.G. Gosselink (1993). Wetlands : 2nd Ed.. Van Nostrand Reinhold, 1993. 722 Pp., ISBN 0-442-00805-8. WICKWARE, G M , HOWARTH, P J (1981). Change detection in the Peace-Athabasca Delta using digital Landsat data, Remote Sensing of Environment. Vol. 11, pp. 9-25. Mar. 1981 http://earthtrends.wri.org/pdf_library/country_profiles/coa_cou_834.pdf http://www.imcg.net/gpd/africa/tanzania.pdf http://www.tanzania.go.tz/profilef.html

GIS and Modelling Research Cluster 2010
Nile Basin Capacity Building Network (NBCBN ) 134
http://www.wetlands.org/RSIS/_COP9Directory/Directory/1TZ001.html http://www.wetlands.org/RSIS/_COP9Directory/Directory/1TZ002.html http://www.wetlands.org/RSIS/_COP9Directory/Directory/1TZ003.html http://www.wetlands.org/RSIS/_COP9Directory/Directory/1TZ004.html

GIS and Modelling Research Cluster 2010
Nile Basin Capacity Building Network (NBCBN ) 135
List of Research Group Members
Scientific Advisors Prof. Roland K. Price Senior Advisor Hydroinformatics UNESCO-IHE, the Netherlands Dr. Zoltan Vekerdy Assistant Professor Faculty of Geo-Information Science and Earth Observation (ITC) University of Twente, the Netherlands
Full Profile of Research Group Members are available on: The Nile Basin Knowledge Map http://www.nilebasin-knowledgemap.com/
Name Country Organization E-mail
Dr. Hoda Soussa Egypt Ain-Shams University [email protected]
Eng. Amel Azab Egypt Hydraulics Research Institute
Dr. Japhet Joel Kashaigili
Tanzania Sokoine University of Agriculture
Eng. Richard Oyoo Uganda National Water and Sewerage Corporation
Mr. Mohamed Saeed Egypt Private Sector [email protected]
Eng. Mohamed Bahgat Egypt Hydraulics Research Institute
Dr. Al-Sayed Diwedar Egypt Hydraulics Research Institute
Mr. Ernest Munyambi D.R. Congo Ministry of Environment Nature
Conservation & Water and Forests
Ir. Salomon Salumu Zahera
D.R. Congo Institut du Batiment et travaux public ( IBTP )
Mr. Nagandu Balekelayi D.R. Congo Mbujimayi University [email protected]
Mr. Hategekimana Sylvere
Rwanda Institute of Scientific and Technological Research (IRST)
Eng. Eman Wasfy Egypt Ain Shams University [email protected]


Related Documents