Conflict on Water Resources Development between Multiple Nations in the Nile River Basin ○ Masahiro ABE 1 , Kenji TANAKA 2 , Toshiharu KOJIRI 2 , Toshio HAMAGUCHI 2 , and Tetsuya SUMI 2 1 Dept. of Urban Management, Kyoto University 2 Water resources Research Center, DPRI, Kyoto University 1 The Second Symposium 20 th Mar 2012

Welcome message from author
This document is posted to help you gain knowledge. Please leave a comment to let me know what you think about it! Share it to your friends and learn new things together.
Transcript
Conflict on Water Resources
Development between Multiple
Nations in the Nile River Basin○ Masahiro ABE1, Kenji TANAKA2, Toshiharu KOJIRI2,
Toshio HAMAGUCHI2 , and Tetsuya SUMI2
1Dept. of Urban Management, Kyoto University2Water resources Research Center, DPRI, Kyoto University
1
The Second Symposium 20th Mar 2012
2
Contents
1. Background
2. Methodology
3. Verification
4. Assessment of future climate
5. Water Resources Development
6. Conclusion
7. Database
The Second Symposium 20th Mar 2012

3
Background
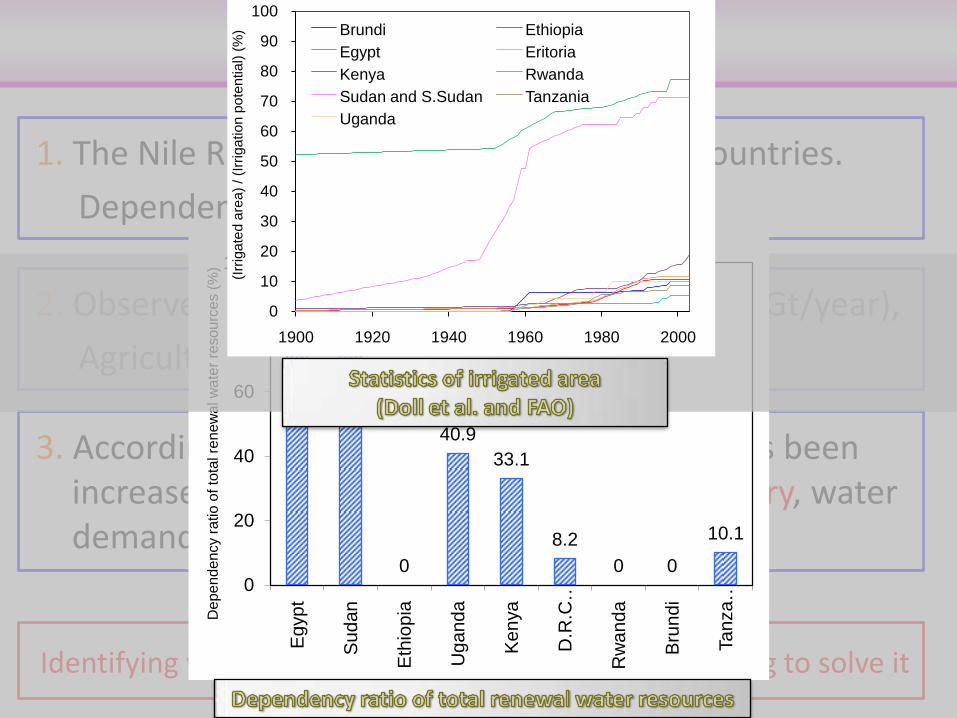
3. According to aquastat (FAO), irrigated area has been increased since 1980. In the end of 21st century, water demand is supposed to be more than supply
Identifying water shortage problem in the Nile and trying to solve it
2. Observed discharge to Aswan High Dam is 72(Gt/year),
Agricultural water use in Egypt is 59(Gt/year)
1. The Nile River crosses borders among 11 countries.
Dependency ratio in Egypt is 96.9%
Background and purpose
96.9
77.3
0
40.9
33.1
8.2
0 0
10.1
0
20
40
60
80
100
Eg
yp
t
Sudan
Eth
iop
ia
Ug
an
da
Ke
nya
D.R
.C…
Rw
an
da
Bru
nd
i
Ta
nza
…
De
pe
nd
en
cy r
atio o
f to
tal re
ne
wa
l w
ate
r re
sou
rce
s (
%)
0
10
20
30
40
50
60
70
80
90
100
1900 1920 1940 1960 1980 2000
(Irr
iga
ted
are
a)
/ (I
rrig
atio
n p
ote
ntia
l) (
%) Brundi Ethiopia
Egypt Eritoria
Kenya Rwanda
Sudan and S.Sudan Tanzania
Uganda
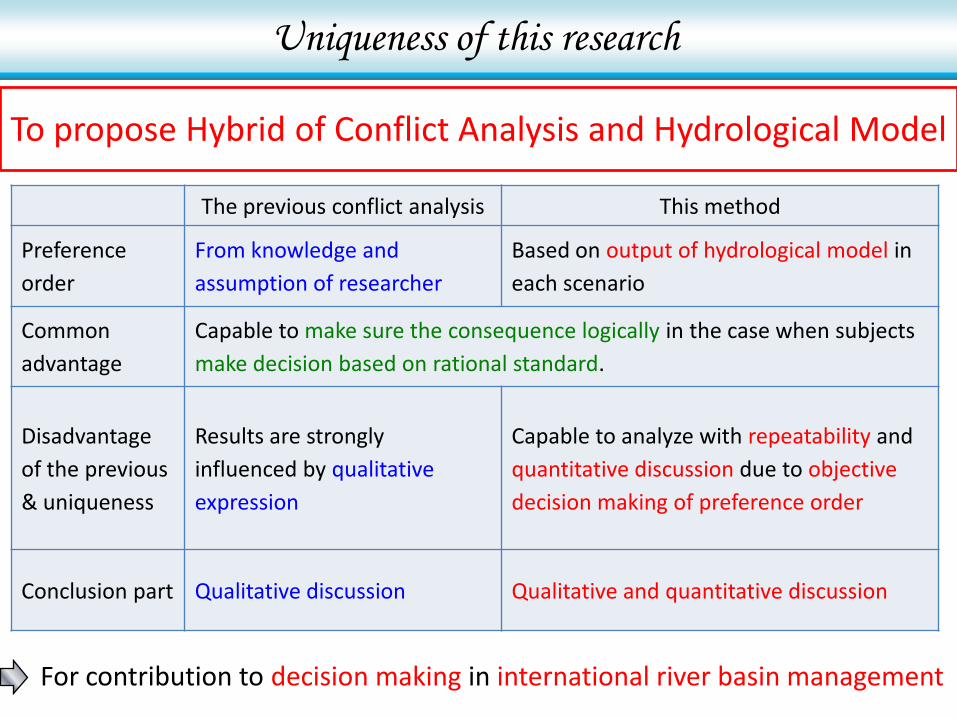
To propose Hybrid of Conflict Analysis and Hydrological Model
The previous conflict analysis This method
Preference
order
From knowledge and
assumption of researcher
Based on output of hydrological model in
each scenario
Common
advantage
Capable to make sure the consequence logically in the case when subjects
make decision based on rational standard.
Disadvantage
of the previous
& uniqueness
Results are strongly
influenced by qualitative
expression
Capable to analyze with repeatability and
quantitative discussion due to objective
decision making of preference order
Conclusion part Qualitative discussion Qualitative and quantitative discussion
For contribution to decision making in international river basin management
Uniqueness of this research

6
Methodology
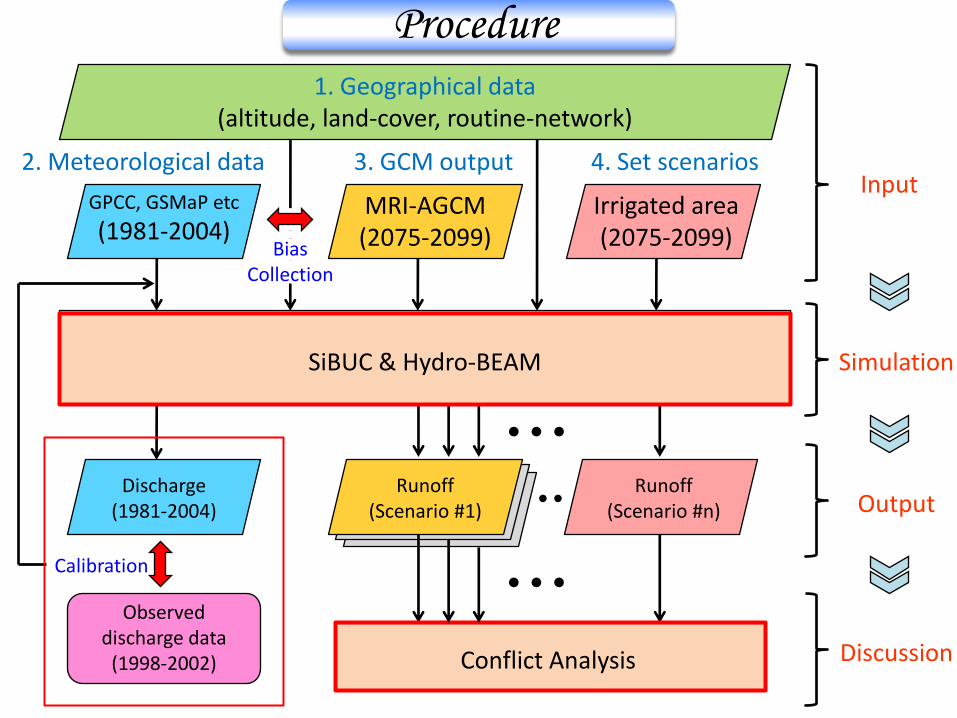
GPCC, GSMaP etc
(1981-2004)MRI-AGCM(2075-2099)
Discharge(1981-2004)
Runoff(Scenario #1)
Runoff(Scenario #n)
Observed discharge data
(1998-2002)
1. Geographical data(altitude, land-cover, routine-network)
SiBUC & Hydro-BEAM
Conflict Analysis
Calibration
Simulation
Output
Discussion
Input2. Meteorological data 3. GCM output 4. Set scenarios
Irrigated area(2075-2099)Bias
Collection
Procedure

8
Remote Sensing and GCM
(bougria-tif.blogspot.com) (Citation: Japan Meteorological Agency)
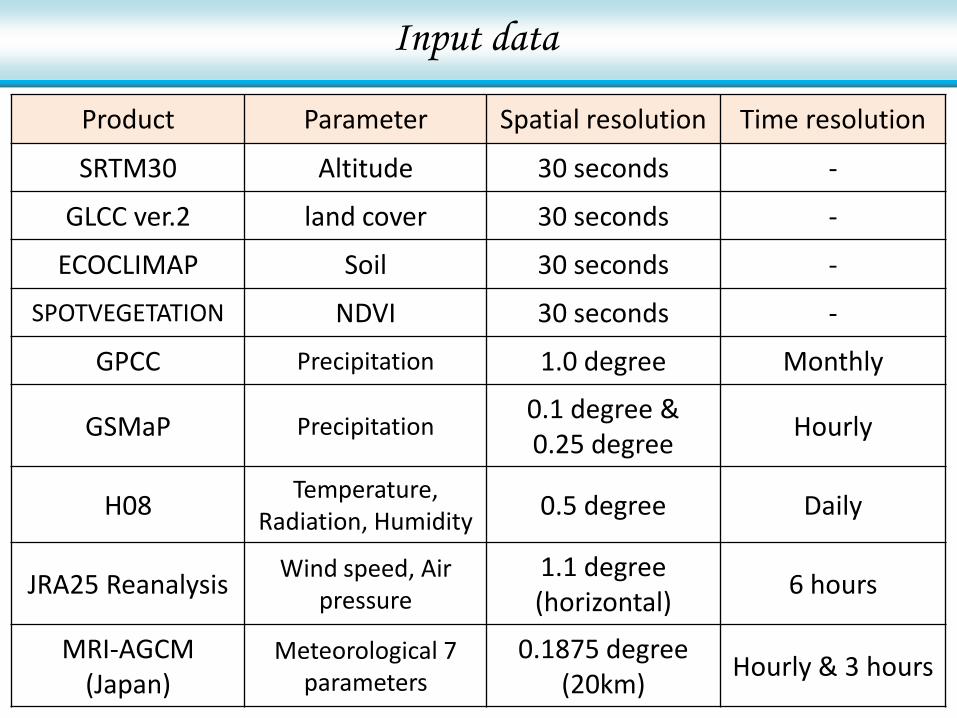
Product Parameter Spatial resolution Time resolution
SRTM30 Altitude 30 seconds -
GLCC ver.2 land cover 30 seconds -
ECOCLIMAP Soil 30 seconds -
SPOTVEGETATION NDVI 30 seconds -
GPCC Precipitation 1.0 degree Monthly
GSMaP Precipitation0.1 degree &0.25 degree
Hourly
H08Temperature,
Radiation, Humidity0.5 degree Daily
JRA25 ReanalysisWind speed, Air
pressure1.1 degree(horizontal)
6 hours
MRI-AGCM (Japan)
Meteorological 7 parameters
0.1875 degree (20km)
Hourly & 3 hours
Input data

10
SiBUC & Hydro-BEAM
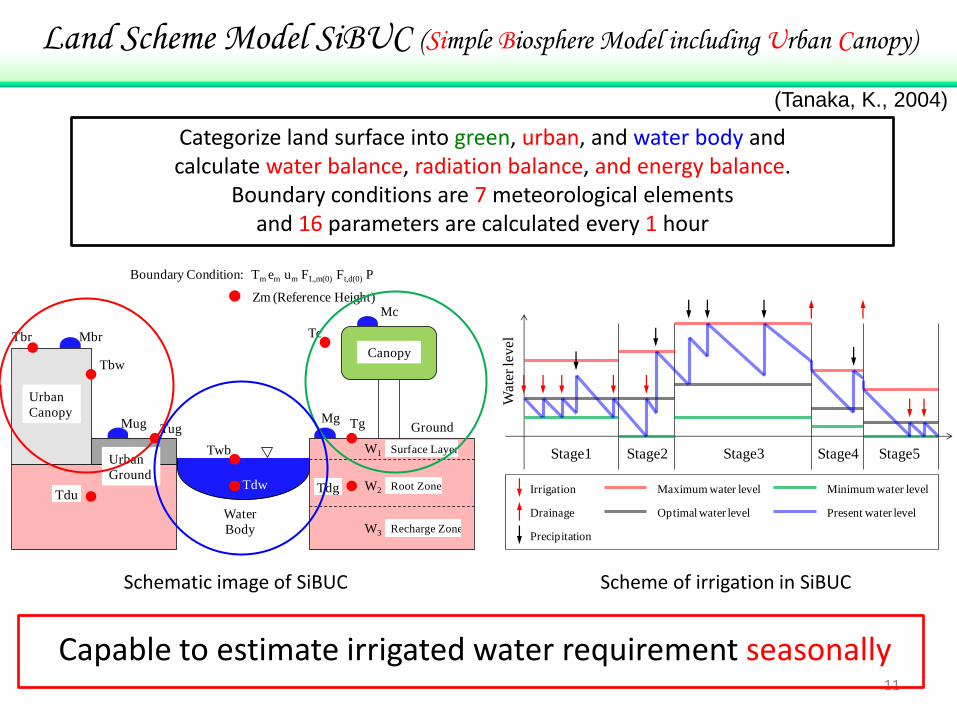
Canopy
Ground
Urban
Canopy
Urban
GroundTdg
Tdu
Water
Body
Tbw
Tdw
Mc
MbrTbr
Mug
Twb
Mg Tg
Tc
Tug
Surface Layer
Root Zone
Recharge Zone
W1
W2
W3
Zm (Reference Height)
Boundary Condition: Tm em um FL,m(0) Ft,d(0) P
11
Land Scheme Model SiBUC (Simple Biosphere Model including Urban Canopy)
(Tanaka, K., 2004)
Categorize land surface into green, urban, and water body and calculate water balance, radiation balance, and energy balance.
Boundary conditions are 7 meteorological elements and 16 parameters are calculated every 1 hour
Schematic image of SiBUC
Stage1 Stage2 Stage4 Stage5Stage3
Wate
r le
vel
Precipitation
Drainage
Irrigation Maximum water level
Optimal water level
Minimum water level
Present water level
Capable to estimate irrigated water requirement seasonally
Scheme of irrigation in SiBUC
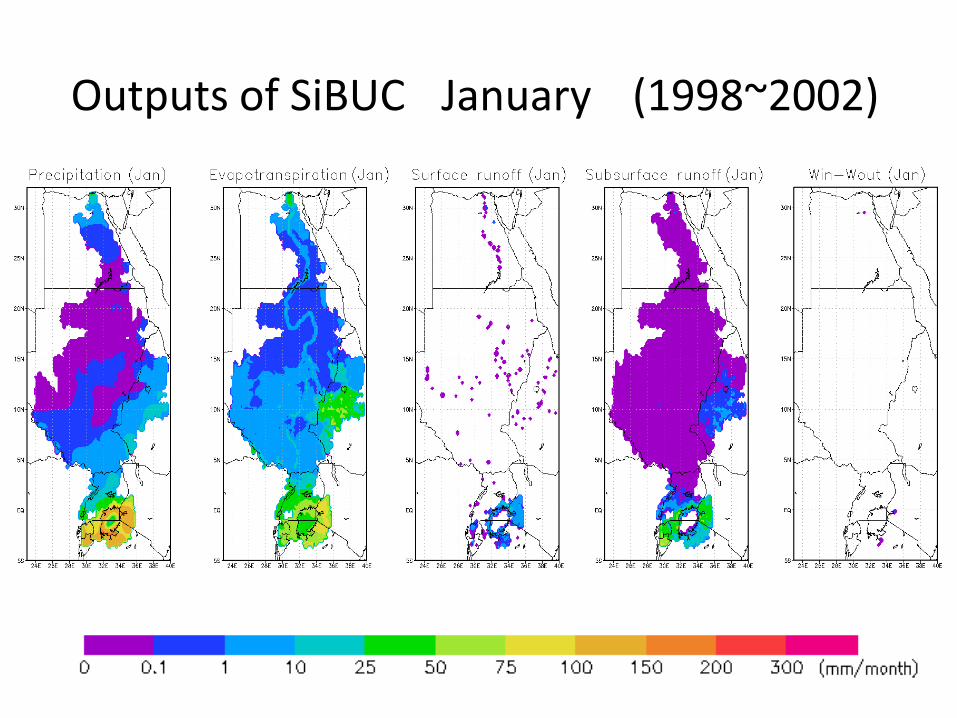
Outputs of SiBUC (1998~2002)January
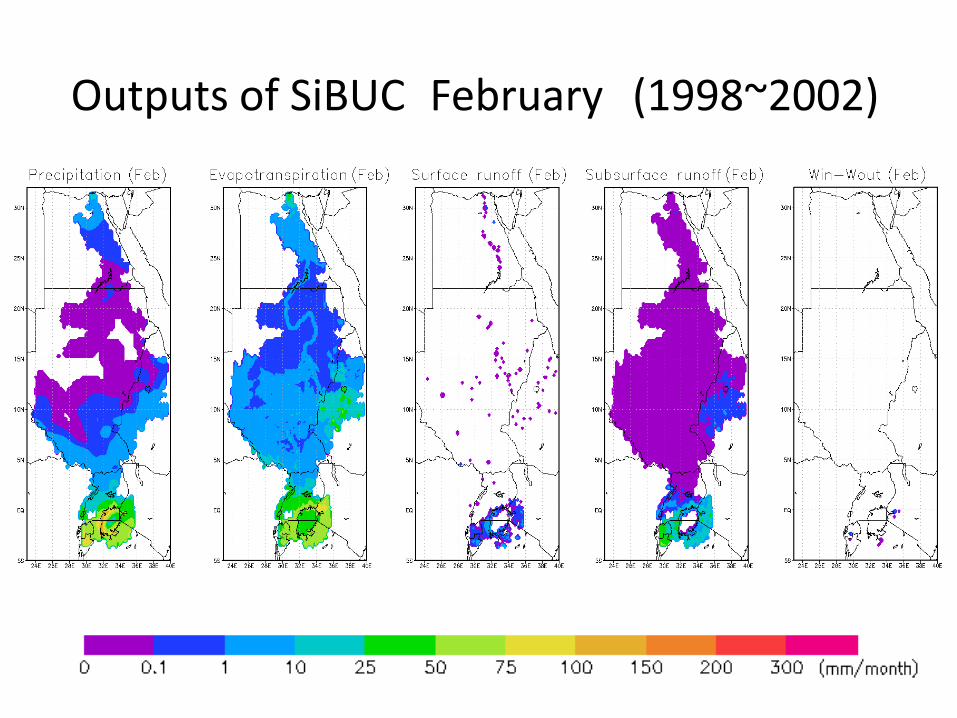
Outputs of SiBUC (1998~2002)February
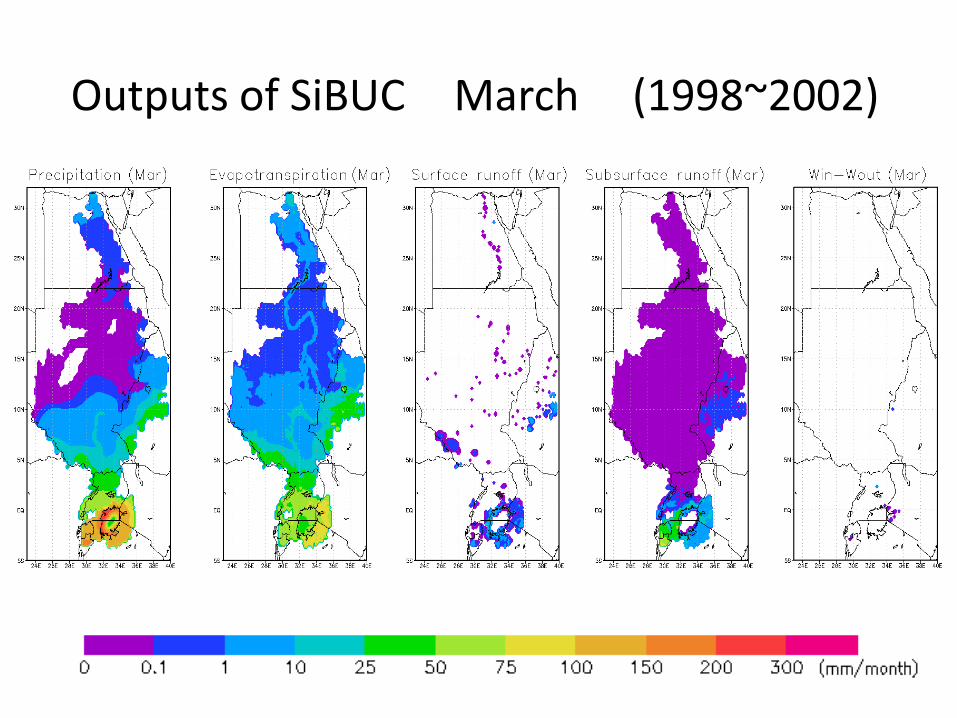
Outputs of SiBUC (1998~2002)March
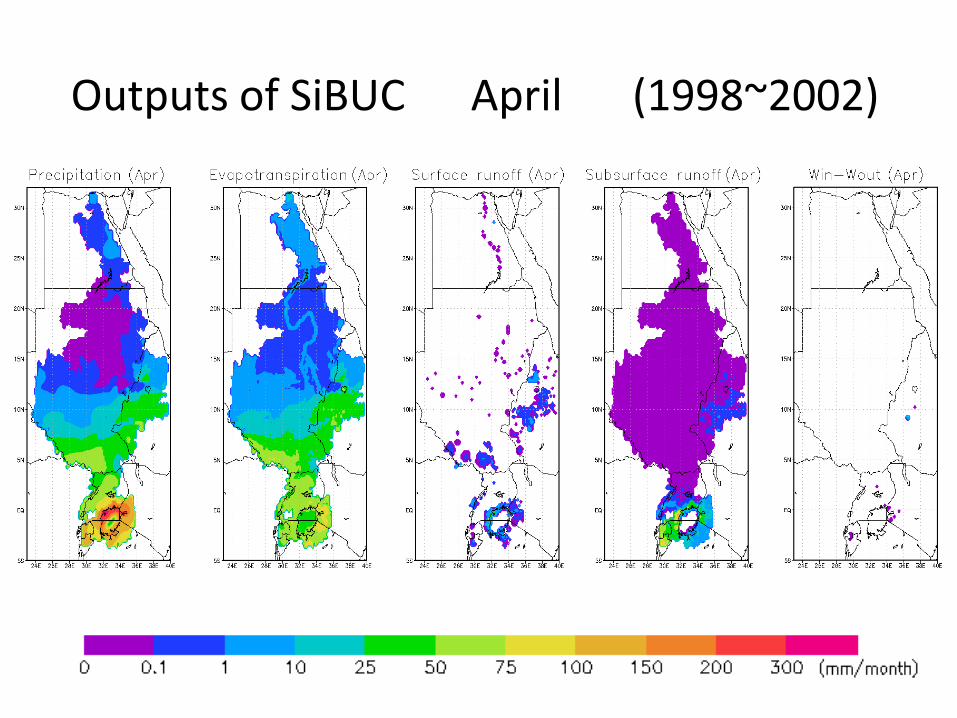
Outputs of SiBUC (1998~2002)April
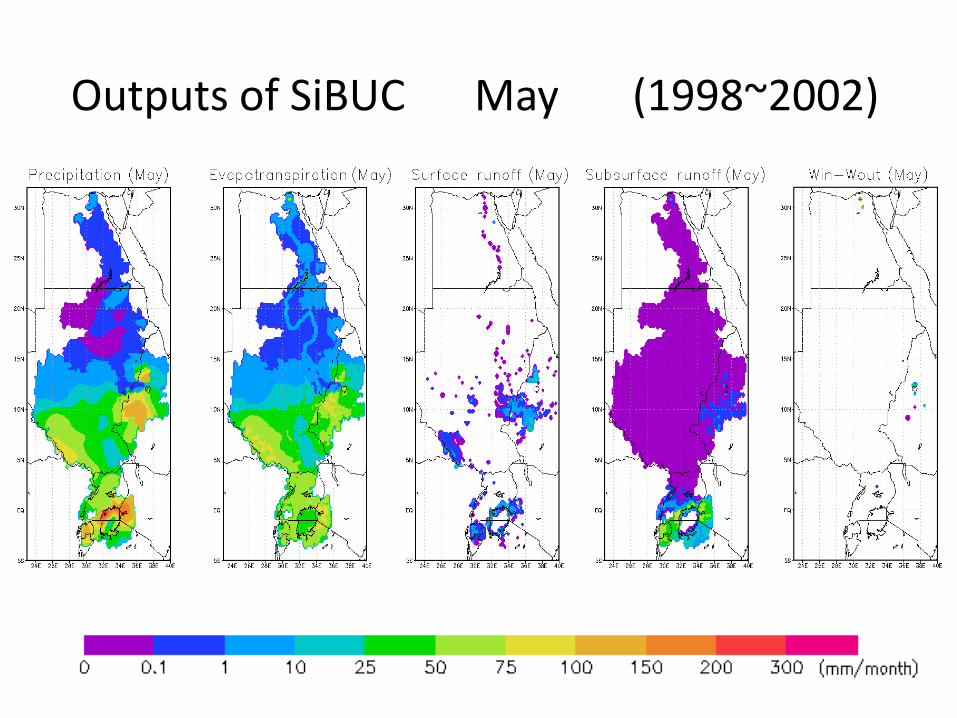
Outputs of SiBUC (1998~2002)May
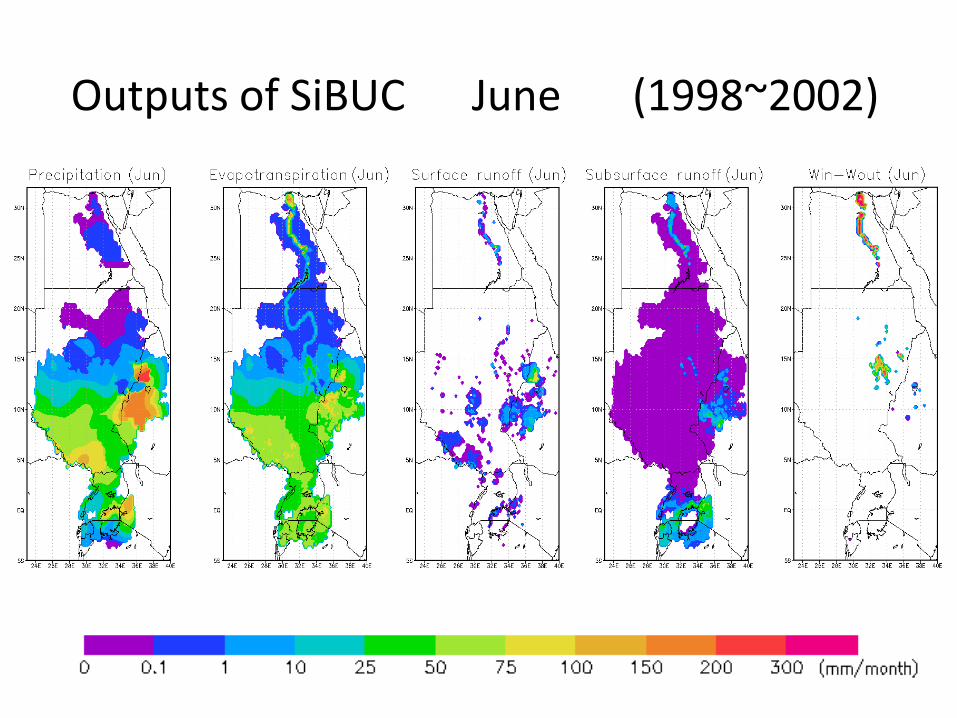
Outputs of SiBUC (1998~2002)June
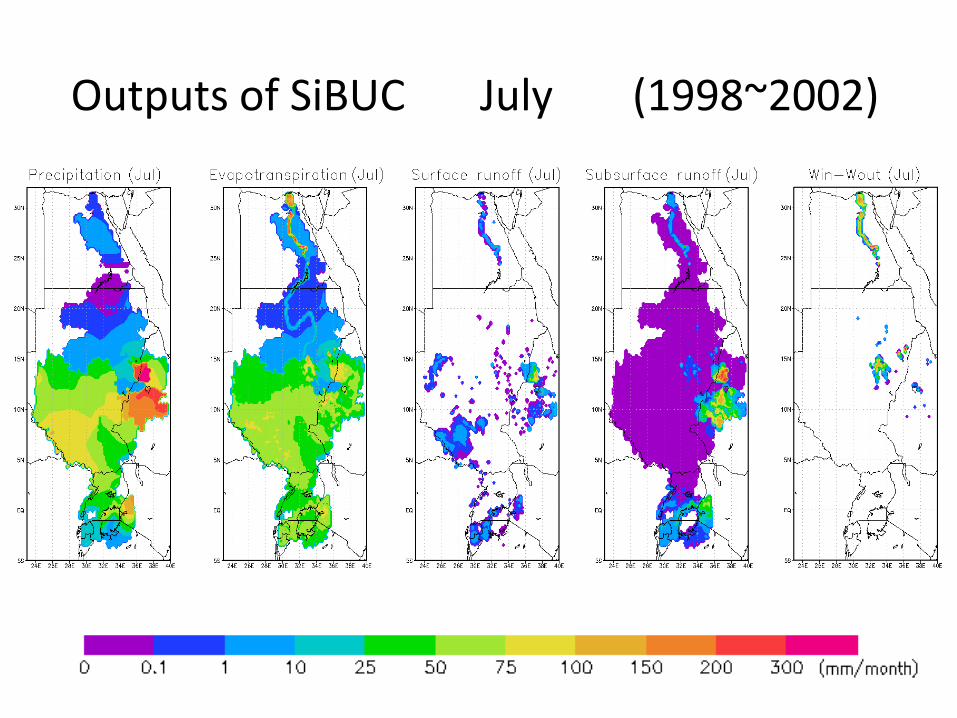
Outputs of SiBUC (1998~2002)July
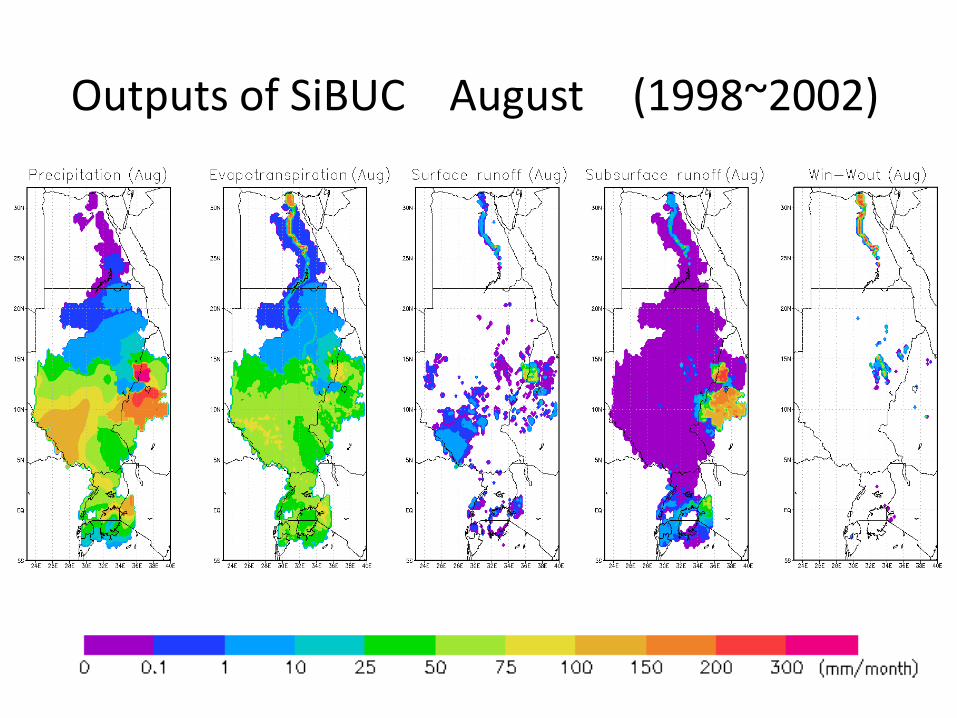
Outputs of SiBUC (1998~2002)August
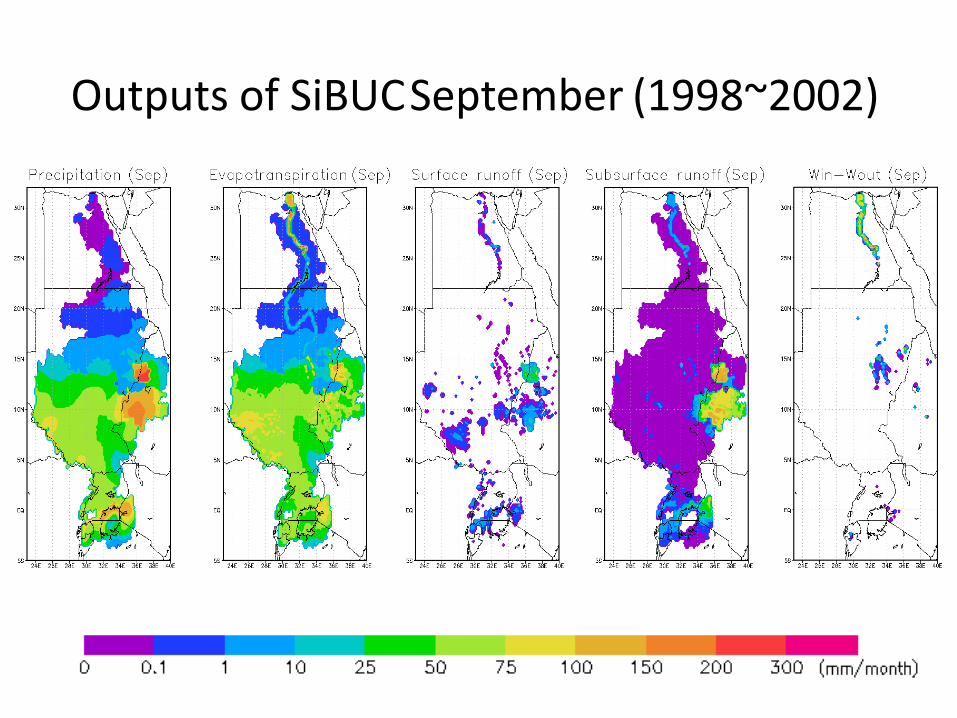
Outputs of SiBUC (1998~2002)September
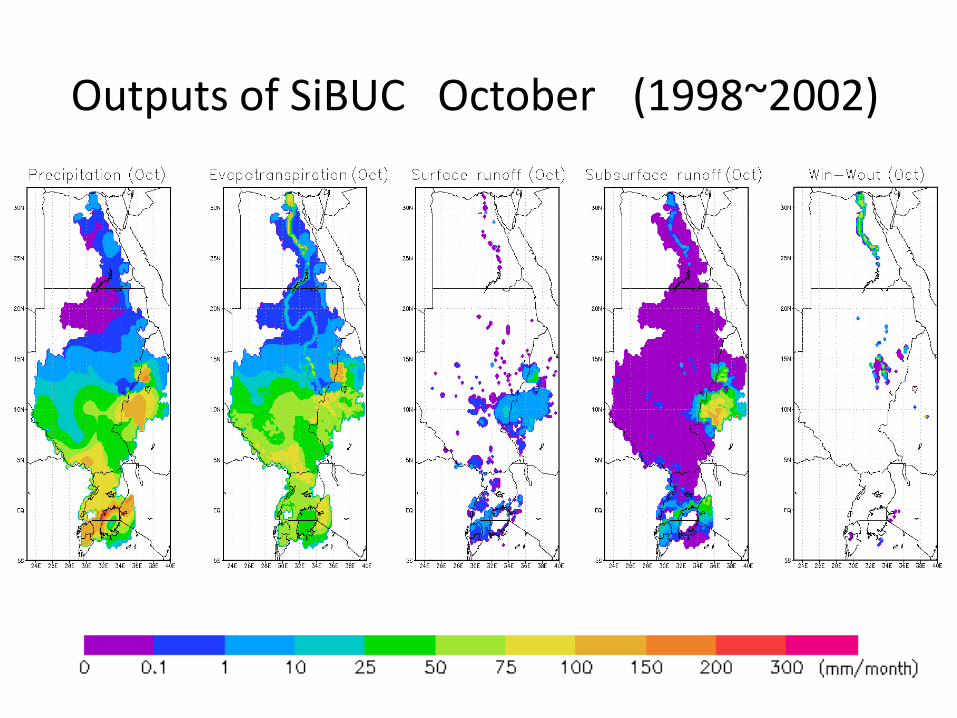
Outputs of SiBUC (1998~2002)October
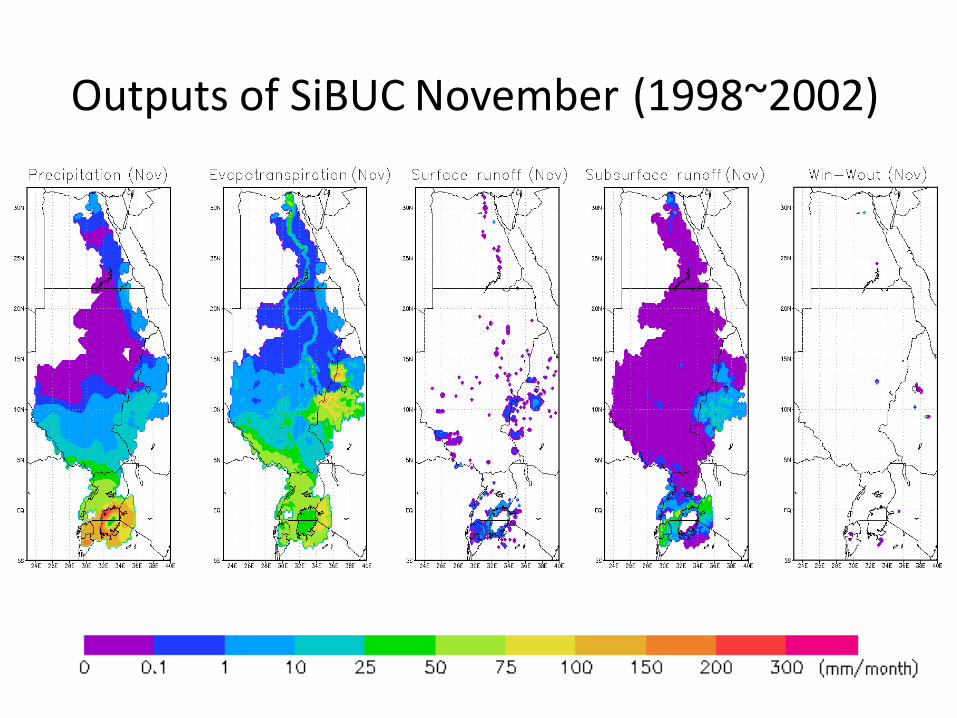
Outputs of SiBUC (1998~2002)November
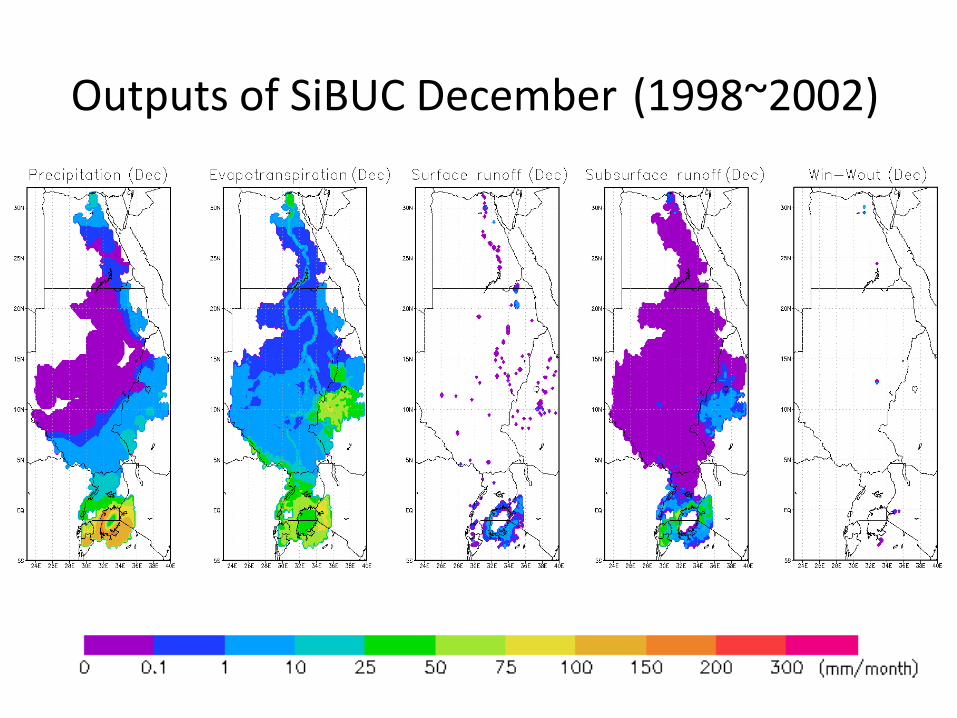
Outputs of SiBUC (1998~2002)December
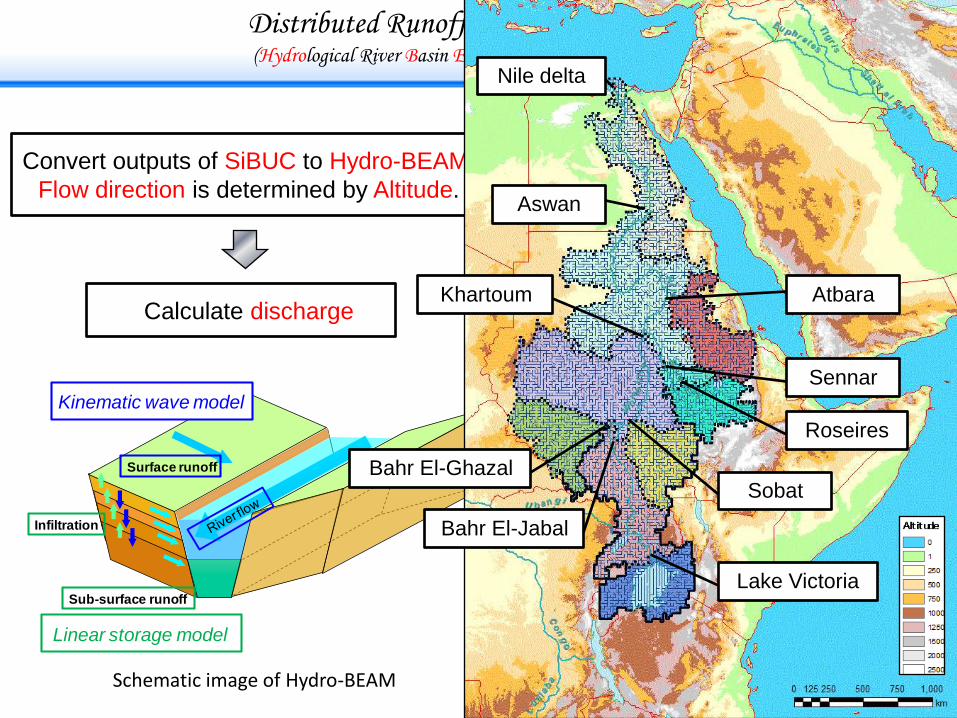
Convert outputs of SiBUC to Hydro-BEAM.
Flow direction is determined by Altitude.
Distributed Runoff Model Hydro-BEAM (Hydrological River Basin Environmental Assessment Model)
Calculate discharge
Surface runoff
Infiltration
Sub-surface runoff
Linear storage model
Kinematic wave model
(Kojiri, T., 2006)
Atbara
Sennar
Roseires
Sobat
Lake Victoria
Bahr El-Jabal
Bahr El-Ghazal
Khartoum
Aswan
Nile delta
Schematic image of Hydro-BEAM
25
Conflict Analysis
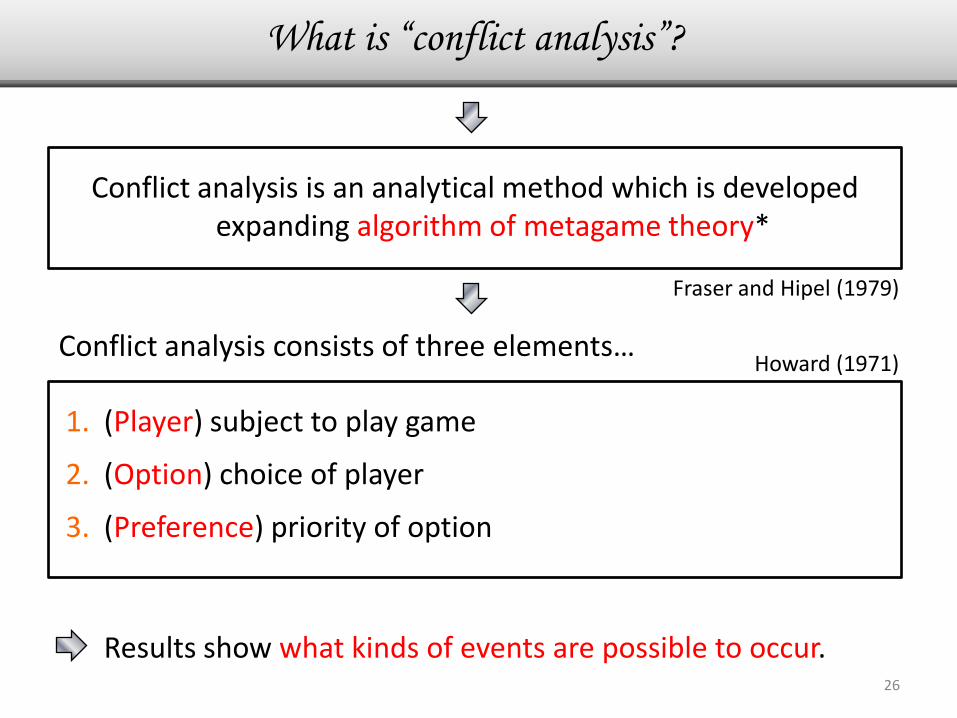
What is “conflict analysis”?
Conflict analysis is an analytical method which is developed expanding algorithm of metagame theory*
(Player) subject to play game
(Option) choice of player
(Preference) priority of option
2.
1.
3.
Conflict analysis consists of three elements…
26
Fraser and Hipel (1979)
Howard (1971)
Results show what kinds of events are possible to occur.
27
Egypt × × E × E × × × × × × × × × ×
Total stability r r r r r u u u u u u u u u u
Player's stability 3 6 9 12 15 2 5 8 11 14 1 4 7 10 13
Preference vector 3 6 9 12 15 3 6 9 12 15
Unilateral improvement 2 5 8 11 14
Ethiopia
Player's stability r r r u u u r r r u u u u u u
Preference vector 7 8 9 4 5 6 13 14 15 1 2 3 10 11 12
Unilateral improvement 7 8 9 7 8 9 13 14 15
4 5 6
Others
Player's stability r r r r r r u u u u u u r r r
Preference vector 10 11 12 13 14 15 1 2 3 4 5 6 7 8 9
Unilateral improvement 10 11 12 13 14 15
Stability Table (with third party)
(r: rational, s: sequential stability, u: unstable)
START
UI from
outcome q for
player A?
UI for B
from A’s UI?
All UIs
for B preferred to
q by A?
Another UI
from q for A?
q is rational for A (r)
q is unstable for A (u)
(Check for
simultaneous stability)
q is sequentially
stable for A (s)
END
NO
NO
NO
YES
YES
NO
YES
YES
q: Event
A(B): Player A(B)
UI: Unilateral Improvement
Algorithm of conflict analysis with example
28
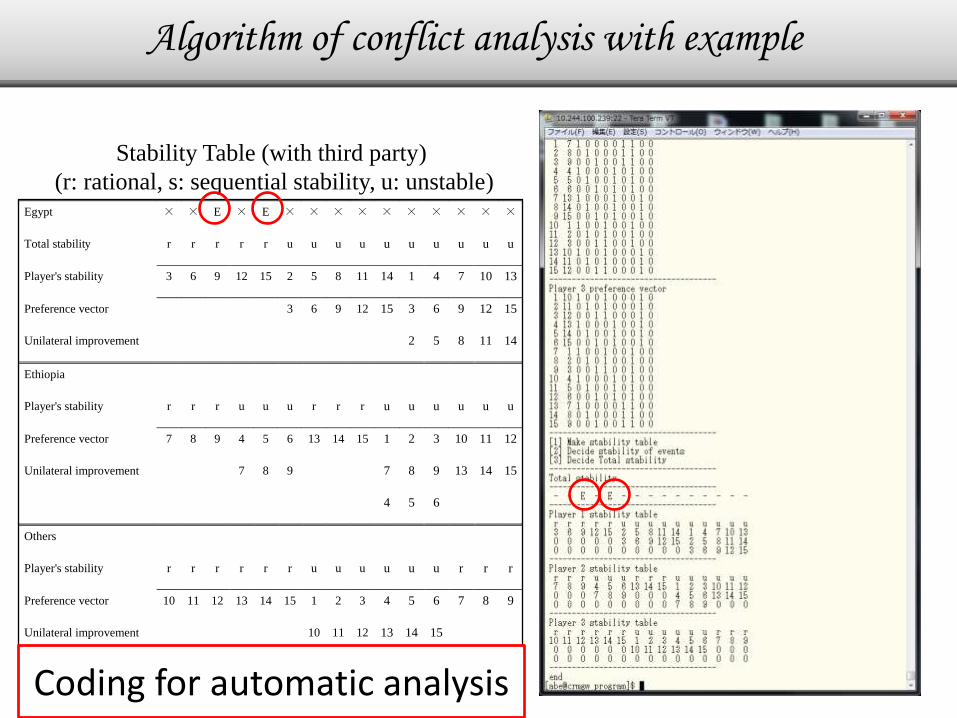
Egypt × × E × E × × × × × × × × × ×
Total stability r r r r r u u u u u u u u u u
Player's stability 3 6 9 12 15 2 5 8 11 14 1 4 7 10 13
Preference vector 3 6 9 12 15 3 6 9 12 15
Unilateral improvement 2 5 8 11 14
Ethiopia
Player's stability r r r u u u r r r u u u u u u
Preference vector 7 8 9 4 5 6 13 14 15 1 2 3 10 11 12
Unilateral improvement 7 8 9 7 8 9 13 14 15
4 5 6
Others
Player's stability r r r r r r u u u u u u r r r
Preference vector 10 11 12 13 14 15 1 2 3 4 5 6 7 8 9
Unilateral improvement 10 11 12 13 14 15
Stability Table (with third party)
(r: rational, s: sequential stability, u: unstable)
Coding for automatic analysis
Algorithm of conflict analysis with example

29
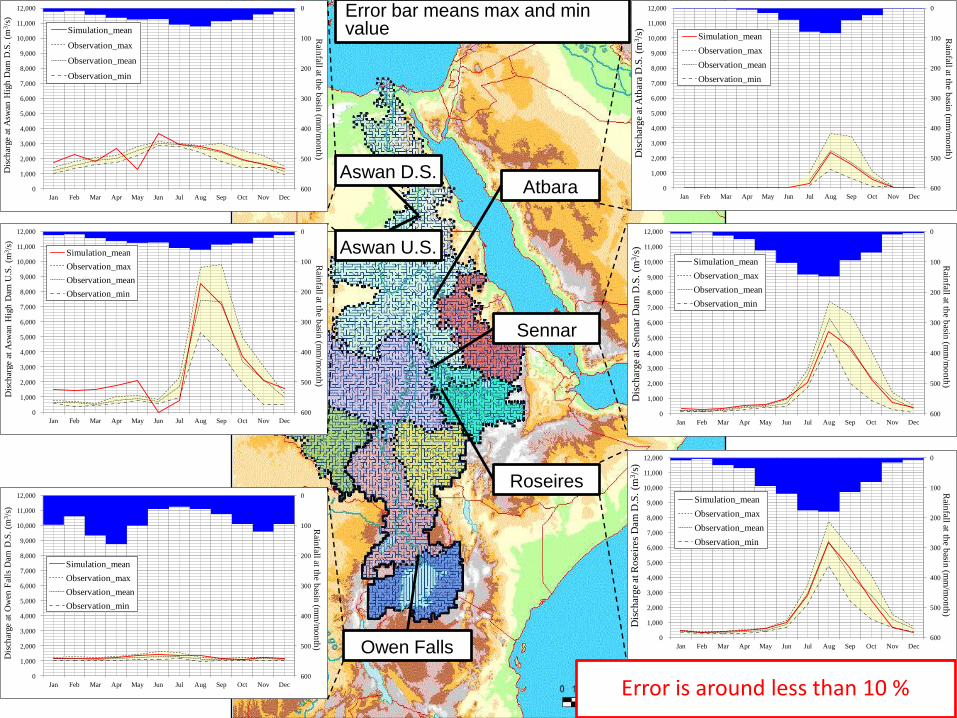
Verification in the Nile Basin
Atbara
Sennar
Owen Falls
Aswan D.S.
Roseires
Aswan U.S.0
100
200
300
400
500
6000
1,000
2,000
3,000
4,000
5,000
6,000
7,000
8,000
9,000
10,000
11,000
12,000
Jan Feb Mar Apr May Jun Jul Aug Sep Oct Nov Dec
Dis
char
ge
at A
swan
Hig
h D
am U
.S.
(m3/s
)
Simulation_mean
Observation_max
Observation_mean
Observation_min
Rain
fallat th
e basin
(mm
/mo
nth
)
0
100
200
300
400
500
6000
1,000
2,000
3,000
4,000
5,000
6,000
7,000
8,000
9,000
10,000
11,000
12,000
Jan Feb Mar Apr May Jun Jul Aug Sep Oct Nov Dec
Dis
char
ge
at A
swan
Hig
h D
am D
.S.
(m3/s
)
Simulation_mean
Observation_max
Observation_mean
Observation_min
Rain
fallat th
e basin
(mm
/mo
nth
)
0
100
200
300
400
500
6000
1,000
2,000
3,000
4,000
5,000
6,000
7,000
8,000
9,000
10,000
11,000
12,000
Jan Feb Mar Apr May Jun Jul Aug Sep Oct Nov Dec
Dis
char
ge
at O
wen
Fal
ls D
am D
.S.
(m3/s
)
Simulation_mean
Observation_max
Observation_mean
Observation_min
Rain
fallat th
e basin
(mm
/mo
nth
)
0
100
200
300
400
500
6000
1,000
2,000
3,000
4,000
5,000
6,000
7,000
8,000
9,000
10,000
11,000
12,000
Jan Feb Mar Apr May Jun Jul Aug Sep Oct Nov Dec
Dis
charg
e a
t R
ose
ires
Dam
D.S
. (m
3/s
)
Simulation_mean
Observation_max
Observation_mean
Observation_min
Rain
fallat th
e basin
(mm
/mo
nth
)
0
100
200
300
400
500
6000
1,000
2,000
3,000
4,000
5,000
6,000
7,000
8,000
9,000
10,000
11,000
12,000
Jan Feb Mar Apr May Jun Jul Aug Sep Oct Nov Dec
Dis
ch
arg
e a
t S
en
nar
Dam
D.S
. (m
3/s
)
Simulation_mean
Observation_max
Observation_mean
Observation_min
Rain
fallat th
e basin
(mm
/mo
nth
)0
100
200
300
400
500
6000
1,000
2,000
3,000
4,000
5,000
6,000
7,000
8,000
9,000
10,000
11,000
12,000
Jan Feb Mar Apr May Jun Jul Aug Sep Oct Nov Dec
Dis
ch
arg
e a
t A
tbara
D.S
. (m
3/s
)
Simulation_mean
Observation_max
Observation_mean
Observation_min
Rain
fallat th
e basin
(mm
/mo
nth
)
Error is around less than 10 %
Error bar means max and min value

31
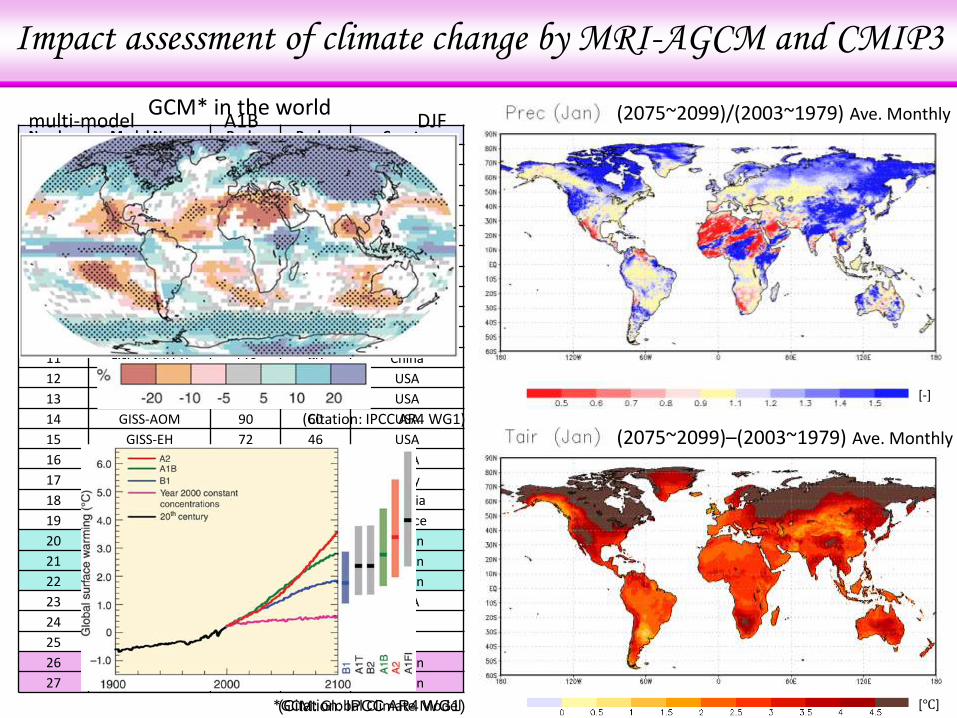
Assessment of future climate
by MRI-AGCM and CMIP3
Number Model Name Resl. x Resl. y Country
1 BCC-CM1 192 96 China
2 BCCR-BCM2.0 128 64 Norway
3 CCSM3 256 128 USA
4 CGCM3.1(T47) 96 48 Canada
5 CGCM3.1(T63) 128 64 Canada
6 CNRM-CM3 128 64 France
7 CSIRO-Mk3.0 192 96 Australia
8 CSIRO-Mk3.5 192 96 Australia
9 ECHAM5/MPI-OM 192 96 Germany
10 ECHO-G 96 48 Germany/Korea
11 FGOALS-g1.0 128 60 China
12 GFDL-CM2.0 144 90 USA
13 GFDL-CM2.1 144 90 USA
14 GISS-AOM 90 60 USA
15 GISS-EH 72 46 USA
16 GISS-ER 72 46 USA
17 INGV-SXG 320 160 Italy
18 INM-CM3.0 72 45 Russia
19 IPSL-CM4 96 72 France
20 MIROC3.2(hires) 320 160 Japan
21 MIROC3.2(medres) 128 64 Japan
22 MRI-CGCM2.3.2 128 64 Japan
23 PCM 128 64 USA
24 UKMO-HadCM3 96 73 UK
25 UKMO-HadGEM1 192 145 UK
26 MRI-AGCM3.1S 1920 960 Japan
27 MRI-AGCM3.2S 1920 960 Japan
*GCM: Global Climate Model(Citation: IPCC AR4 WG1)
GCM* in the world
(Citation: IPCC AR4 WG1)
multi-model DJFA1B
(2075~2099)–(2003~1979) Ave. Monthly
(2075~2099)/(2003~1979) Ave. Monthly
[-]
[℃]
Impact assessment of climate change by MRI-AGCM and CMIP3
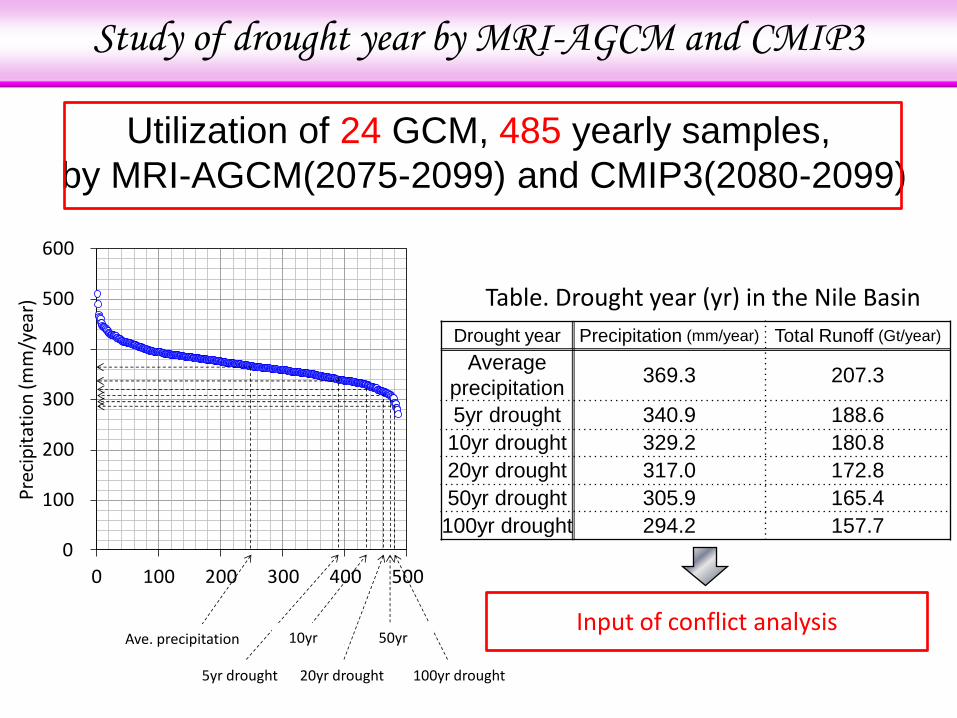
Study of drought year by MRI-AGCM and CMIP3
Drought year Precipitation (mm/year) Total Runoff (Gt/year)
Average
precipitation369.3 207.3
5yr drought 340.9 188.6
10yr drought 329.2 180.8
20yr drought 317.0 172.8
50yr drought 305.9 165.4
100yr drought 294.2 157.7
Table. Drought year (yr) in the Nile Basin
Utilization of 24 GCM, 485 yearly samples,
by MRI-AGCM(2075-2099) and CMIP3(2080-2099)
Input of conflict analysis
0
100
200
300
400
500
600
0 100 200 300 400 500
Pre
cip
itat
ion
(mm
/yea
r)
平均降水量
5年渇水
10年渇水
20年渇水 100年渇水
50年渇水Ave. precipitation
5yr drought
10yr
20yr drought
50yr
100yr drought
34
Water Resources Developmentin the end of 21st century
35
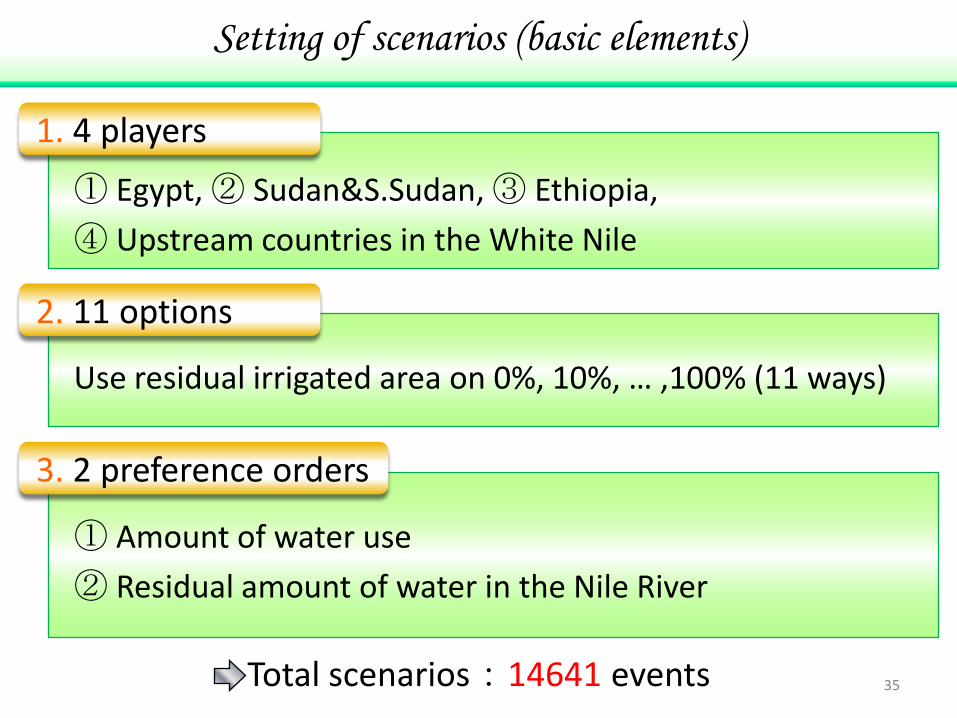
Setting of scenarios (basic elements)
1. 4 players
2. 11 options
3. 2 preference orders
① Egypt, ② Sudan&S.Sudan, ③ Ethiopia,
④ Upstream countries in the White Nile
Use residual irrigated area on 0%, 10%, … ,100% (11 ways)
① Amount of water use
② Residual amount of water in the Nile River
Total scenarios:14641 events
36
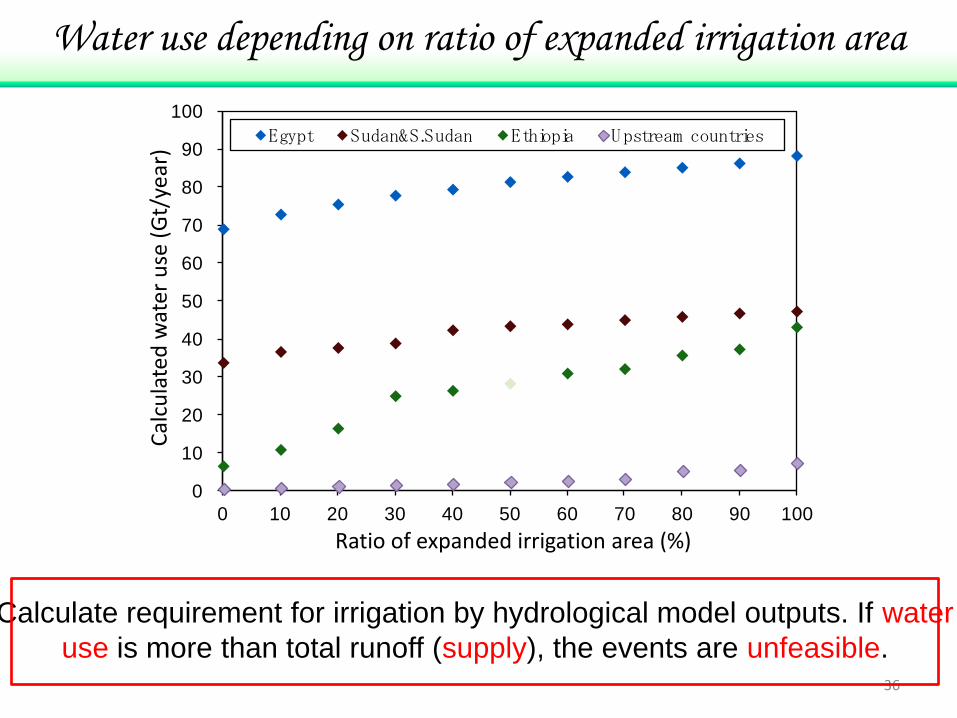
Water use depending on ratio of expanded irrigation area
Calculate requirement for irrigation by hydrological model outputs. If water
use is more than total runoff (supply), the events are unfeasible.
0
10
20
30
40
50
60
70
80
90
100
0 10 20 30 40 50 60 70 80 90 100
算定灌漑水使用量
(Gt/
ye
ar)
農業開発度(%)
Egypt Sudan&S.Sudan Ethiopia Upstream countries
Ratio of expanded irrigation area (%)
Cal
cula
ted
wat
er u
se (
Gt/
year
)
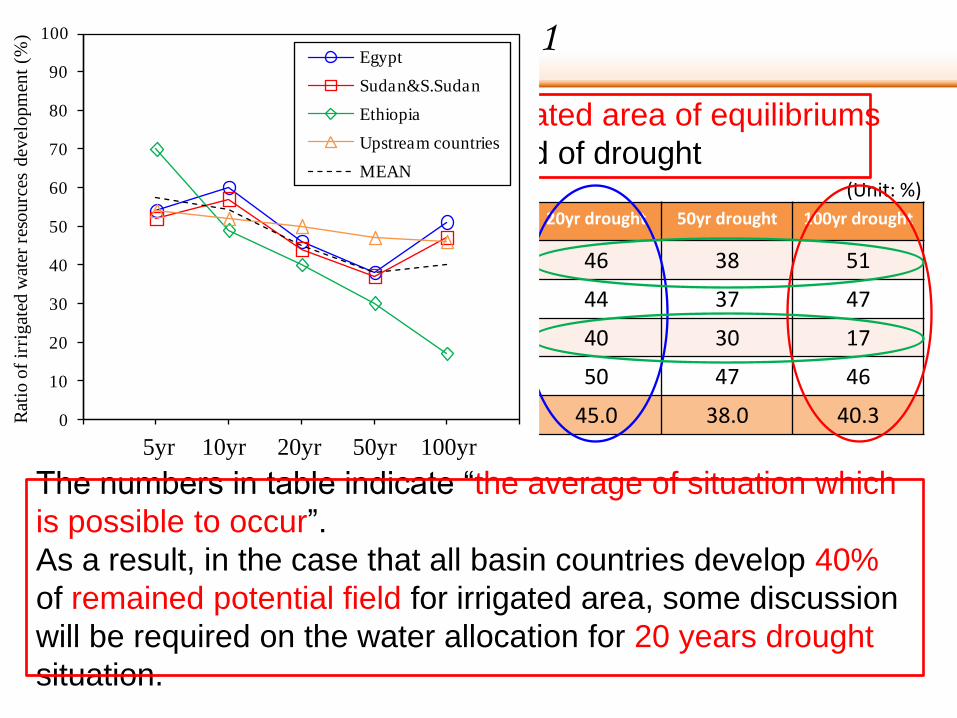
Averaged ratio of expanded irrigated area of equilibriums
in each return period of drought
Analysis 1
5yr drought 10yr drought 20yr drought 50yr drought 100yr drought
Egypt 54 60 46 38 51
Sudan&S.Sudan 52 57 44 37 47
Ethiopia 70 49 40 30 17
Upstream countries 54 52 50 47 46
Average 57.5 54.5 45.0 38.0 40.3
The numbers in table indicate “the average of situation which
is possible to occur”.
As a result, in the case that all basin countries develop 40%
of remained potential field for irrigated area, some discussion
will be required on the water allocation for 20 years drought
situation.
(Unit: %)
0
10
20
30
40
50
60
70
80
90
100
0 1 2 3 4 5 6
Egypt
Sudan&S.Sudan
Ethiopia
Upstream countries
MEAN
Rat
io o
f ir
rig
ated
wat
er r
eso
urc
es d
evel
op
men
t (%
)
5yr 10yr 20yr 50yr 100yr
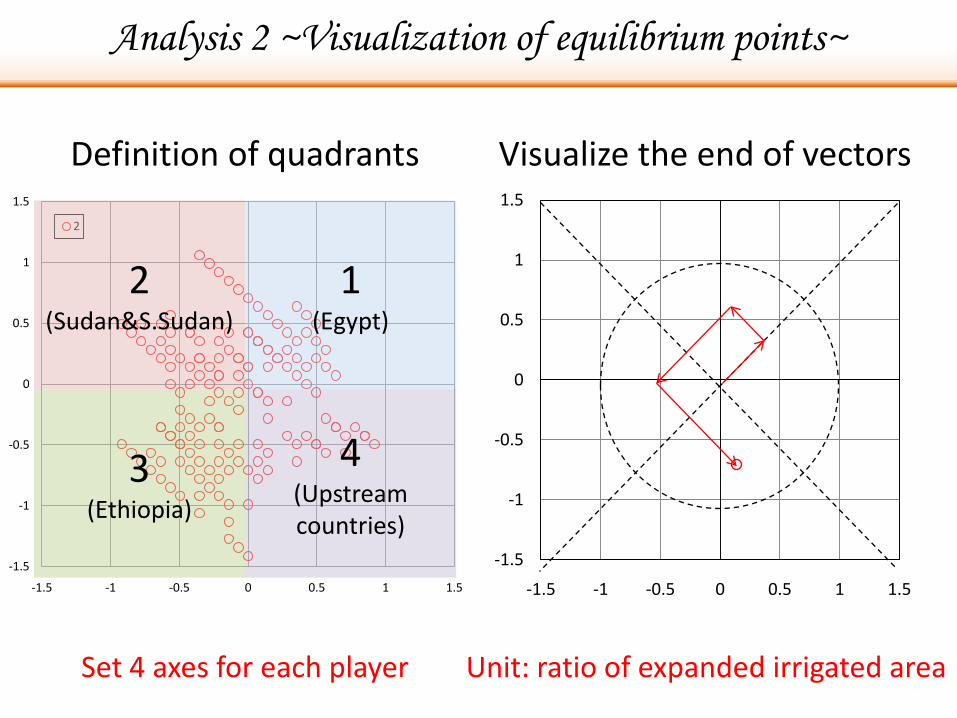
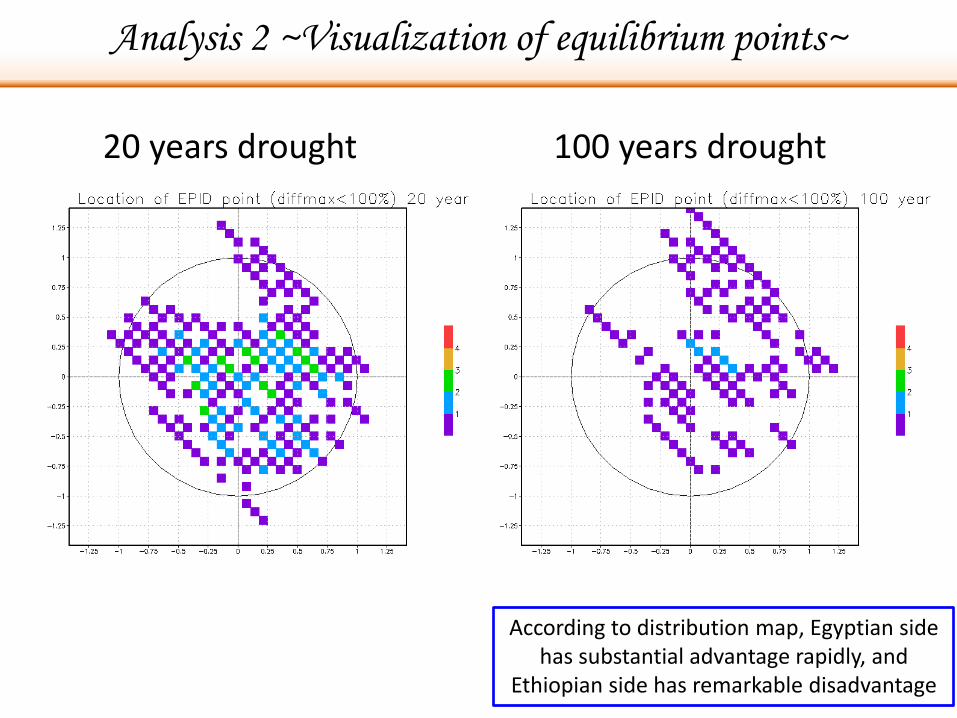
Analysis 2 ~Visualization of equilibrium points~
-1.5
-1
-0.5
0
0.5
1
1.5
-1.5 -1 -0.5 0 0.5 1 1.5
2
Definition of quadrants
1(Egypt)
2(Sudan&S.Sudan)
3(Ethiopia)
4(Upstream countries)
-1.5
-1
-0.5
0
0.5
1
1.5
-1.5 -1 -0.5 0 0.5 1 1.5
Visualize the end of vectors
Set 4 axes for each player Unit: ratio of expanded irrigated area
Analysis 2 ~Visualization of equilibrium points~
20 years drought 100 years drought
According to distribution map, Egyptian side has substantial advantage rapidly, and
Ethiopian side has remarkable disadvantage
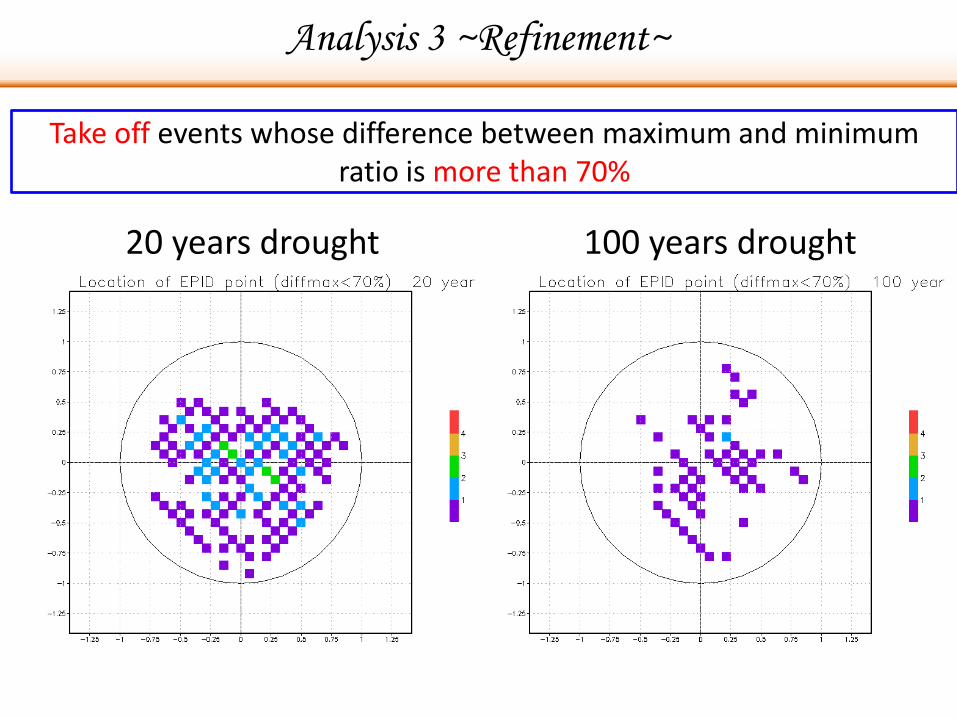
Analysis 3 ~Refinement~
20 years drought 100 years drought
Take off events whose difference between maximum and minimum ratio is more than 70%
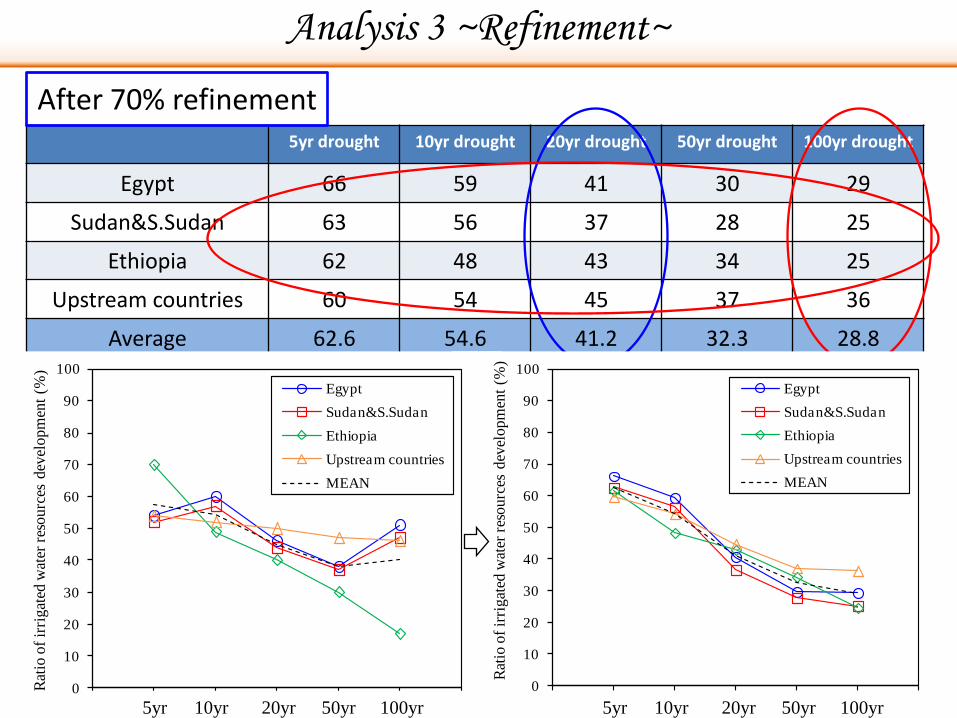
Analysis 3 ~Refinement~
5yr drought 10yr drought 20yr drought 50yr drought 100yr drought
Egypt 66 59 41 30 29
Sudan&S.Sudan 63 56 37 28 25
Ethiopia 62 48 43 34 25
Upstream countries 60 54 45 37 36
Average 62.6 54.6 41.2 32.3 28.8
After 70% refinement
0
10
20
30
40
50
60
70
80
90
100
0 1 2 3 4 5 6
Egypt
Sudan&S.Sudan
Ethiopia
Upstream countries
MEAN
Rat
io o
f ir
rig
ated
wat
er r
eso
urc
es d
evel
op
men
t (%
)
0
10
20
30
40
50
60
70
80
90
100
0 1 2 3 4 5 6
Egypt
Sudan&S.Sudan
Ethiopia
Upstream countries
MEAN
Rat
io o
f ir
rig
ated
wat
er r
eso
urc
es d
evel
op
men
t (%
)
5yr 10yr 20yr 50yr 100yr 5yr 10yr 20yr 50yr 100yr
1. Hybrid of Conflict Analysis and Hydrological Model is proposed and applied to the whole Nile River Basin for international river management.
Conclusion
42
2. Assessment of future climate is conducted in each sub-basin by MRI-AGCM and CMIP3.
3. Plural equilibrium points are analyzed. As a result, in the case of 20 years drought situation, 40% ofremained potential field for irrigated area is recommended as the maximum ratio for all basin countries. These recommended ratio depends on cooperative return period of drought.
43
Database of JE-HydroNet
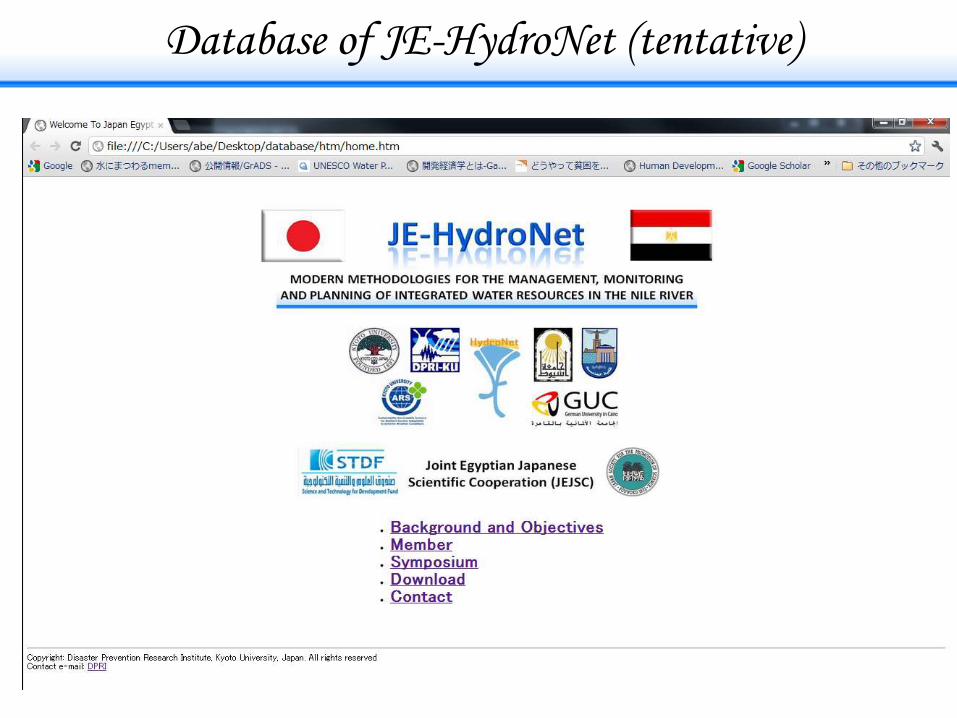
Database of JE-HydroNet (tentative)
45
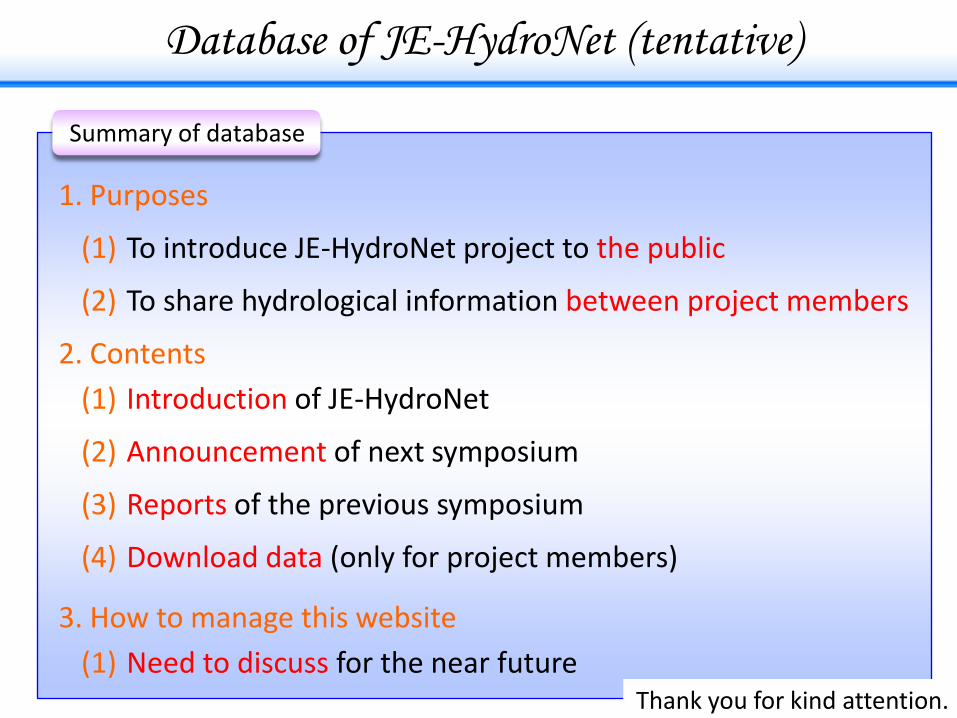
Database of JE-HydroNet (tentative)
Summary of database
1. Purposes
To introduce JE-HydroNet project to the public
To share hydrological information between project members(2)
(1)
2. Contents
3. How to manage this website
Introduction of JE-HydroNet
Announcement of next symposium(2)
(1)
Need to discuss for the near future(1)
Reports of the previous symposium
Download data (only for project members)(4)
(3)
Thank you for kind attention.
Related Documents