Preparatory work leading to a project proposal on V-NAMA in sub sector of energy efficiency in public buildings: Analysis report: Baseline, Energy savings potential and Barriers. 1 ANALYSIS REPORT: BASELINE, ENERGY SAVINGS POTENTIAL AND ENERGY EFFICIENCY PROGRAMMES IN PUBLIC BUILDINGS IN SOUTH AFRICA DRAFT Report developed by Sustainable Energy Africa for GIZ, February 2012

Welcome message from author
This document is posted to help you gain knowledge. Please leave a comment to let me know what you think about it! Share it to your friends and learn new things together.
Transcript

Preparatory work leading to a project proposal on V-NAMA in sub sector of energy efficiency in public buildings:
Analysis report: Baseline, Energy savings potential and Barriers.
1
ANALYSIS REPORT: BASELINE, ENERGY
SAVINGS POTENTIAL AND ENERGY
EFFICIENCY PROGRAMMES IN PUBLIC
BUILDINGS IN SOUTH AFRICA DRAFT Report developed by Sustainable Energy Africa for GIZ, February 2012

Preparatory work leading to a project proposal on V-NAMA in sub sector of energy efficiency in public buildings:
Analysis report: Baseline, Energy savings potential and Barriers.
2
Table of Contents Acronyms ................................................................................................................................... 3 Introduction ............................................................................................................................... 5 Section 1: Method towards developing a baseline and energy savings potential .............. 8
Proposed methodology ........................................................................................................... 8 Method results ........................................................................................................................ 9
Section 2: Energy Efficiency in Public buildings: experience and results to date ............. 11 Programmes and funding streams ......................................................................................... 11 Retrofitted public buildings to date ....................................................................................... 20 Benchmark Analysis............................................................................................................... 24
1. Medium sized multi storey office block analysis ............................................................ 26 2. Single Storey Multi Building Compound Analysis ........................................................... 29 3. Large multi storey integrated office block ...................................................................... 32
Audit summary ...................................................................................................................... 32 Costs ..................................................................................................................................... 33 Cross-check ........................................................................................................................... 33 Conclusions ........................................................................................................................... 36 Business models, contracting and legal issues ....................................................................... 39
Section 3: Public Building Energy Consumption Baseline Picture ...................................... 47 National Buildings ............................................................................................................... 47 Provincial Buildings ............................................................................................................. 52 Municipal Buildings ............................................................................................................. 55 Institutional Baseline Picture.............................................................................................. 59
Finance and funding .......................................................................................................... 64 Institutional capacity ......................................................................................................... 66 Metering and billing practice ............................................................................................. 68
Section 4: Macro analysis of potential for energy saving ................................................... 72 1. Municipal sphere ............................................................................................................... 72 2. Provincial sphere ............................................................................................................... 73 3. National sphere ................................................................................................................. 73 Summary ............................................................................................................................... 74 New build and major renovations.......................................................................................... 74 Voluntary building standards ................................................................................................. 75
Section 5: Barriers / Issues for consideration: initial analysis ............................................ 78 Awareness, political commitment and prioritisation.............................................................. 78 Institutional capacity ............................................................................................................. 79 Financing public sector energy efficiency and ESCOs ............................................................. 81 Policies and measures ........................................................................................................... 83 Learning and replication ........................................................................................................ 84
Baseline Conclusion ................................................................................................................ 85 References ................................................................................. Error! Bookmark not defined. Interviews .................................................................................. Error! Bookmark not defined.

Preparatory work leading to a project proposal on V-NAMA in sub sector of energy efficiency in public buildings:
Analysis report: Baseline, Energy savings potential and Barriers.
3
Acronyms
CFL Compact Fluorescent Light
CoCT City of Cape Town
DANIDA Danish International Development Agency
DBSA Development Bank of SA
DEA Department of Environmental Affairs
DOE Department of Energy
DORA Division of Revenue Act
DPW Department of Public Works
DSM Demand-Side Management
DTI Department of Trade and Industry
EE Energy Efficiency
EEDSM Energy Efficiency and Demand Side Management
EETMS Energy Efficiency Target Monitoring System
EMM Ekurhuleni Metropolitan Municipality
EMS Energy Management System
ERC Energy Research Centre
ESCO Energy Service Company
GBCSA Green Building Council of South Africa
GHG Greenhouse Gas
GIZ German Development Cooperation
GWh GigaWatt-hour
HVAC Heating, Ventilation and Cooling
IDC Industrial Development Corporation
IDM Integrated Demand Management
IDM RMR Integrated Demand Management Residential Mass Rollout
IDT Independent Development Trust
ISO International Organisation for Standardization
JESTT Joint Energy Statistics Task Team
kW KiloWatt
kWh KiloWatt-hour
KZN KwaZulu-Natal

Preparatory work leading to a project proposal on V-NAMA in sub sector of energy efficiency in public buildings:
Analysis report: Baseline, Energy savings potential and Barriers.
4
LED Light-Emitting Diode
M&V Monitoring and Verification
MFMA Municipal Financial Management Act
MoU Memorandum of Understanding
MRV Measurement, Reporting and Verification
MTEF Medium-Term Expenditure Framework
MW MegaWatt
NAMA Nationally Appropriate Mitigation Action
NCCRS National Climate Change Response Strategy
NEEA National Energy Efficiency Agency
NEES National Energy Efficiency Strategy
NERSA National Energy Regulator of South Africa
NGO Non-Government Organisation
NMBMM Nelson Mandela Bay Metropolitan Municipality
PEB Public & Education Building
PPP Public Private Partnership
PRASA Passenger Rail Agency of South Africa
SAEDES South African Energy and Demand Efficiency Standard
SALGA South African Local Governments Association
SANEDI South African National Energy Development Institute
SDBIP Service Delivery Budget Implementation Plan
SEA Sustainable Energy Africa
SEED Sustainable Energy for Environment and Development
SEM Shared Energy Management
SPP Standard Product Programme
SWH Solar Water Heater
UCT University of Cape Town
UEMP Urban Environmental Management Programme
UNIDO United Nations Industrial Development Organisation
V-NAMA Vertically integrated Nationally Appropriate Mitigation Action
WEC World Energy Council
WWTW Waste Water Treatment Works
ZAR South African Rands

Preparatory work leading to a project proposal on V-NAMA in sub sector of energy efficiency in public buildings:
Analysis report: Baseline, Energy savings potential and Barriers.
5
Introduction
This report provides a compilation and analysis of information relating to public building energy
efficiency in South Africa. It has been commissioned by the Department of Environmental Affairs (DEA) of
the Republic of South Africa as part of its collaboration with GIZ in the areas of climate change,
sustainable development and a just transition to a lower carbon economy and society. The report will
inform the development a project proposal on vertically integrated NAMA in the sub-sector of energy
efficiency in public buildings (owned and leased), thereby supporting DEA to respond to its mandate and
responsibilities for the implementation of the national Climate Change Response Policy.
Public sector facilities and operations are recognised globally as having significant opportunities for
energy efficiency improvements (WEC, 2010). Benefits include lower energy costs for government and
public sector stakeholders, reduced demand for new generation and investments in energy supply and
transmission and distribution systems. There are also benefits to be reaped from the leadership role of
the public sector – this provides opportunities to demonstrate and disseminate information about
energy efficiency measures, the public sector can pilot interventions, increase awareness and confidence
in new technologies and business approaches, as well as stimulate the market through its substantial
purchasing power.
Background
The South African Climate Change Response Policy (2011) identifies Near-term Priority Flagship
Programmes. These have been identified as an integral part of the implementation of the policy. The
flagship on energy efficiency and energy demand management is one that has high potential for
emission reduction. It has also been identified that Government will be able to lead by example through
improving energy efficiency in public buildings. The development of a programme to implement public
building efficiency will also provide important pilot opportunities and real experience around multi-level
implementation across different spheres of government.
This preliminary report aims to provide key information on baseline, energy saving potential and barriers
for a vertically integrated NAMA in the public building sector. A final report will be developed that will
further include recommendations towards a NAMA programme. These will aim to address identified
barriers and maximise opportunities for greatest energy savings.
Scope of work and approach

Preparatory work leading to a project proposal on V-NAMA in sub sector of energy efficiency in public buildings:
Analysis report: Baseline, Energy savings potential and Barriers.
6
Public sector activities and operations cover a variety of end-use sectors, including buildings, transport,
service provision and infrastructure development. A major part of the public sector energy use results
from energy used by public buildings for lighting, heating, cooling and ventilation, as well as electrical
appliances in these buildings. In South Africa the data still requires enormous work in order to be
presented with any confidence. The last official national figures for public buildings were published in
2000 (and not since then, it has to be noted, due to concerns as to data reliability). These figures indicate
public buildings to be around 1,33% of total final end use energy consumption1.
This report will focus on the built environment only. Measures for efficiency include simple, low cost
measures, such as lighting, as well as more complex full building retrofits and changes in user behaviour.
The scope of this report considers public buildings within national, regional and local government
authorities, and including various facilities relating to public services (offices, policing and defence,
education, healthcare and social housing) and has included an overview of parastatal government
agencies. The report considers buildings utilised by the public sector whether they are owners or
occupiers, or indeed, landlords.
There are areas of scope that would need to be clarified in a public sector building programme:
• Would the parastatal sector be included? Eskom, for example, challenged whether they fall
within the scope of a public sector programme;
• Does the public sector ‘scope’ include the government owned residential sector? A number of
public owned buildings, particularly in municipalities, but also in the national prison, military
and hospital complexes, are social housing, hostels and government employee residences. The
eThekwini hostels account for some 30% of total electricity consumed within the public
building sector2.
• Should the programme include privately owned buildings occupied by the public sector, and,
conversely, publicly owned buildings occupied by the private sector.
Some pointers or recommendations on these issues will be considered in Part II of the report.
1 More detail can be found in Section 3 and 4. International literature notes that this information is not readily
found, but a broad benchmark is for the public sector to form 2-5% of total final end consumption in a country. The
last reported public building energy consumption figures in South Africa are found in the 2000 DME National Energy
Balance. The method for calculating these figures is unknown (for example, do they include municipal water
pumps, etc or just built infrastructure), and given current data on public buildings, this report cannot verify the
accuracy of these figures at all (it should be noted also that post 2000 this level of disaggregation was done away
with as people felt the data was too unreliable), however, they are still informative. In 2000 final end use
consumption of energy was 2 296PJ and public buildings accounted for 30.5PJ, thus 1,33%. 2 Based on data (not publically available) used in the eThekwini Greenhouse Gas Inventories 2010

Preparatory work leading to a project proposal on V-NAMA in sub sector of energy efficiency in public buildings:
Analysis report: Baseline, Energy savings potential and Barriers.
7
The report has the following main sections:
PART 1: Baseline establishment and barrier analysis
1. Method towards developing a baseline and energy savings potential
Here the report details how the research team went about building up the quantitative and
qualitative picture on public building energy efficiency – past and future.
2. Energy Efficiency in Public buildings
The section outlines the experience and results to date across the spheres of government.
Results are analysed to develop benchmarks and/ or trends.
3. Setting a Baseline
This component of the report moves towards developing a quantitative baseline, drawing on
building stock figures and typologies and electricity consumption. It also provides an overview of
the existing institutional framework, or ‘baseline’.
4. Energy Savings Potential
A synopsis of potential energy saving, based on results to date is provided. However, this is
enormously constrained by the ability to establish a baseline given current data levels.
5. Barriers Analysis
A synopsis of the major barriers facing the achievement of savings in public building energy
efficiency is provided. This will inform Part 2 of the report which will provide recommendations
towards addressing these issues and developing a V-NAMA programme in the sub-sector of
public building efficiency.
PART II: Recommendations towards the development of a V-NAMA project in the subsector of building
energy efficiency
1. Selecting a target
Geographic areas, spheres of government, types of buildings and EE interventions are assessed
in relation to V-NAMA criterion in order to provide recommendations as to programme target
and sequential rollout.
2. Business Model identification
The various business models, procurement options and financing streams for building EE retrofits
in the public sector are evaluated based on local experience and international best practice.
3. Programme design
Key barriers to EE building retrofit in the public sector identified in Part I of the report are
addressed and key elements of a Public Building EE Programme are extracted.

Preparatory work leading to a project proposal on V-NAMA in sub sector of energy efficiency in public buildings:
Analysis report: Baseline, Energy savings potential and Barriers.
8
Section 1: Method towards developing a baseline and energy savings potential
It is globally recognised that few countries have any level of detailed breakdown of public sector energy
consumption3. This is not surprising given the challenges of multiple authorities involved, changing
administrative boundaries, different recording approaches in different authorities and often an absence
of metering practice.
This report is a pioneering effort to pull together available information on the public building sector in
South Africa. Developing this baseline will involve building a picture ‘from the bottom up’ and ‘from the
top down’ (see appendices for detailed steps in these processes). The process, given current data levels,
will by necessity be iterative – as more data becomes available, so the picture will emerge more fully.
Proposed methodology
The bottom up, or ‘micro’ approach will amass data and information from sample municipalities,
provinces, national departments and parastatals on number and type of buildings, electricity
consumption (where available) per square meter or facility/ building type and assess interventions
undertaken – what technologies/interventions were deployed and the savings achieved.
The ‘micro’, bottom up exercise data analysis aims to:
a. provide insight into the results of retrofit activities to date,
b. arrive at indicative information on the number of public buildings across different size
municipalities, provinces, regions,
c. provide a really detailed analysis of the kind of savings that can be achieved in typical building
types and/or through typical interventions.
The top down, or ‘macro’ step looks at developing a baseline of electricity consumed by public buildings
at all levels/spheres of government. This involves:
3 The World Energy Council 2010 notes: “Data on public sector energy use is limited in many countries. Although
sectoral energy charts have been drawn up for years in many countries, the public sector is often not analysed as a
separate entity. … Consequently, few detailed breakdowns of public sector energy use are currently available and
are often not comparable due to different boundaries. The range generally considered is 1% to 5% of total final
energy consumption and 2 – 10% of the energy consumption of buildings…” WEC, 2010: EE: A Recipe for success,
p98-99; also noted in ESMAP, p4.

Preparatory work leading to a project proposal on V-NAMA in sub sector of energy efficiency in public buildings:
Analysis report: Baseline, Energy savings potential and Barriers.
9
a. an analysis of the typical proportion of ‘own’ electricity consumption that is consumed in
buildings at the municipal level and an extrapolation of that figure to a national municipal public
building consumption ‘baseline’ figure.
b. Obtaining (where it exists) total electricity consumption by buildings (per annum) from DPW and
provincial government.
Drawing on both ‘pictures’ and based on the known savings potentials of various building interventions
(as per Eskom data and international standards) a savings potential will be extrapolated for the country
(broken down into different levels of government). This will be indicative only.
The baseline exploration also provides an overview of the implementation models that have been
successfully deployed (identifying funding sources, business models) and will provide an indication of the
typical savings/investment that are emerging as benchmarks.
Method results
Given time constraints, the data collated, though extensive, was necessarily limited (promises of
information require extensive follow up to reap results) and the approach has been to pursue areas
where there was known to be information and data. Obviously some will have been overlooked.
Hopefully this report will stimulate the process of bringing more existing information to the fore.
The data exercise quickly revealed that, while there is a large volume of data, there is very little data
consistency, making it very hard to pursue the methodology through to a national baseline. This is
detailed in the body of the report, but relates principally to:
• Building registries are not consistent across authorities. At this stage there is no registry of
buildings by building typology, so that the exercise of building up a baseline by establishing
consumption averages by building type is not possible.
• Energy consumption of buildings in not recorded against the actual infrastructure, for example,
in many instances the entire erf would be on one meter (within the erf there may be a number
of different physical structures and appliances: residential, offices, workshops, pump stations,
etc).
• Energy consumption may be measured against a building, but not recorded in the same building
identification system as the buildings asset registry (so difficult to align the two).
• Developing a percentage range of public sector consumption as a portion of municipal total
consumption proved difficult, partly due to the challenge to get Eskom data into municipal

Preparatory work leading to a project proposal on V-NAMA in sub sector of energy efficiency in public buildings:
Analysis report: Baseline, Energy savings potential and Barriers.
10
totals; but also the paucity of data on internal energy consumption in municipalities, where
building consumption data is often inclusive of waste water and water treatment plant
equipment.
• South Africa lacks data on the building sector or service sector, from which international
benchmarks may have produced an indicative public building total (WEC, 2012, p 99) (although it
is also acknowledged that energy proportions from colder, Northern country buildings may
render use of these benchmarks null and void).
What the exercise does reveal is the type of data, or data consistency that would need to be place in
order to develop the kind of disaggregation necessary to arrive at a national baseline that has a
reasonable degree of accuracy.

Preparatory work leading to a project proposal on V-NAMA in sub sector of energy efficiency in public buildings:
Analysis report: Baseline, Energy savings potential and Barriers.
11
Section 2: Energy Efficiency in Public buildings: experience and results to date
Programmes and funding streams4
The Department of Public Works (DPW) initiated the first public building retrofit programmes in the
country with an ESCO shared savings scheme programme that began in 1997. The programme was
initiated by a champion, Ace Ackerman. The programme was designed so that the ESCO assumed all risk,
and raised the capital. A first tender went out for the Pretoria region (ESCO not known by authors) and
this was followed by the appointment of ESCO Shared Energy Management (SEM) in the Western Cape
region. Here SEM identified 10 – 12 buildings, including Parliament and Pollsmoor prison, and built on
this up to a total of about 30-35 facilities. SEM was also appointed also in Gauteng region and the re-
tendered Pretoria contract. The Cape region led, embarking on contracts in 1997, other regions only
began in 2000 and 2003. This set of programmes concluded in 2010.
Capital was raised by SEM from commercial banks, with the business owners putting their houses up as
collateral5. Their payback was derived from DPW payments off the savings realised (at set percentages
ranging from 40 – 60%6). Contracts were of 7 – 10 year duration. No external M&V was done, and figures
on savings presented to parliament are not clear enough to make conclusions on the intervention
results7.
In response to the electricity crisis National Treasury allocated funds to DPW in 2008/9 and 2009/10 to
undertake efficiency retrofits. In the financial years of 2010/11 and 2011/12 National Treasury again
allocated funds to DPW, through the MTEF, DPW to undertaken further efficiency retrofits. These
contracts were given to the IDT and done as a straight capital funded project. Projects were done in the
Eastern Cape, Northern Cape, and Mpumalanga Provinces.
In 2010-11 a new set of shared saving contracts were embarked on, this time with the ESCO Zamori, in
the regions of Western Cape, KwaZulu-Natal, North West and Limpopo. These projects have only
4 A summary table of all can be found in Section 3 Baseline analysis
5 Pers. comm. Patrick Costello, Western Cape Manager, SEM, Feb 2013.
6 DPW presentation to Parliament (Public Works PPC), October 2012; pers. comm. Ossie Lamb, Western Cape
Regional DPW office, Feb 2012. 7 As noted, some results were obtained from SEM, and further work with SEM could probably get all of these
savings figures. The presentation by DPW to parliament does not clarify time periods, whether results presented
are annual or cumulative figures, and the figures themselves seem possibly to be out by order of magnitude: DPW
presentation to Parliament, October 2012. A detailed look at this is provided in Section 3: Baseline picture.
Preparatory work leading to a project proposal on V-NAMA in sub sector of energy efficiency in public buildings:
Analysis report: Baseline, Energy savings potential and Barriers.
12
recently got underway. The experience, according to the Western Cape Regional manager of the
contract, is that they are progressing well8. As with the earlier SEM contracts, these are shared-savings
schemes, in which the ESCO is responsible for upfront capital. ESCOs are now, however, able to draw on
the Eskom IDM funds, which will enormously facilitate the financing9.
The DPW programme has been the most extensive in the country and extremely valuable experience has
been developed. Initially the shared savings model caused some concern within the bid evaluation
committee. Presentations and inputs explaining the model were done and this committee was happy
with that the procurement model was acceptable within the terms of the Public Finance Management
Act (PFMA)10. An important finding is that EE retrofitting is an ongoing business, due to technology
changes and efficiency ‘leakage’: in the first SEM contracts a number of efficient lighting options were
not undertaken as the technologies were too expensive and paybacks too long. These technologies are
now the most viable in terms of savings, with the market prices having substantially decreased. The
experience also has been that, over the course of ten years, new fittings are lost, stolen, replaced with
inefficient technologies and that buildings done ten years previously, require retrofitting again.
One concern has been that the programme has not engaged independent M&V (the ESCOs themselves
of course engage in thorough baseline development and monitoring in order to prove savings). This is
under development, emanating from the DPW-DOE Memorandum of Understanding relating to building
EE. As part of energy efficiency interventions in public buildings there is also currently a process to
develop a system to introduce energy performance certification in public buildings.
Provincial efforts around EE in public buildings seem to be limited11, although there seems to be an
interest to engage with the issue from within Environment/climate, Health and/or Economic
development units. The only provincial ‘programme’ found in this study is that of the Western Cape
Health Department. Here Engineering Services have worked to retrofit all (except Riversdale) hospitals
with energy efficient water heating (mostly heat pumps) and other interventions such as painting roofs
white to improve air temperature for HVAC systems, working to utilise open windows and trying to get
energy efficient dimensions into new build design for clinics and hospitals. The programme has collated
8 Pers. comm. Ossie Lamb, Western Cape Region, DPW, Feb 2013.
9 The details of the Zamori contracts have not been established at this stage, for example which IDM fund is drawn
on, etc. 10
Pers. comm. Ossie Lamb, Western Cape DPW, Feb 2013. 11
As engagement with Western Cape Health department indicated, there may be pockets of work taking place that
are simply no known within the typical ‘energy’ circles.

Preparatory work leading to a project proposal on V-NAMA in sub sector of energy efficiency in public buildings:
Analysis report: Baseline, Energy savings potential and Barriers.
13
data for all hospitals and takes responsibility for ongoing ‘energy management’ through monitoring of
consumption against benchmarks12
.
Energy efficiency retrofits in the local government sphere was kick started by funding from the SEED
Programme, run by Sustainable Energy Africa and ICLEI’s Cities for Climate Protection Programme. In
2003 the City of Cape Town did a retrofit of their Parow office building, and Tshwane of their
Minimunitoria building. These initial metro retrofits were then followed by years of trying to get the
ESCO shared savings model to work, but being frustrated by conditions of the MFMA and conservative
finance departments13. DANIDA, through its Urban Environmental Management Programme (UEMP)
fund, then supported retrofits in City of Cape Town and Ekurhuleni, around 2009-10. These retrofits
undertaken have been extremely important in demonstrating notable benefits and savings. The buildings
funded by UEMP in City of Cape Town provided the most substantial data for this study; in Ekurhuleni a
53% energy saving was realised from these initial retrofits, with over 320 000 kWh saved per year. The
payback time was approximately 1.2 years14
.
Local government has also allocated ‘own’ funding to energy efficiency retrofits15
. They have struggled to
use the shared savings investment model, and so the majority of own funding has been through
budgetary allocations16
rather than ‘ring-fenced savings’ from efficiency’17
. The only municipality that has
developed a standing line item (as opposed to ad hoc budgetary allocations) for efficiency is Ekurhuleni
which has created its own Energy Efficiency fund through ‘ring fencing’ a portion of its electricity
revenue. These monies are captured and reallocated, through the budget, to energy efficiency activities.
A detailed outline of this is provided in the case study below: Case study: Ekurhuleni Metropolitan
Municipality: Local government funded energy efficiency.
12
Pers. comm. Andrew Cunninghame, Chief Engineer, Western Cape Department of Health 13
Minutes of meetings between City of Cape Town, City of Johannesburg, DPW; and legal opinions undertaken
during this time attest to the struggle to find an approach that could work within the local government framework. 14
the detail from Ekurhuleni is still being tracked down (due to staff turnover, different department involved, etc),
and so doesn’t, unfortunately, form part of the detailed, baseline analysis. The audit and retrofit were undertaken
by a Danish Energy Management Company and a simple automatic building management timer system resulted in
notable savings (the building was notoriously found to be consuming more energy over weekends and at night due
to HVAC running full time with open windows, etc). Pers. comm. Tshilidzi Thenga/Fred Fryer, EMM Electricity
Department. 15 The City of Cape Town, Ekurhuleni, refer; possibly others. 16
For example, the City of Cape Town’s allocation of R21 million for the retrofit of its civic centre. Pers comm.
ERMD, Dec 2012. 17
Funding of energy efficiency throughout government also takes place through ongoing Buildings Maintenance
budgets (for e.g. the chillers and lifts in the Cape Town civic centre were retrofitted through a Buildings
Maintenance budget entirely separate to any specific energy efficiency retrofit).

Preparatory work leading to a project proposal on V-NAMA in sub sector of energy efficiency in public buildings:
Analysis report: Baseline, Energy savings potential and Barriers.
14
Case study: Ekurhuleni Metropolitan Municipality: Local government funded energy efficiency
Maintenance and refurbishment of electricity re-distribution assets was under the political spotlight in
2005 due to rapidly dwindling available power supplies. Ekurhuleni Municipality approached the National
Energy Regulator of South Africa (NERSA) to allow them to build a maintenance and refurbishment
portion in their tariff. Legislation around re-distribution does allow for this and NERSA gave the go-ahead
for a pilot exercise to test the viability and feasibility of the approach.
In 2009, Ekurhuleni council (backed by council approved policy) agreed to ‘ring fence’ a further portion of
electricity revenue; this time specifically earmarked for energy efficiency. NERSA approved the set up
(largely an internal matter relating to Ekurhuleni finance management) which proposed an allocation of
0.25% of every unit of electricity sold. NERSA conditions stipulate that the amount has to be ring-fenced,
spent for efficiency purposes only and must undergo an audit process every year. Furthermore, targets
relating to the funds had to be integrated into the performance management of staff. These targets are
captured in the Service Delivery Budget Implementation Plan (SDBIP) and linked to performance
bonuses, creating strong motivation amongst staff to achieve targets. The amount varies annually,
depending on sales, but is usually in the region of R25 million18
. Existing legal mechanisms were found to
allow a separate fund to be created and to transfer any unspent funds over to the next financial year19.
Policy and capacity to support energy efficiency rollout was also under development during this time. A
State of Energy (undertaken in 2004) informed the development of an Energy and Climate Change
Strategy, adopted in 2007. Ekurhuleni developed an Energy Efficiency in Council Buildings and on Council
Premises Policy in 2008 that aims to optimise the use of resources in municipal buildings and reduce the
amount of waste produced.
Sustainable energy, inclusive of energy efficiency, is located within the Electricity and Energy Department
and given status through the creation of a separate, but equally important directorate alongside the
three other directorates. Various task teams oversee the efficiency project implementation: 1) The City
Energy Strategy Committee oversees the implementation of the Energy and Climate Change Strategy. 2)
An Internal Energy Task Team consists of representatives from various departments working on energy-
related projects, including: Environment; Municipal Infrastructure; Roads, Transport and Civil Works;
Health and Social Development; Planning; Integrated Development Plan; Communications and
Marketing; and Local Economic Development.20
Initial implementation targets were the Germiston Civic Centre, the East Gauteng Service Council
buildings, and the Edenvale Civic Centre. A full energy audit took place, followed by the installation of
various energy efficient measures, including: solar water heaters, reflective roof surfacing, geyser timers,
efficient lighting (CFLs, LEDs) and ballasts, efficient HVAC systems, revamping of electrical wiring, sealing
of windows and doors, replacement of urns and kettles with hydroboils, and installation of geyser and
18
Pers com (various), Director Energy, EMM, 2012. 19
A reflection on this approach from Kam Chetty, Southern Amitions, working with the NT TAU is as follows: “There
are two issues here, the first is a tariff issue, and the second is the accounting treatment of the transactions. With
respect to Tariffs on electricity the municipality requires NERSA's approval on the tariffs, and they will require
substantial justification, if the standard guidelines are not followed. In this case EMM, had to justify this approach
as part of their application to NERSA. This illustrates that it is possible, given this president. The context now is a
bit more difficult, given the focus on above inflation increases on administrative prices. NERSA is reluctant to
approve any deviation form their guidelines. On the accounting treatment, if NERSA approves, there has to be a
specific ledger account (internal ring-fencing). Independently, I don't see a problem with a municipality dedicating
a portion of their revenue for efficiency, provided there is a policy (approved by council) that allows for this and the
related accounting treatment must be auditable.” Pers. comm. Feb 2013. 20
McDaid, Case Study EMM, 2011.

Preparatory work leading to a project proposal on V-NAMA in sub sector of energy efficiency in public buildings:
Analysis report: Baseline, Energy savings potential and Barriers.
15
lighting timers/motion detectors. An Energy Management system was installed in the Edenvale centre to
record and monitor energy consumption (funded through the DANIDA UEMP funds).
A 53% energy saving was realised from these initial retrofits, with over 320 000 kWh saved per year. The
payback time was approximately 1.2 years. Currently a total of 5 civic centre complexes and 20 depots
have been retrofitted, with roll-out planned for a further 200 municipal buildings. Municipal civic centres
are also included in Ekurhuleni’s internet metering system, which provides live consumption data
updated every 30 minutes.

Preparatory work leading to a project proposal on V-NAMA in sub sector of energy efficiency in public buildings:
Analysis report: Baseline, Energy savings potential and Barriers.
16
As with national government, the next substantial funding for municipal building energy efficiency
retrofit came from National Treasury in the wake of the electricity supply crisis and rolling blackouts of
2008-9. For municipalities this came as an allocation through the Division of Revenue Act (DORA) for
Municipal Energy Efficiency and Demand Side Management, to be managed by the Department of
Energy. The programme initially had public lighting as its focus, and the majority of funds were spent on
street and traffic lighting. However, building audits and lighting retrofits were undertaken in some
instances, and Polokwane included HVAC in its retrofits. This programme, now in its second 3-year cycle,
has extended to include full building retrofits. Results for building efficiency are currently small as this
aspect of the programme has only recently got underway. The Case Study below “DOE’s Municipal
EEDSM Programme” provides a detailed overview of the programme interventions to date. There is no
clear, verified savings figure to date for the building component of this programme (the first programme
cycle M&V reports are about to be finalised, so this figure should shortly be forthcoming).
Around 2010 the major national energy efficiency programme, the Integrated Demand Management
(IDM) programme, run through Eskom, was back in action after some years of dormancy during which
time institutional arrangements and funding processes were being restructured. This fund is available to
the public sector for building efficiency retrofits. For smaller local authorities, the call is for the IDM
programme to work more closely with them to build capacity about how to access the fund. However,
the fund is usually accessed directly by the ESCO appointed to do the retrofit, as part of a financing
package.
The mass implementation of compact fluorescent lamps through the Eskom DSM (now IDM) programme
was concluded in 2010/11. Since the inception of the DSM programme in December 2003 over 47 million
bulbs have been installed country-wide in the residential sector, realising demand savings of 1 958MW.
The public sector benefited substantially through this programme.
Amongst the parastatals, Telkom has deployed funds from the IDM in order to undertake a retrofit
programme that began in March 2012. Use of Eskom’s ESCO programme (targeting substantial, industrial
retrofit in the main) was found to be overly complicated, and they have submitted the majority of their
proposals (looking to retrofit 167 buildings) through the Standard Offer Programme. This makes sense as
the ESCO programme is designed more for industry and for large installations (savings greater than
1MW/annum).

Preparatory work leading to a project proposal on V-NAMA in sub sector of energy efficiency in public buildings:
Analysis report: Baseline, Energy savings potential and Barriers.
17
The parastatal organisations, or state owned companies, in South Africa are actively engaging in energy
efficiency, in buildings and operations. Eskom have an Internal Energy Management division. This tackles
internal energy consumption drawing on internal Eskom ‘own’ funds (as they apparently don’t qualify for
drawing on the IDM programme). Telkom have a number of retrofit proposals underway, predominantly
for lighting and utilising the Eskom IDM funds. Within Transnet there is a dedicated sustainability team
looking at policy and implementation. They are members of the NBI-managed Carbon Disclosure Project
and the Energy Intensive Users Group, as well as the DBSA’s Green Infrastructure team. The PRASA have
indicated that they have started doing some energy audits on some of their buildings. PRASA aims to
make use of Eskom’s IDM RMR fund for its residential stock21.
Table 1: Funding sources for energy efficiency in public buildings, 1997 – 2012
National Treasury
(MTEF) - DPW
National Treasury (DORA) - Municipal EEDSM
Eskom CFL
rollout Eskom IDM
EPC - Shared Savings Own Funds ICLEI
DANIDA - UEMP
National R 180,000,000Dept. of Public Works R 180,000,000 R 180,000,000Parastatal R 0Telkom R 0Transnet R 0Eskom R 0Provincial R 0
R 0Municipality R 122,439,439City of Cape Town R 6,300,000 R 6,000,000 R 21,000,000 R 4,636,524 R 37,936,524City of Johannesburg R 0City of Tshwane R 55,000,000Ekurhuleni Metropolitan Municipality R 32,000,000 R 657,500 R 657,500 R 33,315,000Ethekwini Metropolitan Municipality R 27,800,000 R 27,800,000Hessequa Municipality R 0Nelson Mandela Bay Metropolitan Municipality R 8,387,915 R 8,387,915Polokwane Municipality R 15,000,000 R 15,000,000TOTAL R 180,000,000 R 144,487,915 R 6,000,000 R 0 R 21,657,500 R 0 R 5,294,024 R 357,439,439
TOTALPublic Entity
Funding Source (Funder/ Programme)
Key: monies spent but amount unknown
National funding Own investment Donor funding
The table above provides an overview of funding streams to date into the public building energy
efficiency sector. This has a number of gaps: a quantification of private and public ‘own’ investment, and
IDM investment,22
into the programme would enhance this picture. There may well be some further
21
Pers. com. during November-December 2012 22
Eskom IDM have been approached for support with this information; however it is unlikely that it is recorded as
‘public sector’ given that agreements are instituted between Eskom and private ESCOs.

Preparatory work leading to a project proposal on V-NAMA in sub sector of energy efficiency in public buildings:
Analysis report: Baseline, Energy savings potential and Barriers.
18
municipal ‘own’ investment. The size of the ESCO investment to date in the public sector is unknown, but
has been responsible for the largest public building retrofit to date in the country. However, it can also
be seen that, given concerns within municipal government around new procurement approaches,
national government is a substantial and vital catalytic funder in this sub-sector. Local government, as it
is able to demonstrate benefits, is increasingly bringing funds and capacity into the sector; and, although
not huge, government grants and donor agency funds have been critical in kick starting the process.

Preparatory work leading to a project proposal on V-NAMA in sub sector of energy efficiency in public buildings:
Analysis report: Baseline, Energy savings potential and Barriers.
19
Case study: Department of Energy’s Municipal Energy Efficiency and Demand Side Management
(EEDSM) Programme (DORA)
The municipal component of the Division of Revenue Act (DoRA) funded Energy Efficiency Demand Side
Management (EEDSM) is an initiative of government to provide subsidies to selected municipalities to
reduce the electricity demand as a measure to minimise supply interruptions and carbon emissions. The
initiative aims to target the installation of energy efficient lighting technology in buildings, street and
traffic lights. These subsidies are disbursed by the National Treasury as a conditional grant to
municipalities. The Department of Energy (DoE) is responsible for managing, coordinating, administering,
monitoring and evaluating the programme. Municipalities apply for inclusion in the programme and
proposals are evaluated based on projected savings.
The first 3-year Municipal EEDSM programme cycle started in the 2009/10 and ended at the close of the
2011/12 financial year (June 2012). The majority of these funds (approximately R700 million) went to
street and traffic lighting retrofit, with only a few building lighting projects. A second cycle has been
allocated funds and will run from 2012-15 (R600 million). Public building efficiency has been included in
the programme scope.
Municipal EEDSM 2009-2012: An overview of funds allocated to public building efficiency retrofit, and
interventions undertaken23.
Municipality Project Intervention
Type Technological intervention Approximate Cost of
EE Intervention
Cape Town Building lighting
retrofit i. Replacing 5,963 36 W (T8) with 28
W (T5) luminaires
R 6,300,000.00
Ekurhuleni Building lighting
retrofit i. Replacing 120,000 (T8) fluorescents
with (T5) luminaires
R 12,000,000.00
ii. Installation of 15,000 occupancy
sensors
R 20,000,000.00
Emfuleni Building lighting
retrofit i. Replacing 350 fluorescent lamps
with energy efficient luminaires
Outstanding info24
EThekwini Building lighting i. Installation of T5 lamps R 6,800,000.00
ii. Installation of occupancy sensors
iii. Installation of individual switching
Community
Residential Units
(Hostels)
i. Lighting retrofits R 21,000,000.00
NMBMM Building lighting i. Installation of occupancy sensors R 8,387,915.00
Johannesburg Building lighting Outstanding info Outstanding info
Polokwane Building lighting i. Replacement of 6,058 T12 &T8
fluorescent lamps with T5s
R3,000,000.00
Building lighting i. Replacement of 165 50W
downlighters with 35W ones.
R12,000,000.00
HVAC retrofits i. Replacing of 160 old air
conditioning units with high
efficiency DC Inverter type console
heat pumps
TOTAL R 89,387,915.00
23
M&V reports from various municipalities and DOE, 2012. 24
Followed up; still waiting for information (Feb 2012).

Preparatory work leading to a project proposal on V-NAMA in sub sector of energy efficiency in public buildings:
Analysis report: Baseline, Energy savings potential and Barriers.
20
Section 3: Retrofit data analysis
Retrofitted public buildings to date
Some retrofitting of public buildings has occurred within each sphere of government in South Africa,
although only a limited number of these buildings have comprehensive M&V data linked to them. The
table below shows a summary of known retrofits in public buildings.
Table: Summary of public building retrofits to date
Organisation Year Project scope, short
description & available
data
Business model and
funding used Evaluation
National Govt DPW 1997-
2010
Initiated first public building
retrofit programme in SA.
Initiative ran through
Gauteng, Western Cape,
Free State and through
Pretoria head office. Spend
unknown. M&V only done
by ESCO (i.e. data not
housed with DPW): able to
obtain some data from
WCape.
ESCO shared savings
scheme. The ESCO, SEM,
assumed all risk and raised
capital. Their payback was
derived from DPW
payments off the savings
realised (at set
percentages ranging from
40-60%).
Shared savings model
worked well.
Interestingly, efficient
lighting was, in many
instances, still
considered too costly
at this stage. Many
interventions relating
to tariffs, etc. No
subsidy or grant
funding. No external
M&V. Don’t have
detailed saving per
cost figures. Savings
not clear (needs
confirmation: see
Section 3 below).
DPW 2008/09-
2009/10
Retrofits in Pretoria Head
office x 2 contracts:
R20million (22 sites, 1 981
buildings) and R35 million
(17 sites, 1,206 buildings).
Funds allocated from
National Treasury through
MTEF. Not sure who
contracts awarded to.
Done as straight capital
funded project.
Annual savings said to
be: 13,88 GWh and
36,41 GWh
respectively (DPW
presentation to
parliament, Oct
2012).
DPW 2010/11
and
2011/12
Retrofits in Eastern Cape,
Mpumalanga, Northern
Cape and North West. R70
million and R75 million (not
sure where the R180 million
figure from).
Funds allocated from
National Treasury through
MTEF. Contracts given to
IDT and done as straight
capital funded project.
Annual saving said to
be: 36 GWh (source
as above: but given
investment this small
relative to above –
needs more
checking). No
external M&V
reports.
DPW 2011 Retrofits in Western Cape,
Gauteng, KwaZulu-Natal and
Limpopo. Shared savings
model, will utilise IDM funds
ESCO shared savings
contracts with Zamori
(similar to previous SEM
contracts).
Regions seem happy
with programme to
date – still very much
work in progress.

Preparatory work leading to a project proposal on V-NAMA in sub sector of energy efficiency in public buildings:
Analysis report: Baseline, Energy savings potential and Barriers.
21
Organisation Year Project scope, short
description & available
data
Business model and
funding used Evaluation
and ESCO capital (total
investment unknown). Will
draw on 3rd
party M&V
specialists.
Some concern re
detail of the contract
– too many loopholes
(although conduct of
ESCO been excellent).
Provincial Govt
Western Cape
Government
Current 5 x baseline audits.
1 floor of one building in the
process of retrofitting.
No information available
Western Cape
Government –
Health
department
ongoing Retrofit of hospital geysers
with heat pumps
(predominantly; all
completed except
Riversdale hospital);
working on improving HVAC
systems, painting roofs
white, working on new build
design, etc
Drawing on portion of
Health Department
Engineering budget (R27
million/year for ad hoc
engineering projects).
Done through straight
capital budget, but
excellent initiative
showing the power of
capacity and
knowledge to
integrate EE
transformation.
Local Govt
City of Cape
Town
2003/4 Retrofit of Parow office
building. Baseline energy
audit.
Donor funding from SEED
Programme run by
Sustainable Energy Africa
and ICLEI’s Cities for
Climate Protection
Programme.
Pioneering local
government building
retrofit. Important
lessons and
experience
developed.
City of Cape
Town
2008/09-
2010/11
Building lighting retrofit :
replacing 5,963 36 W (T8)
with 28 W (T5) luminaires.
National Treasury DoRA
EEDSM fund managed by
DoE: 1st
tranche. R
6,300,000.
City of Cape
Town
2009/10 4 x building retrofits
(Durbanville, Fezeka,
Plumstead, Ottery).
Baseline and M&V audits
available.
Donor funding from
DANIDA UEMP fund for
baseline audits. R
4,636,524.
ESCO guaranteed savings
contract with SEM. ESCO
required to guarantee
savings on annual basis,
through submission of
bank guarantee, for 3
years.
Guaranteed savings
model worked, but
found to be fairly
complicated.
Requires upfront
capital to be raised by
the public agent
(govt).
City of Cape
Town
2012
onwards
14 x buildings audited.
Aim: EE lighting retrofit of all
CoCT buildings, starting Oct
2012.
National Treasury DoRA
EEDSM fund managed by
DoE: 2nd
tranche. R 40 mill
(2011/12).
Traditional infrastructure
contract, with savings
guaranteed by contractor.
City of Cape
Town
Current Baseline audit of Civic
Centre completed.
Retrofit of civic centre to
commence 2013 (some
components – lifts, chillers –
already done through
Own funding: ad-hoc
budget allocation from
Building Maintenance. R21
million.
Eskom IDM SPP (sourced
by ESCO): R 6 mill.
Reverting to more
traditional
infrastructure
delivery contracts; no
leveraging of private
sector capital.

Preparatory work leading to a project proposal on V-NAMA in sub sector of energy efficiency in public buildings:
Analysis report: Baseline, Energy savings potential and Barriers.
22
Organisation Year Project scope, short
description & available
data
Business model and
funding used Evaluation
Building Maintenance
initiatives).
Split design and
implement contracts,
using fairly standard
contracts for municipal
infrastructure delivery
City of Cape
Town
Current Installation of building
meters (AMR) and training
of building management
staff, development of
institutional set up for
regular building
management reporting.
AMR via EEDSM?
Capacity - internal
Developing internal,
ongoing building
management and
monitoring capacity is
an important step
and this model worth
following up as it rolls
out.
City of
Johannesburg
2008/09-
2010/11
Outstanding information.
6 baseline audits only
National Treasury DoRA
EEDSM fund managed by
DoE: 1st
tranche.
Outstanding information.
City of Tshwane 2003 Retrofit of Minimunitoria
building.
Donor funding from SEED
Programme run by
Sustainable Energy Africa
and ICLEI’s Cities for
Climate Protection
Programme.
Ekurhuleni
Metropolitan
Municipality
2009 -
current
Initial 3: Germiston Civic
Centre (GCC), East Gauteng
Service Council (EGSC)
buildings and Edenvale Civic
Centre (ECC). GCC & EGSC:
EE lights, hydroboils, geyser
& lighting timers, energy
management system
installed for monitoring,
installation of SWHs,
reflective roof surfacing,
geyser timers, EE lighting &
HVAC, motion sensors,
electrical wiring revamp,
sealing of windows/doors.
53% savings, 1.2 year
payback
Total munic offices
retrofitted: 7. No detailed
baseline audits – do own
internal assessments. M&V
undertaken internally
(except where EEDSM Dora
funds used)
20 depots: EE lights.
Own funding: ring-fenced
a portion of its electricity
revenue on a c/kWh basis.
Donor funding (DANIDA
UNEP fund). R657,500 for
Energy Management
system in Edenvale Centre.
National Treasury DoRA
EEDSM fund managed by
DoE: 1st
tranche.
R32,000,000 (for EE lights
and occupancy sensors)
National Treasury DoRA
EEDSM fund managed by
DoE: 2nd
tranche.
R27,800,000.
Donor funding: ICLEI.
Spend unknown.
Business model: straight
contract basis.
While this approach
doesn’t leverage
private capital, EMM
has created an
ongoing stream of
funding for EE from
its electricity revenue
stream (similar to
Brazilian model or
Eskom IDP
programme). This is
valuable and roll out
of this system worth
exploring (may be
difficult in given times
of pressure on
electricity tariffs);
Further the
availability of internal
funds can be seen to
have resulted in
substantial retrofit
activity. M&V less
vigorous as not
required externally.
Emfuleni Local
Municipality
2008/09-
2010/11
Public building EE lights:
replacing 350 fluorescent
lamps with energy efficient
luminaires.
National Treasury DoRA
EEDSM fund managed by
DoE: 1st
tranche. No data
received on spend.
eThekwini 2008/09- Six public buildings: T5 National Treasury DoRA

Preparatory work leading to a project proposal on V-NAMA in sub sector of energy efficiency in public buildings:
Analysis report: Baseline, Energy savings potential and Barriers.
23
Organisation Year Project scope, short
description & available
data
Business model and
funding used Evaluation
2010/11 lamps, occupancy sensors,
individual switches.
Hostels: EE lighting.
EEDSM fund managed by
DoE: 1st
tranche. R
6,800,000 (public
buildings) and R
21,000,000 (hostels).
eThekwini 2010/11 Hostels. 18 x 2m2 SWHs
connected to existing hot
water tanks, supplying 25
flats. Key constraint:
assessing energy savings.
Metering in building not
recorded at floor level.
Follow-up study initiated to
ascertain energy savings.
Donor funding: supported
by UNIDO through the
Durban Industry Climate
Change Partnership
Project. Spend unknown.
Hessequa Local
Municipality
2003- ?? 9 x municipal offices: EE
lighting
3 x municipal campsites: EE
lighting & SWHs
5 x sports grounds: EE
lighting
National Treasury DoRA
EEDSM fund managed by
DoE
Spend unknown.
Eskom DSM (now IDM) –
CFL rollout.
Nelson Mandela
Bay
Metropolitan
Municipality
2008/09-
2010/11
4 x building baseline audits
1 x building retrofit:
occupancy sensors for public
building lights.
National Treasury DoRA
EEDSM fund managed by
DoE: 1st
tranche. R
8,387,915.
Polokwane
Municipality
2008/09-
2010/11;
and
2011/12
32 Buildings
Nearly 100% of buildings
have been EE retrofitted.
Public building lights:
replacement of 6,058 T12 &
T8 fluorescent lamps with
T5s; replacement of 165
50W downlighters with 35W
ones.
EE HVAC: replacing of 160
old HVAC units with high
efficiency DC Inverter type
console heat pumps.
National Treasury DoRA
EEDSM fund managed by
DoE: 1st
tranche. R
3,000,000 (EE lights) and R
12,000,000 (EE HVAC).
Very extensive
rollout; driven
through DORA
EEDSM funds and
putting dedicated
staff in place. Model
worth exploring for
medium sized towns
(costing, etc).
General 2003-
2010/11
CFL rollout: 47 million bulbs. Eskom DSM (now IDM)
General 2008/09-
2010/11
Public lighting (esp. street
and traffic lights) as initial
focus. Building audits and
lighting retrofits undertaken
in some instances.
National Treasury DoRA
EEDSM fund managed by
DoE: 1st
tranche. R
700,000,000.
General 2012/13-
2014/15
Programme extended to
include full public building
retrofits
National Treasury DoRA
EEDSM fund managed by
DoE: 2nd
tranche. R
600,000,000.
Parastatals
Eskom Ongoing M&V undertaken by Eskom.
No data publically available.
Eskom challenged whether
they fall within the scope of
Own funding. Initially
regional programmes
received funding from
Head Office. Now each

Preparatory work leading to a project proposal on V-NAMA in sub sector of energy efficiency in public buildings:
Analysis report: Baseline, Energy savings potential and Barriers.
24
Organisation Year Project scope, short
description & available
data
Business model and
funding used Evaluation
a public sector programme. region is responsible for
budgeting and funding the
implementation as part of
regional overhead costs.
Programme cost available
in Eskom Annual Report,
but doesn’t publicly report
on cost per savings
achieved.
Business model: straight
contract.
PRASA Current Baseline energy audits
initiated in some buildings.
Eskom IDM RMR: aims to
make use of this for its
residential stock
Telkom 2012
March –
initiated
Plan to retrofit 167
buildings: lighting mainly.
Eskom IDM Standard Offer
Programme. Spend
unknown.
Transnet Current Plans in place for efficiency
retrofitting, in line with ISO
50 000 (Energy
Management System)
certification. Facing big
infrastructure spend (R 300
mill). Have set up
programme to mitigate
energy supply shortage risks
- includes ‘future proofing’
infrastructure.
The majority of the retrofitted local and provincial government public buildings are typical multi-storey
municipal offices, and single storey multi building sites. The exception is Polokwane which retrofitted a
full range of public buildings including pump stations, fire stations, a stadium and workshops with
efficient lighting. The type of buildings retrofitted within the extensive DPW programme is difficult to
assess as sites involve a range of building types. For example a correctional facility or military base would
have several buildings with extensively different functions and energy use patterns. These can be halls,
office spaces, kitchens, residential units and workshops. Generalised data for some of these sites has
been obtained for overall site savings, with a list of the energy efficiency interventions implemented.
Benchmark Analysis
The Green Building Council of South Africa (GBCSA) completed a comprehensive national study of 350
commercial buildings in November 201225. These buildings ranged in size from under 2000 square metres
to greater than 30 000 square metres. The key finding from this study showed that a benchmark for
25
GBCSA Energy and Water benchmark methodology – Final Report November 2012

Preparatory work leading to a project proposal on V-NAMA in sub sector of energy efficiency in public buildings:
Analysis report: Baseline, Energy savings potential and Barriers.
25
energy use in South African commercial buildings is 219kWh/square metre/annum. The report also
concluded that this figure is acceptable across all commercial building sizes. Interestingly the report also
refers to a British study26
of commercial buildings in London, which shows a typical figure of
267kWh/square metre/annum, showing that South African commercial buildings typically consume 18%
less energy than buildings in the London study.
For the purposes of this the report, the GBCSA benchmark of 219kWh/square metre/annum will be used.
Specific learnings from completed public building audits and retrofits from Cape Town, Polokwane and
the Department of Public Works (DPW) and extrapolations for the National picture
Cape Town
Five public building sites have been retrofitted in Cape Town. Four of the five sites were recently
retrofitted, and come with a comprehensive pre and post implementation M&V reports. The fifth site
was retrofitted in 2003 and has some useful M&V results. Three of the five retrofitted sites are medium
sized municipal administration offices. The other two sites are single storey multi building compounds.
As with most municipal building sites, the 5 retrofitted buildings are multifunctional (a selection of office
space, courts, public administration areas, libraries, workshops etc). These are either integrated into the
main building, or incorporated into additional buildings on site.
As such, these five retrofitted public building sites represent two common formats of public building sites
in the country:
1. Medium sized multi-storey integrated office blocks (Tygerberg, Plumstead and Durbanville) and
2. Single-storey multi building compounds (Fezeka and Ottery)
The data from these retrofits is the most comprehensive and most recent available from all the data
collected around the country at this stage. These examples are used, therefore, as indicative of what
value can be obtained from retrofitting these types of public building sites around the country. The
results will also be cross checked against findings from similar buildings in the Polokwane lighting retrofit
programme, as well as the DPW programme later on in the chapter.
26
A Probabilistic Model for Assessing Energy Consumption of the Non-Domestic Building Stock, Ruchi Choudhary,
Department of Engineering, University of Cambridge, UK

Preparatory work leading to a project proposal on V-NAMA in sub sector of energy efficiency in public buildings:
Analysis report: Baseline, Energy savings potential and Barriers.
26
Cape Town has also recently completed an audit of its Civic Centre, a 26 storey high building in the
centre of the city. This constitutes the final typical building format for public building sites in the country:
3. Large multi-storey integrated office block
Data obtained from this audit report is also comprehensive, although the actual retrofit is only due to
happen in 2013. In the absence of other comprehensive reports for large public buildings, it is proposed
that this example is used as indicative of what value can be obtained from retrofitting this type of public
building around the country. Less substantial data obtained from a similar audit for a large municipal
office in Johannesburg will be used for cross checking purposes.
1. Medium sized multi storey office block analysis
Electricity use profile
HVAC
39%
Lights
39%
Office
Equipment
16%
Other
6%
Plumstead energy use by
technology
HVAC
40%
Lights
31%
Office
Equipment
16%
Other
13%
Tygerberg energy use by
technology

Preparatory work leading to a project proposal on V-NAMA in sub sector of energy efficiency in public buildings:
Analysis report: Baseline, Energy savings potential and Barriers.
27
As can be seen from the two buildings’ energy baselines, a typical pattern of lights and HVAC being
responsible for 70-80% of building energy consumption is apparent. This ties up very closely with typical
larger commercial buildings.
Energy audit summary
The data coming from the retrofitting of Plumstead, Durbanville and Tygerberg municipal offices is very
useful to provide a typical expected saving for medium sized multi storey public buildings. The following
information is a summary from the energy audit reports and M&V from the respective sites:
Overview Plumstead Durbanville Tygerberg
Main building
services General Administration,
Revenue, Planning and
Building Development
Management
General Administration,
Public Library, Council
Chambers
General administration,
council chamber
Date of retrofit 2011 2011 2003
Annual elec use
(kWh) Jan-Dec 09 943,640 383,355 690,084
Elec supply City City City
Floor area (m²) 8,630 5,285 Not available
kWh/sq m/year 109 73 Not available
Energy use patterns
prior to retrofit Consumption and
demand index very low
compared to the South
African commercial
building benchmark of
219 kWh/sq m/year.
Similar buildings. Partly
explained by low
occupancy density (29m²
per person) and the fact
that not all areas are air-
conditioned.
Consumption and
demand indices much
lower than comparable
buildings. Partly
explained because the
Library (expected to be
less energy intensive) is
being fed from this
building. Also: low night
load, low occupancy and
infrequent usage of
certain parts of the
building (e.g. Council
Chambers).
Not available
Interventions 1. Power factor
correction, 2. HVAC operating hours
maximisation, 3.High
efficiency lighting (T5)
and control gear, 4. Intelligent thermostat
control 5. SWH
1. Power factor
correction, 2. High efficiency lighting
(T5) and control gear, 3. SWH
Efficient lighting,
predominantly
fluorescent bulbs and
tubes and electronic
ballasts, adjusting air
conditioning use times
Estimated kWh
saved (%) 16.5% 17.1% 20%
Estimated kVA
saved (%) 17.3% - -
Actual kWh saved
(%) (Jan 2012-May
31.24% (including
behavioural change) - 22% (estimated at 14%
technical and 8%

Preparatory work leading to a project proposal on V-NAMA in sub sector of energy efficiency in public buildings:
Analysis report: Baseline, Energy savings potential and Barriers.
28
Overview Plumstead Durbanville Tygerberg
2012) behavioural change)
Actual kVA saved
(%) (Jan 2012-May
2012)
23.5% - -
It is interesting to note that both Plumstead and Tygerberg had behavioural change campaigns running
within the building. As a result both of these buildings exceeded the predicted savings from just the
interventions alone. Behavioural change in these two buildings resulted in improved efficiency of 8-16%.
The expected energy savings (in kWh) per intervention per year for the two recently retrofitted building
sites of Plumstead and Durbanville were broken down as follows:
Total savings
kWh
% of building
baseline energy kWh
% of building
baseline energy kWh
% of building
baseline energy kWh
% of building
baseline energy kWh
Plumstead 118 830 13% 10 260 1% 18 500 2% 8 310 1% 155 900
Durbanville 61 400 16% - - - - 4 230 1% 65 630
Lighting - high efficiency lighting and
control gear
HVAC - operating hours
optimisation
Intelligent thermostat control on
HVAC Solar Water Heating
As can be seen in these buildings, the largest area where savings can be realised is through building
lighting. This figure ranges from 13-16% of total building electricity use. Smaller savings from HVAC (2%
of building electricity use) and water heating efficiency (1% of building electricity use) measures are
possible.
The expected energy demand savings (kVA) per intervention year for the two building sites were broken
down as follows:
Power
factor
correction
Lighting - high efficiency
lighting and control gear
Intelligent
thermostat
control
Solar Water
Heating
Total
savings
(kVA)
Plumstead 12.9 28.6 4 4.4 49.9
Durbanville 8.5 20.8 - 1.5 30.8
As can be seen from the table above, efficient lighting has the most beneficial effect on energy demand
levels, while power factor correction, thermostat control and solar water heating are important but less
significant.
Costs
Paybacks for the various interventions are summarised in the table below.

Preparatory work leading to a project proposal on V-NAMA in sub sector of energy efficiency in public buildings:
Analysis report: Baseline, Energy savings potential and Barriers.
29
It is interesting to note that simple payback periods for the interventions are very long (5-19 years), and
would probably not be attractive to commercial clients.
2. Single Storey Multi Building Compound Analysis
These are typically clusters of smaller buildings on one public site, which can be utilised for many
different functions such as office space, workshops, halls and courts. To illustrate this, an aerial view of
the Ottery municipal site is provided in the red outline below.
Preparatory work leading to a project proposal on V-NAMA in sub sector of energy efficiency in public buildings:
Analysis report: Baseline, Energy savings potential and Barriers.
30
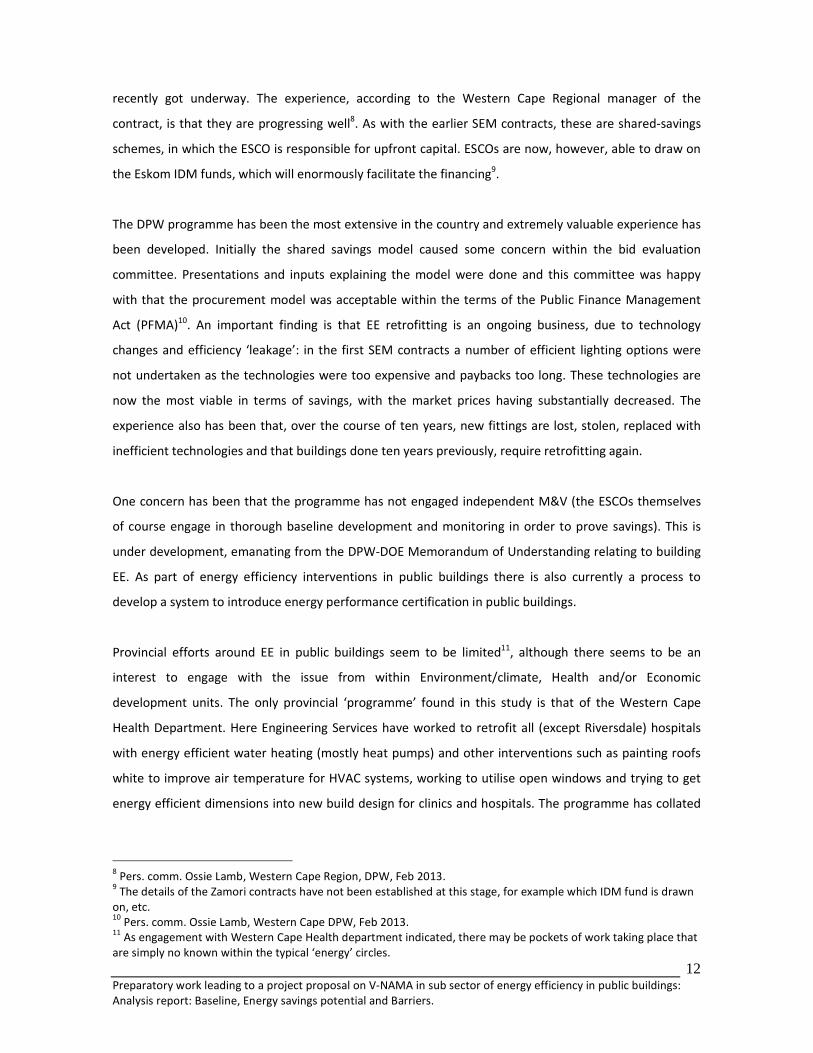
Electricity use profile
HVAC
16%
Lights
53%
Office
Equipment
10%
Hot water
12% Other
9%
Ottery energy use by technology
HVAC
20%
Lights
62%
Office
Equipment
10%
Hot Water
8%
Fezeka energy use by technology
The figures coming from single storey show that lighting is the predominant energy user on the site
(53%-62% of total energy use), while HVAC has a lower impact (16-20% of total energy use). This is a
significant shift in energy use patterns when compared to medium sized multistorey buildings where
HVAC and lighting is typically 40% . Hot water consumption in these structures is also significant, due to
the fact that each building has a water heater, a more inefficient configuration to multistorey buildings.
Energy audit summary
The data coming from the retrofitting of Fezeka and Ottery municipal offices is very useful to provide a
typical expected saving for this type of public building configuration. The following information is a
summary from the energy audit reports and M&V from the respective sites:
Overview Ottery Fezeka
Main building
services General Administration, Fire
Department, Traffic Services,
Rondevlei Sub Council, Law
Enforcement, City Parks, Electrical
Maintenance
General Administration, Revenue,
Health Department, Forestry, Water
Works, Family Court
Annual elec use
(kWh) Jan-Dec 09 449,376 336,781
Elec supply City Eskom
Floor area (m²) 5,541 4,063
kWh/sq m/year 81 83
Interventions 1. High efficiency lighting (T5)
and control gear,
2. SWHs
1. Outside lighting daylight
controls,
2. High efficiency lighting (T5) and

Preparatory work leading to a project proposal on V-NAMA in sub sector of energy efficiency in public buildings:
Analysis report: Baseline, Energy savings potential and Barriers.
31
Overview Ottery Fezeka
control gear,
3. HVAC operating hours
optimisation,
4. SWH
Estimated kWh
saved (%) 17.1 11.8
Current energy
use patterns Despite the fire and police
departments being occupied 24/7 the
consumption index is low.
Demand and consumption indices are
much lower than industry benchmark
figures. Attributed to low occupancy
density, minimal air conditioning and
possibly the discipline of staff to switch
off equipment and lights.
The expected energy savings (in kWh) per intervention per year for the two building sites were broken
down as follows:
Total savings
kWh
% of building
baseline energy kWh
% of building
baseline energy kWh
% of building
baseline energy kWh
% of building
baseline energy kWh
Ottery 56 900 13% - - - - 20 030 4% 155 900
Fezeka 31 090 9% 3 570 1% 3 570 1% 5 150 2% 65 630
Lighting - high efficiency lighting and
control gear, daylight control
HVAC - operating hours
optimisation
Intelligent thermostat control on
HVAC Solar Water Heating
As can be seen in these buildings, the largest area where savings can be realised is through building
lighting. This figure ranges from 9-13% of total building electricity use. Smaller savings from HVAC (1% of
building electricity use) and water heating efficiency (2%-4% of building electricity use) measures are
possible.
The amount of savings possible is similar to medium sized public buildings, although water heating
savings are greater. This is most likely due to the lack of centralised water heating, with each structure
having its own water heating facility.
Costs

Preparatory work leading to a project proposal on V-NAMA in sub sector of energy efficiency in public buildings:
Analysis report: Baseline, Energy savings potential and Barriers.
32
Long payback periods for these interventions make them in all likelihood unattractive to commercial
clients. However, government would consider these benefits as the building will still be in public use for a
longer period than the payback.
3. Large multi storey integrated office block
Electricity use profile
The figure below shows the audited baseline consumption for the 26 storey Cape Town Civic Centre:
Office Equip
16%Elevators &
Escalators
1.4%IT &
Printing
Room
1%
Kitchens
3%Water
heating
1%
other/losses
9%
AirCon / Ventilation
41%
Lights
27%
Electricty Consumption Breakdown - Civic Centre
Audit summary
The comprehensive audit for the Cape Town Civic Centre is very useful to provide a typical expected
saving for a large multi storey public building. The following information is a summary from the energy
audit for the site:
Overview Cape Town Civic Centre
Main building
services General Administration, Revenue, Planning and Building Development
Management
Annual elec use
(kWh 23,750,000
Elec supply City
Floor area (m²) 97,000
kWh/sq m/year 244
Energy use patterns
prior to retrofit Slightly higher than the GBCSA commercial building average consumption figure

Preparatory work leading to a project proposal on V-NAMA in sub sector of energy efficiency in public buildings:
Analysis report: Baseline, Energy savings potential and Barriers.
33
The expected energy savings (in kWh) per intervention year for the Civic Centre was broken down as
follows:
No Description Cost Energy
Savings/a
MWh
%
Saving Savings/a
nnum R Life Cycle
Cost/a R Nett
Savings/a R
(Initial)
Payback
Years
1 Lighting R36m 3 800 16% R3m R13k R3m 6
2 Main Chiller
Replacement R11m 2 550 11% R2m - R2m 4
3 Window
blinds R20m 1 800 8% R1.44m R40k R1.4m 8 – 9
4 HVAC Main
Fan VSD’s R1m 900 3.7% R720k R20k R700k 1.5
5 Sub-metering R1m 200 1% R160k 0 R80 000 6
6 HVAC
Maintenance 0 200 0.9% R160k 0 R160 000 0
7 Workstation
Monitors R2m 150 0.6% R120k R150k - -
8 Lift Drive
System R1m 140 0.5% R112k - R112 000 6
As can be seen, the largest area where savings can be realised is through implementation of efficient
building lighting. The figure of 16% saving of total building electricity use from efficient lighting is very
similar to the medium sized buildings assessed earlier in this chapter.
The replacement of the existing chiller for a more efficient model will result in an 11% reduction in
baseline building electricity. Additional interventions such as implementing a variable speed drive for the
main fan can also have a significant benefit (3.7% reduction). With centralised HVAC systems, large
savings are possible if they are replaced with more efficient technology.
Costs
This audit report indicated shorter payback periods (4-6 years) for the interventions than those of the
other two building types. This improved payback period is due to the fact that energy consumption levels
per square metre per annum are two to three times higher on in this building, and the effectiveness of
the intervention implemented will be increased.
Cross-check
The results were cross-checked against findings from other public building retrofits in the country

Preparatory work leading to a project proposal on V-NAMA in sub sector of energy efficiency in public buildings:
Analysis report: Baseline, Energy savings potential and Barriers.
34
1. Polokwane efficient lighting retrofit of 34 buildings
The audit information obtained for this retrofit programme does not look at overall building
consumption saving percentages, but rather provides information on savings specifically from
installing efficient lighting. These are shown in the table below.
Energy Use (lighting)
Building Name Before After % Saving
Moletjie Library 3750 1632 56%
Moletjie Licensing department 2190 1595 27%
Seshego Library 8988 4653 48%
Moletjie Community Hall 1384 1134 18%
Environmental Depot-Seshego 11775 8346 29%
Seshego Water Plant 2710 1939 28%
Mankweng Cluster Office Zone 3930 1582 60%
Mankweng Fire Station Zone A 4040 1508 63%
Mankweng Traffic Station Zone 2310 1302 44%
Mankweng Offices Zone C 2190 1964 10%
Sebayeng Office 1233 1370 -11%
Nursery Ladanna 9075 4945 46%
Sewer Purification Ladanna 32110 23235 28%
Dalmada Water purification 6390 3883 39%
Ladanna Hostel 965 603 38%
33 Church Street 1650 622 62%
Mankweng Sewer Works 5660 3452 39%
Ramakgapula Water Purification 4995 3542 29%
Union Building 3220 1828 43%
Recreation House 1220 334 73%
Fire Brigade Old Airport 17490 8752 50%
Game Reserve 19930 10444 48%
House Labuschagne 3705 1611 57%
House Gholf Club 2085 933 55%
Ladanna Fire Brigade 19385 12281 37%
Electrical Workshop 9050 6304 30%
Mechanical Workshop 13585 10481 23%
Peter Makhaba Stadium Old 40325 24447 39%
Peter Makaba Station New 16200 2916 82%
Sand River Pump Station 490 490 0%
Sand River North Pumpstation 2395 1387 42%
Marshall Street pumpstation 196 196 0%
Matebole Water Plant 1680 1083 36%
Molepo Water Plant 3340 2113 37%
Chuene Water Plant 2520 1446 43%
Totals 262161 154353 41%

Preparatory work leading to a project proposal on V-NAMA in sub sector of energy efficiency in public buildings:
Analysis report: Baseline, Energy savings potential and Barriers.
35
On average a saving of 41% was obtained across all buildings on lighting energy use, mostly through
replacement of inefficient fittings (magnetic ballasts with electronic ballasts) and efficient globes (T8 &
T12 with T5, incandescent with CFLs etc). This is very similar to the lighting retrofits in the Cape Town
buildings. Comparison to these audits shows the following results:
a. Plumstead saving on lighting energy use: 33%
b. Cape Town Civic Centre saving on lighting energy use: 59%
c. Ottery saving on lighting energy use: 25%
The conclusion that can be reached from this comparison is that actual savings from efficient lighting
does differ markedly from building to building.
2. City of Johannesburg audits of 6 buildings
Limited information was obtained here and as the information is confidential, it cannot be explicitly
stated in this report. However, the following information was obtained from the audit of a large
municipal office block in Johannesburg:
Baseline consumption (kWh) 2 155 629
Intervention kWh saved as %
Lighting
Replace magnetic ballasts 180222 8.4%
Replace inefficient lamps 96359 4.5%
Replace inefficient floodlights 12380 0.6%
Occupancy and ambient light sensors 173584 8.1%
Sub total (lighting) 462545 21.5%
HVAC
Control + timers 132953 6.2%
Total 595498 27.6%
Comparing these results to the Cape Town Civic Centre audit, the following can be noted:
a. Savings through replacing inefficient light fittings and lamps is 16% in Cape Town, and 13.5% in
Johannesburg. This also falls within the typical bracket of 13%-16% determined for the medium sized
multi-storey office blocks
b. The Johannesburg audit includes additional lighting savings of 8.1% through occupancy and ambient
light sensors, an intervention not covered in the Cape Town audit
c. The HVAC system in the Johannesburg building is not centralised like Cape Town, so comparisons
cannot be made there. However, a comparison can be made with the medium multi-storey office
blocks which have individual air conditioners. Savings in the Johannesburg building are 6%, while the
medium office blocks can save up to 3%.

Preparatory work leading to a project proposal on V-NAMA in sub sector of energy efficiency in public buildings:
Analysis report: Baseline, Energy savings potential and Barriers.
36
3. Department of Public Works retrofit programme
Information obtained for this programme was a summary of retrofits to 35 national government building
sites between 6 and 12 years ago. Many of these sites were multi building compounds (military bases,
prisons, naval bases). The following key information was drawn from this summary:
a. It is interesting to note that efficient lighting retrofits were generally not implemented, due to the
high cost of the technology at the time. Incandescent bulbs were replaced with CFLs in some
buildings.
b. The majority of these building sites were retrofitted with timers for lighting, HVAC and any other
high energy usage process (eg water heating for washing in prisons). Power factor correction was
also implemented in several buildings, to counteract the losses from the magnetic ballasts of the
fluorescent lighting.
c. Money saving and not energy saving interventions such as tariff switching was also very effectively
employed in most buildings. One building realised 30% savings from this alone.
d. From the data received it is possible to determine the baseline of those multi building compounds
which did not employ tariff switching. Due to the lack of clarity provided in the data between
financial savings from energy efficient interventions and straight money saving interventions, it is
difficult to benchmark the energy usage patterns of the balance of the buildings. The table below
shows the credible baseline figures for 9 of the 35 buildings:
Percentage
savings on
energy cost
Nett Floor Area
building(s)
Ave kWh saved
/year
Ave kWh per
year
kWh/sqm/
year
After
intervention
kWh/sq
m/year Improvement
TAS & Warfare School 13.6% 9 400 116 923 862 485 92 745 563 79 12
SA Library 16.0% 6 370 22 057 137 689 22 115 632 18 3
Ysterplaat Air Force Base 8.7% 54 345 573 853 6 563 835 121 5 989 982 110 11
Silvermine Military Base 16.4% 17 790 433 494 2 650 379 149 2 216 885 125 24
Youngsfield Military Base 11.3% 41 078 391 337 3 453 845 84 3 062 508 75 10
Voorberg Prison, Porterville 9.6% 30 482 112 866 1 181 592 39 1 068 726 35 4
Malmesbury New Prison 9.1% 24 299 372 688 4 099 787 169 3 727 099 153 15
Acacia Park & Wingfield Military Base 9.1% 82 324 648 942 7 110 433 86 6 461 491 78 8
Drakenstein Prison 4.0% 85 415 404 809 10 182 314 119 9 777 505 114 5
Average 8% Average 98 Average 88
These baseline energy figures are on average (98kWh/sq m/yr) slightly higher than those obtained for
the Ottery (81kWh/sq m/yr) and Fezeka (83kWh/sq m/yr) multi building complexes. The average savings
realised off the baseline (7%) compare favourably with those obtained from Ottery and Fezeka (4-9%) if
lighting is excluded.
Conclusions
1. There is very little comprehensive audit and M&V data for public buildings available in South Africa.
The most comprehensive data was obtained from the City of Cape Town, and this information has
been used as a basis for typical savings achievable from different building types. This information has

Preparatory work leading to a project proposal on V-NAMA in sub sector of energy efficiency in public buildings:
Analysis report: Baseline, Energy savings potential and Barriers.
37
been cross checked against less substantial data obtained from audits of buildings in Polokwane,
City of Johannesburg and those included in the Department of Public Works programme,
2. Generally, public buildings have lower energy usage per square meter (80-170kWh/m2/yr) when
compared to typical commercial buildings (average 219 kWh/m2/yr). The exception in this study was
the City of Cape Town Civic Centre which had a figure of 240 kWh/m2/yr. The reasons for the
generally low energy usage figures are unclear, but they may be due to low occupancy levels, broken
lights and HVAC equipment, or areas which are not air conditioned, and not because they are
necessarily efficient already. Simple payback periods (6-12 years) on public buildings are therefore
not as attractive as for typical commercial buildings (often 3 years)
3. Retrofits of 3 types of public buildings were assessed
a. Medium sized multi-storey office block (floor area<10 000m2)
b. Single storey multi building compound
c. Large multi storey office block (floor area > 10 000m2)
The medium and large multi storey office blocks showed very similar baseline characteristics with
lighting (27-39%), HVAC (39-41%) and office equipment (16%). The Single storey multi building
compound had a larger proportion of lighting (53%-62%), with HVAC (16%-20%) and office
equipment (10%) not as large. This may be due to the fact that the compound space typically is not
exclusively office space, and as such is not all air conditioned or containing office electrical
equipment.
4. In all 3 building types, the retrofitting of efficient lighting provides the most potential for energy
saving. Figures in building baseline energy reduction from this range from 9% to 24% as a result of
these. The simple payback for lighting is anywhere from 6-12 years, depending on the efficiency and
cost of the technology chosen.
5. In all three building types, HVAC operation optimisation is not a significant component of the
potential savings. However, behaviour change campaigns in 2 of the buildings resulted in larger
energy savings than expected. Efficient behavioural use of the HVAC system therefore can have a
large impact on building efficiency. The only way to realise large scale HVAC savings is through
retrofitting a new and more efficient system. These systems can reduce building energy levels by
11% (over 25% reduction in HVAC energy use).
6. Water heating in single storey multi building compounds is significantly higher proportionally to
overall energy usage when compared to multi storey office blocks (2-4% against 1%). Efficient water
heating retrofits should be considered for these types of sites.

Preparatory work leading to a project proposal on V-NAMA in sub sector of energy efficiency in public buildings:
Analysis report: Baseline, Energy savings potential and Barriers.
38
Benchmark of EE potential by building type
Low High Modify existing New Low High Low High
Single storey multi building compound 9% 13% 2% 5% 2% 4% 13% 22%
Medium sized multi-storey office block
(floor area<10 000m2) 13% 16% 3% 11% 1% 1% 17% 28%
Large multi storey office block (floor
area > 10 000m2) 16% 24% 1%-6% 11% N/A N/A 17%-23% 35%
TotalLighting HVAC Water Heating
% saving from intervention off baseline consumption

Preparatory work leading to a project proposal on V-NAMA in sub sector of energy efficiency in public buildings:
Analysis report: Baseline, Energy savings potential and Barriers.
39
Business models, contracting and legal issues
This report has been developed in a two phase process: an initial data collection and stakeholder
engagement and subsequent follow up and refining of information towards programme
recommendations. Business models and procurement approaches are evaluated more succinctly in Part
II of the report. What follows here is an overview of the emerging experience and process undergone
within government (particularly local government) as they set out to engage in building EE
implementation.
The DPW has done the majority of its energy efficiency retrofits through Energy Performance Contracts
drawing on a shared saving business model. The first programme, which contracted the ESCO Shared
Energy Management (SEM), was structured so that SEM assumed all risk and raised the capital. The
electricity sales avoided through efficiency savings were ‘captured’ and shared according to a
contractually agreed division (ranging from 40 – 60%27
). There was initial resistance to the approach
from the Bid committee as it involved appointment based on method and model, rather than actual cost;
further it was a long-term contract. Presentations and inputs were made to the bid committee to clarify
and inform them about the model, and the Bid Committee then approved the procurement process28.
This shared savings model has also been applied to the latest DPW contract for retrofit in a number of
the provinces, through their regional offices. The programme, including the contracting process and
building identification is done from head office in Pretoria.
DPW is developing a standard Energy Performance Contract that can be used by many government
departments, so as to create a certain level of standardisation and certainty in the market. The
development of this should draw on as much experienced gleaned throughout the country through the
programmes undertaken.
DPW have also undertaken retrofits through a straight capital payments budget, standard contracting
approach, in which the monies have been received as grant funding from National Treasury budget
allocations.
A number of legal and financial systems challenges to energy efficiency retrofit exist at the local level
(and although ‘piggy backing’ on the national contract was explored, this never was never approved).
27
DPW presentation to Parliament, October 2012; Pers. comm. Ossie Lamb, Feb 2013. 28
Pers.comm Ossie Lamb, Feb 2013.

Preparatory work leading to a project proposal on V-NAMA in sub sector of energy efficiency in public buildings:
Analysis report: Baseline, Energy savings potential and Barriers.
40
The first barrier (regardless of whether the business model is funded through a Performance contract
model or capital budget) relates to the two step process of energy efficiency retrofits. The cost of the
retrofit can only be determined post the audit; i.e the costing (and related guarantee of savings) is
dependent on the audit. The two processes are intricately interlinked, but the contracting system does
not readily allow for this: a municipality cannot easily appoint a service provider for an unknown
amount; but if they split the audit and retrofit into two contracts there is no guarantee that the company
that did the audit will be given the contract to retrofit. ESCOs are clear that they would not take on a job
where they must guarantee savings against an audit that they didn’t undertake themselves (i.e. have full
confidence in).
In Cape Town Supply-Chain management, after much wrangling, agreed on a process in which the call for
proposals included both the audit and retrofit, but the assessment of the retrofit cost was based on an
indicative cost for a typical retrofit of a set rand value. This enabled the Bid Adjudication Committee to
assess price and functionality and Supply-Chain have built in checks and balances through making the
process include re-adjudication by the Bid Committee at each stage of the subsequent retrofit costing
process.29
This seems to be fairly cumbersome, and the indications are that procurement approaches
from other sectors, such as IT, or large infrastructure, can provide important blue-prints (e.g. in IT it is
common to establish a ‘benchmark’ and ask companies to develop proposals on how they will exceed
this baseline expectation30
). Ekurhuleni has avoided this barrier altogether through undertaking their
own audits and developing tender specs in-house, then simply appointing a service provider through a
traditional outputs based contract.
Secondly, finding a mechanism for energy efficient building retrofit work that is not reliant on direct
grant money (capital budget) has been a long struggle and, indeed, the majority of retrofits at the local
level have been undertaken through donor and national government grant funding. While grant funding
appears to be a critical element to get public sector retrofit activity started, it does not make sense in the
longer term as resources are constrained and the public sector is not tapping into the sustainable
financing that can be derived through monies saved in avoided electricity costs.
The City of Cape Town and City of Johannesburg, working closely with the Clinton Foundation, explored
the Energy Performance Contracting options. The following obstacles to this approach were encountered
by both cities:
29
City of Cape Town, ERMD, pers. comm., 2012 30 Pers. comm. NT TAU, Feb 2013.

Preparatory work leading to a project proposal on V-NAMA in sub sector of energy efficiency in public buildings:
Analysis report: Baseline, Energy savings potential and Barriers.
41
a. The “shared savings” model relies on ‘ring-fencing’ of savings. This is difficult for municipalities
for two reasons: one is that in a municipality that is an electricity distributor, no actual, hard cash
savings take place. Instead, savings through energy efficiencies simply result in accounting shifts,
or book entries, within the Municipal Finance Department. Secondly, public budget processes
work so that operational costs match budget: a saving in year 1 will result in the necessity to
reduce budget ‘ask’ in year 2.
b. Building retrofit pay back periods are usually longer than 3 years, and a shared saving contract
for more than 3 years would result in the municipality having to follow the conditions of Section
33 of the MFMA – a not impossible, but lengthy and process of jumping through hoops relating
to public comment periods, etc.
c. Section 33 of the MFMA raises the question of whether the contract places a ‘financial
obligation’ on a municipality beyond its budget period (i.e. beyond what it can be certain of
obtaining).
Although in a shared saving scheme the municipality will never be ‘out of pocket’ (i.e. have less money in
total - as the ESCO pays for the costs upfront, and takes the cost of the equipment installation and cost
of the services it provides out of the energy savings created by the work), a legal opinion by the City of
Johannesburg makes the interpretation that the contract may still be considered to impose a ‘financial
obligation’ on the municipality. This is because, although a cost saving is acquired, the municipality is
obligated to make budgetary provision for the payment of the service provider31
.
Overcoming these obstacles is not impossible, but given that undertaking building efficiency does not
offer any immediate net benefit to a municipality (given that budgeting processes mean that savings are
not realised as such - as operational costs go down, so does the budget), while imposing some degree of
risk, putting effort into overcoming procurement challenges will not be a high priority. However, this
work – in particular exploring and aligning the differing national and local interpretations of the
application of MFMA and budget processes – is currently being tackled by the Technical Assistance Unit
of National Treasury32
.
The extensive work by the City of Johannesburg, with the Clinton Foundation, in fact stalled at this point.
Cape Town went on to pursue a guaranteed savings model (see Case Study: City of Cape Town:
‘guaranteed savings’ model). In this model the City pays upfront the capital and service delivery costs to
31
Legal Opinion Re: Whether Section 33 of the MFMA is Applicable to the Energy Efficiency Retrofit Programme,
City of Johannesburg, 2007 32 Pers. comm.. TAU, NT, Feb 2013.

Preparatory work leading to a project proposal on V-NAMA in sub sector of energy efficiency in public buildings:
Analysis report: Baseline, Energy savings potential and Barriers.
42
the ESCO, who in turn guarantees the savings to cover these costs. This is done through the lodging of a
bank guaranteed cheque to the City of Cape Town for the ‘shared saving’ component – thus ensuring
that the City would achieve savings to cover their costs, plus additional. Should the agreed upon savings
not be met, the shortfall in monetary savings would be paid in from this guaranteed cheque. This model
still relies on upfront capital to be supplied by the City (donor, grant or internal budget funds), but does
leverage the performance aspect of the typical EE business model. The experience in Cape Town is that
as savings are ‘proved’ and demonstrated the City Finance department is more willing to ‘find’ the
necessary funds and allocate these for upfront efficiency capital payments, through the budgetary
processes.
Municipalities have also worked to structure contracts so that they can be undertaken within a 3 year
time frame. This has some challenges in that municipalities may have to pay more than the savings at
that point, also they have to make sure that their own maintenance departments are prepared to take
over the maintenance of the efficient equipment and can ensure optimum performance for savings.
All successful approaches at the local level still appear to require some degree of grant and subsidy
funding. The City of Cape Town were able to move on the guaranteed savings scheme as they had
funding through the DOE’s Municipal EEDSM fund to undertake the initial audits and they had DANIDA
UEMP funds to provide some of the retrofit capital. In the sizeable civic centre project now underway,
the City has allocated R21 million from its Finance Department towards capital costs, and the Eskom
Standard Product Programme (SPP) will contribute R6 million (this will be sourced by the ESCO). In the
case of Ekurhuleni, they have moved to create an energy efficiency finance stream within the municipal
electricity tariff. This provides the necessary capital, and retrofits are usually straight equipment
purchase and installation contracts (as detailed in Case study: Ekurhuleni Metropolitan Municipality:
Local government funded energy efficiency)
Case Study: City of Cape Town: ‘guaranteed savings’ model
(For the technical data analysis of this intervention, see Section 3 of this report)
Cape Town recently undertook the first guaranteed savings contract successfully implemented by a
municipality in South Africa. Electricity savings achieved in the first ten months exceeded the guaranteed
savings for the first year.
The City has a long history of developing institutional and policy capacity in support of sustainable energy
development, including efficiency in municipal buildings. Back in early 2000, funding from the SEED
programme, run by SEA, and ICLEI’s Cities for Climate Protection Campaign, allowed for audits and
retrofits of other facilities. Energy policy was developed in the City as early as 2003. An Energy and
Climate Change unit, housed within the Environmental Resource Management Department, was

Preparatory work leading to a project proposal on V-NAMA in sub sector of energy efficiency in public buildings:
Analysis report: Baseline, Energy savings potential and Barriers.
43
established in 2006. This unit plays a substantial and strategic role in establishing and furthering energy
efficiency programmes, which requires dedicated capacity and leadership.
The City’s Energy and Climate Action Plan has an objective to achieve a 10% reduction in energy
consumption in council operations. In support of this, the Energy and Climate Change committee of
council (Section 80) recommended the development of an Internal Energy Management Policy that
would direct the establishment of an Energy Management System (EMS) to govern internal energy use.
This would also look to allocating staff to implement the policy.
After numerous failed attempts to find an acceptable mechanism to undertake municipal energy
efficiency retrofits, the City embarked on a Energy Performance ‘guaranteed savings’ contract, funded
through DANIDA UEMP.33 The model was structured so that all payments were done within a 3 year
period – this was possible as the capital for the intervention was available to the City – and the
conditions of Section 33 of the MFMA were avoided.
The ESCO34 (Shared Energy Management) was appointed in 2009/10 to carry out preliminary and
detailed audits, and energy efficiency retrofits in 4 City-owned administrative buildings. Large,
administrative buildings with a strong public interface were selected. The detailed audits contained
proposed implementation plans for each building, which were reviewed and approved.
The ESCO was required to guarantee savings on an annual basis, through the submission of a bank
guarantee to the City. Should the savings be less than anticipated, the ESCO is required to supplement
the realised savings with their own funding to reach the guaranteed amount. If the savings are higher
than guaranteed, the guarantee period is shortened and the ESCO is released of the commitment earlier.
The ESCO was only required to guarantee savings resulting from the technical interventions (in this sense
the additional behaviour component provided some ‘fat’ in the system for the ESCO). The ESCO
guaranteed savings across all 4 buildings combined. If one building over-performs and another under-
performs, the total savings will be calculated, and the ESCO is bound by this total. This means that only
one guarantee is submitted each year (administratively less cumbersome), but also that the ESCO can
spread its risk.
Challenges and lessons learnt:
• Savings cannot be ring-fenced due to municipal financial legislation and regulations
• Demonstrable benefits are critical in transforming such an energy efficiency programme into a
priority programme that receives budget year on year
• Solar water heater (SWH) payback was long due to low hot water demand, but they were still
installed to promote their use through public visibility. Heat pumps may be considered in future.
• Building maintenance costs decreased, but there is an administrative cost of holding the ESCO to the
payback period. The guarantee period should be a maximum of 2-3 years, with the onus on the ESCO
to prove savings and carry out building maintenance while training facility managers. Skills handover
is critical.
• Savings tend to be underestimated by the ESCO and maximised by the project manager. Reaching
agreement could be challenging.
• Savings achieved through behaviour change was significantly more than expected (acting as a “safety
net” for the ESCO). Maintaining staff behaviour requires continued effort.
In October 2012 the City embarked on the retrofit of 14 additional buildings. This will be funded through
the DOE’s Municipal EEDSM Programme and will involve the retrofit of efficient lighting. The business
33
Danish International Development Agency Urban Environmental Management Programme 34
Energy Service Company

Preparatory work leading to a project proposal on V-NAMA in sub sector of energy efficiency in public buildings:
Analysis report: Baseline, Energy savings potential and Barriers.
44
model will once again be in the form of a guaranteed savings contract with payments taking place within
a 3-year budget cycle (averting requirements of Section 33).
Monitoring, Reporting and Verification
The Department of Energy is tasked with the exercise of monitoring the savings achievements towards
the targets set within the National Energy Efficiency Strategy (2005, reviewed 2008). They are currently
in the process of developing a national Energy Efficiency Target Monitoring System (EETMS). This is a
complex process based on a decomposition approach (i.e. measure the whole and try to identify, with
reasonable degree of accuracy, the drivers behind increases/decreases in total consumption). The
method will be piloted in 2013 and DPW and 5 pilot municipalities (along with industry) will be providing
detailed building baseline information and subsequent savings to be used within the pilot35.
At the same time the Department of Environmental Affairs has the Air Quality Monitoring, as well as
Carbon Monitoring, within its mandates. DEA, with GIZ support and working with the Energy Research
Centre are in the process of developing an MRV (Measurement, Reporting and Verification) approach.
Measurement and monitoring of climate responses is critical to ensure their effective implementation.
The monitoring and evaluation system proposed, in the National Climate Change Response Strategy
(NCCRS) white paper, will monitor, report and verify on the implementation of objectives defined in the
carbon budget and sectoral mitigation strategies. The monitoring process will be coordinated and
overseen by the DEA.
Currently work on an MRV system associated with the NCCRS policy objectives is under development
(GIZ is working with DEA and the Energy Resource Centre, UCT on this). Initial conclusions, according to
Boyd et. al. (2011), are that “The mapping exercise of MRV-related initiatives in South Africa shows that
that there is a wide range of actors, activities, databases and regulations in place, which can provide a
strong basis for a domestic MRV system. These existing initiatives are rather disconnected from each
other, so establishing a coherent framework for MRV will require careful coordination and linking
between existing systems and coordination”36
.
Both departments and SANEDI are members of the Joint Energy Statistics Task Team, which could
provide a forum to ensure that there is healthy collaboration between these two ventures. It is
important that data feed processes are streamlined and not duplicated.
35
This report has not explored the roles of DOE vis. a vis. SANEDI with regard to the ongoing management of the
EETMS post its development. 36
Boyd, A, et. al, South African approaches to measuring, reporting and verifying: A scoping report, Energy
Research Centre, University of Cape Town, South Africa http://www.erc.uct.ac.za/Research/publications/12-Boyd-
etal_Approches_to_MRV.pdf (accessed 12/12/2012)

Preparatory work leading to a project proposal on V-NAMA in sub sector of energy efficiency in public buildings:
Analysis report: Baseline, Energy savings potential and Barriers.
45
Monitoring and verification at the project level in the country is fast developing. The M&V sector in the
country is well developed. The initial DPW shared savings contracts from 1997 were only monitored by
the ESCO and this is being addressed. Further DPW work will draw on third party M&V specialists. M&V
is included as a necessary component of the Municipal EEDSM programme run by DOE. Getting this
aspect of the programme up and running took a while, as municipalities identified specialists, learnt how
to write up terms of reference and evaluate tenders. Of enormous importance is the fact that almost any
EE retrofit project in the country will draw on the Integrated Demand Management (IDM) fund managed
by Eskom. This fund has strict M&V requirements. This data is a vital component of a NAMA programme
in this sub-sector and the method to capture the public building information within this large programme
needs to be developed with Eskom.
M&V can vary in cost depending on complexity of the job. The call is for ‘blueprint’ protocols to be
developed to expedite and reduce the cost of these exercises in the public sector, while maintaining the
credibility of the verification process.37
Stringent certification requirements also serve to keep the
market very small and not very competitive. Particularly for fairly straight forward retrofits, in the public
sector environment, the level of M&V required may be unnecessarily elaborate. A working group was set
up between DOE, M&V experts and SALGA to tackle M&V issues in the municipal sector, but has not yet
met.
Guaranteeing the savings over time and ongoing building maintenance
Public building retrofit is a very new area of work in government and lessons are picked up all along the
way as the first generation of retrofit practice reaches completion. Experience is now indicating that
insufficient attention has been paid to the post retrofit work and the training, resources and activities
needed to support this. Maintenance of the retrofit was partly de-emphasised in contracts in municipal
pilots as it would have pushed the contract beyond the 3 year margin that enabled avoiding Section 33 of
the MFMA in the contracting process.
However this emerges as critical. There is a need for the implementing department to hand over to the
maintenance department an ‘as built list’, so that they are alerted to the new installations and can be
brought into the process of maintaining the new equipment and ensuring that Supply-Chain
management processes supplying Maintenance Stores are given new specs for lighting, etc. This requires
37
Comment by head of Eskom M&V team, Karel Steyn, at ERC/DEA MRV meeting, Johannesburg, 2012; also
articulated in Municipal EEDSM meetings, 2010 – 2012.

Preparatory work leading to a project proposal on V-NAMA in sub sector of energy efficiency in public buildings:
Analysis report: Baseline, Energy savings potential and Barriers.
46
resources and training. This is important as municipalities will often not engage in contracts with ESCO’s
beyond 3 years, and good maintenance is essential if savings are to be ensured and the municipality is to
reap the energy efficiency cost savings.38
A maintenance issue that requires consideration prior to any intervention (not just post) is that of the
average maintenance level of buildings. Frequently raised, across different authority levels, is the fact
that it is common in public buildings to live with a certain level of equipment failure39. Regular building
maintenance is a luxury few government agencies have access to, and, in the case of the national DPW
maintenance is done through external contractors. It is common, therefore, to tolerate equipment
failure until resources are available to bring in new equipment and/or sufficient ‘failures’ warrant
bringing in a maintenance contractor.
This is a double edged sword for energy efficiency programmes. The prevailing situation is ‘efficient’ but
may not be ideal in terms of occupational health and safety. There are also mixed incentives: for an
ESCO in a performance contract it makes sense to ensure that new equipment is operating at maximum
efficiency, but total equipment failure (beyond the equipment guarantee period) will increase savings,
while replacing it carries costs. How these maintenance agreements are sorted out between the parties
has to be clear and ensure optimum efficiency and occupational health conditions.
38
A recent anecdote from a municipality graphically illustrates the importance of this step: Buildings maintenance
lowered the ceiling in a building that had undergone a retrofit. Equally efficient new lighting and fittings were put
into the new ceiling. However, when the ESCO did their routine energy performance check they discovered the
earlier lights, sandwiched between the two ceilings, were still switched on! 39
Anecdotally, officials speak of HVAC equipment being out of action for over two years; an audit of a building in
Polokwane found up to 50% of the existing light fittings were not fitted with working lamps.

Preparatory work leading to a project proposal on V-NAMA in sub sector of energy efficiency in public buildings:
Analysis report: Baseline, Energy savings potential and Barriers.
47
Section 3: Public Building Energy Consumption Baseline Picture
National Public Buildings
The last published record of data for public buildings in the country was in the DME 2000 National Energy
Balance. This provides a valuable indication of the public building baseline for the country, but at this
stage should be treated as indicative only: the method of data collection is not known and this level of
disaggregation was abandoned post 2000 due to lack of reliability of the data.
Total Energy 2000 (in PJ)
% of all provinces
Public building ELEC consumption (GWh)
% total pubic building ELEC consumption
Western Cape 289.86 13 1808.33 21%Easatern Cape 180.19 8 669.44 8%Northern Cape 35.67 2 141.67 2%Free State 121.4 5 391.67 5%KwaZulu Natal 475.7 21 983.33 12%North West 131.2 6 380.56 4%Gauteng 783.82 34 3377.78 40%Mpumalanga 193.14 8 338.89 4%Northern Province 84.79 4 369.44 4%Total for all provinces 2295.77 100 8461.11 100%
Based on this picture, public buildings (at 30.5PJ of consumption) can be said to represent 1,33% of
national final end use energy consumption. Most recent final end use energy demand has been
published by DOE for 2009 at 2 627 PJ; if the percentage holds, then approximately 34,9 PJ was
consumed within the public building sub-sector. This would translate into 9 705 GWh.
This sub-sector comprises national-DPW buildings, Provincial administrative, health and
education buildings, and municipal administrative, workshop and other community facilities. An
attempt to quantify these three components is provided below and provides the following
picture:
National-DPW 2 792 GWh
Provincial (hospitals only) 948 GWh
Municipal: (buildings only, conservative
estimations in absence Eskom data)
498 GWh
Total 4 238 GWh
Total based on 2000 Energy balance 1,33%
total final energy consumption
9 705 GWh
A fairly large gap between the figure above (9 705 GWh) and the sum of the components
persists. This could be for a variety of reasons:
• national figures include municipal services, such as pump stations, public lighting (this would
substantially increase the municipal consumption figure);
• municipal figures difficult to calculate in absence of Eskom data;
• provincial figures for admin and education are still not known;
• method for national figure calculations is not known.

Preparatory work leading to a project proposal on V-NAMA in sub sector of energy efficiency in public buildings:
Analysis report: Baseline, Energy savings potential and Barriers.
48
National-DPW Buildings
POLICY/MANDATE
Department of Energy responsible for implementation of the National Energy Efficiency Strategy (2005,
reviewed 2008); Department of Environmental Affairs responsible for the implementation of the
National Climate Change Response Strategy (2010) which identified public building efficiency as a
‘flagship’ project; Department of Public Works is custodian of 72,000 national buildings/facilities;
Department of Trade and Industry responsible for building regulation.
BUILDING STOCK
National buildings primarily relate to offices of line departments, prestige buildings and legislation
enforcement and the military, consisting of magisterial offices and courts, supreme courts, military
bases, prisons, ‘safe houses’ and complexes under the departments of the South African Police Service,
Justice and Constitutional Development, Correctional Services, and Defence and Military Veterans. There
are also some museums under the Department of Arts and Culture and erven under the Department of
Rural Development and Land Reform.
DPW regional offices No. of sites* Annual electricity
consumption Annual spend on
electricity
Eastern Cape 303 No data R 97,420,548.95
Free State 363 No data R 124,352,719.83
Gauteng NA No data NA
KwaZulu-Natal NA No data NA
Limpopo NA No data NA
Mpumalanga NA No data NA
Northern Cape NA No data NA
North West NA No data NA
Western Cape 1,177 (with 18 000
structures) No data R 279,184,200.20
* A site may represent one large building, or a number of structures in a complex, such as a Correctional
Service facility, with prison, warder houses, offices, etc.
NA = Data not requested and/or not received; this data is accessible.
Building Type No. of buildings/ sites Annual electricity spend
Eastern Cape Free State Eastern Cape Free State
Community
facilities 3% 4% 8% 17%
Complex/Office 61% 40% 42% 42%
Court 3% 15% 4% 6%
Land 6% 13% 1% 4%
Military 2% 3% 1% 5%
Other 6% 8% 4% 1%
Prison 6% 7% 38% 24%
Residential 13% 10% 2% 2%
Services 1% 1%
Services = shops/stores; Military = military base, commando, regiment; Residential = SAPS emergency
dwellings; Land = erven; Complex = mainly office, but usually undefined
Department No. of Buildings Annual Electricity Spend

Preparatory work leading to a project proposal on V-NAMA in sub sector of energy efficiency in public buildings:
Analysis report: Baseline, Energy savings potential and Barriers.
49
Eastern Cape Free State Western
Cape
Eastern Cape Free State Western
Cape
Agriculture, Forests
& Fisheries
1% 0% 1% 2% 0% 3%
Arts & Culture 0% 2% 3% 0% 2% 3%
Communications 2% 0%
Correctional
Services
9% 10% 3% 38% 36% 25%
Defence & Military
Veterans
3% 4% 1% 7% 33% 29%
Energy 5% 0%
Environmental
Affairs
1% 1%
Gender Equality
Commission
5% 0%
Government
Communications
3% 0%
Health 1% 0%
Home Affairs 0% 1% 0% 0%
Human Rights
Commission
5% 0%
Independent Police
Investigation
2% 0%
Justice &
Constitutional
Development
16% 21% 2% 10% 8% 5%
Labour 1% 1% 1% 1%
Leased Out
Privately
8% 0%
National
Prosecuting
Authority
5% 0%
NDPW Prestige 8% 9%
Public Protector 2% 0%
Public Works 2% 1% 2% 2% 2% 2%
Rural
Development, Land
& Reform
4% 2% 0% 1%
SA Micro Apex
Fund
6% 0%
SA Police Services 64% 55% 1% 39% 18% 17%
SA Revenue
Services
1% 0% 4% 1% 1% 0%
SA Social Security
Agency
0% 5% 0% 0%
Statistics SA 3% 0%
Trade & Industry 1% 0%
Unknown 8% 0%
Unutilised 3% 3% 8% 0% 0% 0%
Water Affairs 1% 2% 0% 1%
TOTAL 100% 100% 100% 100% 100% 100%
EFFICIENCY RETROFITS PROGRESS TO DATE
Shared savings contracts in four regions (from the Pretoria, Johannesburg, Cape Town and Bloemfontein
regional offices) from 1997-2010; National Treasury funded implementation 2008-2012; new shared

Preparatory work leading to a project proposal on V-NAMA in sub sector of energy efficiency in public buildings:
Analysis report: Baseline, Energy savings potential and Barriers.
50
savings contracts underway, broadly, 2010 – 2020, across a number of regions (including KwaZulu-Natal,
Western Cape, North West).
Total buildings retrofitted (all structures): 5 392
Total monies spent (does NOT include shared savings investments): R 180 million
Recorded annual savings to date: approx some 54 GWh/annum (however, full figures not known as not
clear: see analysis in footnote40)
TOTAL BASELINE ELECTRICITY CONSUMPTION
The following is highly indicative, but provides insight into the method towards establishing a baseline. A
fair bit more work would need to be done in order to increase the validity of the baseline:
NOTE: this calculation is for DPW-‘owned’ assets only (it not a national public buildings total as per 2000
DME Energy balance figures).
a. Western Cape regional DPW spend on electricity 2011: R279, 184,200.20
b. Western Cape represents 9 – 10% of national total energy consumption
c. Assuming public building consumption is proportional that would mean national spend on public
building electricity is in region of R2,791,842,002.00
d. Assuming an average charge of R1/kWh this represents : 2 791 842 002 kWh (2 792 GWh)
CONCLUSIONS
40 DPW figures presented to parliament, October 2012: report analysis (SEA 2013)
Project Start End
no
years kWh saved R saved kWh saved/yr R saved/yr
R/kWh
saved
Pretoria 2003 2011 8
101,770,824 R 36,203,787 12,721,353 R 4,525,473 ZAR 0.36
Joburg 2000 2010 10
108,641,210 R 46,629,107 10,864,121 R 4,662,911 ZAR 0.43
Bloemfontein 2003 2010 7
55,973,806 R 26,372,777 7,996,258 R 3,767,540 ZAR 0.47
Cape Town 1997 2009 12
269,502,386 R 45,528,418 22,458,532 R 3,794,035 ZAR 0.17
***Full table with unclear data
Project Start End
no
years kWh saved R saved kWh saved/yr R saved/yr R/kWh saved
Pretoria 2003 2010 7
1,147,608 R 311,973,659 163,944 ZAR 44,567,666 ZAR 271.85
Pretoria 2003 2010 7
1,147,608 R 31,973,659 163,944 ZAR 4,567,666 ZAR 27.86
Pretoria 2003 2011 8
101,770,824 R 36,203,787 12,721,353 ZAR 4,525,473 ZAR 0.36
Joburg 2000 2010 10
108,641,210 R 46,629,107 10,864,121 ZAR 4,662,911 ZAR 0.43
Bloemfontein 2003 2010 7
55,973,806 R 26,372,777 7,996,258 ZAR 3,767,540 ZAR 0.47
Cape Town 1997 2009 12
269,502,386 R 45,528,418 22,458,532 ZAR 3,794,035 ZAR 0.17
Cape Town 2009 2011 2
1,997,673 R 7,116,241 998,837 ZAR 3,558,121 ZAR 3.56

Preparatory work leading to a project proposal on V-NAMA in sub sector of energy efficiency in public buildings:
Analysis report: Baseline, Energy savings potential and Barriers.
51
Cumulatively, office complexes add up and comprise 40-50% of consumption; from a departmental
perspective, it is the large military, policy and correctional service complexes that dominate. These two
areas should be priorities.
Although electricity consumption data is not available, the rand consumption and building stock data is
relatively accessible and a more complete picture could be derived.

Preparatory work leading to a project proposal on V-NAMA in sub sector of energy efficiency in public buildings:
Analysis report: Baseline, Energy savings potential and Barriers.
52
Provincial Buildings
POLICY/MANDATE
Provinces have a concurrent environmental mandate with national government, and as such must
contribute to the delivery of the NCCRS implementation and undertake Air Quality monitoring reporting
(including GHG emissions). Provinces have mandates around education and health and are the
custodians of provincial departmental buildings, schools, hospitals and old age facilities. A number of
provinces have developed local energy and climate policy and set targets for achieving efficiency in their
own operations.
BUILDING STOCK
Provincial buildings consist mainly of clinics, hospitals, schools and the provincial government’s own
offices. The most comprehensive provincial building data available was for hospitals. A summary of
hospital buildings is presented below:
Hospitals by Province
District Hospitals
National Central Hospitals
Provincial Tertiaries
Regional Hospitals
Specialised Hospital
Community Hospitals
Psychiatric Hospitals
Provincially-aided Hospitals
Total
Eastern Cape 45 8 2 10 5 18 88Free State 25 1 5 1 32Gauteng 8 4 11 4 4 31KwaZulu Natal 43 1 2 13 8 4 71Limpopo 32 2 6 3 43Mpumalanga 23 2 3 5 33Northern Cape 13 1 5 7 1 27North West 21 5 2 28Western Cape 22 3 8 5 5 15 58Total 232 8 20 49 40 7 22 33 411Source: Dept of Health
Detailed energy data for hospitals was only made available by the Chief Engineer for the Western Cape
Provincial Department of Health. This included energy breakdown by hospital type, floor area of these
buildings and energy performance of the buildings based on energy per square metre per annum. This
information was then applied across the national hospital breakdown above to provide a rough national
approximation by province of hospital energy usage patterns:
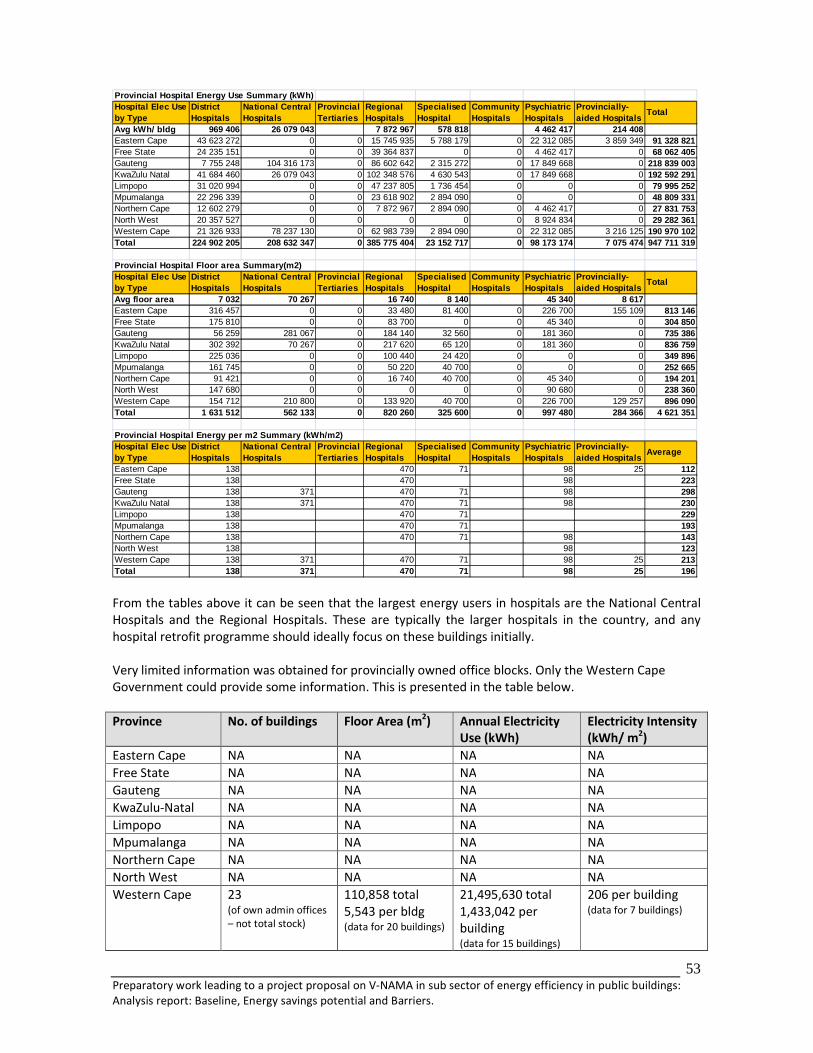
Preparatory work leading to a project proposal on V-NAMA in sub sector of energy efficiency in public buildings:
Analysis report: Baseline, Energy savings potential and Barriers.
53
Provincial Hospital Energy Use Summary (kWh)Hospital Elec Use by Type
District Hospitals
National Central Hospitals
Provincial Tertiaries
Regional Hospitals
Specialised Hospital
Community Hospitals
Psychiatric Hospitals
Provincially-aided Hospitals
Total
Avg kWh/ bldg 969 406 26 079 043 7 872 967 578 818 4 462 417 214 408Eastern Cape 43 623 272 0 0 15 745 935 5 788 179 0 22 312 085 3 859 349 91 328 821Free State 24 235 151 0 0 39 364 837 0 0 4 462 417 0 68 062 405Gauteng 7 755 248 104 316 173 0 86 602 642 2 315 272 0 17 849 668 0 218 839 003KwaZulu Natal 41 684 460 26 079 043 0 102 348 576 4 630 543 0 17 849 668 0 192 592 291Limpopo 31 020 994 0 0 47 237 805 1 736 454 0 0 0 79 995 252Mpumalanga 22 296 339 0 0 23 618 902 2 894 090 0 0 0 48 809 331Northern Cape 12 602 279 0 0 7 872 967 2 894 090 0 4 462 417 0 27 831 753North West 20 357 527 0 0 0 0 0 8 924 834 0 29 282 361Western Cape 21 326 933 78 237 130 0 62 983 739 2 894 090 0 22 312 085 3 216 125 190 970 102Total 224 902 205 208 632 347 0 385 775 404 23 152 717 0 98 173 174 7 075 474 947 711 319
Provincial Hospital Floor area Summary(m2)Hospital Elec Use by Type
District Hospitals
National Central Hospitals
Provincial Tertiaries
Regional Hospitals
Specialised Hospital
Community Hospitals
Psychiatric Hospitals
Provincially-aided Hospitals
Total
Avg floor area 7 032 70 267 16 740 8 140 45 340 8 617Eastern Cape 316 457 0 0 33 480 81 400 0 226 700 155 109 813 146Free State 175 810 0 0 83 700 0 0 45 340 0 304 850Gauteng 56 259 281 067 0 184 140 32 560 0 181 360 0 735 386KwaZulu Natal 302 392 70 267 0 217 620 65 120 0 181 360 0 836 759Limpopo 225 036 0 0 100 440 24 420 0 0 0 349 896Mpumalanga 161 745 0 0 50 220 40 700 0 0 0 252 665Northern Cape 91 421 0 0 16 740 40 700 0 45 340 0 194 201North West 147 680 0 0 0 0 0 90 680 0 238 360Western Cape 154 712 210 800 0 133 920 40 700 0 226 700 129 257 896 090Total 1 631 512 562 133 0 820 260 325 600 0 997 480 284 366 4 621 351
Provincial Hospital Energy per m2 Summary (kWh/m2)Hospital Elec Use by Type
District Hospitals
National Central Hospitals
Provincial Tertiaries
Regional Hospitals
Specialised Hospital
Community Hospitals
Psychiatric Hospitals
Provincially-aided Hospitals
Average
Eastern Cape 138 470 71 98 25 112Free State 138 470 98 223Gauteng 138 371 470 71 98 298KwaZulu Natal 138 371 470 71 98 230Limpopo 138 470 71 229Mpumalanga 138 470 71 193Northern Cape 138 470 71 98 143North West 138 98 123Western Cape 138 371 470 71 98 25 213Total 138 371 470 71 98 25 196
From the tables above it can be seen that the largest energy users in hospitals are the National Central
Hospitals and the Regional Hospitals. These are typically the larger hospitals in the country, and any
hospital retrofit programme should ideally focus on these buildings initially.
Very limited information was obtained for provincially owned office blocks. Only the Western Cape
Government could provide some information. This is presented in the table below.
Province No. of buildings Floor Area (m2) Annual Electricity
Use (kWh) Electricity Intensity
(kWh/ m2)
Eastern Cape NA NA NA NA
Free State NA NA NA NA
Gauteng NA NA NA NA
KwaZulu-Natal NA NA NA NA
Limpopo NA NA NA NA
Mpumalanga NA NA NA NA
Northern Cape NA NA NA NA
North West NA NA NA NA
Western Cape 23 (of own admin offices
– not total stock)
110,858 total 5,543 per bldg (data for 20 buildings)
21,495,630 total 1,433,042 per
building (data for 15 buildings)
206 per building (data for 7 buildings)

Preparatory work leading to a project proposal on V-NAMA in sub sector of energy efficiency in public buildings:
Analysis report: Baseline, Energy savings potential and Barriers.
54
NA = Data not requested and/or not received.
EFFICIENCY RETROFITS PROGRESS TO DATE
Commitments to achieving efficiency in own buildings across four provinces, but no very visible signs of
retrofits in progress. Western Cape Property Management office is busy compiling a ‘State of the Estate’
report which will develop a comprehensive building registry and related resource consumption. Notably,
the Western Cape Department of Health Engineering division has been engaged in resource consumption
monitoring and management for a number of years. All hospitals (save Riversdale) have been retrofitted
with EE water heating devices (predominantly heat pumps) and ‘cool’ roofs have been emphasised to
ease the load on HVAC systems. A wealth of knowledge exists here on efficient building design and
management, benchmarks for best practice have been derived and a process of monitoring consumption
and responding to ‘spikes’ is in place.
TOTAL ELECTRICITY CONSUMPTION
There is insufficient data to develop this picture.
CONCLUSION
This study approached three provinces, but was only able to obtain information from one. Indications
are that this sector is lagging, despite commitments. Interestingly, two of the provinces noted that
people within the Health departments were interested in pursuing efficiency and it should be noted that
a lot of potential savings could be realised here as hospitals have boilers, massive air conditioning plants,
laundries and lighting. Similarly, one ESCO consultant raised the idea of efficiency in schools with hostels
and old age homes, where water heating and lighting are issues. These institutions are struggling, with
new tariff schedules excluding them from low rates, to pay bills.
Information obtained on hospitals in the Western Cape indicates that a programme focussed on the
larger hospitals (National and Regional) will potentially realise the greatest energy saving returns due to
their substantially larger consumption levels per square metre. It is assumed that the same would be
true for other National and Regional hospitals nationally.
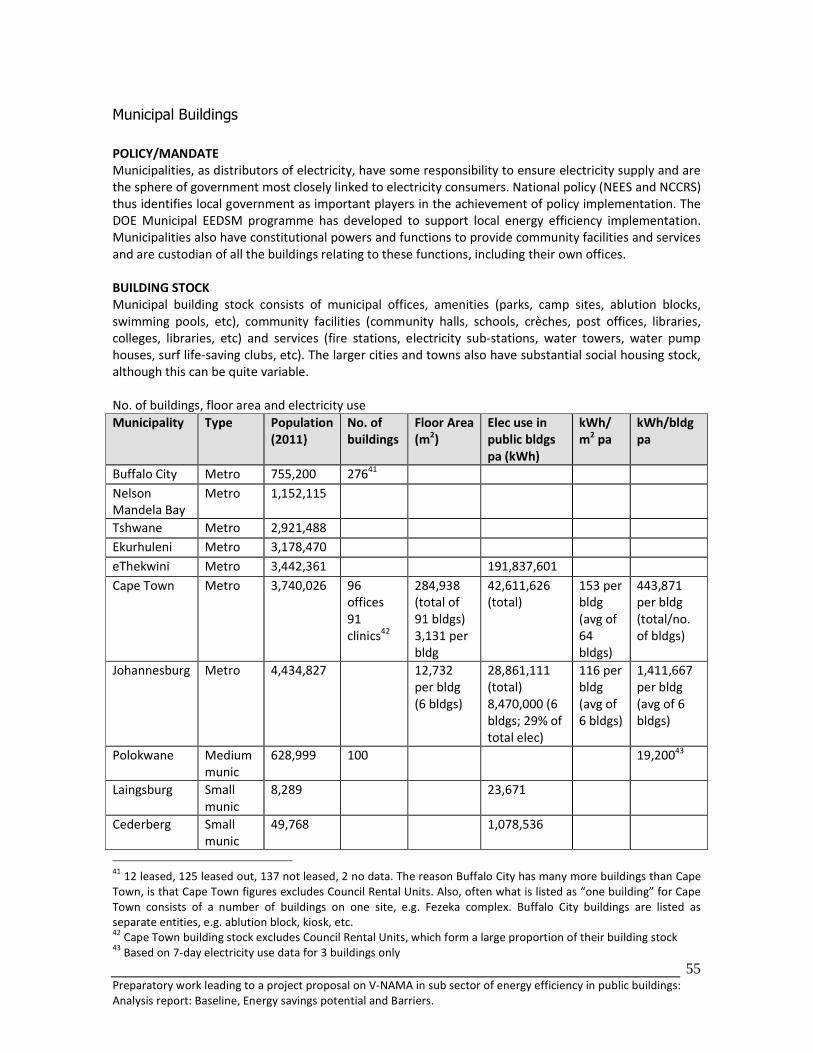
Preparatory work leading to a project proposal on V-NAMA in sub sector of energy efficiency in public buildings:
Analysis report: Baseline, Energy savings potential and Barriers.
55
Municipal Buildings
POLICY/MANDATE
Municipalities, as distributors of electricity, have some responsibility to ensure electricity supply and are
the sphere of government most closely linked to electricity consumers. National policy (NEES and NCCRS)
thus identifies local government as important players in the achievement of policy implementation. The
DOE Municipal EEDSM programme has developed to support local energy efficiency implementation.
Municipalities also have constitutional powers and functions to provide community facilities and services
and are custodian of all the buildings relating to these functions, including their own offices.
BUILDING STOCK
Municipal building stock consists of municipal offices, amenities (parks, camp sites, ablution blocks,
swimming pools, etc), community facilities (community halls, schools, crèches, post offices, libraries,
colleges, libraries, etc) and services (fire stations, electricity sub-stations, water towers, water pump
houses, surf life-saving clubs, etc). The larger cities and towns also have substantial social housing stock,
although this can be quite variable.
No. of buildings, floor area and electricity use
Municipality Type Population
(2011) No. of
buildings Floor Area
(m2) Elec use in
public bldgs
pa (kWh)
kWh/
m2 pa kWh/bldg
pa
Buffalo City Metro 755,200 27641
Nelson
Mandela Bay Metro 1,152,115
Tshwane Metro 2,921,488
Ekurhuleni Metro 3,178,470
eThekwini Metro 3,442,361 191,837,601
Cape Town Metro 3,740,026 96
offices 91
clinics42
284,938
(total of
91 bldgs) 3,131 per
bldg
42,611,626
(total) 153 per
bldg
(avg of
64
bldgs)
443,871
per bldg
(total/no.
of bldgs)
Johannesburg Metro 4,434,827 12,732
per bldg
(6 bldgs)
28,861,111
(total) 8,470,000 (6
bldgs; 29% of
total elec)
116 per
bldg
(avg of
6 bldgs)
1,411,667
per bldg
(avg of 6
bldgs)
Polokwane Medium
munic 628,999 100 19,20043
Laingsburg Small
munic 8,289 23,671
Cederberg Small
munic 49,768 1,078,536
41
12 leased, 125 leased out, 137 not leased, 2 no data. The reason Buffalo City has many more buildings than Cape
Town, is that Cape Town figures excludes Council Rental Units. Also, often what is listed as “one building” for Cape
Town consists of a number of buildings on one site, e.g. Fezeka complex. Buffalo City buildings are listed as
separate entities, e.g. ablution block, kiosk, etc. 42
Cape Town building stock excludes Council Rental Units, which form a large proportion of their building stock 43
Based on 7-day electricity use data for 3 buildings only

Preparatory work leading to a project proposal on V-NAMA in sub sector of energy efficiency in public buildings:
Analysis report: Baseline, Energy savings potential and Barriers.
56
Municipality Type Population
(2011) No. of
buildings Floor Area
(m2)
Elec use in
public bldgs
pa (kWh)
kWh/
m2 pa
kWh/bldg
pa
Hessequa Small
munic 52,642 13
offices 3 camps
22,935
(offices) 5,478
(camps) 1,764 per
office 1,826 per
camp
1,112,739
(may incl
WWTW)
Knysna Small
munic 68,659 10,074,394
(may incl
WWTW)
Mossel Bay Small
munic 89,430 3,450,248
(may incl
WWTW)
Oudtshoorn Small
munic 95,933 1,064,730
Langeberg Small
munic 97,724 8,196,588
(may incl
WWTW)
Saldanha Bay Small
munic 99,193 304,000
Swartland Small
munic 113,762 800,000
George Small
munic 193,672 2,400,000
Sol Plaatje Small
munic 248,041 108
Drakenstein Small
munic 251,262
No. of buildings/ sites by building type
Buffalo City Ekurhuleni Hessequa Sol Plaatje
TYPE Metro Metro Small Municipality Small Municipality
Amenities 14% 3% 19% 22%
Clinic 12% 7%
Community
facilities 17% 18% 25%
Complex
Court 2%
Depot 3% 3%
Land
Military
Office 28% 33% 81% 26%
Other 6% 14%
Prison
Residential 23% 15%

Preparatory work leading to a project proposal on V-NAMA in sub sector of energy efficiency in public buildings:
Analysis report: Baseline, Energy savings potential and Barriers.
57
Buffalo City Ekurhuleni Hessequa Sol Plaatje
Retail 4% 4%
Services 4% 14% 1%
TOTAL 100% 100% 100% 100%
Annual electricity use by building type
Type eThekwini44
Amenities 6%
Community facilities 7%
Depot 1%
Office 26%
Other 17%
Residential 33%
Services 9%
EFFICIENCY RETROFITS PROGRESS TO DATE
A number of municipal buildings across the country have benefited through the Eskom CFL roll out.
Leading metros, notably Ekurhuleni and Cape Town have initiated large retrofit projects through donor
and own funding, as well as the DOE’s Municipal EEDSM. This programme has seen some five or so cities
and towns undertake building audits and lighting retrofits (in case of Polokwane, also HVAC and heat
pumps). In the current cycle of funding this number is set to increase to about 20.
City of Cape Town and Ekurhuleni have already tackled their major office/ civic complexes.
TOTAL ELECTRICITY CONSUMPTION
Municipal own-use and public buildings electricity consumption
Entity Type Population
(2011) Own elec use (% of
metro/munic total) Elec use in public bldgs
(% of own use) Buffalo City Metro 755,200 3% (excl Eskom)
Nelson Mandela Bay Metro 1,152,115 19% (excl Eskom)
Tshwane Metro 2,921,488 10% (excl Eskom)
Ekurhuleni Metro 3,178,470 3% (excl Eskom)
eThekwini Metro 3,442,361 3% (excl Eskom)
3% (incl Eskom)
53%
Cape Town Metro 3,740,026 3% (excl Eskom)
2% (incl Eskom)
16%
Johannesburg Metro 4,434,827 2% (incl Eskom) 10%
Laingsburg Small munic 8,289 7% (excl Eskom) 7%
Cederberg Small munic 49,768 5% (excl Eskom) 40%
Hessequa Small munic 52,642 3% (excl Eskom) 51% (may incl WWTW45
)
Knysna Small munic 68,659 9% (excl Eskom) 76% (may incl WWTW)
Mossel Bay Small munic 89,430 4% (excl Eskom) 31% (may incl WWTW)
Oudtshoorn Small munic 95,933 7% (excl Eskom) 10%
Langeberg Small munic 97,724 5% (excl Eskom) 65% (may incl WWTW)
44
In eThekwini, hostels account for twice as much electricity consumption as municipal offices. Source: eThekwini
GHG Inventory, 2011. There are almost 14,000 residential units within the 10 CRU complexes in the city and they
house approximately 100,000 people. Of these approximately 25% currently have geysers for hot water and the
bulk of residents use kettles and two plate stoves to heat water for bathing and washing. Project Summary
Document: KwaDabeka Hostel Hot Water Pilot 45
Waste Water Treatment Works

Preparatory work leading to a project proposal on V-NAMA in sub sector of energy efficiency in public buildings:
Analysis report: Baseline, Energy savings potential and Barriers.
58
Entity Type Population
(2011) Own elec use (% of
metro/munic total) Elec use in public bldgs
(% of own use) Saldanha Bay Small munic 99,193 11% (excl Eskom)
1% (incl Eskom)
1%
Theewaterskloof Small munic 108,790 5% (excl Eskom)
Swartland Small munic 113,762 4% (excl Eskom) 12%
George Small munic 193,672 7% (excl Eskom) 7%
Sol Plaatje Small munic 248,041 2% (excl Eskom)
Drakenstein Small munic 251,262 3% (excl Eskom)
Sources: State of Energy in SA Cities 2011, eThekwini Greenhouse Gas Inventories
Using the method to move towards establishing a baseline, provides the following outcome:
d. Municipal distribution in South Africa for 2011 is: 91 564 GWh - 40.8% of the national
total (Sales to redistributors, Eskom Annual Report, 2011)
e. Of this approximately 3.4% is typically for municipal electricity consumption (mostly for
streetlights, traffic lights, public buildings and water): 3 113 GWh (methodology in this
report under Section 4: Macro analysis of potential for energy saving)
f. Typically 16% of the municipal consumption is for public buildings: 498 GWh
(methodology in Section 4)
Further work needs to be done in order to be able to present a baseline with a higher confidence level.
CONCLUSIONS
Broadly the key areas for municipal efficiency consideration amongst their building stock would be
offices, amenities and social housing/hostels. However, consumption appears to vary considerably and
larger towns would do well to analyse consumption in order to decide on strategic interventions – for
example, in the City of Johannesburg the large metro office in the centre of town accounts for some 60%
of total municipal electricity consumption.
Smaller municipalities contribute very little to the consumption totals. Here relatively easily accessed
lighting programmes are sufficient.

Preparatory work leading to a project proposal on V-NAMA in sub sector of energy efficiency in public buildings:
Analysis report: Baseline, Energy savings potential and Barriers.
59
Institutional Baseline Picture
Energy efficiency in public buildings: policy mandates
The two key policies in South Africa which speak to the issue of energy efficiency in public buildings are
the National Energy Efficiency Strategy (2005, reviewed 20008) and the National Climate Change
Response Strategy (NCCRS, 2010):
The Department of Energy (DoE) holds the mandate to implement the NEES and is responsible for
ensuring energy security within the country broadly (through the Energy Act, 2008). The NEES provides
clear and practical guidelines for the implementation of efficient practices within our economy, including
the setting of governance structures for activity development, promotion and coordination. The
department’s activities in energy efficiency promotion are mostly focused on electricity efficiency.
The Department of Environmental Affairs (DEA) is involved in South Africa’s energy efficiency policy
through its White Paper on National Climate Change Response, aimed at meeting international emissions
reduction commitments. Energy efficiency forms a significant portion of the emissions reduction
potential. This is recognised in the NCCRS, which also specifically identifies public building energy
efficiency as a “flagship project” towards meeting emission reduction targets. The department intends to
develop a V-NAMA project in the sub-sector of building energy efficiency.
Other government departments or spheres, and agencies, involved in energy efficiency in public
buildings policy implementation are:
• Department of Public Works (DPW)
• National Energy Efficiency Agency (NEEA) and SANEDI
• Department of Trade and Industry (DTI)
• Local government authorities (municipalities)
• Provincial governments
The Department of Public Works (DPW) link to public building energy efficiency lies in its mandate
around the provision and management of the accommodation, housing, land and infrastructure needs of
national departments. DPW is the custodian of a portfolio of some 72,000 state buildings. Energy
efficiency in government buildings has been a priority for the department since 1997. The department
has saved millions of Rands (ZAR) through its energy efficiency initiatives. DPW has also formulated an

Preparatory work leading to a project proposal on V-NAMA in sub sector of energy efficiency in public buildings:
Analysis report: Baseline, Energy savings potential and Barriers.
60
energy code of conduct for all buildings under its custodianship for implementation by national
government departments that are using state-owned and leased buildings.
The Department of Trade and Industry (DTI) developed the country’s Energy Efficiency Building
Regulations in 2011. The energy efficiency regulations require that all new buildings, whether it is homes,
industrial buildings, hotels and schools will have to meet minimum energy efficiency requirements. The
energy efficiency regulations are in terms of the National Building Regulations and Buildings Standards
Act 2008 (Act No. 103 of 1977).
Intergovernmental task teams have been established to coordinate work relating to these joint, or
overlapping mandates, in the area of energy management and energy efficiency in public buildings. Of
relevance are:
• The Joint Energy Statistics Task Team (JESTT) – was established to meet the demand for quality
energy statistics through collaboration with relevant institutions in the country. The task team
consists of the DoE, StatsSA, NERSA and SANEDI.
• The Energy Efficiency in Public Buildings Task Team - is an inter-departmental task team,
formed on 14th February 2008 specifically for the purposes of developing a co-ordinating and
accelerating the energy programme in state-owned buildings. Central to the task team are DoE
and DPW. Other organisations that have been incorporated into this task team include Eskom,
PRASA, DEA, SANEDI/NEEA and GIZ.
Provincial and local government: South Africa’s Constitution (1996) provides the legal basis for
allocating powers to different spheres of government and sets out the functional areas of national,
provincial and local government competencies in Schedule 4 and 5. Energy is currently a national
competency except in the case of electricity reticulation which is a function performed by local
government.
Local government: Schedules 4 and 5, Part B of the Constitution allocates powers and functions to local
government. These include custodianship, development and provision of all public facilities and
amenities relating to the functioning of local government and its provision of community services.
Consequently, municipalities are identified in the two major policy directives around energy efficiency in
public buildings, as key to policy delivery. However, the official ‘mandate’ around energy efficiency in
public buildings at local government is not clear. Municipalities also note that the devolution of the
delivery on this policy objective needs to be accompanied by the resources and capacity allocation to do
the related work.

Preparatory work leading to a project proposal on V-NAMA in sub sector of energy efficiency in public buildings:
Analysis report: Baseline, Energy savings potential and Barriers.
61
A number of municipalities, particularly amongst the larger metros, have also, in the past decade,
developed their own energy efficiency policies with some energy efficiency targets in place. These
include Internal energy management policies, and, in the case of Ekurhuleni, a policy specifically
addressing energy efficiency in council owned and occupied buildings (2009).
Provincial Government: Provinces have no direct mandate around energy, but there is however a clear
and demonstrable link between energy and the environment, the latter (including Air Quality
management functions) a concurrent function in terms of the Constitution, which links them closely to
the national Department of Environment in terms of efforts towards achieving the NCCRS emissions
reduction commitments.
Provincial government are allocated powers and functions around schools, hospitals and old age
facilities. In addition, they must manage their own building infrastructure.
Provincial energy efficiency targets in place:
Province Source EE target in Commercial/
Public Buildings sector
Eastern Cape Province Eastern Cape Sustainable Energy Strategy,
2012 10 % by 2015 (provincial
buildings)
Gauteng Province Assessment of Energy Efficiency and
Renewable Energy Potential in Gauteng and
Associated Long Term Energy Planning
Implications, 2010
13 % by 2014
25% by 2025
North West Province Renewable Energy Strategy for the North
West Province, 2012 Unspecified
Western Cape Province White Paper on Sustainable Energy for the
Western Cape Province, 2010 11% by 2014
Other institutions
South Africa’s universities, scientific and research institutions and NGOs are also very active participants
in the country’s energy efficiency programmes. These institutions conduct the following activities for
energy efficiency promotion and implementation in the public buildings sector:
• recommendations for government institutions for energy efficient improvement,
• collection and dissemination of information on available energy saving potential in the public
buildings sector,
• critical analysis of best practices in the development and implementation of energy efficiency
and environmental policies,
• development of scientific research for innovative energy efficient technologies,

Preparatory work leading to a project proposal on V-NAMA in sub sector of energy efficiency in public buildings:
Analysis report: Baseline, Energy savings potential and Barriers.
62
• creation of databases on energy efficient technologies and equipment
• M&V expertise,
• Benchmarking and rating system development and administration.
Buildings/Asset registries
From the survey conducted, it appears that most authorities, local to national, have some degree of
building registry (although engagement with provinces in this study was limited); however these are not
compiled in any comparable way, such as by building type, or floor space. In very few instances are there
known and recorded electricity consumption figures for public buildings. (See Appendix: State of
information on public buildings for a full outline of the state of building registries amongst the authorities
surveyed).
National government: Regional offices of the Department of Public Works: DPW is the custodian of
state buildings with a total portfolio of approximately 72,000 buildings (DPW, 2012). DPW has a central
Property Management Information System (PMIS) which houses all the information on energy, refuse,
water and other payments done nationally. Initial overview of two provinces was obtained from DPW
and a request for the full provincial overview has not yet been responded to.
Regional DPW Offices appear to have a comprehensive list of building facilities, both leased and owned,
listed against property codes designating building type, e.g. Police Station, Court, Correctional Services,
Line Department, Prestige Buildings, etc. The regional office in Cape Town is able to provide the number
of land parcels and total number of structures, but not aligned to building type. Similarly, there is not a
detailed list of the buildings within each facility. For example, the SA Navy has within the facility offices,
hostels, residences, stores, etc.
Regional DPW offices can provide account of the money paid for electricity per each facility. This cannot
be accurately translated in to electricity consumed as prices differ from municipality to municipality and
Eskom distribution areas within each region, some facilities are billed as industrial, some residential,
business or agricultural and these rates all differ. Further there are also small and large power users.
However, this system may provide a useful site of electricity data collection in the future.
A challenge for energy monitoring is that DPW facilities are usually metered per erf, at the intake point,
not per building (in complex facilities, this will include a range of buildings). The Payments Division of the
regional office is billed and they make payment and then recoup the money from the relevant line
department. Difficulties can arise when they are not clear about which department is occupying a

Preparatory work leading to a project proposal on V-NAMA in sub sector of energy efficiency in public buildings:
Analysis report: Baseline, Energy savings potential and Barriers.
63
particular building. Keeping accurate registries requires site visits in instances where the user is disputed
and they do not have the staff capacity to do this. There is a clear disjuncture between user and
payment.
The regional offices of the DPW is able to provide records of expenditure on electricity for different
facilities, but this often is at the facility (rather than individual building) scale, so may include a variety of
building types. However this system may offer opportunities to record energy consumption.
Information on provinces in this study is limited. From information received, the indication is that
Provincial government are just beginning the exercise of consolidating and updating/refining asset
registries. For example, Department of Public Works: Property Management, in the Western Cape
Province, were unable to provide a researcher with this information a couple of years ago and were not
particularly interested in the topic. This has changed dramatically: the department is undertaking a State
of the Estate Report, which will be a full asset registry/inventory of buildings owned and occupied,
including offices, hospitals and some schools. The report will also include building performance
measures, electricity consumption baselines and benchmarks. This is due for completion in March
201346
.
For many municipalities the exercise of compiling this registry has been recently undertaken, and often
been costly, lengthy and still ‘work in progress.’47
It was also noted, that due to fairly newly rearranged
political boundaries, it is almost impossible for a municipality to consider a registry ‘complete’ and they
are always ‘discovering new buildings’. Registries differ substantially in what organising method they
use. Some group by physical address, others by building type (and these categories are not consistent
across municipalities), others by billing record number, etc. While resource consumption in rating
systems is usually measured per floor area, this level of detail would be far beyond the institutional
capacity available for the compilation of asset registries.
Across all spheres of government, while a level of building asset registry is in place, the lack of
breakdown on building type makes it difficult to extrapolate energy savings potential. There is very little
data on energy consumption per floor area (this usually only in buildings that have undergone a detailed
audit). Developing a blue print for the kind of information to develop within asset registries, to support
46
Marks, S, Climate change management, Province of the Western Cape, pers. com., November 2012. 47
Ekurhuleni has recently contracted PriceWaterhouseCooper to undertake this exercise; eThekwini compiled
something in 2010 as part of a GHG Inventory exercise, but this was not reliable and in the 2011 update of this
document, this was substantially reworked.

Preparatory work leading to a project proposal on V-NAMA in sub sector of energy efficiency in public buildings:
Analysis report: Baseline, Energy savings potential and Barriers.
64
ongoing energy management, would assist. The Western Cape ‘State of the Estate’ report will possibly
offer an interesting example.
Finance and funding
Currently the funding of public building retrofit is through three main routes:
1. Self funded/’own investment’: This can either be through direct capital allocations, as in Ekurhuleni,
or through shared savings schemes, such as DPW, or potentially through guaranteed savings in an Energy
Performance Contract . This form of funding is highly sustainable.
2. National Treasury allocations: this has supported programmes at national and local level and provides
an important impetus, particularly in municipalities that have little incentive to embark on efficiency
work. This kind of fund stimulates the development of capacity within government, and, once developed,
this capacity is then able to follow up on further investment and funding opportunities.
3. Eskom IDM: IDM has a budget of R5.45 billion to achieve 1074 MW savings over the period 2011-2013
This fund includes the SWH rebate programme, the Standard Product model, the Standard Offer, ESCO
model and Performance contracting. The ESCO model is designed really for large scale industrial projects
and is not really accessible for public building retrofit projects (only very large scale projects, such as the
Cape Town civic centre which is looking at saving around 1,2 MW per annum would qualify for this
funding stream which targets projects greater than 1 MW per annum).
IDM Funding Models
a. ESCO Process: EE installation through an ESCO. Payment value based on detailed financial and
technical evaluation. Payment (to ESCO) during and on completion. Valid for projects greater than
1MW. Focus: industrial & commercial. Catering for individual projects with unique requirements.
Covers: process optimisation, lighting, heat pumps, HVAC, etc. 6-18 month approval process.
b. Rebates: For individual products. Rebate, based on savings potential of product, claimed by
consumer. High pressure SWHs (low pressure shifting to DoE) & heat pumps.
c. Residential Mass Rollout: For 1-5MW projects. Project Developer submits a batch invoice (1MW)
with supporting documentation. Payment will be made after independent verification. Approval

Preparatory work leading to a project proposal on V-NAMA in sub sector of energy efficiency in public buildings:
Analysis report: Baseline, Energy savings potential and Barriers.
65
process project dependent. Aim: bulk replacement of inefficient lighting, implementation of energy
saving technologies (EE showerheads) and load control devices (geyser controllers and insulation,
pool timers). Aimed at: Project Developers of Residential sector projects.
d. Standard Offer: 50kW-1MW projects. Payment according to standard value per kWh saved per
technology; 70% on implementation, 10% pa afterwards based on M&V. Covers: lighting, hot water
systems, solar, process optimisation. Approval process <2 months. Aimed at: Industrial (new – used
to be excluded), commercial and agriculture customers.
e. Standard Product: <100kW projects. Standard payment value per item calculated based on savings
potential; 100% on installation, based on M&V. Covers: lighting, showerheads, industrial heat
pumps. LED & CFL downlighters now included (used to be part of downlighter mass rollout). Aimed
at: commercial and agriculture customers. Approval process <2 weeks.
f. Aggregated Standard Product: 1-5MW projects. Payment value based on individual project
calculation. Payment according to published rate per technology. Full payment of 1MW batches after
commissioning. Focus: industrial & commercial. Approval process project dependent. Aimed at:
Project Developers of Industrial and Commercial projects.
g. Performance Contracting: For projects substantially larger than ESCO process (>5MW). Payment
according to published rates R/kWh for demonstrated savings. Bulk performance payments over
contract period across multiple projects. Aimed at: project developers of large capital industrial
projects to increase commitment and reduce risk of non-delivery. Covers: compressed air,
ventilation, lighting, showerheads, heat pumps, SWH, etc. 3-4 month approval process.
DPW identified that their building stock is a bit different from what Eskom IDM currently funds, and they
will now be working with Eskom in developing a programme that will be suitable to their needs. One
municipality noted that there has been some difficulty experienced in getting a schools/hostel
programme funded through the IDM.
The fund is generally accessed by the ESCO appointed to do a retrofit, and the indication is that the IDM
fund will contribute to the latest set of DPW retrofit programmes and to the Cape Town civic centre
retrofit. However, some exploration of what kind of support government needs in order to access the
fund would be important.

Preparatory work leading to a project proposal on V-NAMA in sub sector of energy efficiency in public buildings:
Analysis report: Baseline, Energy savings potential and Barriers.
66
The indications are that the SPP for lighting is where the best return on investment is to be found and
the recommendation seems to be to ‘gun’ for this, rather than trying to ‘shoe-horn’ a whole building
retrofit into an IDM proposal. All government-owned residential units would qualify for IDM support
through the Residential Mass Rollout (RMR) programme. This fund covers a basket of interventions,
including CFLs, geyser timers, efficient showerheads, down lighters, etc.
Drawing on the Eskom IDM fund for a public building retrofit is also a good way to tie the ESCO into a
three year period of external monitoring and verification, as this is a requirement of the IDM fund.
Institutional capacity
DPW note that they lack relevant qualified expertise to support energy efficiency retrofit projects and
the programme as a whole. Specific capacity lacking is identified as electrical engineers and M&V
experts. Regional offices do have ‘on the ground’ technically experienced staff who could provide an
important resource to the programme. M&V capacity may be available in other departments and could
be deployed. Currently the DPW has entered into an MOU with DOE around future M&V within the
programme. As with national government, while Provincial and Local government have property and
asset management departments, there is no dedicated capacity within these to handle the new, and
often technically complex, area of energy management (requiring knowledge around kVA, baselines,
lighting system design, etc).
Although lack of dedicated capacity remains the central challenge48, substantial growth is underway,
particularly where projects have taken place, showing the importance of demonstration projects and
‘easy’ funding to kick start a process, get capacity into place, which is then developed and able to drive
further investments. Dedicated energy units, with energy efficiency in buildings as an aspect of their
work, have been developed in the last five years in Cape Town, Ekurhuleni, eThekwini and staff in a
number of mid-sized towns, such as Polokwane, have developed substantially capacity in the area of
building efficiency through the Municipal EEDSM programme cycle.
48
Mbombela noted that there is one person alone in charge of municipality’s entire metering system (this when it
brings in 34% of municipal revenue), and one person responsible for maintenance of street lights in whole area.

Preparatory work leading to a project proposal on V-NAMA in sub sector of energy efficiency in public buildings:
Analysis report: Baseline, Energy savings potential and Barriers.
67
Case study: Parastatal and state owned company taking efficiency forward
Most South African parastatals, such as Eskom, Transnet and Telkom, have dedicated efficiency or
sustainability units, with capacity to take efficiency and low carbon programmes forward. Transnet work
within the framework of the National Business Initiative coordinated Carbon Disclosure Project. They
have plans in place for efficiency retrofitting, in line with ISO 50 000 (Energy Management System)
certification. In terms of going forward, not just retrofit projects, Transnet are facing a big infrastructure
spend (R300 million) and have set up a programme to mitigate energy supply shortage risks. This
includes ‘future proofing’ infrastructure, which will include ensuring that it is energy efficient. Transnet
are members of the DBSA’s Green Infrastructure Council.
Eskom use own funds entirely for efficiency retrofits. Eskom’s Internal Energy Efficiency programme has
a Manager (Senior Engineer) at head office in Megawatt Park and Energy Project Managers (or
champions) in each region and/or division. Each region conducts audits (high level) of its facilities and
buildings and develops regional targets. Drawing on these, head office compiles Programme targets.
Relatively ‘rough’ programme targets are included in their shareholder compact each year. Programme
targets are relatively flexible, changing from year to year; but annual targets put forward by the regions
in their efficiency programmes for the year become set targets. A decision has been taken to include
rental buildings if the occupation contract is for 3 years or more. In these instances Eskom (with the
permission of the owner) will undertake the retrofit at their own cost as the savings during occupation
make this worthwhile.
Initially these regional programmes received funding from Head Office, but now each region is
responsible for budgeting and funding the implementation as part of the regional overhead costs. The
Programme Manager is accountable for implementation and meeting targets, these are also compacted
down to the regions.
Interestingly, implementation happens through the usual commercial, tender process and is a straight
forward contract for work. Eskom does not use an ESCO model of shared savings or energy performance
management. Their approach is to place more emphasis is on upfront quality control – ensuring that
they are supplied with reputable equipment and sound installation. M&V is done by Eskom and tracked
over years. The cost of the programme is in the Eskom Annual Report, but Eskom does not publicly
report on cost per savings achieved.

Preparatory work leading to a project proposal on V-NAMA in sub sector of energy efficiency in public buildings:
Analysis report: Baseline, Energy savings potential and Barriers.
68
Metering and billing practice
Across the public sector this emerges as a key concern. Without the ability to assess the savings, identify
the greatest potential, measure and monitor the savings, there is nothing to drive a retrofit programme
and no ability to access sustainable financing.
The survey points to a situation where, while some buildings are metered, other facilities are not49; or a
facility may be metered at the take in point, but this is not divided further between actual buildings. For
example, the Navy complex has a single take in point, that is metered, but beyond this there is limited
metering of residential houses, offices, etc. Another situation is where a building may be metered, but it
houses a variety of municipal line departments and departments are billed for electricity services
according to a budgetary process that bears no relation to the actual consumption. Quite often,
particularly at national level, the Public Works office is not clear about which department is actually
occupying the building – particularly where departments undergo restructuring. (Polokwane, 2012; DPW
Cape Town Region, 2012).
The categorisation of electricity accounts is not systematic, or may be but varies considerably from
authority to authority. These do not necessarily line up with asset registries. Electricity data systems are
designed primarily for billing purposes, not for electricity consumption analysis. It is often difficult to
allocate electricity accounts to different types of infrastructure.50
In a municipal system the electricity
data is usually linked to an account number and vote number for a specific department and each
department will have a budget available for electricity costs. The cost for electricity is deducted from this
available budget, a process that is largely automated and in most instances an account is not even
generated or communicated to the relevant department.
There is also a situation where a number of municipal facilities are not metered, billed or ‘paying’ for
electricity consumption – i.e. this is unmeasured consumption. This would be absorbed in the municipal
Electricity balance as part of non technical losses. This figure a moving target as is also absorbs pre
payment which happens in fluctuating manner, so its hard to track what proportion is municipal ‘own
49
An illustrative example is City of Cape Town, where of approximately 95 buildings examined by Special Technical
Services, some 26% had no meter device, or staff were unable to enter the building an/or locate any meter device.
City of Cape Town-owned Buildings Electricity Consumption Reporting System report, 2011. 50
The experience described by a Western Cape Provincial official applies across the board, where “Property
management were not able to supply me with a building inventory of what we own [they have since embarked on a
State of the Estate report which will consolidate this information]. However, they were able to provide a list of the
account numbers they pay against each month. I submitted the account numbers to the City of Cape Town
electricity department and through their SAP system, was provided with monthly historical consumption data. I
tried to match building and account numbers as much as possible,” Marks, S, pers. com., November 2012.

Preparatory work leading to a project proposal on V-NAMA in sub sector of energy efficiency in public buildings:
Analysis report: Baseline, Energy savings potential and Barriers.
69
losses’ (Polokwane, Mbombela, 2012). Savings in this instance would simply be ‘less of a loss’, and may
be miniscule.
Even amongst parastatals some facilities and buildings are not metered or billed (Eskom, Transnet,
2012). Within Eskom they do, in general, pay for own consumption if they are in a municipal distribution
area or in rented office space, but not in all instances (Eskom, 2012). Megawatt Park is metered and
billed.
These payment (or lack of) situations are problematic for a number of reasons. Anomalies in electricity
consumption are not picked up (e.g. where, as in the case in one municipality, consumption was higher
over weekends and at night due to lack of energy management that switched off the HVAC system) and
there is very limited responsibility for electricity consumption. This lack of responsibility generally runs
through the public sector generally and is primarily a result of historically low electricity costs. As
electricity price increases it will become increasingly important to pay attention to individual electricity
accounts and be able to relate this consumption of particular infrastructure.
This situation also makes it hard to access the ESCO model performance contract financing; there is also
little incentive to save as there is no person who actually receives a bill and takes responsibility for
escalating costs. In this context it is also difficult to make a financial case – the electricity in some
instances is ‘free’, in others it may simply be avoided cost to Eskom (i.e. around 40c per unit – or the
average of the previous year’s purchase price from Eskom) and in other instances it ‘charged’ to the line
department at a full cost (i.e. a commercial tariff, of say around R1.00 per unit).
Issues of metering, both for billing and energy management purposes, are being explored by some of the
metros in a quite a bit of depth.51
51
Gie, J, The City of Cape Town-owned buildings, 2012 takes a detailed look at the electricity monitoring systems
and services and future options in this regard for municipal owned facilities; “Potential for improved electricity data
reporting within the eThekwini Water and Sanitation Department” report by eThekwini Energy Office for the Head
of eThekwini Water and Sanitation, September 2012, takes a detailed look at how the system could be improved
for billing and energy management purposes.
Preparatory work leading to a project proposal on V-NAMA in sub sector of energy efficiency in public buildings:
Analysis report: Baseline, Energy savings potential and Barriers.
70
Case study: eThekwini metering and billing practice exploration
eThekwini established an Energy Office, within the Treasury department, around 2009, and this has lead
the eThekwini Internal Energy Management policy, adopted in early 2012. The Energy Office quickly
realised that without proper systems to monitor electricity consumption, little progress could be made in
internal electricity consumption reductions.
A detailed examination of metering and monitoring of the electricity consumption at eThekwini Water
and Sanitation department revealed:
Current meters are not suitable for monitoring energy: General meters accounted for about 90% of the
meters. These meters are mostly simple watt hour meters that are manually read every 3rd month. The
consumption data is manually entered into the billing system and the data is averaged for monthly
consumption billing. Such meters cannot provide any information recording or accurate baseline
information as they are not read regularly enough.
Bulk meters, on the other hand, provide a level of monitoring (time of use data recording). Data is
automatically captured and processed into the billing system. These meters are more costly to install,
but general meters are more expensive to use and capture data. However, even with a bulk meter and
historical data, the poor categorisation of electricity accounts may mean that it is still difficult to allocate
consumption information to a specific structure, building or infrastructure.
As with most municipalities, actual ‘payment’ for electricity by municipal sub-departments is effectively a
book entry exercise, with no actual account ever being received by the user department and no direct
responsibility for consumption is in place. The situation represents a significant potential loss of revenue.
eThekwini plan to transform the situation through:
Addressing responsibility: developing awareness amongst staff, assigning individual responsibility for
checking and monitoring accounts;
Improving data capture and account categorisation: converting larger accounts to Bulk TOU meters and
working with departments (line and Resource Management Services) to identify all accounts and develop
relevant account categories (by department and region);
Reporting and monitoring: develop and implement an Electricity Data Management system and
dashboard to provide automatic monthly reports for different accounts and generate alarms if anomalies
are noticed.
Building electricity accounts are currently being classified according to a departmental code and the
metro plans to move towards classification by Eskom SIC codes, in order to align with Eskom data
collection processes. Ultimately they aim to have a system that classifies facilities’ electricity
consumption spatially (GPS-coordinates) and by sub-department52
. The eThekwini Energy Office and City
Architects intend to procure remove monitoring equipment that can be installed in various municipal
buildings to better understand energy consumption and identify areas of energy efficiency interventions.
52
Presentation by Energy Office, SALGA workshop November 2012, ‘Potential for improved electricity data
reporting’, eThekwini Energy Office, 2012

Preparatory work leading to a project proposal on V-NAMA in sub sector of energy efficiency in public buildings:
Analysis report: Baseline, Energy savings potential and Barriers.
71
Section 4: Energy Savings Potential
The recently published World Energy Council report “Energy Efficiency: A Recipe for Success” notes that
data on public sector energy use is limited in many countries: “Although sectoral energy charts have
been drawn up for years in many countries, the public sector is often not analysed as a separate entity….
Consequently, few detailed breakdowns of public sector energy uses are currently available and are
often not comparable due to different boundaries.” (WEC, 2010, p98). Disaggregation of energy to public
buildings was last done in South Africa in 2000 and the method used for the data picture is unknown. The
picture points to this sub-sector accounting for approximately 1,33% of total final end use consumption.
This would align broadly with international benchmarking that indicates that the range for total public
sector energy consumption generally considered is 1% to 5% of total final energy consumption (though
what proportion of this is allocated to building energy consumption is not provided). Another
international benchmark is 2 – 10% of the energy consumption of buildings in a country may be
apportioned to the public sector, however, this figure is not known in South Africa (WEC, 2010, p 99).
The only international example of disaggregation of public sector energy consumption between national
and local spheres is that of Germany. Again, it must be noted that these figures are for total public sector
consumption, not public building consumption as a sub sector of public sector. In Germany,
municipalities account for 60% of total public sector energy consumption (note: this includes electricity,
but also transport, heating, etc); with regional and national government each accounting for a similar
18% of public sector consumption (WEC, 2010, p98).
The data collected in this report indicates that there are substantial gaps that cannot be filled at this
stage. While current calculations indicate that in South Africa, for the public buildings sub sector,
national consumption is possibly greater than provincial and local government, if a full
provincial/municipal picture was obtainable and water and waste water treatment and public lighting
were added to this picture, the relative proportions may be very different.
Consequent to this difficulty in establishing a baseline, the actual energy saving potential in the public
sector is most often not known. The estimated and realised energy savings for individual measures are
often as high as 20 – 30% and for buildings, specifically, more consistently around 30%. This ties up with
the retrofit results of the Municipal offices in Parow, Cape Town, which realised savings of 30%. Applying
a savings potential figure of 25% to the indicative total national building consumption figure of 9 705

Preparatory work leading to a project proposal on V-NAMA in sub sector of energy efficiency in public buildings:
Analysis report: Baseline, Energy savings potential and Barriers.
72
GWh/annum, a very broad sketch potential national buildings EE savings amount of 2 912 GWh/annum
emerges.
This report has set out to develop an initial, indicative assessment of the energy ‘size’ of the built
environment in terms of electricity consumption in South Africa and synthesise the estimated and
realised energy savings for individual interventions in order to assess the potential for efficiency savings.
Given the levels of data found, this is challenging. Below is a ‘run through’ of the method using the data
available and will hopefully identify data gaps. However, the outcomes cannot be taken as in any way
reliable and certainly cannot be used at this stage for planning purposes.
Macro analysis of potential for energy saving
1. Municipal sphere
Entity Own elec use as % of
munic total excl Eskom) Elec use in public bldgs (% of
own use)
Buffalo City 3%
Tshwane 10%
Ekurhuleni 3%
eThekwini 3% 53%
Cape Town 3% 16%
Johannesburg 2% 10%
Average METRO 3.4 26
Laingsburg 7% 7%
Cederberg 5% 40%
Hessequa 3% 51% (may incl WWTW)
Knysna 9% 76% (may incl WWTW)
Mossel Bay 4% 31% (may incl WWTW)
Oudtshoorn 7% 10%
Langeberg 5% 65% (may incl WWTW)
Theewaterskloof 5%
Swartland 4% 12%
George 7% 7%
Sol Plaatje 2%
Drakenstein 3%
Average SMALL MUNIC 5 15*
* this average does not include percentages where WWTW may be included.
a. Municipalities received 91 564 GWh (40.8% national total) for re-distribution in 2011.

Preparatory work leading to a project proposal on V-NAMA in sub sector of energy efficiency in public buildings:
Analysis report: Baseline, Energy savings potential and Barriers.
73
b. From the analysis of municipal electricity consumption data (see table above) approximately
3.4% of this is typically for metro electricity consumption (mostly for streetlights, traffic lights,
public buildings and water); and as metro’s consume the vast majority (50% or more) of total
municipal consumption, this figure is used (i.e. a bit conservative): 3 113 GWh.
c. Typically 16% of the municipal consumption is public buildings: 498 GWh.
d. Assuming that all large and medium multi-storey public buildings make up 70% of this figure, and
single storey compounds make up 30% of the balance, the following savings are possible:
Low High Modify existing New Low High Low High
Medium sized multi-storey office block
(floor area<10 000m2) 22.66 27.89 5.23 19.18 1.74 1.74 29.64 48.81
Single storey multi building compound 13.45 19.43 2.99 7.47 2.99 5.98 19.43 32.88
Large multi storey office block (floor
area > 10 000m2) 27.89 27.89 1.74 19.18 N/A N/A 29.64 47.07
Total (GWh) 64.01 75.21 9.96 45.83 4.73 7.72 78.70 128.76
Potential EE savingsfor municipal public buildings per intervention off baseline consumption
(GWh)
Lighting HVAC Water Heating Total
2. Provincial sphere
Insufficient data
3. National sphere
(this refers to DPW-‘owned’ buildings only, not parastatal or sub national building stock)
e. Western Cape regional DPW spend on electricity 2011: R 279, 184,200.20.
f. Western Cape represents 9-10% of national total energy consumption53
.
g. Assuming public building consumption is proportional that would mean national spend on public
building electricity is in region of R 2,791,842,002.00.
h. Assuming an average charge of R1/kWh this represents: 2 791 842 002 kWh (or 2 791 GWh).
i. Assuming that all large and medium multi-storey public buildings make up 70% of this figure, and
single storey compounds make up 30% of the balance, the following savings are possible:
53
Ref: DEADP Energy and GHG Emissions Inventory report 2012 and DOE past issues of the National Energy
Statistics.

Preparatory work leading to a project proposal on V-NAMA in sub sector of energy efficiency in public buildings:
Analysis report: Baseline, Energy savings potential and Barriers.
74
Low High Modify existing New Low High Low High
Medium sized multi-storey office block
(floor area<10 000m2) 127.04 156.35 29.32 107.49 9.77 9.77 166.12 273.62
Single storey multi building compound 75.38 108.89 16.75 41.88 16.75 33.50 108.89 184.27
Large multi storey office block (floor
area > 10 000m2) 156.35 156.35 9.77 107.49 N/A N/A 166.12 263.84
Total (GWh) 358.77 421.59 55.84 256.86 26.52 43.28 441.14 721.73
Potential EE savingsfor national public buildings per intervention off baseline consumption
(GWh)
Lighting HVAC Water Heating Total
Summary
Based on existing detailed data, national public buildings can achieve some 5 times more savings
compared to municipal buildings. However, the data gathered is insufficient, and the conclusions drawn
here are merely to provide a ‘ball park’ estimate of what is possible, and to test the methodology.
Further work is needed for any clearer picture.
New build and major renovations
It is worth noting that while retrofit work is being undertaken, these large state institutions are
continuously busy with new building development and major refurbishments of existing stock. These
moments offer even greater potential that standard retrofit programmes and should be brought into any
energy efficiency in public buildings programme.
In KZN region alone, the DPW office is currently undertaking repairs and renovations of R200 million on
the central Police Station and R220 million on the Port Shepstone Magistrate’s Court. A sizeable portion
(about a quarter) of these projects directly involves electrical design and fittings/equipment and there is
also the other aspects of efficiency in building materials and design that would also come into it. In this
instance the regional DPW Electrical Engineer, who has sought out relevant networks through which to
learn about new technologies, has made sure the consultants design the electrical fittings (in renovation)
and the entire building (in new build) to energy efficiency standards. The Port Shepstone Magistrate’s
Court will be designed as a ‘green’ building. This is being done within current budgets. The greater
challenge is a lack of direction around which efficient technologies and equipment should be utilised.
In the Western Cape province, a wealth of knowledge has been developed around energy and resource
efficient design in the Health sector. However, ensuring that this knowledge is incorporated in the design
of new buildings, which takes place in the Public Works department, requires improved departmental

Preparatory work leading to a project proposal on V-NAMA in sub sector of energy efficiency in public buildings:
Analysis report: Baseline, Energy savings potential and Barriers.
75
coordination. Developing the capacity of all staff to understand and engage in these issues is an
important step54
.
Voluntary building standards
The adoption of voluntary building standards by public actors is relatively recent. Given local capacity in
the public sector, take up of voluntary standards will remain limited, but has the potential to disseminate
awareness, lead practice and thus drive building regulations – voluntary standards use building codes as
their baselines, but in the long term they drive the development of building regulations. By adopting
voluntary standards as the required performance level of its own buildings, the public sector can prepare
the market for stricter regulations. This is seen by local ESCOs as a really important step in the right
direction (SEM, 2012).
The Green Building Council of South Africa (GBCSA)55
rating system sets out a "menu" of all the green
measures that can be incorporated into a building to make it green. Points are awarded to a building
according to which measures have been incorporated, and, after appropriate weighting, a total score is
arrived at, which determines the rating.
The system has been developed primarily for new build, or significant refurbishment, but the pioneering
of rating tools to benchmark the operation and maintenance of existing buildings is under development.
The first component of this tool related to energy and water has been developed for office buildings,
following an extensive survey of 350 buildings across South Africa.
Building rating is done by independent assessment and certification is awarded for 4-Star, 5-Star or 6-
Star Green Star SA ratings. The rating system has been based on extensive examination of international
best practice and made locally applicable.
Four rating tools are available and all are of relevance to the public building sector:
1) multi-unit residential (new)
2) public & education building PILOT (new)
3) office
4) retail centre
54
Pers.comm Andrew Cunninghame, Chief Engineer, Dept Health, Western Cape Province, Feb 2013. 55
Information sourced from the GBCSA web site. 2012.

Preparatory work leading to a project proposal on V-NAMA in sub sector of energy efficiency in public buildings:
Analysis report: Baseline, Energy savings potential and Barriers.
76
The Green Star SA – Public & Education Building (PEB) rating tool assesses the environmental attributes
of new or significantly refurbished public and education building developments. Development types
within the scope of the Green Star SA – Public & Education Building PILOT (Updated) include but are not
limited to: Community Centres, Library/Museum/Gallery Buildings, Basic (schools) and Higher Education
buildings, Theatres/Cinemas/Music Halls, Places of Worship and Convention / Exhibition Centres.
Application to the rating system requires complex modelling of energy performance, certainly beyond
the usual public sector budgets. Special membership fees are in place for government, which can reduce
the certification costs. Funded, pilot exercises can, however, provide a good demonstration and develop
important knowledge and skills amongst government staff involved in building development.
Case study: Green Star Public Building development: City of Cape Town Electricity Services Head Office
and Manenberg contact centre
The City of Cape Town will be establishing new offices for its Electricity Department to be located within
the suburb of Bloemhof, Bellville. The new office building will be a five storey structure approximately
23.8m in height, consisting mainly of offices configured around a central glazed atrium. Outdoor eating
and recreational areas will be provided on the ground floor terrace, and a roof garden will be established
that will offer walking trails as well as covered recreational areas. The building has yet to be built, but the
design has received a 4 star rating – Office v1 Design Rating.
The Manenberg Contact Centre, a new build project of the City, provides facilities for two City
departments: Existing Settlements and Revenue. It has a public component of cash offices, meeting
cubicles and waiting halls; and a staff component of offices, meeting rooms and breakaway courtyards.
Its primary purpose is to bring service delivery closer to the communities. Manenberg and surrounding
residents will be able to access the City’s service hotline; make enquiries with regards to the Housing
database, tenancy matters, service and rental accounts; pay municipal accounts and traffic fines;
purchase prepaid electricity, and apply for services, rates rebates and indigent benefits.
In meeting the Green Star SA rating for best practice, the Manenberg Contact Centre has set a precedent
for other municipal buildings in environmental sustainability. The selected construction methods
provided skills training and job opportunities for the local community; while the art components were
developed with the local residents to create a building the community can call their own. The building
design received a 4 Star Green Star SA – Office v1 Design Rating in August 2012.
ISO 50001: 2011
In 2011 the International Organisation for Standardization (ISO) released one of its voluntary standards
the ISO 50001:2011 on Energy Management Systems. ISO 50001 is an international energy management
standard that is meant to help organisations improve how they use energy, by understanding their
energy intensity and efficiency. This standard is based on the management system that is already
understood and implemented by organisations worldwide, under ISO 9001, 14001 etc. The standard can
provide government departments with a framework of requirements for integrating energy performance

Preparatory work leading to a project proposal on V-NAMA in sub sector of energy efficiency in public buildings:
Analysis report: Baseline, Energy savings potential and Barriers.
77
into their management practices. This framework can help a department to develop a policy for more
efficient use of energy, fix targets and objectives to meet the policy, and use data to better understand
and make decisions about energy use. ISO 50001 does not set energy targets or goals; it is up to a
department to set its own goals. The standard promotes energy efficiency through measures and
controls meant to help you reach your goals. ISO 50001 also emphasises the principle of continual
improvement, as done by other standards like ISO 9001 & ISO 14001. This principle of continual
improvement helps an organisation get better with time, giving the organisation the potential for more
savings as time goes on. Certification to ISO 50001 shows public commitment to energy management
and also saves your organisation money. The standard improves the ability to benchmark, measure and
report energy improvements. This management system can be adopted for South Africa’s public
buildings.
South African Energy and Demand Efficiency Standard (SAEDES)
The SAEDES, developed by the national Department of Minerals and Energy (now the Department of
Energy), is a guideline that aims to improve energy efficiency in new and retrofitted commercial buildings
while maintaining cost-efficiency. It promotes good design, innovation and the use of renewable energy.
The City of Tlokwe’s ‘green’ council chamber building was the first building in South Africa to officially
comply with the SAEDES requirements. Upgrades ensured that the building would use 10,200 kWh less
energy a year compared to its original design. Some of the innovations undertaken by the council
chamber design team were to increase the thermal resistance of the walls and the public gallery floor
and to replace the portico lighting systems with compact fluorescent lamps (CFL). Tlokwe now requires
that all new municipal buildings comply with the SAEDES.

Preparatory work leading to a project proposal on V-NAMA in sub sector of energy efficiency in public buildings:
Analysis report: Baseline, Energy savings potential and Barriers.
78
Section 5: Barriers / Issues for consideration: initial analysis
In a survey of over 70 countries, the WEC found that despite visible benefits of energy efficiency in the
public sector large-scale programmes remain relatively few and public sector initiatives face multiple
challenges in design and implementation (WEC, 2010, p 100). This seems to be due to a lack of enabling
conditions and the existence of specific barriers to energy efficiency, including:
• Lack of awareness and low priority leading to absent or insufficient policies and targets; related
challenges arise from changes in leadership and competing policy priorities across various levels
of government.
• Insufficient institutional capacity and expertise in design and implementation.
• Lack of available financing and budgetary autonomy.
Awareness, political commitment and prioritisation
While EE is often presented as an obvious ‘win’ situation for government (energy savings) there is in fact
no real net benefit for government administrations (as opposed to ‘government’ as the broader
community): budget savings are not realised but become budget reductions in the next cycle and there is
an outlay in terms of administration, staff time, and a degree of risk in that contracts may be legally
challenged, contractors may default. Given this, it is unsurprising that while there may be a broad
political commitment to the concept, this does not translate into buy-in from Executive Management or
into action down the ranks where the much more pressing demands of meeting basic service delivery
understandably receive priority in terms of allocation of scarce resources and capacity. Again, this is a
rapidly changing space and strong championship is present in many of the metros, some provinces and
DPW. A number of metros have broad efficiency strategies and targets and Ekurhuleni has a specific
council policy on energy efficiency in its municipal buildings.
There is, particularly in smaller municipalities, a general lack of information on energy efficiency and very
low levels of awareness. Furthermore, the issue of energy efficiency needs to be translated into ‘service
delivery’ terminology in order to gain political and administrative traction.
Energy efficiency is often considered as representing a double negative: not only must the electricity
fund this out of its capital or operating budget, but they also lose the revenue (funny money, but may be
represented as a loss of revenue on the Electricity balance sheet). This needs to be turned around and
there is plenty of opportunity for this: own buildings represent an own saving (or at least efficient

Preparatory work leading to a project proposal on V-NAMA in sub sector of energy efficiency in public buildings:
Analysis report: Baseline, Energy savings potential and Barriers.
79
financial management); in times of energy supply limitations, savings can be utilised for new
developments, provincial public buildings, such as schools and old age homes, are battling to pay their
bills and have large outstanding debt, so it would make sense to assist them to reduce costs (some
political mileage here too) as this would not represent a loss, but in fact may increase the ability to pay.
Institutional capacity
At a national level the DPW has identified specific gaps around monitoring and technical capacity. The
lack of continuity in government departments is also cited as a challenge in terms of capacity. Projects
are often hampered by the fact that staff turnover means that institutional capacity developed and
institutional knowledge disappear when those individual leave.
There seems to be a general recognition that funding and financing is available, but that often the gap is
that there is nobody with the time to dedicate to securing these investments. The new tasks deriving
from the national commitments of the NEES and the NCCRS White Paper are felt at the local level to be
an intrusion into somebody’s current work. No new resources are allocated to support the work and
there is no reward for the additional load. From the local level programmes may be experienced as ad
hoc and there is no clear strategic roll out that can be grasped.
Some municipalities have made reference to the challenge of finding an institutional home for this work.
It may fall between Electricity and Environment departments. Cooperation between departments is
often challenging. There are also particular capacity crisis in Electricity departments, with senior,
experienced staff retiring, high levels of vacant positions.
It is also worth noting some exceptional development in the area of municipal capacity to tackle energy
efficiency. Energy offices, or units have been developed in a number of the metro and even some mid-
sized towns (leading here are Ekurhuleni, eThekwini, Cape Town, Polokwane).
A leading example, for illustrative purposes, is eThekwini: flowing from its Energy Office and newly
adopted Internal Energy Management Policy, eThekwini has an Energy Management (Monitoring)
System. This comprises managerial (planning, training, communicating, monitoring and review) and
technical components (technical planning of energy data management, purchase of hardware,
implementation, M&V, system performance). Overseeing the Policy implementation is an Energy
Management Steering Committee that includes representatives from all relevant line departments
(Architecture, Electricity, Environmental Planning, Housing, Transport, Treasury, Water and Sanitation).

Preparatory work leading to a project proposal on V-NAMA in sub sector of energy efficiency in public buildings:
Analysis report: Baseline, Energy savings potential and Barriers.
80
The committee has high level representation as it is chaired by the Deputy City Manager, with the Energy
office as secretariat, responsible for the day to day handling of the work. The responsibility to deliver on
the Policy is built into the institution through performance indicators (baselines and energy saving
targets) and incentives, and supported with dedicated staff and resources.
Legal and financial complexity: Performance contracting is a new and complex form of agreement in the
energy sector. Many in procurement and legal services are unsure about moving into this kind of
agreement and this is a substantial stumbling block56. However, the growing experience and example set
by successful implementation (at national and local level) is already having an impact on this. Further, as
an understanding of this type of exercise emerges, already existing performance contracting experience
in roads and major infrastructure, or the IT sector, can be drawn in.
This also points to the value of catalytic, external grant funding to kick start these ‘new’ and often
resisted processes. Smaller municipalities noted, however, that there needs to be strong and strict
procedures in place for ring fencing that money, as in municipalities that are under financial difficulty,
grant funding runs the risk of being appropriated to pay staff salaries. A need to get business and
financial skills into the technical departments, in order to get funded projects underway, was also noted.
Data and measuring: Solutions to ongoing energy monitoring and billing systems will also need to match
resources with outcome. The comprehensive alignment of infrastructure units to electricity metering and
building registries across the board in government is unlikely to happen57.
Lack of primary data for setting a baseline is a critical issue (see discussion under Billing and Metering
above). In order to implement energy efficiency it is essential that good data exists to quantify savings
and assess interventions. The ESCO models do bring in this technical expertise and the first task in any
ESCO contract is the development of a verifiable baseline.
The further and ongoing development of the national MRV/EETMS system for building efficiency needs
to take place and its rollout into various departments and spheres of government supported. Systems
need to match as closely as possible existing data collection systems.
56
An example of complex contracting is the Cape Town civic centre retrofit process, which involves a basket of
funding and financing, a two tiered approach with two ESCOs (one planning, managing and monitoring and one
implementing and providing equipment and installation services), etc. Pers com, CCT ERMD, 2012. 57
Succinctly put by DPW Regional manager Ossie Lamb: “not in my lifetime’, pers.comm. Feb 2013.

Preparatory work leading to a project proposal on V-NAMA in sub sector of energy efficiency in public buildings:
Analysis report: Baseline, Energy savings potential and Barriers.
81
Constraints and problems emerging from experience to date:
• Lengthy procurement processes, even if don’t go out to tender (under R200 000), with tight time
frames to spend the money.
• lack of dedicated professional services unit/staff capacity to take interventions forward,
including qualified electrical engineers aligned to the size of portfolio
• Resistance from building management who have been left with problems following interventions
(e.g. holes in roofs where new light fittings been replaced and no budget allocated to remedy
this).
• Energy savings from the interventions are not linked to original capital expenditure. This means
there is a lack of financial incentives to drive the process.
• Retrofits rushed due to need to spend budget before financial year end.
• Complaints by building users fuel the internal resistance
• Procurement policy / requirements keep changing and TOR are sent back repeatedly to line
department for reworking; this may be improving with experience.
• ‘Job’ queues at Procurement and Line departments who have competing priorities.
• No sustainable process of financing – capital allocations dependent on political will – this starting
to change with national funds coming into place, IDM and increasingly demonstration of savings
convincing Senior Administrators and politicians.
• Access to facilities and security issues
Financing public sector energy efficiency and ESCOs
Lack of available finance for energy efficiency improvements in the public sector is identified by the WEC
as one of the most common and visible barriers to scaling up energy efficiency programmes in many
countries. This is identified as an issue at all levels from national governments to individual
municipalities. Broadly there are two financing options:
a. existing budgetary funds that can be used with energy efficiency in mind (in public procurement
of goods and services and new construction);
b. additional funding channelled to support energy efficiency, such as performance contracts and
other sources of funding (donor, carbon finance, external finance institutions).
Retrofit programmes often focus on explicit retrofit activities; but many government institutions
(national to local) are busy with ongoing refurbishment and maintenance and even new build. These
budget allocations are an important resource for building energy efficiency. Experience is that they are

Preparatory work leading to a project proposal on V-NAMA in sub sector of energy efficiency in public buildings:
Analysis report: Baseline, Energy savings potential and Barriers.
82
already being deployed for energy efficiency retrofit purposes and this needs to be built on and further
developed58
.
Performance contracting requires access to seed financing, economic stability and a legal framework for
contract law. Experience with ESCOs has shown the need for technical expertise in contractual issues and
a sufficient legal framework to support it. While South African metros may have access to sufficient
technical knowledge on contractual issues, smaller municipalities are likely to struggle to find this. This is
an important consideration given that performance contracting is considered one of the main ways of
financing future initiatives in energy efficiency.
A key enabling feature of the ESCO industry is the use of performance guarantees and contracts, with
payments based on the actual energy saving achieved. A major advantage is that customers can fund the
project over time and can do so with very little or no discretionary budgets (effectively off-balance) and
at a relatively low risk (Developing a Vibrant ESCO market, IDC, 2012).
The ESCO perspective is that there is a host of possibilities in the public building sector and it can largely
be self financing, i.e. financed through savings realised. This substantial potential lies in lighting (“low
hanging fruit”) and setting up of an energy management system (EMS). Savings can be realised in energy
efficient water heating in hospitals and prisons. While some ESCOs have not had any problems in raising
the finance from the banking sector, others say that banks are reluctant to fund municipalities. A self-
financing outcome also relies on re-consideration of how the budget process can positively relate to this
model.
A major challenge for ESCOs has been in the procurements and tender process in the public sector59. This
is particularly problematic when the audit and retrofit process are contracted separately. According to
ESCO’s ‘it doesn’t make any sense to do the audit if you don’t know that you are going to do the retrofit’
(Kayema, 2012). This separation of audit from retrofit makes it difficult for an ESCO to develop a turnkey
project. Local government needs direction around how to design procurement processes that are able to
handle the linking of audit and retrofit in a sequential manner. Best practice methodologies exist, but
awareness and confidence in the approaches must be developed.
58
Cape Town retrofit of chillers and lifts by Property Management division; regional DPW offices are including
efficient lighting design in refurbishments, etc. 59
Lateral thinking is needed when it comes to getting an energy efficiency project going. To date the experience of
SEM, one of two of South Africa’s large ESCOs, is that Cape Town is the only city that has got this process right
(interview, Patrick Costello, Shared Energy Management, November 2012).
Preparatory work leading to a project proposal on V-NAMA in sub sector of energy efficiency in public buildings:
Analysis report: Baseline, Energy savings potential and Barriers.
83
Examples of public sector projects that generate carbon finance have so far been very few (WEC, 2010,
p101). This may offer significant financing potential as more experience is developed. Developing
countries can mainly benefit from external finance in the form of incentives, grants and soft loans from
International Financing Institutions (WEC, 2010, p101). These should include financing for capacity
building activities, such as training for municipal energy managers and support for building and
strengthening institutional structures that may pave the way for additional investments in the field of
energy efficiency.
Case study: Challenges experienced in municipal based performance contracting
• performance contracting is new and relatively complex – no actual legal or institutional barriers
to this, and, ironically, it is often easier for a municipality to enter into a standard service
provider, capital payments contract, than into a performance agreement, despite there being no
actual additional payments, just a redirection of a portion of the building management/
electricity consumption costs to the ESCO.
• Standard capital payment project is not ideal as budgets are typically tight, this is not a priority
and many savings opportunities lie dormant for years.
• Performance contracting requires a certain ‘ring fencing’ of funds generated from savings (i.e.
not actual funds, but rather money not spent – which can confuse a public financial approach.
This has been the major obstacle, but there is now sufficient experience demonstrating how this
can work.
• Legal opinion (COJ) is that this type of contract does involve a financial obligation on the public
entity, and therefore, where the contract is longer than 3 years, the requirements of the MFMA
relating to longer term contracts apply. It is therefore administratively demanding as it must go
out for public comment; also relies on economic and administrative stability.
• Involvement of smaller ESCOs an issue, but can be subcontracted by the larger ESCOs, who are
able to shoulder the financial risk.
• Badly maintained buildings a problem60
: will increase electricity consumption post a retrofit –
how does the ESCO and performance savings model cater for this?
• Issue of ensuring savings – ESCO needs the guarantee that the building and energy efficient
interventions will be adequately maintained; risky as often maintenance budgets get cut when
there is a financial crisis and this limits the savings: in some instances the maintenance is built
into the contract, with the City allocating some of the savings to this. In this way the
maintenance and savings is put firmly into the ESCOs hands providing some guarantee to the
ESCO for the lifespan of the contract. However this does increase the amounts paid over to the
ESCO, thus extending the payback period of the contract. Provide example.
Policies and measures
National policy is in place and some policy instruments are in place, including new building standards
that include energy efficiency. No mandatory performance standards exist, but voluntary standards are
in place and leading best practice (in new build and design) has taken place in the public sector. At this
60
Polokwane: at time of audit 35-40% of lighting was not working (either fused tubes or not working at all)

Preparatory work leading to a project proposal on V-NAMA in sub sector of energy efficiency in public buildings:
Analysis report: Baseline, Energy savings potential and Barriers.
84
stage there is no mandatory certification for all government buildings, but some kind of Energy
Management system is being considered by DPW.
Policies are supported by funds, notably the IDM and the Municipal EEDSM. However, some attention
needs to be given to staff capacity to take this work forward within all levels of government.
A growing number of leading municipalities and provinces have energy efficiency policies and targets for
building efficiency in place. These can provide important blueprints for others.
Learning and replication
There are few restrictions for introducing energy efficiency measures in any country. The first enabling
condition is recognition of the potential of energy efficiency measures to deliver cost savings and
emissions reductions and consequently sufficient priority both in terms of policy and budgetary
allocations. The experience is that as projects demonstrate real savings, the institutions become far more
ready to take on this work. Extensive ‘best practice’ exists and learning networks to share experience and
information, through which to develop knowledge and skills, have an important role to play.

Preparatory work leading to a project proposal on V-NAMA in sub sector of energy efficiency in public buildings:
Analysis report: Baseline, Energy savings potential and Barriers.
85
Baseline Conclusion
This report forms the first of a two part assessment: the first establishing baseline, potential and barriers,
the second will explore solutions to barriers and the best form, given lessons and current frameworks,
for a programmatic approach to efficiency in the public building sub sector. This report has gathered
extensive information relating to the sub sector, and put together as comprehensive a picture on this sub
sector as possible within time frames and existing data constraints. As more information becomes
available this Part 1 document should be continuously updated.
For a more reliable baseline and energy savings potential, the following data would be necessary:
g. Municipal data: Further analysis of % municipal energy consumption used by the municipality in
public services. Currently Eskom data at the local level is not known across the board, so for
consistency we have used municipal-distributed electricity in order to benchmark. However, the
proportion of Eskom: Municipal distribution varies substantially across the country and this
method would not be generally applicable (for example Thulamela municipality is entirely within
Eskom distribution area).
h. Further disaggregation of proportion going to buildings within municipal ‘own’ consumption.
Many municipalities don’t record this as a separate sector (it is often put in with waste water
treatment, or not captured at all).
i. Provincial data: no detailed study of the breakdown of provincial ‘own’ energy use has been
done in the country to date.
j. National data: expenditure for all regional offices would be necessary (and reasonably do-able);
it would be an impossibly lengthy exercise to put accurate energy figures to the expenditure
data, given range of rates (commercial, large consumer, etc). However, in the short term the
generalised translation of expenditure to consumption may well be sufficient. In the long run
hopefully billing data capture can include an energy consumption data capture too.
k. For seriously detailed energy savings potential, registries and billing would need to be far more
specifically related to actual building structure, detailing type.
Despite challenges, an important first attempt at disaggregation of national data into a public building
sub sector data picture has been undertaken. From a technical and economic perspective, lighting
emerges as the key intervention to take forward and this is well catered for in the current national IDM
programme.
Preparatory work leading to a project proposal on V-NAMA in sub sector of energy efficiency in public buildings:
Analysis report: Baseline, Energy savings potential and Barriers.
86
Building efficiency is, often, experienced as additional, and not central to the political agenda of service
delivery and poverty alleviation. Clear mandates that are accompanied by resources to fulfil them is vital
to shift this. Grant funding also emerges as playing a very valuable role in kick starting energy efficiency
initiatives, given the (understandable) institutional inertia. A grant-funded “seed” project generally
results in the development of capacity, which is then able to explore the longer-term, more sustainable
investment finance available. It is notable that institutions (particularly a few leading municipalities and
parastatals) that have dedicated units/staff are the ones who are forging ahead with programmes.
At the same time, it must be recognised that ESCO contracting is complex and requires new approaches
which financial and legal staff in municipalities are reluctant, or do not have the capacity, to undertake.
This requires capacity development and support. A sub sector programme will also need to be strategic:
outcomes must match resources (for example, an exercise to regularise billing and metering for energy
management purposes would require extensive resources – time and money – which may not reap
sufficient benefits in terms of savings, except perhaps in the larger institutions of DPW or sizeable
metros).
A number of initiatives – programmes, funding streams and monitoring exercises – exist. What is not
visible is an overarching, clear strategy that clarifies approach, the roles of different stakeholders and
resources to accompany responsibilities. The sub sector appears to be complex in terms of roles and
responsibilities and there is a need to clarify mandates. Amongst national government there are
overlapping (it seems) policy directives and close cooperation is needed to ensure one clear, strategic
direction and effort. Joint task teams established will form important vehicles to take this forward, but
some high level direction may be important. There also needs to be much greater clarity on how this
mandate is devolved from national policy to other spheres of government, or even regional offices, and
where there is devolution of the mandate, this should come with clear strategic direction and sufficient
capacity and resources for local government to take it on.

Preparatory work leading to a project proposal on V-NAMA in sub sector of energy efficiency in public buildings:
Analysis report: Baseline, Energy savings potential and Barriers.
87
References
- Boyd A. et. al, Energy Research Centre, University of Cape Town, South Africa. South African
approaches to measuring, reporting and verifying: A scoping report. Link:
http://www.erc.uct.ac.za/Research/publications/12-Boyd-etal_Approches_to_MRV.pdf
(accessed 12/12/2012)
- Cunninghame, A, A Novices Guide to Planning Health Infrastructure, A benchmark approach,
updated May 2012.
- Delport, Stephen (Ekurhuleni Electricity Department), How implementing an online meter
monitoring and feedback system has helped the City of Ekurhuleni to manage both revenue
and demand for its Large Power Users, AMEU conference paper 2011.
- Department of Minerals and Energy (CABEERE): Report No. 2.3.4 – 03 – Final Report: Energy
Efficiency Baseline Study, October 2002
- Energy Sector Management Assistance Program Briefing Note 09/10. Public Procurement of
Energy Efficiency Services: Getting Started.
- Eskom. Shift performance, grow sustainably: Integrated Report for the year ended 31 March
2012.
- eThekwini Energy Office, September 2012. Potential for improved electricity data reporting
within the eThekwini Water and Sanitation Department.
- European Public-Private Partnership Expertise Centre. Guidance on Energy Efficiency in
Public Buildings.
- United Nations Development Programme, 2010. Promoting Energy Efficiency in Buildings:
Lessons Learned from International Experience.
- Gie J., Strategic Development Information and GIS Department, Strategic Information
Branch, June 2011. The City of Cape Town owned Buildings Electricity Consumption
Reporting System (November 2009 – November 2010): Review and capturing methods and
learnings.
- IDC, KSW, BMZ, 2012. Developing a Vibrant ESCO Market – Prospects for South Africa’s
energy efficiency future.
- Legal Opinion Re: Whether Section 33 of the MFMA is Applicable to the Energy Efficiency
Retrofit Programme, City of Johannesburg, 2007
- McDaid L. 2011. Case Study: Ekurhuleni Metropolitan Municipality: Municipally-driven
energy efficiency and refurbishment.
- San Francisco Water Power Sewer: Services of the San Francisco Public Utilities Commission,
October 2012. 2011 Energy Benchmarking Report: San Francisco Municipal Buildings.
- Sustainable Energy Africa & Nano Energy, 2010. Assessment of Energy Efficiency and
Renewable Energy Potential in Gauteng and Associated Long Term Energy Planning
Implications – As input to the Gauteng Integrated Energy Strategy, Cape Town, South Africa
- Walsh V., City of Cape Town. Energy efficiency in municipal buildings – City of Cape Town
case study.

Preparatory work leading to a project proposal on V-NAMA in sub sector of energy efficiency in public buildings:
Analysis report: Baseline, Energy savings potential and Barriers.
88
- Western Cape Department of Environmental Affairs and Development Planning. A Guide to
Energy Management in Public Buildings: Draft for Internal Comment, 26 June 2006.
- Western Cape Government, 2010. White Paper on Sustainable Energy for the Western Cape
Province, Cape Town, South Africa.
- World Energy Council 2010. Energy Efficiency: A Recipe for Success.

Preparatory work leading to a project proposal on V-NAMA in sub sector of energy efficiency in public buildings:
Analysis report: Baseline, Energy savings potential and Barriers.
89
Interviews
Personnel from the following organisations were contacted/interviewed:
National: Department of Public Works: national and selected regional offices
Para statal or government owned companies: Eskom, Transnet, Telkom
Provinces: Western Cape Province (Environment, Climate Change Office) , KZN (Economic Development)
Municipal: Metros: City of Cape Town, eThekwini, EMM, Buffalo City, COJ
Mid size towns: Polokwane, SPM, Mbombela, KSD, Rustenburg, Thulamela, George
Smaller municipalities: Nxuba, Hessequa
ESCOs: Shared Energy Management (SEM); Kayema
Preparatory work leading to a project proposal on V-NAMA in sub sector of energy efficiency in public buildings:
Analysis report: Baseline, Energy savings potential and Barriers.
PART II: RECOMMENDATIONS TOWARDS THE
DEVELOPMENT OF A PROJECT PROPOSAL ON
V-NAMA IN THE SUBSECTOR OF ENERGY
EFFICIENCY IN PUBLIC BUILDINGS IN SOUTH
AFRICA DRAFT Report developed by Sustainable Energy Africa for GIZ, February 2012

1
Table of Contents
Introduction ............................................................................................................................... 2 Section 1: Selecting a Target: Baseline analysis and project selection ............................... 3
1. Country region..................................................................................................................... 3 2. Sphere of Government and Commitment and Capacity to Implement ................................. 5 3. Building type and intervention choice.................................................................................. 0 Target areas for consideration ................................................................................................. 1
Section 2: Business Model identification ................................................................................. 2 EE Business Models for Public Buildings in South Africa ........................................................... 0 Other models for consideration in the public sector ................................................................ 1 Financing and funding models and options .............................................................................. 2 Evaluation of EE funding options in South Africa ..................................................................... 3
Section 3: Programme design.................................................................................................. 5 Policy, regulation and mechanisms towards EE in buildings ..................................................... 5 Process building blocks ............................................................................................................ 7
1: Developing a project proposal and obtaining council approval and budget...................... 8 2: Baseline development, metering/data capture and MRV system development ............... 9 3: Implementation: Capacity, Technical assistance and Funding ........................................ 10
Some recommended programme elements emerging from action in response to barriers .... 11 Developing long-term framework: mitigation action targets, outcomes and indicator
development ......................................................................................................................... 12 Institutional set-up, mandates, roles and responsibilities of key stakeholders ....................... 13
Conclusion ............................................................................................................................... 15 Appendices ................................................................................................................................ 0
Appendix A: Evaluation of mitigation potential in top 3 provinces ........................................... 0 Appendix B: Eskom baseline development method summary .................................................. 0 Appendix C: SIC Codes ............................................................................................................. 3

2
Introduction
At the heart of the rationale behind a Vertical-NAMA project or programme is the necessity to link
national goals and commitments to local and regional government priorities in a manner that facilitates
mutual cooperation and benefit. Public buildings hold a degree of political clout, they require regular
refurbishment and maintenance attention; and many of the larger municipalities and some provinces
have policy and even targets, relating to efforts to reduce internal energy consumption. This programme
will talk directly to these goals.
However, public buildings at the local (and regional, though less is known about this sphere) are one of
the more complicated EE retrofits and paybacks and returns are not as good as some other
interventions, for example street lighting. For municipalities struggling ‘to keep the lights on’ EE projects
can appear to be an additional burden, not well aligned to pressing service delivery demands. Data on
buildings and energy consumption is sparse. The programme needs to be designed to overcome these
hurdles. Part II of this report follows on from Part I which explored the status quo in the public building
sector, and aims to highlight elements of a programme that would address current barriers facing mass
rollout of EE in the public building subsector.

3
Section 1: Selecting a Target: Baseline analysis and project selection
This section will look to pull together the information gathered in Part 1 of this report to determine
which areas should be targeted to roll out a public building EE programme. The key criteria are
determined by the international V-NAMA process. The major target determining criteria are, of course,
mitigation potential. But the issues of stakeholder commitment, institutional capacity, co-benefits are
also of relevance. The following areas are examined in order to determine programme target selection:
1. Country region
2. Sphere of government and commitment and capacity to implement
3. Building Type and intervention choice
1. Country region
The objective from this exercise is to determine which geographical location has the best potential for
overall mitigation. Information obtained from the most up to date provincially disaggregated energy
balance (2000) shows the following1:
Province Total Energy 2000 (in PJ)
Total energy as % of all provinces
Public building ELEC consumption (GWh)
% of total pubic building ELEC consumption
Western Cape 289.86 13% 1808.33 21% Eastern Cape 180.19 8% 669.44 8% Northern Cape 35.67 2% 141.67 2% Free State 121.4 5% 391.67 5% KwaZulu Natal 475.7 21% 983.33 12% North West 131.2 6% 380.56 4% Gauteng 783.82 34% 3377.78 40% Mpumalanga 193.14 8% 338.89 4% Northern Province 84.79 4% 369.44 4% Total for all provinces 2295.77 100% 8461.11 100%
From this table it can be seen that the largest energy consumption in public buildings occurs in Gauteng
(40%), with the Western Cape (21%) and KwaZulu-Natal (12%) coming second and third respectively.
1 Provincial Energy Balance, DoE, 2000. It is worth noting that this data may not be substantially reliable –
disaggregation of national energy balances to provincial levels where abandoned after 2000 because of concerns
about data reliability at this scale. However, it is believed that the broad allocations may be of indicative value in
the absence of anything more reliable.

4
While this table provides a comprehensive figure for total national public building consumption a few
cautionary points need to be noted:
1. the disaggregation of the national energy balance to provincial allocations was abandoned post
2000 due to concerns about the quality of the data (so the method of arriving at these provincial
allocations is unknown at this stage, and, given our knowledge of the level of data in the public
building sector, it is presumed that the allocations are based on a number of assumptions, rather
than any actual data monitoring);
2. these figures are for all public buildings – national (DPW), provinces, municipalities. The
disaggregation between the 3 spheres is unknown.
3. It is possible (given the figures) that they include ALL areas of local government facility accounts,
including energy for waste water treatment and pumping, etc.
The method employed in Part I of this report (Section 3: Baseline energy picture) has attempted to
develop a picture based on current known figures, and across spheres. In that method, only the built
fabric of local government own electricity consumption has been calculated (excluding waste water
treatment, etc). However, given data levels that picture is incomplete. Thus the two sets of figures
provide some useful cross reference.
Estimates for public building electricity consumption in this report are around:
• 2, 791 GWh for DPW-owned national public buildings;
• 948 GWh for hospitals in the provincial sphere (office and school data unknown);
• 498 GWh for municipal buildings
In total this is some 4, 000 GWh short of the 2000 energy balance allocations. Data is outstanding for
provincial administrative buildings and education facilities; further, the figures are extrapolations of
known data, of course carrying large error risks. A great deal of further work is required, as the data
becomes more available (and hurdles such as the inability to know Eskom distribution figures at the local
level), to begin to develop a more reliable picture.
Assuming that the 2000 data discrepancies are evenly applied across all the provinces, what this table
does show is that geographically, the greatest potential for retrofitting public buildings exists in the
Gauteng, the Western Cape and KwaZulu-Natal provinces.

5
2. Sphere of Government and Commitment and Capacity to Implement
The emphasis of a vertical NAMA is on bringing regional (local and provincial) government into
programmes towards achieving national mitigation commitments or targets. While, in this sense national
government may be considered as an existing participant in national mitigation, the reality is that
alignment across national departments still needs to be explored and pioneered. Further, much of
national implementation takes place on a regional level, bringing some degree of decentralised
administration – and related challenges – into the picture. For these reasons, all spheres of government
can be considered of importance in a V-NAMA pilot process.
Sphere of
government
Mitigation potential, opportunities and challenges
National Public buildings owned by national government appear to hold the largest mitigation
potential. As these are administered through one office (DPW Head office) this makes for
substantial bundling opportunities, bringing down transaction costs enormously. Programmes,
drawing on private capital through ESCO shared savings contracts, are already underway and
have been working well. Major areas of programme support likely to be M&V and data
collection, capacity of building maintenance staff, particularly to support refurbishment and
new build design.
Provincial There is little data/information here. Capacity appears to exist in ‘pockets’. Western Cape data
provides an important insight into potential within hospitals. Improved energy services in this
sector would also have important social co-benefits in terms of quality of health care
experience.
Local The emerging data points to larger metro buildings as having mitigation potential; within
smaller municipalities a far simpler lighting retrofit programme may be sufficient to address
the key mitigation potential.
The table below looks at some of the key issues which may determine where a building retrofit
programme should be targeted within these the provinces:

Preparatory work leading to a project proposal on V-NAMA in sub sector of energy efficiency in public buildings: Analysis report: Baseline, Energy savings potential and
Barriers.
Province Public building
energy
consumption
level/
mitigation
potential
Availability of
data/Number of
provincial and
local buildings
Number of Metros
and big towns/
urban rural
diversity
Political commitment at
provincial and municipal level
(“championship”)
Energy offices/
capacity/ policy
Financial
support
needs
Alignment with existing
projects
Gauteng 40%
High ****
Data: good
Number buildings:
High
3 metros;
some smaller
industrial
municipalities,
small rural
component.
Policy and targets: strong
Leadership: medium
Capacity: medium to
strong
Medium to
low
Current: EEDSM
EMM: own EE programme
running.
EEDSM been accessed.
Western
Cape
21%
Medium to high
***
Data: good,
including province
Health;
Number buildings:
Medium to high
1 metro, 2 larger
towns, mix of
urban and rural
(rural largely
commercial
agricultural).
Policy and targets: strong
Leadership: strong
Capacity: very strong
(dedicated staff,
training programmes)
Medium to
low
Current: Regional DPW ESCO
contract, CCT has internal
capacity and budget
allocations.
EEDSM been accessed.
KZN 12 %
Medium **
Data: good (bit
messy);
Number buildings:
Medium
1 metro, 2 larger
towns, large rural
component.
Policy and targets: strong
Leadership: strong
Capacity: strong Medium Current: Regional DPW ESCO
contract; eThekwini has
internal EE rollout.
EEDSM been accessed.
Eastern
Cape
8%
Medium to low
**
Data: Provincial
unknown,
NMBMM audits of
major buildings
Number of
buildings: Medium
2 metros, couple
of larger towns,
substantial rural
component.
Policy and targets: weak (not
known fully)
Leadership: Metro has some,
generally not very strong
Capacity: in NMBMM
medium to strong,
Buffalo city – strong
electricity capacity (but
constrained); KSD
capacity constraints
Medium to
high
Current: some DPW
contracts still running? Part
of SDC/SALGA EE
programme; EEDSM?
EEDSM been accessed.
Free State 5%
Medium to low
**
Data: unknown 1 metro,
substantial rural
component
Policy and targets: weak (not
known)
Leadership: generally not very
strong (not known)
Capacity: Centelec in
Mangaung has capacity,
but generally
constrained
Fairly high Current: ?
EEDSM been accessed: some
issues with spend.
North
West
4% Low * Data: unknown Larger towns, rural
component
Policy and targets: weak (not
known)
Leadership: not strong (not
known)
Capacity: weak
Not known Part of SDC/SALGA EE
programme;
EEDSM been accessed.
Mpumala
nga
4% Low * Data: largely
unknown
Large town, large
rural component
Policy and targets: fairly weak
(not known)
Leadership: generally not very
strong (not known), but under
Capacity: good
electricity staff in
Mbombela, but short in
numbers
Assume high Part of SDC/SALGA EE
programme;
EEDSM been accessed.

1
Province Public building
energy
consumption
level/
mitigation
potential
Availability of
data/Number of
provincial and
local buildings
Number of Metros
and big towns/
urban rural
diversity
Political commitment at
provincial and municipal level
(“championship”)
Energy offices/
capacity/ policy
Financial
support
needs
Alignment with existing
projects
development through SALGA
EE programme in Mbombela
Limpopo 4% Low * Data: has detailed
data for
Polokwane,
province unknown
Large town, large
rural component
Policy and targets: not known,
assume weak
Leadership: generally not very
strong (not known), but under
development through SALGA
EE programme in Polokwane
Currently under
administration.
Capacity: good
electricity staff in
Polokwane, but short in
numbers
Assume high Part of SDC/Salga EE
programme;
EEDSM been accessed.
Northern
Cape
2% Very low Data: largely
unknown.
Large town, large
rural component
Policy and targets: SPM has
strong policy and targets,
Province – not known
Leadership: strong
Capacity: have a
Sustainable Energy
Unit, but struggle to get
implementation
support.
Assume high Part of SDC/SALGA EE
programme;
EEDSM been accessed.
Notes:
1. Insufficient time to get asset registries for each and every city and larger town; have included number where have it. It is usually fairly easy to get a registry of total
buildings, but difficult to assign these to building type categories. Detail on each municipality, where it has been collated, can be found in DATA Summary
documents (attached). Also, municipalities record very differently – each built structure vs. facilities (so, smaller municipality may appear to have substantially
more buildings).
2. Co-benefits not evaluated as this likely similar across areas.

Preparatory work leading to a project proposal on V-NAMA in sub sector of energy efficiency in public buildings:
Analysis report: Baseline, Energy savings potential and Barriers.
A detailed table on the top 3 provinces, in terms of mitigation potential, can be found in Appendix A. In
terms of these three provinces, from a policy and capacity perspective each of the three provinces listed
above would be suitable locations to target an efficient building programme. Provincial capacity in KZN is
probably the lowest of the three. However at Metro level, eThekwini, Ekurhuleni and Cape Town all have
very strong energy offices which could manage or co-ordinate a programme, while Tshwane and the City
of Johannesburg would require additional co-ordination assistance.
3. Building type and intervention choice
Results from Part 1 of this report indicate that savings realised off the baseline energy consumption for
each of the three classes of public buildings (single storey multi building compound, medium sized
multi-storey office block and large multi-storey office block) are fairly similar. As a reminder this
information is presented again below:
Low High Modify existing New Low High Low High
Medium sized multi-storey office block
(floor area<10 000m2) 13% 16% 3% 11% 1% 1% 17% 28%
Single storey multi building compound 9% 13% 2% 5% 2% 4% 13% 22%
Large multi storey office block (floor
area > 10 000m2) 16% 24% 1% 11% N/A N/A 17% 35%
% saving from intervention off baseline consumption
Lighting HVAC Water Heating Total
The single storey compounds are the least beneficial of the three (13%-22% savings as opposed to 17% -
35% savings). Maximum mitigation benefits would come from retrofitting the large multi-storey office
blocks, and then the medium multi storey blocks.
In terms of intervention choice, efficient lighting should be prioritised due to its high mitigation impact in
all building types. Other interventions such as HVAC and water heating are beneficial if financially viable,
but will not contribute as greatly to mitigation efforts, unless an inefficient HVAC system is replaced with
a more efficient system.
It also would be sensible for projects where capacity to implement is poor, building lighting alone should
be focussed on to simplify a project
There is very little knowledge on saving potential in provincially owned office blocks and hospitals, but as
the largest buildings within provincial government, these should be initially targeted as they promise the
greatest savings.

1
All on-ground building engineering staff have noted that capacity to monitor and manage energy in
buildings is critical; as is the knowledge to ensure that new build and refurbishment of public buildings
are designed with energy efficiency in mind.
Target areas for consideration
Based on the information presented above, the following target areas are recommended for further
investigation:
Sphere of sub-
national
government
Programme Interventions Potential savings
Metros
All multi-storey office
buildings,
Larger building compounds
Full suite of
interventions
17%-35% off baseline
Smaller
municipalities
All office buildings above
1000sq m
Efficient lighting 13%-16% off baseline
Provincial
government
Focus on National and
Regional hospitals
Explore office blocks and
schools
Unknown Unknown
2
Section 2: Business Model identification
Although EE projects in public facilities can be done through traditional fee-for-service, civil work
contracts, the innovation in this sector lies in the capturing of the efficiency savings to offset capital
costs. This can be done through payment of fees proportionate to the EE performance, or through
guarantee of savings and in this it differs from other PPPs in infrastructure in that it measures reduction
achieved. This makes the establishment of the baseline and the methodology design for measuring and
calculating the energy savings effectively at the outset critical, in order to properly allocate risk sharing
between the parties.
The main emphasis in an EE programme should be on implementing EE investments aimed at reducing
energy consumption in physical terms, rather than simply trying to decrease the energy bill in financial
terms (though this has been a good incentive in DPW where they have found that they were being billed
on incorrect tariffs, etc, in a number of facilities2).
The experience in South Africa to date, and this is affirmed as the most effective strategy in international
literature3, is that a variety of models and procurement approaches are important to enable government
agencies to ‘mix and match’ and find appropriate and feasible solutions within their particular context.
For example, the scale of national facilities (and potentially hospitals at regional level), and dearth of
capacity to manage these, means that the high service/risk “Shared savings” model in which the ESCO
provides a full set of services, is ‘value buying4’ in this context. In addition, the scale of the venture
means that the transaction costs can be greatly reduced. On the other hand, in the absence of clarity
around contractual issues relating to the shared-savings model, metros have found that the transaction
costs in terms of procurement administration efforts are relatively too high and it is far simpler to raise
funds and simply procure EE through a traditional ‘build to order’ contract. Models need to be well
understood and matched with the situation. Some indication of pros, cons (towards an indication of
possible applications) are supplied below.
2 Pers. comm. Ossie Lamb, Western Cape Region, DPW, Feb 2013.
3 ESMAP, p 8-13 and EPEC, p14
4 Pers.comm. Ossie Lamb, ibid.

Preparatory work leading to a project proposal on V-NAMA in sub sector of energy efficiency in public buildings: Analysis report: Baseline, Energy savings potential and
Barriers.
EE Business Models for Public Buildings in South Africa
Business model Detail Local examples Pros Cons
High service/risk
“Shared Savings”
full service EPC
ESCOs design, implement, verify
and get paid from actual energy
saved.
Contracts in which the ESCO
offers financing and provides a
savings guarantee, meaning the
ESCO bears both the financial and
performance risk.
Department of Public Works has
successfully concluded a 10 year
Shared Savings programme with ESCO
Shared Energy Management; and has
entered a new 10 year contract with
ESCO Zamori.
Mobilise private sector financing and
transfer risk.
ESCO offers all services and financing, so
minimal additional capacity from public
sector; ESCO brings substantial technical
expertise into maintaining savings over
extended period, usually 10 years; draws
on private finance so has an in built
sustainability.
Effective where large number of facilities
can be bundled (reduces complex
procurement transaction costs) and where
lack of internal capacity.
Public sector ‘benefits’ that could
be retained are garnered by the
private sector; Complex contracting
issues: pay back periods are usually
around 6 – 10 years, thus bringing
in Section 33 of the MFMA, which
CFOs are seemingly very reluctant
to engage; opinion also that
conditions of Section 33 render this
option ‘illegal’ in the public sector.
“Guaranteed
savings” Contract
ESCOs design and implement and
guarantee minimum level of
savings. Contracts in which the
ESCO takes the performance risk
and the public partner is
responsible for the financing
(from a third party). In some
instances this may be structured
as a performance contract
(payment on proof of savings), in
others the ESCO is paid upfront,
but must guarantee savings or
reimburse the client.
City of Cape Town has used this model
with 4 buildings, drawing on funding
from DANIDA.
Able to avoid MFMA complexities, while
retaining some of the service advantages
provided in an ESCO contract
(maintenance, energy management).
Miss out on longer term
maintenance of savings.
Reliant (seemingly) on availability of
public/donor funding (budget, grant
or subsidy) which may decrease
longer term sustainability.
Utility DSM “ESCO” A publicly owned ESCO uses
funds from a DSM programme to
invest in target public buildings at
no cost to the agency (so no
procurement, since no
contract/payment)
Eskom’s rollout of energy efficient CFL
lighting across the country (private
and public sector).
This achieved an enormously successful
80% penetration. Huge economies of scale.
Economic development and job creation
(small ESCOs used).
Need a strong regulator to verify
and ensure targets are being met
Consultant with
fixed payments
Helps client design and
implement the project, advises
and receives a fixed lump-sum
Ekurhuleni has retrofitted some 7 civic
centres and 20 depots (just lighting in
depots) through direct contracts;
Avoid complex procurement, so save on
admin capacity – much speedier, no risk.
Reliant on available funding: own
budget, donor, grant funding. EMM
have built in sustainability through

1
Business model Detail Local examples Pros Cons
fee for service. City of Cape Town retrofit of Civic
Centre: split contracts – phase 1
employs an ESCO to raise the Eskom
IDM subsidy on behalf of the City, do
project design and specs, manage
phase 2. Phase 2 will appoint ESCOs to
implement interventions. Funds from
Facilities line item, and IDM Standard
Product for lighting only (total R6 mill
per single intervention) – standard
design and civil works contracts (CW)
creating a budget line item that is
‘fed’ through apportioning small %
of electricity revenue here.
Low service/ risk
Preparatory work leading to a project proposal on V-NAMA in sub sector of energy efficiency in public buildings:
Analysis report: Baseline, Energy savings potential and Barriers.
ESCO “Shared Saving” model: ESCOs package substantial services, including consulting engineering,
general contracting, energy analysis, project management, project financing, training, performance
guarantees, energy measurement, risk management. They can vary in size and ownership (may be
privately owned, utility subsidiaries, not-for-profit, joint-venture and some rare examples of state-owned
or municipally-owned ESCOs5). Their ability to raise finance can depend on their financial strength. An
ESCO’s share of savings typically falls within a range from 50% to 90%, with 65-85% representing the
most common values6. ESCOs derive revenue from the design and installation of cost-saving solutions at
a client’s facility. Costs are marked up to cover overheads and generate profit. ESCOs are required to
limit costs to that they can be paid from savings over an agreed contract period. The “shared savings”
model motivates the ESCO to maximise most cost-effective measures to achieve savings.
Guaranteed savings contract: The public partner obtains project funds (from budget or third party
financier) and takes on the financial risks. The ESCO is paid to provide all necessary support activities and
facilitate the financial arrangements between the public partner and funding institution (where relevant,
e.g. obtaining the IDM fund monies). The ESCO provides a guarantee of a minimum level of energy
savings, which allows for reimbursement of the loan. In the case of a shortfall in realised savings, the
ESCO is obliges to make a reimbursement cover in the difference between the expected savings ad the
amount to be paid back to the financial institution. If savings exceed the guarantee, usually the public
partner keeps the excess. The contract is thus a traditional ‘turnkey’ contract with the public partner
and, in an additional agreement, the ESCO commits to refunding any amounts received where the energy
savings are not achieved (EPEC, p 12).
The ESCO “shared-saving” model offers enormous value in that it leverages private capital and ‘value
buys’, bringing in to an often capacity constrained public sector the specialised technical expertise
relating to monitoring and maintenance (for example, auto meter readings can enable the ESCO to
monitor and respond to spikes, as this is structured to be very much in their interests, whereas this type
of response capacity can often be low in the public sector), reporting, clarifying tariff and billing
structures, and baseline development. On the other hand, where there is the capacity to develop this
sort of expertise in-house and design building management systems that incentivise efficient
management, that is obviously a best practice scenario and a programme should enable and enhance
this where it is viable. For example, the City of Cape Town is in the process of installing Auto Meter
Readers in their major buildings and training the building managers to read these and respond to spikes
and general trends. Building managers will be required to report to the Energy Unit on readings and
5 EPEC, p 10.
6 EPEC, p 11.
1
provide analysis of outcomes and indicate whether they have intervened or responded7. Ekurhuleni do
all of their building monitoring and tender specification in-house8. The Western Cape Health Department
has an Engineering division that has extensive health building energy capacity, but this kind of capacity is
rapidly disappearing as engineers move out of the public sector and, indeed, out of the country9.
Other models for consideration in the public sector
Public ESCO: ESCO publicly owned so no requirement for competitive procurement process. Here the
public sector would pay for the capital, but retain the full benefit.
PROS: this can reduce transaction costs for procurement, greater access to concessional international
funding, while raising the comfort level of municipalities that know little about energy efficiency projects.
A publicly owned ESCO would also ensure that all the benefits accrue to the public sector (in private
models usually at least half of the benefit is passed on to the private sector in exchange for upfront
capital).
CONS: may not be as efficient and cost-effective as the private sector, may become monopolistic, may
not lead to sustainable, vibrant ESCO market. The establishment of a new public institution can also take
years to set up, thus delaying the process substantially. There would be concerns about the motivation
for ongoing maintenance and monitoring post the retrofit and maintenance of the savings levels.
Types of procurement
Broadly, contracts can be categorised in the following way (there are a number of variations within
these)10
:
Procurement approach Experience, evaluation and
application
Split design and construction contracts
This involves a standard civil works (CW) contracting process where an
agency is contracted to conduct the audit/project design, including
technical specifications and bidding documents and a second contract is
then issued for the supply and construction project. The model can include
standard payment on completion of the project per design; turnkey bids
(i.e. evaluation based on savings targets, or minimum costs to meet
savings11
) with fixed payments or turnkey bids with performance based
payments.
City of Cape Town civic centre retrofit
project has been developed on this
basis and EMM does most of their
retrofits through a standard CW
contract with design done internally.
7 Pers.comm Sarah Ward, Energy Management Unit, City of Cape Town, Feb 2013.
8 Pers. comm. Tshilidzi Thenga, Energy Division, Ekurhuleni, Dec 2012.
9 Pers. comm. Andrew Cunninghame, Chief Engineer, Department of Health, Western Cape province, Feb 2013.
10 see ESMAP, p22, for a detailed table
11 There are many precedents for this, for example in the IT sector where a bidders may be told that 30% saving
would be the benchmark and they are asked to propose what they can do over and above this. Pers. comm. Kam
Chetty, TAU, Feb 2013.

2
Procurement approach Experience, evaluation and
application
Combined design and output based contracts
Here there is no upfront design and contractors are appointed on broad
technical and financial bids based on basic facility information. The first
task of the contract is design, which must be approved by the client before
construction. Payments can be output or performance based. There can
also be a two-stage bidding process.
DPW contracts are done in this way;
City of Cape Town also used this
contract design for their 4 building
retrofit.
Indefinite contracting: umbrella government agency competitively
procures/pre-selects ESCO(s) on basis of general qualifications (method
and split) and other spheres/departments of government agencies can
contract directly with these without further procurement.
PRO: reduces transaction costs
relating to complex procurement and
thus allows for much easier
contracting between smaller
government agencies and ESCOs,
ESCO can invest in staff and
equipment as has longer term
security
CONS: potential for non transparent
direct contracting approaches; can
stifle the market for new entrants;
less leverage on price negotiation.
Project bundling: bundle a pool of facilities to award a single contract to a
large ESCO
DPW contract underway; CCT x 4
buildings.
PRO: reduces transaction costs;
spreads the risk , economies of scale
CON: if gets too large it may be
difficult to manage.
A note on project bundling and minimum project viability size: As detailed in the table, here a public
partner bids out a bundle of facilities for a large ESCO. Transaction costs (notably procurement
processes) for energy efficiency projects in the public sector are high compared to the capital budget
(relative to other public sector projects). Bundling can help to achieve economies of scale and lower
transaction costs. Bundling also enables an approach that tackles the quick wins upfront, across multiple
buildings, thus bringing in quick cash returns to the ESCO (paid on proving savings), enabling the ESCO to
move onto additional interventions. Local ESCO SEM notes that in shared savings projects a minimum
scale threshold for these to be viable would be a facility bundle with at least R500 000 (half a million)
annual energy consumption12
. The European benchmark for project viability is EURO 2 – 5 million project
investment range13
.
Financing and funding models and options
The nature of the project financing may have implications for the business model and procurement
method. Own-financing by government may be attractive if they can access lower cost financing or
12
Pers. com. Patrick Costello, Manager, Western Cape, Shared Energy Management, Feb 2013 13
EPEC, p13
3
concessional donor loans, public revolving funds or DSM programs. This enables government to retain
much of the efficiency benefit that can be derived in an efficiency programme. It may also simplify
procurement procedures. On the other hand, ESCOs offer a way to finance EE projects off-budget. This
can be very attractive where there are competing budget demands and little net benefit to be derived
from the EE project. However, this is dependent on the ability of ESCOs to raise finance.
Financing will typically be through a combination of mechanisms, and various sources. The experience of
ESCO Shared Energy Management is that the financial institutions in this country have moved a long
from where they were ten or fifteen years ago, when this kind of project was first undertaken in the
country14
. A range of capital sources are now fairly easily accessible and there are no notable gaps in
terms of financing of EE projects.
Evaluation of EE funding options in South Africa
Type of Finance Current funds in place in South Africa Evaluation
Self financing:
Government budget for
EE projects
Public partners with sufficient funds can self-finance EE projects. However, government is under
enormous spending pressure and competing demands on the budgets they have. The challenge
they face is: Does this project have higher priority compared to other public projects competing
for the same funding. Further, efficiencies may not be able to retain the financial savings due to
budgetary rules (operating budgets must meet operating costs).
Self financing: Provincial/
Municipal internal
funding
City of Cape Town: Facilities have provided
funding from their budget for the retrofit of the
civic centre;
Western Cape Health: Engineering budget has
annual allocation for small (R2 – 300k) projects
that has been used for EE retrofits.
PRO: Enormously simplifies the procurement
process; savings benefit entirely retained in
the public sector, but maybe not within the
relevant department or municipality itself.
CON: very ad hoc (difficult to build up a
programmatic approach); competing funding
needs within the municipality; doesn’t
mobilise private capital.
Ekurhuleni Metropolitan Municipality –
revolving funds from “ring-fenced” portion of
the electricity revenues.
As above.
Additional PRO: funding can be fairly
sustainable and enables a programmatic
approach to EE projects.
Additional CON: ‘Ring fencing’ of funding not
readily approved by Councils and may also
need NERSA approval.
Self financing: National
Treasury funding
Conditional Grants
- EEDSM funding to municipalities
channelled through the DoE
- MTEF allocations for EE to DPW
As above.
Additional PRO: These funds appear to be
extremely important in catalysing EE
projects and building internal capacity in
implementing organisation.
DSM subsidy funding Eskom is tasked with raising DSM finance
through a EE levy on electricity tariffs. This
finance is made available to ESCOs/institutions
through the Integrated Demand Management
programme. Eskom IDM programme has various
funding streams: Standard Offer, Standard
Product, Performance Contracting & ESCO
Process
PRO: subsidisation of projects based on
benchmarked performance can substantially
enhance the attractiveness of a project for
an ESCO.
CON: can be difficult to work the system –
increases transaction costs.
14
Pers. com. Patrick Costello, SEM, Feb 2013.

4
Type of Finance Current funds in place in South Africa Evaluation
Debt
funding/Commercial
bank lending
Loans Debt financing for EE is now a possibility
with commercial banks in South Africa,
although this may be fairly expensive and
difficult for smaller ESCOs to raise.
Equity investment for EE ESCO partners with other investors to raise
funding. For e.g. the recently established
European EE Fund (“EEEF”) – provides market
based financing for commercially viable public
EE, supported by various banks and the
European Commission (EPEC, p22).
South Africa doesn’t have this sort of fund in
place, but this ‘gap’ may well be largely met
through Development Finance (below).
Development Finance
Institutions
Development Bank of South Africa (DBSA) –
Green Fund
Potential to fund EE in the public sector
through its Green Fund
Industrial Development Corporation (IDC) –
Energy Efficiency Fund
Currently being setup to fund the private
sector/ ESCOs through low interest loans
International DFIs Needs exploration

5
Section 3: Programme design
Some recently published guides on public building energy efficiency provide extremely detailed and
helpful, step by step guidance on EE project development and implementation that has been read in
detail and found to be relevant to the South African context. The most useful of these are:
• Public Procurement of EE services: Getting Started – ESMAP EE Cities Initiative
• Guidance on Energy Efficiency in Public Buildings – EPEC
• Promoting EE in Buildings - UNDP-GEF
Policy, regulation and mechanisms towards EE in buildings
National EE policy is in place, with associated targets and implementation action plans. At the provincial
and local level some policy development has been achieved, with much underway. Good ‘best practice’
and policy blue prints exist for regional and local government in South Africa.
EE regulations for new build and major refurbishments have been developed and the country is fast
developing the capacity to enforce these; although these may be not as ambitious as they could, the use
of Energy building codes, or rating systems, or voluntary performance standards are not recommended
in this programme. Some cities will pioneer this (see case study in Part I of this document on CCT
Manenberg civic centre), and this provides really important input into the sector around technologies,
etc, but it is far too costly in terms of technical resources and membership fees to be considered across
the board.
The major gap for EE building implementation lies in the lack of an enabling environment and current
lack of incentives for regional or local government to take on this additional activity and risk. The table
below explores typical barriers in South African implementation of EE in public buildings at sub-national
level; and makes recommendations towards creating a more enabling environment (programme design
recommendations).
Issue, barrier Response action
Limited incentives to implement
EE (potential loss of budget and
competing budget needs), try
new approaches and take on risks
Demonstrate financial saving and economic benefit; Support integration of
Municipal policy commitments to EE into KPI’s of CFO and other senior
managers; support innovation at local level through provision of varied
business model options; consider process to tax inefficient lighting

6
Issue, barrier Response action
technologies and directly subsidise efficient at source (would result in
automatic replacement without need for big process); clarify budgeting
process with NT to establish whether possible to change budgeting process to
allow retention of energy savings; establish awards for staff (building on
existing EE Awards); risk sharing/financing programs.
Lack of awareness and
information, including costs,
benefits, risks, products (lack of
trust of EE potential).
Initiate awareness (case studies/demonstrations); Guide on economic
benefit15
; Guideline from NT (MFMA division) on application legal framework
to this type of contracting (see below); Guide/input/presentation on how the
contracting works (e.g. in DPW they had to make specific inputs/presentations
to the ‘educate’ the bid committee about the kind of contractual
arrangement); procurement guidelines; training of on-ground building
managers around new EE building regulations and develop learning/info
sharing networks (particularly for application of new EE regs in new build and
renovation).
In particular there is a need to
address the perception (legal
opinion) that ESCO shared saving
model incurs ‘financial obligation’
in terms of Section 33 of MFMA.
Detailed examination of contract wording (DPW and COJ Honeywell contracts)
to establish where the objection lies; examination of COJ legal opinion by
MFMA division to establish if this based on an interpretation of budget
formats that could be cleared up by NT (Hattingh); MFMA at NT to then issue
guideline on their understanding of the application of the public finance
legislation.
Complex /restrictive contracting
and procurement and financing
rules
Benchmarking of typical savings/building type through enhancing data bases
to facilitate procurement approaches (e.g. what can you do above 30% saving
in building x); procurement guidelines; develop locally applicable business
models (innovate around a variety and see what works); strengthen public EE
funds.
Lack information, data, baselines,
benchmarking
Responses here need to be realistic and pragmatic: under current capacity
conditions certain data will simply not be forthcoming in the foreseeable
future; research can build up important pockets of information from which
broad understanding and benchmarking can be derived; develop
billing/accounting systems that include consumption with cost; align asset
registries with energy management data needs; install AMR where feasible,
explore national reporting data bank.
Lack of technical capacity, EE
audits, project design,
Create some sort of Technical Assistance agency/unit for EE projects; appoint
dedicated EE managers/staff; develop training for building managers (see
15 This motivation can be complex as the economic benefit argument is dependent on a definition of municipality
that includes not just the admin unit, but also the broader community (as per SALGA definition, but not necessarily
the legal definition: pers. comm. Kam Chetty, TAU, Feb 2013)

7
Issue, barrier Response action
procurement, implementation,
monitoring
CCT); develop procurement and contracting guidelines; establish process for
prequalification of ESCOs; train energy staff in M&V protocols and procedures;
product catalogues/specifications and on-ground building manager
learning/info sharing networks (particularly for application of new EE
regulations in new build and renovation).
Lack of accountability for energy
consumption or savings and
consequent lack of data (lack of
technical capacity for ongoing
building energy management and
monitoring)
Support development of targets and reporting/monitoring system - fund
purchase and installation of AMR in priority buildings in larger cities; train
energy managers in monitoring, analysis and reporting; support development
of accounting system that enables benchmarking and monitoring (e.g. use of
SIC codes, blue print registry system); and develop a guideline on energy
(resource) oriented asset registry system that includes building names, types
and sizes and consumption (as this begins to come in). See Appendix C for
more detail on SIC Codes.
Lack of funding for upfront audits
and project funding
Work with relevant departments to try and get budgets allocated to EE
building projects (e.g. Facilities – align with their refurbishment projects);
strengthen dedicated grant/subsidy programmes (NT grants, IDM funds);
explore internal municipal ‘ring fencing’ of electricity revenue to support
internal DSM projects; Facilitate access to IDM funds.
Proportionally high transaction
costs (relatively small capital
requirements)
maximise opportunities for standardisation and economies of scale: bundling;
technical assistance provided to prepare and design the project;
Pro forma / model documents/templates (e.g. contracts, baseline
development, audits) to streamline projects (explore contracts developed by
Clinton Foundation and other international best practice, best wording in
terms of MFMA conditions, learn from ‘loop holes’ in existing DPW contract);
prequalification of ESCOs and M&V professionals.
Overarching coordination and
post retrofit maintenance issues
Establish overarching buildings coordination at all levels of government,
between departments; train Maintenance and supply chain staff to ensure
sustainability of savings.
Understanding typical processes within sub-national government is really important in developing an EE
building efficiency programme, and EE projects within it. Some recommended process building blocks for
South African municipalities follow:
Process building blocks
8
1: Developing a project proposal and obtaining council approval and budget
This is no small issue as it involves overcoming the disincentives and developing political ‘buy in’ in a
municipality. Municipalities have little incentive to embark on EE building projects and the following
needs to be overcome:
- the disjuncture at municipal level between consumption and billing: there is often no metering,
no monitoring and often no actual payments (even when in Eskom area often just a general
agreement with eskom for an amount for whole city, not relating to individual building
consumption) for electricity;
- no net benefit, but incur admin costs and risk: whether the municipality does building EE or not,
the net cost doesn’t really change for them (because operational budget must match operational
cost – so if cost goes down, next years budget must go down), but the activity will incur admin
costs, and risks (if service provider doesn’t meet obligations, city absorbs that risk);
The recommendations are to increase information and awareness, and build a compelling case
through:
- build on existing mandate and demonstrate savings and economic benefits: local government is
constitutionally obliges to manage public funds and deliver service in efficient and sustainable
way, so the financial savings must be demonstrated; the economic benefits of increased activity
in the built environment sector must also be demonstrated;
- build a degree of compulsion into the system by bringing EE performance into the key
performance indicators (KPIs) of the CFO and senior managers. In the instance of the Head of
Electricity, this could possibly be reflected through minimising non-technical losses;
- this would then push it down into line departments: this will vary (need to be opportunistic and
work where energy is), but likely Energy units, Electricity department or Environment.
- the ‘implementing’ department will then need to generate/develop a project proposal [note: link
to technical assistance, capacity building and guidance/template documents] for approval within
the city budgeting process (without this nothing can happen – no capacity can be allocated, etc).
- The implementing department must ensure that a steering committee is set up of all relevant
Executive Managers – Finance, Infrastructure, Electricity, etc and must ensure that all of these
support the proposal before it goes to council for approval in budget process.
- To further develop the project, there has to be capacity allocated, in the form of a dedicated,
capable staff member at this level to take on the project development work. This cannot simply
be additional to an existing (usually overburdened) job description: some new capacity must be
created.

9
- Building selection guidance: the indications are that larger buildings offer the most value in
terms of savings and these should be the priority (“tier 1”); it is also worth considering
prioritising buildings with large staff component and public interface, and the distribution of the
selection across geographical areas in city (to maximise awareness impact); start also with the
most simple (e.g. avoid complications where building may be privately owned, etc).
2: Baseline development,16
metering/data capture and MRV system development
It is obviously important, for the programme as a whole and the individual projects, to develop a project
baseline, and an approved methodology through which to measure the savings achieved. The
methodologies17
to do this is very established in South Africa, in terms of international M&V protocols
and, it is believed, align with UNFCCC requirements (see Appendix B). An initial assessment of potential is
important in terms of prioritising interventions, but a full baseline development is usually part of the
appointed ESCOs work. Given the state of consumption metering, monitoring and data collection, the
following support activities will be important:
- Develop simple interventions into accounting systems for data capture of actual resource
consumption not just cost of consumption (this relates particularly to national and provincial
government; at this stage municipalities rarely have a billing system for internal consumption);
- Develop public asset registries that are simple, but begin to enable benchmarking (building size,
type, consumption);
- Explore installation of smart (AMR) meters in the strategic, ‘tier one’ buildings18
. This could
provide readings against specific codes (and explore linking these to sic codes for ultimate longer
term data capture alignment), these readings could go remotely to municipal departments but
also potentially to a national data base. This would also provide an ongoing management
tool – can measure and monitor consumption and savings (incentives) (See CCT in
Section 2 on building manager development and energy management reporting).
16
Note, this refers to project baseline development. It is not possible to establish a public building electricity
consumption baseline at province or local level government in South Africa; this could be established for public
buildings at national level, but would require great deal of work (each account reviewed to get actual consumption
– accounts in each region will run into 1000s); Reasons being: many municipalities/provinces don’t have
comprehensive asset registries (some still discovering buildings), many buildings not even metered, many meters
not read, consumption not captured in electricity billing system in a form that is extractable, etc. A broad, indicative
assessment of baseline electricity consumption in public buildings, and consequent mitigation potential, can be
achieved through the method/process outlined in Part 1. This is a useful exercise for strategic decision, making but
not for MRV within UNFCCC requirements. 17
For a good overview of this, see EPEC, p 42 18
Delport, Stephen (Ekurhuleni Electricity Department), How implementing an online meter monitoring and
feedback system has helped the City of Ekurhuleni to manage both revenue and demand for its Large Power Users,
AMEU conference paper 2011.

10
- Develop and set up a national EE in public buildings auto monitoring and reporting station/data
base. This would generate a “point” baseline – i.e. on the buildings being targeted; and this
baseline could expand over time to increasingly develop a sense of the national EE in public
buildings potential. Ideally this would mean that the programme does not add to already
arduous reporting requirements for municipalities (already often tied in to reporting to Eskom
IDM, EEDSM Programme, NERSA, internal, etc).
3: Implementation: Capacity, Technical assistance and Funding
EE project development, from business model, to procurement, bid evaluation, contracting and
monitoring and verification is enormously complex and specialised. This is a new type of procurement
approach (although there are some existing precedents in terms of infrastructure and IT contracts) and
the public sector, particularly the smaller municipalities, will need capacity development and technical
assistance and guidance.
The appointment of dedicated capacity has been noted above. However, this should also include
facilitation support to build and develop inter-departmental energy efficiency teams in municipalities
(the work requires substantial inter-departmental cooperation: Facilities, Energy/Environment,
Electricity, Maintenance, Procurement/supply-chain etc). Learning networks amongst municipalities have
also been shown to be an effective strategy (and indeed amongst facility managers at all spheres of
government). These networks should also facilitate on-ground experience feeding in to business model
and contract development. The development of building and facility management staff knowledge
around technical EE products and equipment will be important for sustainability, and informing new
build/refurbishment EE design.
Technical assistance must be expert, including EE technology skills, financing and legal skills relating to EE
procurement and contracting. The programme should, at the same time, work to ensure the transfer of
these skills into the public sector. The development of guidelines, templates and method documents,
training exercises and learning networks will enhance this. Technical assistance must also ensure it works
with existing capacity, for example, drawing on the TA Unit of National Treasury in relation to work
around application of public finance legislation to the sector; utilising existing training organisations such
as Certified Energy Management training, etc. Technical assistance can be expanded/spread through the
provision of guideline documents, templates and models as noted (in tables above and below).

11
Some recommended programme elements emerging from action in response to barriers
Programme element Detail
Information and awareness Case studies and demonstration of savings and economic benefits; Input on how EE
relates to municipal mandates; Awards programme; sharing of best practice (e.g.
Western Cape Health department Engineering services).
Capacity Appointment of an EE manager (new capacity or reallocation of existing capacity –
but must ideally not in additional to existing job) with resources coming from
national; as other critical positions remain vacant in many municipal electricity
departments, some efforts to support filling of these positions; ensure development
of capacity in national grand funding programmes to strengthen and grow these.
Identification of existing ‘pockets’ of experience and capacity relating to building
management and support and development of these (e.g. CEM courses; best practice
CCT building manager programme; Health officials to UCT Postgraduate Diploma in
Health Care Technology Management, module on Hospital Engineering Practice, etc).
Develop and set up a national EE in public buildings auto monitoring and reporting
station.
Facilitation Policy development (where not in place) targets and integration of performance
measures into the municipality’s KPI system (NB inter departmental participation in
this); project proposal approval
Technical assistance Explore establishment of Technical Assistance: could be an agency/unit (can be PPP,
not-for-profit/NGO, or private consulting firm often hired on a fee-for-service basis)
with strong technical expertise in EE technology, financing and contracting to support
audits, procurement, contracting, monitoring; could be in the form of TA grants to
local authorities and provinces for development and launch of EE projects;
Purchase and installation of hardware – AMR – for buildings in programme (but also
ensuring that the meter technology is appropriate to the situation, e.g. smart
metering reliant on effective cell phone network – this not present in many instances,
even in larger towns such as Polokwane);
Access to financing and funding (e.g. IDM, budgetary allocations - internal);
Prequalification of ESCOs and M&V professionals (building on Eskom IDM experience,
but not relying on Eskom to provide this for the whole country unless this agreed
upon)
Training / learning Input / presentations for bid committees/ supply chain management;
Building managers on AMR reading, monitoring, responding and reporting;
Energy officers on EE tech, procurement, contracting, M&V
Learning network for facilities managers, particularly those involved in developing
specs for new build and refurbishment (on energy efficiency regulations and new

12
Programme element Detail
technologies)
Maintenance staff on post retrofit savings maintenance
Energy professionals to attain CMVP certification; Building management to undertake
CEM training; Health engineering department or provincial public works officials to
undertake Hospital engineering practise (UCT post-graduate diploma module).
Model / template
documents
Contracts; baseline development; energy consumption asset registries (pursue sic
codes, grouping, benchmarking, etc) / data capture systems, schools/hospitals
project design
Guidelines Project proposal development: building selection; bundling, etc; business models;
economic benefits; MFMA – application financial legal framework (including budget
issues); Procurement; Benchmarking; Funding and financing options; MRV
Research and development Further work towards developing a national overview of public building energy
consumption in different spheres and geographic areas;
Develop benchmarking for building types;
Explore possibilities of EE ‘stream’ or portfolio in private/public financing institutions
Draw on innovation and experience in private sector and amongst parastatals.
Developing long-term framework: mitigation action targets, outcomes and indicator
development
Section 1 refers to key programme target areas. These include:
1. retrofit of all buildings over 10 000 square meters (tier 1; with over 2000 square meters – tier 2
as a secondary target);
2. 100% efficient lighting in smaller buildings;
3. possible hospital programme (no targets at this stage)
However, developing quantitative implementation targets is challenging given the current data situation.
For example, there is no information on the total number of public buildings over a particular size. The
European Commission has a proposal for a new EE Directive (currently under negotiation) that will
require public authorities to refurbish at least 3% of their building stock by floor area each year (EPEC, p
4). This kind of target is useful to focus efforts, but is not possible in South African given the lack of
registries of public buildings reflecting floor area, or any type of total baseline against which to set
targets. As the programme develops, benchmarking and baseline development should enable more
specific programmatic target setting to be put in place.
Programme outcomes can be measured through a range of the following possible indicators:

13
- KWh and emissions decrease: summing of savings (total) and savings per square meter and %
savings per intervention off individual building/facility project baselines;
- Total number of buildings (and size of buildings/square metres) retrofitted; total number of
lights, and other technologies installed; number of behaviour campaigns, etc;
- Visible EE building targets in policies and KPIs of senior managers;
- Visible budget allocations;
- EE positions created and inter-departmental structures in place;
- Capacity building activities (numbers on training courses, capacity building events held);
- Physical metering systems installed;
Research on MRV systems for climate mitigation is being undertaken on behalf of DEA by the Energy
Research Centre at UCT and this work should provide some direction as to how to capture data flows
from the programme. As noted above, these could ideally be automatically captured, though clearly this
may not work in all circumstances.
Institutional set-up, mandates, roles and responsibilities of key stakeholders
As noted in Part I of this document, there are multiple mandates and responsibilities relating to public
building EE that sit across different departments and spheres of government. Key roles are outlined
below, however, in terms of the programme elements outlined above, the major outstanding
institutional issues for discussion amongst stakeholders are:
a. Where the programme management is located (e.g. facilitation, guide development, partner
liaison) and how is this funded;
b. Where and how the technical assistance is developed and located (e.g. unit of technical experts,
technical assistance grants, and within what institution or agency etc)
c. MRV information flows (currently this area is under development; see also notes above).
If the programme is to successfully achieve vertical integration, it should not be designed as a
programme driven by national government, but an inclusive programme that recognises and
acknowledge local and regional government as spheres of government in their own right. The PM should
also be located in an institution that is experienced in implementation more than policy development. In
this sense, a national department or Inter-Departmental Task Team will not be the ideal holding place.
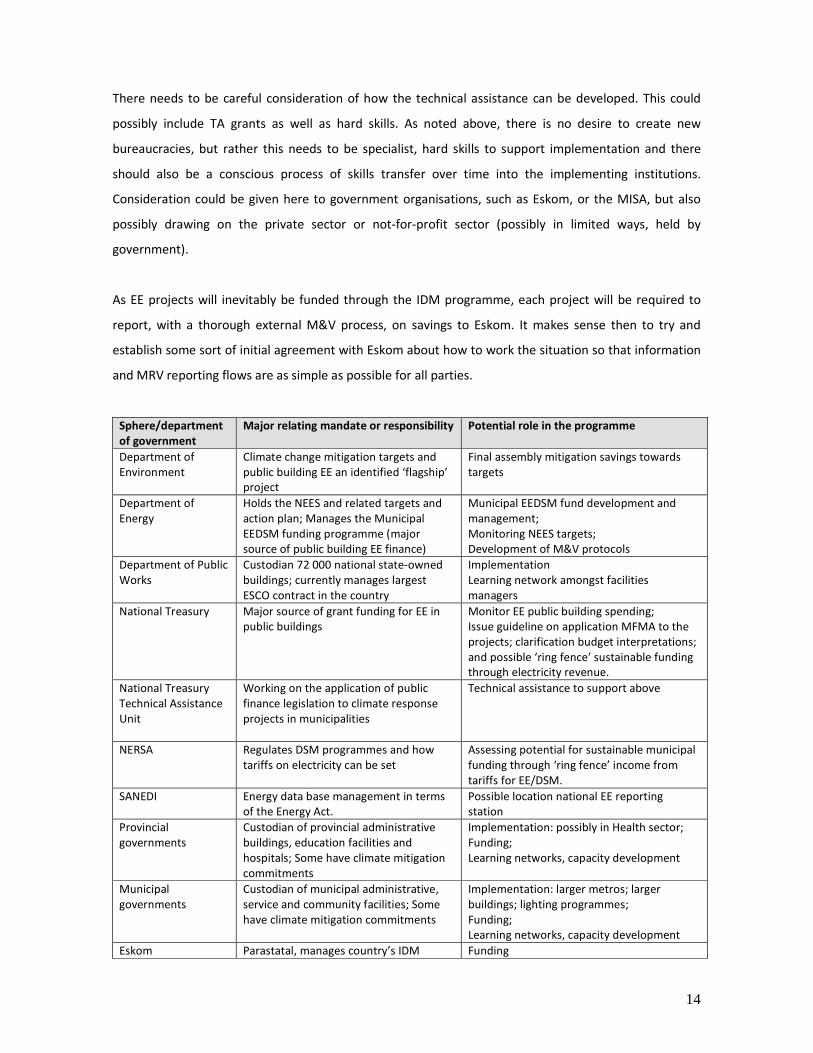
14
There needs to be careful consideration of how the technical assistance can be developed. This could
possibly include TA grants as well as hard skills. As noted above, there is no desire to create new
bureaucracies, but rather this needs to be specialist, hard skills to support implementation and there
should also be a conscious process of skills transfer over time into the implementing institutions.
Consideration could be given here to government organisations, such as Eskom, or the MISA, but also
possibly drawing on the private sector or not-for-profit sector (possibly in limited ways, held by
government).
As EE projects will inevitably be funded through the IDM programme, each project will be required to
report, with a thorough external M&V process, on savings to Eskom. It makes sense then to try and
establish some sort of initial agreement with Eskom about how to work the situation so that information
and MRV reporting flows are as simple as possible for all parties.
Sphere/department
of government
Major relating mandate or responsibility Potential role in the programme
Department of
Environment
Climate change mitigation targets and
public building EE an identified ‘flagship’
project
Final assembly mitigation savings towards
targets
Department of
Energy
Holds the NEES and related targets and
action plan; Manages the Municipal
EEDSM funding programme (major
source of public building EE finance)
Municipal EEDSM fund development and
management;
Monitoring NEES targets;
Development of M&V protocols
Department of Public
Works
Custodian 72 000 national state-owned
buildings; currently manages largest
ESCO contract in the country
Implementation
Learning network amongst facilities
managers
National Treasury Major source of grant funding for EE in
public buildings
Monitor EE public building spending;
Issue guideline on application MFMA to the
projects; clarification budget interpretations;
and possible ‘ring fence’ sustainable funding
through electricity revenue.
National Treasury
Technical Assistance
Unit
Working on the application of public
finance legislation to climate response
projects in municipalities
Technical assistance to support above
NERSA Regulates DSM programmes and how
tariffs on electricity can be set
Assessing potential for sustainable municipal
funding through ‘ring fence’ income from
tariffs for EE/DSM.
SANEDI Energy data base management in terms
of the Energy Act.
Possible location national EE reporting
station
Provincial
governments
Custodian of provincial administrative
buildings, education facilities and
hospitals; Some have climate mitigation
commitments
Implementation: possibly in Health sector;
Funding;
Learning networks, capacity development
Municipal
governments
Custodian of municipal administrative,
service and community facilities; Some
have climate mitigation commitments
Implementation: larger metros; larger
buildings; lighting programmes;
Funding;
Learning networks, capacity development
Eskom Parastatal, manages country’s IDM Funding
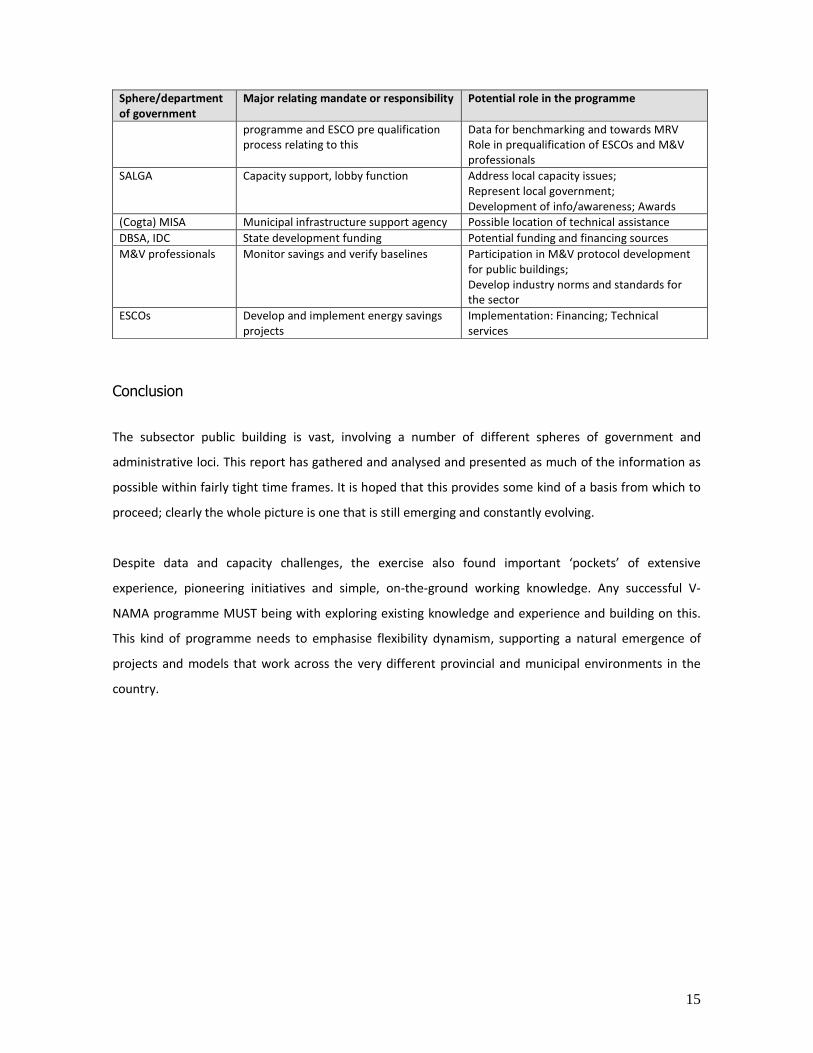
15
Sphere/department
of government
Major relating mandate or responsibility Potential role in the programme
programme and ESCO pre qualification
process relating to this
Data for benchmarking and towards MRV
Role in prequalification of ESCOs and M&V
professionals
SALGA Capacity support, lobby function Address local capacity issues;
Represent local government;
Development of info/awareness; Awards
(Cogta) MISA Municipal infrastructure support agency Possible location of technical assistance
DBSA, IDC State development funding Potential funding and financing sources
M&V professionals Monitor savings and verify baselines Participation in M&V protocol development
for public buildings;
Develop industry norms and standards for
the sector
ESCOs Develop and implement energy savings
projects
Implementation: Financing; Technical
services
Conclusion
The subsector public building is vast, involving a number of different spheres of government and
administrative loci. This report has gathered and analysed and presented as much of the information as
possible within fairly tight time frames. It is hoped that this provides some kind of a basis from which to
proceed; clearly the whole picture is one that is still emerging and constantly evolving.
Despite data and capacity challenges, the exercise also found important ‘pockets’ of extensive
experience, pioneering initiatives and simple, on-the-ground working knowledge. Any successful V-
NAMA programme MUST being with exploring existing knowledge and experience and building on this.
This kind of programme needs to emphasise flexibility dynamism, supporting a natural emergence of
projects and models that work across the very different provincial and municipal environments in the
country.

Preparatory work leading to a project proposal on V-NAMA in sub sector of energy efficiency in public buildings: Analysis report: Baseline, Energy savings potential and
Barriers.
Appendices
Appendix A: Evaluation of mitigation potential in top 3 provinces
Province Public building
energy
consumption
level/mitigation
potential
Availability of
data/Number of
provincial and local
buildings
Number of
Metros and big
towns/ urban
rural diversity
Political
commitment at
provincial and
municipal level
(“championship”)
Energy
offices/capacity/policy
Capacity and
financial support
needs
Alignment with
existing projects
Gauteng 40% national
public building
energy
consumption:
Mitigation
potential high
****
National: Regional
DPW will have some
data; Provincial data:
not really known.
Municipal:
COJ: detailed audits
done on major large
buildings; have
consumption/squ m
for 6 top buildings;
buildings = 9% ‘own’
consumption.
EMM: 234 total
facilities; have it by
building type.
3 metros;
handful of
smaller but
very industrial
municipalities,
small rural
component.
Provincial Energy
and CC policy
with targets;
Metros all have
energy and
climate policies
and commitment.
Province has an energy
office (still emerging,
not very strong);
Ekurhuleni – energy
directorate within
electricity shows strong
leadership and
implementation ability;
City of Joburg – capacity
but dispersed between
departments
(Environment, Planning,
Built environment/
Infrastructure, City
Power);
Tshwane- no strong
leadership at the
moment, some capacity
but dispersed between
departments; Emfuleni
has strong
Environmental
champion.
On one hand the
volume of mitigation
potential and
capacity is strong
positive indicator,
but also would
require coordination,
possible dispersing of
target focus.
Financially this
province benefits
from grant
programme; own EE
funding stream in
EMM.
Regional DPW
ESCO contracts
2000-2010;
EEDSM (DoRA) in
most
municipalities; In
addition EMM has
own EE
programme
running.
KZN 12 % national
public building
National: Regional
DPW will have some
1 metro, 2
larger towns,
Province has an
active RE/EE
eThekwini – strong
energy office, targets
Good capacity. Has
benefitted from
Regional DPW
ESCO contract

1
Province Public building
energy
consumption
level/mitigation
potential
Availability of
data/Number of
provincial and local
buildings
Number of
Metros and big
towns/ urban
rural diversity
Political
commitment at
provincial and
municipal level
(“championship”)
Energy
offices/capacity/policy
Capacity and
financial support
needs
Alignment with
existing projects
energy
consumption
(although higher
proportion of
country’s energy
total?):
Mitigation
potential
medium
**
data; Provincial data:
not really known.
Municipal: eThekwini
has fairly detailed
surveys/audits, with
limitations (confusing
data sets).
large rural
component.
knowledge
sharing group
(KSEF); eThekwini
has new internal
energy policy and
targets.
and policy in place. EEDSM grants (not
currently)
(current); EEDSM
initiatives in last
cycle.
Western
Cape
21% national
public building
energy
consumption:
Mitigation
potential
medium to high
***
National: Regional
DPW will have some
data; Provincial data:
Admin/office
complexes and
schools not really
known, but has
excellent health
facility data;
Municipal: CCT 96
admin buildings;
developing fairly
good data picture,
some audits on
major buildings and
installing AMR on
these.
1 metro, 2
larger towns,
mix of urban
and rural (rural
largely
commercial
agricultural).
Province has
policy and
commitment,
only province
with established
Health EE
capacity found;
CCT: Policy,
targets, some
data collection,
staff capacity
Cape Town- strong
energy office, targets
and policy in place.
Specific building
efficiency staff in place.
Have a building
managers capacity
development
programme in place.
Regional DPW
ESCO contract
(current);
EEDSM initiatives
in last cycle, have
internal capacity
and budget
allocations.
Notes: There was insufficient time to obtain asset registries for each and every city and larger town, but these were included where available. Usually it is fairly easy to
obtain a registry of total buildings, but difficult to assign these to building type categories. Detail on each municipality, where it has been collated, can be found in DATA
Summary documents (attached).

Preparatory work leading to a project proposal on V-NAMA in sub sector of energy efficiency in public buildings:
Analysis report: Baseline, Energy savings potential and Barriers.
Appendix B: Eskom baseline development method summary
Standardised monitoring and verification (M&V) guidelines are outlined in the “M&V Guidelines”
document available on the Eskom website19
. The M&V Guidelines is typically updated once a year. It is
based on international protocols, the International Performance Measurement and Verification Protocol
(IPMVP)20
and the M&V Guidelines for Federal Energy Management Projects, and also refers to the SABS:
SANS 50010 standard measurement and verification of energy savings.
The M&V process must be designed to provide an impartial quantification and assessment of project
impacts and savings. An independent M&V Team needs to be included in the process to determine and
verify the savings. All stakeholders must agree on the method of calculating the efficiency and demand-
side impacts. M&V typically has the following basic stages:
1. Perform an M&V scoping study and compile a scoping report
2. Development M&V Plan
3. Secure buy-in for M&V Plan
4. Pre-Implementation monitoring/metering (in order to obtain the baseline)
5. Develop the M&V baseline and obtain buy-in
6. Post-implementation verification
7. Post-implementation monitoring/metering
8. Service level adjustment of baseline and calculation of savings
9. Produce and submit M&V performance assessment reports, and performance tracking reports
10. Continue compiling tracking reports for duration of project
Focus in this section: Step 5.
A baseline energy audit is conducted to determine the type, quantity and rating of all relevant energy
using systems, in order to assess potential savings. The audit usually consists of a preliminary walk-
through audit followed by a detailed audit. Assumptions are also stated regarding system information
that is not available.
19
M&V Guidelines available at www.eskom.co.za/c/article/340/mv-documents 20
More details on the IPMVP can be found at www.evo-world.org. The document can be downloaded here:
www.eskom.co.za/c/article/340/mv-documents.

1
Pre-implementation measurements need to commence once acceptance has been obtained for the M&V
plan from the ESCO and the client. Note that all metering equipment needs to be calibrated at least once
per year and the calibration certificate needs to be kept by the M&V Team for later reference if needed.
Metering equipment can be installed by the ESCO on the project site, but it is important that the M&V
Team is actively involved in this process if the data is to be used for M&V baseline development. Portable
metering equipment installed by the ESCO without M&V Team involvement or verification is not
acceptable for baseline development purposes.
Measurements need to be taken for an acceptable period prior to implementation (preferably 3 months,
but may vary for certain projects) to allow for sufficient data and project buy-in for the M&V baseline. If
seasonal variance or impacts are expected for the project, 12-month data need to be used for baseline
development. If possible, the M&V Team should attempt to obtain data for a period of the most recent
months just prior to project implementation. Care should be taken in instances where data is available
for long periods of time. Data older than 12 months can include operational practices and electricity use
patterns that are no longer valid; resulting in baselines not representing the actual case just prior to the
intervention(s). Statistical sampling techniques can be used to reduce the number of measurements
without compromising data accuracy. Information on acceptable statistical sampling techniques can be
obtained from Eskom’s Assurance and Forensic Department.
Data suitable for baseline development include electricity use and operational data from historian
systems, Supervisory control and data acquisition (SCADA) systems and metering equipment
(permanent, temporary or portable).
Baselines are critical to the process and care need to be taken during their development. It is not
sufficient just to look at what happened the previous year and use it as a baseline. It could happen that
energy costs increase after implementation, and a baseline should be able to pick this up. Baseline
should also accurately reflect other changes, such as increased electricity use due to either increased
production for industrial sites or increased occupancy in commercial buildings, for instance.
Measurement scope:
• Option A: Partially Measured Retrofit Isolation: Isolates electricity use of equipment affected by
a project from electricity use of rest of facility. Only partial measurement is used under Option A,
with some parameter(s) being stipulated rather than measured.

2
• Option B: Retrofit Isolation: Same as Option A, but no stipulations are allowed, i.e. full
measurement is required.
• Option C: Whole Building: use of utility meters or whole building sub-metres to assess the
energy performance of a total building. Determines the collective savings of all efficiency
measures.
• Option D: Calibrated Simulation: Use of computer simulation software to predict facility energy
use. Must be calibrated.
The level of detail of the M&V efforts should be in proportion to the size of the savings. Thus, projects
with small expected savings would be measured and verified by a simple M&V process (typically Option
A).
The baseline report should include the following:
• Project information, objectives, site description, stakeholder contact details
• Variables used to characterise the baseline
• Description of the pre-implementation metering data used, as well as information on the
metering period and interval
• Data used to develop the baseline
• Characterisation procedures
• Assumptions used during baseline characterisation
• Baseline SLA (Service Level Adjustment) procedures. SLAs are necessary to bring the baseline and
post-implementation periods under the same set of operational conditions if any of the pre-
implementation conditions were to change
• Baseline adjustment procedures. These adjustments are done when equipment and/or scope
changes occur during the project. They are done on an ad hoc basis and not periodically as in the
case of SLAs.
• Actual demand baseline profile(s) and energy consumption values that will be used in the
determination of the project’s savings
Examples of standardised M&V baseline reports are available upon request for various project types
from Eskom’s Assurance and Forensic Department.

3
Appendix C: SIC Codes
Data source: Companies and Intellectual Property Commission website (www.cipc.co.za)
Standard Industrial Classification Codes (SIC Codes) are an internationally accepted set of codes for the
standard classification of all economic activities. These codes are prescribed by the Department of
International Economic and Social Affairs of the United Nations.
See http://www.cipc.co.za/Publications_files/Sic_Codes.pdf for an extract from the preface of the fifth
edition of the Standard Industrial Classification of all Economic Activities, as published by Statistics South
Africa.
The SIC was designed for the classification of establishments according to the kind of economic activity,
and provides a standardised framework for the collection, tabulation, analysis and presentation of
statistical data on establishments.
The SIC code consists of a 5 digit number with each digit of the code having the following significance:
• First Digit = Major Division
• Second Digit = Division
• Third Digit = Major Group
• Fourth Digit = Group
• Fifth Digit = Sub-Group
If, as an example, we look at the SIC code 33711, we will be able to extract the following meaning:
3 The first digit or Major Division = Manufacturing
3 The second digit or Division = Manufacture of coke, refined petroleum products and
nuclear fuel; manufacture of chemicals and chemical products; manufacture of rubber and
plastic products
7 The third digit or Major Group = Manufacture of rubber products
1 The fourth digit or Group = Manufacture of rubber tyres and tubes; retreading and
rebuilding of rubber tyres
1 The fifth digit or Sub-Group = Manufacture of tyres and tubes

4
A summary of SIC codes 0 through to 8 is shown below, with more detail shown for SIC Code 9
Community, Social and Personal Services.
0 PRIVATE HOUSEHOLDS, EXTERRITORIAL ORGANISATIONS, REPRESENTATIVES OF FOREIGN
GOVERNMENTS AND OTHER ACTIVITIES NOT ADEQUATELY DEFINED
1 AGRICULTURE, HUNTING AND RELATED SERVICES
2 MINING AND QUARRYING
3 MANUFACTURING
4 ELECTRICITY, GAS AND WATER SUPPLY
5 CONSTRUCTION
6 WHOLESALE AND RETAIL TRADE; REPAIR OF MOTOR VEHICLES, MOTOR CYCLES AND PERSONAL AND
HOUSEHOLD GOODS; HOTELS AND RESTAURANTS
7 TRANSPORT, STORAGE AND COMMUNICATION
8 FINANCIAL INTERMEDIATION INSURANCE, REAL ESTATE AND BUSINESS SERVICES
9 COMMUNITY, SOCIAL AND PERSONAL SERVICES
91 PUBLIC ADMINISTRATION AND DEFENCE ACTIVITIES
910 PUBLIC ADMINISTRATION AND DEFENCE ACTIVITIES
911 CENTRAL GOVERNMENT ACTIVITIES, GOVERNMENT DEPARTMENTS, SELF-GOVERNING TERRITORIES
AND THEIR LOWER AUTHORITIES, OTHER CENTRAL GOVERNMENT
9110 Central Government Activities
91101 Government Departments
91102 Provincial Administrations
91103 Self-governing Territories And Their Lower Authorities
91109 Other Central Government Activities
912 REGIONAL SERVICES COUNCIL ACTIVITIES
9120 Regional Services Council Activities
91200 Regional Services Council Activities
913 LOCAL AUTHORITY ACTIVITIES
9130 Local Authority Activities
91300 Local Authority Activities
914 PROVINCIAL ADMINISTRATIONS
915 SA NATIONAL DEFENCE FORCE
916 SA POLICE SERVICE
917 CORRECTIONAL SERVICES
92 EDUCATION
920 EDUCATIONAL SERVICES
9200 Educational Services
92001 PRE-PRIMARY EDUCATION AND ACTIVITIES OF AFTER-SCHOOL CENTRES
92002 PRIMARY AND SECONDARY EDUCATION
92003 SPECIAL EDUCATION AND TRAINING OF MENTALLY RETARDED CHILDREN
92004 EDUCATION BY TECHNICAL COLLEGES AND TECHNICAL INSTITUTIONS
92005 EDUCATION BY TECHNIKONS
92006 EDUCATION BY TEACHERSÆ TRAINING COLLEGES AND COLLEGES OF EDUCATION FOR FURTHER
TRAINING
92007 EDUCATION BY UNIVERSITIES
92008 EDUCATION BY CORRESPONDENCE AND PRIVATE VOCATIONAL COLLEGES
92009 OTHER EDUCATIONAL SERVICES - OWN ACCOUNT TEACHERS, MOTOR VEHICLE DRIVING
SCHOOLS/TUTORS AND MUSIC, DANCING AND OTHER ART SCHOOLS, ETC.
93 HEALTH AND SOCIAL WORK
931 HUMAN HEALTH ACTIVITIES

5
9311 HOSPITAL ACTIVITIES
93111 GENERAL HOSPITALS
93112 MATERNITY HOMES
93113 TUBERCULOSIS HOSPITALS
93114 PSYCHIATRIC HOSPITALS
93115 DETACHED OPERATION THEATRES
93119 OTHER HOSPITALS, N.E.C.
9312 MEDICAL AND DENTAL PRACTICE ACTIVITIES
93121 MEDICAL PRACTITIONER AND SPECIALIST ACTIVITIES
93122 DENTIST AND SPECIALIST DENTIST ACTIVITIES
9319 OTHER HUMAN HEALTH ACTIVITIES
93191 SUPPLEMENTARY HEALTH SERVICES OR PARAMEDICAL STAFF (PRACTITIONERS)
93192 CLINICS AND RELATED HEALTH CARE SERVICES
93193 NURSING SERVICES
93194 CHIROPRACTORS AND OTHER ASSOCIATED HEALTH CARE SERVICES
93199 OTHER HEALTH SERVICES
932 VETERINARY ACTIVITIES
9320 VETERINARY ACTIVITIES
93200 VETERINARY ACTIVITIES
933 SOCIAL WORK ACTIVITIES
9330 SOCIAL WORK ACTIVITIES
93300 SOCIAL WORK ACTIVITIES
94 OTHER COMMUNITY, SOCIAL AND PERSONAL SERVICES ACTIVITIES
940 SEWAGE AND REFUSE DISPOSAL, SANITATION AND SIMILAR ACTIVITIES
9400 SEWAGE AND REFUSE DISPOSAL, SANITATION AND SIMILAR ACTIVITIES
94000 SEWAGE AND REFUSE DISPOSAL, SANITATION AND SIMILAR ACTIVITIES
95 ACTIVITIES OF MEMBERSHIP ORGANISATIONS N.E.C.
951 ACTIVITIES OF BUSINESS, EMPLOYERS AND PROFESSIONAL ORGANISATIONS
9511 ACTIVITIES OF BUSINESS AND EMPLOYERSÆ ORGANISATIONS
95110 ACTIVITIES OF BUSINESS AND EMPLOYERSÆ ORGANISATIONS
9512 ACTIVITIES OF PROFESSIONAL ORGANISATIONS
95120 ACTIVITIES OF PROFESSIONAL ORGANISATIONS
952 ACTIVITIES OF TRADE UNIONS
9520 ACTIVITIES OF TRADE UNIONS
95200 ACTIVITIES OF TRADE UNIONS
959 ACTIVITIES OF OTHER MEMBERSHIP ORGANISATIONS
9591 ACTIVITIES OF RELIGIOUS ORGANISATIONS
95910 ACTIVITIES OF RELIGIOUS ORGANISATIONS
9592 ACTIVITIES OF POLITICAL ORGANISATIONS
95920 ACTIVITIES OF POLITICAL ORGANISATIONS
9599 ACTIVITIES OF OTHER MEMBERSHIP ORGANISATIONS N.E.C.
95990 ACTIVITIES OF OTHER MEMBERSHIP ORGANISATIONS N.E.C.
96 RECREATIONAL, CULTURAL AND SPORTING ACTIVITIES
961 MOTION PICTURE, RADIO, TELEVISION AND OTHER ENTERTAINMENT ACTIVITIES
9611 MOTION PICTURE AND VIDEO PRODUCTION AND DISTRIBUTION
96111 MOTION PICTURE AND VIDEO PRODUCTION AND DISTRIBUTION
96112 RELATED ACTIVITIES - FILM AND TAPE RENTING TO OTHER INDUSTRIES, BOOKING, DELIVERY AND
STORAGE
9612 MOTION PICTURE PROJECTION
96121 MOTION PICTURE PROJECTION BY CINEMAS
96122 MOTION PICTURE PROJECTION BY DRIVE-IN CINEMAS

6
9613 RADIO AND TELEVISION ACTIVITIES
96130 RADIO AND TELEVISION ACTIVITIES
9614 DRAMATIC ARTS, MUSIC AND OTHER ARTS ACTIVITIES
96140 DRAMATIC ARTS, MUSIC AND OTHER ARTS ACTIVITIES
9619 OTHER ENTERTAINMENT ACTIVITIES N.E.C.
96190 OTHER ENTERTAINMENT ACTIVITIES N.E.C.
962 NEWS AGENCY ACTIVITIES
9620 NEWS AGENCY ACTIVITIES
96200 NEWS AGENCY ACTIVITIES
963 LIBRARY, ARCHIVES, MUSEUMS AND OTHER CULTURAL ACTIVITIES
9631 LIBRARY AND ARCHIVES ACTIVITIES
96310 LIBRARY AND ARCHIVES ACTIVITIES
9632 MUSEUM ACTIVITIES AND PRESERVATION OF HISTORICAL SITES AND BUILDINGS
96320 MUSEUM ACTIVITIES AND PRESERVATION OF HISTORICAL SITES AND BUILDINGS
9633 BOTANICAL AND ZOOLOGICAL GARDENS AND NATURE RESERVE ACTIVITIES
96330 BOTANICAL AND ZOOLOGICAL GARDENS AND NATURE RESERVE ACTIVITIES
964 SPORTING AND OTHER RECREATIONAL ACTIVITIES
9641 SPORTING ACTIVITIES
96410 SPORTING ACTIVITIES
9649 OTHER RECREATIONAL ACTIVITIES
96490 OTHER RECREATIONAL ACTIVITIES
99 OTHER SERVICE ACTIVITIES
990 OTHER SERVICE ACTIVITIES
9901 WASHING AND (DRY-) CLEANING OF TEXTILES AND FUR PRODUCTS
99010 WASHING AND (DRY-) CLEANING OF TEXTILES AND FUR PRODUCTS
9902 HAIRDRESSING AND OTHER BEAUTY TREATMENT
99021 MEN'S HAIRDRESSING
99022 LADIES' HAIRDRESSING
99023 MEN'S AND LADIES' HAIRDRESSING
Related Documents