Unlocking the Retirement Savings Potential of the HSA Securities offered through Cetera Advisor Networks LLC, Member SIPC | 2010 Main Street, Suite 1220, Irvine, California 92614 SageView Advisory Group , and Cetera Advisor Networks are not affiliated companies Lisa M. Garcia, AIF, QPFC Retirement Plan Consultant, SageView Advisory Group [email protected] Presented by:

Welcome message from author
This document is posted to help you gain knowledge. Please leave a comment to let me know what you think about it! Share it to your friends and learn new things together.
Transcript
Unlocking the Retirement Savings Potential of the HSA
Securities offered through Cetera Advisor Networks LLC, Member SIPC | 2010 Main Street, Suite 1220, Irvine, California 92614 SageView Advisory Group , and Cetera Advisor Networks are not affiliated companies
Lisa M. Garcia, AIF, QPFCRetirement Plan Consultant, SageView Advisory [email protected]
Presented by:

Lisa M. Garcia, AIF, QPFC
* Listing in these publication does not guarantee success
Lisa Garcia has over 15 Years retirement services experience. She currentlyserves as a Retirement Plan Consultant in SageView’s Florida office andworks with plan sponsors of defined benefit, defined contribution deferredcompensation and non-qualified plans advising them on program design,investment strategy, participant engagement and helping them manage theirfiduciary responsibility.
Lisa is an active member of the retirement services industry. She has servedas a delegate of the American Retirement Association representing Americansavers in Washington with multiple presentations to Congress aimed atimproving the retirement system in the U.S.
Career Highlights:
Named one of the Top 50 Under 40 retirement plan consultants in the country by the NationalAssociation of Plan Advisors (NAPA)
Top Women Advisors 2016 - 2018
Retirement Plan Top Consulting Team of the Year 2018
2

What we’ll cover today
1. A brief history of retirement plans
2. Trends impacting plans today
3. Savings Potential of the HSA – Convergence of Health & Wealth
4. Conclusions
3

A brief history of retirement plans and savings trends today

Defined Contribution/457 Plans Overview
» Defined contribution plans were created in 1980
» Target Date Funds introduced in 1994 by Wells Fargo & Barclays
» Automatic enrollment became a Safe Harbor in 2006 under the Pension Protection Act
» According to the latest PLANSPONSOR Survey, about 60% of plans utilize automatic enrollment
» To date, Americans have amassed over $16 Trillion dollars in 401(k)’s and IRA’s
Source: Wikipedia, ICI Survey cited on slide 9 5
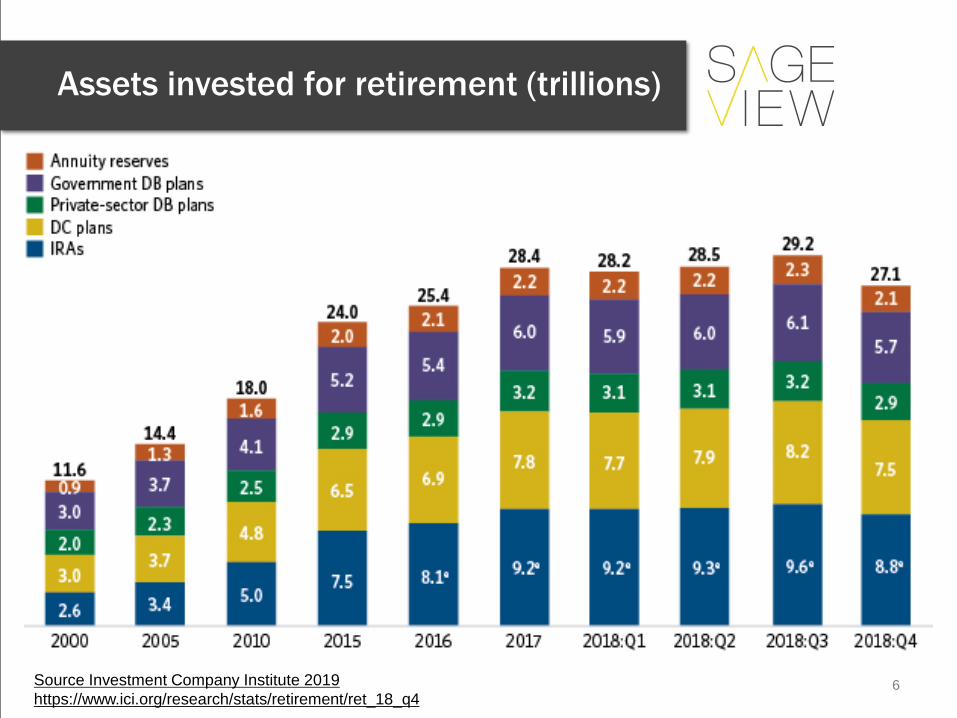
Assets invested for retirement (trillions)
Source Investment Company Institute 2019 https://www.ici.org/research/stats/retirement/ret_18_q4
6

Savings today
» The average retirement savings of American workers is $95,600 (Fidelity Investments).
» Averages broken down by age:
https://www.bankrate.com/retirement/average-401k-balance-by-age/
Ages 30-39: $38,400Ages 40-49: $93,400Ages 50-59: $160,000Ages 60-69: $182,100Ages 70+: $171,400
7
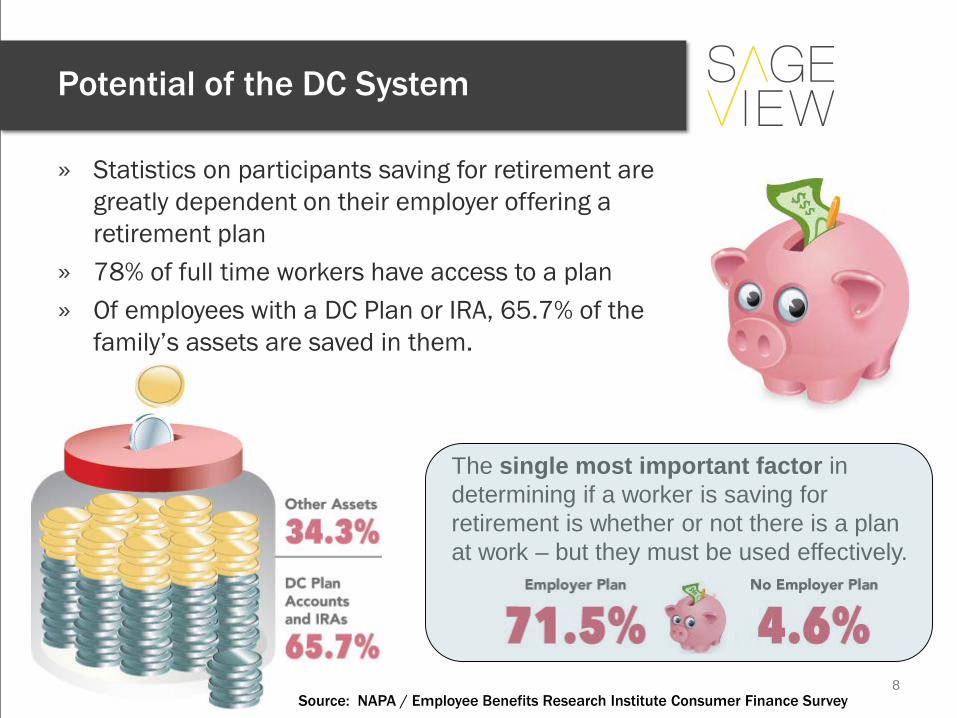
Potential of the DC System
» Statistics on participants saving for retirement are greatly dependent on their employer offering a retirement plan
» 78% of full time workers have access to a plan » Of employees with a DC Plan or IRA, 65.7% of the
family’s assets are saved in them.
The single most important factor in determining if a worker is saving for retirement is whether or not there is a plan at work – but they must be used effectively.
Source: NAPA / Employee Benefits Research Institute Consumer Finance Survey8
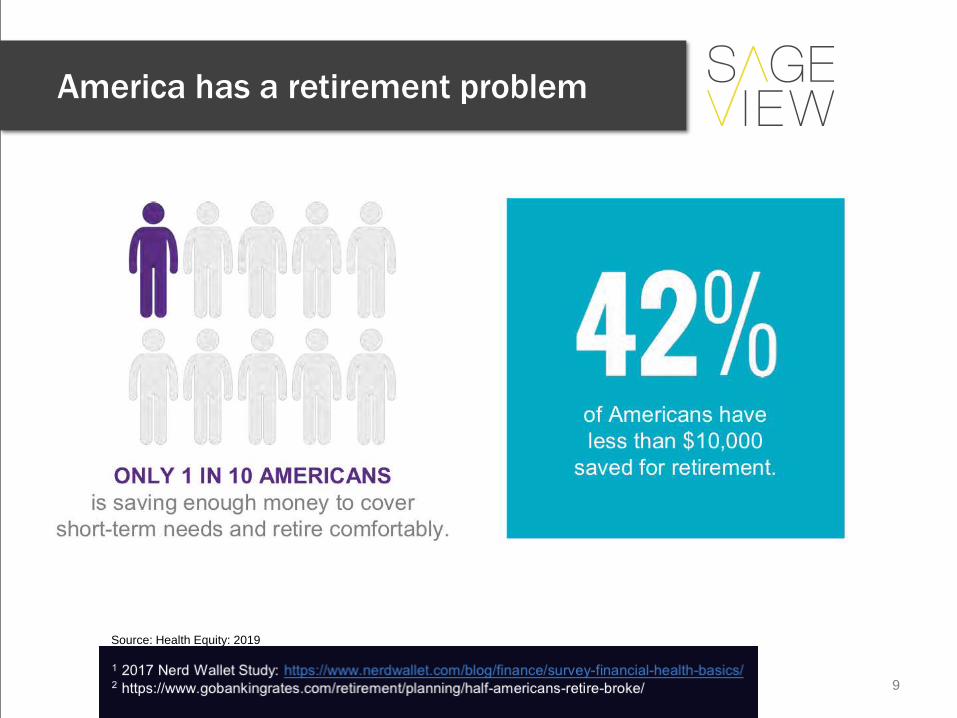
America has a retirement problem
Source: Health Equity: 2019
9

10
Positive Trends

Trends impacting plans today
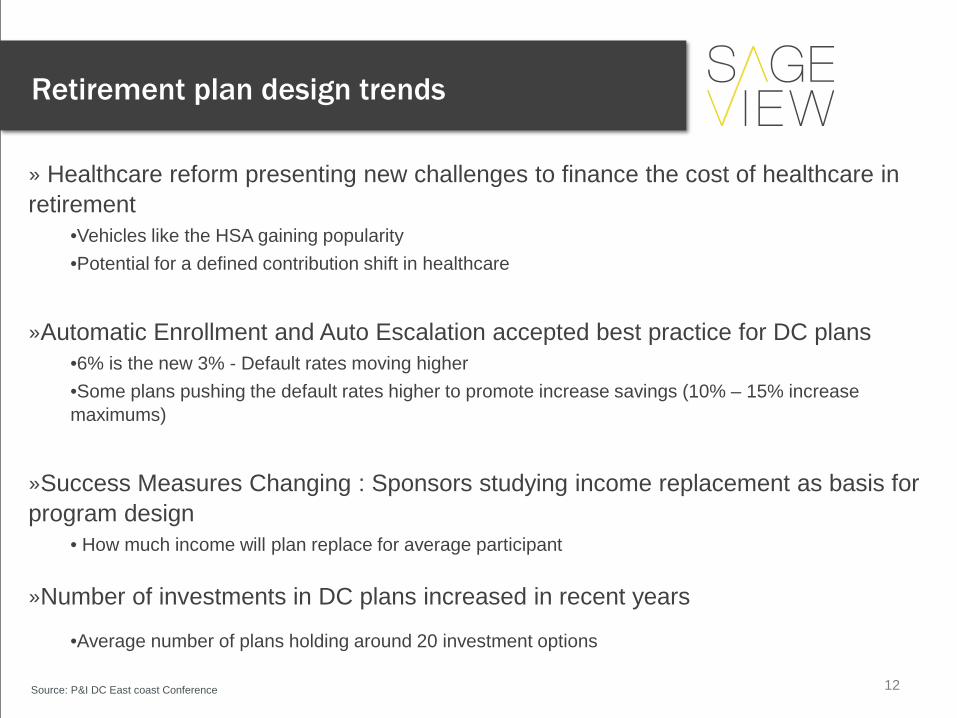
Retirement plan design trends
» Healthcare reform presenting new challenges to finance the cost of healthcare in retirement
•Vehicles like the HSA gaining popularity•Potential for a defined contribution shift in healthcare
»Automatic Enrollment and Auto Escalation accepted best practice for DC plans•6% is the new 3% - Default rates moving higher •Some plans pushing the default rates higher to promote increase savings (10% – 15% increase maximums)
»Success Measures Changing : Sponsors studying income replacement as basis for program design
• How much income will plan replace for average participant
»Number of investments in DC plans increased in recent years
•Average number of plans holding around 20 investment options
Source: P&I DC East coast Conference 12
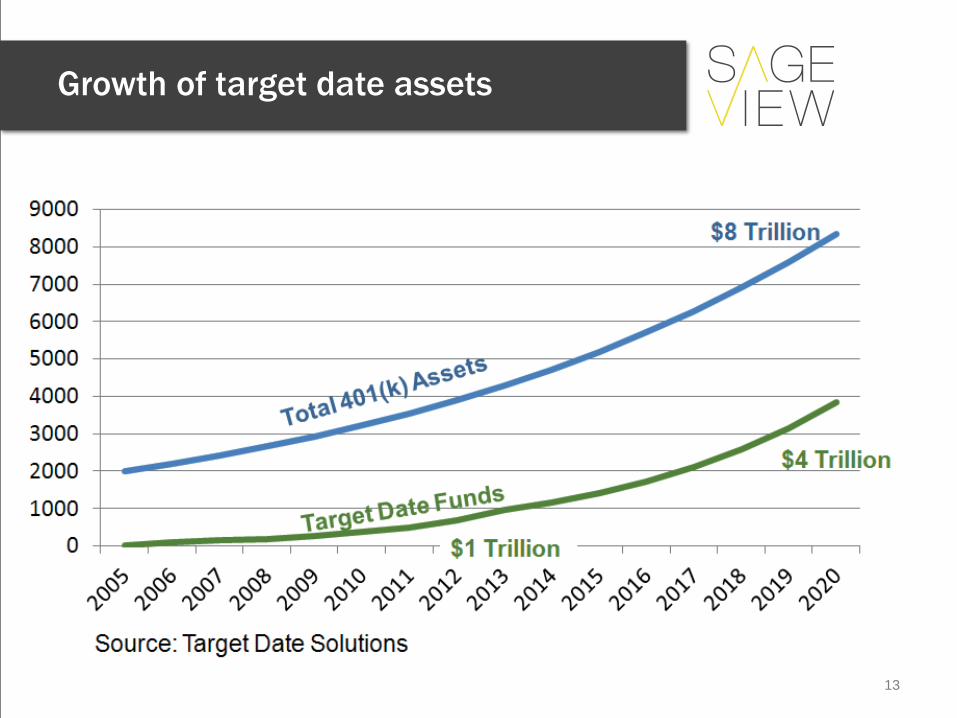
Growth of target date assets
13

Increased longevity
» On average, people are living longer. In many cases, retirement plan distributions will need to supplement 30+ years in retirement
14
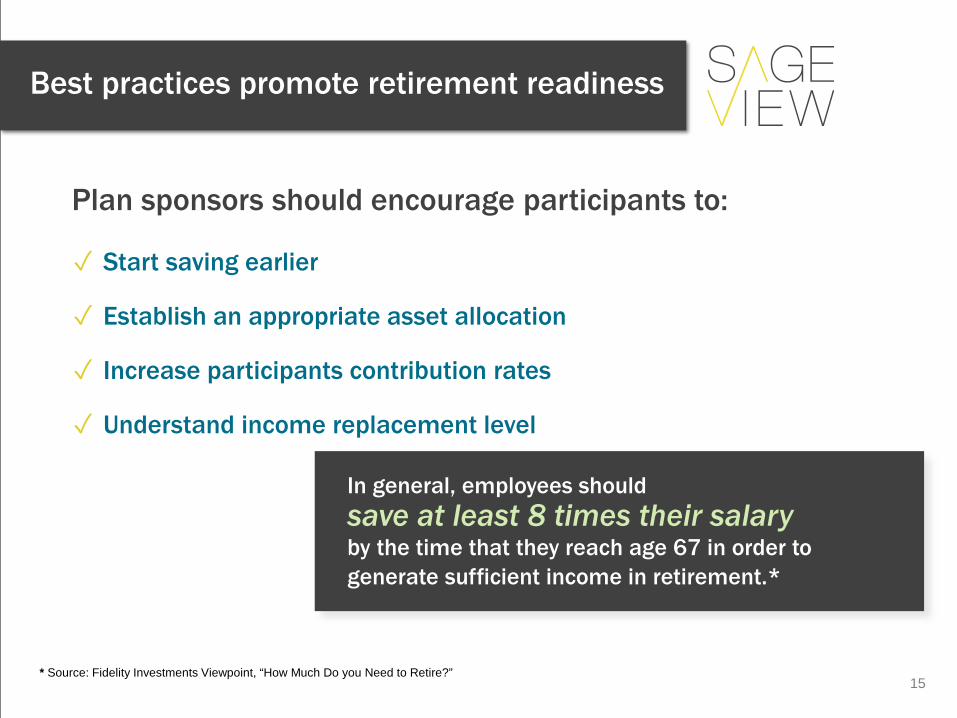
Best practices promote retirement readiness
In general, employees should save at least 8 times their salaryby the time that they reach age 67 in order to generate sufficient income in retirement.*
Plan sponsors should encourage participants to:
✓ Start saving earlier
✓ Establish an appropriate asset allocation
✓ Increase participants contribution rates
✓ Understand income replacement level
PLAN DESIGN: PARTNER WITH PARTICIPANTS
* Source: Fidelity Investments Viewpoint, “How Much Do you Need to Retire?”15

The savings potential of the HSA –Convergence of Health & Wealth

America has a healthcare problem
Source: Health Equity: 2019
17

Savings in HSA’s
https://www.pionline.com/article/20190228/ONLINE/190229832/investment-assets-in-hsa-accounts-jump-23-in-2018
» Overall assets in HSA’s topped $53 Billon for 2018
» At the end of 2018, assets invested in mutual funds HSA accounts totaled $10.2 Billion (19% of overall saved amount)
» Assets invested in HSA’s increased by 23% in 2018
» Invested assets projected to grow to $16.7 Billion by 2020
18
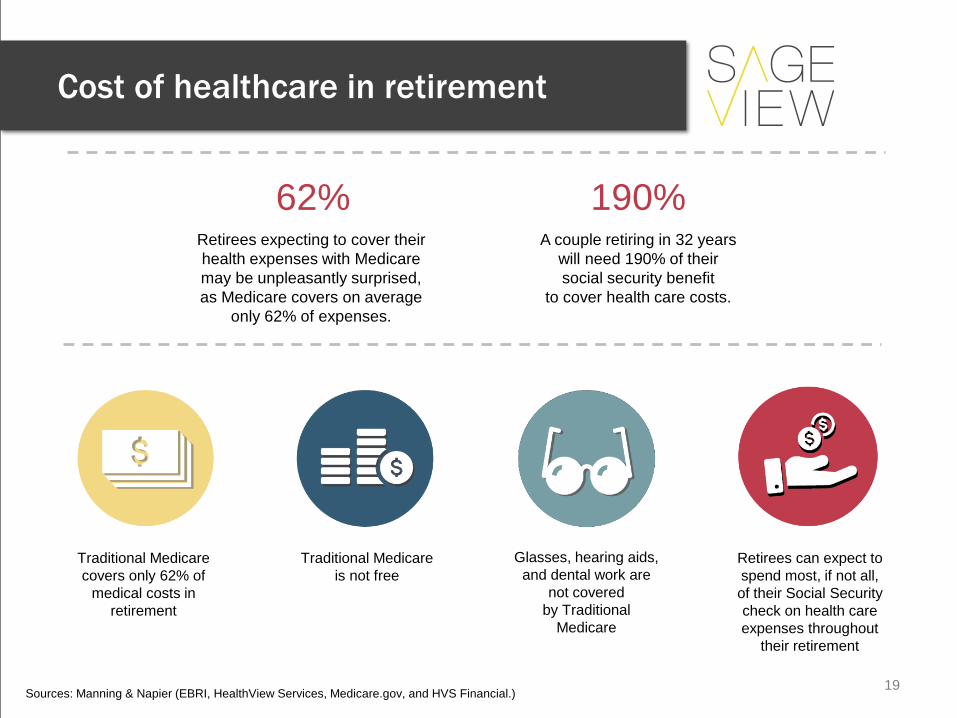
62%Retirees expecting to cover their health expenses with Medicare may be unpleasantly surprised, as Medicare covers on average
only 62% of expenses.
190%A couple retiring in 32 years
will need 190% of their social security benefit
to cover health care costs.
Traditional Medicare covers only 62% of
medical costs in retirement
Traditional Medicare is not free
Glasses, hearing aids, and dental work are
not covered by Traditional
Medicare
Retirees can expect to spend most, if not all, of their Social Security check on health care expenses throughout
their retirement
Sources: Manning & Napier (EBRI, HealthView Services, Medicare.gov, and HVS Financial.)
Cost of healthcare in retirement
19
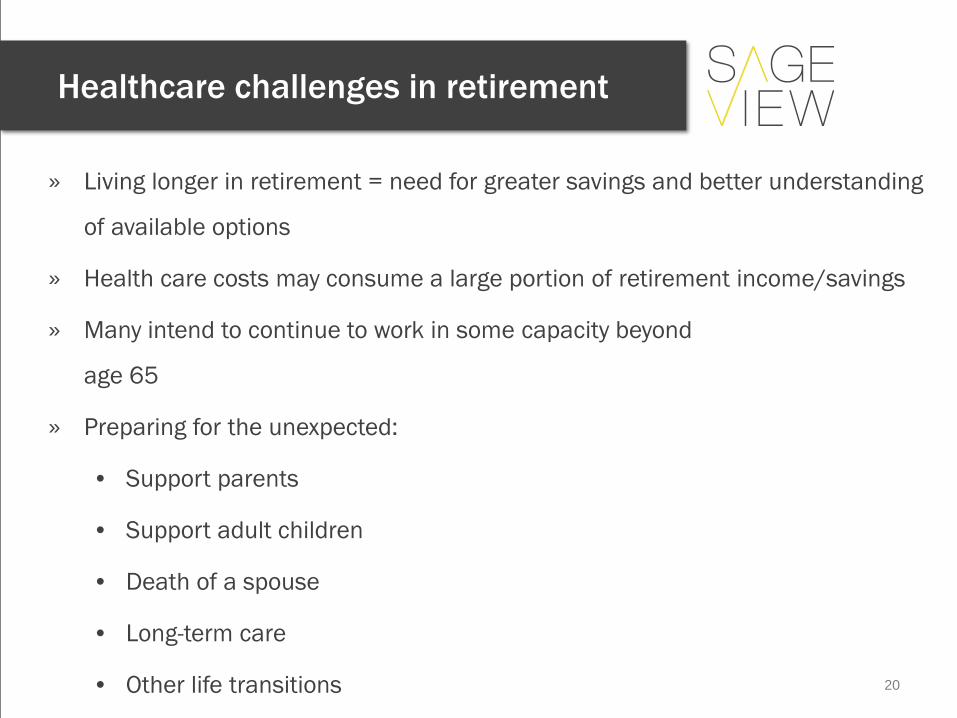
» Living longer in retirement = need for greater savings and better understanding
of available options
» Health care costs may consume a large portion of retirement income/savings
» Many intend to continue to work in some capacity beyond
age 65
» Preparing for the unexpected:
• Support parents
• Support adult children
• Death of a spouse
• Long-term care
• Other life transitions
Healthcare challenges in retirement
20
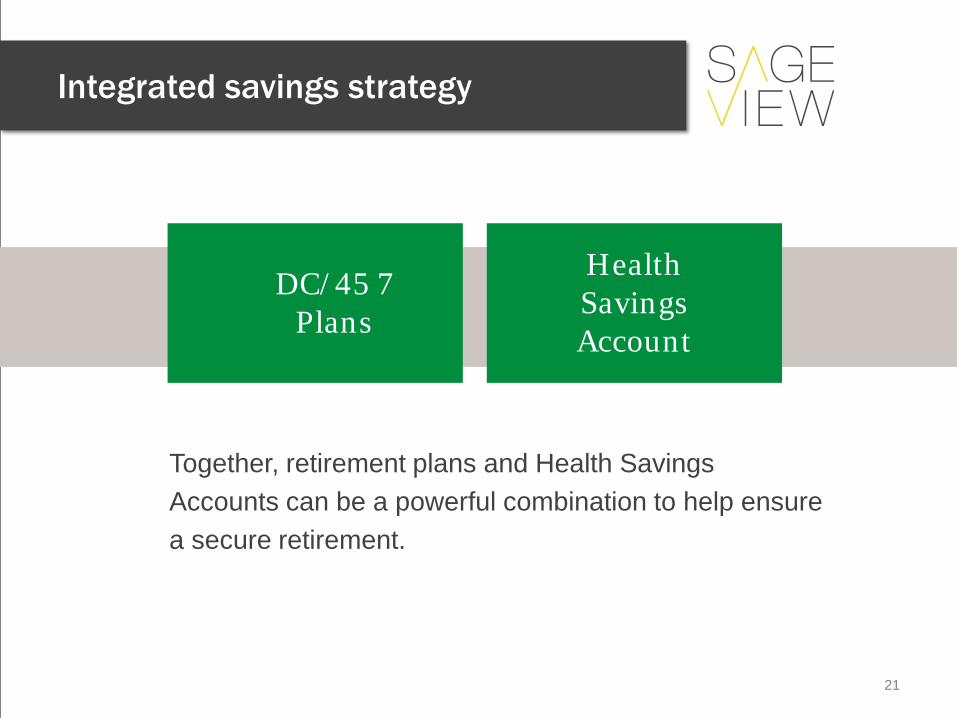
Together, retirement plans and Health Savings Accounts can be a powerful combination to help ensure a secure retirement.
DC/45 7 Plans
Health Savings Account
Integrated savings strategy
21
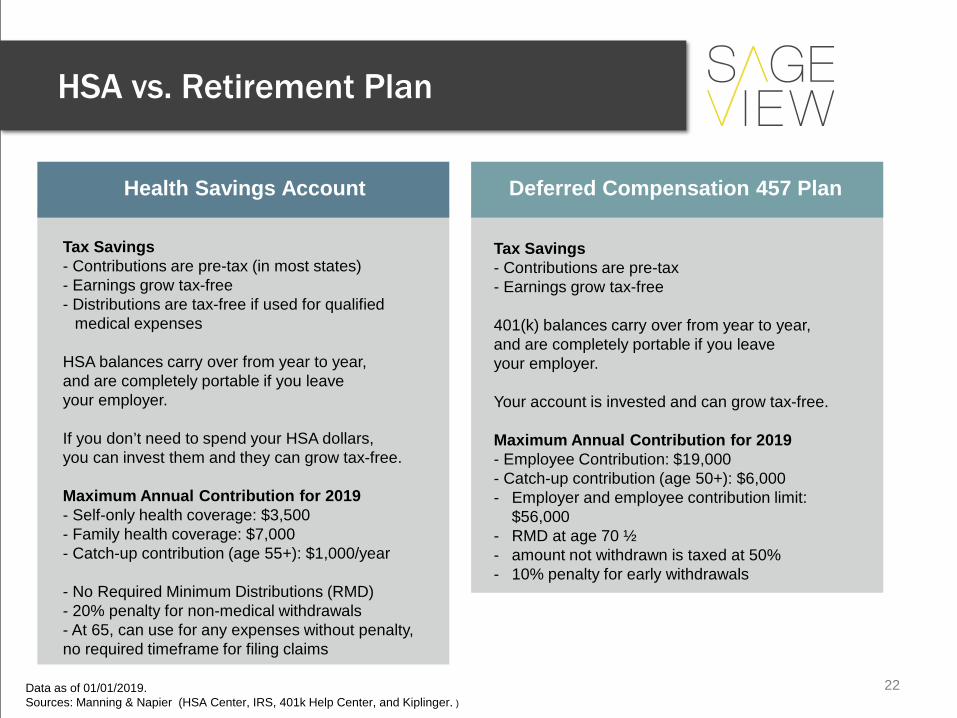
Health Savings Account Deferred Compensation 457 Plan
Tax Savings- Contributions are pre-tax (in most states)- Earnings grow tax-free- Distributions are tax-free if used for qualified
medical expenses
HSA balances carry over from year to year, and are completely portable if you leave your employer.
If you don’t need to spend your HSA dollars, you can invest them and they can grow tax-free.
Maximum Annual Contribution for 2019- Self-only health coverage: $3,500- Family health coverage: $7,000- Catch-up contribution (age 55+): $1,000/year
- No Required Minimum Distributions (RMD) - 20% penalty for non-medical withdrawals - At 65, can use for any expenses without penalty, no required timeframe for filing claims
Tax Savings- Contributions are pre-tax- Earnings grow tax-free
401(k) balances carry over from year to year, and are completely portable if you leave your employer.
Your account is invested and can grow tax-free.
Maximum Annual Contribution for 2019- Employee Contribution: $19,000- Catch-up contribution (age 50+): $6,000- Employer and employee contribution limit:
$56,000- RMD at age 70 ½ - amount not withdrawn is taxed at 50%- 10% penalty for early withdrawals
Data as of 01/01/2019. Sources: Manning & Napier (HSA Center, IRS, 401k Help Center, and Kiplinger. )
HSA vs. Retirement Plan
22

Tax-preferred savings account for qualified medical expenses
1Pre-Tax
Contributions
2Tax-freeEarnings
3Tax-free
Distributions for Qualified Medical Expenses
A Triple Tax Benefit
Can be used for current and future health care expenses – even in retirement
HSA’s are an excellent savings vehicle
KEY POINT: Employer Contributions in to HSA’s are not subject to Medicare, Social Security and FUTA (estimated savings of 8.25% on employer contributions)
23
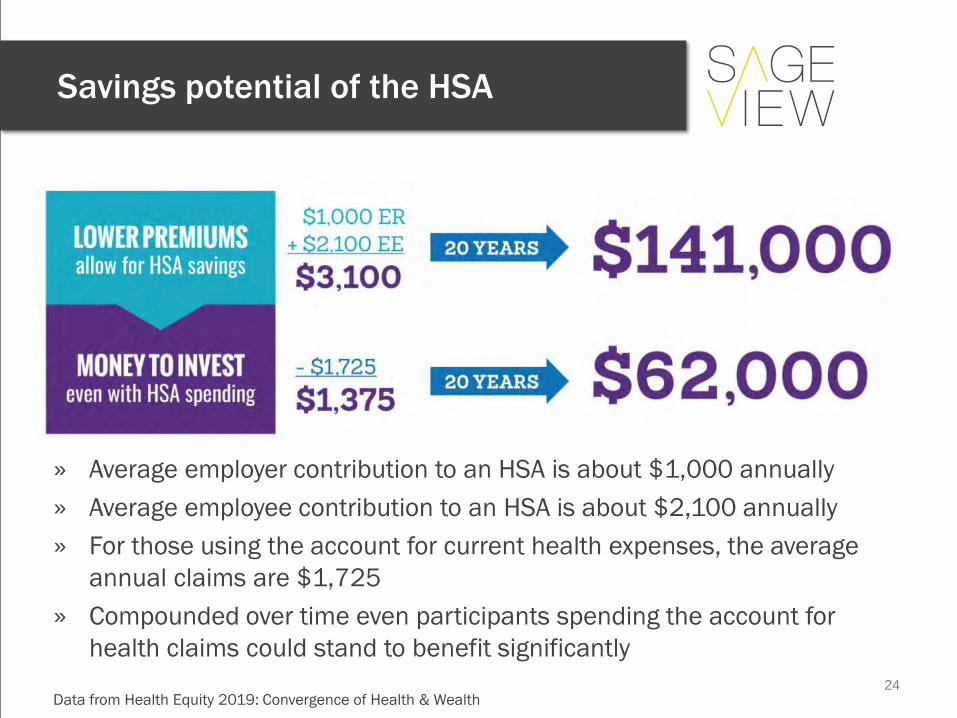
Savings potential of the HSA
» Average employer contribution to an HSA is about $1,000 annually » Average employee contribution to an HSA is about $2,100 annually » For those using the account for current health expenses, the average
annual claims are $1,725» Compounded over time even participants spending the account for
health claims could stand to benefit significantly
Data from Health Equity 2019: Convergence of Health & Wealth 24

$1,200,000
$1,000,000
$800,000
$600,000
$400,000
$200,000
$010 Years 20 Years 30 Years 40 Years
Potential Savings in a Health Savings Account, by Years Saved and Expected Rate of Return assuming maximum individual contribution made each year.
$53,000 $60,000$68,000
$118,000$150,000
$193,000$216,000
$313,000
$469,000
$360,000
$600,000
$1,062,000
2.5% 5.0% 7.5%
Expected Rate of Return
Source: Manning & Napier, EBRI. For illustrative purposes only.A number of assumptions were made to generate the potential savings: 1) It was assumed that the maximum contribution was made each year. Contributions were assumed to have been made monthly, where the monthly contribution was one-twelfth of the maximum annual contribution. The maximum contribution thresholds were increased 2.5 percent each year. 2) Individuals eligible to make catch-up contributions (those ages 55 and older) were assumed to have made those contributions. As a result, in the 10-year savings estimates, catch-up contributions were assumed to have been made in each of the years. In the 20-, 30-, and 40-year savings estimates, catch-up contributions were assumed to have been made during the final 10-year period. In other words, the 10-year savings estimates represent the amount a 55-year-old could save by the time he or she reached age 65. The 20-year savings estimates represent the amount a 45-year-old could save by the time he or she reached age 65. The 30-year savings estimates represent the amount a 35-year-old could save by the time he or she reached age 65. And the 40-year savings estimates represent the maximum amount a 25-year-old could save by the time he or she reached age 65. The maximum catch-up contribution was not indexed to inflation.
Savings potential of the HSA
25

Cash Account Returns
26

Asset Class Returns
27

21%of cash-outs from
Retirement Plans held at a former employer were used to pay medical expenses.
15.8%of Hardship Withdrawals
from retirement plans went to pay medical expenses.
58%of respondents to a T. Rowe Price Survey have taken money out of a retirement account to pay for
something else.
20% to pay off debt 10% health care costs
Sources: Manning & Napier ( T. Rowe Price Family Financial Trade-Offs Survey and Aon Hewitt. )
HSA’s can preserve wealth
28

Optimize benefit design to max savings
Source: Health Equity: 2019 29

Minimum deductible $1,350 single/$2,700 familyMaximum out-of-pocket expenses $6,750 single/$13,500 family
Must be enrolled in a qualified high deductible health plan (HDHP) with:1
Up to IRS limits: $3,500 single/$7,000 family in 2019(based on HDHP enrollment)$1,000 catch-up contribution for age 55+
Allows annual contributions – from employee and employer combined2
65% of employees may be financially better off in a HDHP*
Data as of 01/01/2019 *Based on: (i) case study in “The case for CDHPs...”, Change Healthcare, and (ii) statistics showing that 80% of individuals in the U.S. account for only 18.30% of total health spending,
“Concentration of Health Care Sending in the U.S. Population, 2010,” Kaiser Family Foundation.Sources: Manning & Napier, ConnectYourCare, Blue Cross Blue Shield, Concepts in Benefits, Inc., and Change Healthcare.
Trend to high deductible health plans
Utilizing the HSA
30

1
Source: 2017 PSCA Survey on Health Savings Accounts and Retirement Plans
Utilization of the HSA
» 81% of employers contribute to an HSA
» 58% of eligible employees participate in the plan
» Less than 7% of employees on average use their entire balance each year
» Employer contributions are most commonly tied to a set dollar amount per the HDHP Coverage Level (can be at beginning of year or per pay)
» 75% of employers offering an HSA regard it as part of their Retirement benefits
» In companies with more than 5,000 employees, over 90% considered the investment component important or very important
31
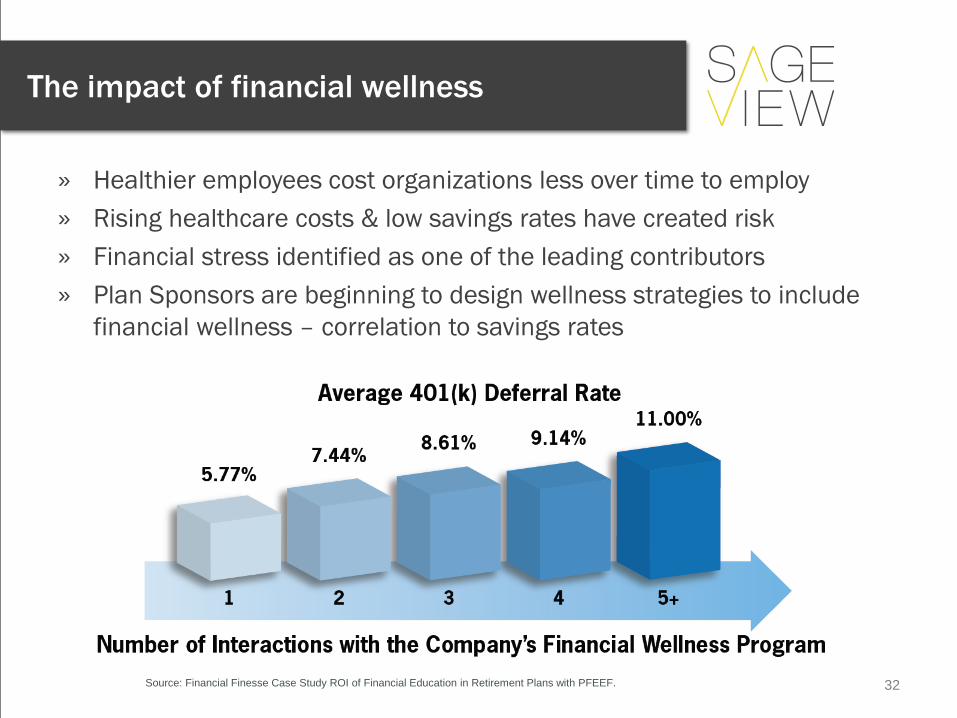
The impact of financial wellness
» Healthier employees cost organizations less over time to employ» Rising healthcare costs & low savings rates have created risk» Financial stress identified as one of the leading contributors » Plan Sponsors are beginning to design wellness strategies to include
financial wellness – correlation to savings rates
Source: Financial Finesse Case Study ROI of Financial Education in Retirement Plans with PFEEF. 32

Conclusions & Implications
Conclusions & Implications
» Continued growth of DC and 457 plan assets likely
» Greater responsibility placed on employees for preparing themselves for the future
»Educating employees on the plan options will be critical to success
» Healthcare reform presenting new challenges to finance the cost of healthcare in retirement but unfunded gaps can be addressed today using vehicles like HSA’s and financial wellness tools.
»New technology could improve the administrative efficiency of plans and allow participants a fully automated but comprehensive experience. More health providers are connecting with retirement service providers.
Source: 2013 P&I DC East coast Conference 34
2019 Defined Contribution Plan Industry ReportGovernment: City/Municipal
DC Retirement Plan Benchmarks
For Plan Sponsor use only. Not for use with plan participants.Source: PLANSPONSOR Defined Contribution Survey, 2018
Valid until November, 2019
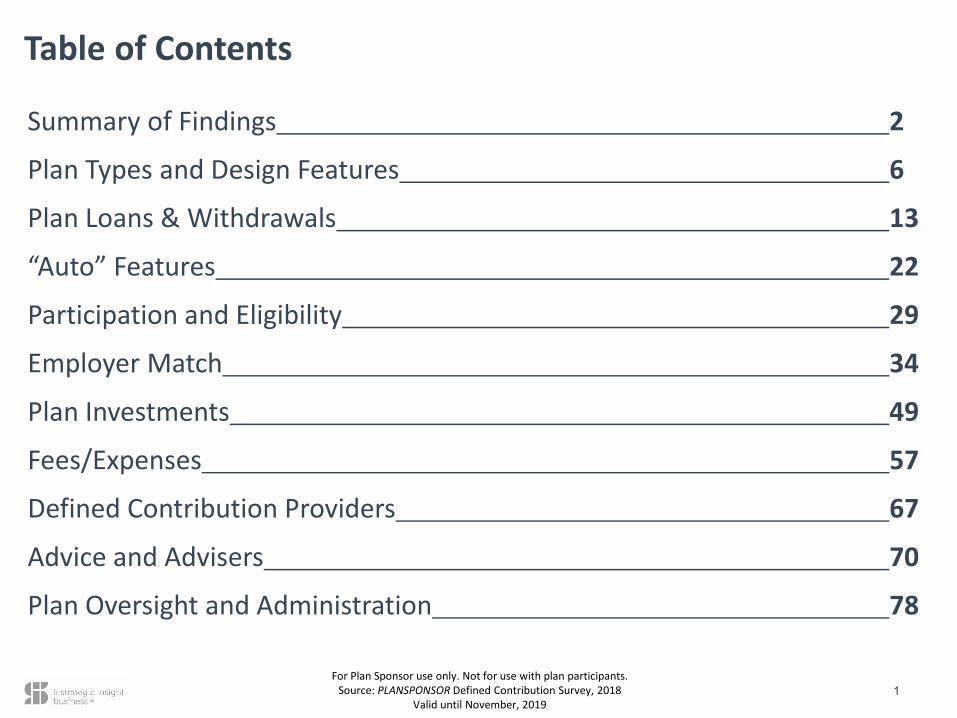
Summary of Findings 2
Plan Types and Design Features 6
Plan Loans & Withdrawals 13
“Auto” Features 22
Participation and Eligibility 29
Employer Match 34
Plan Investments 49
Fees/Expenses 57
Defined Contribution Providers 67
Advice and Advisers 70
Plan Oversight and Administration 78
Table of Contents
1
For Plan Sponsor use only. Not for use with plan participants.Source: PLANSPONSOR Defined Contribution Survey, 2018
Valid until November, 2019
About this report
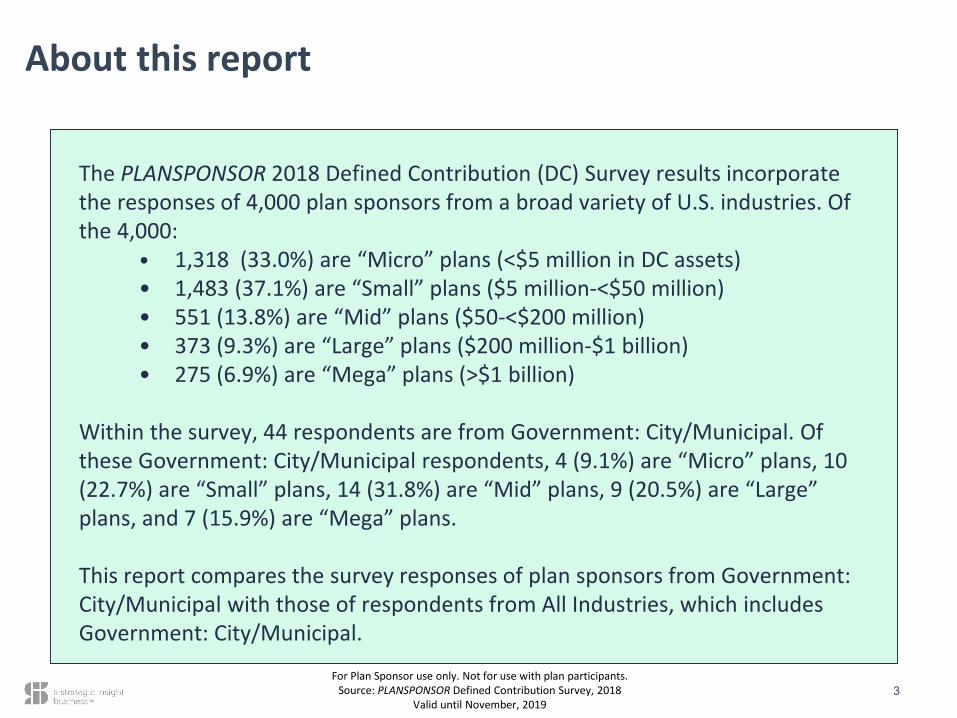
The PLANSPONSOR 2018 Defined Contribution (DC) Survey results incorporate the responses of 4,000 plan sponsors from a broad variety of U.S. industries. Of the 4,000:
• 1,318 (33.0%) are “Micro” plans (<$5 million in DC assets)• 1,483 (37.1%) are “Small” plans ($5 million-<$50 million)• 551 (13.8%) are “Mid” plans ($50-<$200 million)• 373 (9.3%) are “Large” plans ($200 million-$1 billion)• 275 (6.9%) are “Mega” plans (>$1 billion)
Within the survey, 44 respondents are from Government: City/Municipal. Of these Government: City/Municipal respondents, 4 (9.1%) are “Micro” plans, 10 (22.7%) are “Small” plans, 14 (31.8%) are “Mid” plans, 9 (20.5%) are “Large” plans, and 7 (15.9%) are “Mega” plans.
This report compares the survey responses of plan sponsors from Government: City/Municipal with those of respondents from All Industries, which includes Government: City/Municipal.
3

For Plan Sponsor use only. Not for use with plan participants.Source: PLANSPONSOR Defined Contribution Survey, 2018
Valid until November, 2019
Does your organization offer any of these additional workplace retirement/savings plans?
All Industries Government: City/Municipal
Overall <$5MM $5MM-$50MM
>$50MM-$200MM
>$200MM-$1B $>1B Overall <$5MM $5MM-
$50MM>$50MM-$200MM
>$200MM-$1B $>1B
Defined Benefit Plan (Traditional) 21.8% 15.2% 18.3% 22.2% 37.4% 48.5% 54.5% 50.0% 30.0% 64.3% 55.6% 71.4%
Defined Benefit Plan (CashBalance)
5.2% 2.2% 2.3% 4.2% 12.4% 26.5% 4.5% 0.0% 0.0% 0.0% 0.0% 28.6%
Defined Benefit Plan (Hybrid/ other
formula)2.0% 0.9% 1.0% 2.0% 3.0% 10.7% 13.6% 0.0% 10.0% 14.3% 11.1% 28.6%
Equity Compensation
(e.g., Stock) Plan6.7% 1.6% 2.7% 10.8% 16.9% 30.1% 2.3% 0.0% 0.0% 0.0% 0.0% 14.3%
Health Savings Accounts (HSA) 46.2% 28.7% 47.1% 58.9% 65.9% 70.2% 38.6% 0.0% 40.0% 42.9% 44.4% 42.9%
Retiree Health Benefits 12.0% 1.9% 6.0% 17.6% 34.9% 48.5% 50.0% 0.0% 30.0% 71.4% 55.6% 57.1%
NONE - do not offer any of these plans 37.5% 56.2% 38.7% 22.6% 11.8% 5.5% 18.2% 50.0% 50.0% 7.1% 0.0% 0.0%
8
For Plan Sponsor use only. Not for use with plan participants.Source: PLANSPONSOR Defined Contribution Survey, 2018
Valid until November, 2019
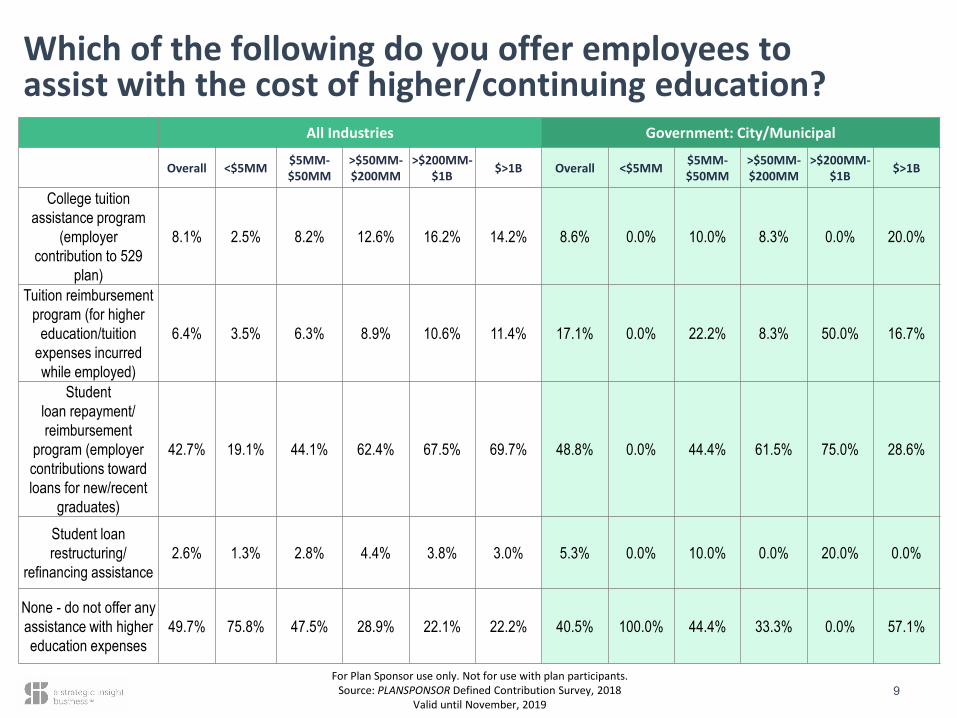
Which of the following do you offer employees to assist with the cost of higher/continuing education?
All Industries Government: City/Municipal
Overall <$5MM $5MM-$50MM
>$50MM-$200MM
>$200MM-$1B $>1B Overall <$5MM $5MM-
$50MM>$50MM-$200MM
>$200MM-$1B $>1B
College tuition assistance program
(employer contribution to 529
plan)
8.1% 2.5% 8.2% 12.6% 16.2% 14.2% 8.6% 0.0% 10.0% 8.3% 0.0% 20.0%
Tuition reimbursement program (for higher
education/tuition expenses incurred while employed)
6.4% 3.5% 6.3% 8.9% 10.6% 11.4% 17.1% 0.0% 22.2% 8.3% 50.0% 16.7%
Student loan repayment/ reimbursement
program (employer contributions toward loans for new/recent
graduates)
42.7% 19.1% 44.1% 62.4% 67.5% 69.7% 48.8% 0.0% 44.4% 61.5% 75.0% 28.6%
Student loan restructuring/
refinancing assistance2.6% 1.3% 2.8% 4.4% 3.8% 3.0% 5.3% 0.0% 10.0% 0.0% 20.0% 0.0%
None - do not offer any assistance with higher education expenses
49.7% 75.8% 47.5% 28.9% 22.1% 22.2% 40.5% 100.0% 44.4% 33.3% 0.0% 57.1%
9

For Plan Sponsor use only. Not for use with plan participants.Source: PLANSPONSOR Defined Contribution Survey, 2018
Valid until November, 2019
How many loans can a participant have open at one time?
All Industries Government: City/Municipal
Overall <$5MM $5MM-$50MM
>$50MM-$200MM
>$200MM-$1B $>1B Overall <$5MM $5MM-
$50MM>$50MM-$200MM
>$200MM-$1B $>1B
One 57.7% 67.7% 56.5% 55.4% 51.1% 41.6% 58.6% 66.7% 57.1% 60.0% 50.0% 66.7%
Two 33.2% 24.7% 33.4% 35.5% 39.2% 49.0% 34.5% 0.0% 28.6% 40.0% 50.0% 33.3%
Three 5.0% 4.1% 4.3% 5.9% 6.7% 6.9% 3.4% 33.3% 0.0% 0.0% 0.0% 0.0%
Four or more 4.2% 3.6% 5.8% 3.2% 3.0% 2.4% 3.4% 0.0% 14.3% 0.0% 0.0% 0.0%
16
For Plan Sponsor use only. Not for use with plan participants.Source: PLANSPONSOR Defined Contribution Survey, 2018
Valid until November, 2019
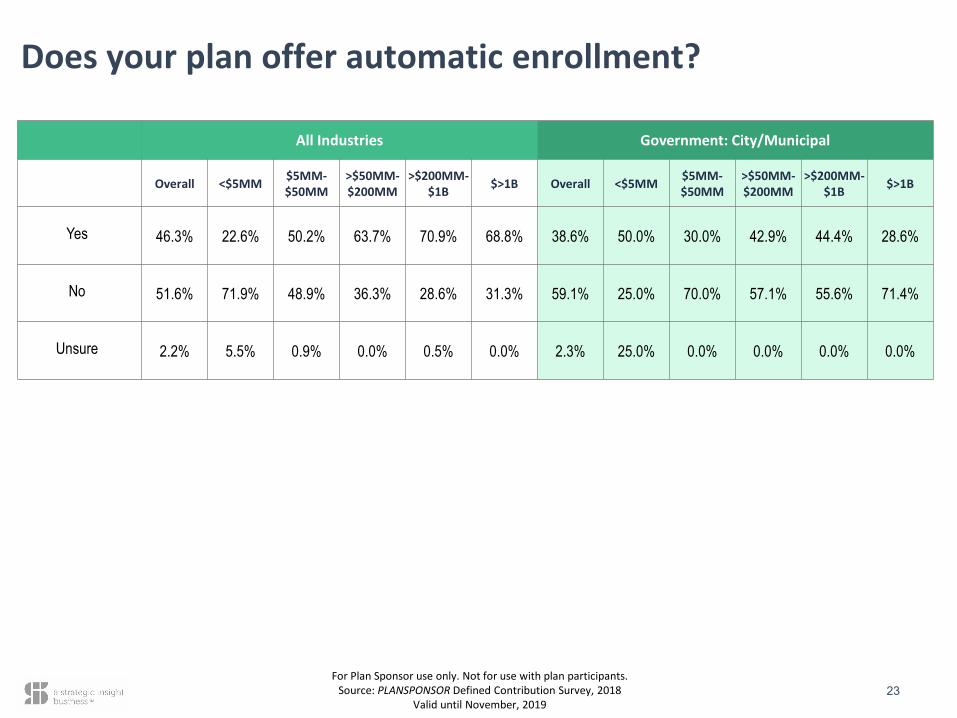
Does your plan offer automatic enrollment?
All Industries Government: City/Municipal
Overall <$5MM $5MM-$50MM
>$50MM-$200MM
>$200MM-$1B $>1B Overall <$5MM $5MM-
$50MM>$50MM-$200MM
>$200MM-$1B $>1B
Yes 46.3% 22.6% 50.2% 63.7% 70.9% 68.8% 38.6% 50.0% 30.0% 42.9% 44.4% 28.6%
No 51.6% 71.9% 48.9% 36.3% 28.6% 31.3% 59.1% 25.0% 70.0% 57.1% 55.6% 71.4%
Unsure 2.2% 5.5% 0.9% 0.0% 0.5% 0.0% 2.3% 25.0% 0.0% 0.0% 0.0% 0.0%
23
For Plan Sponsor use only. Not for use with plan participants.Source: PLANSPONSOR Defined Contribution Survey, 2018
Valid until November, 2019
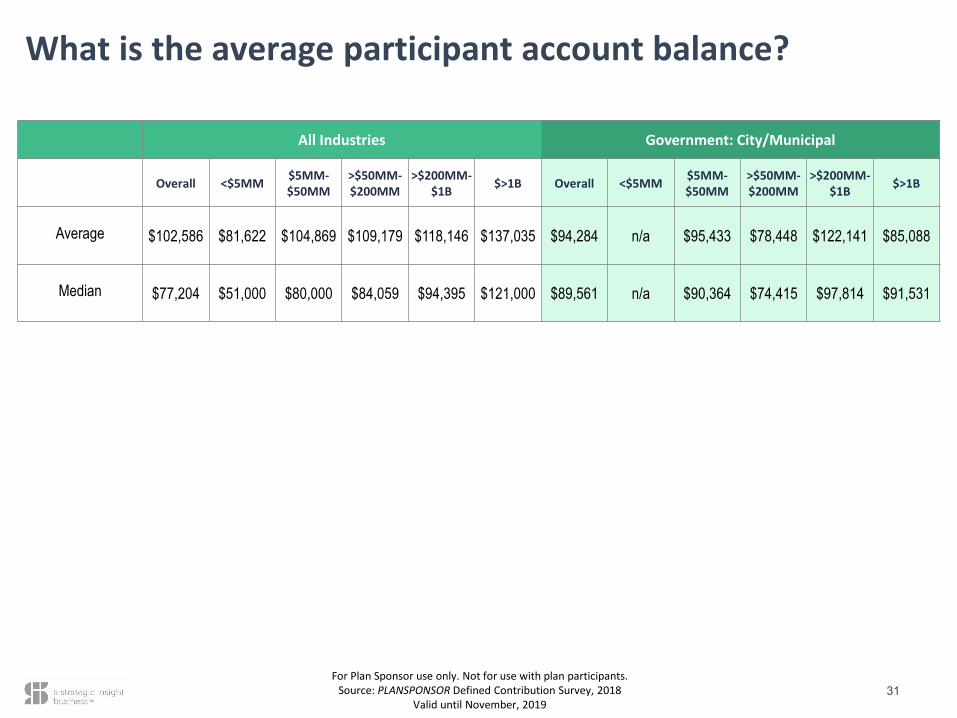
What is the average participant account balance?
All Industries Government: City/Municipal
Overall <$5MM $5MM-$50MM
>$50MM-$200MM
>$200MM-$1B $>1B Overall <$5MM $5MM-
$50MM>$50MM-$200MM
>$200MM-$1B $>1B
Average $102,586 $81,622 $104,869 $109,179 $118,146 $137,035 $94,284 n/a $95,433 $78,448 $122,141 $85,088
Median $77,204 $51,000 $80,000 $84,059 $94,395 $121,000 $89,561 n/a $90,364 $74,415 $97,814 $91,531
31
For Plan Sponsor use only. Not for use with plan participants.Source: PLANSPONSOR Defined Contribution Survey, 2018
Valid until November, 2019
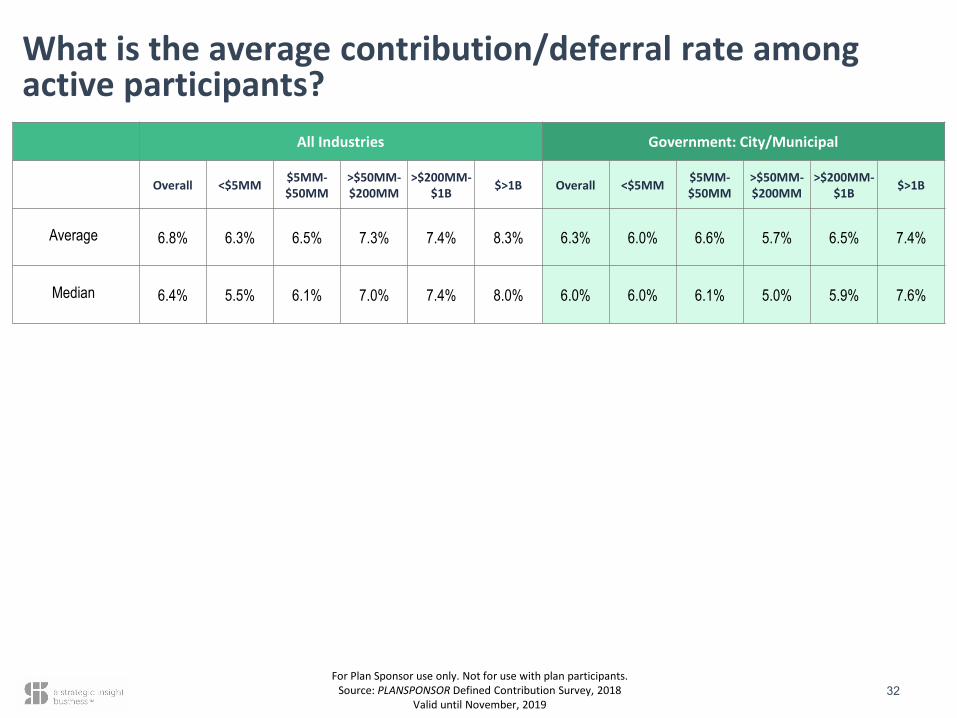
What is the average contribution/deferral rate among active participants?
All Industries Government: City/Municipal
Overall <$5MM $5MM-$50MM
>$50MM-$200MM
>$200MM-$1B $>1B Overall <$5MM $5MM-
$50MM>$50MM-$200MM
>$200MM-$1B $>1B
Average 6.8% 6.3% 6.5% 7.3% 7.4% 8.3% 6.3% 6.0% 6.6% 5.7% 6.5% 7.4%
Median 6.4% 5.5% 6.1% 7.0% 7.4% 8.0% 6.0% 6.0% 6.1% 5.0% 5.9% 7.6%
32

For Plan Sponsor use only. Not for use with plan participants.Source: PLANSPONSOR Defined Contribution Survey, 2018
Valid until November, 2019
Does your organization offer a matching contribution to participant accounts?*
All Industries Government: City/Municipal
Overall <$5MM $5MM-$50MM
>$50MM-$200MM
>$200MM-$1B $>1B Overall <$5MM $5MM-
$50MM>$50MM-$200MM
>$200MM-$1B $>1B
Yes 76.5% 70.8% 78.1% 78.3% 80.2% 85.7% 43.9% 50.0% 40.0% 46.2% 33.3% 57.1%
No 23.2% 28.4% 21.8% 21.7% 19.5% 14.3% 56.1% 50.0% 60.0% 53.8% 66.7% 42.9%
Unsure 0.3% 0.8% 0.1% 0.0% 0.3% 0.0% 0.0% 0.0% 0.0% 0.0% 0.0% 0.0%
*NOTE: A matching contribution requires a participant contribution that is “matched” by the employer up to somedefined limit (i.e., 50% match on first 6% of salary, dollar-for-dollar up to $1000, etc.).
35
For Plan Sponsor use only. Not for use with plan participants.Source: PLANSPONSOR Defined Contribution Survey, 2018
Valid until November, 2019
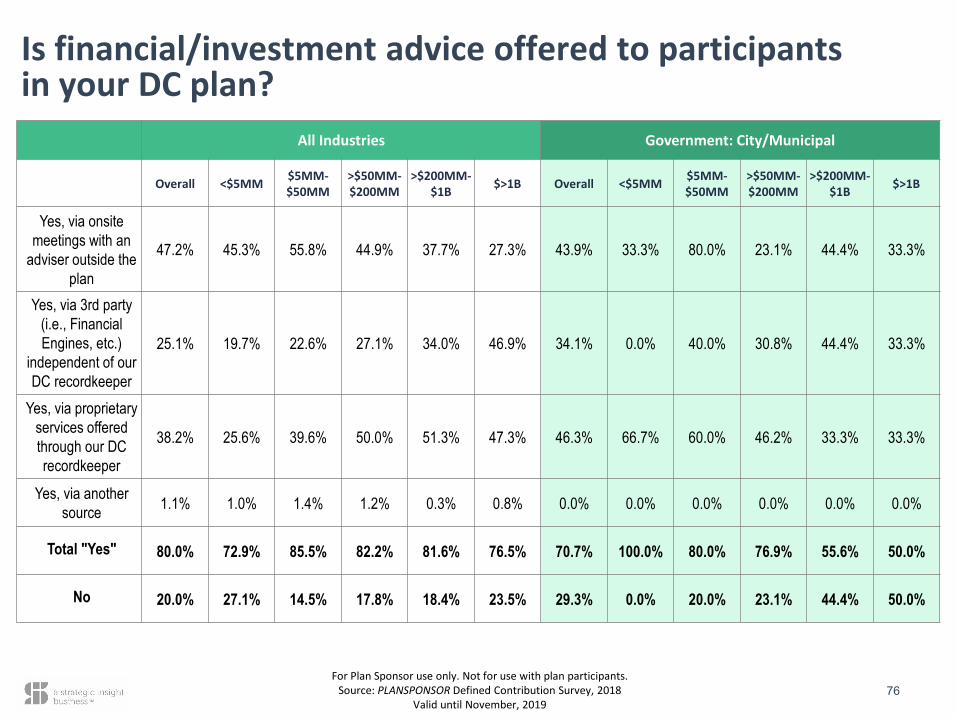
Is financial/investment advice offered to participants in your DC plan?
All Industries Government: City/Municipal
Overall <$5MM $5MM-$50MM
>$50MM-$200MM
>$200MM-$1B $>1B Overall <$5MM $5MM-
$50MM>$50MM-$200MM
>$200MM-$1B $>1B
Yes, via onsite meetings with an
adviser outside the plan
47.2% 45.3% 55.8% 44.9% 37.7% 27.3% 43.9% 33.3% 80.0% 23.1% 44.4% 33.3%
Yes, via 3rd party (i.e., Financial Engines, etc.)
independent of our DC recordkeeper
25.1% 19.7% 22.6% 27.1% 34.0% 46.9% 34.1% 0.0% 40.0% 30.8% 44.4% 33.3%
Yes, via proprietary services offered through our DC recordkeeper
38.2% 25.6% 39.6% 50.0% 51.3% 47.3% 46.3% 66.7% 60.0% 46.2% 33.3% 33.3%
Yes, via another source 1.1% 1.0% 1.4% 1.2% 0.3% 0.8% 0.0% 0.0% 0.0% 0.0% 0.0% 0.0%
Total "Yes" 80.0% 72.9% 85.5% 82.2% 81.6% 76.5% 70.7% 100.0% 80.0% 76.9% 55.6% 50.0%
No 20.0% 27.1% 14.5% 17.8% 18.4% 23.5% 29.3% 0.0% 20.0% 23.1% 44.4% 50.0%
76
For Plan Sponsor use only. Not for use with plan participants.Source: PLANSPONSOR Defined Contribution Survey, 2018
Valid until November, 2019
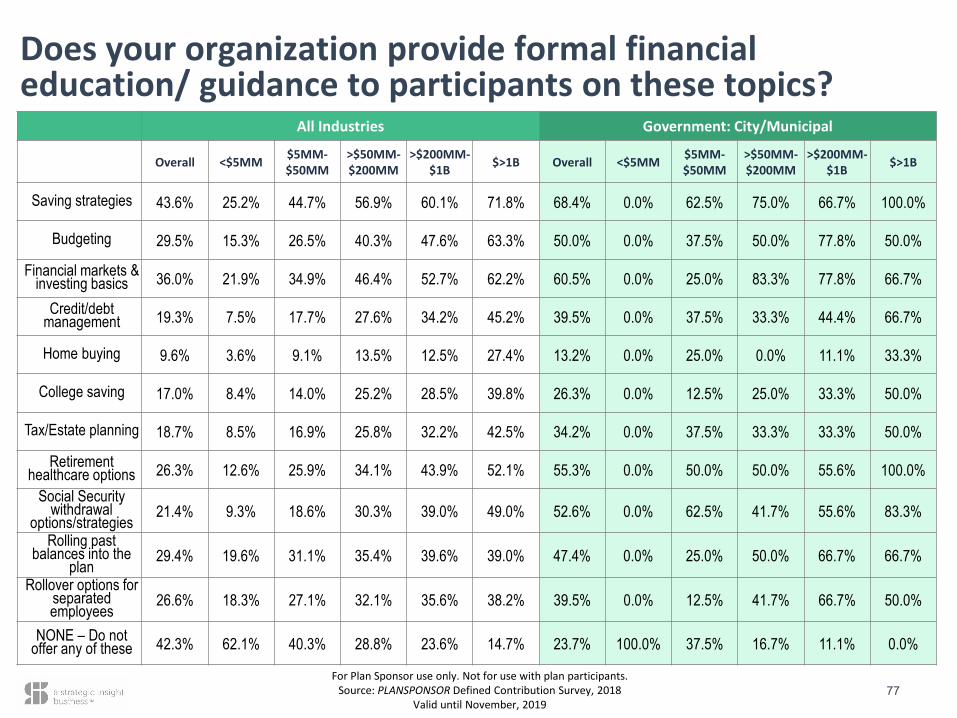
Does your organization provide formal financial education/ guidance to participants on these topics?
All Industries Government: City/Municipal
Overall <$5MM $5MM-$50MM
>$50MM-$200MM
>$200MM-$1B $>1B Overall <$5MM $5MM-
$50MM>$50MM-$200MM
>$200MM-$1B $>1B
Saving strategies 43.6% 25.2% 44.7% 56.9% 60.1% 71.8% 68.4% 0.0% 62.5% 75.0% 66.7% 100.0%
Budgeting 29.5% 15.3% 26.5% 40.3% 47.6% 63.3% 50.0% 0.0% 37.5% 50.0% 77.8% 50.0%
Financial markets & investing basics 36.0% 21.9% 34.9% 46.4% 52.7% 62.2% 60.5% 0.0% 25.0% 83.3% 77.8% 66.7%
Credit/debt management 19.3% 7.5% 17.7% 27.6% 34.2% 45.2% 39.5% 0.0% 37.5% 33.3% 44.4% 66.7%
Home buying 9.6% 3.6% 9.1% 13.5% 12.5% 27.4% 13.2% 0.0% 25.0% 0.0% 11.1% 33.3%
College saving 17.0% 8.4% 14.0% 25.2% 28.5% 39.8% 26.3% 0.0% 12.5% 25.0% 33.3% 50.0%
Tax/Estate planning 18.7% 8.5% 16.9% 25.8% 32.2% 42.5% 34.2% 0.0% 37.5% 33.3% 33.3% 50.0%
Retirement healthcare options 26.3% 12.6% 25.9% 34.1% 43.9% 52.1% 55.3% 0.0% 50.0% 50.0% 55.6% 100.0%
Social Security withdrawal
options/strategies 21.4% 9.3% 18.6% 30.3% 39.0% 49.0% 52.6% 0.0% 62.5% 41.7% 55.6% 83.3%
Rolling past balances into the
plan 29.4% 19.6% 31.1% 35.4% 39.6% 39.0% 47.4% 0.0% 25.0% 50.0% 66.7% 66.7%
Rollover options for separatedemployees 26.6% 18.3% 27.1% 32.1% 35.6% 38.2% 39.5% 0.0% 12.5% 41.7% 66.7% 50.0%
NONE – Do not offer any of these 42.3% 62.1% 40.3% 28.8% 23.6% 14.7% 23.7% 100.0% 37.5% 16.7% 11.1% 0.0%
77

Questions?

Thank you.Lisa M. Garcia, AIF, QPFCPh: (407) 791-3562Email: [email protected]
www.sageviewadvisory.com
Disclosure & Disclaimer
Securities offered through Cetera Advisor Networks, Member FINRA, SIPC, SageView and Cetera are not affiliated companies.
STATEMENT OF OPINION: This and/or the accompanying information was prepared by or obtained from sources which SageView. believes to be reliable but does not guarantee its accuracy. Any opinions expressed or implied herein are not necessarily the same as those of SageView research departments and are subject to change without notice. The report herein is not a complete analysis of every material fact in respect to any company, industry, or security. Additional Information is available upon request.
ASSET CLASS SUITABILITY: Stocks of small companies are typically more volatile than stocks of larger companies. They often involve higher risks because they may lack the management expertise, financial resources, product diversification and competitive strengths to endure adverse economic conditions. High-yield, non-investment grade bonds are only suitable for aggressive investors willing to take greater risks, which could result in loss of principal and interest payments. Global/International investing involves risks not typically associated with US investing, including currency fluctuations, political instability, uncertain economic conditions and different accounting standards.
PAST PERFORMANCE: Past performance is not an indication of future results.ASSET ALLOCATION: Asset Allocation cannot eliminate the risk of fluctuating prices and uncertain returns.INTERNATIONAL INVESTING: Global/International investing involves risks not typically associated with US investing, including currency fluctuations, political instability, uncertain economic conditions and different account standards.
37
Related Documents