Welcome message from author
This document is posted to help you gain knowledge. Please leave a comment to let me know what you think about it! Share it to your friends and learn new things together.
Transcript


PART 1
Introduction
and Underlying Concepts
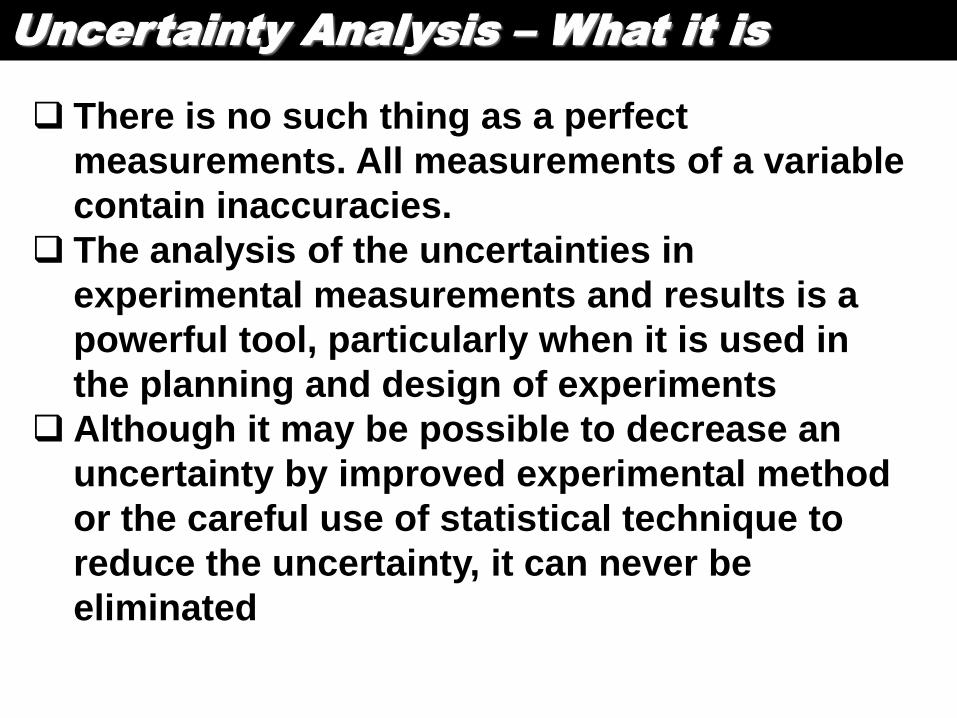
Uncertainty Analysis – What it is
There is no such thing as a perfect
measurements. All measurements of a variable
contain inaccuracies.
The analysis of the uncertainties in
experimental measurements and results is a
powerful tool, particularly when it is used in
the planning and design of experiments
Although it may be possible to decrease an
uncertainty by improved experimental method
or the careful use of statistical technique to
reduce the uncertainty, it can never be
eliminated
Issues of Analysis
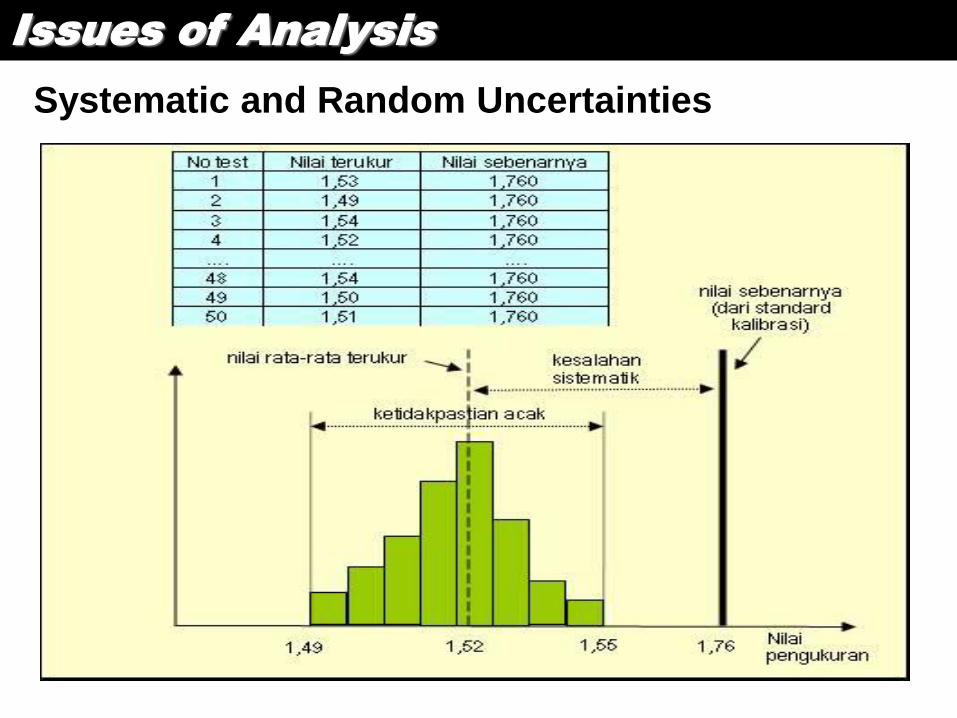
Systematic and Random Uncertainties
Issues of Analysis
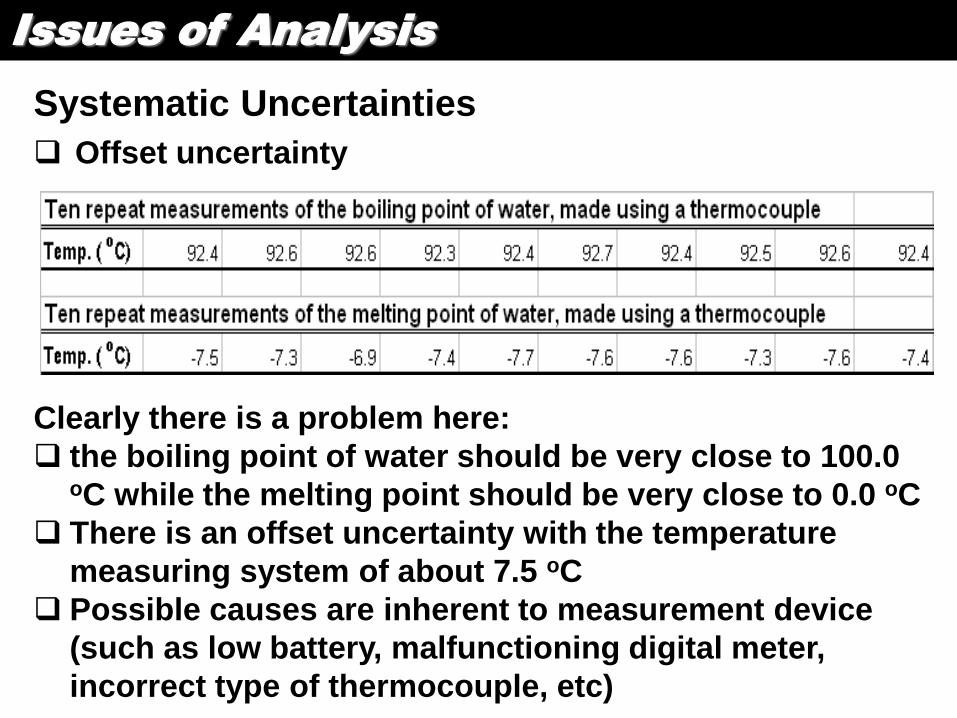
Systematic Uncertainties
Offset uncertainty
Clearly there is a problem here:
the boiling point of water should be very close to 100.0 oC while the melting point should be very close to 0.0 oC
There is an offset uncertainty with the temperature
measuring system of about 7.5 oC
Possible causes are inherent to measurement device
(such as low battery, malfunctioning digital meter,
incorrect type of thermocouple, etc)
Issues of Analysis
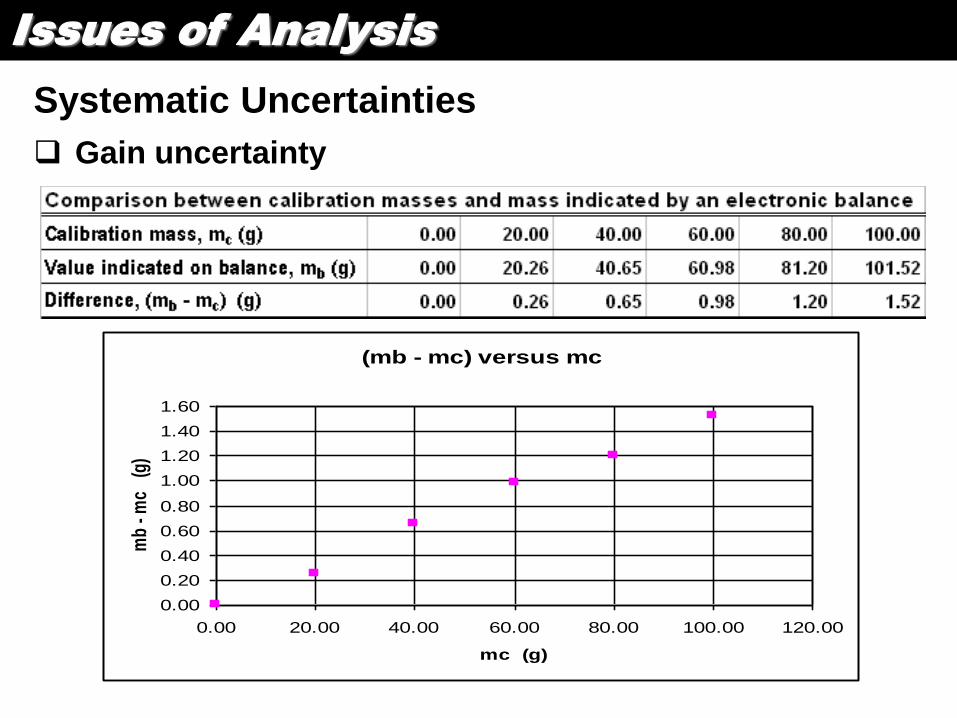
Systematic Uncertainties
Gain uncertainty
(mb - mc) versus mc
0.00
0.20
0.40
0.60
0.80
1.00
1.20
1.40
1.60
0.00 20.00 40.00 60.00 80.00 100.00 120.00
mc (g)
mb
- mc
(g)
Issues of Analysis
Random Uncertainties
Random uncertainties produce scatter in observed
values.
The cause :
o limitation in the scale of the instrument
resolution uncertainty due to rounding up of
measured value
o reading uncertainty
o random uncertainty due to environmental factor
(electrical interference, vibration, power supply
fluctuation, Brownian motion of air molecule,
background radiation, noise, etc)
Use statistical technique to get an estimate of the
probable uncertainty and to allow us to calculate the
effect of combining uncertainties
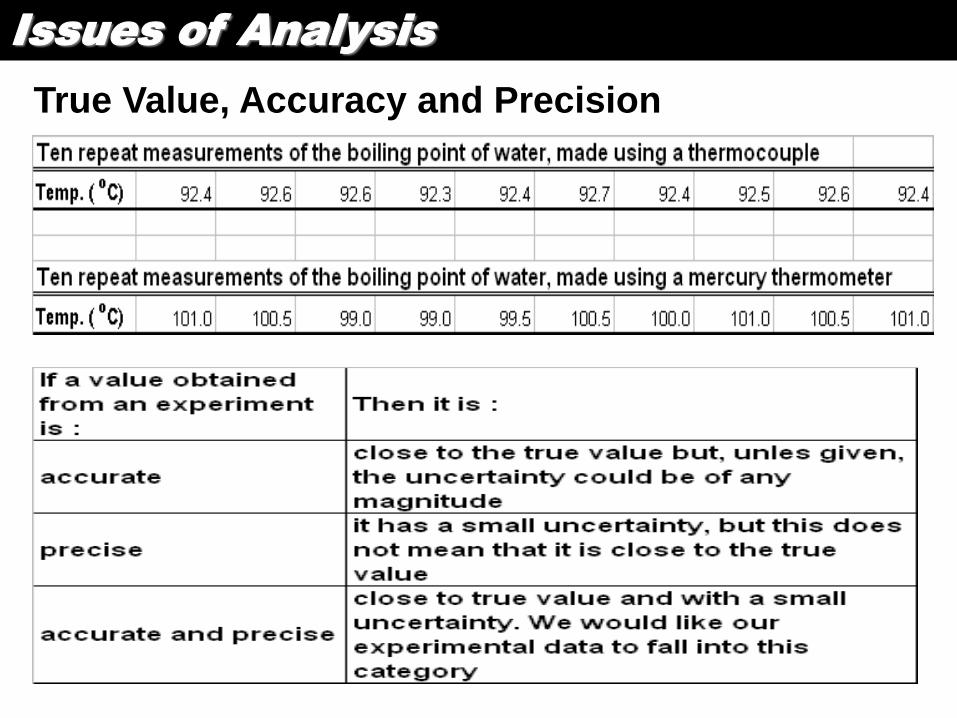
Issues of Analysis
True Value, Accuracy and Precision
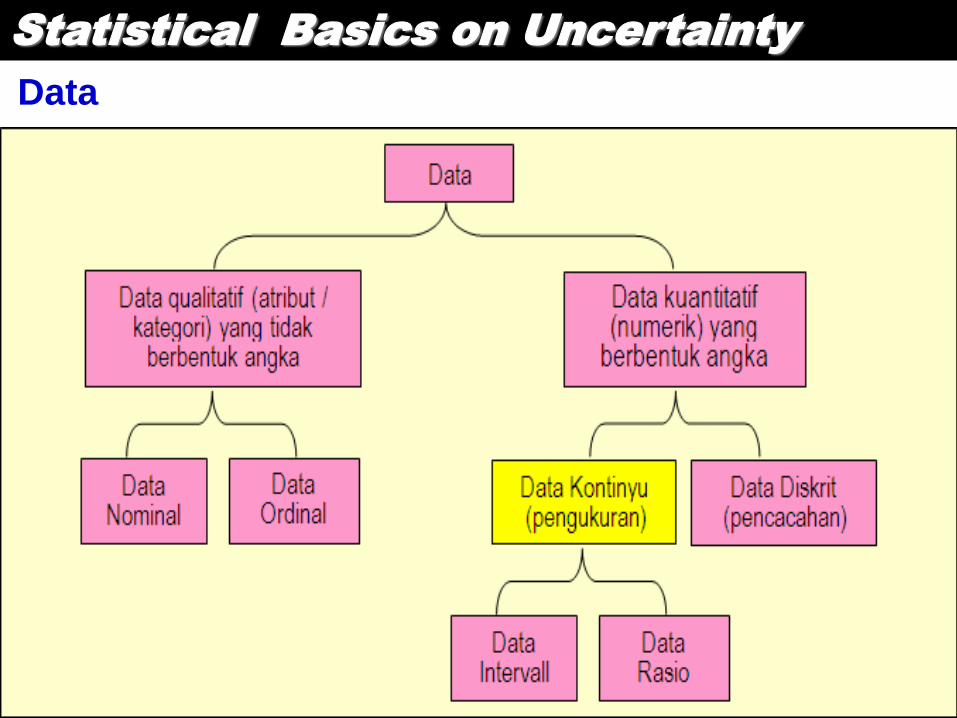
Statistical Basics on Uncertainty
Data
Statistical Basics on Uncertainty
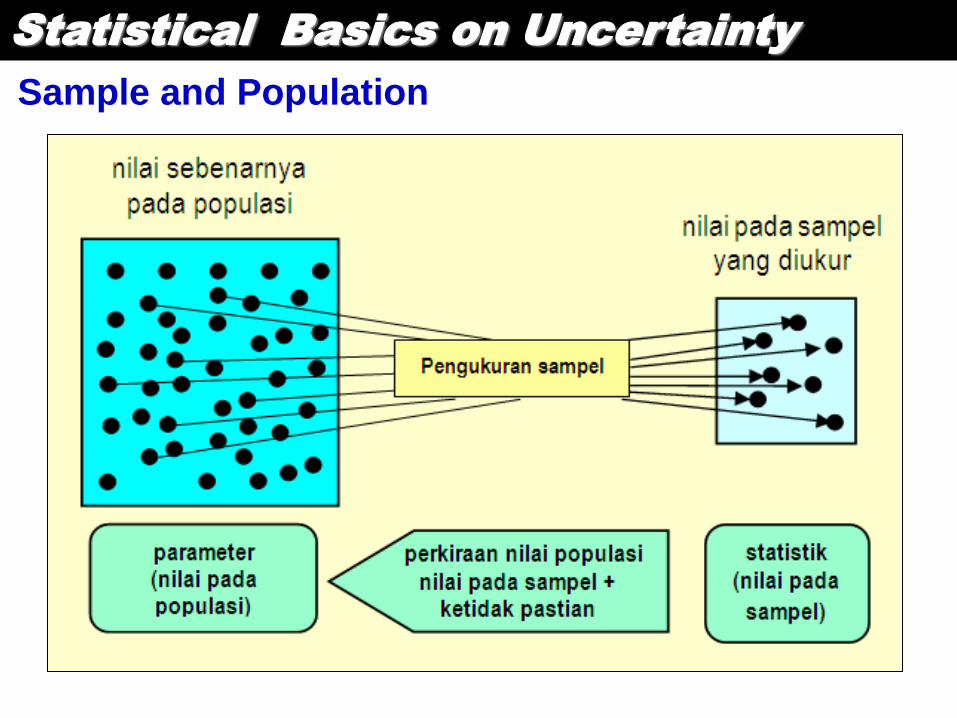
Sample and Population
Statistical Basics on Uncertainty
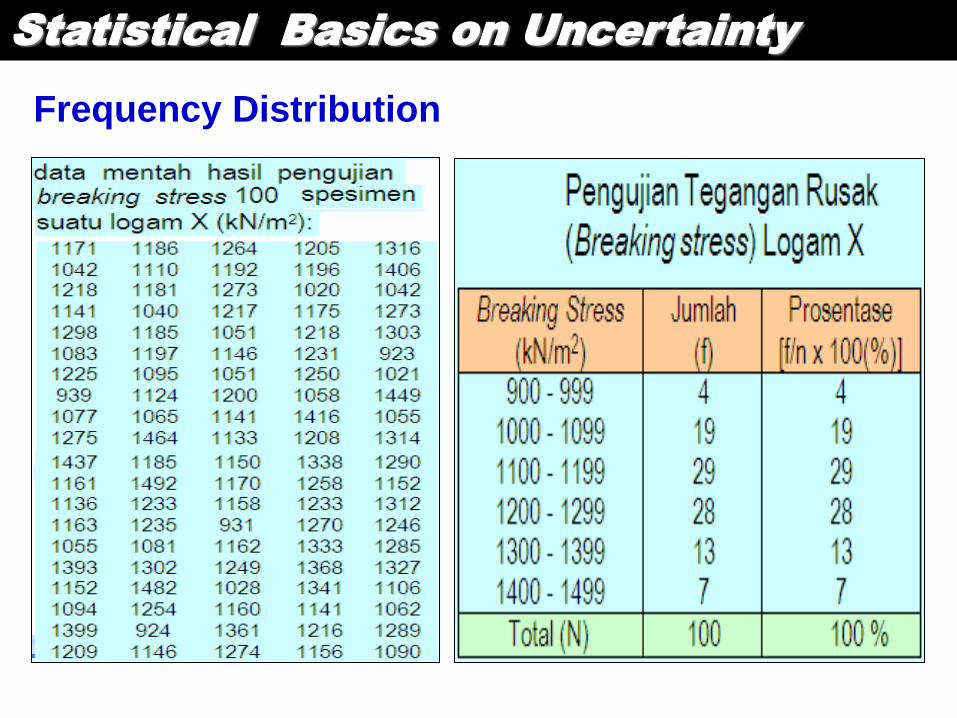
Frequency Distribution
Statistical Basics on Uncertainty
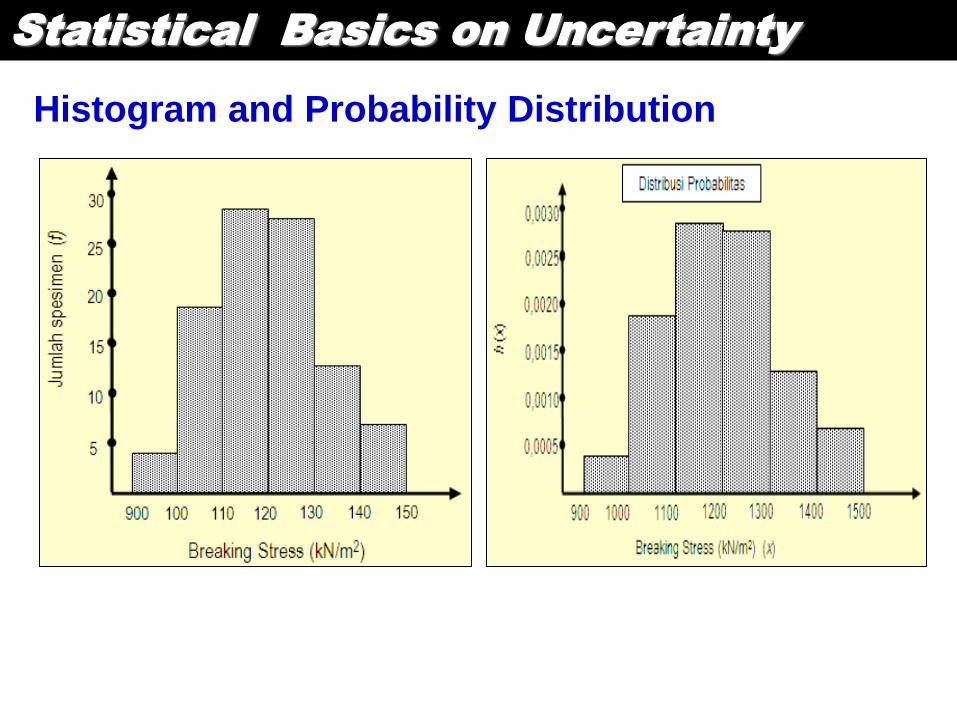
Histogram and Probability Distribution
Statistical Basics on Uncertainty
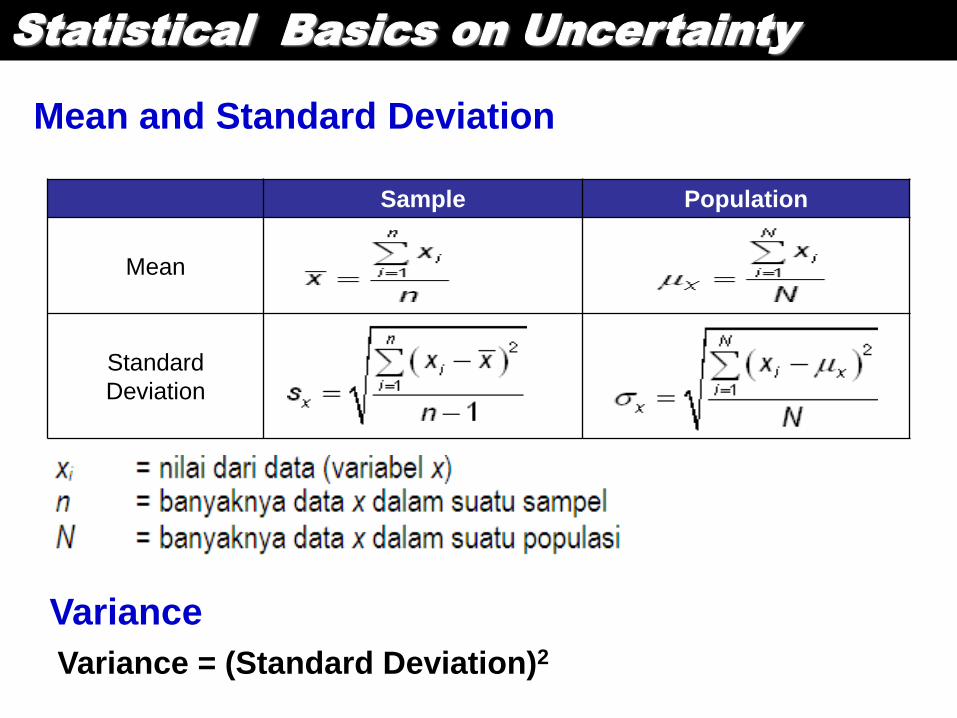
Mean and Standard Deviation
Sample Population
Mean
Standard
Deviation
Variance = (Standard Deviation)2
Variance
Statistical Basics on Uncertainty
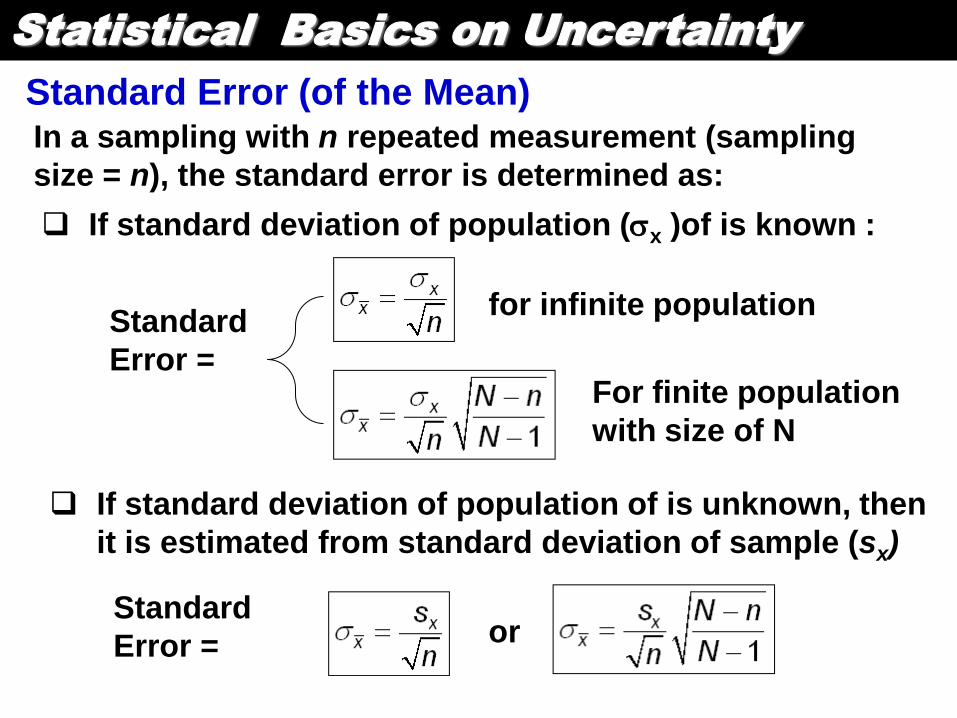
Standard Error (of the Mean)
If standard deviation of population (x )of is known :
In a sampling with n repeated measurement (sampling
size = n), the standard error is determined as:
Standard
Error =
If standard deviation of population of is unknown, then
it is estimated from standard deviation of sample (sx)
for infinite population
For finite population
with size of N
Standard
Error = or
Statistical Basics on Uncertainty
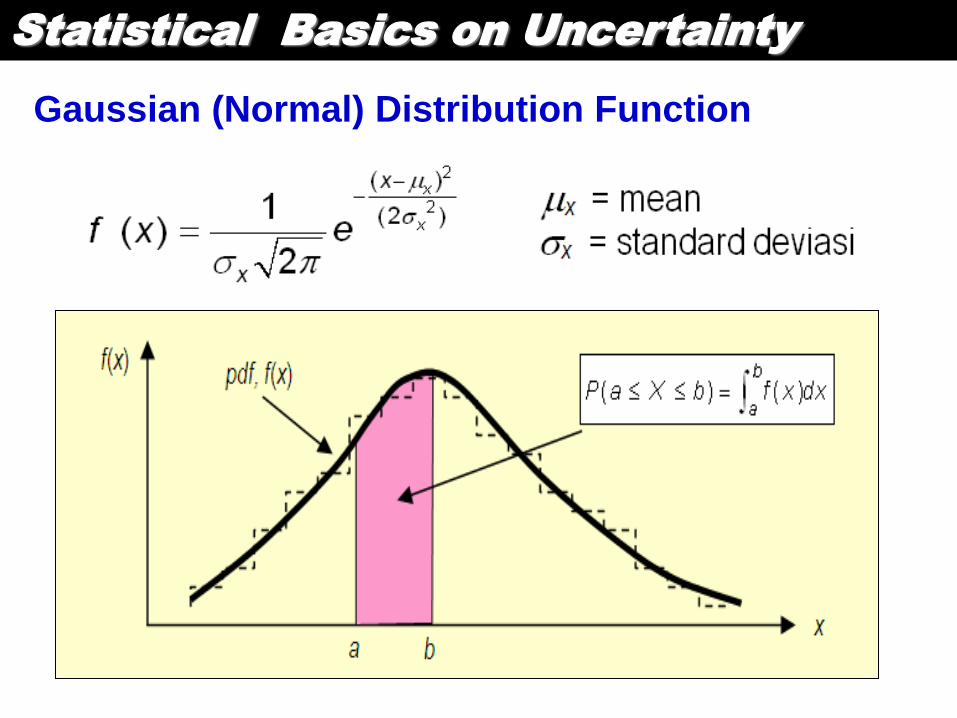
Gaussian (Normal) Distribution Function
Statistical Basics on Uncertainty
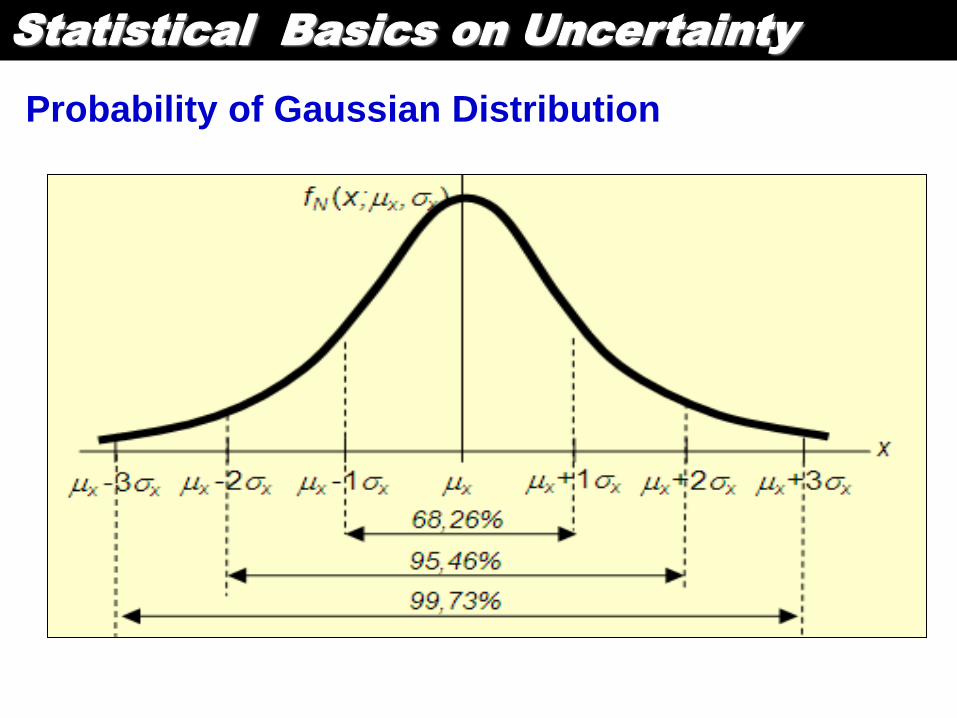
Probability of Gaussian Distribution
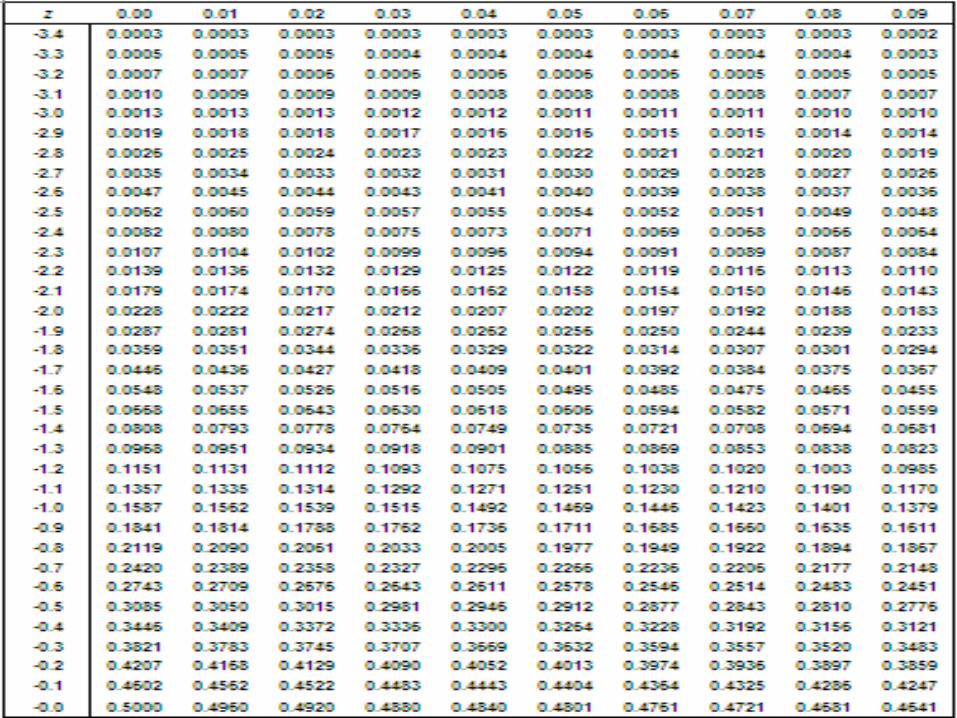
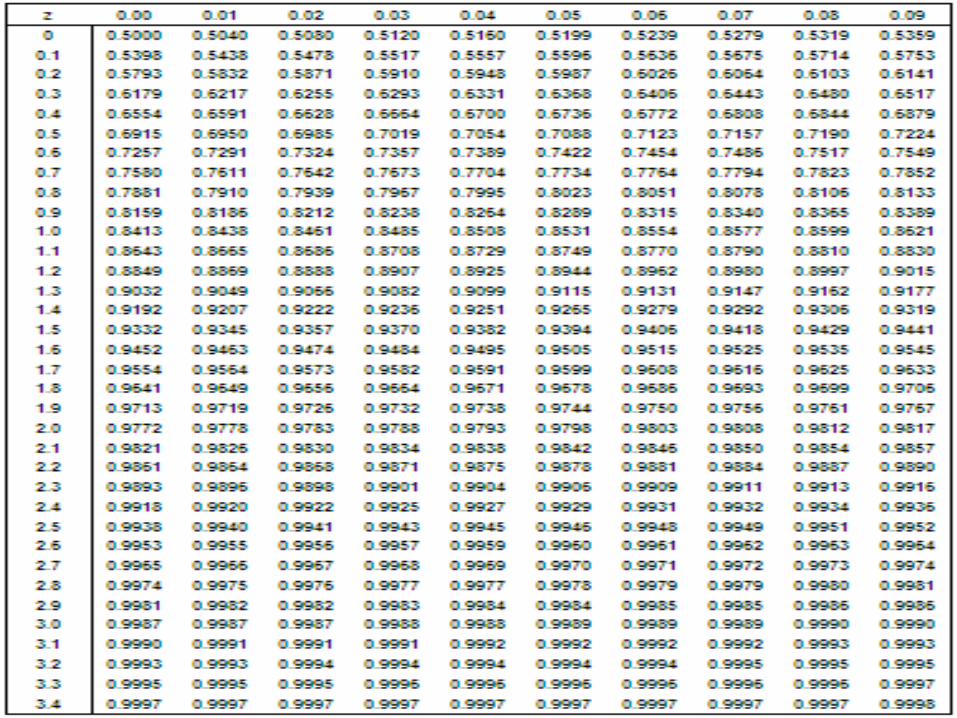
Statistical Basics on Uncertainty
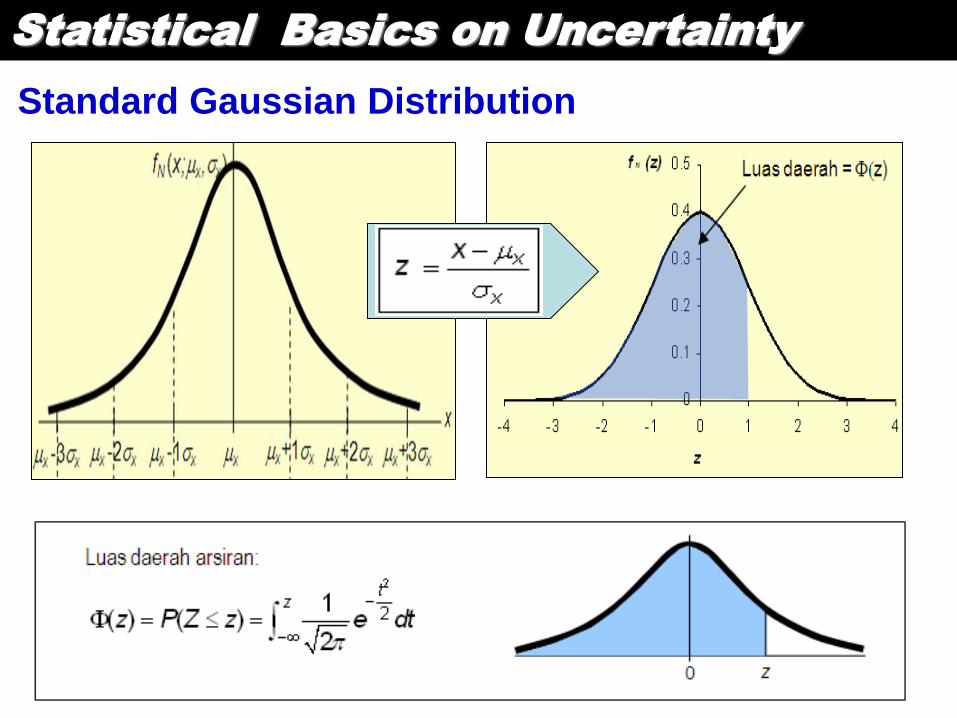
Standard Gaussian Distribution
PART 2
Determining Measurement
Uncertainty
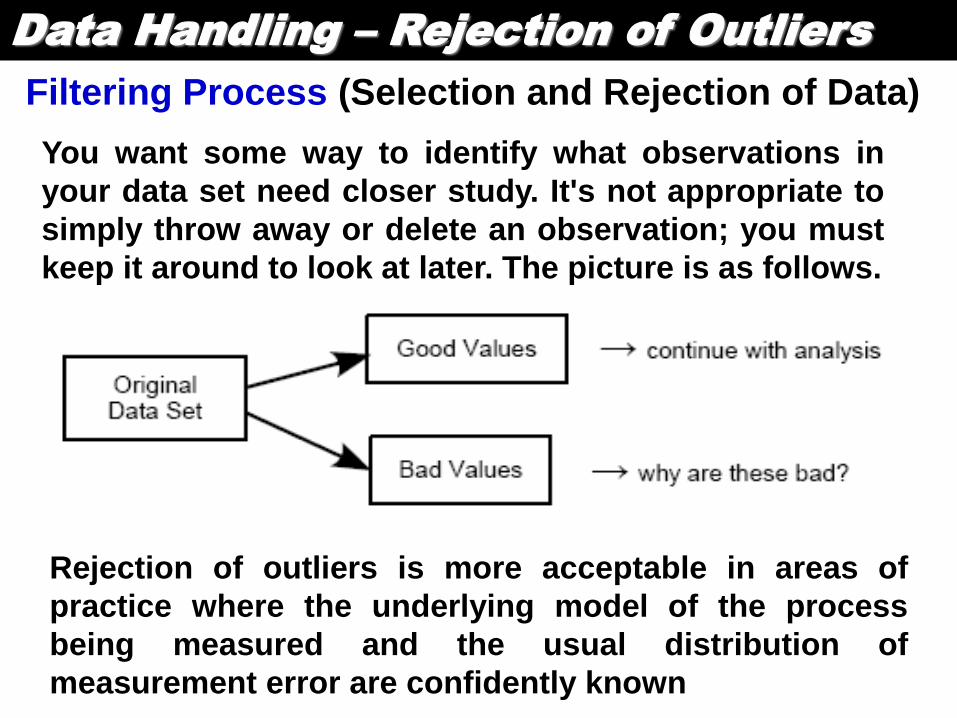
Data Handling – Rejection of Outliers
Rejection of outliers is more acceptable in areas of
practice where the underlying model of the process
being measured and the usual distribution of
measurement error are confidently known
You want some way to identify what observations in
your data set need closer study. It's not appropriate to
simply throw away or delete an observation; you must
keep it around to look at later. The picture is as follows.
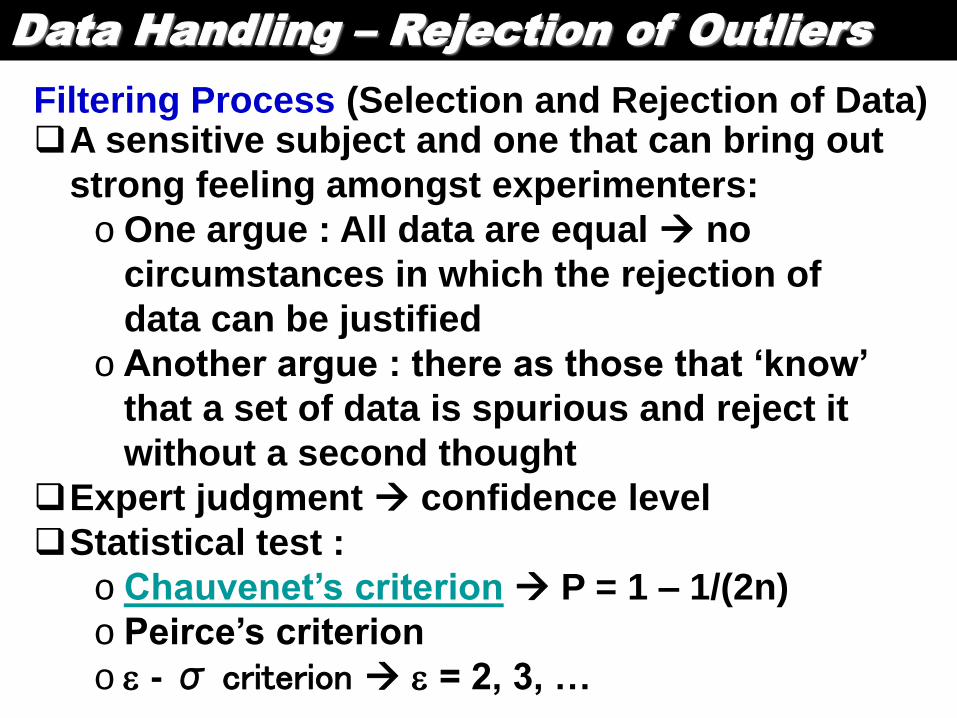
Filtering Process (Selection and Rejection of Data)
Data Handling – Rejection of Outliers
Filtering Process (Selection and Rejection of Data) A sensitive subject and one that can bring out
strong feeling amongst experimenters:
o One argue : All data are equal no
circumstances in which the rejection of
data can be justified
o Another argue : there as those that ‘know’
that a set of data is spurious and reject it
without a second thought
Expert judgment confidence level
Statistical test :
o Chauvenet’s criterion P = 1 – 1/(2n)
o Peirce’s criterion
o - σ criterion = 2, 3, …
Data Handling – Rejection of Outliers
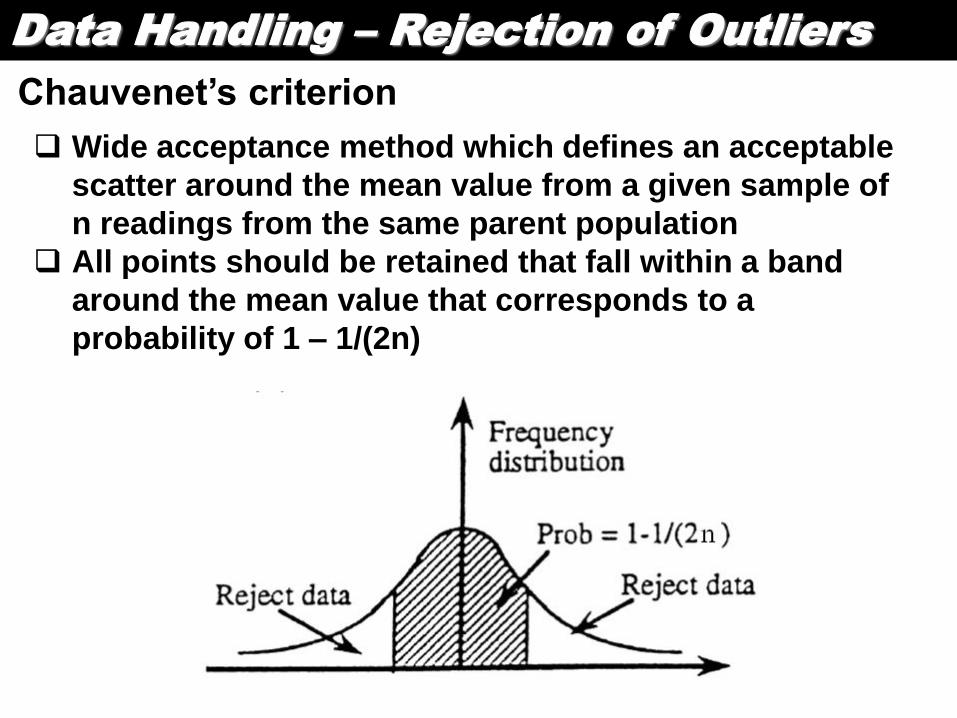
Chauvenet’s criterion
Wide acceptance method which defines an acceptable
scatter around the mean value from a given sample of
n readings from the same parent population
All points should be retained that fall within a band
around the mean value that corresponds to a
probability of 1 – 1/(2n)
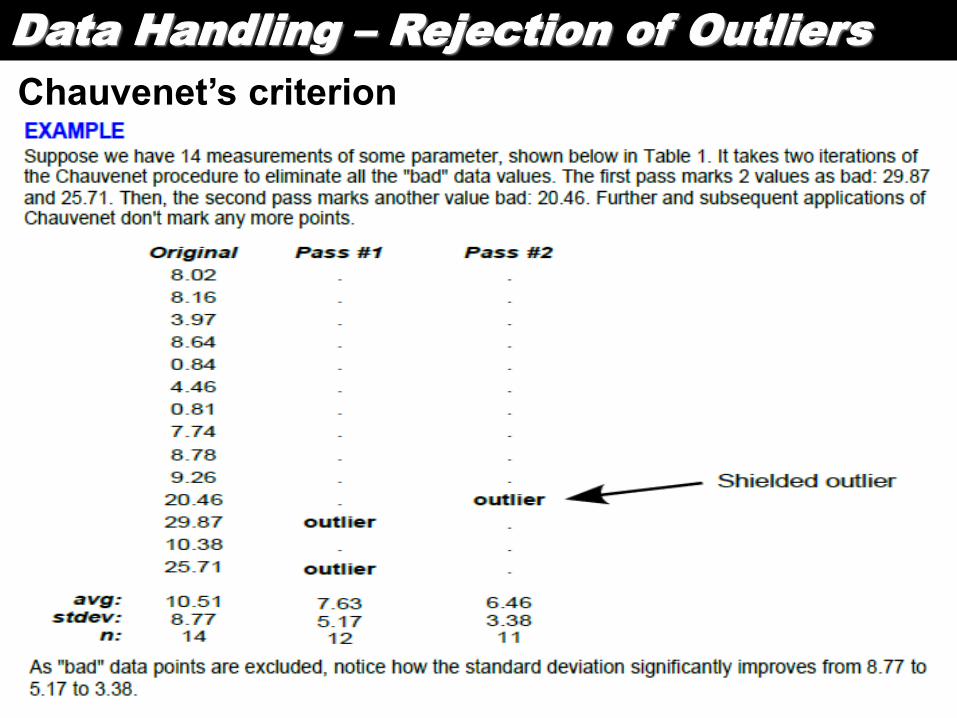
Data Handling – Rejection of Outliers
Chauvenet’s criterion
Dealing with Uncertainty
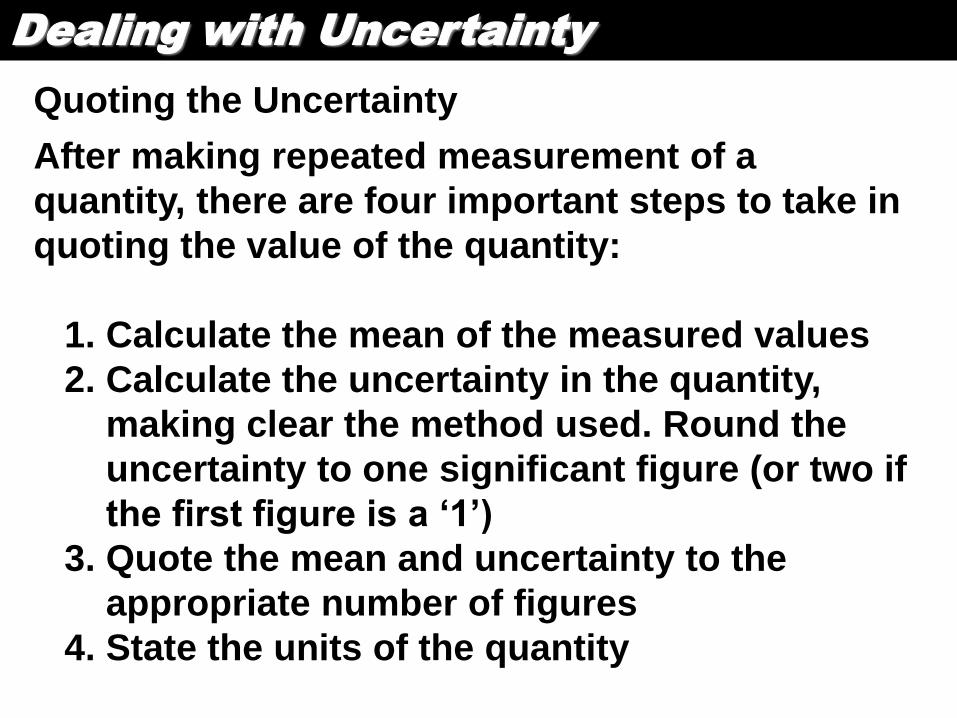
Quoting the Uncertainty
After making repeated measurement of a
quantity, there are four important steps to take in
quoting the value of the quantity:
1. Calculate the mean of the measured values
2. Calculate the uncertainty in the quantity,
making clear the method used. Round the
uncertainty to one significant figure (or two if
the first figure is a ‘1’)
3. Quote the mean and uncertainty to the
appropriate number of figures
4. State the units of the quantity
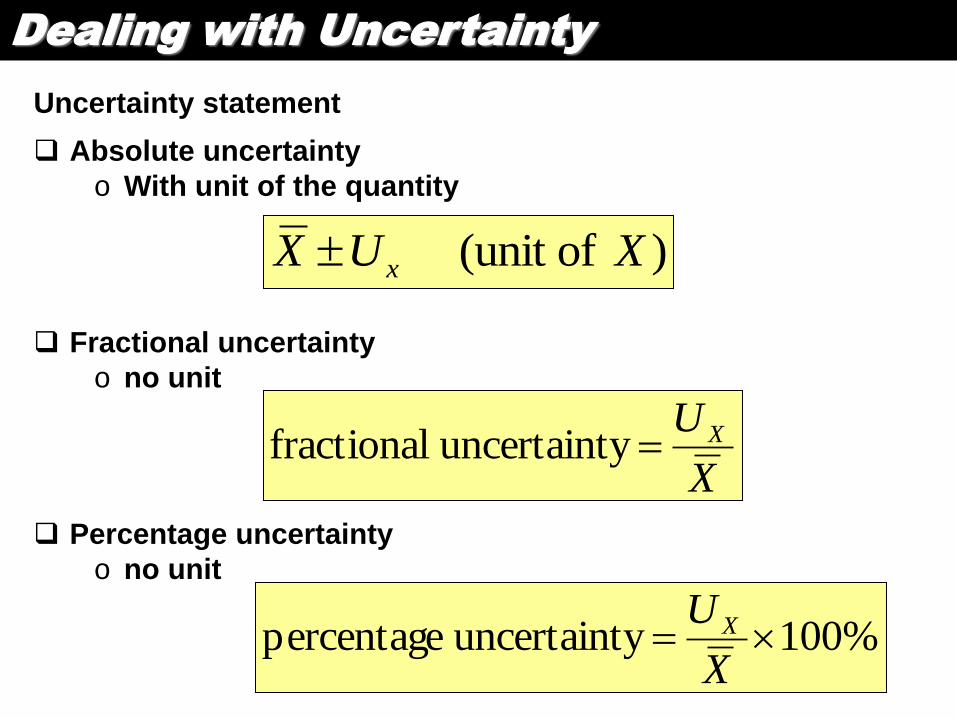
Dealing with Uncertainty
Uncertainty statement
Absolute uncertainty
o With unit of the quantity
) of(unit XUX x
Fractional uncertainty
o no unit
X
U Xy uncertaint fractional
Percentage uncertainty
o no unit
%100y uncertaint percentage X
U X
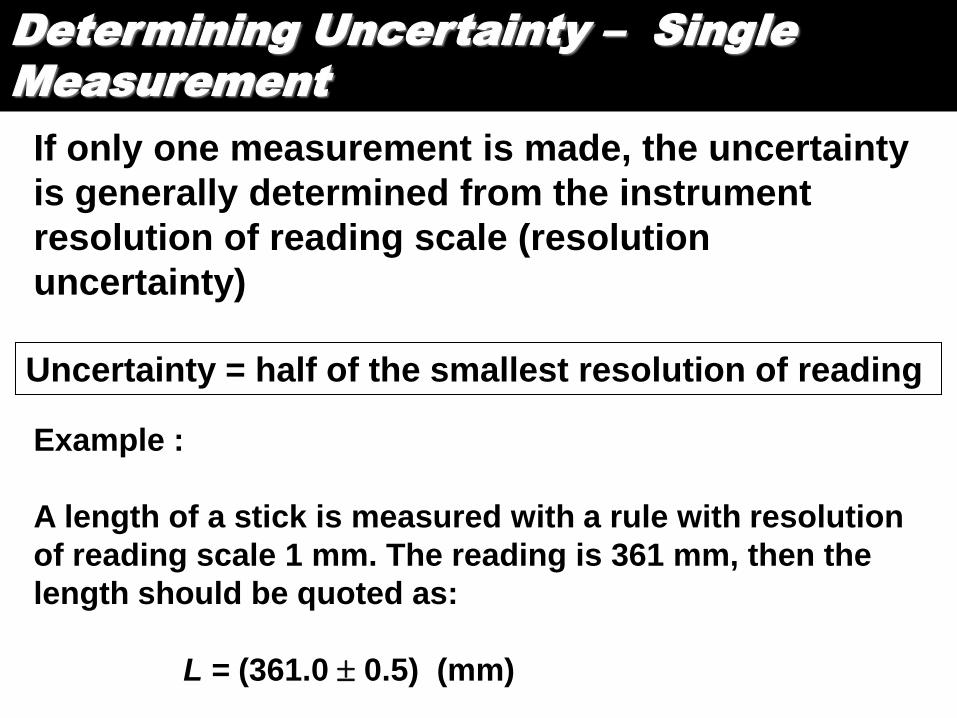
Determining Uncertainty – Single
Measurement
If only one measurement is made, the uncertainty
is generally determined from the instrument
resolution of reading scale (resolution
uncertainty)
Uncertainty = half of the smallest resolution of reading
Example :
A length of a stick is measured with a rule with resolution
of reading scale 1 mm. The reading is 361 mm, then the
length should be quoted as:
L = (361.0 0.5) (mm)
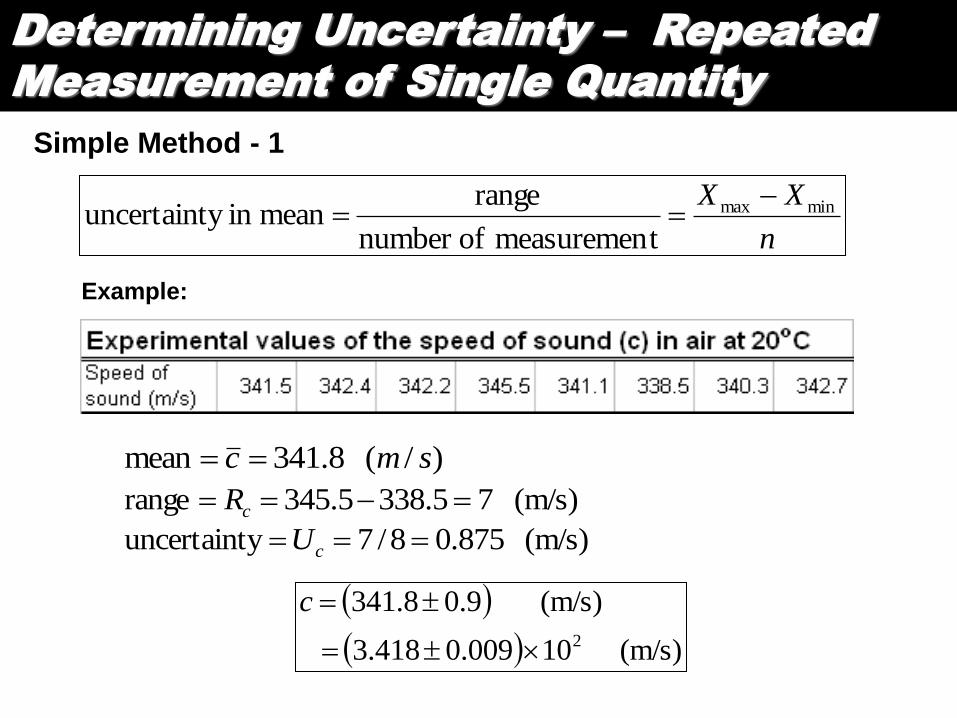
Determining Uncertainty – Repeated
Measurement of Single Quantity
Simple Method - 1
n
XX minmax
tmeasuremen ofnumber
range mean in y uncertaint
Example:
)/( 8.341mean smc
(m/s) 75.3385.345range cR
(m/s) 875.08/7yuncertaint cU
(m/s) 100.0093.418
(m/s) 9.08.341
2
c
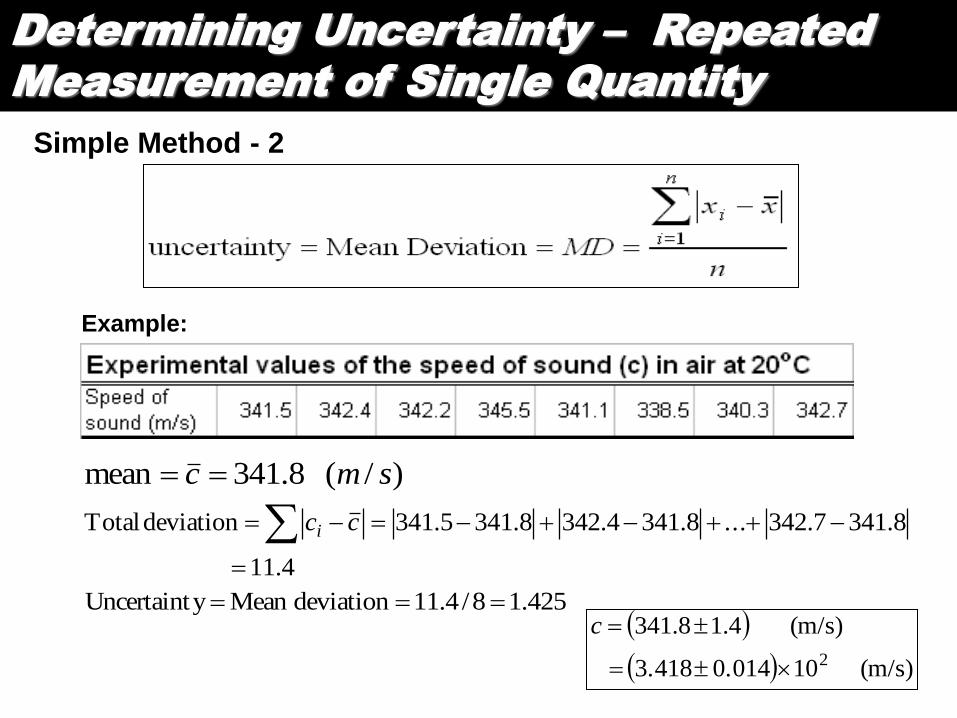
Determining Uncertainty – Repeated
Measurement of Single Quantity
Simple Method - 2
Example:
)/( 8.341mean smc
4.11
8.3417.342...8.3414.3428.3415.341deviation Total
cci
425.18/4.11deviationMean y Uncertaint
(m/s) 100.0143.418
(m/s) 4.18.341
2
c
Determining Uncertainty – Repeated
Measurement of Single Quantity
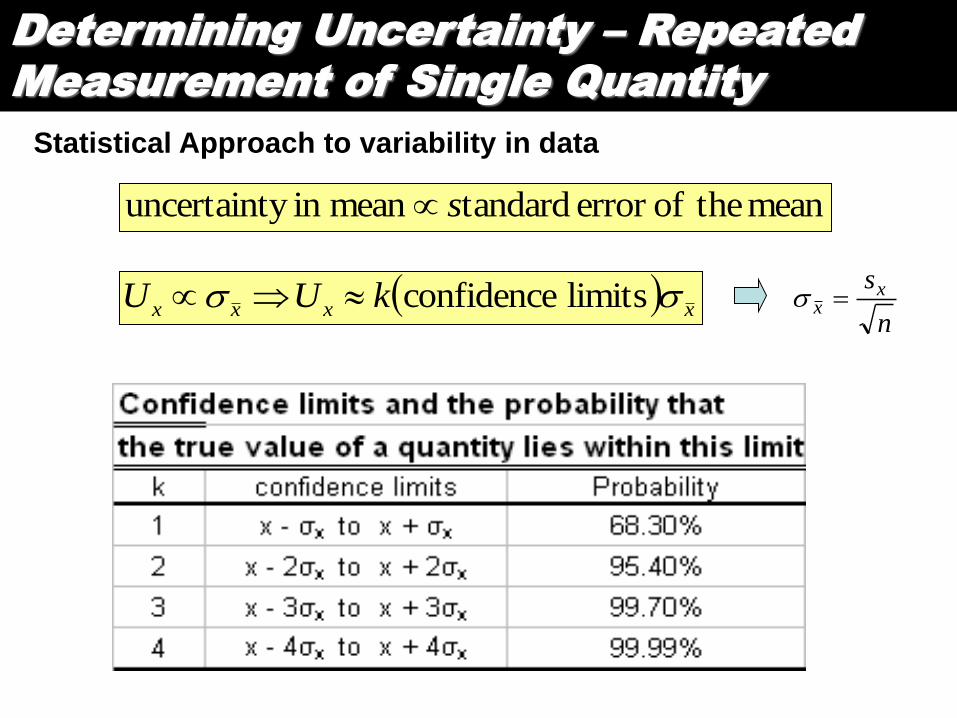
Statistical Approach to variability in data
mean theoferror tandard mean in y uncertaint s
n
sxx xxxx kUU limits confidence
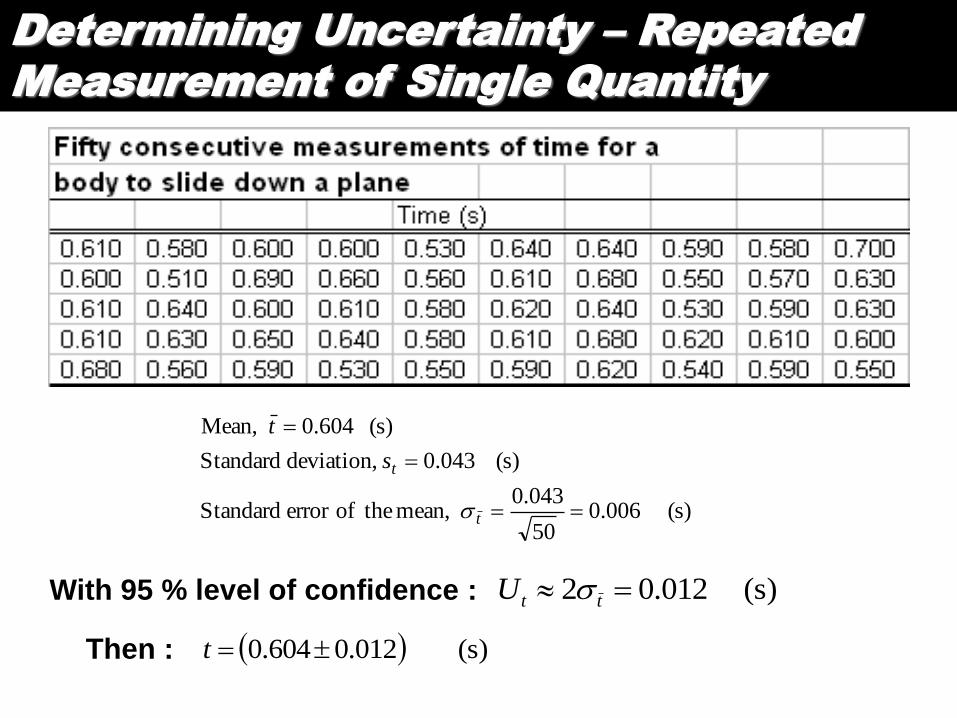
Determining Uncertainty – Repeated
Measurement of Single Quantity
(s) 006.050
043.0 mean, theoferror Standard
(s) 043.0 deviation, Standard
(s) 604.0 Mean,
t
ts
t
With 95 % level of confidence : (s) 012.02 ttU
Then : (s) 012.0604.0 t
Combining Uncertainty – Uncertainty
Propagation
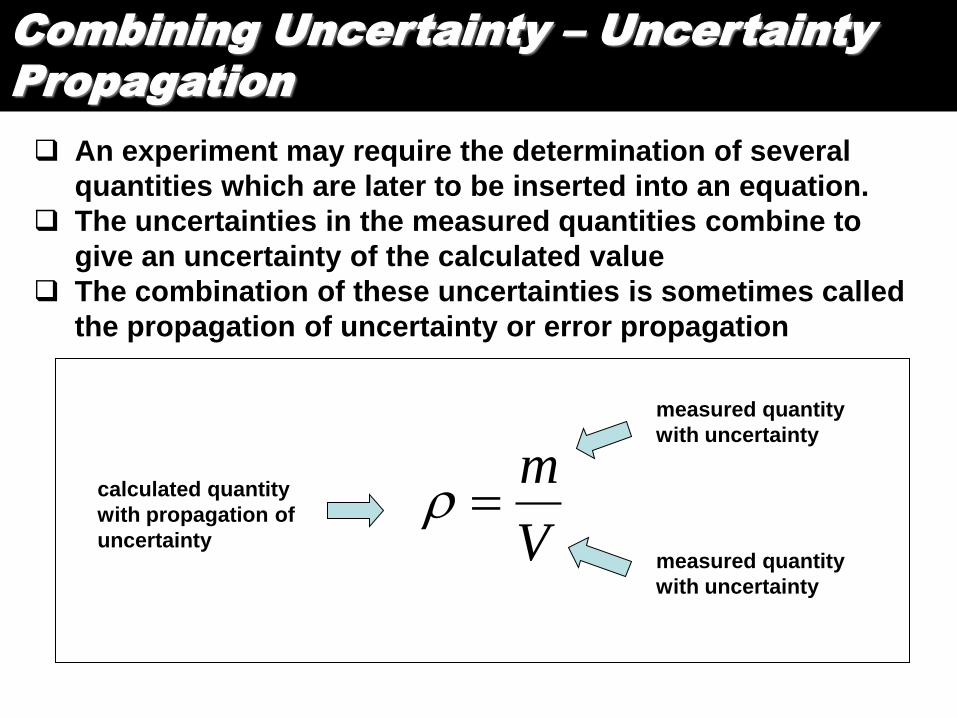
An experiment may require the determination of several
quantities which are later to be inserted into an equation.
The uncertainties in the measured quantities combine to
give an uncertainty of the calculated value
The combination of these uncertainties is sometimes called
the propagation of uncertainty or error propagation
V
m
measured quantity
with uncertainty
measured quantity
with uncertainty
calculated quantity
with propagation of
uncertainty
Combining Uncertainty – Simple Method
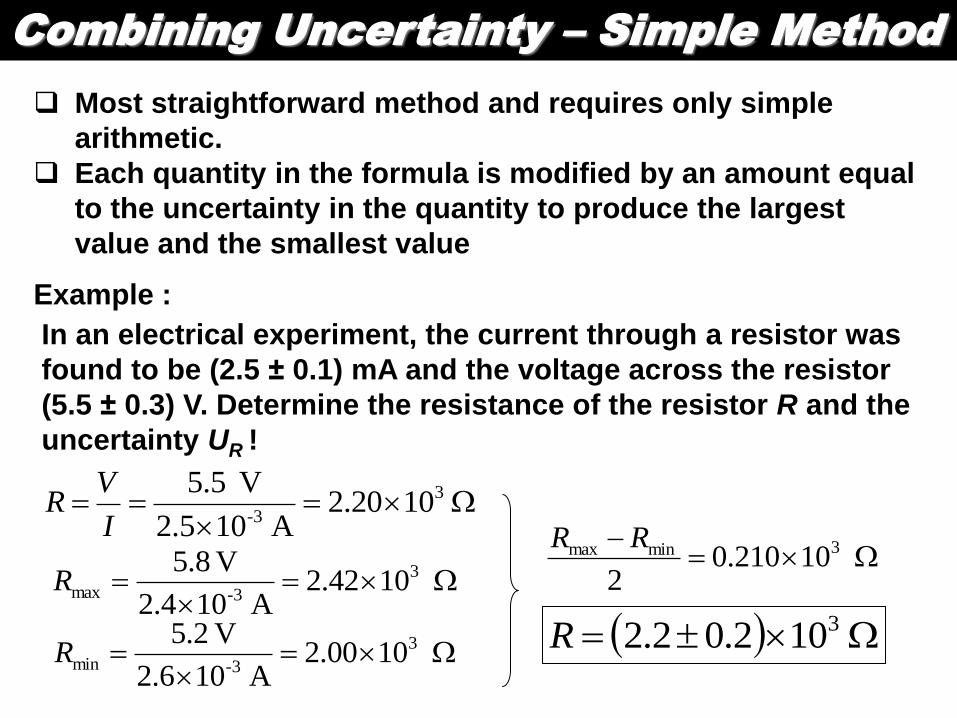
Most straightforward method and requires only simple
arithmetic.
Each quantity in the formula is modified by an amount equal
to the uncertainty in the quantity to produce the largest
value and the smallest value
Example :
In an electrical experiment, the current through a resistor was
found to be (2.5 ± 0.1) mA and the voltage across the resistor
(5.5 ± 0.3) V. Determine the resistance of the resistor R and the
uncertainty UR !
1020.2A 102.5
V 5.5 3
3-I
VR
1042.2A 102.4
V 8.5 3
3-maxR
1000.2A 102.6
V 2.5 3
3-minR
10210.02
3minmax RR
102.02.2 3R
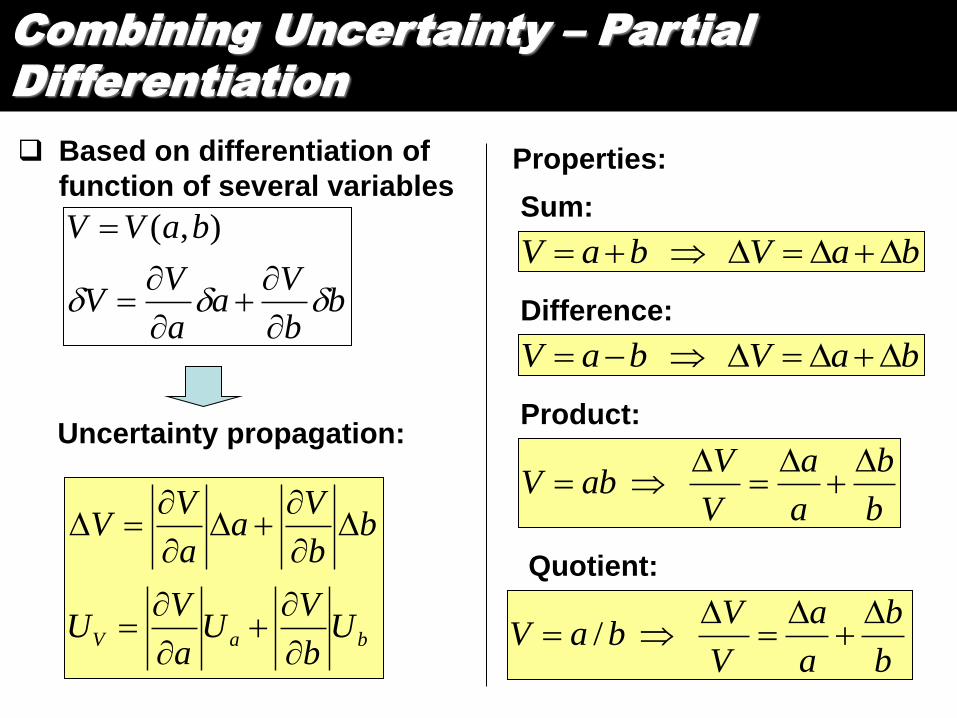
Combining Uncertainty – Partial
Differentiation
Based on differentiation of
function of several variables
bb
Va
a
VV
baVV
),(
baV Ub
VU
a
VU
bb
Va
a
VV
Uncertainty propagation:
Properties:
baVbaV
baVbaV
b
b
a
a
V
VabV
b
b
a
a
V
VbaV
/
Sum:
Difference:
Product:
Quotient:
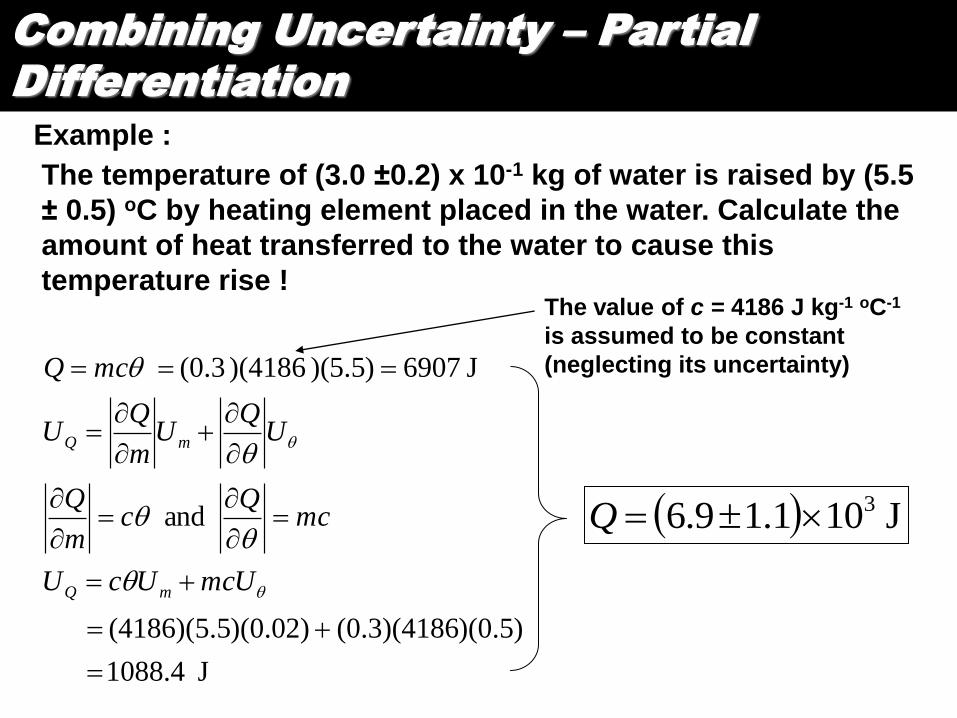
Combining Uncertainty – Partial
Differentiation
Example :
The temperature of (3.0 ±0.2) x 10-1 kg of water is raised by (5.5
± 0.5) oC by heating element placed in the water. Calculate the
amount of heat transferred to the water to cause this
temperature rise !
J 1088.4
)(0.5)(0.3)(4186 )(0.02)(4186)(5.5
and
J 6907)5.5)( )(4186 (0.3
mcUUcU
mcQ
cm
Q
UQ
Um
QU
mcQ
mQ
mQ
The value of c = 4186 J kg-1 oC-1
is assumed to be constant
(neglecting its uncertainty)
J 101.19.6 3Q
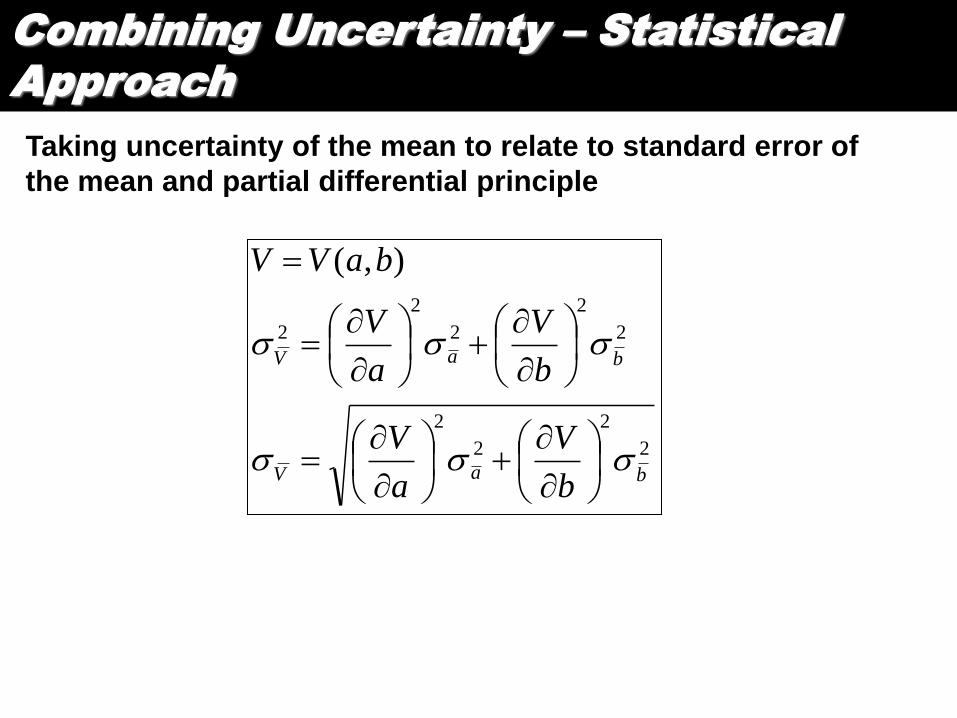
Combining Uncertainty – Statistical
Approach
2
2
2
2
2
2
2
2
2
),(
baV
baV
b
V
a
V
b
V
a
V
baVV
Taking uncertainty of the mean to relate to standard error of
the mean and partial differential principle
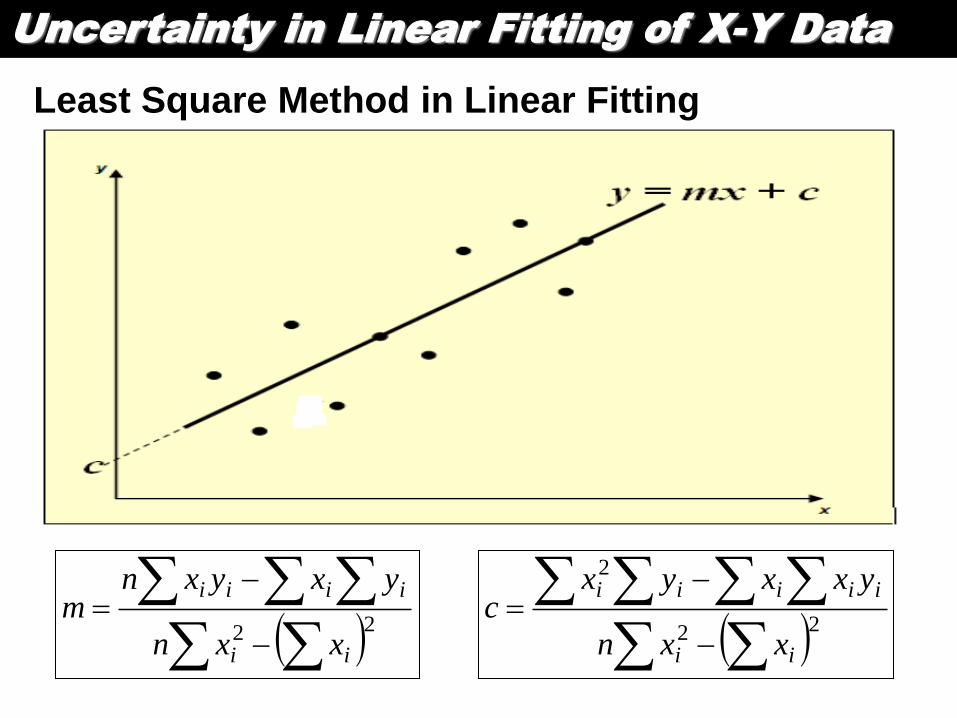
Uncertainty in Linear Fitting of X-Y Data
Least Square Method in Linear Fitting
22ii
iiii
xxn
yxyxnm
22
2
ii
iiiii
xxn
yxxyxc
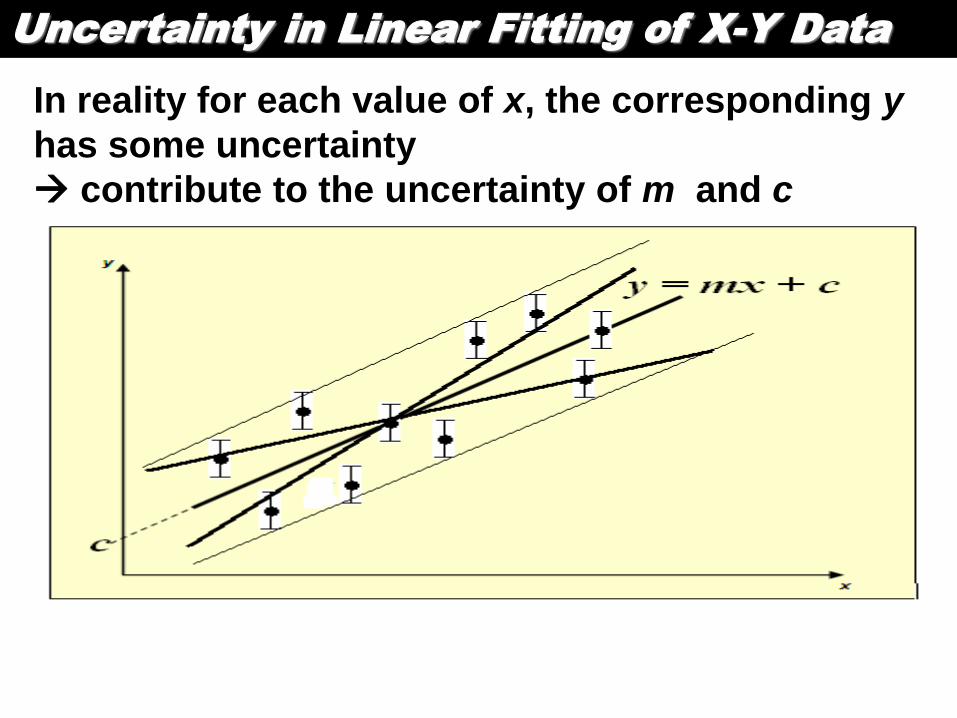
Uncertainty in Linear Fitting of X-Y Data
In reality for each value of x, the corresponding y
has some uncertainty
contribute to the uncertainty of m and c
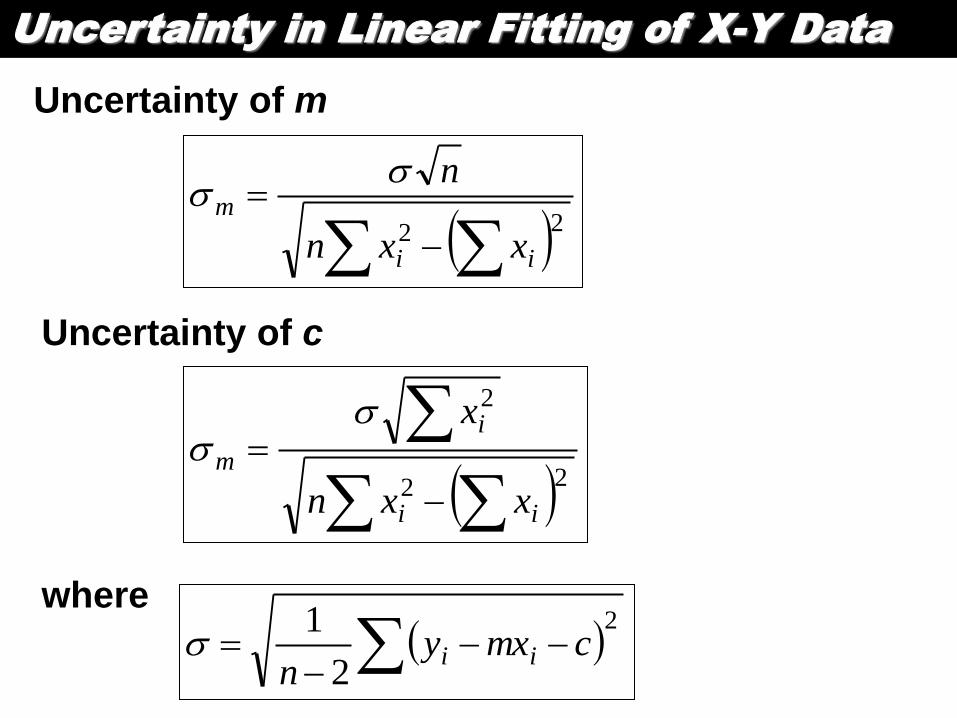
Uncertainty in Linear Fitting of X-Y Data
Uncertainty of m
22
ii
m
xxn
n
Uncertainty of c
22
2
ii
i
m
xxn
x
where
2
2
1
cmxy
nii
PART 3
More on Measurement
Uncertainty
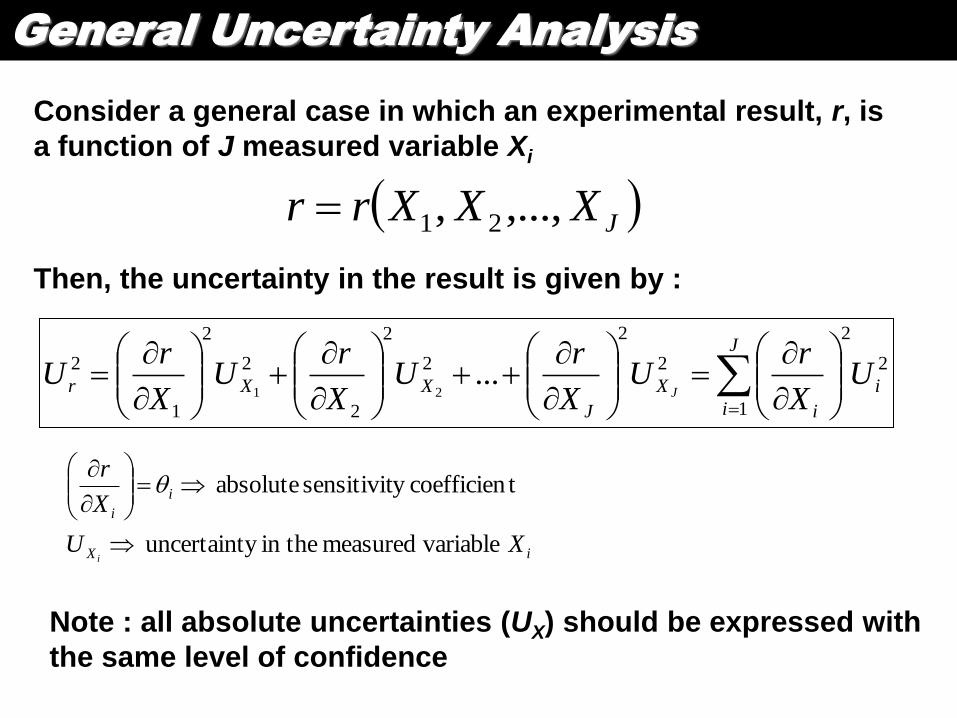
General Uncertainty Analysis
Consider a general case in which an experimental result, r, is
a function of J measured variable Xi
JXXXrr ,...,, 21
Then, the uncertainty in the result is given by :
2
1
2
2
2
2
2
2
2
2
1
2 ...21 i
J
i i
X
J
XXr UX
rU
X
rU
X
rU
X
rU
J
iX
i
i
XU
X
r
i variablemeasured in they uncertaint
tcoefficieny sensitivit absolute
Note : all absolute uncertainties (UX) should be expressed with
the same level of confidence
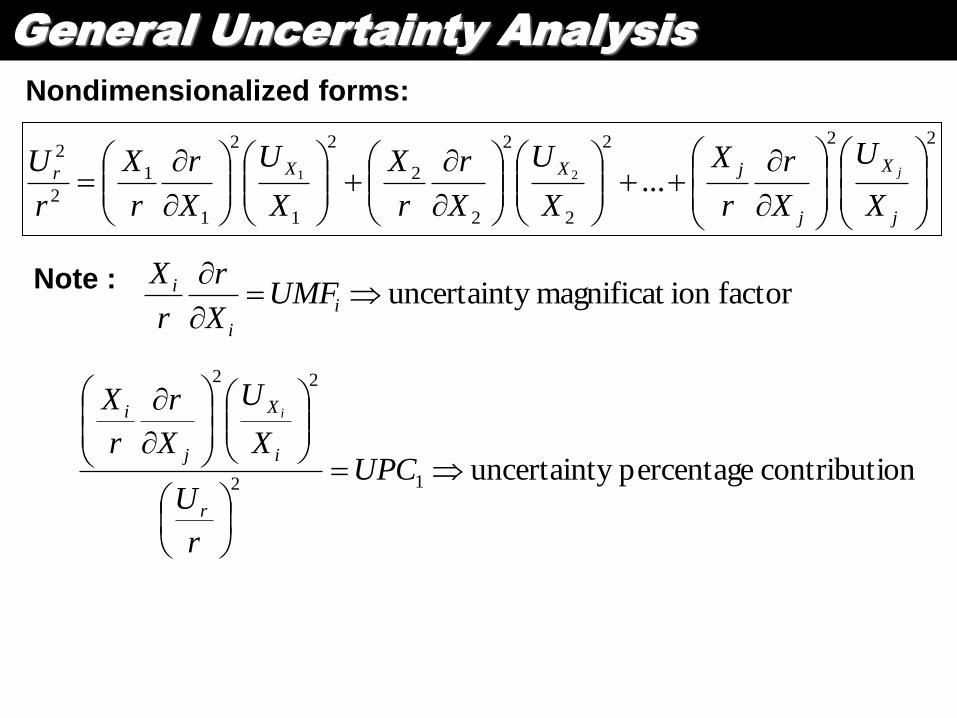
General Uncertainty Analysis
Nondimensionalized forms:
222
2
2
2
2
2
1
2
1
1
2
2
...21
j
X
j
jXXr
X
U
X
r
r
X
X
U
X
r
r
X
X
U
X
r
r
X
r
U j
Note : factorion magnificaty uncertaint
i
i
i UMFX
r
r
X
oncontributi percentagey uncertaint12
22
UPC
r
U
X
U
X
r
r
X
r
i
X
j
i i
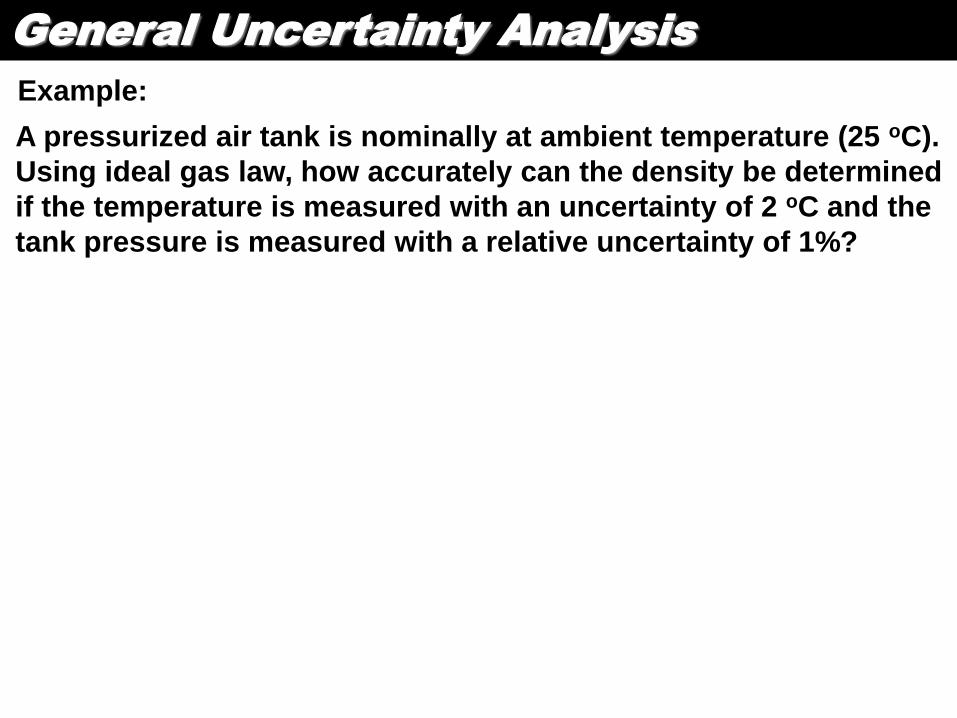
General Uncertainty Analysis
Example:
A pressurized air tank is nominally at ambient temperature (25 oC).
Using ideal gas law, how accurately can the density be determined
if the temperature is measured with an uncertainty of 2 oC and the
tank pressure is measured with a relative uncertainty of 1%?
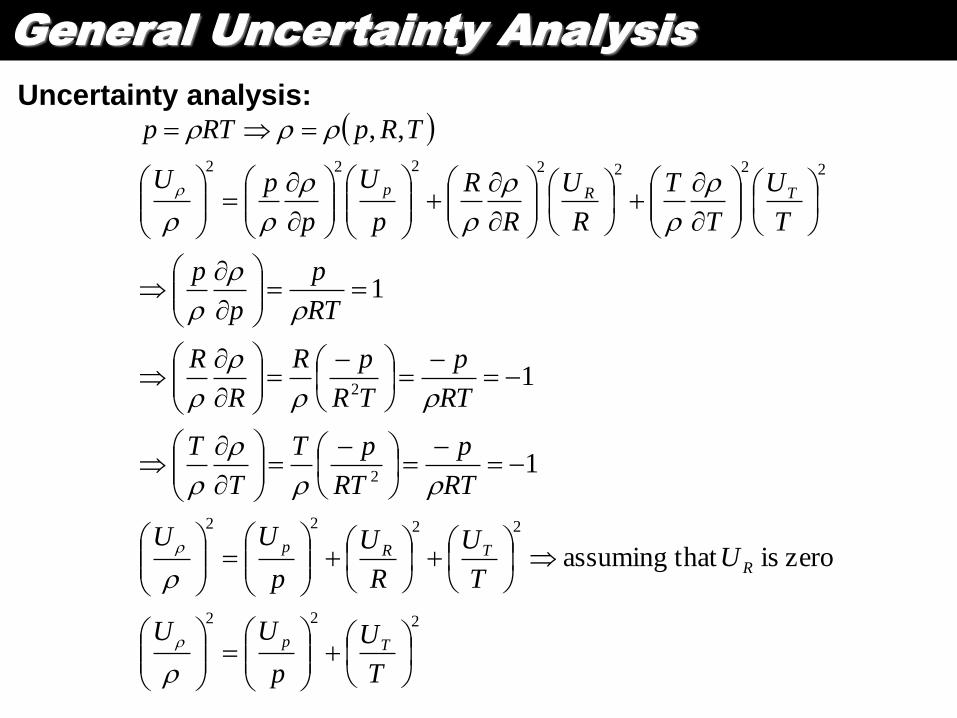
General Uncertainty Analysis
Uncertainty analysis:
222
2222
2
2
2222222
zero is that assuming
1
1
1
,,
T
U
p
UU
UT
U
R
U
p
UU
RT
p
RT
pT
T
T
RT
p
TR
pR
R
R
RT
p
p
p
T
U
T
T
R
U
R
R
p
U
p
pU
TRpRTp
Tp
RTRp
TRp
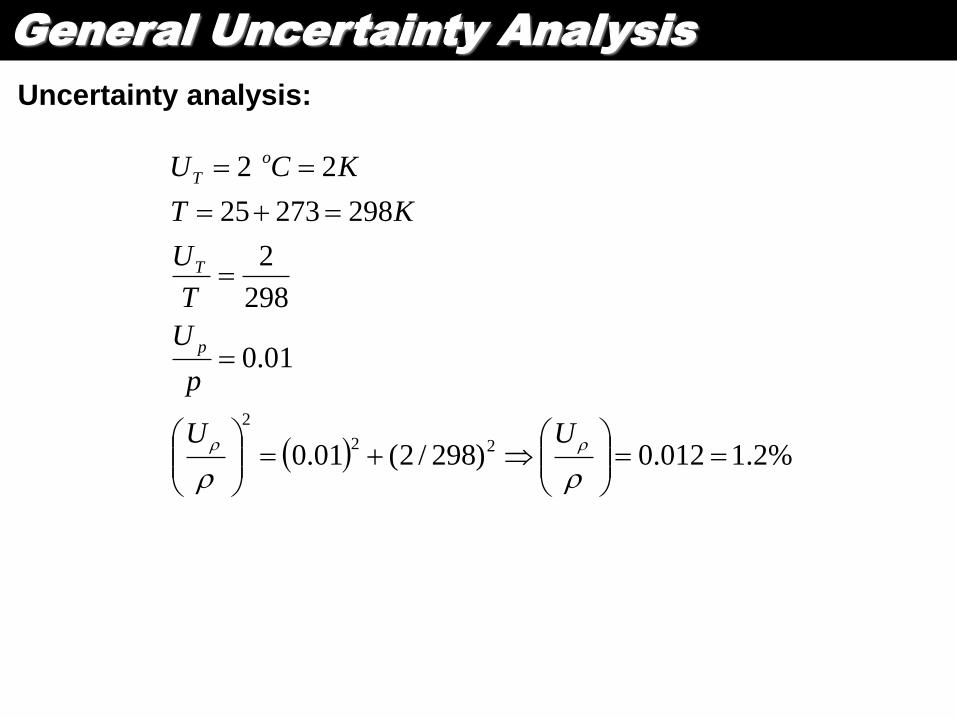
General Uncertainty Analysis
Uncertainty analysis:
%2.1012.0)298/2(01.0
01.0
298
2
29827325
2 2
22
2
UU
p
U
T
U
KT
KCU
p
T
o
T
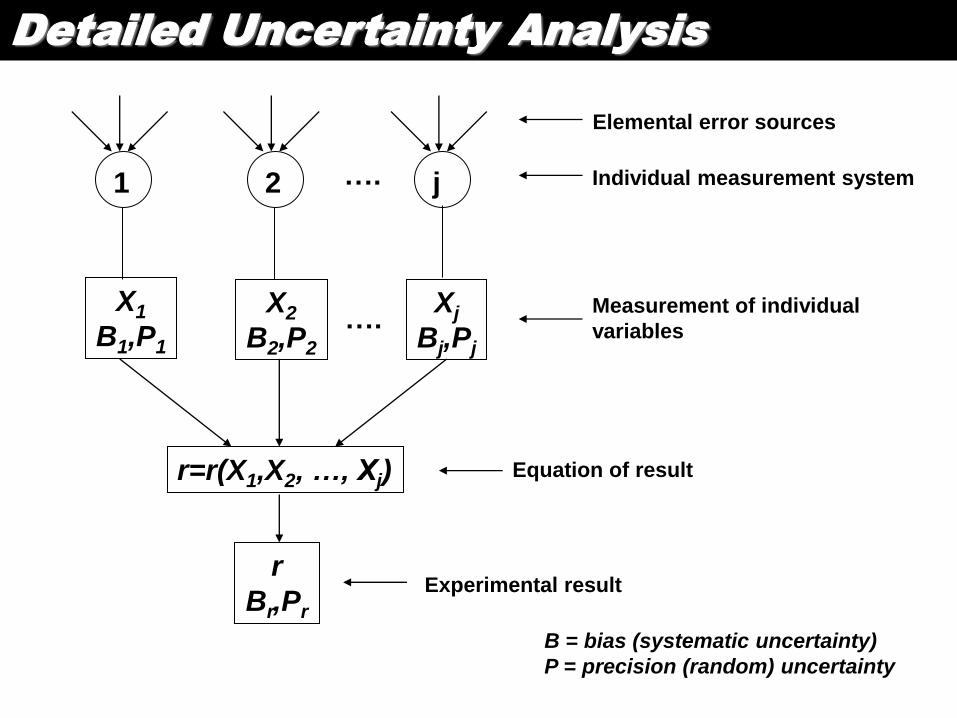
Detailed Uncertainty Analysis
X1
B1,P1 X2
B2,P2
Xj
Bj,Pj
1 2 j ….
….
r=r(X1,X2, …, Xj)
r
Br,Pr
Elemental error sources
Individual measurement system
Measurement of individual
variables
Equation of result
Experimental result
B = bias (systematic uncertainty)
P = precision (random) uncertainty
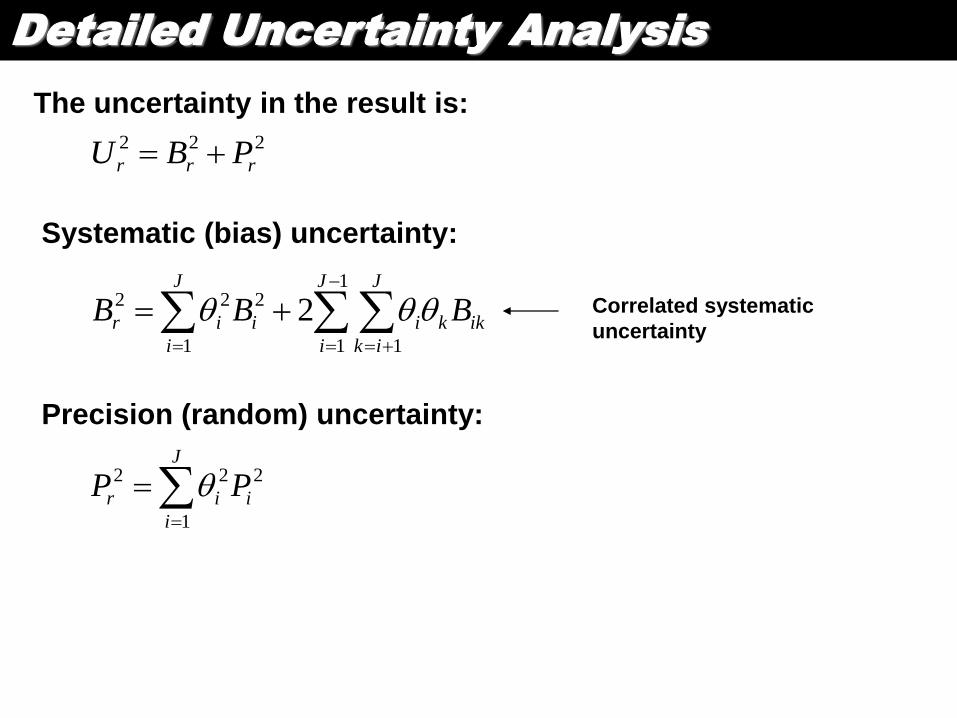
Detailed Uncertainty Analysis
The uncertainty in the result is:
222
rrr PBU
Systematic (bias) uncertainty:
1
1 11
222 2J
i
J
ik
ikki
J
i
iir BBB
J
i
iir PP1
222
Precision (random) uncertainty:
Correlated systematic
uncertainty
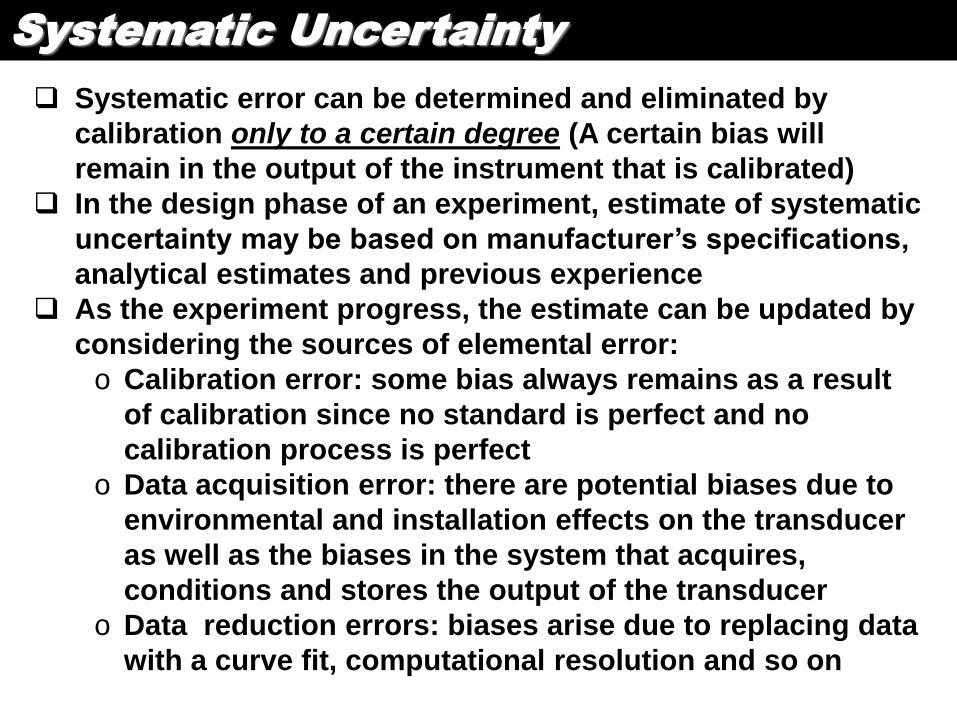
Systematic Uncertainty
Systematic error can be determined and eliminated by
calibration only to a certain degree (A certain bias will
remain in the output of the instrument that is calibrated)
In the design phase of an experiment, estimate of systematic
uncertainty may be based on manufacturer’s specifications,
analytical estimates and previous experience
As the experiment progress, the estimate can be updated by
considering the sources of elemental error:
o Calibration error: some bias always remains as a result
of calibration since no standard is perfect and no
calibration process is perfect
o Data acquisition error: there are potential biases due to
environmental and installation effects on the transducer
as well as the biases in the system that acquires,
conditions and stores the output of the transducer
o Data reduction errors: biases arise due to replacing data
with a curve fit, computational resolution and so on
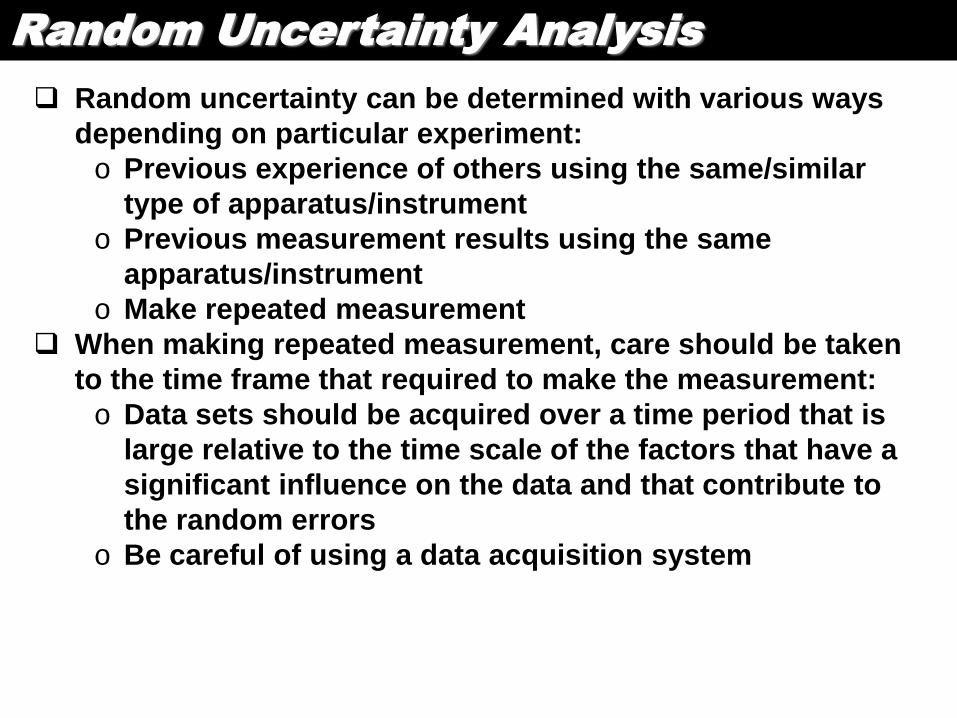
Random Uncertainty Analysis
Random uncertainty can be determined with various ways
depending on particular experiment:
o Previous experience of others using the same/similar
type of apparatus/instrument
o Previous measurement results using the same
apparatus/instrument
o Make repeated measurement
When making repeated measurement, care should be taken
to the time frame that required to make the measurement:
o Data sets should be acquired over a time period that is
large relative to the time scale of the factors that have a
significant influence on the data and that contribute to
the random errors
o Be careful of using a data acquisition system
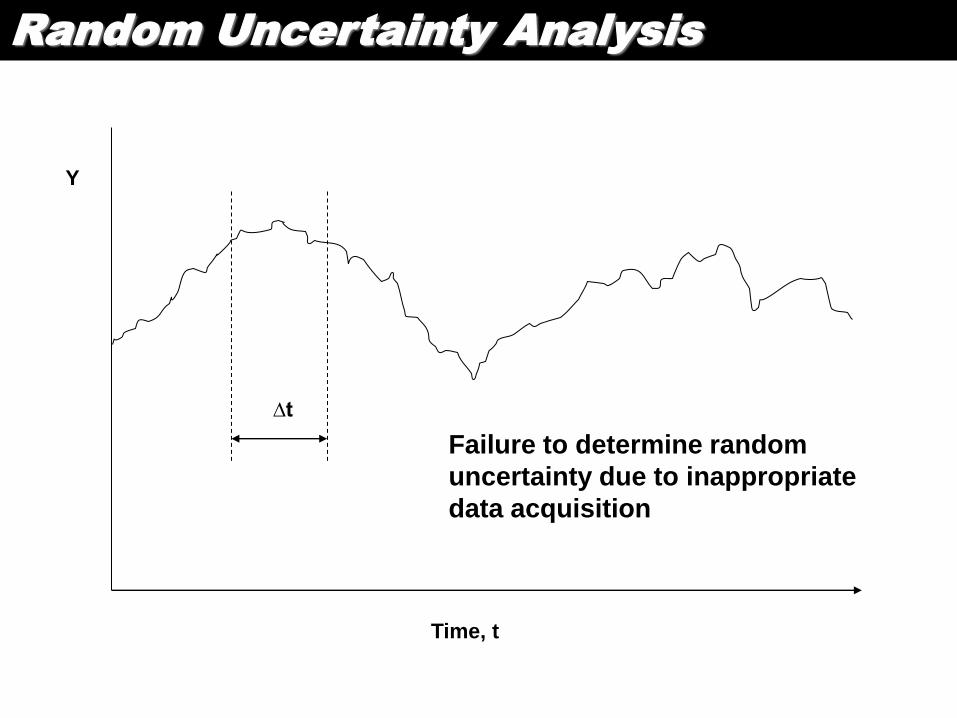
Random Uncertainty Analysis
∆t
Time, t
Y
Failure to determine random
uncertainty due to inappropriate
data acquisition
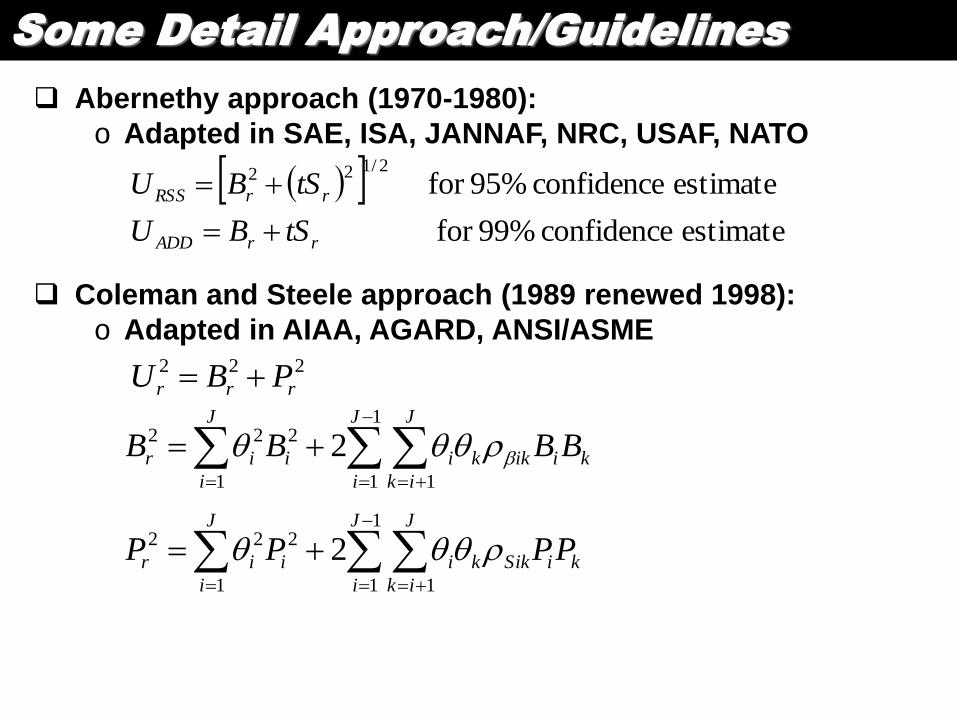
Some Detail Approach/Guidelines
Abernethy approach (1970-1980):
o Adapted in SAE, ISA, JANNAF, NRC, USAF, NATO
estimate confidence 99%for
estimate confidence 95%for 2/122
rrADD
rrRSS
tSBU
tSBU
Coleman and Steele approach (1989 renewed 1998):
o Adapted in AIAA, AGARD, ANSI/ASME 222
rrr PBU
1
1 11
222 2J
i
J
ik
kiikki
J
i
iir BBBB
1
1 11
222 2J
i
J
ik
kiSikki
J
i
iir PPPP
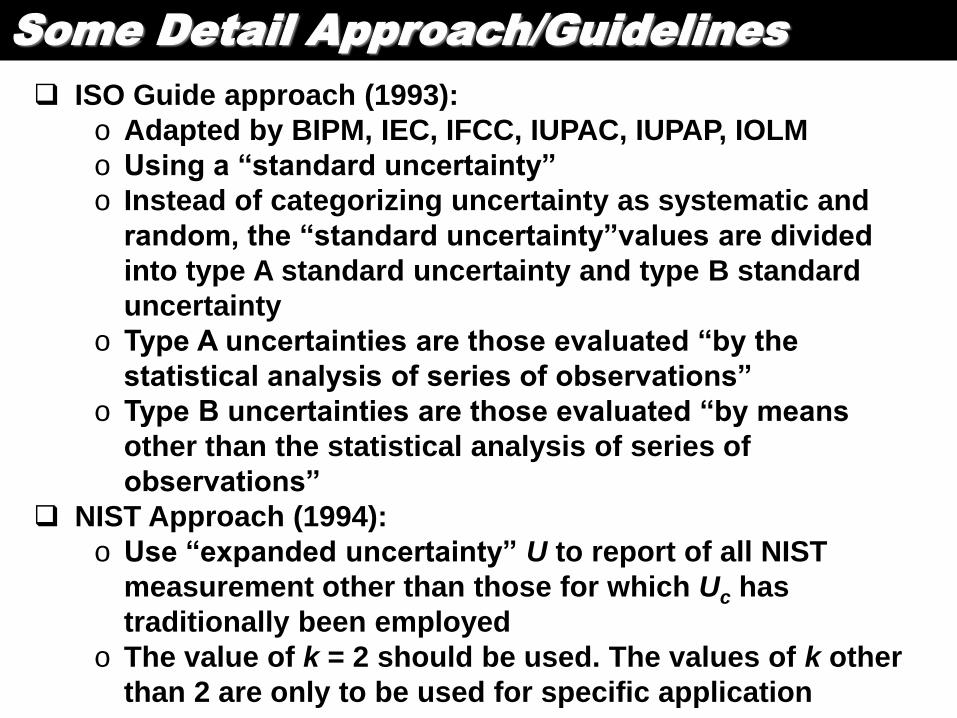
Some Detail Approach/Guidelines
ISO Guide approach (1993):
o Adapted by BIPM, IEC, IFCC, IUPAC, IUPAP, IOLM
o Using a “standard uncertainty”
o Instead of categorizing uncertainty as systematic and
random, the “standard uncertainty”values are divided
into type A standard uncertainty and type B standard
uncertainty
o Type A uncertainties are those evaluated “by the
statistical analysis of series of observations”
o Type B uncertainties are those evaluated “by means
other than the statistical analysis of series of
observations”
NIST Approach (1994):
o Use “expanded uncertainty” U to report of all NIST
measurement other than those for which Uc has
traditionally been employed
o The value of k = 2 should be used. The values of k other
than 2 are only to be used for specific application
References
[1] Montgomery, D.C., & Runger, G.C, Applied Statistics and Probability for Engineers 3rd
Ed., John Wiley and Sons, Inc., New York, (2003)
[2] Harinaldi, Prinsip-prinsip Statistik Untuk Teknik dan Sains, Erlangga, (2005)
[3] Kirkup, L, Experimental Method: An Introduction to the Analysis and Presentation of
Data, John Wiley and Sons, Australia, Ltd., Queensland, (1994)
[4] Coleman, H.W and Steele, W.G., Experimentation and Uncertainty Analysis for Engineer
2nd Ed., John Wiley and Sons, Inc., New York, (1999)
[5] Doebelin, E.O, Engineering Experimentation, Planning Execution, Reporting, McGraw-
Hill Book Co., New York, (1995)
Related Documents