© 2014 Nature America, Inc. All rights reserved. NATURE BIOTECHNOLOGY ADVANCE ONLINE PUBLICATION RESOURCE An integrated catalog of reference genes in the human gut microbiome Junhua Li 1–3,19 , Huijue Jia 1,19 , Xianghang Cai 1,19 , Huanzi Zhong 1,19 , Qiang Feng 1,4,19 , Shinichi Sunagawa 5 , Manimozhiyan Arumugam 1,5,6 , Jens Roat Kultima 5 , Edi Prifti 7 , Trine Nielsen 6 , Agnieszka Sierakowska Juncker 8 , Chaysavanh Manichanh 9 , Bing Chen 1 , Wenwei Zhang 1 , Florence Levenez 7 , Juan Wang 1 , Xun Xu 1 , Liang Xiao 1 , Suisha Liang 1 , Dongya Zhang 1 , Zhaoxi Zhang 1 , Weineng Chen 1 , Hailong Zhao 1 , Jumana Yousuf Al-Aama 10,11 , Sherif Edris 11,12 , Huanming Yang 1,11,13 , Jian Wang 1,13 , Torben Hansen 6 , Henrik Bjørn Nielsen 8 , Søren Brunak 8 , Karsten Kristiansen 4 , Francisco Guarner 9 , Oluf Pedersen 6 , Joel Doré 7,14 , S Dusko Ehrlich 7,15 , MetaHIT Consortium 16 , Peer Bork 5,17 & Jun Wang 1,4,6,11,18 1 BGI-Shenzhen, Shenzhen, China. 2 BGI Hong Kong Research Institute, Hong Kong, China. 3 School of Bioscience and Biotechnology, South China University of Technology, Guangzhou, China. 4 Department of Biology, University of Copenhagen, Copenhagen, Denmark. 5 European Molecular Biology Laboratory, Heidelberg, Germany. 6 The Novo Nordisk Foundation Center for Basic Metabolic Research, Faculty of Health and Medical Sciences, University of Copenhagen, Copenhagen, Denmark. 7 INRA, Institut National de la Recherche Agronomique, Metagenopolis, Jouy en Josas, France. 8 Center for Biological Sequence Analysis, Technical University of Denmark, Kongens Lyngby, Denmark. 9 Digestive System Research Unit, University Hospital Vall d’Hebron, Ciberehd, Barcelona, Spain. 10 Department of Genetic Medicine, Faculty of Medicine, King Abdulaziz University (KAU), Jeddah, Saudi Arabia. 11 Princess Al-Jawhara AlBrahim Centre of Excellence in Research of Hereditary Disorders (PACER-HD), Faculty of Medicine, KAU, Jeddah, Saudi Arabia. 12 Department of Biological Sciences, Faculty of Science, King Abdulaziz University (KAU), Jeddah, Saudi Arabia. 13 James D. Watson Institute of Genome Science, Hangzhou, China. 14 INRA, Institut National de la Recherche Agronomique, Unité mixte de Recherche 14121 Microbiologie de l’Alimentation au Service de la Santé, Jouy en Josas, France. 15 Centre for Host-Microbiome Interactions, Dental Institute Central Office, King’s College London, Guy’s Hospital, London Bridge, UK. 16 A full list of additional members and affiliations appears at the end of the paper. 17 Max Delbrück Centre for Molecular Medicine, Berlin, Germany. 18 Macau University of Science and Technology, Macau, China. 19 These authors contributed equally to this work. Correspondence should be addressed to Jun W. ([email protected]) or P.B. ([email protected]). Many analyses of the human gut microbiome depend on a catalog of reference genes. Existing catalogs for the human gut microbiome are based on samples from single cohorts or on reference genomes or protein sequences, which limits coverage of global microbiome diversity. Here we combined 249 newly sequenced samples of the Metagenomics of the Human Intestinal Tract (MetaHit) project with 1,018 previously sequenced samples to create a cohort from three continents that is at least threefold larger than cohorts used for previous gene catalogs. From this we established the integrated gene catalog (IGC) comprising 9,879,896 genes. The catalog includes close-to-complete sets of genes for most gut microbes, which are also of considerably higher quality than in previous catalogs. Analyses of a group of samples from Chinese and Danish individuals using the catalog revealed country-specific gut microbial signatures. This expanded catalog should facilitate quantitative characterization of metagenomic, metatranscriptomic and metaproteomic data from the gut microbiome to understand its variation across populations in human health and disease. The ensemble of microorganisms in our gut, referred to as the human gut microbiota, is known to be important for human physiol- ogy and disease in the gut and beyond 1 . However, our knowledge of the genetic and functional diversity in gut microbes is far from complete. Increasing numbers of fecal samples are being analyzed by targeted 16S rRNA gene pyrosequencing and to a lesser extent by metagenomic shotgun sequencing, because of the higher costs and more complex data analysis associated with the latter. Metagenomic assembly of short sequencing reads enables functional insights and is a more convenient and unbiased way of obtaining genomic infor- mation for environmental microbes, compared to culture-based or single-cell methods. However, data from different studies are scat- tered (most notably in the MetaHIT 2 and the Human Microbiome Project (HMP) 3 gene catalogs), and there has been no comprehensive and uniformly processed database that can represent the human gut microbiota around the world. With the increasing amount of sequenc- ing data, it is also not clear at what pace the number of species and genes discovered in the gut microbiome will continue to grow, and to what extent our current sampling and data analyses capture common and rare entities in the gut microbiota. Catalogs of reference genes in the human gut microbiome are cru- cial for functional metagenomic analyses 2 . Sequencing reads can be mapped to the catalog to profile the species and gene content of a sample; genes with co-varying abundance levels can be clustered to reveal disease markers in metagenome-wide association studies 4–7 ; analyses of gene content might guide isolation of strains from fecal samples and document the strains’ genomic information in the origi- nal habitat before possible changes during cultivation; and as meta- transcriptomics 8,9 and metaproteomics 10 become more common, a gene catalog would greatly facilitate analyses of RNA or protein data. Received 1 April; accepted 3 June; published online 6 July 2014; doi:10.1038/nbt.2942

Welcome message from author
This document is posted to help you gain knowledge. Please leave a comment to let me know what you think about it! Share it to your friends and learn new things together.
Transcript
©20
14 N
atu
re A
mer
ica,
Inc.
All
rig
hts
res
erve
d.
nature biotechnology advance online publication �
r e s o u r c e
An integrated catalog of reference genes in the human gut microbiomeJunhua Li1–3,19, Huijue Jia1,19, Xianghang Cai1,19, Huanzi Zhong1,19, Qiang Feng1,4,19, Shinichi Sunagawa5, Manimozhiyan Arumugam1,5,6, Jens Roat Kultima5, Edi Prifti7, Trine Nielsen6, Agnieszka Sierakowska Juncker8, Chaysavanh Manichanh9, Bing Chen1, Wenwei Zhang1, Florence Levenez7, Juan Wang1, Xun Xu1, Liang Xiao1, Suisha Liang1, Dongya Zhang1, Zhaoxi Zhang1, Weineng Chen1, Hailong Zhao1, Jumana Yousuf Al-Aama10,11, Sherif Edris11,12, Huanming Yang1,11,13, Jian Wang1,13, Torben Hansen6, Henrik Bjørn Nielsen8, Søren Brunak8, Karsten Kristiansen4, Francisco Guarner9, Oluf Pedersen6, Joel Doré7,14, S Dusko Ehrlich7,15, MetaHIT Consortium16, Peer Bork5,17 & Jun Wang1,4,6,11,18
1BGI-Shenzhen, Shenzhen, China. 2BGI Hong Kong Research Institute, Hong Kong, China. 3School of Bioscience and Biotechnology, South China University of Technology, Guangzhou, China. 4Department of Biology, University of Copenhagen, Copenhagen, Denmark. 5European Molecular Biology Laboratory, Heidelberg, Germany. 6The Novo Nordisk Foundation Center for Basic Metabolic Research, Faculty of Health and Medical Sciences, University of Copenhagen, Copenhagen, Denmark. 7INRA, Institut National de la Recherche Agronomique, Metagenopolis, Jouy en Josas, France. 8Center for Biological Sequence Analysis, Technical University of Denmark, Kongens Lyngby, Denmark. 9Digestive System Research Unit, University Hospital Vall d’Hebron, Ciberehd, Barcelona, Spain. 10Department of Genetic Medicine, Faculty of Medicine, King Abdulaziz University (KAU), Jeddah, Saudi Arabia. 11Princess Al-Jawhara AlBrahim Centre of Excellence in Research of Hereditary Disorders (PACER-HD), Faculty of Medicine, KAU, Jeddah, Saudi Arabia. 12Department of Biological Sciences, Faculty of Science, King Abdulaziz University (KAU), Jeddah, Saudi Arabia. 13James D. Watson Institute of Genome Science, Hangzhou, China. 14INRA, Institut National de la Recherche Agronomique, Unité mixte de Recherche 14121 Microbiologie de l’Alimentation au Service de la Santé, Jouy en Josas, France. 15Centre for Host-Microbiome Interactions, Dental Institute Central Office, King’s College London, Guy’s Hospital, London Bridge, UK. 16A full list of additional members and affiliations appears at the end of the paper. 17Max Delbrück Centre for Molecular Medicine, Berlin, Germany. 18Macau University of Science and Technology, Macau, China. 19These authors contributed equally to this work. Correspondence should be addressed to Jun W. ([email protected]) or P.B. ([email protected]).
Many analyses of the human gut microbiome depend on a catalog of reference genes. Existing catalogs for the human gut microbiome are based on samples from single cohorts or on reference genomes or protein sequences, which limits coverage of global microbiome diversity. Here we combined 249 newly sequenced samples of the Metagenomics of the Human Intestinal Tract (MetaHit) project with 1,018 previously sequenced samples to create a cohort from three continents that is at least threefold larger than cohorts used for previous gene catalogs. From this we established the integrated gene catalog (IGC) comprising 9,879,896 genes. The catalog includes close-to-complete sets of genes for most gut microbes, which are also of considerably higher quality than in previous catalogs. Analyses of a group of samples from Chinese and Danish individuals using the catalog revealed country-specific gut microbial signatures. This expanded catalog should facilitate quantitative characterization of metagenomic, metatranscriptomic and metaproteomic data from the gut microbiome to understand its variation across populations in human health and disease.
The ensemble of microorganisms in our gut, referred to as the human gut microbiota, is known to be important for human physiol-ogy and disease in the gut and beyond1. However, our knowledge of the genetic and functional diversity in gut microbes is far from complete. Increasing numbers of fecal samples are being analyzed by targeted 16S rRNA gene pyrosequencing and to a lesser extent by metagenomic shotgun sequencing, because of the higher costs and more complex data analysis associated with the latter. Metagenomic assembly of short sequencing reads enables functional insights and is a more convenient and unbiased way of obtaining genomic infor-mation for environmental microbes, compared to culture-based or single-cell methods. However, data from different studies are scat-tered (most notably in the MetaHIT2 and the Human Microbiome Project (HMP)3 gene catalogs), and there has been no comprehensive and uniformly processed database that can represent the human gut
microbiota around the world. With the increasing amount of sequenc-ing data, it is also not clear at what pace the number of species and genes discovered in the gut microbiome will continue to grow, and to what extent our current sampling and data analyses capture common and rare entities in the gut microbiota.
Catalogs of reference genes in the human gut microbiome are cru-cial for functional metagenomic analyses2. Sequencing reads can be mapped to the catalog to profile the species and gene content of a sample; genes with co-varying abundance levels can be clustered to reveal disease markers in metagenome-wide association studies4–7; analyses of gene content might guide isolation of strains from fecal samples and document the strains’ genomic information in the origi-nal habitat before possible changes during cultivation; and as meta-transcriptomics8,9 and metaproteomics10 become more common, a gene catalog would greatly facilitate analyses of RNA or protein data.
Received 1 April; accepted 3 June; published online 6 July 2014; doi:10.1038/nbt.2942
©20
14 N
atu
re A
mer
ica,
Inc.
All
rig
hts
res
erve
d.
� advance online publication nature biotechnology
r e s o u r c e
The MetaHIT2 and the HMP3 gene catalogs, based on 124 sam-ples from individuals in European countries (here referred to as ‘European samples’) and 136 samples from individuals in the United States (‘American samples’), respectively, have limited representation and might contain partial or chimeric genes that could be extended or eliminated with more sequencing data and state-of-the-art pro-cessing algorithms.
In this study, we established a catalog of the human gut micro-bial genes by processing 249 newly sequenced samples and 1,018 published samples from MetaHIT2,6,7, HMP3 and a large diabetes study from China4, as well as 511 sequenced genomes of gut-related bacteria and archaea. This nonredundant reference catalog of 9,879,896 genes is freely accessible through our website (http://meta.genomics.cn) and the data are deposited in the GigaScience Database11. Beside providing an expanded resource for future analy-ses, study of the catalog suggests that we may have reached satu-rated coverage of core gene content and functions, but rare genes will continue to be discovered with increased sampling. We also demonstrate discovery of population-specific characteristics of gut microbiota using the catalog.
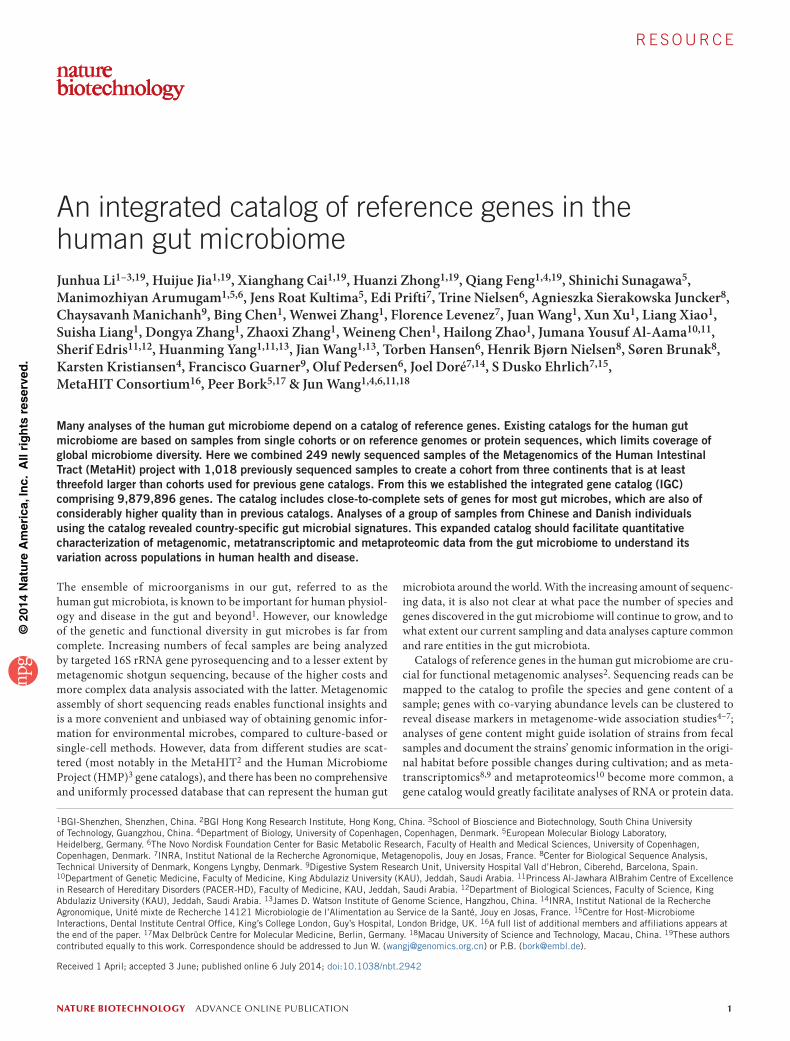
RESULTSConstruction of the integrated gene catalogHere we completed the MetaHIT cohort by sequencing 249 fecal samples from adults in Denmark or Spain, which led to a collection of 760 European samples2,6,7 (Supplementary Table 1) and a catalog of 8,096,991 nonredundant genes (Fig. 1). To create an intercontinental gene catalog for the
human gut microbiome, we integrated the European-sample microbial gene catalog with data from 368 Chinese samples4 and 139 American samples3 (Fig. 1a and Supplementary Table 1). Because we used a standardized and automated workflow that has been shown previously to improve the quality of assembly, gene prediction and redundancy removal12,13 (Online Methods), genes from the American samples were 32.8% longer on average and 41.5% fewer in total number com-pared to the updated HMP catalog (downloaded in August 2013). The updated HMP catalog had more fragmented assemblies compared to ours (despite a slight improvement compared to the original study3) (Fig. 1b). Merging of the cohorts resulted in a catalog of 9,750,788 genes (here called three cohorts nonredundant gene catalog (3CGC)), based on 1,267 gut metagenomes (1,070 individuals) from three con-tinents, amounting to 6.4 Tb of metagenomic sequencing data (Fig. 1 and Supplementary Fig. 1a,b), which is considerably more than for previous cohorts2,3,7.
Abundant gut microbes were well represented in the 3CGC, but some low-abundance yet common microbes were insufficiently cov-ered, probably because of low sequencing depth for these species.
IGC
Gut-relatedSPGC
3CGC
American gutgene catalog
Chinese gutgene catalog
Clustering (CD-HIT)
MOCAT processing pipeline
760 Europeansamples,
sequencing data
Read trimming andfiltering
Read removal
Assembly
AssemblyrevisionGene
prediction
Gene clustering CD-HIT
Self-developedpipeline
SOAPdenovov1.06
SOAPaligner2
FastX or SolexaQA
MetaGeneMarkv2.8
European gutgene catalog
368 Chinesesamples,
sequencing data
139 Americansamples,
sequencing data
3,449 sequencedprokaryotic genomes
Isolated bodysite from IMG
HMP OTUs ofstool body site
Selecting gut-related prokaryotes
116
4714586
181
20
78
132 276
983 prokaryotes
511 prokaryotes
Clustering (CD-HIT)
Clustering (CD-HIT)
Filtering by coverageof sequencing data
8
28
132
15095
Genecatalog
ReferenceSample
sizeNumber of
ORFsCompleteORFs (%)
Total length(bp)
a
b Average length (bp)
N50(bp)
N90(bp)
Maxlength
Minlength
102
102
102
100
23,034
88,230
88,230
24,615
378
405
384
513
909
1,053
1,029
1,221
704
775
748
928
2,323,171,095
2,750,208,618
7,298,407,194
612,211,588
46.26
NA
60.05
56.34
99.77
3,299,822
3,547,396
9,750,788
659,492
124
368
1,267
10288,0863811,0237466,039,847,3688,096,991760 56.18Current study
MetaHIT 2010 study
10240,0113871,0057451,996,356,21955.452,681,342Current study 139
10226,1092857655612,571,088,392NA4,581,984139HMP 2012 study*
Current study**
Current study
Current study
European
American
Chinese
3CGC
SPGC
IGC 10088,2303841,0357537,436,156,05557.749,879,8961,267***Current study
Figure 1 Construction of the IGC. (a) Pipeline for data processing and integration (see also Online Methods). Metagenomic sequencing data from the European, Chinese and American cohorts were processed with the MOCAT pipeline13 to generate their respective gene catalogs. The three catalogs were merged to form 3CGC. Sequenced prokaryotic genomes or draft genomes regarded as potentially of human gut origin, according to the IMG system15 (red), 16S rRNA gene sequence (operational taxonomic unit, OTU) from HMP (green), or coverage by 3CGC (blue) (Online Methods). This initial set of 983 genomes was filtered by our metagenomic sequencing data, which resulted in 511 genomes whose genes comprise the SPGC. Finally, 3CGC were merged with SPGC to generate the IGC. (b) General features of the gene catalogs. *, original HMP study reported a gut microbial gene catalog containing 5,183,353 genes3, 13% more than the number shown here from the catalog downloaded from the HMP website in August 2013 (http://www.hmpdacc.org/HMGC/); the sample number is 139 instead of the 136 stated in the original study3. **, original study for the Chinese samples created a gene catalog based on 145 instead of 368 samples4. ***, IGC also incorporated 511 prokaryotic genomes. ORF, open reading frame; N50, 50% of the total length at this length or longer; N90, 90% of the total length at this length or longer; NA, not applicable.
©20
14 N
atu
re A
mer
ica,
Inc.
All
rig
hts
res
erve
d.
nature biotechnology advance online publication �
r e s o u r c e
For example, the strain labeled Clostridium sp. D5 by the US National Center for Biotechnology Information (NCBI) (but we found it to be classified as Clostridium XlVa in Lachnospiraceae instead of Clostridium in Clostridiaceae, according to the 16S classifier from the Ribosomal Database Project (RDP)14; Online Methods), was listed by the Integrated Microbial Genomes (IMG) system15 as a strain isolated from human feces, and we detected it in 53% of stool samples (n = 325) in HMP’s 16S rRNA gene data (Online Methods). However, only 4.9% of its genome was cov-ered by 3CGC genes (Supplementary Fig. 1c). To ensure representation of such low-abundance but prevalent organisms, we extracted genes from the genomes of 511 bacterial and archaeal strains that are associated with the human gut and whose genomes were detected in our metagenomic sequencing cohorts (>90% cumulative coverage of the genome by all 1,267 metagenomes; Online Methods). This resulted in a group of 659,492 non-redundant genes, which we refer to as the sequenced prokaryotic gene catalog (SPGC) (Fig. 1 and Supplementary Table 2).
We combined SPGC with 3CGC to form the IGC. The IGC includes 9,879,896 genes, which is nearly three and four times more than the existing MetaHIT and the reassembled HMP gene catalogs, respec-tively2,3 (Fig. 1). Each sample contained an average of 762,665 genes and contributed 469 unique genes on average. Any two samples had in common an average of 250,382 genes (32.8% of 762,665 genes).
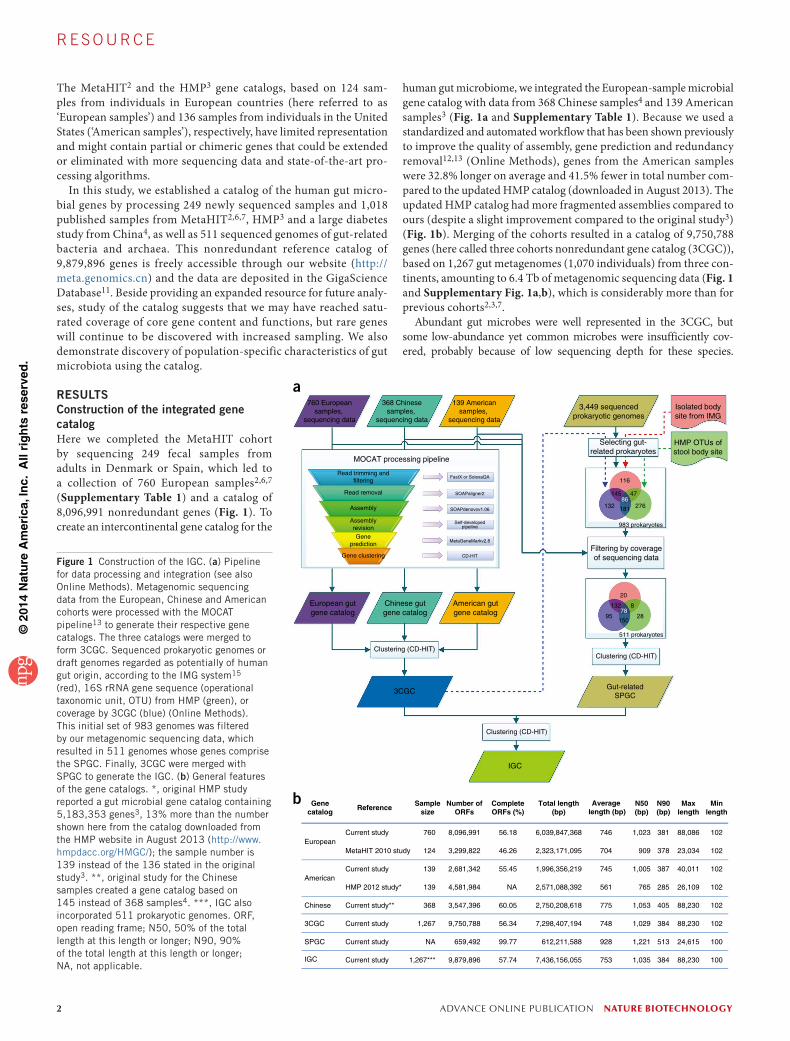
Quality and completeness of the integrated gene catalog75.7% and 74.1% of the genes in the IGC were new compared to the MetaHIT 2010 (ref. 2) and the HMP 2012 (ref. 3) gene catalogs, respectively (Supplementary Fig. 2a,e). For sequencing reads from the MetaHIT 2010 study2, we mapped about 10% more reads to the IGC than to the MetaHIT 2010 catalog, reaching an average mapping rate of 79.24% (Fig. 2a). IGC allowed better mapping of sequencing reads (80.54% on average) from the cohorts used for its construction, compared to unintegrated European, Chinese and American gene catalogs (Supplementary Fig. 3a). Data from three studies conducted
in America16, Japan17 and Sweden5 not used in the construction of the IGC had 73.67%, 81.36% and 76.15% of sequencing data rep-resented in the IGC, respectively (Fig. 2b,c and Online Methods). Because the percentage of gene-coding regions in all prokaryotic genomes is ~87% (Supplementary Table 3), and an estimated 7.25% of sequencing reads with an average length of 77 base pairs could not be mapped reliably as they only partially overlapped with genes (Online Methods), the percentages of mapped reads that we observed with the IGC are close to the maximum achievable mapping rates. In addition, richness estimation based on Chao2 (ref. 18) suggests that the IGC covers 94.5% of the gene content in the sampled gut microbiome (Fig. 2d), similar to an estimation of 95.4% using the incidence-based coverage estimator (ICE)19.
Comparison of the genes assembled in the IGC to the previous cat-alogs showed that the 12.2% of the MetaHIT 2010 genes not present in the IGC were shorter, more fragmented and often had unknown taxonomy and function compared to the 87.8% MetaHIT 2010 genes present in the IGC (Supplementary Fig. 2c,d). This difference might be due to the approaches used to generate the IGC, including stricter quality control of sequencing reads (using FASTX Toolkit; http:// hannonlab.cshl.edu/fastx_toolkit/), an improved assembler (SOAPdenovo 1.06)20, assembly revision (in the MOCAT pipeline)13, more specific gene calling (MetaGeneMark)21, and a standardized and ultrafast clus-tering algorithm used to merge gene catalogs (CD-HIT)12 (Fig. 1 and Online Methods). Similarly, the 23.6% of HMP 2012 genes that were not present in the IGC were much shorter and aligned with a small portion of sequencing reads compared to the 76.4% HMP 2012 genes present in the IGC (Supplementary Fig. 2g). Of the genes shared among the catalogs, the majority were longer in the IGC (Supplementary Fig. 2b,f).
Taxonomic representation in the IGCWe taxonomically annotated the IGC using reference genomes of 3,449 bacteria and archaea (Supplementary Table 3 and Online
Figure 2 Coverage of the IGC. (a) Percentage of total reads in the MetaHIT 2010 study (n = 124 samples) that could be mapped to MetaHIT 2010 and the IGC. Plotted are interquartile ranges (IQRs; boxes), medians (dark lines in the boxes), the lowest and highest values within 1.5 times IQR from the first and third quartiles (whiskers above and below the boxes), and outliers beyond the whiskers (circles). (b) Percentage of total reads in unrelated studies of Japanese samples (Sanger sequencing, n = 13 samples) and American samples (Roche 454 sequencing, n = 18 samples) that could be mapped to MetaHIT 2010 and IGC with the criterion of identity ≥ 90% and mapped length ≥ 100 bp16,17, and from Swedish samples (Illumina sequencing, n = 145) that could be mapped with identity ≥ 95% (Online Methods)5. Results for two overlap cutoffs (>1% and >80%) for queries are shown for Sanger and 454 reads. OL, overlap. *, 130 of the 145 individuals were born in Sweden. (c) Distribution of mapping ratio for the mostly Swedish cohort (shown in b) with normal glucose tolerance (NGT), impaired glucose tolerance (IGT) and type II diabetes (T2D). Each point represents one sample, colored according to nationality at birth. The mapping ratio is not available from the original study5. (d) Rarefaction curve based on gene profiles of 1,267 samples using the Chao2 estimator18 (Online Methods).
Map
ped
read
s ra
tio (
%)
c 85
a 100
Map
ped
read
s ra
tio (
%)
90
80
70
60
50
0MetaHIT 2010 IGC
100
Map
ped
read
s ra
tio (
%)
b
MetaHIT 2010
Swedish*(Illumina)
American(454)
Japanese(Sanger)
OL>1% OL>80% OL>1% OL>80%
IGC
80
60
40
20
0
80
75
70
65
60
0
IGT
Sweden Iceland
SlovakiaNorway
FranceHungary
FinlandEstonia
YugoslaviaDenmarkGermany
T2DNGT
d 12
10
8
6
4
2
00 400 800
Chao2
# of
gen
es (
× 10
6 )
# of samples
1,200

©20
14 N
atu
re A
mer
ica,
Inc.
All
rig
hts
res
erve
d.
� advance online publication nature biotechnology
r e s o u r c e
Methods)22. Similar to previous studies4,23, 21.3% of the genes in the IGC could be uniquely and reliably assigned to a phylum and 16.3% to a genus. Genes that could be assigned to genera represented 44.4% of the total sequencing reads (ranging from 5.3% to 78.4% of the sequencing reads in individual samples; Supplementary Fig. 3b).
For 3CGC (IGC without SPGC) com-pared to MetaHIT 2010, we observed that on average 3CGC had 32.26% higher cover-age of individual genomes (the improvement in coverage in 3CGC versus MetaHIT 2010 ranged from −0.71% to +80.44%; average gene content in bacterial genomes is 87%) (Fig. 3a, Supplementary Tables 3 and 4). The improvement in genomic coverage correlated with the increase in maximum abundance of the genera as the cohort size expanded from 124 in MetaHIT 2010 to 1,267 in IGC (Fig. 3a,b). The most abundant genus,
Genera that occurred in large numbers of samples (high occurrence frequency) tended to be those species previously known to inhabit the human gut (Supplementary Fig. 4d, and Supplementary Tables 5 and 6). A notable exception was Oenococcus used in wine fermentation, which had not been reported as a gut commensal (Supplementary Table 6) but the occurrence frequency of genes annotated to this genus was 13.5% in the current cohort (Online Methods). Although genera not affiliated with the human gut substantially outnumbered genera found in the gut according to the IMG (Supplementary Table 6), they only contributed relatively low-occurrence genes (Supplementary Fig. 4e).
100a
b
c
80
60
0
–1
–2
–3
–4
Bac
tero
ides
Pre
vote
llaE
sche
richi
aE
ubac
teriu
mB
utyr
ivib
rioF
aeca
libac
teriu
mR
umin
ococ
cus
Alis
tipes
Ros
ebur
iaP
arap
revo
tella
Akk
erm
ansi
aK
leb
siel
laC
lost
ridiu
mB
ifid
obac
teriu
mP
arab
acte
roid
esB
laut
iaD
ialis
ter
Cop
roco
ccus
Lact
obac
illus
Aci
dam
inoc
occu
sS
trep
toco
ccus
Met
hano
bre
vib
acte
rF
usob
acte
rium
Dor
eaP
hasc
olar
ctob
acte
rium
Od
orib
acte
rS
utte
rella
Vei
llone
llaM
egas
pha
era
Ent
erob
acte
rM
itsuo
kella
Bilo
phi
laH
aem
ophi
lus
Col
linse
llaC
opro
bac
illus
Shi
gel
laD
esul
fovi
brio
Wei
ssel
laV
ictiv
allis
Pep
tost
rep
toco
ccus
Eg
ger
thel
laE
nter
ococ
cus
Ana
erot
runc
usP
orp
hyro
mon
asS
ucci
natim
onas
Pep
toni
phi
lus
Turic
ibac
ter
Lact
ococ
cus
Citr
obac
ter
Ana
eros
tipes
Pro
teus
Ag
gre
gat
ibac
ter
Pyr
amid
obac
ter
Sla
ckia
Sel
enom
onas
Pro
vid
enci
aH
elic
obac
ter
Max
imum
abu
ndan
ce (
log 10
)
–5
100
80
60
40
20
% c
over
ed
0
40
% im
prov
emen
t in
cove
rage
20
0
MetaHIT 2010 samples (n = 124)
IGC samples (n = 1,267)
Improvement in 3CGC MetaHIT 2010
L. r
eute
ri M
M2-
3L.
reu
teri
DS
M 2
0016
L. r
eute
ri JC
M 1
112
L. r
eute
ri M
M4-
1AL.
am
ylov
orus
GR
L111
8L.
john
soni
i DP
C 6
026
L. a
myl
ovor
us G
RL
1112
L. a
cid
ophi
lus
30S
CL.
john
soni
i FI9
785
L. jo
hnso
nii A
TC
C 3
3200
L. jo
hnso
nii N
CC
533
L. r
eute
ri A
TC
C 5
3608
L. r
eute
ri S
D21
12L.
reu
teri
CF
48-3
AL.
reu
teri
100-
23L.
rum
inis
SP
M02
11L.
rum
inis
AT
CC
256
44L.
gas
seri
202-
4L.
gas
seri
AT
CC
333
23L.
gas
seri
MV
-22
L. g
asse
ri JV
-V03
L. g
asse
ri 22
4-1
L. a
cid
ophi
lus
AT
CC
479
6L.
aci
dop
hilu
s N
CF
M
L. fe
rmen
tum
AT
CC
149
31L.
ferm
entu
m IF
O 3
956
L. fe
rmen
tum
CE
CT
571
6L.
hel
vetic
us D
SM
200
75L.
ferm
entu
m 2
8-3-
CH
NL.
hel
vetic
us D
PC
457
1L.
hel
vetic
us H
10L.
cris
pat
us S
T1
L. c
risp
atus
JV
-V01
L. c
risp
atus
214
-1L.
cris
pat
us M
V-1
A-U
S
L. v
agin
alis
AT
CC
495
40L.
cris
pat
us M
V-3
A-U
S
L. o
ris F
0423
L. o
ris P
B01
3-T
2-3
L. a
ntri
DS
M 1
6041
L. s
aliv
ariu
s A
CS
-116
-V-C
ol5a
L. d
elb
ruec
kii s
ubsp
. bul
garic
us N
D02
L. s
aliv
ariu
s N
IAS
840
L. s
aliv
ariu
s A
TC
C 1
1741
L. d
elb
ruec
kii s
ubsp
. bul
garic
us A
TC
C 1
1842
L. d
elb
ruec
kii s
ubsp
. bul
garic
us A
TC
C B
AA
-365
L. d
elb
ruec
kii s
ubsp
. bul
garic
us 2
038
L. d
elb
ruec
kii s
ubsp
. bul
garic
us P
B20
03/0
44-T
3-4
L. d
elb
ruec
kii s
ubsp
. lac
tis D
SM
200
7
L. s
aliv
ariu
s U
CC
118
L. s
aliv
ariu
s C
EC
T 5
713
L. s
aliv
ariu
s G
J-24
L. c
risp
atus
125
-2-C
HN
Figure 3 Improved genome coverage in 3CGC. (a) Improvement in the percentage of each strain’s genome covered by 3CGC compared to MetaHIT 2010 genes. Only the 593 strains whose genomes were covered more than 60% by MetaHIT 2010 or 3CGC genes (BLASTN v2.2.24, with criterion of score ≥ 60 and mapped length ≥ 80% for queries) are shown. A complete list of strains is shown in Supplementary Table 4. Strains were grouped by genera. Each dot represents one strain in a genus. Size of the dots scales inversely with the number of strains in the same genus (i.e., a genus with only one strain covered more than 60% had a large dot). The dashed line shows the theoretical maximum of 87% (the average gene content of a bacterial genome). (b) Difference in the highest relative abundance of a genus seen in the MetaHIT 2010 cohort (n = 124) and the IGC cohort (n = 1,267). Genera were ordered according to their relative abundance maxima in MetaHIT 2010 and the resulting x-axis labels are as indicated in a. (c) Genome coverage of different Lactobacillus strains in 3CGC and MetaHIT 2010.
Bacteroides, was no more than 10% better covered except for two strains, whereas genera that were sampled to much higher abundance in the current cohort (e.g., Prevotella, Lactobacillus, Peptostreptococcus, Enterococcus and Helicobacter, specifically, H. winghamensis) showed substantial improvement in their genomic coverage by our gene cata-log. At the strain level, pathogenic strains such as Escherichia coli O157:H7 and cheese starter strains like L. delbrueckii were substantially bet-ter represented in the IGC because of increased sampling (Fig. 3c, Supplementary Fig. 4a and Supplementary Table 4). Analysis of Enterococcus revealed that most samples contained low levels of this genus, but its occasional high abundance in Chinese and European samples, combined with sufficient sequencing depth, enabled 70–80% improvement in the genomic coverage of Enterococcus in the IGC (Supplementary Fig. 4b,c). Thus, increased sampling might be a more effective alternative to deeper sequencing for improved coverage of rare species.
©20
14 N
atu
re A
mer
ica,
Inc.
All
rig
hts
res
erve
d.
nature biotechnology advance online publication �
r e s o u r c e
Functional representation of gut microbesWe annotated the genes in the IGC according to the Kyoto Encyclopedia of Genes and Genomes (KEGG) and the evolutionary genealogy of genes nonsupervised orthologous groups (eggNOG) databases24,25. We identified a total of 6,980 KEGG orthologous groups (KOs) and 36,489 eggNOG orthologous groups, which represented 51.6% and 69.3% of the total sequencing reads (Supplementary Fig. 3b) and involved 42.1% and 60.4% of the IGC genes, respectively.
876 KOs were present in the IGC but not in the MetaHIT 2010 catalog, whereas 36 KOs present in the MetaHIT 2010 catalog were absent from IGC because of the increased stringency. Consistent with richness estimation by Chao2 (Fig. 2d) and ICE, and as suggested by the local rather than global improvement in the coverage of metabolic pathways from MetaHIT 2010 to IGC (Supplementary Fig. 4f), the IGC might provide saturated coverage of the functional capacity of the human gut prokaryotes. Although bacteria are the dominant organ-isms in the gut microbiota26–28, we obtained 500 more eukaryotic KOs in the IGC compared to MetaHIT 2010, but pathways in higher eukaryotes such as glycosphingolipid biosynthesis, proteoglycan biosynthesis and diterpenoid biosynthesis remained largely absent (Supplementary Fig. 4f and Supplementary Table 7).
To test the usefulness of the IGC for analyzing metatranscrip-tomic as well as metagenomic data, we mapped metatranscriptomic sequencing reads from a recent study9 to the catalog. After removing genes corresponding to noncoding RNAs such as rRNA, tRNA and signal recognition particle RNA, a higher percentage of the metatran-scriptome reads could be mapped to IGC compared to using reference genomes of gut bacteria and archaea only (SPGC) (Online Methods and Supplementary Fig. 3c). Despite the stringent alignment criteria (Online Methods), the amount of reads mapping to protein-coding
genes in each sample according to the IGC correlated well with values from the original study (Supplementary Fig. 3d). Also, using the IGC instead of the reference genomes (SPGC) allowed identi-fication of more KOs, especially in pathways such as carbohydrate metabolism, cellular processes and signaling, and membrane trans-port (Supplementary Fig. 3e).
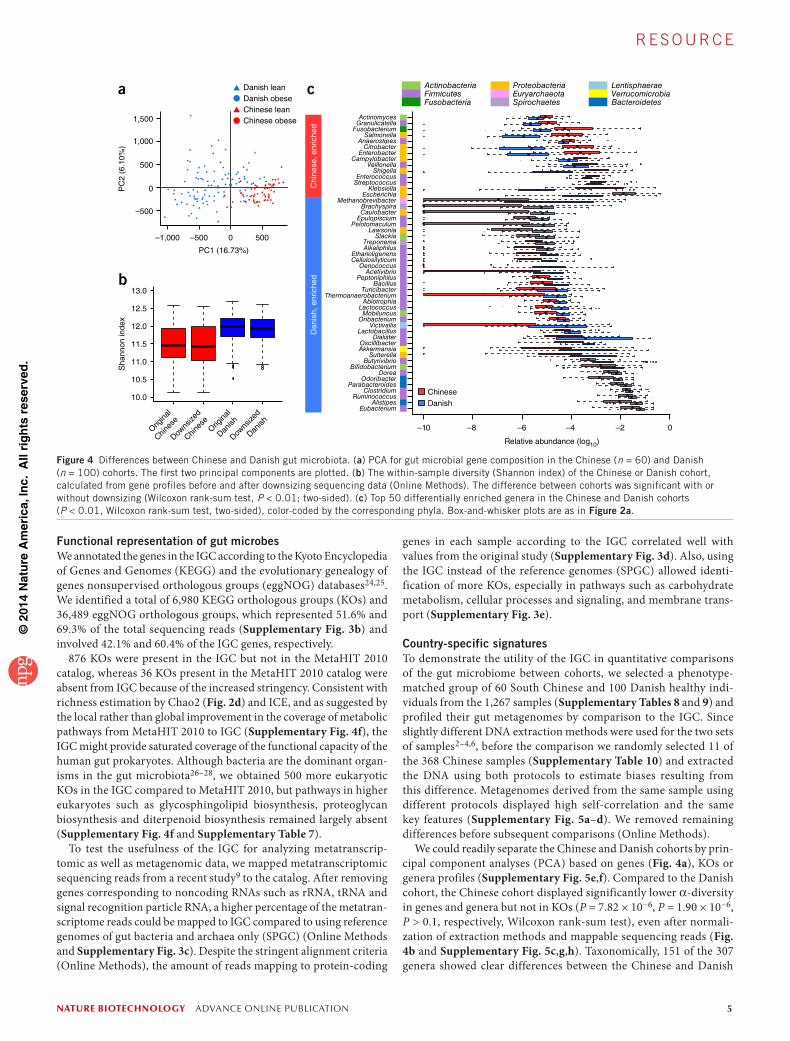
Country-specific signaturesTo demonstrate the utility of the IGC in quantitative comparisons of the gut microbiome between cohorts, we selected a phenotype-matched group of 60 South Chinese and 100 Danish healthy indi-viduals from the 1,267 samples (Supplementary Tables 8 and 9) and profiled their gut metagenomes by comparison to the IGC. Since slightly different DNA extraction methods were used for the two sets of samples2–4,6, before the comparison we randomly selected 11 of the 368 Chinese samples (Supplementary Table 10) and extracted the DNA using both protocols to estimate biases resulting from this difference. Metagenomes derived from the same sample using different protocols displayed high self-correlation and the same key features (Supplementary Fig. 5a–d). We removed remaining differences before subsequent comparisons (Online Methods).
We could readily separate the Chinese and Danish cohorts by prin-cipal component analyses (PCA) based on genes (Fig. 4a), KOs or genera profiles (Supplementary Fig. 5e,f). Compared to the Danish cohort, the Chinese cohort displayed significantly lower α-diversity in genes and genera but not in KOs (P = 7.82 × 10⁻⁶, P = 1.90 × 10⁻⁶, P > 0.1, respectively, Wilcoxon rank-sum test), even after normali-zation of extraction methods and mappable sequencing reads (Fig. 4b and Supplementary Fig. 5c,g,h). Taxonomically, 151 of the 307 genera showed clear differences between the Chinese and Danish
c
–10
Dan
ish,
enr
iche
dC
hine
se, e
nric
hed
b13.0
12.5
12.0
11.5
11.0
10.5
10.0
Origina
l
Chines
e
Sha
nnon
inde
x
Downs
ized
Chines
eOrig
inal
Danish
Downs
ized
Danish –8 –6
Relative abundance (log10)
Chinese
Actinobacteria
ShigellaEnterococcus
Klebsiella
Treponema
Ethanoligenens
ThermoanaerobacteriumAbiotrophia
Sutterella
EubacteriumAlistipes
RuminococcusClostridium
ParabacteroidesOdoribacter
DoreaBifidobacterium
Butyrivibrio
AkkermansiaOscillibacter
DialisterLactobacillus
VictivallisOribacterium
MobiluncusLactococcus
TuricibacterBacillus
PeptoniphilusAcetivibrio
OenococcusCellulosilyticum
Alkaliphilus
SlackiaLawsonia
PelotomaculumEpulopisciumCaulobacterBrachyspira
MethanobrevibacterEscherichia
Streptococcus
VeillonellaCampylobacter
EnterobacterCitrobacter
AnaerostipesSalmonella
FusobacteriumGranulicatellaActinomyces
FirmicutesFusobacteria
Proteobacteria LentisphaeraeVerrucomicrobiaBacteroidetes
EuryarchaeotaSpirochaetes
–4 –2 0
Danish
a
1,500P
C2
(6.1
0%)
PC1 (16.73%)
1,000
–1,000
500
500
0
0
–500
–500
Danish leanDanish obeseChinese leanChinese obese
Figure 4 Differences between Chinese and Danish gut microbiota. (a) PCA for gut microbial gene composition in the Chinese (n = 60) and Danish (n = 100) cohorts. The first two principal components are plotted. (b) The within-sample diversity (Shannon index) of the Chinese or Danish cohort, calculated from gene profiles before and after downsizing sequencing data (Online Methods). The difference between cohorts was significant with or without downsizing (Wilcoxon rank-sum test, P < 0.01; two-sided). (c) Top 50 differentially enriched genera in the Chinese and Danish cohorts (P < 0.01, Wilcoxon rank-sum test, two-sided), color-coded by the corresponding phyla. Box-and-whisker plots are as in Figure 2a.
©20
14 N
atu
re A
mer
ica,
Inc.
All
rig
hts
res
erve
d.
� advance online publication nature biotechnology
r e s o u r c e
samples (P < 0.01, false discovery rate (FDR) of 0.0048, power = 0.7, Wilcoxon rank-sum test; Supplementary Fig. 5i,j and Supplementary Table 11). For example, the Danish samples were generally enriched in the phylum Firmicutes, including Oenococcus and other lactic acid bacteria, whereas the Chinese samples had greater abundance of Proteobacteria (Fig. 4c).
3,491 KOs were significantly different between the two cohorts (P < 0.01, FDR = 0.003, power = 0.7, Wilcoxon rank-sum test; Supplementary Fig. 5k and Supplementary Table 12). The most prominent differences involved diet-related processes such as energy metabolism, carbohydrate metabolism, amino acid metabolism, and metabolism of cofactors and vitamins, as well as xenobiotic-associated functions such as membrane transport and xenobiotic biodegradation and metabolism (Supplementary Figs. 6 and 7, Supplementary Tables 13–25 and Supplementary Notes). These dif-ferences in metabolic potential of the gut microbiota between healthy Chinese and Danish adults might be influenced by differences in diet (perhaps bread, dairy and vitamins) and environmental factors (perhaps aromatic carcinogens or nitrogen oxides) (Supplementary Fig. 8 and Supplementary Notes).
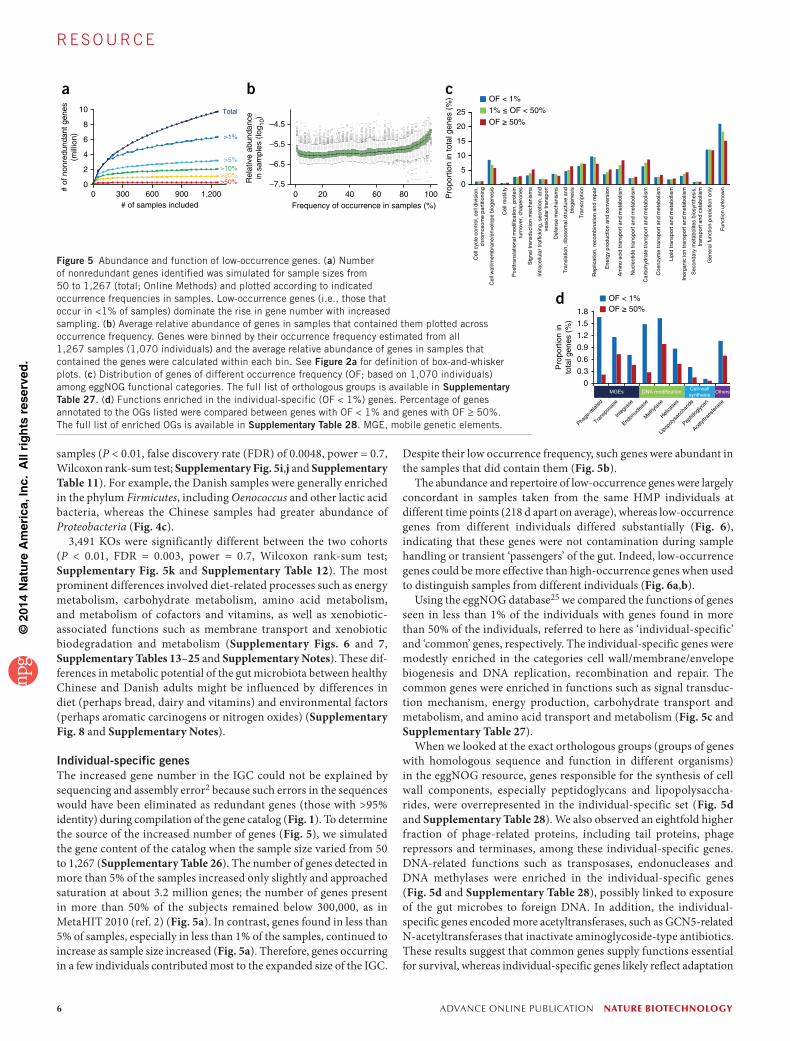
Individual-specific genesThe increased gene number in the IGC could not be explained by sequencing and assembly error2 because such errors in the sequences would have been eliminated as redundant genes (those with >95% identity) during compilation of the gene catalog (Fig. 1). To determine the source of the increased number of genes (Fig. 5), we simulated the gene content of the catalog when the sample size varied from 50 to 1,267 (Supplementary Table 26). The number of genes detected in more than 5% of the samples increased only slightly and approached saturation at about 3.2 million genes; the number of genes present in more than 50% of the subjects remained below 300,000, as in MetaHIT 2010 (ref. 2) (Fig. 5a). In contrast, genes found in less than 5% of samples, especially in less than 1% of the samples, continued to increase as sample size increased (Fig. 5a). Therefore, genes occurring in a few individuals contributed most to the expanded size of the IGC.
Despite their low occurrence frequency, such genes were abundant in the samples that did contain them (Fig. 5b).
The abundance and repertoire of low-occurrence genes were largely concordant in samples taken from the same HMP individuals at different time points (218 d apart on average), whereas low-occurrence genes from different individuals differed substantially (Fig. 6), indicating that these genes were not contamination during sample handling or transient ‘passengers’ of the gut. Indeed, low-occurrence genes could be more effective than high-occurrence genes when used to distinguish samples from different individuals (Fig. 6a,b).
Using the eggNOG database25 we compared the functions of genes seen in less than 1% of the individuals with genes found in more than 50% of the individuals, referred to here as ‘individual-specific’ and ‘common’ genes, respectively. The individual-specific genes were modestly enriched in the categories cell wall/membrane/envelope biogenesis and DNA replication, recombination and repair. The common genes were enriched in functions such as signal transduc-tion mechanism, energy production, carbohydrate transport and metabolism, and amino acid transport and metabolism (Fig. 5c and Supplementary Table 27).
When we looked at the exact orthologous groups (groups of genes with homologous sequence and function in different organisms) in the eggNOG resource, genes responsible for the synthesis of cell wall components, especially peptidoglycans and lipopolysaccha-rides, were overrepresented in the individual-specific set (Fig. 5d and Supplementary Table 28). We also observed an eightfold higher fraction of phage-related proteins, including tail proteins, phage repressors and terminases, among these individual-specific genes. DNA-related functions such as transposases, endonucleases and DNA methylases were enriched in the individual-specific genes (Fig. 5d and Supplementary Table 28), possibly linked to exposure of the gut microbes to foreign DNA. In addition, the individual- specific genes encoded more acetyltransferases, such as GCN5-related N-acetyltransferases that inactivate aminoglycoside-type antibiotics. These results suggest that common genes supply functions essential for survival, whereas individual-specific genes likely reflect adaptation
10
aTotal
8
6
4
2
00 300 600 900 1,200
# of samples included
# of
non
redu
ndan
t gen
es(m
illio
n) >1%
>5%>10%>20%>50%
b
–4.5
Rel
ativ
e ab
unda
nce
in s
ampl
es (
log 1
0)
–5.5
–6.5
–7.50 20 40 60 80 100Frequency of occurrence in samples (%)
c25
Pro
port
ion
in to
tal g
enes
(%
) OF < 1%
1% ≤ OF < 50%
OF ≥ 50%20
15
10
5
0
Cel
l cyc
le c
ontr
ol, c
ell d
ivis
ion,
chro
mos
ome
part
ition
ing
Cel
l wal
l/mem
bran
e/en
velo
pe b
ioge
nesi
s
Pos
ttran
slat
iona
l mod
ifica
tion,
pro
tein
turn
over
, cha
pero
nes
Intr
acel
lula
r tr
affic
king
, sec
retio
n, a
ndve
sicu
lar
tran
spor
t
Tra
nsla
tion,
rib
osom
al s
truc
ture
and
biog
enes
is
Sec
onda
ry m
etab
olite
s bi
osyn
thes
is,
tran
spor
t and
cat
abol
ism
Fun
ctio
n un
know
n
Gen
eral
func
tion
pred
ictio
n on
ly
Inor
gani
c io
n tr
ansp
ort a
nd m
etab
olis
m
Lipi
d tr
ansp
ort a
nd m
etab
olis
m
Coe
nzym
e tr
ansp
ort a
nd m
etab
olis
m
Car
bohy
drat
e tr
ansp
ort a
nd m
etab
olis
m
Nuc
leot
ide
tran
spor
t and
met
abol
ism
Am
ino
acid
tran
spor
t and
met
abol
ism
Ene
rgy
prod
uctio
n an
d co
nver
sion
Rep
licat
ion,
rec
ombi
natio
n an
d re
pair
Tra
nscr
iptio
n
Def
ense
mec
hani
sms
Sig
nal t
rans
duct
ion
mec
hani
sms
Cel
l mot
ility
d OF < 1%OF ≥ 50%
MGEs DNA modification OthersCell-wallsynthesis
Pro
port
ion
into
tal g
enes
(%
)
1.8
Phage
-relat
ed
Trans
posa
se
Inte
gras
e
Endon
uclea
se
Met
hylas
e
Helica
ses
Lipop
olysa
ccha
ride
Peptid
oglyc
an
Acetyl
trans
fera
se
1.5
1.2
0.9
0.6
0.3
0
Figure 5 Abundance and function of low-occurrence genes. (a) Number of nonredundant genes identified was simulated for sample sizes from 50 to 1,267 (total; Online Methods) and plotted according to indicated occurrence frequencies in samples. Low-occurrence genes (i.e., those that occur in <1% of samples) dominate the rise in gene number with increased sampling. (b) Average relative abundance of genes in samples that contained them plotted across occurrence frequency. Genes were binned by their occurrence frequency estimated from all 1,267 samples (1,070 individuals) and the average relative abundance of genes in samples that contained the genes were calculated within each bin. See Figure 2a for definition of box-and-whisker plots. (c) Distribution of genes of different occurrence frequency (OF; based on 1,070 individuals) among eggNOG functional categories. The full list of orthologous groups is available in Supplementary Table 27. (d) Functions enriched in the individual-specific (OF < 1%) genes. Percentage of genes annotated to the OGs listed were compared between genes with OF < 1% and genes with OF ≥ 50%. The full list of enriched OGs is available in Supplementary Table 28. MGE, mobile genetic elements.

©20
14 N
atu
re A
mer
ica,
Inc.
All
rig
hts
res
erve
d.
nature biotechnology advance online publication �
r e s o u r c e
to host immune system, viral infection, antibiotic treatment and other challenges experienced by the gut microbiome.
DISCUSSIONThe IGC is a comprehensive resource for further investigations of the gut microbiome, covering strains with a diverse range of occur-rence frequencies, abundance and transit durations in the human gut. Future efforts to enhance this catalog could be more targeted to samples with high abundance of a particular strain of interest, which might indicate deviation from a healthy status or relate to a particu-lar environmental factor. As the gut could be seeded by microbes present in food and drinks9, quantitative information on the intake and excretion of microbes, the half-life of a strain in the gut29 and so forth would be necessary to define a gut commensal reliably. It is also possible that invasive techniques such as colonoscopy would identify more mucosal-associated microbes than fecal sampling.
Our analysis of two phenotype-matched cohorts of healthy Chinese and Danish adults based on the IGC revealed differences in their gut microbiota regarding many aspects of nutrient metabolism as well as xenobiotic detoxification, which might have been shaped by diet and environment (Supplementary Fig. 8 and Supplementary Note). However, other influences, such as host genetics, remain possible.
Low-occurrence genes contributed overwhelmingly to the increased total gene number in the IGC and might reflect the distinct combination of genetic, nutritional and medical factors in a host. Although the individ-uals had no recent antibiotic treatment, we observed enrichment in pos-sible antibiotic resistance genes both at the population level30,31 (penicillin resistance in Danes and multidrug resistance in Chinese; Supplementary Table 21) and in the individual-specific genes (e.g., acetyltransferases and peptidoglycan synthesis), which highlights the need for close monitoring of direct and indirect exposure to antibiotics.
Gut bacteriophages are believed to be mostly temperate but can be induced to enter the lytic cycle32,33. We identified genes for maintenance of lysogeny, such as phage repressors, as well as various genes involved in replication and infection. Other individual-specific genes might also be carried by phages, which are known to alter the metabolism of and confer stress resistance to their bacterial host33–36, and appear stably associated with a given individual32. It remains to be explored whether rare genes in the non-gut microbiome are also enriched for phages or adaptive functions possibly carried by phages36.
Similar to the field of human genetics, where the search for new alleles has progressed from common to rare, our data indicate that cataloging of our ‘other genome’, the human gut microbiome, is also entering the stage for identification of rare or individual-specific genes instead of common and shared genes. It is also reaching the stage for quantitative comparisons between populations around the world. A reference gene catalog such as the IGC allows rapid and
multi-omic profiling of the genetic and functional repertoire of a given gut metagenome, and facilitates investigations of its geographical, genetic, temporal and physiological characteristics.
A website (http://meta.genomics.cn, optimized for Safari) has been set up to better visualize the annotation information of the gene catalog and guide researchers who are interested in using our data set and downloading specific sets of data.
METHODSMethods and any associated references are available in the online version of the paper.
Accession codes. European Bioinformatics Institute Sequence Read Archive: ERP004605 (metagenomic sequencing data of the 249 European samples and 11 Chinese samples).
Note: Any Supplementary Information and Source Data files are available in the online version of the paper.
ACKNOWLEDGMENTSThis research was supported by the European Commission FP7 grant HEALTH-F4-2007-201052 and HEALTH-F4-2010-261376, Natural Science Foundation of China (30890032, 30725008, 30811130531 and 31161130357), the Shenzhen Municipal Government of China (ZYC200903240080A, BGI20100001, CXB201108250096A and CXB201108250098A), European Research Council CancerBiome grant (project reference 268985), METACARDIS project (FP7-HEALTH-2012-INNOVATION-I-305312), the Danish Strategic Research Council grant (2106-07-0021), the Ole Rømer grant from Danish Natural Science Research Council and the Solexa project (272-07-0196). Additional funding came from the Lundbeck Foundation Centre for Applied Medical Genomics in Personalized Disease Prediction, Prevention and Care (http://www.lucamp.org/), the Novo Nordisk Foundation Center for Basic Metabolic Research (an independent research center at the University of Copenhagen partially funded by an unrestricted donation from the Novo Nordisk Foundation; http://www.metabol.ku.dk) and the Metagenopolis grant ANR-11-DPBS-0001. We are indebted to many additional faculty and staff of BGI-Shenzhen who contributed to this work.
AUTHOR CONTRIBUTIONSJ.L., Q.F., S.D.E., P.B. and Jun W. managed the project. T.N., T.H., F.G. and O.P. performed clinical sampling. C.M., W.Z., F.L. and Jua.W. performed DNA extraction. J.L., M.A., K.K., P.B. and Jun W. designed the analyses. J.L., H.J., X.C., H. Zhong, Q.F., E.P., A.S.J., B.C., L.X., S.L., D.Z., Z.Z., W.C., H. Zhao, S.E. and H.B.N. performed the data analyses. J.L., X.C., S.S., J.R.K., Z.Z. and W.C. constructed the integrated gene catalog and performed the functional and taxonomic annotation analyses. J.L., X.C., H. Zhong, B.C. and S.L. performed the country-specific signature analyses. J.L., H.J. and H. Zhong wrote the paper. S.S., M.A., X.X., J.Y.A.-A., H.Y., Ji.W., S.B., K.K., O.P., J.D., S.D.E., P.B. and Jun W. revised the paper. The MetaHIT Consortium members contributed to design and execution of the study.
COMPETING FINANCIAL INTERESTSThe authors declare no competing financial interests.
reprints and permissions information is available online at http://www.nature.com/reprints/index.html.
Figure 6 Temporal stability of low-occurrence genes. (a,b) Genes were binned by their occurrence frequency estimated from all 1,070 individuals. Within each bin, the Sorenson index based on gene content was estimated for pairwise comparisons of multiple samples taken from 43 HMP individuals (a), and first time point (stool 1) samples from 94 different HMP individuals (b). The two sets of dots in a that showed substantially lower Sorenson indices in all occurrence frequencies than the rest of the data originated from comparison between 763536994-stool 2 sample with the same individual’s stool 1 and stool 3 samples; this sample seems to be an outlier. (c) Relative abundance of genes in common among samples from 43 HMP individuals sampled at two time points were compared to calculate the Spearman’s correlation coefficient. See Figure 2a for definition of box-and-whisker plot and Online Methods for computation.
1.0
0.8
0.6
0.4
0.2
0
0 10 20 30 40 50 60 70 80 90100
Frequency of occurrence inindividuals (%)
Intr
a-in
divi
dual
sim
ilarit
yco
effic
ient
(S
oren
son
inde
x)
a1.0
0.8
0.6
0.4
0.2
0
0 10 20 30 40 50 60 70 80 90100
Frequency of occurrence inindividuals (%)
Inte
r-in
divi
dual
sim
ilarit
yco
effic
ient
(S
oren
son
inde
x)
b1.0
0.8
0.6
0.4
–0.4
0.2
–0.2
0
0 10 20 30 40 50 60 70 80 90100
Frequency of occurrence inindividuals (%)
Intr
a-in
divi
dual
abu
ndan
cesi
mila
rity
(Spe
arm
an)
c
©20
14 N
atu
re A
mer
ica,
Inc.
All
rig
hts
res
erve
d.
� advance online publication nature biotechnology
r e s o u r c e
20Commissariat à l’Energie Atomique, Genoscope, France. 21Centre National de la Recherche Scientifique, UMR 8030, Evry, France. 22Evry, France, Université d’Evry Val d’Essone, Evry, France. 23The Wellcome Trust Sanger Institute, Hinxton, Cambridge, UK. 24Danone Research, Palaiseau, France. 25Gut Biology & Microbiology, Danone Research, Centre for specialized nutrition, Wageningen, the Netherlands. 26Istituto Europeo di Oncologia, Milan, Italy. 27Institut Mérieux, Lyon, France. 28Laboratory of Microbiology, Wageningen University, Utrecht, the Netherlands. 29Department of Bacteriology and Immunology, University of Helsinki, Helsinki, Finland.
MetaHIT consortium (additional members):
Nicolas Pons7, Emmanuelle Le Chatelier7, Jean-Michel Batto7, Sean Kennedy7, Florence Haimet7, Yohanan Winogradski7, Eric Pelletier20–22, Denis LePaslier20–22, François Artiguenave20–22, Thomas Bruls20–22, Jean Weissenbach20–22, Keith Turner23, Julian Parkhill23, Maria Antolin9, Francesc Casellas9, Natalia Borruel9, Encarna Varela9, Antonio Torrejon9, Gérard Denariaz24, Muriel Derrien24, Johan E T van Hylckama Vlieg24, Patrick Viega24, Raish Oozeer25, Jan Knoll25, Maria Rescigno26, Christian Brechot27, Christine M’Rini27, Alexandre Mérieux27, Takuji Yamada5, Sebastian Tims28, Erwin G Zoetendal28, Michiel Kleerebezem28, Willem M de Vos28,29, Antonella Cultrone14, Marion Leclerc14, Catherine Juste14, Eric Guedon14, Christine Delorme14, Séverine Layec14, Ghalia Khaci14, Maarten van de Guchte14, Gaetana Vandemeulebrouck14, Alexandre Jamet14, Rozenn Dervyn14, Nicolas Sanchez14, Hervé Blottière14, Emmanuelle Maguin14, Pierre Renault14, Julien Tap5,7 & Daniel R Mende5
1. Clemente, J.C., Ursell, L.K., Parfrey, L.W. & Knight, R. The impact of the gut microbiota on human health: an integrative view. Cell 148, 1258–1270 (2012).
2. Qin, J. et al. A human gut microbial gene catalogue established by metagenomic sequencing. Nature 464, 59–65 (2010).
3. The Human Microbiome Project Consortium. A framework for human microbiome research. Nature 486, 215–221 (2012).
4. Qin, J. et al. A metagenome-wide association study of gut microbiota in type 2 diabetes. Nature 490, 55–60 (2012).
5. Karlsson, F.H. et al. Gut metagenome in European women with normal, impaired and diabetic glucose control. Nature 498, 99–103 (2013).
6. Le Chatelier, E. et al. Richness of human gut microbiome correlates with metabolic markers. Nature 500, 541–546 (2013).
7. Nielsen, H.B. et al. Identification and assembly of genomes and genetic elements in complex metagenomic samples without using reference genomes. Biotechnol. doi:10.1038/nbt.2939 (6 July 2014).
8. Xiong, X. et al. Generation and analysis of a mouse intestinal metatranscriptome through Illumina based RNA-sequencing. PLOS ONE 7, e36009 (2012).
9. David, L.A. et al. Diet rapidly and reproducibly alters the human gut microbiome. Nature 505, 559–563 (2014).
10. Erickson, A.R. et al. Integrated metagenomics/metaproteomics reveals human host-microbiota signatures of Crohn’s disease. PLOS ONE 7, e49138 (2012).
11. Li, J. et al. Supporting data for the paper: “An integrated catalog of reference genes in the human gut microbiome.” GigaScience Database doi:10.5524/100064 (2014).
12. Li, W. & Godzik, A. Cd-hit: a fast program for clustering and comparing large sets of protein or nucleotide sequences. Bioinformatics 22, 1658–1659 (2006).
13. Kultima, J.R. et al. MOCAT: a metagenomics assembly and gene prediction toolkit. PLOS ONE 7, e47656 (2012).
14. Wang, Q., Garrity, G.M., Tiedje, J.M. & Cole, J.R. Naive Bayesian classifier for rapid assignment of rRNA sequences into the new bacterial taxonomy. Appl. Environ. Microbiol. 73, 5261–5267 (2007).
15. Markowitz, V.M. et al. IMG 4 version of the integrated microbial genomes comparative analysis system. Nucleic Acids Res. 42, D560–D567 (2014).
16. Turnbaugh, P.J. et al. A core gut microbiome in obese and lean twins. Nature 457, 480–484 (2009).
17. Kurokawa, K. et al. Comparative metagenomics revealed commonly enriched gene sets in human gut microbiomes. DNA Res. 14, 169–181 (2007).
18. Chao, A. Estimating the population size for capture-recapture data with unequal catchability. Biometrics 43, 783–791 (1987).
19. Lee, S.M. & Chao, A. Estimating population size via sample coverage for closed capture-recapture models. Biometrics 50, 88–97 (1994).
20. Li, R. et al. De novo assembly of human genomes with massively parallel short read sequencing. Genome Res. 20, 265–272 (2010).
21. Zhu, W., Lomsadze, A. & Borodovsky, M. Ab initio gene identification in metagenomic sequences. Nucleic Acids Res. 38, e132 (2010).
22. Mende, D.R., Sunagawa, S., Zeller, G. & Bork, P. Accurate and universal delineation of prokaryotic species. Nat. Methods 10, 881–884 (2013).
23. Arumugam, M. et al. Enterotypes of the human gut microbiome. Nature 473, 174–180 (2011).
24. Kanehisa, M. & Goto, S. KEGG: Kyoto encyclopedia of genes and genomes. Nucleic Acids Res. 28, 27–30 (2000).
25. Powell, S. et al. eggNOG v3.0: orthologous groups covering 1133 organisms at 41 different taxonomic ranges. Nucleic Acids Res. 40, D284–D289 (2012).
26. Scanlan, P.D. & Marchesi, J.R. Micro-eukaryotic diversity of the human distal gut microbiota: qualitative assessment using culture-dependent and -independent analysis of faeces. ISME J. 2, 1183–1193 (2008).
27. Marchesi, J.R. Prokaryotic and eukaryotic diversity of the human gut. Adv. Appl. Microbiol. 72, 43–62 (2010).
28. Parfrey, L.W., Walters, W.A. & Knight, R. Microbial eukaryotes in the human microbiome: ecology, evolution, and future directions. Front. Microbiol. 2, 153 (2011).
29. Faith, J.J. et al. The long-term stability of the human gut microbiota. Science 341, 1237439 (2013).
30. Forslund, K. et al. Country-specific antibiotic use practices impact the human gut resistome. Genome Res. 23, 1163–1169 (2013).
31. Hu, Y. et al. Metagenome-wide analysis of antibiotic resistance genes in a large cohort of human gut microbiota. Nat. Commun. 4, 2151 (2013).
32. Reyes, A. et al. Viruses in the faecal microbiota of monozygotic twins and their mothers. Nature 466, 334–338 (2010).
33. Minot, S. et al. The human gut virome: inter-individual variation and dynamic response to diet. Genome Res. 21, 1616–1625 (2011).
34. Wang, X. et al. Cryptic prophages help bacteria cope with adverse environments. Nat. Commun. 1, 147 (2010).
35. Reyes, A., Semenkovich, N.P., Whiteson, K., Rohwer, F. & Gordon, J.I. Going viral: next-generation sequencing applied to phage populations in the human gut. Nat. Rev. Microbiol. 10, 607–617 (2012).
36. Modi, S.R., Lee, H.H., Spina, C.S. & Collins, J.J. Antibiotic treatment expands the resistance reservoir and ecological network of the phage metagenome. Nature 499, 219–222 (2013).
©20
14 N
atu
re A
mer
ica,
Inc.
All
rig
hts
res
erve
d.
nature biotechnologydoi:10.1038/nbt.2942
which were downloaded from EBI with the accession code PRJNA28117; and (iii) data from European individuals5, which was downloaded from NCBI with the accession code ERP002469.
Two previously published gene catalogs for the human gut microbiome used in this project include: (i) a gene catalog established from 124 Europeans by MetaHIT2, which was downloaded from http://gutmeta.genomics.org.cn/; (ii) a gene catalog established by HMP3, which was downloaded from http://www.hmpdacc.org/HMGC/ in August 2013.
Gut metatranscriptomic data from 59 samples were downloaded from the Gene Expression Omnibus under accession GSE46761 (ref. 9). All of these public metatranscriptomic sequencing samples were processed by the MOCAT pipeline to extract high-quality reads13.
Collection and quality control of 3,449 sequenced prokaryotic genomes or draft genomes. Prokaryotic genomes were collected and filtered as described22. Briefly, all prokaryotic genomes available at NCBI and EMBL Bank on 23 February 2012 were downloaded and genomes with more than 300 contigs and N50 < 10 kbp were removed. In addition, we removed genomes for which less than 30 of 40 universal single-copy marker genes were identi-fied40,41. Finally, for genomes with the same taxonomy identifier, but different project identifiers, one genome was randomly chosen, which resulted in a set of 3,449 genomes used in this study.
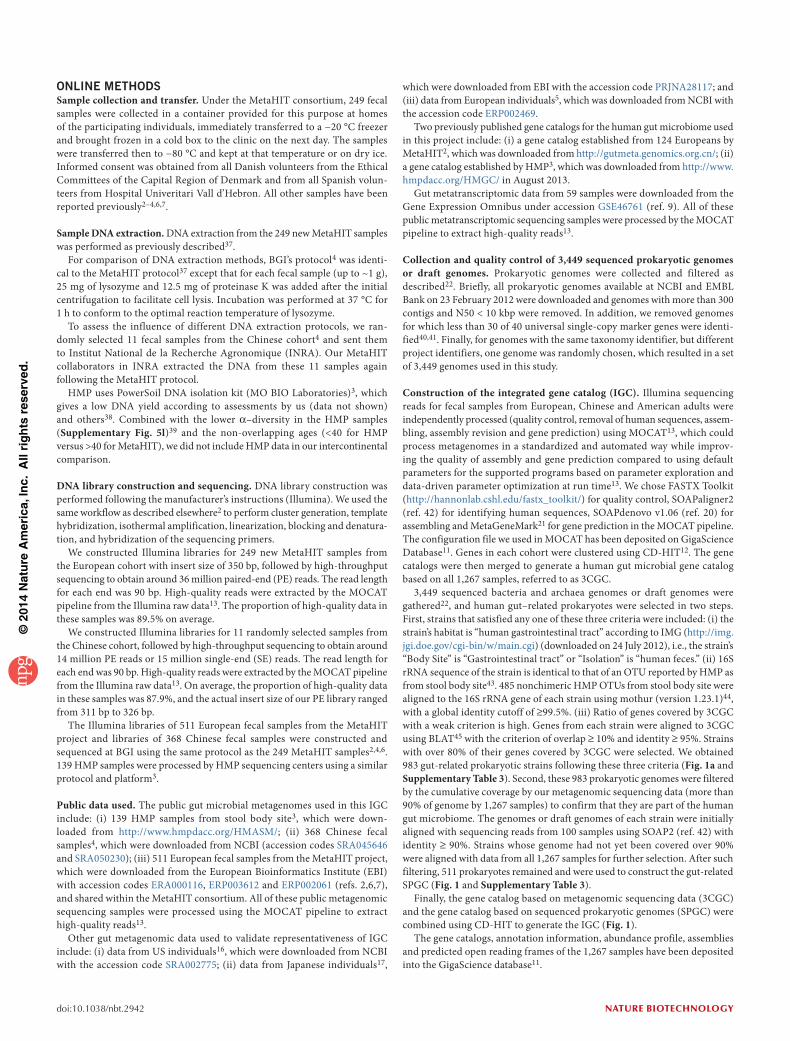
Construction of the integrated gene catalog (IGC). Illumina sequencing reads for fecal samples from European, Chinese and American adults were independently processed (quality control, removal of human sequences, assem-bling, assembly revision and gene prediction) using MOCAT13, which could process metagenomes in a standardized and automated way while improv-ing the quality of assembly and gene prediction compared to using default parameters for the supported programs based on parameter exploration and data-driven parameter optimization at run time13. We chose FASTX Toolkit (http://hannonlab.cshl.edu/fastx_toolkit/) for quality control, SOAPaligner2 (ref. 42) for identifying human sequences, SOAPdenovo v1.06 (ref. 20) for assembling and MetaGeneMark21 for gene prediction in the MOCAT pipeline. The configuration file we used in MOCAT has been deposited on GigaScience Database11. Genes in each cohort were clustered using CD-HIT12. The gene catalogs were then merged to generate a human gut microbial gene catalog based on all 1,267 samples, referred to as 3CGC.
3,449 sequenced bacteria and archaea genomes or draft genomes were gathered22, and human gut–related prokaryotes were selected in two steps. First, strains that satisfied any one of these three criteria were included: (i) the strain’s habitat is “human gastrointestinal tract” according to IMG (http://img.jgi.doe.gov/cgi-bin/w/main.cgi) (downloaded on 24 July 2012), i.e., the strain’s “Body Site” is “Gastrointestinal tract” or “Isolation” is “human feces.” (ii) 16S rRNA sequence of the strain is identical to that of an OTU reported by HMP as from stool body site43. 485 nonchimeric HMP OTUs from stool body site were aligned to the 16S rRNA gene of each strain using mothur (version 1.23.1)44, with a global identity cutoff of ≥99.5%. (iii) Ratio of genes covered by 3CGC with a weak criterion is high. Genes from each strain were aligned to 3CGC using BLAT45 with the criterion of overlap ≥ 10% and identity ≥ 95%. Strains with over 80% of their genes covered by 3CGC were selected. We obtained 983 gut-related prokaryotic strains following these three criteria (Fig. 1a and Supplementary Table 3). Second, these 983 prokaryotic genomes were filtered by the cumulative coverage by our metagenomic sequencing data (more than 90% of genome by 1,267 samples) to confirm that they are part of the human gut microbiome. The genomes or draft genomes of each strain were initially aligned with sequencing reads from 100 samples using SOAP2 (ref. 42) with identity ≥ 90%. Strains whose genome had not yet been covered over 90% were aligned with data from all 1,267 samples for further selection. After such filtering, 511 prokaryotes remained and were used to construct the gut-related SPGC (Fig. 1 and Supplementary Table 3).
Finally, the gene catalog based on metagenomic sequencing data (3CGC) and the gene catalog based on sequenced prokaryotic genomes (SPGC) were combined using CD-HIT to generate the IGC (Fig. 1).
The gene catalogs, annotation information, abundance profile, assemblies and predicted open reading frames of the 1,267 samples have been deposited into the GigaScience database11.
ONLINE METHODSSample collection and transfer. Under the MetaHIT consortium, 249 fecal samples were collected in a container provided for this purpose at homes of the participating individuals, immediately transferred to a −20 °C freezer and brought frozen in a cold box to the clinic on the next day. The samples were transferred then to −80 °C and kept at that temperature or on dry ice. Informed consent was obtained from all Danish volunteers from the Ethical Committees of the Capital Region of Denmark and from all Spanish volun-teers from Hospital Univeritari Vall d’Hebron. All other samples have been reported previously2–4,6,7.
Sample DNA extraction. DNA extraction from the 249 new MetaHIT samples was performed as previously described37.
For comparison of DNA extraction methods, BGI’s protocol4 was identi-cal to the MetaHIT protocol37 except that for each fecal sample (up to ~1 g), 25 mg of lysozyme and 12.5 mg of proteinase K was added after the initial centrifugation to facilitate cell lysis. Incubation was performed at 37 °C for 1 h to conform to the optimal reaction temperature of lysozyme.
To assess the influence of different DNA extraction protocols, we ran-domly selected 11 fecal samples from the Chinese cohort4 and sent them to Institut National de la Recherche Agronomique (INRA). Our MetaHIT collaborators in INRA extracted the DNA from these 11 samples again following the MetaHIT protocol.
HMP uses PowerSoil DNA isolation kit (MO BIO Laboratories)3, which gives a low DNA yield according to assessments by us (data not shown) and others38. Combined with the lower α–diversity in the HMP samples (Supplementary Fig. 5l)39 and the non-overlapping ages (<40 for HMP versus >40 for MetaHIT), we did not include HMP data in our intercontinental comparison.
DNA library construction and sequencing. DNA library construction was performed following the manufacturer’s instructions (Illumina). We used the same workflow as described elsewhere2 to perform cluster generation, template hybridization, isothermal amplification, linearization, blocking and denatura-tion, and hybridization of the sequencing primers.
We constructed Illumina libraries for 249 new MetaHIT samples from the European cohort with insert size of 350 bp, followed by high-throughput sequencing to obtain around 36 million paired-end (PE) reads. The read length for each end was 90 bp. High-quality reads were extracted by the MOCAT pipeline from the Illumina raw data13. The proportion of high-quality data in these samples was 89.5% on average.
We constructed Illumina libraries for 11 randomly selected samples from the Chinese cohort, followed by high-throughput sequencing to obtain around 14 million PE reads or 15 million single-end (SE) reads. The read length for each end was 90 bp. High-quality reads were extracted by the MOCAT pipeline from the Illumina raw data13. On average, the proportion of high-quality data in these samples was 87.9%, and the actual insert size of our PE library ranged from 311 bp to 326 bp.
The Illumina libraries of 511 European fecal samples from the MetaHIT project and libraries of 368 Chinese fecal samples were constructed and sequenced at BGI using the same protocol as the 249 MetaHIT samples2,4,6. 139 HMP samples were processed by HMP sequencing centers using a similar protocol and platform3.
Public data used. The public gut microbial metagenomes used in this IGC include: (i) 139 HMP samples from stool body site3, which were down-loaded from http://www.hmpdacc.org/HMASM/; (ii) 368 Chinese fecal samples4, which were downloaded from NCBI (accession codes SRA045646 and SRA050230); (iii) 511 European fecal samples from the MetaHIT project, which were downloaded from the European Bioinformatics Institute (EBI) with accession codes ERA000116, ERP003612 and ERP002061 (refs. 2,6,7), and shared within the MetaHIT consortium. All of these public metagenomic sequencing samples were processed using the MOCAT pipeline to extract high-quality reads13.
Other gut metagenomic data used to validate representativeness of IGC include: (i) data from US individuals16, which were downloaded from NCBI with the accession code SRA002775; (ii) data from Japanese individuals17,
©20
14 N
atu
re A
mer
ica,
Inc.
All
rig
hts
res
erve
d.
nature biotechnology doi:10.1038/nbt.2942
Investigation on the representation of a low-abundance but prevalent human gut bacterium. Genome of NCBI 556261.HMPREF0240_10201 (Clostridiaceae|Clostridium|Clostridium sp. D5 in NCBI, Lachnospiraceae|Clostridium XlVa according to the RDP database14, Feburary 2014) originally isolated from human feces was chosen as a reference. Genes from 3CGC were aligned to the NCBI 556261 genome by BLAST with the criterion of more than 95% identity and 90% overlap of query. Only 4.9% the genome was represented by 3CGC. The occurrence frequency of the strain was assessed by sequencing data of 325 stool samples from HMP in 16S rRNA gene variable regions3. Tags of each sample with length more than 150 bp were aligned to the 16S rRNA gene from the NCBI 556261 genome by mothur (version 1.23.1)44 with more than 97% identity and more than 90% overlap of query. 53% of the HMP stool samples carried this species (2.1 tags on average), which indicated that it is a universally present but low-abundance species in the human gut environment. Cumulative coverage of its genome by metagenomic sequencing reads from 1,267 samples was assessed by SOAP2 (ref. 42) with more than 95% identity. The best covered sample was chosen according to the maximum number of NCBI 556261 genes covered by ORFs assembled from the sample.
Phylogenetic annotation based on reference genomes. Phylogenetic annotation was performed using an in-house pipeline. (i) We aligned 9.7 million genes of 3CGC onto the database of 3,449 prokaryotic genomes using BLASTN (v2.2.24, default parameters except that -e0.01 -b100 -K 1 -F T). (ii) For each gene, only the top 10% highest-scoring alignments covering ≥ 80% of gene length and identity ≥ 65% were retained. (iii) Each gene was assigned the taxonomy of the alignment(s) with 50% or higher consensus above the similarity threshold for taxonomic rank (>65% for phylum, >85% for genus and >95% for species). (iv) The 0.7 million genes of SPGC were assigned the taxonomy they came from.
As explained previously4,23, our phylogenetic annotation method ensures unique assignment and minimizes ambiguity. The false positive rates at phy-lum level and genus level were 0.77% and 1.84%, respectively23.
Functional annotation (KEGG and eggNOG). We aligned putative amino acid sequences translated from the integrated gene catalog against the pro-teins or domains in eggNOG (v3.0) and KEGG databases (release 59.0, genes from animals or plants were excluded) using BLASTP (v2.2.24, default param-eter except that -e 0.01 -b 100 -K 1 -F T). KEGG annotation was performed using an in-house pipeline, where each protein was assigned to a KO when the highest-scoring annotated hit(s) contained at least one alignment over 60 bits. eggNOG annotation was performed using Smash Community (v1.6, find_best_hit.pl&og_mapping.py, with default parameters)46.
Comparison between MetaHIT 2010, HMP 2012 and IGC genes. 9.9 mil-lion genes from IGC and 3.3 million genes from the MetaHIT 2010 catalog2 were pooled together, and redundant genes were identified using CD-HIT11 with ≥95% identity and ≥90% overlap. For the shared (overlapped) genes, the length was compared and discrepancies greater than 10% were regarded as significantly longer or shorter in IGC. 9.9 million genes from IGC and 4.6 million genes from the updated HMP 2012 catalog3 were compared using the same workflow.
Aligning public human microbial sequencing data onto gene catalogs. Roche 454 reads from 18 US twins and their mother16 and Sanger reads from 13 Japanese individuals17 were aligned to MetaHIT 2010 and IGC using BLASTN (v2.2.24), with the criterion of mapped length ≥ 100 bp. The ratio of reads that could be aligned to MetaHIT2010 or IGC was filtered by two overlap thresholds (the proportion of a read aligned to the gene catalog), 1% and 80% (Fig. 2b).
Illumina reads from 145 European individuals (130 of them were born in Sweden)5 were aligned to MetaHIT 2010 and IGC using SOAP2 with the criterion of identity ≥ 95%42.
Aligning public human microbial metatranscriptomic data onto gene cata-logs. With our gene catalog constructed directly from the gut microbiome, we were able to allocate transcript sequences from 59 metatranscriptomic sequencing samples9 onto the gene catalog (IGC) using SOAP2 (≥95% iden-tity)42 to identify expressed genes, and retrieve their annotated functions.
SPGC, the gene catalog compiled from 511 gut-related bacterial or archaeal genomes or draft genomes present in the 1,267 metagenomes, was used to compare with IGC, because the set of 539 human-associated microbial refer-ence genomes used in the original study is not known (the human microbiome database used47 now contains 2673 genomes, as of 31 March 2014, http://www.hmpdacc.org/catalog/). The hashing-based software SSAHA2 (ref. 48) used in the original study has a very loose alignment criterion (parameters: ‘-best 1 -score 20 -solexa’) and likely does not support unequivocal identification of gene functions. Besides, SSAHA2 is substantially slower than short-read aligners such as SOAP2 in terms of aligned bases per unit time, and is too slow to handle our gene catalogs.
A few noncoding RNAs were involved while integrating 511 human gut-associated reference genomes into our catalog. In order to calculate the ratio of reads mapped to protein-coding genes (coding sequences; CDS), we eliminated genes annotated to non-coding RNAs in SPGC and IGC, with the keywords ‘RNA’ but no ‘-ase’, ‘enzyme’ or ‘protein’ from the original genome annota-tions22. SPGC and IGC contained 923 and 866 noncoding RNA genes (rRNA, tRNA, SRP RNA, etc.), respectively, according to this search criteria.
Computation of relative gene abundance. High-quality reads from each sample were aligned against the gene catalog by SOAP2 using the criterion of identity ≥ 95%42. Sequence-based abundance profiling was performed as previously described4.
Construction of genus, KO and enzyme profiles. For the genus profile, we used phylogenetic assignment of each gene from the original gene catalog and summed the relative abundance of genes from the same genus to yield the abundance of that genus. Relative abundance of each genus in a sample constituted the genus profile of that sample. The KO profile was constructed using the same method. The relative abundance of an enzyme was calculated from summation of the relative abundance of its corresponding KOs.
Estimating loss of mappable reads at gene boundaries. When mapped against the gene catalog, a portion of short reads would be lost at the bound-ary regions of a gene (Supplementary Fig. 9a).
The lost ratio of abundance, ratelost could be calculated as (Supplementary Fig. 9b),
if rateboundary lostboundary( ) ,2
1× ≤ =
−L L
L
Lgg
if
rate
if
boundary boundary
lostboundary
( ) ,
,
2
12
4
× > ≥
=
−+
×
L L L
L
L
g
g LL
L
L LL
g
g
gg
is even
if is oddboundary
11
4
2−
+× ×
( ),
if L Lgboundary lostrate> =, 1
where Lg is gene length; Lboundary is length of boundary region which equals read length in our situation.
We used all the genes from 511 human gut-associated prokaryotes (Supplementary Table 2) to estimate the proportion of lost sequencing data from prokaryotic gene coding region for individual samples (Supplementary Fig. 9c). The proportion of lost sequencing data from prokaryotic gene cod-ing region,
Rate ratelost lostgenome
T ii
i
n LgL, ,
,= ×
=∑
5111
where i (1,2, … n) refers to each gene from the 511 human gut-associated prokaryotes; Lgi is the length of gene i; ratelost, i is the lost abundance for gene i; L511, genome is the total genome size of 511 human gut-associated prokaryotes.

©20
14 N
atu
re A
mer
ica,
Inc.
All
rig
hts
res
erve
d.
nature biotechnologydoi:10.1038/nbt.2942
For a given read length of 77 bp (the average read length of 1,267 samples in this study) (Supplementary Table 1), the proportion of lost sequencing data from prokaryotic gene coding regions is estimated to be 7.25%.
BMI criteria used for European and Chinese cohorts. A number of reports indicated that the BMI criterion for Asians is lower than for Europeans, and that Asians tend to accumulate abdominal fat and develop obesity-related dis-eases without overall obesity49–51. Accordingly, we used a lower BMI cutoff to define obesity status in Chinese. For Chinese, we used BMI values < 21 kg/m2 for being lean and ≥ 25 kg/m2 for obesity. For Danish we used BMI values < 25 kg/m2 for being lean and ≥ 30 kg/m2 for obesity.
Biodiversity and richness analysis: a-diversity. Based on the gene, genus or KO profile, we calculated the α-diversity (within-sample diversity) to estimate the gene, genus or KO diversities of a sample using the Shannon index:
′ = −=∑H a lnai ii
S
1
where S is the number of genes and ai is the relative abundance of gene i. A high α-diversity indicates a high evenness or many types of genes present in the sample.
Adjustment by linear regression. A linear regression equation was gener-ated based on the 11 randomly selected samples whose DNA was extracted twice using both the BGI and MetaHIT protocols (Supplementary Fig. 5c). For comparison with the Danish cohort, the within-sample diversity index of the Chinese cohort (n = 60) was adjusted according to the linear regression equation to eliminate possible biases introduced by different DNA extraction protocols.
Read downsizing. To eliminate the influence of fluctuations in sequencing amount, we sampled the alignment results and downsized the number of mapped pairs to 11 million for each sample.
Rarefaction curve analysis. To assess the gene richness in our Chinese or Danish cohort, we generated a rarefaction curve. For a given number of indi-vidual samples, we performed random sampling 1,000 times in the cohort with replacement and estimated the total number of genes that could be identified from these samples by the Chao2 richness estimator18. To minimize erroneous identification, only the genes with ≥1 pair of mapped reads were determined to be present in a sample.
Statistical analysis of the gut metagenome. To identify associations between metagenomic profiles and populations, a two-tailed Wilcoxon rank-sum test was used in the profiles. We identified a genus marker if its P value was <0.01 and occurrence frequency >10% in at least one cohort, and identified a KO/enzyme marker if its P < 0.01 and occurrence frequency > 30% in at least one cohort.
The statistical method used to detect biases in extraction methods was similar to the above-mentioned method, but we did not consider occurrence frequency because the sample size was only 11.
Estimating the false discovery rate and statistical power. Instead of a sequential P-value rejection method, we applied the ‘qvalue’ method proposed in a previous study52 to estimate the FDR. Statistical hypothesis tests were performed on a large number of features of the genus profiles and KO profiles. Given that a FDR was obtained by the q value method53, we estimated the power Pe for a given P-value threshold as
PNNee e=
−−
( )( )11 0
FDRp
where π0 is the proportion of null distribution P values among all tested hypoth-eses; Ne is the number of P values that were less than the P-value threshold;
N is the total number of all tested hypotheses; FDRe is the estimated false discovery rate under the P-value threshold.
Simulation for the dependence of gene catalog size on sampling scale. Two data tables were prepared before simulation. The first one was a ‘gene profile’ table, containing information about the relative abundance of each gene for each sample. The table was generated using the method in ref. 4. The second one was a ‘genes assembled’ table, containing information about whether a gene was assembled due to the presence of an individual sample. The table was generated from the clustering output file from CD-HIT, which traced genes corresponding to the same cluster (representative gene) to the original sample.
Simulation was performed by random sampling without replacing the selected samples, with sample size from 50 to 1,267 samples, 50 samples per step. For each simulated set, the estimated size of the nonredundant gene catalog was calculated from the ‘genes assembled’ table, and the distribution of genes in a range of occurrence frequencies was calculated through the ‘gene profile’ table. For each sample size, the simulation was performed 1,000 times, and the averages were plotted.
Concordance of low-occurrence genes between samples. Sorenson index, also known as Sørensen-Dice index, was used to measure the presence/absence similarity of genes of all occurrence frequencies (according to all 1,070 indi-viduals) in HMP samples.
Sørensen’s original formula was applied to the presence/absence data, in the form:
QS CA B
A BA B
=+
= ∩+
2 2 | || | | |
where A and B are the number of genes in samples A and B, respectively, and C is the number of species shared by the two samples; QS is the quotient of similarity and ranges from 0 to 1.
Spearman’s rank correlation coefficient was used to measure the abundance similarity of genes of all occurrence frequencies in HMP samples.
Intraindividual similarity was based on the samples taken from the same 43 HMP individuals at different times (218 d apart on average). And the interin-dividual similarity was based on any two stool samples (the first time point) from 94 different HMP individuals.
Source genera for genes of diverse occurrence frequencies. The occur-rence frequency of each IGC gene was rounded to the nearest integer, for example, 1% represents 1% ± 0.5%. For each source genus, the numbers of genes in each occurrence frequency percentile were counted (Supplementary Table 5). Supplementary Figure 4e was derived from this table with a gene number cutoff of ≥10.
37. Furet, J.-P. et al. Comparative assessment of human and farm animal faecal microbiota using real-time quantitative PCR. FEMS Microbiol. Ecol. 68, 351–362 (2009).
38. Li, A. et al. A pyrosequencing-based metagenomic study of methane-producing microbial community in solid-state biogas reactor. Biotechnol. Biofuels 6, 3 (2013).
39. Sunagawa, S. et al. Metagenomic species profiling using universal phylogenetic marker genes. Nat. Methods 10, 1196–1199 (2013).
40. Ciccarelli, F.D. et al. Toward automatic reconstruction of a highly resolved tree of life. Science 311, 1283–1287 (2006).
41. Sorek, R. et al. Genome-wide experimental determination of barriers to horizontal gene transfer. Science 318, 1449–1452 (2007).
42. Li, R. et al. SOAP2: an improved ultrafast tool for short read alignment. Bioinformatics 25, 1966–1967 (2009).
43. Fodor, A.A. et al. The “most wanted” taxa from the human microbiome for whole genome sequencing. PLOS ONE 7, e41294 (2012).
44. Schloss, P.D. et al. Introducing mothur: open-source, platform-independent, community-supported software for describing and comparing microbial communities. Appl. Environ. Microbiol. 75, 7537–7541 (2009).
45. Kent, W.J. BLAT–the BLAST-like alignment tool. Genome Res. 12, 656–664 (2002).
©20
14 N
atu
re A
mer
ica,
Inc.
All
rig
hts
res
erve
d.
nature biotechnology doi:10.1038/nbt.2942
46. Arumugam, M., Harrington, E.D., Foerstner, K.U., Raes, J. & Bork, P. SmashCommunity: a metagenomic annotation and analysis tool. Bioinformatics 26, 2977–2978 (2010).
47. Nelson, K.E. et al. A catalog of reference genomes from the human microbiome. Science 328, 994–999 (2010).
48. Ning, Z., Cox, A.J. & Mullikin, J.C. SSAHA: a fast search method for large DNA databases. Genome Res. 11, 1725–1729 (2001).
49. World Health Organization Western Pacific Region & WHO/IASO/IOTF. The Asia Pacific perspective: redefining obesity and its treatment. Heal. Commun. Aust. Pty. Ltd. (2000) at http://www.wpro.who.int/nutrition/documents/Redefining_obesity/en/index.html.
50. Anuurad, E. et al. The new BMI criteria for Asians by the regional office for the western pacific region of WHO are suitable for screening of overweight to prevent metabolic syndrome in elder Japanese workers. J. Occup. Health 45, 335–343 (2003).
51. Ko, G.T., Chan, J.C., Cockram, C.S. & Woo, J. Prediction of hypertension, diabetes, dyslipidaemia or albuminuria using simple anthropometric indexes in Hong Kong Chinese. Int. J. Obes. Relat. Metab. Disord. 23, 1136–1142 (1999).
52. Storey, J.D. A direct approach to false discovery rates. J. R. Stat. Soc. Ser. B. Stat. Methodol. 64, 479–498 (2002).
53. Storey, J.D. & Tibshirani, R. Statistical significance for genome-wide studies. Proc. Natl. Acad. Sci. USA 100, 9440–9445 (2003).
Related Documents