ARTICLE Received 22 Nov 2013 | Accepted 14 Mar 2014 | Published 15 Apr 2014 Gut microbiome of the Hadza hunter-gatherers Stephanie L. Schnorr 1, *, Marco Candela 2, *, Simone Rampelli 2 , Manuela Centanni 2 , Clarissa Consolandi 3 , Giulia Basaglia 2 , Silvia Turroni 2 , Elena Biagi 2 , Clelia Peano 3 , Marco Severgnini 3 , Jessica Fiori 2 , Roberto Gotti 2 , Gianluca De Bellis 3 , Donata Luiselli 4 , Patrizia Brigidi 2 , Audax Mabulla 5 , Frank Marlowe 6 , Amanda G. Henry 1 & Alyssa N. Crittenden 7 Human gut microbiota directly influences health and provides an extra means of adaptive potential to different lifestyles. To explore variation in gut microbiota and to understand how these bacteria may have co-evolved with humans, here we investigate the phylogenetic diversity and metabolite production of the gut microbiota from a community of human hunter-gatherers, the Hadza of Tanzania. We show that the Hadza have higher levels of microbial richness and biodiversity than Italian urban controls. Further comparisons with two rural farming African groups illustrate other features unique to Hadza that can be linked to a foraging lifestyle. These include absence of Bifidobacterium and differences in microbial composition between the sexes that probably reflect sexual division of labour. Furthermore, enrichment in Prevotella, Treponema and unclassified Bacteroidetes, as well as a peculiar arrangement of Clostridiales taxa, may enhance the Hadza’s ability to digest and extract valuable nutrition from fibrous plant foods. DOI: 10.1038/ncomms4654 OPEN 1 Plant Foods in Hominin Dietary Ecology Research Group, Max Planck Institute for Evolutionary Anthropology, Deutscher Platz 6, 04103 Leipzig, Germany. 2 Department of Pharmacy and Biotechnology, University of Bologna, Via Belmeloro 6, 40126 Bologna, Italy. 3 Institute of Biomedical Technologies, Italian National Research Council, Via Fratelli Cervi 93, 20090 Segrate, Milan, Italy. 4 Department of Biological, Geological and Environmental Sciences, University of Bologna, Via Selmi 3, Bologna 40126, Italy. 5 College of Arts and Social Sciences, University of Dar es Salaam, 35091 Dar es Salaam, Tanzania. 6 Division of Biological Anthropology, University of Cambridge, Cambridge CB2 1TN, UK. 7 Metabolism, Anthropometry, and Nutrition Laboratory, Department of Anthropology, University of Nevada, Las Vegas, Nevada 89154-5003, USA. * These authors contributed equally to the work. Correspondence and requests for materials should be addressed to A.G.H. (email: [email protected]). NATURE COMMUNICATIONS | 5:3654 | DOI: 10.1038/ncomms4654 | www.nature.com/naturecommunications 1 & 2014 Macmillan Publishers Limited. All rights reserved.

Welcome message from author
This document is posted to help you gain knowledge. Please leave a comment to let me know what you think about it! Share it to your friends and learn new things together.
Transcript
ARTICLE
Received 22 Nov 2013 | Accepted 14 Mar 2014 | Published 15 Apr 2014
Gut microbiome of the Hadza hunter-gatherersStephanie L. Schnorr1,*, Marco Candela2,*, Simone Rampelli2, Manuela Centanni2, Clarissa Consolandi3,
Giulia Basaglia2, Silvia Turroni2, Elena Biagi2, Clelia Peano3, Marco Severgnini3, Jessica Fiori2, Roberto Gotti2,
Gianluca De Bellis3, Donata Luiselli4, Patrizia Brigidi2, Audax Mabulla5, Frank Marlowe6, Amanda G. Henry1 &
Alyssa N. Crittenden7
Human gut microbiota directly influences health and provides an extra means of adaptive
potential to different lifestyles. To explore variation in gut microbiota and to understand how
these bacteria may have co-evolved with humans, here we investigate the phylogenetic
diversity and metabolite production of the gut microbiota from a community of human
hunter-gatherers, the Hadza of Tanzania. We show that the Hadza have higher levels of
microbial richness and biodiversity than Italian urban controls. Further comparisons with two
rural farming African groups illustrate other features unique to Hadza that can be linked to a
foraging lifestyle. These include absence of Bifidobacterium and differences in microbial
composition between the sexes that probably reflect sexual division of labour. Furthermore,
enrichment in Prevotella, Treponema and unclassified Bacteroidetes, as well as a peculiar
arrangement of Clostridiales taxa, may enhance the Hadza’s ability to digest and extract
valuable nutrition from fibrous plant foods.
DOI: 10.1038/ncomms4654 OPEN
1 Plant Foods in Hominin Dietary Ecology Research Group, Max Planck Institute for Evolutionary Anthropology, Deutscher Platz 6, 04103 Leipzig, Germany.2 Department of Pharmacy and Biotechnology, University of Bologna, Via Belmeloro 6, 40126 Bologna, Italy. 3 Institute of Biomedical Technologies, ItalianNational Research Council, Via Fratelli Cervi 93, 20090 Segrate, Milan, Italy. 4 Department of Biological, Geological and Environmental Sciences, University ofBologna, Via Selmi 3, Bologna 40126, Italy. 5 College of Arts and Social Sciences, University of Dar es Salaam, 35091 Dar es Salaam, Tanzania. 6 Division ofBiological Anthropology, University of Cambridge, Cambridge CB2 1TN, UK. 7 Metabolism, Anthropometry, and Nutrition Laboratory, Department ofAnthropology, University of Nevada, Las Vegas, Nevada 89154-5003, USA. * These authors contributed equally to the work. Correspondence and requests formaterials should be addressed to A.G.H. (email: [email protected]).
NATURE COMMUNICATIONS | 5:3654 | DOI: 10.1038/ncomms4654 | www.nature.com/naturecommunications 1
& 2014 Macmillan Publishers Limited. All rights reserved.
The human gut microbiota (GM) is vital for host nutrition,metabolism, pathogen resistance and immune function1,and varies with diet, lifestyle and environment2–4.
Together, the host and microbiome have been termed a ‘supra-organism’ whose combined activities represent both a sharedtarget for natural selection and a driver of adaptive responses5. Bystudying GM variation across human populations, we are able toexplore the limits of our genetic and metabolic potential, and theextent to which GM-host co-evolution is responsible for ourphysiological flexibility and environmental adaptation6–8.
Comparative studies between unindustrialized rural commu-nities from Africa and South America and industrialized westerncommunities from Europe and North America have revealedspecific GM adaptations to their respective lifestyles. Theseadaptations include higher biodiversity and enrichment ofBacteroidetes and Actinobacteria in rural communities, and anoverall reduction in microbial diversity and stability in westernpopulations4,9. Unindustrialized small-scale rural societies aretargets for understanding trends in human–GM interactionsbecause they rely less on antibiotics and sterile cleaners, and oftenconsume a greater breadth of unrefined seasonally availablefoods10. Yet, despite recent focus on rural societies, there remainsa significant gap in our knowledge of the microbe–hostrelationship among hunter-gatherer populations. This isespecially problematic because humans have relied on huntingand gathering for 95% of our evolutionary history.
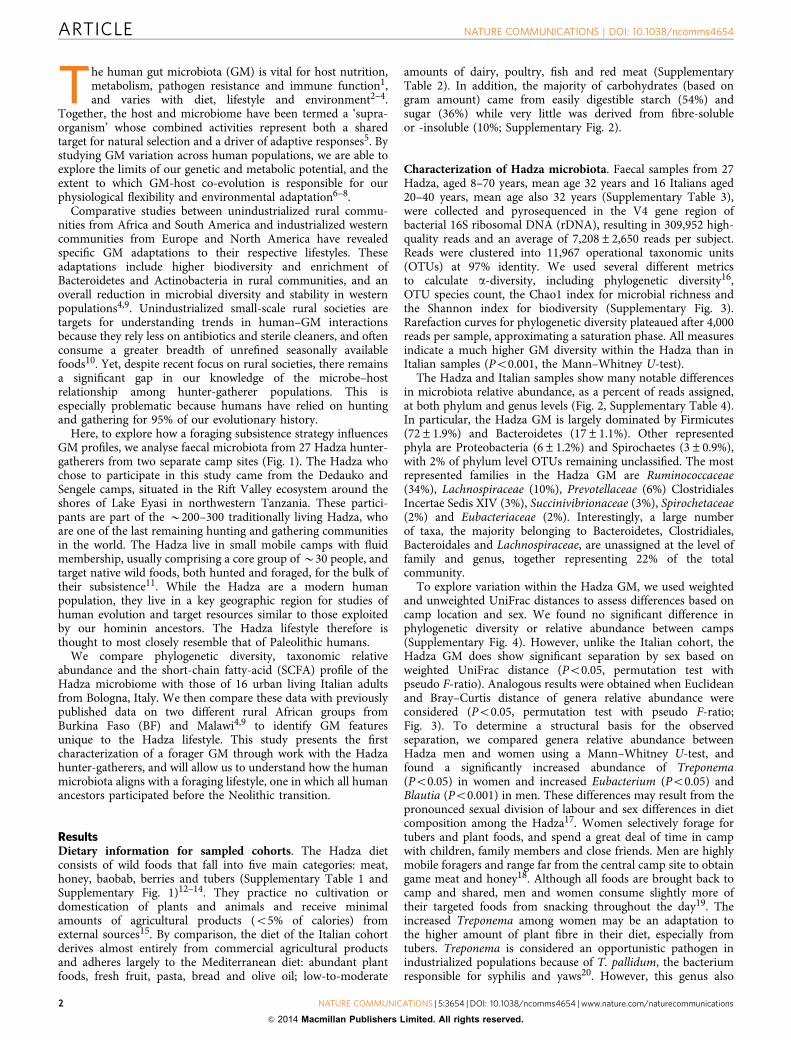
Here, to explore how a foraging subsistence strategy influencesGM profiles, we analyse faecal microbiota from 27 Hadza hunter-gatherers from two separate camp sites (Fig. 1). The Hadza whochose to participate in this study came from the Dedauko andSengele camps, situated in the Rift Valley ecosystem around theshores of Lake Eyasi in northwestern Tanzania. These partici-pants are part of the B200–300 traditionally living Hadza, whoare one of the last remaining hunting and gathering communitiesin the world. The Hadza live in small mobile camps with fluidmembership, usually comprising a core group of B30 people, andtarget native wild foods, both hunted and foraged, for the bulk oftheir subsistence11. While the Hadza are a modern humanpopulation, they live in a key geographic region for studies ofhuman evolution and target resources similar to those exploitedby our hominin ancestors. The Hadza lifestyle therefore isthought to most closely resemble that of Paleolithic humans.
We compare phylogenetic diversity, taxonomic relativeabundance and the short-chain fatty-acid (SCFA) profile of theHadza microbiome with those of 16 urban living Italian adultsfrom Bologna, Italy. We then compare these data with previouslypublished data on two different rural African groups fromBurkina Faso (BF) and Malawi4,9 to identify GM featuresunique to the Hadza lifestyle. This study presents the firstcharacterization of a forager GM through work with the Hadzahunter-gatherers, and will allow us to understand how the humanmicrobiota aligns with a foraging lifestyle, one in which all humanancestors participated before the Neolithic transition.
ResultsDietary information for sampled cohorts. The Hadza dietconsists of wild foods that fall into five main categories: meat,honey, baobab, berries and tubers (Supplementary Table 1 andSupplementary Fig. 1)12–14. They practice no cultivation ordomestication of plants and animals and receive minimalamounts of agricultural products (o5% of calories) fromexternal sources15. By comparison, the diet of the Italian cohortderives almost entirely from commercial agricultural productsand adheres largely to the Mediterranean diet: abundant plantfoods, fresh fruit, pasta, bread and olive oil; low-to-moderate
amounts of dairy, poultry, fish and red meat (SupplementaryTable 2). In addition, the majority of carbohydrates (based ongram amount) came from easily digestible starch (54%) andsugar (36%) while very little was derived from fibre-solubleor -insoluble (10%; Supplementary Fig. 2).
Characterization of Hadza microbiota. Faecal samples from 27Hadza, aged 8–70 years, mean age 32 years and 16 Italians aged20–40 years, mean age also 32 years (Supplementary Table 3),were collected and pyrosequenced in the V4 gene region ofbacterial 16S ribosomal DNA (rDNA), resulting in 309,952 high-quality reads and an average of 7,208±2,650 reads per subject.Reads were clustered into 11,967 operational taxonomic units(OTUs) at 97% identity. We used several different metricsto calculate a-diversity, including phylogenetic diversity16,OTU species count, the Chao1 index for microbial richness andthe Shannon index for biodiversity (Supplementary Fig. 3).Rarefaction curves for phylogenetic diversity plateaued after 4,000reads per sample, approximating a saturation phase. All measuresindicate a much higher GM diversity within the Hadza than inItalian samples (Po0.001, the Mann–Whitney U-test).
The Hadza and Italian samples show many notable differencesin microbiota relative abundance, as a percent of reads assigned,at both phylum and genus levels (Fig. 2, Supplementary Table 4).In particular, the Hadza GM is largely dominated by Firmicutes(72±1.9%) and Bacteroidetes (17±1.1%). Other representedphyla are Proteobacteria (6±1.2%) and Spirochaetes (3±0.9%),with 2% of phylum level OTUs remaining unclassified. The mostrepresented families in the Hadza GM are Ruminococcaceae(34%), Lachnospiraceae (10%), Prevotellaceae (6%) ClostridialesIncertae Sedis XIV (3%), Succinivibrionaceae (3%), Spirochetaceae(2%) and Eubacteriaceae (2%). Interestingly, a large numberof taxa, the majority belonging to Bacteroidetes, Clostridiales,Bacteroidales and Lachnospiraceae, are unassigned at the level offamily and genus, together representing 22% of the totalcommunity.
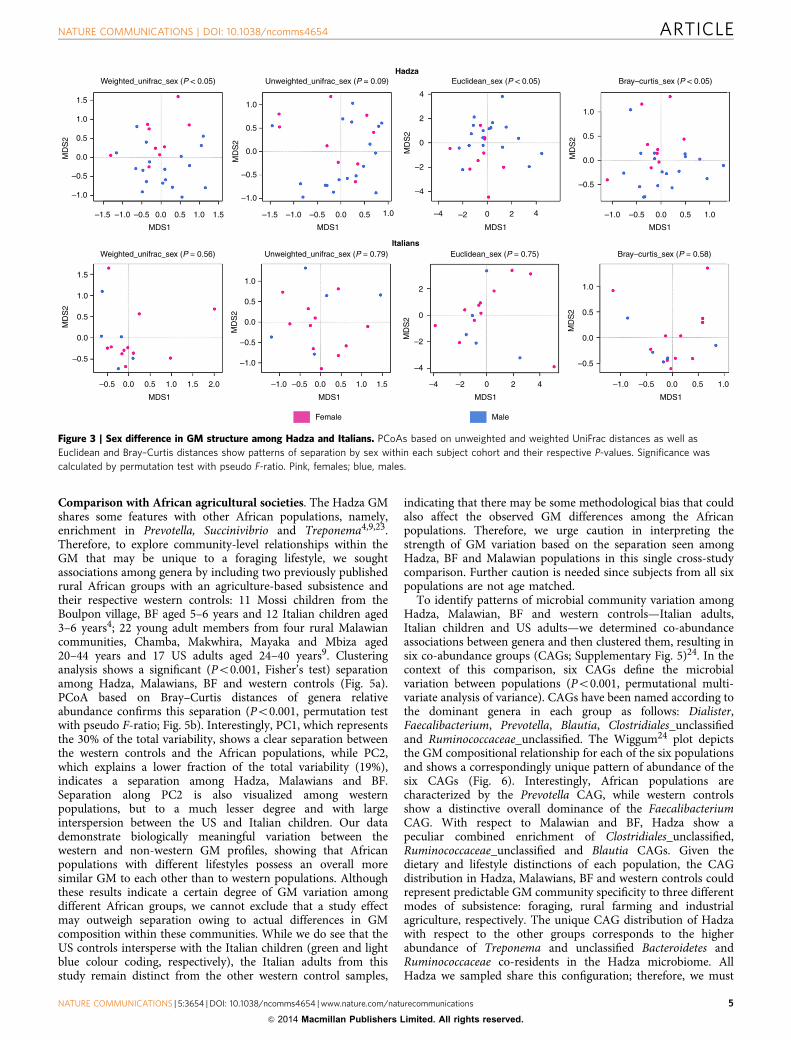
To explore variation within the Hadza GM, we used weightedand unweighted UniFrac distances to assess differences based oncamp location and sex. We found no significant difference inphylogenetic diversity or relative abundance between camps(Supplementary Fig. 4). However, unlike the Italian cohort, theHadza GM does show significant separation by sex based onweighted UniFrac distance (Po0.05, permutation test withpseudo F-ratio). Analogous results were obtained when Euclideanand Bray–Curtis distance of genera relative abundance wereconsidered (Po0.05, permutation test with pseudo F-ratio;Fig. 3). To determine a structural basis for the observedseparation, we compared genera relative abundance betweenHadza men and women using a Mann–Whitney U-test, andfound a significantly increased abundance of Treponema(Po0.05) in women and increased Eubacterium (Po0.05) andBlautia (Po0.001) in men. These differences may result from thepronounced sexual division of labour and sex differences in dietcomposition among the Hadza17. Women selectively forage fortubers and plant foods, and spend a great deal of time in campwith children, family members and close friends. Men are highlymobile foragers and range far from the central camp site to obtaingame meat and honey18. Although all foods are brought back tocamp and shared, men and women consume slightly more oftheir targeted foods from snacking throughout the day19. Theincreased Treponema among women may be an adaptation tothe higher amount of plant fibre in their diet, especially fromtubers. Treponema is considered an opportunistic pathogen inindustrialized populations because of T. pallidum, the bacteriumresponsible for syphilis and yaws20. However, this genus also
ARTICLE NATURE COMMUNICATIONS | DOI: 10.1038/ncomms4654
2 NATURE COMMUNICATIONS | 5:3654 | DOI: 10.1038/ncomms4654 | www.nature.com/naturecommunications
& 2014 Macmillan Publishers Limited. All rights reserved.
includes proficient cellulose and xylan hydrolyzers21, and it ispossible Treponema acts as a mutualistic component of theHadza GM to help with fibre degradation. The sex-baseddivisions in the Hadza lifestyle probably play a role in alteringcomposition abundance of the GM through different patternsof environmental and community exposure, such as thosepreviously viewed across age, geography or diet4,9. Furtherclarification of this division would require the inclusion ofmore Hadza women in the sample pool.
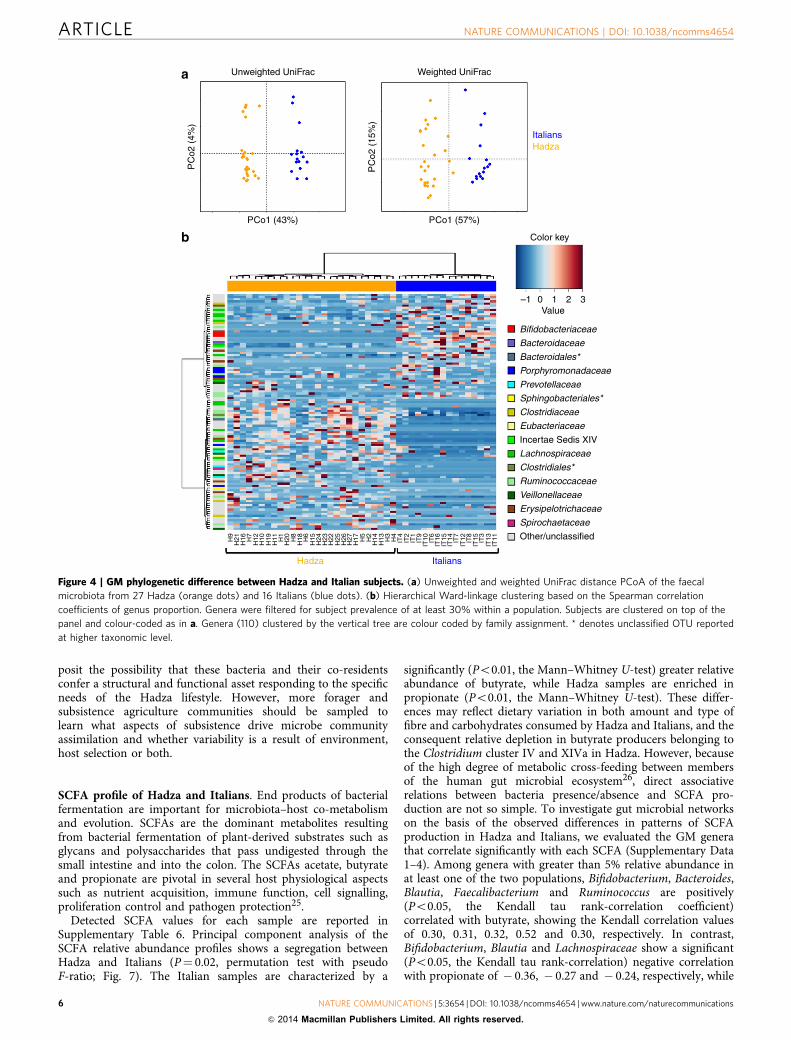
Detailed comparison with Italian controls. The Hadza andItalian GM profiles are quite distinct. Community structurevisualized using principal coordinates analysis (PCoA) ofweighted and unweighted UniFrac distances reveal a sharp seg-regation along PCo1, indicating a strong core division in GMphylogeny between Hadza and Italian individuals (Po0.001,permutation test with pseudo F-ratio; Fig. 4). Mean values ofunweighted UniFrac distances also reveal lower within-groupvariability of taxonomic diversity among Hadza than Italians(Po0.001, permutation test with pseudo F-ratio). This similarityin breadth of phylogenetic diversity among Hadza is probably aresult of close proximity community living with food sharing.
Camp movement is usually resource driven (food and water) andthe size and duration of camps vary greatly by season. In the dryseason, many groups congregate around water holes, which alsomake hunting more productive. During the wet season, groupsare small and much more scattered with often five or fewer adults.
Although Firmicutes and Bacteroidetes are the dominant phylain both Hadza and Italian GM, Hadza are characterized by arelatively higher abundance of Bacteroidetes and a lowerabundance of Firmicutes (Supplementary Table 4). The twoGM ecosystems are remarkably different with respect tosubdominant phyla (o10% relative abundance). Hadza arelargely enriched in Proteobacteria and Spirochaetes, which areextremely rare in the Italian GM, while Actinobacteria, animportant subdominant component of the Italian GM, arealmost completely absent from the Hadza microbiome. At thegenus level, the Hadza GM is comparatively enriched inPrevotella, Eubacterium, Oscillibacter, Butyricicoccus, Sporobacter,Succinivibrio and Treponema and correspondingly depletedin Bifidobacterium, Bacteroides, Blautia, Dorea, unclassifiedLachnospiraceae, Roseburia, Faecalibacterium, Ruminococcusand unclassified Erysipelotrichaceae. Moreover, there are manyunclassified genera belonging to Bacteroidetes, Clostridiales andRuminococcaceae in the Hadza GM, emphasizing our still limited
10
5
35
35
Tana
Ewaso Ng’iro
Athi
Galana
Pan
gani
Nzoia
ga
Kagera
Malagarasi
Gombe
Ugalla
We
mbe
re
WamiKinyasungwe
Ruf
i
ji
Gre
at
Ru
aha
Kilo
mbe
ro
Luwegu
Rio
Lug e
nda
Mes
sing
eR
io
L ua
ngw
a
Rungwa
Njom
be
RioRovuma
Mbwemburu
Tana
Malag a rasi
K
isigo
Ruvuma
Katum
b iki
Nkululu
INDIANOCEAN
LakeVictoria
LacKivu
LakeEyasi
LakeManyara
LakeNatron
LakeMweru
LakeBangweulu
LakeRukwa
LakeMtera
Lake
Tanganyika
LakeN
yasa
KENYA
UGANDA
RWANDA
BURUNDI
THECONGO
DEM. REP.OF THECONGO
ZAMBIA
MALAWI
ZAMBIA
MOZAMBIQUE
Masaka
JinjaEldoret
Meru
Mpika
Mbala
Entebbe Nanyuki
Kisumu
Butere
Garissa
Voi Malindi
Nakuru
Nyeri
Machakos
Magadi
Moba
Kasama
Mocímboada Praia
Goma
Mzuzu
Kasulu
Kilosa
MaguKahangara
Masasi
Mpanda
Newala
Ngara
Njombe
Same
Sengerema
Tukuyu
Tunduru
Ujiji
Mbamba Bay
Nansio
Chunya
Nachingwea
Liwale
Ifakara
Tunduma
Kalemie
Nkhata Bay
Maniamba
Palma
Mueda
Montepuez
Mombasa
Isoka
Pemba
Uvinza
Bukoba
Arusha
Lindi
Mbeya
Moshi
Mtwara
Musoma
Mwanza
Songea
Sumbawanga
Kigoma
Bujumbura
Kigali
Kampala
Nairobi
Dar es Salaam
Pemba
Zanzibar
Island
Kilimanjaro
Mount Kenya
Land boundary 1950s
Present day land access
Lake Eyasi
Lake
Man
yara
Ngorogoro Conservation Area
Maswa Game Reserve
Extent of Hadza camp sites
c
a
d
b
TANZANIA
Figure 1 | Location and scenery of Hadza land in Tanzania, Africa. In deep bush camps, hunting and gathering still make up the majority (490%)
of subsistence. (a) Location of Hadza land in northern Tanzania; (b) top of a rock ridge near Sengele camp overlooking a lush landscape in between
two phases of the rainy season; (c) extent of the land surrounding Lake Eyasi where Hadza make their camp sites, orange border denotes land area in
1950s and area in yellow shows the reduced area Hadza occupy today; (d) view of baobab trees within Hadza land during the early dry season.
Photo a modified from the CIA World Factbook. Photos b and d by SL Schnorr and AN Crittenden.
NATURE COMMUNICATIONS | DOI: 10.1038/ncomms4654 ARTICLE
NATURE COMMUNICATIONS | 5:3654 | DOI: 10.1038/ncomms4654 | www.nature.com/naturecommunications 3
& 2014 Macmillan Publishers Limited. All rights reserved.
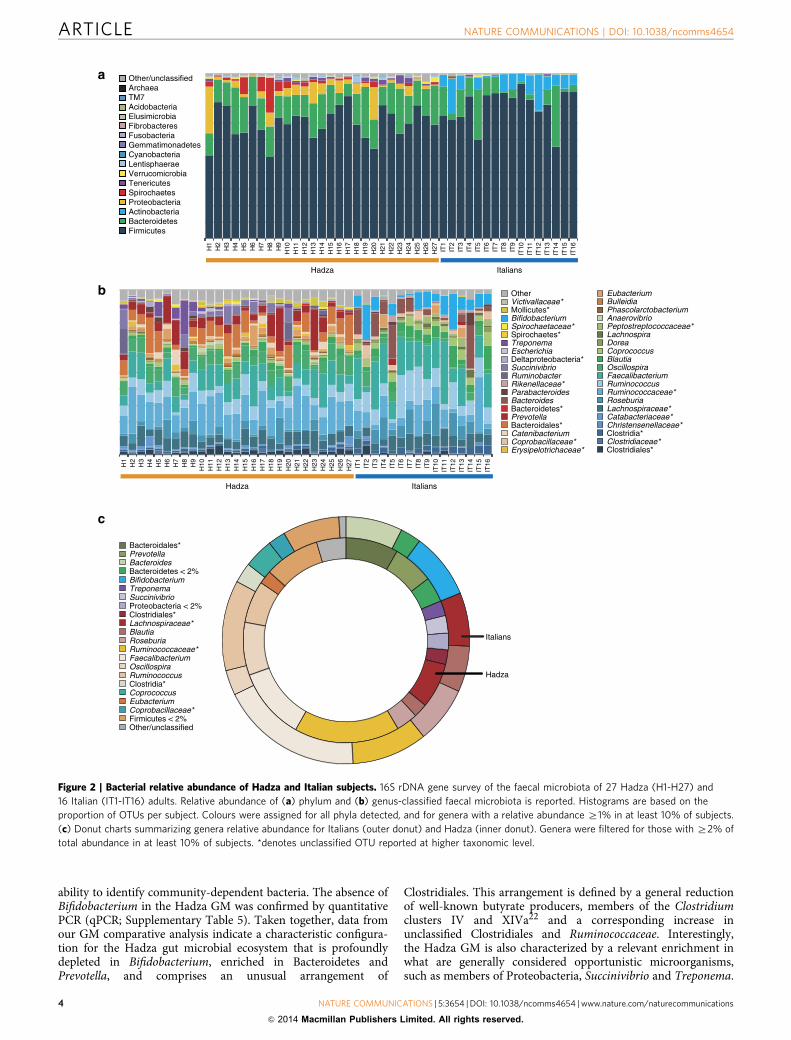
ability to identify community-dependent bacteria. The absence ofBifidobacterium in the Hadza GM was confirmed by quantitativePCR (qPCR; Supplementary Table 5). Taken together, data fromour GM comparative analysis indicate a characteristic configura-tion for the Hadza gut microbial ecosystem that is profoundlydepleted in Bifidobacterium, enriched in Bacteroidetes andPrevotella, and comprises an unusual arrangement of
Clostridiales. This arrangement is defined by a general reductionof well-known butyrate producers, members of the Clostridiumclusters IV and XIVa22 and a corresponding increase inunclassified Clostridiales and Ruminococcaceae. Interestingly,the Hadza GM is also characterized by a relevant enrichment inwhat are generally considered opportunistic microorganisms,such as members of Proteobacteria, Succinivibrio and Treponema.
a
c
Other/unclassifiedArchaeaTM7AcidobacteriaElusimicrobiaFibrobacteresFusobacteriaGemmatimonadetesCyanobacteriaLentisphaeraeVerrucomicrobiaTenericutesSpirochaetesProteobacteriaActinobacteriaBacteroidetesFirmicutes
H1
H2
H3
H4
H5
H6
H7
H8
H9
H10
H11
H12
H13
H14
H15
H16
H17
H18
H19
H20
H21
H22
H23
H24
H25
H26
H27 IT1
IT2
IT3
IT4
IT5
IT6
IT7
IT8
IT9
IT10
IT11
IT12
IT13
IT14
IT15
IT16
OtherVictivallaceae*Mollicutes*BifidobacteriumSpirochaetaceae*Spirochaetes*TreponemaEscherichiaDeltaproteobacteria*SuccinivibrioRuminobacterRikenellaceae*ParabacteroidesBacteroidesBacteroidetes*PrevotellaBacteroidales*CatenibacteriumCoprobacillaceae*Erysipelotrichaceae*
EubacteriumBulleidiaPhascolarctobacteriumAnaerovibrioPeptostreptococcaceae*LachnospiraDoreaCoprococcusBlautiaOscillospiraFaecalibacteriumRuminococcusRuminococcaceae*RoseburiaLachnospiraceae*Catabacteriaceae*Christensenellaceae*Clostridia*Clostridiaceae*Clostridiales*
H1
H2
H3
H4
H5
H6
H7
H8
H9
H10
H11
H12
H13
H14
H15
H16
H17
H18
H19
H20
H21
H22
H23
H24
H25
H26
H27 IT1
IT2
IT3
IT4
IT5
IT6
IT7
IT8
IT9
IT10
IT11
IT12
IT13
IT14
IT15
IT16
Bacteroidales*PrevotellaBacteroidesBacteroidetes < 2%BifidobacteriumTreponemaSuccinivibrioProteobacteria < 2%Clostridiales*Lachnospiraceae*BlautiaRoseburiaRuminococcaceae*FaecalibacteriumOscillospiraRuminococcusClostridia*CoprococcusEubacteriumCoprobacillaceae*Firmicutes < 2%Other/unclassified
Hadza
Italians
b
Hadza Italians
Hadza Italians
Figure 2 | Bacterial relative abundance of Hadza and Italian subjects. 16S rDNA gene survey of the faecal microbiota of 27 Hadza (H1-H27) and
16 Italian (IT1-IT16) adults. Relative abundance of (a) phylum and (b) genus-classified faecal microbiota is reported. Histograms are based on the
proportion of OTUs per subject. Colours were assigned for all phyla detected, and for genera with a relative abundance Z1% in at least 10% of subjects.
(c) Donut charts summarizing genera relative abundance for Italians (outer donut) and Hadza (inner donut). Genera were filtered for those with Z2% of
total abundance in at least 10% of subjects. *denotes unclassified OTU reported at higher taxonomic level.
ARTICLE NATURE COMMUNICATIONS | DOI: 10.1038/ncomms4654
4 NATURE COMMUNICATIONS | 5:3654 | DOI: 10.1038/ncomms4654 | www.nature.com/naturecommunications
& 2014 Macmillan Publishers Limited. All rights reserved.
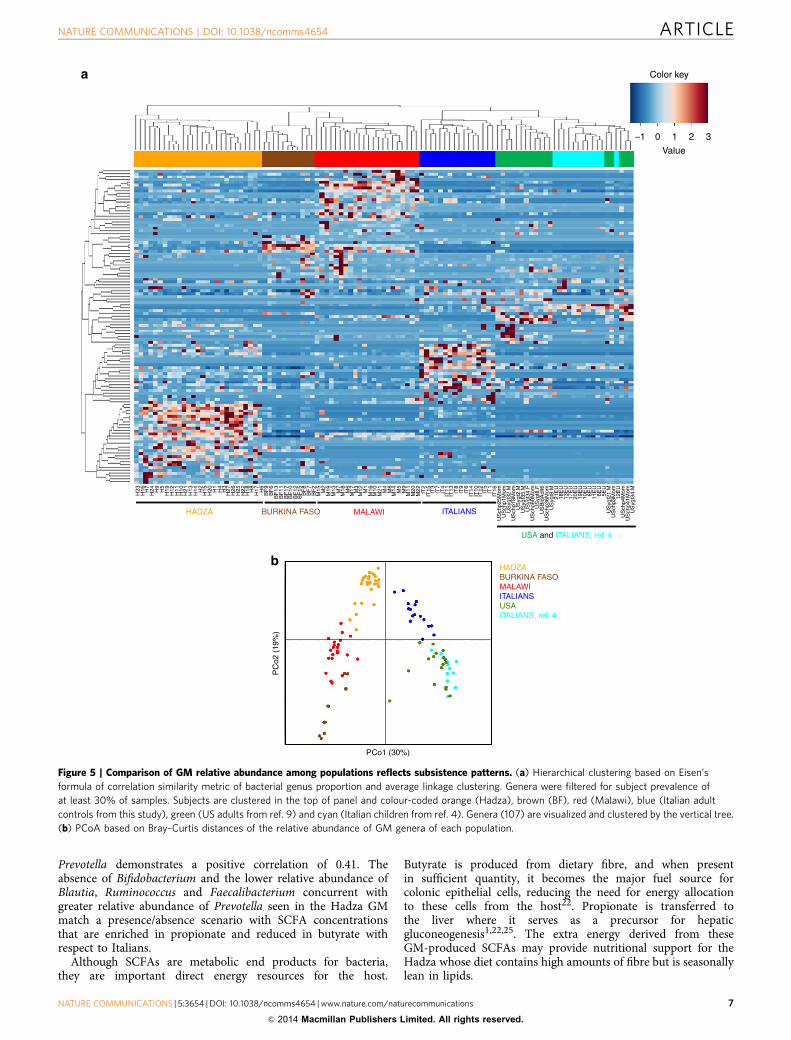
Comparison with African agricultural societies. The Hadza GMshares some features with other African populations, namely,enrichment in Prevotella, Succinivibrio and Treponema4,9,23.Therefore, to explore community-level relationships within theGM that may be unique to a foraging lifestyle, we soughtassociations among genera by including two previously publishedrural African groups with an agriculture-based subsistence andtheir respective western controls: 11 Mossi children from theBoulpon village, BF aged 5–6 years and 12 Italian children aged3–6 years4; 22 young adult members from four rural Malawiancommunities, Chamba, Makwhira, Mayaka and Mbiza aged20–44 years and 17 US adults aged 24–40 years9. Clusteringanalysis shows a significant (Po0.001, Fisher’s test) separationamong Hadza, Malawians, BF and western controls (Fig. 5a).PCoA based on Bray–Curtis distances of genera relativeabundance confirms this separation (Po0.001, permutation testwith pseudo F-ratio; Fig. 5b). Interestingly, PC1, which representsthe 30% of the total variability, shows a clear separation betweenthe western controls and the African populations, while PC2,which explains a lower fraction of the total variability (19%),indicates a separation among Hadza, Malawians and BF.Separation along PC2 is also visualized among westernpopulations, but to a much lesser degree and with largeinterspersion between the US and Italian children. Our datademonstrate biologically meaningful variation between thewestern and non-western GM profiles, showing that Africanpopulations with different lifestyles possess an overall moresimilar GM to each other than to western populations. Althoughthese results indicate a certain degree of GM variation amongdifferent African groups, we cannot exclude that a study effectmay outweigh separation owing to actual differences in GMcomposition within these communities. While we do see that theUS controls intersperse with the Italian children (green and lightblue colour coding, respectively), the Italian adults from thisstudy remain distinct from the other western control samples,
indicating that there may be some methodological bias that couldalso affect the observed GM differences among the Africanpopulations. Therefore, we urge caution in interpreting thestrength of GM variation based on the separation seen amongHadza, BF and Malawian populations in this single cross-studycomparison. Further caution is needed since subjects from all sixpopulations are not age matched.
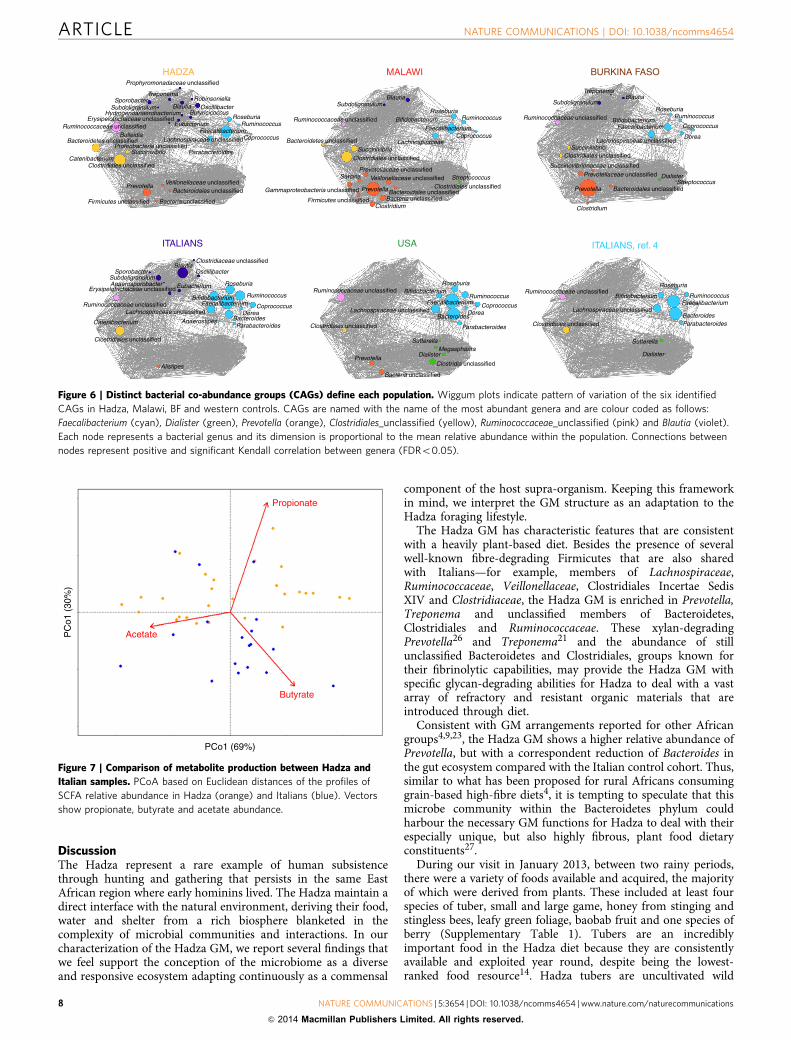
To identify patterns of microbial community variation amongHadza, Malawian, BF and western controls—Italian adults,Italian children and US adults—we determined co-abundanceassociations between genera and then clustered them, resulting insix co-abundance groups (CAGs; Supplementary Fig. 5)24. In thecontext of this comparison, six CAGs define the microbialvariation between populations (Po0.001, permutational multi-variate analysis of variance). CAGs have been named according tothe dominant genera in each group as follows: Dialister,Faecalibacterium, Prevotella, Blautia, Clostridiales_unclassifiedand Ruminococcaceae_unclassified. The Wiggum24 plot depictsthe GM compositional relationship for each of the six populationsand shows a correspondingly unique pattern of abundance of thesix CAGs (Fig. 6). Interestingly, African populations arecharacterized by the Prevotella CAG, while western controlsshow a distinctive overall dominance of the FaecalibacteriumCAG. With respect to Malawian and BF, Hadza show apeculiar combined enrichment of Clostridiales_unclassified,Ruminococcaceae_unclassified and Blautia CAGs. Given thedietary and lifestyle distinctions of each population, the CAGdistribution in Hadza, Malawians, BF and western controls couldrepresent predictable GM community specificity to three differentmodes of subsistence: foraging, rural farming and industrialagriculture, respectively. The unique CAG distribution of Hadzawith respect to the other groups corresponds to the higherabundance of Treponema and unclassified Bacteroidetes andRuminococcaceae co-residents in the Hadza microbiome. AllHadza we sampled share this configuration; therefore, we must
Hadza
Italians
Weighted_unifrac_sex (P < 0.05) Unweighted_unifrac_sex (P = 0.09) Euclidean_sex (P < 0.05) Bray–curtis_sex (P < 0.05)
Weighted_unifrac_sex (P = 0.56) Unweighted_unifrac_sex (P = 0.79) Euclidean_sex (P = 0.75) Bray–curtis_sex (P = 0.58)
MDS1
MDS1
MD
S2
1.5
1.0
0.5
0.0
–0.5
MD
S2
1.5
1.0
0.5
0.0
–0.5
1.5 2.01.00.50.0–0.5
–1.0
MD
S2
MD
S2
MD
S2
MD
S2
MD
S2
MD
S2
1.0
0.5
0.0
–0.5
1.0
0.5
0.0
–0.5
1.0
0.5
0.0
–0.5
1.00.50.0–1.0 –0.5
–1.0
1.0
0.5
0.0
–0.5
–1.0
1.51.00.50.0–0.5–1.0–1.5
MDS1
MDS1
Female
MDS1
MDS1
MDS1
1.00.50.0–1.0 –0.5
MDS1
1.00.50.0–0.5–1.0
1.0 1.50.50.0–0.5–1.0
–1.5
4
2
0
–2
–4
2
0
–2
–4
420–2–4
420–2–4
Male
Figure 3 | Sex difference in GM structure among Hadza and Italians. PCoAs based on unweighted and weighted UniFrac distances as well as
Euclidean and Bray–Curtis distances show patterns of separation by sex within each subject cohort and their respective P-values. Significance was
calculated by permutation test with pseudo F-ratio. Pink, females; blue, males.
NATURE COMMUNICATIONS | DOI: 10.1038/ncomms4654 ARTICLE
NATURE COMMUNICATIONS | 5:3654 | DOI: 10.1038/ncomms4654 | www.nature.com/naturecommunications 5
& 2014 Macmillan Publishers Limited. All rights reserved.
posit the possibility that these bacteria and their co-residentsconfer a structural and functional asset responding to the specificneeds of the Hadza lifestyle. However, more forager andsubsistence agriculture communities should be sampled tolearn what aspects of subsistence drive microbe communityassimilation and whether variability is a result of environment,host selection or both.
SCFA profile of Hadza and Italians. End products of bacterialfermentation are important for microbiota–host co-metabolismand evolution. SCFAs are the dominant metabolites resultingfrom bacterial fermentation of plant-derived substrates such asglycans and polysaccharides that pass undigested through thesmall intestine and into the colon. The SCFAs acetate, butyrateand propionate are pivotal in several host physiological aspectssuch as nutrient acquisition, immune function, cell signalling,proliferation control and pathogen protection25.
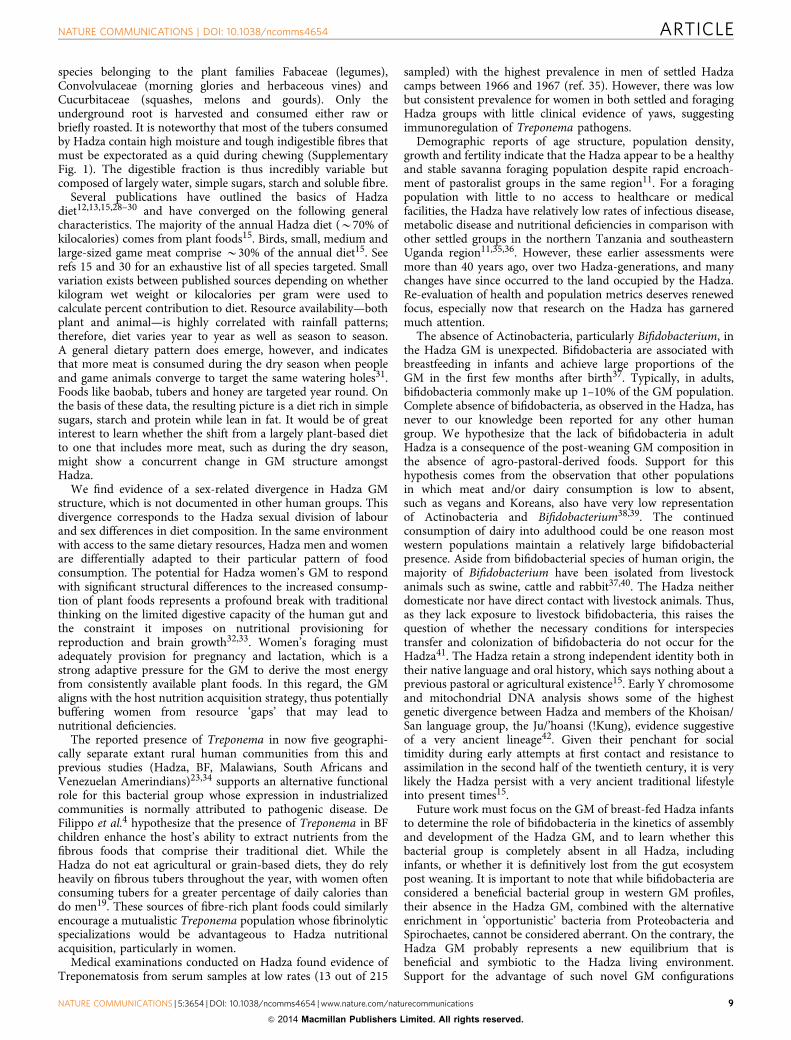
Detected SCFA values for each sample are reported inSupplementary Table 6. Principal component analysis of theSCFA relative abundance profiles shows a segregation betweenHadza and Italians (P¼ 0.02, permutation test with pseudoF-ratio; Fig. 7). The Italian samples are characterized by a
significantly (Po0.01, the Mann–Whitney U-test) greater relativeabundance of butyrate, while Hadza samples are enriched inpropionate (Po0.01, the Mann–Whitney U-test). These differ-ences may reflect dietary variation in both amount and type offibre and carbohydrates consumed by Hadza and Italians, and theconsequent relative depletion in butyrate producers belonging tothe Clostridium cluster IV and XIVa in Hadza. However, becauseof the high degree of metabolic cross-feeding between membersof the human gut microbial ecosystem26, direct associativerelations between bacteria presence/absence and SCFA pro-duction are not so simple. To investigate gut microbial networkson the basis of the observed differences in patterns of SCFAproduction in Hadza and Italians, we evaluated the GM generathat correlate significantly with each SCFA (Supplementary Data1–4). Among genera with greater than 5% relative abundance inat least one of the two populations, Bifidobacterium, Bacteroides,Blautia, Faecalibacterium and Ruminococcus are positively(Po0.05, the Kendall tau rank-correlation coefficient)correlated with butyrate, showing the Kendall correlation valuesof 0.30, 0.31, 0.32, 0.52 and 0.30, respectively. In contrast,Bifidobacterium, Blautia and Lachnospiraceae show a significant(Po0.05, the Kendall tau rank-correlation) negative correlationwith propionate of � 0.36, � 0.27 and � 0.24, respectively, while
a Unweighted UniFrac
PCo1 (43%)H
9H
21H
16 H7
H12
H10
H19
H11 H1
H20 H8
H18 H6
H15
H24
H23
H22
H25
H26
H27
H17 H5
H2
H14
H13 H3
H4
IT4
IT2
IT1
IT9
IT10 IT6
IT16
IT15
IT14 IT7
IT12 IT8
IT15 IT3
IT13
IT11
PCo1 (57%)
Bifidobacteriaceae
Color key
Bacteroidaceae
Bacteroidales*
Porphyromonadaceae
Prevotellaceae
Sphingobacteriales*
Clostridiaceae
Eubacteriaceae
Incertae Sedis XIV
Lachnospiraceae
Clostridiales*
Ruminococcaceae
Veillonellaceae
Erysipelotrichaceae
Spirochaetaceae
Other/unclassified
Hadza Italians
HadzaItalians
PC
o2 (
15%
)
PC
o2 (
4%)
Weighted UniFrac
b
Value–1 0 1 2 3
Figure 4 | GM phylogenetic difference between Hadza and Italian subjects. (a) Unweighted and weighted UniFrac distance PCoA of the faecal
microbiota from 27 Hadza (orange dots) and 16 Italians (blue dots). (b) Hierarchical Ward-linkage clustering based on the Spearman correlation
coefficients of genus proportion. Genera were filtered for subject prevalence of at least 30% within a population. Subjects are clustered on top of the
panel and colour-coded as in a. Genera (110) clustered by the vertical tree are colour coded by family assignment. * denotes unclassified OTU reported
at higher taxonomic level.
ARTICLE NATURE COMMUNICATIONS | DOI: 10.1038/ncomms4654
6 NATURE COMMUNICATIONS | 5:3654 | DOI: 10.1038/ncomms4654 | www.nature.com/naturecommunications
& 2014 Macmillan Publishers Limited. All rights reserved.
Prevotella demonstrates a positive correlation of 0.41. Theabsence of Bifidobacterium and the lower relative abundance ofBlautia, Ruminococcus and Faecalibacterium concurrent withgreater relative abundance of Prevotella seen in the Hadza GMmatch a presence/absence scenario with SCFA concentrationsthat are enriched in propionate and reduced in butyrate withrespect to Italians.
Although SCFAs are metabolic end products for bacteria,they are important direct energy resources for the host.
Butyrate is produced from dietary fibre, and when presentin sufficient quantity, it becomes the major fuel source forcolonic epithelial cells, reducing the need for energy allocationto these cells from the host22. Propionate is transferred tothe liver where it serves as a precursor for hepaticgluconeogenesis1,22,25. The extra energy derived from theseGM-produced SCFAs may provide nutritional support for theHadza whose diet contains high amounts of fibre but is seasonallylean in lipids.
Color key
–1 0 1 2 3
Value
a
bHADZABURKINA FASOMALAWIITALIANSUSAITALIANS, ref. 4
PCo1 (30%)
PC
o2 (
19%
)
HADZA BURKINA FASO MALAWI ITALIANS
USA and ITALIANS, ref. 4
H23
H16 H7
H24 H9
H5
H19
H12
H11
H10
H21
H13
H14 H
2H
15H
20 H1
H4
H3
H27
H26
H25
H22
H18 H8
H17 H
6B
F9
BF
6B
F13
BF
11B
F17
BF
10B
F12
BF
15B
F8
BF
7B
F2
M15 M2
M19
M13 M7
M3
M12 M1
M16
M10
M21 M4
M8
M14 M5
M9
M11
M20
M22 IT2
IT15 IT
3IT
7IT
4IT
11IT
13 IT8
IT9
IT6
IT14
IT10
IT12 IT5
IT1
IT16
US
chp2
5Mom
US
chp1
Mom
US
ygt3
2.M
US
chp1
8Mom
US
ygt2
.MU
Syg
t35.
MU
Syg
t34.
FU
Sch
p60M
omU
Syg
t8.F
US
Bld
Adl
t6U
Sch
p36M
omU
Syg
t8.M
21E
U18
EU
13E
U17
EU
20E
U19
EU
10E
U8E
U11
EU
6EU
5EU
US
ygt2
1.M
US
chp3
Mom
12E
UU
Sch
p4M
omU
Sch
p41M
omU
Syg
t34.
M
M18 M6
M17
Figure 5 | Comparison of GM relative abundance among populations reflects subsistence patterns. (a) Hierarchical clustering based on Eisen’s
formula of correlation similarity metric of bacterial genus proportion and average linkage clustering. Genera were filtered for subject prevalence of
at least 30% of samples. Subjects are clustered in the top of panel and colour-coded orange (Hadza), brown (BF), red (Malawi), blue (Italian adult
controls from this study), green (US adults from ref. 9) and cyan (Italian children from ref. 4). Genera (107) are visualized and clustered by the vertical tree.
(b) PCoA based on Bray–Curtis distances of the relative abundance of GM genera of each population.
NATURE COMMUNICATIONS | DOI: 10.1038/ncomms4654 ARTICLE
NATURE COMMUNICATIONS | 5:3654 | DOI: 10.1038/ncomms4654 | www.nature.com/naturecommunications 7
& 2014 Macmillan Publishers Limited. All rights reserved.
DiscussionThe Hadza represent a rare example of human subsistencethrough hunting and gathering that persists in the same EastAfrican region where early hominins lived. The Hadza maintain adirect interface with the natural environment, deriving their food,water and shelter from a rich biosphere blanketed in thecomplexity of microbial communities and interactions. In ourcharacterization of the Hadza GM, we report several findings thatwe feel support the conception of the microbiome as a diverseand responsive ecosystem adapting continuously as a commensal
component of the host supra-organism. Keeping this frameworkin mind, we interpret the GM structure as an adaptation to theHadza foraging lifestyle.
The Hadza GM has characteristic features that are consistentwith a heavily plant-based diet. Besides the presence of severalwell-known fibre-degrading Firmicutes that are also sharedwith Italians—for example, members of Lachnospiraceae,Ruminococcaceae, Veillonellaceae, Clostridiales Incertae SedisXIV and Clostridiaceae, the Hadza GM is enriched in Prevotella,Treponema and unclassified members of Bacteroidetes,Clostridiales and Ruminococcaceae. These xylan-degradingPrevotella26 and Treponema21 and the abundance of stillunclassified Bacteroidetes and Clostridiales, groups known fortheir fibrinolytic capabilities, may provide the Hadza GM withspecific glycan-degrading abilities for Hadza to deal with a vastarray of refractory and resistant organic materials that areintroduced through diet.
Consistent with GM arrangements reported for other Africangroups4,9,23, the Hadza GM shows a higher relative abundance ofPrevotella, but with a correspondent reduction of Bacteroides inthe gut ecosystem compared with the Italian control cohort. Thus,similar to what has been proposed for rural Africans consuminggrain-based high-fibre diets4, it is tempting to speculate that thismicrobe community within the Bacteroidetes phylum couldharbour the necessary GM functions for Hadza to deal with theirespecially unique, but also highly fibrous, plant food dietaryconstituents27.
During our visit in January 2013, between two rainy periods,there were a variety of foods available and acquired, the majorityof which were derived from plants. These included at least fourspecies of tuber, small and large game, honey from stinging andstingless bees, leafy green foliage, baobab fruit and one species ofberry (Supplementary Table 1). Tubers are an incrediblyimportant food in the Hadza diet because they are consistentlyavailable and exploited year round, despite being the lowest-ranked food resource14. Hadza tubers are uncultivated wild
HADZA
ITALIANS
MALAWI
USA
BURKINA FASO
ITALIANS, ref. 4
Prophyromonadaceae unclassified
TreponemaRobinsoniella
Blautia
Blautia
Blautia BlautiaSporobacter
Sporobacter
Subdoligranulum
Subdoligranulum
Subdoligranulum SubdoligranulumOscillibacter
Oscillibacter
ButyricicoccusRoseburia
Roseburia Roseburia Roseburia
Roseburia Roseburia
Ruminococcus
Ruminococcus Ruminococcus Ruminococcus
Ruminococcus RuminococcusEubacterium
Eubacterium
HydrogenoanaerobacteriumErysipelotrichaceae unclassified
Ruminococcaceae unclassified
Ruminococcaceae unclassified
Ruminococcaceae unclassified Ruminococcaceae unclassified
Ruminococcaceae unclassified Ruminococcaceae unclassified
BulleidiaBacteroidetes unclassified Bacteroidetes unclassified
Faecalibacterium Faecalibacterium
Faecalibacterium Faecalibacterium Faecalibacterium
Faecalibacterium
Coprococcus
Coprococcus Coprococcus
Coprococcus
Coprococcus
Lachnospiraceae unclassified
Lachnospiraceae unclassified Lachnospiraceae unclassifiedLachnospiraceae unclassified
Lachnospiraceae unclassifiedLachnospiraceaeProteobacteria unclassified
Succinivibrio Succinivibrio Succinivibrio
Catenibacterium
Catenibacterium
Clostridiales unclassified
Clostridiales unclassified Clostridiales unclassified
Clostridiales unclassified
Clostridiales unclassified
Clostridiales unclassifiedClostridiales unclassified
Prevotella
Prevotella
Prevotella Prevotella
Parabacteroides
Parabacteroides Parabacteroides Parabacteroides
Veillonellaceae unclassifiedVeillonellaceae unclassified
Bacteroidales unclassified Bacteroidales unclassified Bacteroidales unclassified
Bacteria unclassified
Bacteria unclassified
Bacteria unclassifiedFirmicutes unclassified Firmicutes unclassified
StreptococcusStreptococcus
Prevotellaceae unclassifiedPrevotellaceae unclassifiedSarcina
Gammaproteobacteria unclassified
Clostridium Clostridium
Bifidobacterium
BifidobacteriumBifidobacterium
Bifidobacterium
Bifidobacterium
Dorea
Dorea Dorea
Succinovibrionaceae unclassified
Dialister
Dialister Dialister
Treponema
Anaerostipes
Alistipes
AnaerosporobacterErysipelotrichaceae unclassified
Bacteroides Bacteroides Bacteroides
Clostridiaceae unclassified
Clostridia unclassified
MegasphaeraSutterella Sutterella
Figure 6 | Distinct bacterial co-abundance groups (CAGs) define each population. Wiggum plots indicate pattern of variation of the six identified
CAGs in Hadza, Malawi, BF and western controls. CAGs are named with the name of the most abundant genera and are colour coded as follows:
Faecalibacterium (cyan), Dialister (green), Prevotella (orange), Clostridiales_unclassified (yellow), Ruminococcaceae_unclassified (pink) and Blautia (violet).
Each node represents a bacterial genus and its dimension is proportional to the mean relative abundance within the population. Connections between
nodes represent positive and significant Kendall correlation between genera (FDRo0.05).
PC
o1 (
30%
)
PCo1 (69%)
Acetate
Butyrate
Propionate
Figure 7 | Comparison of metabolite production between Hadza and
Italian samples. PCoA based on Euclidean distances of the profiles of
SCFA relative abundance in Hadza (orange) and Italians (blue). Vectors
show propionate, butyrate and acetate abundance.
ARTICLE NATURE COMMUNICATIONS | DOI: 10.1038/ncomms4654
8 NATURE COMMUNICATIONS | 5:3654 | DOI: 10.1038/ncomms4654 | www.nature.com/naturecommunications
& 2014 Macmillan Publishers Limited. All rights reserved.
species belonging to the plant families Fabaceae (legumes),Convolvulaceae (morning glories and herbaceous vines) andCucurbitaceae (squashes, melons and gourds). Only theunderground root is harvested and consumed either raw orbriefly roasted. It is noteworthy that most of the tubers consumedby Hadza contain high moisture and tough indigestible fibres thatmust be expectorated as a quid during chewing (SupplementaryFig. 1). The digestible fraction is thus incredibly variable butcomposed of largely water, simple sugars, starch and soluble fibre.
Several publications have outlined the basics of Hadzadiet12,13,15,28–30 and have converged on the following generalcharacteristics. The majority of the annual Hadza diet (B70% ofkilocalories) comes from plant foods15. Birds, small, medium andlarge-sized game meat comprise B30% of the annual diet15. Seerefs 15 and 30 for an exhaustive list of all species targeted. Smallvariation exists between published sources depending on whetherkilogram wet weight or kilocalories per gram were used tocalculate percent contribution to diet. Resource availability—bothplant and animal—is highly correlated with rainfall patterns;therefore, diet varies year to year as well as season to season.A general dietary pattern does emerge, however, and indicatesthat more meat is consumed during the dry season when peopleand game animals converge to target the same watering holes31.Foods like baobab, tubers and honey are targeted year round. Onthe basis of these data, the resulting picture is a diet rich in simplesugars, starch and protein while lean in fat. It would be of greatinterest to learn whether the shift from a largely plant-based dietto one that includes more meat, such as during the dry season,might show a concurrent change in GM structure amongstHadza.
We find evidence of a sex-related divergence in Hadza GMstructure, which is not documented in other human groups. Thisdivergence corresponds to the Hadza sexual division of labourand sex differences in diet composition. In the same environmentwith access to the same dietary resources, Hadza men and womenare differentially adapted to their particular pattern of foodconsumption. The potential for Hadza women’s GM to respondwith significant structural differences to the increased consump-tion of plant foods represents a profound break with traditionalthinking on the limited digestive capacity of the human gut andthe constraint it imposes on nutritional provisioning forreproduction and brain growth32,33. Women’s foraging mustadequately provision for pregnancy and lactation, which is astrong adaptive pressure for the GM to derive the most energyfrom consistently available plant foods. In this regard, the GMaligns with the host nutrition acquisition strategy, thus potentiallybuffering women from resource ‘gaps’ that may lead tonutritional deficiencies.
The reported presence of Treponema in now five geographi-cally separate extant rural human communities from this andprevious studies (Hadza, BF, Malawians, South Africans andVenezuelan Amerindians)23,34 supports an alternative functionalrole for this bacterial group whose expression in industrializedcommunities is normally attributed to pathogenic disease. DeFilippo et al.4 hypothesize that the presence of Treponema in BFchildren enhance the host’s ability to extract nutrients from thefibrous foods that comprise their traditional diet. While theHadza do not eat agricultural or grain-based diets, they do relyheavily on fibrous tubers throughout the year, with women oftenconsuming tubers for a greater percentage of daily calories thando men19. These sources of fibre-rich plant foods could similarlyencourage a mutualistic Treponema population whose fibrinolyticspecializations would be advantageous to Hadza nutritionalacquisition, particularly in women.
Medical examinations conducted on Hadza found evidence ofTreponematosis from serum samples at low rates (13 out of 215
sampled) with the highest prevalence in men of settled Hadzacamps between 1966 and 1967 (ref. 35). However, there was lowbut consistent prevalence for women in both settled and foragingHadza groups with little clinical evidence of yaws, suggestingimmunoregulation of Treponema pathogens.
Demographic reports of age structure, population density,growth and fertility indicate that the Hadza appear to be a healthyand stable savanna foraging population despite rapid encroach-ment of pastoralist groups in the same region11. For a foragingpopulation with little to no access to healthcare or medicalfacilities, the Hadza have relatively low rates of infectious disease,metabolic disease and nutritional deficiencies in comparison withother settled groups in the northern Tanzania and southeasternUganda region11,35,36. However, these earlier assessments weremore than 40 years ago, over two Hadza-generations, and manychanges have since occurred to the land occupied by the Hadza.Re-evaluation of health and population metrics deserves renewedfocus, especially now that research on the Hadza has garneredmuch attention.
The absence of Actinobacteria, particularly Bifidobacterium, inthe Hadza GM is unexpected. Bifidobacteria are associated withbreastfeeding in infants and achieve large proportions of theGM in the first few months after birth37. Typically, in adults,bifidobacteria commonly make up 1–10% of the GM population.Complete absence of bifidobacteria, as observed in the Hadza, hasnever to our knowledge been reported for any other humangroup. We hypothesize that the lack of bifidobacteria in adultHadza is a consequence of the post-weaning GM composition inthe absence of agro-pastoral-derived foods. Support for thishypothesis comes from the observation that other populationsin which meat and/or dairy consumption is low to absent,such as vegans and Koreans, also have very low representationof Actinobacteria and Bifidobacterium38,39. The continuedconsumption of dairy into adulthood could be one reason mostwestern populations maintain a relatively large bifidobacterialpresence. Aside from bifidobacterial species of human origin, themajority of Bifidobacterium have been isolated from livestockanimals such as swine, cattle and rabbit37,40. The Hadza neitherdomesticate nor have direct contact with livestock animals. Thus,as they lack exposure to livestock bifidobacteria, this raises thequestion of whether the necessary conditions for interspeciestransfer and colonization of bifidobacteria do not occur for theHadza41. The Hadza retain a strong independent identity both intheir native language and oral history, which says nothing about aprevious pastoral or agricultural existence15. Early Y chromosomeand mitochondrial DNA analysis shows some of the highestgenetic divergence between Hadza and members of the Khoisan/San language group, the Ju/’hoansi (!Kung), evidence suggestiveof a very ancient lineage42. Given their penchant for socialtimidity during early attempts at first contact and resistance toassimilation in the second half of the twentieth century, it is verylikely the Hadza persist with a very ancient traditional lifestyleinto present times15.
Future work must focus on the GM of breast-fed Hadza infantsto determine the role of bifidobacteria in the kinetics of assemblyand development of the Hadza GM, and to learn whether thisbacterial group is completely absent in all Hadza, includinginfants, or whether it is definitively lost from the gut ecosystempost weaning. It is important to note that while bifidobacteria areconsidered a beneficial bacterial group in western GM profiles,their absence in the Hadza GM, combined with the alternativeenrichment in ‘opportunistic’ bacteria from Proteobacteria andSpirochaetes, cannot be considered aberrant. On the contrary, theHadza GM probably represents a new equilibrium that isbeneficial and symbiotic to the Hadza living environment.Support for the advantage of such novel GM configurations
NATURE COMMUNICATIONS | DOI: 10.1038/ncomms4654 ARTICLE
NATURE COMMUNICATIONS | 5:3654 | DOI: 10.1038/ncomms4654 | www.nature.com/naturecommunications 9
& 2014 Macmillan Publishers Limited. All rights reserved.
comes from the finding that GM restructuring also occurs incentenarians43, who are extreme examples of organismalrobusticity. In addition, these findings illustrate a need toreevaluate the standards by which we consider GM ‘healthy’ or‘unhealthy’, as they are clearly context dependent.
GM diversity, as found in rural African populations and now inthe Hadza, is almost certainly the ancestral state for humans.Adaptation to the post-industrialized western lifestyle iscoincident with a reduction in GM diversity, and as a result, adecline in GM stability. Diversity and stability are factors withmajor health implications, particularly now that the humangastrointestinal tract is increasingly recognized as the gateway topathogenic, metabolic and immunologic diseases44. Co-speciationbetween host and microbiota over millions of years has shapedboth sets of organisms into mutualistic supra-organisms.Dissolving that contact through sterilization and limitedenvironmental exposure has had a drastic effect on health andimmune function of modern westernized human groups. TheHadza GM is likely an ‘old friend’ and stable arrangement fittingtheir traditional hunter-gatherer lifestyle45.
We are only just beginning to document GM diversity acrosspopulations. In our study, more than 33% of the total Hadza GMgenera remain unidentified. Such taxonomic uncertainty holdsexciting prospects for discovering yet unknown microbial geneticarrangements. This finding also underscores the importance ofincreasing our reference phylogenies and resolving deep taxo-nomic relationships between bacteria by sampling a wider varietyof environments and extreme ecological zones7.
In summary, the characterization of the Hadza GM presents asuite of unique features that suggest specific adaptation to aforaging lifestyle, which includes a large proportion of highlyrefractory plant foods. We expect that detailed study of thefunction of this GM community will expose a greater number ofgenetic specializations for degrading polysaccharides than what iscurrently found in other human populations. When viewedbroadly, inconsistencies in associations among GM structure, dietand disease belie interpretive confidence about GM phenotypes.The functional redundancy found in bacterial communitiesindicates that microbial activity, rather than composition, isconserved. However, the ability of novel genes to propagatethrough environmental transfer into common gut bacteriacomplicates the enterotype–function paradigm. Moreover,closely related human symbiont microorganisms have beendemonstrated to differ widely in their glycan use phenotypesand corresponding genomic structures46. Even if taxonomicsimilarities do exist between human populations, at finer scalestheir GM communities may exhibit dramatic metabolicdifferences tailored to suit disparate environmental constraints.With a microbiome functional assignment rate at 60% (ref. 2),these questions need to be resolved by testing GM activity usingin vivo techniques such as with gnotobiotic mice47 or in vitrotechniques such as with computer-controlled simulations of thelarge intestine48. Furthermore, comparative analysis between thehuman and great ape GM, especially with members of Pan, willhighlight important distinctions that enabled early humanancestors to extend their dietary and ecological ranges withoutthe need for technological buffering. Host–microbiomemutualism holds great relevance to the field of humanevolution as it vastly propels the genetic landscape foradaptation well beyond somatic potential.
MethodsSubject enrollment. The 27 Hadza volunteers who participated in this study camefrom the Dedauko and Sengele camps and are part of the B200–300 traditionallyliving Hadza. Faecal samples were collected over a period of 2 weeks in January2013 from consenting healthy participants. All participants were first told of the
study, its objectives and their role as volunteers. Since Hadza are non-literate,verbal consent was obtained by those who agreed to participate, and this wasdocumented by a separate witness. In the case of young Hadza, we obtained verbalassent from the youths and verbal consent from the parents, which was againdocumented by a separate witness. Samples were matched with subject interviewsto record age, sex and health status, but because of ambiguity with regard to age ofsome of the participants, this information was excluded from further analysis. Allwork was approved by the University of Leipzig Ethik-Kommission review boardon 29 May 2012, reference number 164-12-21052012. Permission for this workwas granted from the Tanzanian Commission for Science and Technology(COSTECH), permit number 2012-315-NA-2000-80.
Sixteen Italian adults (age: 20–40 years) were recruited for this study in thegreater Bologna metropolitan area. All subjects were healthy and had not receivedantibiotics, probiotics or prebiotics for at least 3 months before sampling. Writteninformed consent was obtained from the subjects enrolled. Samples were collectedbetween March and April 2013. Twenty-four hour dietary recalls were provided byeach enrolled subject for 3 days. We used the standard method in nutritionalscience of sampling 2 week days and 1 weekend day in an attempt to fully accountfor dietary habit and fluctuation. Records were entered and analysed using theFood Processor SQL version 10.13.0 and compiled for summary reporting of themain caloric contributions by food group and macronutrient.
Sample collection and storage. Hadza samples were handled and storedfollowing previously described methods49. In brief, samples were submerged in30 ml of 97% ethanol for 24–36 h, after which the ethanol was carefully poured outand the remaining solid material was transferred to 50 ml tubes containing silicabeads (Sigma 10087). All Hadza samples were transported by express to Bologna,Italy where further analysis was performed. Italian samples were collected, driedusing the two-step ethanol and silica procedure, and stored at � 80 �C in Bolognauntil further use.
Comparison of dry and frozen faecal samples. Hadza stool samples could notremain frozen during their removal from Tanzania because of unreliable sourcingof dry ice shipping materials, so we first performed a comparison of DNAextraction and amplification and SCFA quantification on split samples ofGermany-living westerners. Stool samples were split into two segments, onefraction was stored at � 80 �C and the second was dried using the two-stepethanol/silica procedure as described above. Total DNA extraction yield,pyrosequencing of the 16S rDNA V4 gene region and SCFA relative abundancequantification were performed (as described below) in parallel from frozen anddried sample aliquots. According to our data, we obtained comparable DNA yield,GM profiles and SCFA relative abundance profiles from frozen and dry aliquots ofthe same stool (Supplementary Table 7). GM profiles were shown to cluster bysubject independent of the storage method (Supplementary Fig. 6). Taken together,these data support the reliability of the drying method for use in stool storage.
DNA extraction from faecal samples. Total DNA from faecal material wasextracted using QIAamp DNA Stool Mini Kit (QIAGEN) with a modified protocol.In brief, 250 mg of faeces were suspended in 1 ml of lysis buffer (500 mM NaCl,50 mM Tris–HCl pH 8, 50 mM EDTA, 4% SDS). Four 3 mm glass beads and 0.5 gof 0.1 mm zirconia beads (BioSpec Products) were added, and the samples weretreated in FastPrep (MP Biomedicals) at 5.5 movements per second for 3 min.Samples were heated at 95 �C for 15 min, and then centrifuged for 5 min at fullspeed to pellet stool particles. Supernatants were collected and 260 ml of 10 Mammonium acetate was added, followed by incubation in ice for 5 min andcentrifugation at full speed for 10 min. One volume of isopropanol was added toeach supernatant and incubated in ice for 30 min. The precipitated nucleic acidswere collected by centrifugation for 15 min at full speed and washed with ethanol70%. Pellets were resuspended in 100 ml of TE buffer and treated with 2 ml ofDNase-free RNase (10 mg ml� 1) at 37 �C for 15 min. Protein removal byProteinase K treatment and DNA purification with QIAamp Mini Spin columnswere performed following the kit protocol. Final DNA concentration wasdetermined by using NanoDrop ND-1000 (NanoDrop Technologies).
16S rDNA gene amplification. For the amplification of the V4 region of the16S rDNA gene, the primer set 520F (50-AYTGGGYDTAAAGNG-30) and 802R(50-TACNVGGGTATCTAATCC-30) (with Y¼C/T, D¼A/G/T, N¼ any base,V¼A/C/G) was used. These primers were designed to include at their 50-end oneof the two adaptor sequences used in the 454-sequencing library preparationprotocol (adaptor A and B), linked to a unique MID tag barcode of 10 basesallowing the identification of the different samples. PCR mixtures contained 0.5 mMof each forward and reverse primer, 100 ng of template DNA, 2.5 U of GoTaq FlexiPolymerase (Promega), 200 mM of dNTPs and 2 mM of MgCl2 in a final volume of50 ml. Thermal cycling consisted of an initial denaturation step at 95 �C for 5 min,followed by 35 cycles of denaturation at 94 �C for 50 s, annealing at 40 �C for 30 sand extension at 72 �C for 60 s, with a final extension step at 72 �C for 5 min(ref. 50). PCR amplifications were carried out in a Biometra Thermal Cycler TGradient (Biometra).
ARTICLE NATURE COMMUNICATIONS | DOI: 10.1038/ncomms4654
10 NATURE COMMUNICATIONS | 5:3654 | DOI: 10.1038/ncomms4654 | www.nature.com/naturecommunications
& 2014 Macmillan Publishers Limited. All rights reserved.
qPCR for Bifidobacterium quantification. qPCR was carried out in a LightCyclerinstrument (Roche). Quantification of the 16S rRNA gene of Bifidobacterium wasperformed with previously described genus-specific primers bif-164 and bif-662(ref. 51). For quantification, standard curves were generated by using 10-fold serialdilution of genomic DNA from B. animalis subspecies lactis BI07. Amplificationwas carried out in a 20-ml final volume containing 100 ng of faecal DNA, 0.5 mM ofeach primer and 4 ml of LightCycler-FastStart DNA Master SYBR Green I (Roche).Amplifications were done under the following conditions: (i) startingpreincubation at 95 �C for 10 min; (ii) amplification including 35 cycles of foursteps each at the temperature transition rate of 20 �C s� 1: denaturation at 95 �C for15 s, annealing at 63 �C for 20 s, extension at 72 �C for 30 s and fluorescenceacquisition at 90 �C for 5 s; and (iii) melting curve analysis.
Pyrosequencing of faecal slurries. The PCR products derived from amplificationof the specific 16S rDNA V4 hypervariable region were individually purified withMinElute PCR Purification Kit (QIAGEN) and then quantified using the Quant-iTPicoGreen dsDNA kit (Invitrogen). After the individual quantification step,amplicons were pooled in equal amounts (thus, creating three 9-plex for Hadzasamples and two 8-plex pools for Italian samples) and again purified by 454-RocheDouble Ampure size selection protocol with Agencourt AMPure XP DNApurification beads (Beckman Coulter Genomics GmbH) to remove primer dimers,according to the manufacturer’s instructions (454 LifeSciences, Roche). Ampliconpools were fixed to microbeads to be clonally amplified by performing an emulsionPCR following the GS-FLX protocol Titanium emPCR LIB-A (454 LifeSciences,Roche). Following this amplification step, the beads were enriched to keep onlythose carrying identical PCR products on their surface, and then loaded onto apicotiter plate for pyrosequencing reactions, according to the GS-FLX Titaniumsequencing protocol. All pools were sequenced in one-eighth of a plate each.
Bioinformatic analysis of 16S rDNA and statistical methods. Sequencing readswere analysed using the QIIME pipeline52 as described previously24. In brief, V4sequences were filtered according to the following criteria: (i) read length notshorter than 150 bp and not longer than 350 bp; (ii) no ambiguous bases (Ns); (iii)a minimum average quality score over a 50-bp rolling window of 25; and (iv) exactmatch to primer sequences and maximum 1 error in barcode tags. For bacterialtaxonomy assignment, we used RDP-classifier (version 2.2) with 50% as confidencevalue threshold. Trimmed reads were clustered into OTUs at 97% identity level andfurther filtered for chimeric sequences using ChimeraSlayer (http://www.microbiomeutil.sourceforge.net/#A_CS). Alpha-diversity and rarefactionplots were computed using four different metrics: Shannon, PD whole tree, chao1and observed species. Weighted and unweighted UniFrac distances and Euclideandistance of genus-level relative abundance were used to perform PCoA. PCoA,heatmap and bar plots were built using the packages Made4 (ref. 53) and Vegan(http://www.cran.r-project.org/package=vegan).
The R packages Stats and Vegan were used to perform statistical analysis.In particular, to compare GM structure among different populations for a and bdiversity, we used a Wilcoxon-signed rank test. Data separation in the PCoA wastested using a permutation test with pseudo F-ratios (function Adonis in the Veganpackage). Cluster separation in hierarchical clustering analyses was assessedfor significance using Fisher’s exact test. Significant differences in phylum orgenus-level abundance between Hadza and Italians, and between Hadza males andfemales, were assessed by Mann–Whitney U-tests, and corrected for multiplecomparisons using the Benjamini–Hochberg method when appropriate. Falsediscovery rate (FDR)o0.05 was considered as statistically significant.
The Kendall correlation test between SCFA levels and the relative abundance ofgenera was achieved using function ‘cor.test’ of the package ‘Stats’ of R. Sequencesfrom refs 9 and 4 and were obtained from Metagenomics Rapid Annotation usingSubsystem Technology (MG-RAST), project I.D. 201 and European NucleotideArchive, project number ERP000133, repositories, respectively, and processed andassigned following the QIIME pipeline. Bacterial CAGs were determined asdescribed previously24. In brief, the associations among the genera were evaluatedusing the Kendall correlation test, visualized using hierarchical Ward clusteringwith a Spearman correlation distance metrics and used to define co-abundantgenera groups. The significant associations were controlled for multiple testingusing the q-value method (FDRo0.05)54. Permutational multivariate analysis ofvariance55 was used to determine whether the CAGs were significantly differentfrom each other. The Wiggum plot network analysis was created as previouslydescribed24 using cytoscape software (http://www.cytoscape.org/). Circle sizerepresents genus abundance and connections between nodes represent positive andsignificant Kendall correlations between genera (FDRo0.05).
GC–MS determination of SCFAs in faecal samples. Aliquots of dried faecalsamples (about 250 mg) were briefly homogenized after the addition of 1 ml of 10%perchloric acid in water and centrifuged at 15,000g for 5 min at 4 �C. Five hundredmicrolitres of supernatant was diluted 1:10 in water, 10 ml of D8-butyric acid(internal standard, IS) were added to the sample at the final concentration of20mg ml� 1. The calibration curves were prepared adding the IS to scalar amountsof the acids in diluted samples or water (for external standardization). All thestandards (purity 499%), acetic, propionic, butyric, valeric acids and IS were
provided by Sigma and were used to prepare calibration solutions for quantification(linear response) and identification. Headspace solid-phase microextraction (HS-SPME) was performed by using a 75-mm Carboxen/polydimethylsiloxane fibre(Supelco). The optimized final extraction conditions were temperature 70 �C,10 min of equilibration time and 30 min of extraction time. The analytes weredesorbed into the gas chromatograph (GC) injector port at 250 �C for 10 min,including fibre cleaning. GC–mass spectrometry (MS) analysis was carried out on aTRACE GC 2000 Series (ThermoQuest CE Instruments) GC, interfaced with GCQPlus (ThermoQuest CE Instruments) mass detector with ion trap analyser, oper-ating in EI mode (70 eV). The capillary GC column was a Phenomenex ZB-WAX(30 m� 0.25 mm ID, 0.15 mm film thickness), consisting of 100% polyethyleneglycol. Helium (He) was the carrier gas at a flow rate of 1.0 ml min� 1. An oventemperature programme was adopted: initial 40 �C (hold time: 5 min), then rampedby 10 �C min� 1 to 220 �C (hold time: 5 min). The temperature of transfer line andionization source was maintained at 250 and 200 �C, respectively.
The GC was operated in splitless mode; the injector base temperature was set at250 �C. The mass spectra were recorded in full scan mode (34–200 a.m.u.) to collectthe total ion current chromatograms. Quantification was carried out by using theextracted ion chromatograms by selecting fragment ions of the studied analytes(43 and 60 a.m.u. for acetic acid, 55 and 73 a.m.u. for propionic acid, 60 and73 a.m.u. for butyric and valeric acids, and 63 and 77 a.m.u. for IS). The SCFAsconcentration in faecal samples was expressed in mmol g� 1 of faeces. Limit ofdetection ranged from 4 to 68 nmol g� 1.
References1. Nicholson, J. K. et al. Host-gut microbiota metabolic interactions. Science 336,
1262–1267 (2012).2. Wu, G. D. et al. Linking long-term dietary patterns with gut microbial
enterotypes. Science 334, 105–108 (2011).3. Kau, A. L., Ahern, P. P., Griffin, N. W., Goodman, A. L. & Gordon, J. I. Human
nutrition, the gut microbiome and the immune system. Nature 474, 327–336(2011).
4. De Filippo, C. et al. Impact of diet in shaping gut microbiota revealed by acomparative study in children from Europe and rural Africa. Proc. Natl Acad.Sci. 107, 14691–14696 (2010).
5. Turnbaugh, P. J. et al. The human microbiome project. Nature 449, 804–810(2007).
6. Candela, M., Biagi, E., Maccaferri, S., Turroni, S. & Brigidi, P. Intestinalmicrobiota is a plastic factor responding to environmental changes. TrendsMicrobiol. 20, 385–391 (2012).
7. Rinke, C. et al. Insights into the phylogeny and coding potential of microbialdark matter. Nature 499, 431–437 (2013).
8. Hehemann, J.-H. et al. Transfer of carbohydrate-active enzymes from marinebacteria to Japanese gut microbiota. Nature 464, 908–912 (2010).
9. Yatsunenko, T. et al. Human gut microbiome viewed across age and geography.Nature 486, 222–227 (2012).
10. Ehlers, S. & Kaufmann, S. H. E. Infection, inflammation, and chronic diseases:consequences of a modern lifestyle. Trends Immunol. 31, 184–190 (2010).
11. Blurton Jones, N. G., Smith, L. C., O’Connell, J. F., Hawkes, K. & Kamuzora,C. L. Demography of the Hadza, an increasing and high density population ofSavanna foragers. Am. J. Phys. Anthropol. 89, 159–181 (1992).
12. Schoeninger, M. J., Bunn, H. T., Murray, S. S. & Marlett, J. A. Composition oftubers used by Hadza foragers of Tanzania. J. Food Comp. Anal. 14, 15–25(2001).
13. Murray, S. S., Schoeninger, M. J., Bunn, H. T., Pickering, T. R. & Marlett, J. A.Nutritional composition of some wild plant foods and honey used by Hadzaforagers of Tanzania. J Food Comp. Anal. 14, 3–13 (2001).
14. Marlowe, F. W. & Berbesque, C. J. Tubers as fallback foods and their impact onHadza hunter-gatherers. Am. J. Phys. Anthropol. 140, 751–758 (2009).
15. Marlowe, F. W. The Hadza: Hunter-Gatherers of Tanzania 336 (Univ.California Press, 2010).
16. Faith, D. P. Conservation evaluation and phylogenetic diversity. Biol. Conserv.61, 1–10 (1992).
17. Marlowe, F. W. Male contribution to diet and female reproductive successamong foragers. Curr. Anthropol. 42, 755–760 (2001).
18. Pontzer, H. et al. Hunter-gatherer energetics and human obesity. PLoS ONE 7,e40503 (2012).
19. Berbesque, C. J., Marlowe, F. W. & Crittenden, A. N. Sex differences in Hadzaeating frequency by food type. Am. J. Hum. Biol. 23, 339–345 (2011).
20. Antal, G. M., Lukehart, S. A. & Meheus, A. Z. The endemic treponematoses.Microbes Infect. 4, 83–94 (2002).
21. Warnecke, F. et al. Metagenomic and functional analysis of hindgut microbiotaof a wood-feeding higher termite. Nature 450, 560–565 (2007).
22. Den Besten, G. et al. The role of short-chain fatty acids in the interplay betweendiet, gut microbiota, and host energy metabolism. J. Lipid Res. 54, 2325–2340(2013).
23. Ou, J. et al. Diet, microbiota, and microbial metabolites in colon cancer risk inrural Africans and African Americans. Am. J. Clin. Nutr. 98, 111–120 (2013).
NATURE COMMUNICATIONS | DOI: 10.1038/ncomms4654 ARTICLE
NATURE COMMUNICATIONS | 5:3654 | DOI: 10.1038/ncomms4654 | www.nature.com/naturecommunications 11
& 2014 Macmillan Publishers Limited. All rights reserved.
24. Claesson, M. J. et al. Gut microbiota composition correlates with diet andhealth in the elderly. Nature 488, 178–184 (2012).
25. Tremaroli, V. & Backhed, F. Functional interactions between the gut microbiotaand host metabolism. Nature 489, 242–249 (2012).
26. Flint, F. J. et al. Polysaccharide utilization by gut bacteria: potential for newinsights from genomic analysis. Nat. Rev. Microbiol. 6, 121–131 (2008).
27. Thomas, F., Hehemann, J.-H., Rebuffet, E., Czjzek, M. & Michel, G.Environmental and gut bacteroidetes: the food connection. Front. Microbiol.2, 93 (2011).
28. Vincent, A. S. Plant foods in savanna environments: a preliminary report oftubers eaten by the Hadza of Northern Tanzania. World Archaeol. 17, 131–148(1985).
29. Crittenden, A. N. The importance of honey consumption in human evolution.Food Foodways 19, 257–273 (2011).
30. Peterson, D., Baalow, R. & Cox, J. Hadzabe: By the Light of a Million Fires 234(Mkuki na Nyota Publishers Ltd, 2012).
31. Woodburn, J. Man the Hunter 49–55 (Transaction Publishers, 1969).32. Aiello, L. C. & Wheeler, P. The expensive-tissue hypothesis: the brain and
the digestive system in human and primate evolution. Curr. Anthropol. 36,199–221 (1995).
33. Wrangham, R. W. & Conklin-Brittain, N. Cooking as a biological trait. Comp.Biochem. Physiol. 136, 35–46 (2003).
34. Tito, R. Y. et al. Insights from characterizing extinct human gut microbiomes.PLoS ONE 7, e51146 (2012).
35. Bennett, F., Barnicot, N., Woodburn, J., Pereira, M. & Henderson, B. Studies onviral, bacterial, rickettsial and treponemal diseases in the Hadza of Tanzaniaand a note on injuries. Hum. Biol. 45, 243–272 (1973).
36. Work, T., Ifekwunigwe, A., Jelliffe, D., Jelliffe, P. & Neumann, C. TropicalProblems in Nutrition. Ann. Intern. Med. 79, 701–711 (1973).
37. Turroni, F. et al. Exploring the diversity of the bifidobacterial population in thehuman intestinal tract. Appl. Environ. Microbiol. 75, 1534–1545 (2009).
38. Nam, Y.-D., Jung, M.-J., Roh, S. W., Kim, M.-S. & Bae, J.-W. Comparativeanalysis of Korean human gut microbiota by barcoded pyrosequencing.PLoS ONE 6, e22109 (2011).
39. Zimmer, J. et al. A vegan or vegetarian diet substantially alters the humancolonic faecal microbiota. Eur. J. Clin. Nutr. 66, 53–60 (2012).
40. Ventura, M. et al. Genomics of Actinobacteria: tracing the evolutionary historyof an ancient phylum. Int. J. Food. Microbiol. 120, 2–12 (2007).
41. Moeller, A. H. et al. Sympatric chimpanzees and gorillas harbor convergent gutmicrobial communities. Genome Res. 23, 1715–1720 (2013).
42. Knight, A. et al. African Y chromosome and mtDNA divergenceprovides insight into the history of click languages. Curr. Biol. 13, 464–473(2003).
43. Biagi, E. et al. Through ageing, and beyond: gut microbiota and inflammatorystatus in seniors and centenarians. PLoS ONE 5, e10667 (2010).
44. Blaser, M. J. & Falkow, S. What are the consequences of the disappearinghuman microbiota? Nat. Rev. Microbiol. 7, 887–894 (2009).
45. Rook, G. A. W. et al. Mycobacteria and other environmental organisms asimmunomodulators for immunoregulatory disorders. Springer. Semin.Immunopathol. 25, 237–255 (2004).
46. Martens, E. C. et al. Recognition and degradation of plant cell wallpolysaccharides by two human gut symbionts. PLoS Biol. 9, e1001221 (2011).
47. Lecuit, M., Sonnenburg, J. L., Cossart, P. & Gordon, J. I. Functional genomicstudies of the intestinal response to a foodborne enteropathogen in ahumanized gnotobiotic mouse model. J. Biol. Chem. 282, 15065–15072 (2007).
48. Minekus, M. et al. A computer-controlled system to simulate conditions of thelarge intestine with peristaltic mixing, water absorption and absorption offermentation products. Appl. Microbiol. Biotechnol. 53, 108–114 (1999).
49. Nsubuga, A. M. et al. Factors affecting the amount of genomic DNA extractedfrom ape faeces and the identification of an improved sample storage method.Mol. Ecol. 13, 2089–2094 (2004).
50. Claesson, M. J. et al. Comparative analysis of pyrosequencing and aphylogenetic microarray for exploring microbial community structures in thehuman distal intestine. PLoS ONE 4, 1–15 (2009).
51. Candela, M. et al. Unbalance of intestinal microbiota in atopic children. BMCMicrobiol. 12, 95 (2012).
52. Caporaso, J. G. et al. QIIME allows analysis of high-throughput communitysequencing data. Nat. Methods 7, 335–336 (2010).
53. Culhane, A. C., Thioulouse, J., Perriere, G. & Higgins, D. G. MADE4: an Rpackage for multivariate analysis of gene expression data. Bioinformatics 21,2789–2790 (2005).
54. Dabney, A., Storey, J. & Warnes, G. qvalue: Q-value estimation for falsediscovery rate control. R package (2013).
55. Anderson, M. J. A new method for non-parametric multivariate analysis ofvariance. Aust. Ecol. 26, 32–46 (2001).
AcknowledgementsWe are grateful to the Hadza for their cooperation and contribution to this study. Wethank the Tanzanian government and Commission for Science and Technology forallowing us to conduct our research in Tanzania with the Hadza. We thank our fieldassistants, Shabaan and Mika Peterson, for their help in working with the Hadza. We alsothank Dorobo Safaris, Chris and Nani Smelling, the MPI Plant Foods Group and theDepartment of Human Evolution for their continued support throughout this project.Finally, we thank A. Strauss, N. Scott, C. Leonard, R. Power, C. Debono Spiteri,D.C. Salazar Garcia, J. Watzke, A. Hutschenreuther, S. Stelzer, N. Dorschner,H. Temming, T. Blass, A. Cagan, J. Dabney, M. Stoneking, T. Gorissen, K. Venema,A.A. Kassu, K. Ussi, A. Sylvester and D. Geller for their help in various facets along theway. Funding was provided by the Lincy Foundation-University of Nevada, Las Vegasand the Max-Planck-Gesellschaft.
Author contributionsS.L.S., A.N.C., F.W.M. and A.G.H. designed the project. S.L.S. collected Hadza samples.M.Ce. and S.T. collected Italian samples. M.Ce. and S.T. performed DNA extraction and16S rDNA amplification. C.C., C.P. and M.S. performed the samples processing andpyrosequencing experiments. S.R. and M.C. ran the genetic analysis. G.B. and J.F.performed GC–MS analysis. S.L.S., S.R., M.C., E.B. and M.S. analysed the data. S.L.S.,M.C., A.N.C. and A.G.H. wrote the paper. G.D.B., R.G., P.B. and D.L. revised and editedthe draft. All authors discussed the results and commented on the manuscript.
Additional informationAccession codes: Amplicon sequences have been deposited in the MG-RAST databaseunder project ID 7058.
Supplementary Information accompanies this paper at http://www.nature.com/naturecommunications
Competing financial interests: The authors declare no competing financial interests.
Reprints and permission information is available online at http://npg.nature.com/reprintsandpermissions/
How to cite this article: Schnorr, S. L. et al. Gut microbiome of the Hadzahunter-gatherers. Nat. Commun. 5:3654 doi: 10.1038/ncomms4654 (2014).
This work is licensed under a Creative Commons Attribution-NonCommercial-NoDerivs 3.0 Unported License. The images or other
third party material in this article are included in the article’s Creative Commons license,unless indicated otherwise in the credit line; if the material is not included under theCreative Commons license, users will need to obtain permission from the license holderto reproduce the material. To view a copy of this license, visit http://creativecommon-s.org/licenses/by-nc-nd/3.0/
ARTICLE NATURE COMMUNICATIONS | DOI: 10.1038/ncomms4654
12 NATURE COMMUNICATIONS | 5:3654 | DOI: 10.1038/ncomms4654 | www.nature.com/naturecommunications
& 2014 Macmillan Publishers Limited. All rights reserved.
Related Documents