Chronic conditions, physical function and health care use: Findings from the Australian Longitudinal Study on Women’s Health The research on which this report is based was conducted as part of the Australian Longitudinal Study on Women’s Health by researchers from the University of Newcastle and the University of Queensland. We are grateful to the Australian Government Department of Health for funding and to the women who provided the survey data. Suggested citation:

Welcome message from author
This document is posted to help you gain knowledge. Please leave a comment to let me know what you think about it! Share it to your friends and learn new things together.
Transcript
Chronic conditions, physical function and health care use: Findings from the Australian
Longitudinal Study on Women’s Health
The research on which this report is based was conducted as part of the Australian Longitudinal Study on Women’s Health by researchers from the University of Newcastle and the University of Queensland. We are grateful to the Australian Government Department of Health for funding and to the women who provided the survey data.
Suggested citation:
Byles J, Hockey R, McLaughlin D, Dobson A, Brown W, Loxton D, and Mishra G.
Chronic conditions, physical function and health care use: Findings from the Australian Longitudinal Study on Women’s Health. Report prepared for the Australian Government Department of Health, June 2015.

KEY MESSAGES
51% of women in the 1946-51 cohort have arthritis at age 62-67. This prevalence is already higher than the prevalence of arthritis among women in the 1921-26 cohort when they were aged 73-75.
MBS and PBS costs are $1000 higher for women with arthritis in the 1946-51 cohort compared to women with no arthritis. Costs are $500 higher among women in the 1921-26 cohort.
Asthma prevalence is increasing in all cohorts, and is associated with poorer survival among the older women. Many women with asthma still smoke, and have other health risks.
Diabetes prevalence is rapidly increasing in all cohorts. Prevalence is already higher in the 1946-51 cohort than it was for the 1921-26 cohort at the start of the study. Given the high BMI of women in younger cohorts, prevalence of diabetes among younger women is likely to be higher again when these women reach older ages. Diabetes also has higher prevalence and incidence among current and ex-smokers in the 1973-78 and 1946-51 cohorts.
Poor diet quality is associated with risk of diabetes including a higher risk with lower zinc intakes, as well as with higher intakes of monosaturated fatty acids, and lower intakes of dietary fibre. Women in the 1946-51 cohort with a Mediterranean style diet have a lower risk of developing diabetes.
Poor mental health is comorbid with physical conditions and with more general practice consultations, and stress and depression may play a role in the development of arthritis.
Many women have more than one condition, particularly women with BMI in the obese range.
Medicare items such as complex care plans and annual cycle of care for diabetes appear to be underutilized even by women with multiple comorbidities.

TABLE OF CONTENTS1. Executive Summary..................................................................................................15
1.1. Arthritis....................................................................................................................15
1.2. Asthma.....................................................................................................................16
1.3. Breast cancer...........................................................................................................17
1.4. Cardiovascular conditions........................................................................................18
1.5. Diabetes...................................................................................................................19
1.6. Mental health..........................................................................................................20
1.7. Comorbidity.............................................................................................................21
1.8. Summary..................................................................................................................21
2. Introduction..............................................................................................................23
2.1. Definition of chronic conditions...............................................................................23
2.2. Prevalence of chronic conditions.............................................................................24
2.3. Incidence of chronic conditions...............................................................................25
2.4. Use of health services by women who report chronic conditions...........................25
2.5. Participants..............................................................................................................25
3. Mortality..................................................................................................................26
3.1. Chronic disease and death.......................................................................................26
4. Obesity and other common risk factors....................................................................31
5. Arthritis and musculoskeletal conditions..................................................................36
5.1. Women and arthritis................................................................................................36
5.2. Ascertainment of arthritis in ALSWH.......................................................................37
5.3. Prevalence of arthritis..............................................................................................38
5.4. Incidence of arthritis................................................................................................39
5.5. Factors associated with arthritis..............................................................................39
5.5.1. Area of residence................................................................................................40
5.5.2. Highest educational qualification........................................................................41
5.5.3. Difficulty managing on income............................................................................42
5.5.1. Body Mass Index.................................................................................................43
5.5.1. Smoking...............................................................................................................44
5.5.2. Physical activity...................................................................................................45

5.6. Other factors associated with arthritis....................................................................47
TABLE OF CONTENTS (cont.)
5.7. Arthritis and health related quality of life................................................................48
5.8. Use of health services by women who report arthritis............................................50
5.9. Summary points.......................................................................................................52
6. Asthma.....................................................................................................................53
6.1. Women and asthma................................................................................................53
6.2. Ascertainment of asthma in ALSWH........................................................................54
6.3. Prevalence of asthma..............................................................................................55
6.4. Incidence of asthma.................................................................................................56
6.5. Factors associated with asthma...............................................................................57
6.5.1. Area of residence................................................................................................57
6.5.2. Highest educational qualification........................................................................58
6.5.3. Difficulty managing on income............................................................................59
6.5.1. Body Mass Index.................................................................................................60
6.5.2. Smoking...............................................................................................................61
6.5.3. Physical activity...................................................................................................62
6.5.4. Comorbid conditions...........................................................................................63
6.6. Asthma and health-related quality of life................................................................63
6.7. Use of health services by women who report asthma.............................................65
6.8. Impact of asthma on survival...................................................................................66
6.9. Summary points.......................................................................................................67
7. Breast cancer............................................................................................................68
7.1. Ascertainment of breast cancer in ALSWH..............................................................68
7.2. Prevalence of breast cancer.....................................................................................70
7.3. Factors associated with breast cancer.....................................................................72
7.3.1. Area of residence................................................................................................72
7.3.2. Highest educational qualification........................................................................73
7.3.3. Difficulty managing on income............................................................................74
7.3.1. Body Mass Index.................................................................................................75
7.3.2. Smoking...............................................................................................................76
7.3.3. Physical activity...................................................................................................77

7.3.4. Other factors associated with breast cancer.......................................................78
TABLE OF CONTENTS (cont.)
7.4. Health-related quality of life in women with breast cancer....................................78
7.5. Use of health services by women who report breast cancer...................................81
7.6. Summary Points.......................................................................................................82
8. Cardiovascular conditions.........................................................................................83
8.1. Ascertainment of heart disease and stroke in ALSWH.............................................83
8.2. Prevalence of heart disease and stroke...................................................................85
8.2.1. Heart conditions..................................................................................................85
8.2.2. Stroke conditions................................................................................................85
8.3. Women and heart and stroke conditions................................................................86
8.4. Area of residence and heart and stroke conditions.................................................87
8.5. Risk factors for heart and stroke conditions............................................................87
8.6. Socio-economic position and heart and stroke conditions......................................89
8.7. Mental health and heart and stroke conditions......................................................90
8.8. Use of health services by women who report heart and stroke conditions............91
8.9. Deaths among women reporting heart and stroke conditions................................95
8.10. Summary points.......................................................................................................96
9. Diabetes...................................................................................................................97
9.1. Women and diabetes...............................................................................................97
9.2. Ascertainment of diabetes in ALSWH......................................................................98
9.3. Prevalence of diabetes............................................................................................99
9.4. Incidence of diabetes.............................................................................................100
9.5. Factors associated with diabetes...........................................................................101
9.5.1. Area of residence..............................................................................................101
9.5.2. Highest educational qualification......................................................................102
9.5.3. Difficulty managing on income..........................................................................104
9.5.1. Body Mass Index...............................................................................................105
9.5.2. Smoking.............................................................................................................109
9.5.3. Physical activity.................................................................................................110
9.5.4. Other risk factors for diabetes among women in ALSWH.................................111
9.6. Impact of diabetes on health-related quality of life (HRQOL)................................112
9.7. Use of health services by women who report diabetes.........................................114
TABLE OF CONTENTS (cont.)
9.8. Summary points.....................................................................................................116
10. Mental health.........................................................................................................118
11. Comorbidities.........................................................................................................129
11.1. Multimorbidity and Comorbidity...........................................................................129
11.2. Area of residence...................................................................................................133
11.3. Difficulty managing on income..............................................................................136
11.4. Body mass index (BMI)..........................................................................................139
11.5. Smoking.................................................................................................................142
11.6. Physical activity......................................................................................................145
11.7. Health service use..................................................................................................148
11.8. GP Chronic Disease Management Plan..................................................................150
11.9. Summary points.....................................................................................................151
12. Appendix A: Cohort Attrition..................................................................................152
13. Appendix B: Survey Questions – Chronic Conditions...............................................154
14. References..............................................................................................................162
TABLE OF FIGURES
Figure 3-1: Causes of death for women in the 1946-51 cohort: Top five causes of death are breast cancer, lung cancer, colorectal cancer, cerebrovascular disease and ovarian cancer.................................................26
Figure 3-2: Causes of death for women in the 1921-26 cohort: Top five causes of death are coronary heart disease, cerebrovascular disease, dementia, chronic obstructive pulmonary disease and diabetes..................27
Figure 4-1: Prevalence of overweight and obesity in each cohort (1973-78, 1946-51, 1921-26) at each survey.................................................................31
Figure 4-2: Prevalence of smoking in each cohort (1973-78, 1946-51, 1921-26) at each survey..........................................................................................32
Figure 4-3: Physical activity levels in each cohort (1973-78, 1946-51, 1921-26) at each survey................................................................................................34
Figure 4-4: Difficulty managing on income in each cohort (1973-78, 1946-51, 1921-26) at each survey................................................................................35
Figure 5-1: Prevalence of arthritis, Surveys 3-7 for the 1946-51 cohort and Surveys 2-6 for the 1921-26 cohort...............................................................38
Figure 5-2: Prevalent and incident cases of arthritis, Surveys 3-7 for the 1946-51 cohort and Surveys 2-6 for the 1921-26 cohort .......................................39
Figure 5-3: Prevalent and incident cases of arthritis, Surveys 3-7 for the 1946-51 cohort and Surveys 2-6 for the 1921-26 cohort, according to area of residence at Survey 1........................................................................40
Figure 5-4: Prevalent and incident cases of arthritis, Surveys 3-7 for the 1946-51 cohort and Surveys 2-6 for the 1921-26 cohort,, according to highest educational qualification...................................................................41
Figure 5-5: Prevalent and indicdent cases of arthritis, Surveys 3-7 for the 1946-51 cohort and Surveys 2-6 for the 1921-26 cohort, accoring to difficulty managing on income..................................................................42
Figure 5-6: Prevalent and incident cases of arthritis, Surveys 3-7 for the 1946-51 cohort and Surveys 2-6 for the 1921-26 cohort, according to BMI category.................................................................................................43
Figure 5-7: Prevalent and incident cases of arthritis, Surveys 3-7 for the 1946-51 cohort and Surveys 2-6 for the 1921-26 cohort, according to smoking status...............................................................................................44
Figure 5-8: Prevalent and incident cases of arthritis, Surveys 3-7 for the 1946-51 cohort and Surveys 2-6 for the 1921-26 cohort, according to level of physical activity.................................................................................45

TABLE OF FIGURES (cont.)
Figure 5-9: Physical function scores at each survey for women who have ever reported arthritis (on any survey), and women who have never reported arthritis, Surveys 1-7 (1946-51 cohort) and Surveys 1-6 (1921-26 cohort)............................................................................................48
Figure 5-10: Mental health scores at each survey for women have ever reported arthritis (on any survey), and women who have never reported arthritis, Surveys 1-7 (1946-51 cohort) and Surveys 1-6 (1921-26 cohort)............................................................................................49
Figure 5-11: Number of general practice visits at each survey for women who have ever reported arthritis (on any survey), and women who have never reported arthritis, Surveys 1-7 (1946-51 cohort) and Surveys 1-6 (1921-26 cohort)........................................................................50
Figure 6-1: Prevalence of asthma at each survey among women in the 1973-78, 1946-51 and 1921-26 cohorts..................................................................55
Figure 6-2: Prevalent and incident cases of asthma, Surveys 1-6 (1973-78 cohort), Surveys 1-7 (1946-51 cohort) and Surveys 1-6 (1921-26 cohort)...........................................................................................................56
Figure 6-3: Prevalent and incident cases of asthma, Surveys 1-6 (1973-78 cohort), Surveys 1-7 (1946-51 cohort) and Surveys 1-6 (1921-26 cohort), according to area of residence at Survey 1......................................57
Figure 6-4: Prevalent and incident cases of asthma, Surveys 1-6 (1973-78 cohort), Surveys 1-7 (1946-51 cohort) and Surveys 1-6 (1921-26 cohort), according to highest educational qualification................................58
Figure 6-5: Prevalent and incident cases of asthma, Surveys 1-6 (1973-78 cohort), Surveys 1-7 (1946-51 cohort) and Surveys 1-6 (1921-26 cohort, according to difficulty managing on income.....................................59
Figure 6-6: Prevalent and incident cases of asthma, Surveys 1-6 (1973-78 cohort), Surveys 1-7 (1946-51 cohort) and Surveys 1-6 (1921-26 cohort), according to BMI category...............................................................60
Figure 6-7: Prevalent and incident cases of asthma, Surveys 1-6 (1973-78 cohort), Surveys 1-7 (1946-51 cohort) and Surveys 1-6 (1921-26 cohort), according to smoking status at Survey 1..........................................61
Figure 6-8: Prevalent and incident cases of asthma, Surveys 1-6 (1973-78 cohort), Surveys 1-7 (1946-51 cohort) and Surveys 1-6 (1921-26 cohort, according to level of physical activity................................................62
TABLE OF FIGURES (cont.)

Figure 6-9: Mean physical function scores at each survey for women who have ever reported asthma (on any survey), and women who have never reported asthma, Surveys 1-6 (1973-78 cohort), Surveys 1-7 (1946-51 cohort) and Surveys 1-6 (1921-26 cohort)......................................63
Figure 6-10: Mean mental health scores at each survey for women who have ever reported asthma (on any survey), and women who have never reported asthma, Surveys 1-6 (1973-78 cohort), Surveys 1-7 (1946-51 cohort) and Surveys 1-6 (1921-26 cohort)......................................64
Figure 6-11: Mean number of general practice visits each year for women who have ever reported asthma (on any survey) and women who have never reported asthma, Surveys 1-6 (1973-78 cohort), Surveys 1-7 (1946-51 cohort) and Surveys 1-6 (1921-26 cohort)......................................65
Figure 7-1: Prevalence of breast cancer at each survey (1 to 7) in the 1946-51 cohort and at Surveys 1 and 2 in the 1921-26 cohort....................................70
Figure 7-2: Prevalent and incident cases of breast cancer, Surveys 1 – 7, in the 1946-51 cohort..............................................................................................71
Figure 7-3: Prevalent and incident cases of breast cancer in the 1946-51 cohort, Surveys 1-7, according to area of residence......................................72
Figure 7-4: Prevalent and incident cases of breast cancer in the 1946-51 cohort, Surveys 1-7, according to highest educational qualification...................................................................................................73
Figure 7-5: Prevalent and incident cases of breast cancer in the 1946-51 cohort, Surveys 1-7, according to difficulty managing on income.................74
Figure 7-6: Prevalent and incident cases of breast cancer in the 1946-51 cohort, Surveys 1-7, according to BMI category............................................75
Figure 7-7: Prevalent and incident cases of breast cancer in the 1946-51 cohort, Surveys 1-7, according to smoking status.........................................76
Figure 7-8: Prevalent and incident cases of breast cancer in the 1946-51 cohort, Surveys 1-7, according to level of physical activity...........................77
Figure 7-9: Mean physical function scores at each survey for women who have ever reported breast cancer (on any survey), and women who have never reported breast cancer, Surveys 1-7 (1946-51 cohort)...........................................................................................................78
TABLE OF FIGURES (cont.)

Figure 7-10: Mean mental health scores at each survey for women who have ever reported breast cancer (on any survey), and women who have never reported breast cancer, Surveys 1-7 (1946-51 cohort)...............79
Figure 7-11: Mean number of general practice visits each year for women who have ever reported breast cancer (on any survey) and women who have never reported breast cancer, Surveys 1-7 (1946-51 cohort)...........................................................................................................81
Figure 8-1: Prevalence of self-reported heart disease in the 1973-78 cohort (Survey 1), the 1946-51 cohort (Surveys 1-7) and the 1921-26 cohort (Surveys 1-6)......................................................................................85
Figure 8-2: Prevalence of stroke conditions in the 1946-51 cohort (Surveys 1-7) and the 1921-26 cohort (Surveys 1-6).......................................................86
Figure 8-3: Prevalence of hypertension in the 1973-78 cohort (Surveys 1-6), the 1946-51 cohort (Surveys 1-7) and the 1921-26 cohort (Surveys 1-6)................................................................................................................ 88
Figure 8-4: Mean number of general practice visits each survey year for women reporting heart disease, Surveys 1-6 (1973-78 cohort), Surveys 1-7 (1946-51 cohort) and Surveys 1-6 (1921-26 cohort)..................91
Figure 8-5: Mean number of general practice visits each survey year for women reporting stroke conditions, Surveys 1-7 (1946-51 cohort) and Surveys 1-6 (1921-26 cohort).................................................................93
Figure 9-1: Prevalence of diabetes at each survey among women in the 1989-95, 1973-78, 1946-51 and 1921-26 cohorts...................................................99
Figure 9-2: Prevalent and incident cases of diabetes, Surveys 1-6 (1973-78 cohort), Surveys 1-7 (1946-51 cohort), and Surveys 1-6, (1921-26 cohort).........................................................................................................100
Figure 9-3: Prevalent and incident cases of diabetes, Surveys 1-6 (1973-78 cohort), Surveys 1-7 (1946-51 cohort), and Surveys 1-6 (1921-26 cohort), according to area of residence at Survey 1....................................101
Figure 9-4: Prevalent and incident cases of diabetes, Surveys 1-6 (1973-78 cohort), Surveys 1-7 (1946-51 cohort), and Surveys 1-6 (1921-26 cohort), according to highest educational qualification at Survey 1............102
Figure 9-5: Prevalent and incident cases of diabetes, Surveys 1-6 (1973-78 cohort), Surveys 1-7 (1946-51 cohort), and Surveys 1-6 (1921-26 cohort), according to difficulty managing on income at Survey 1................104
TABLE OF FIGURES (cont.)

Figure 9-6: Prevalent and incident cases of diabetes, Surveys 1-6 (1973-78 cohort), Surveys 1-7 (1946-51 cohort), and Surveys 1-6 (1921-26 cohort), according to BMI category at Survey 1..........................................105
Figure 9-7: Prevalent and incident cases of diabetes, Surveys 1-6 (1973-78 cohort), Surveys 1-7 (1946-51 cohort), and Surveys 1-6 (1921-26 cohort), according to smoking status at Survey 1........................................109
Figure 9-8: Prevalent and incident cases of diabetes, Surveys 1-6 (1973-78 cohort), Surveys 1-7 (1946-51 cohort), and Surveys 1-6 (1921-26 cohort), according to level of physical activity at Survey 2..........................110
Figure 9-9: Mean physical function scores for women who have ever reported diabetes (at any survey) and women who have never reported diabetes, Surveys 1-6 (1973-78 cohort), Surveys 1-7 (1946-51 cohort), and Surveys 1-6 (1921-26 cohort)...................................112
Figure 9-10: Mean mental health scores for women who have ever reported diabetes (at any survey) and women who have never reported diabetes, Surveys 1-6 (1973-78 cohort), Surveys 1-7 (1946-51 cohort), and Surveys 1-6 (1921-26 cohort)..................................................113
Figure 9-11: Mean number of general practice visits for women who have ever reported diabetes (at any survey) and women who have never reported diabetes, Surveys 1-6 (1973-78 cohort), Surveys 1-7 (1946-51 cohort), and Surveys 1-6 (1921-26 cohort)...................................114
Figure 10-1: Percentage of women with psychological distress (SF-36 MHI ≤52) in the past four weeks, plotted against the average age of women at that survey for Surveys 1 to 6 of the 1973-78 and 1921-26 cohorts and Surveys 1 to 7 of the 1946-51 cohort......................................119
Figure 10-2: Prevalence of psychological distress (SF-36 MHI ≤52) for Surveys 1 to 6 of the 1973-78 and 1921-26 cohorts and Surveys 1 to 7 of the 1946-51 cohort by area of residence...........................................................120
Figure 10-3: Prevalence of psychological distress (SF-36 MHI ≤52) for Surveys 1 to 6 of the 1973-78 and 1921-26 cohorts and Surveys 1 to 7 of the 1946-51 cohort by education......................................................................121
Figure 10-4: Prevalence of psychological distress (SF-36 MHI ≤52) for Surveys 1 to 6 of the 1973-78, Surveys 1 to 7 of the 1946-51 cohort and Surveys 1 to 6 of the 1921-26 cohort by managing on income...................122
Figure 10-5: Prevalence of psychological distress (SF-36 MHI ≤52) for Surveys 1 to 6 of the 1973-78 and 1921-26 cohorts and Surveys 1 to 7 of the 1946-51 cohort by BMI category.................................................................123
TABLE OF FIGURES (cont.)

Figure 10-6: Prevalence of psychological distress (SF-36 MHI ≤52) for Surveys 1 to 6 of the 1973-78 and 1921-26 cohorts and Surveys 1 to 7 of the 1946-51 cohort by smoking status..............................................................124
Figure 10-7: Prevalence of psychological distress (SF-36 MHI ≤52) for Surveys 1 to 6 of the 1973-78 and 1921-26 cohorts and Surveys 1 to 7 of the 1946-51 cohort by physical activity.............................................................125
Figure 10-8: Mean number of general practice visits for women who have ever reported psychological distress (at any survey) and women who have never reported psychological distress, Surveys 1-6 (1973-78 cohort), Surveys 1-7 (1946-51 cohort), and Surveys 1-6 (1921-26 cohort).........................................................................................................126
Figure 11-1: Number of chronic conditions (asthma, heart disease and diabetes) reported by women in the 1973-78 cohort at each survey by average age at that survey..........................................................130
Figure 11-2: Number of chronic conditions (asthma, heart disease, diabetes, arthritis, stroke and breast cancer) reported by women in the 1946-51 cohort at each survey by average age at that survey....................131
Figure 11-3: Number of chronic conditions (asthma, heart disease, diabetes, arthritis, and stroke) reported by women in the 1921-26 cohort at each survey by average age at that survey..................................................132
Figure 11-4: Number of conditions reported at Survey 6 by women in the 1973-78 cohort according to remoteness area at Survey 1.........................133
Figure 11-5: Number of conditions reported at Survey 7 by women in the 1946-51 cohort according to remoteness area at Survey 1.........................134
Figure 11-6: Number of conditions reported at Survey 6 by women in the 1921-26 cohort according to remoteness area at Survey 1.........................135
Figure 11-7: Number of conditions reported at Survey 6 by women in the 1973-78 cohort according to manage on income at Survey 1.....................136
Figure 11-8: Number of conditions reported at Survey 7 by women in the 1946-51 cohort according to manage on income at Survey 1.....................137
Figure 11-9: Number of conditions reported at Survey 6 by women in the 1921-26 cohort according to manage on income at Survey 1.....................138
Figure 11-10: Number of conditions reported at Survey 6 by women in the 1973-78 cohort according to BMI at Survey 1.............................................139
Figure 11-11: Number of conditions reported at Survey 7 by women in the 1946-51 cohort according to BMI at Survey 1.............................................140
TABLE OF FIGURES (cont.)

Figure 11-12: Number of conditions reported at Survey 6 by women in the 1921-26 cohort according to BMI at Survey 1.............................................141
Figure 11-13: Number of conditions reported at Survey 6 by women in the 1921-26 cohort according to smoking status at Survey 1............................142
Figure 11-14: Number of conditions reported at Survey 7 by women in the 1946-51 cohort according to smoking status at Survey 1............................143
Figure 11-15: Number of conditions reported at Survey 6 by women in the 1921-26 cohort according to smoking status at Survey 1............................144
Figure 11-16: Number of conditions reported at Survey 6 by women in the 1973-78 cohort according to physical activity status at Survey 2................145
Figure 11-17: Number of conditions reported at Survey 7 by women in the 1946-51 cohort according to physical activity status at Survey 2................146
Figure 11-18: Number of conditions reported at Survey 6 by women in the 1921-26 cohort according to physical activity status at Survey 2................147
Figure 11-19: Mean number of general practice visits since 1996 for women in the 1946-51 cohort by number of chronic conditions reported at Survey 7.......................................................................................................148
Figure 11-20: Mean number of general practice visits since 1996 for women in the 1921-26 cohort by number of chronic conditions reported at Survey 7.......................................................................................................149

LIST OF TABLES
Table 3-1 Probability of death between Survey 2 (1998) and October 2014 women with self-reported chronic conditions at Survey 1 or Survey 2, 1946-51 cohort...............................................................................28
Table 3-2 Probability of mortality between Survey 2 (1999) and October 2014 for women with self-reported chronic conditions at Survey 1 or Survey 2, 1921-26 cohort..........................................................................28
Table 5-1 Comparison of costs for MBS and PBS uptake in women who have never reported arthritis and those who have reported arthritis, mean cost ($) 2013 .......................................................................................51
Table 6-1 Comparison of costs for MBS and PBS uptake in women who have never reported asthma and those who have reported asthma, mean cost ($) 2013........................................................................................66
Table 7-1 Comparison of costs for MBS and PBS uptake in women of the 1946-51 cohort who have never reported breast cancer and those who have reported breast cancer, mean cost ($) 2013.................................82
Table 8-1 Comparison of costs for MBS and PBS uptake in women who have never reported heart disease and those who have reported heart disease, mean cost ($) 2013..........................................................................92
Table 8-2 Comparison of costs for MBS and PBS uptake in women who have never reported stroke conditions and those who have reported stroke conditions, mean cost ($) 2013...........................................................94
Table 9-1 Comparison of costs for MBS and PBS uptake in women who have never reported diabetes and those who have reported diabetes, mean cost ($) 2013 .....................................................................................115
Table 10-1 Comparison of costs for MBS and PBS uptake in women who have never reported psychological distress and those who have reported psychological distress, mean cost ($) 2013...................................127
Table 11-1 Comparison of costs for Chronic Disease Management (MBS items 721 to 732) uptake in women who have reported 1, 2, 3 or 4+ conditions compared to women with no conditions; number of women in each group, average annual number of general practice visits and mean annual cost ($) 2010-2013.................................................150
Table 12-1 Participation and retention across surveys between 1996 and 2013 for women from the 1973-1978, 1946-1951 and 1921-1926 cohorts.........................................................................................................152


1. Executive Summary
This report presents a summary of common and important chronic conditions affecting women in the Australian Longitudinal Study of Women’s Health (ALSWH). The ALSWH includes three cohorts of women (born 1921-26, 1946-51, 1973-78) who have been repeatedly surveyed since 1996, and a new cohort (born 1989-95) first surveyed in 2013.
In this report we present data on the increasing prevalence of several major chronic conditions as the women age, including arthritis, asthma, diabetes, and cardiovascular conditions. We show the relationship between chronic disease and decline in women’s physical and mental health related quality of life, and their increased use of general practice consultations. We compare mean Medicare Benefits Schedule (MBS) and Pharmaceutical Benefits Scheme (PBS) costs between women who have and do not have each of the chronic conditions. The report also considers the prevalence of comorbidities and the increased rate of death associated with some of these chronic conditions.
1.1. ArthritisArthritis is one of the most common conditions reported by women in ALSWH, affecting around 70% of women in the 1921-26 cohort by the time they were aged 85-90 years. When women in the 1946-51 cohort were aged 50-55 years, around 20% had arthritis, but this prevalence increased to around 51% by ages 62-67. Arthritis was also strongly associated with reduced physical function scores, and with poorer mental health. This rapid increase in the prevalence of arthritis as the women age, and its effect on quality of life, emphasizes the importance of this chronic condition and its impact on women’s health through mid-life and at older ages.
Arthritis is also associated with significant increases in health care use and costs. Women with arthritis have greater use of general practice services than women without arthritis, and higher overall MBS costs. MBS costs for women from the 1946-51 cohort with arthritis were almost 50% higher and PBS costs were 60% higher than for women who did not have arthritis, with combined MBS/PBS costs around $1000 per year higher among women with arthritis than those without. The difference in costs was smaller among women in the 1921-26 cohort who generally used more MBS and PBS services than the 1946-51 cohort, with combined MBS/PBS costs around $500 per year higher among women with arthritis than those without. A detailed analysis of the drivers of these costs among women with arthritis in the 1921-26 cohort indicates that costs are significantly higher among women in urban areas, women with Department of Veteran’s Affairs (DVA) health insurance cover or private
16

hospital insurance. Costs also increased with each comorbid condition, and with poorer levels of physical function. Single women had lower health care costs than married or partnered women. Moreover, these effects were strongest among women with the highest levels of health service use.
The prevalence and incidence of arthritis does not follow a strong socioeconomic gradient, except through its association with obesity. Arthritis is strongly associated with higher Body Mass Index (BMI), and BMI has increased dramatically across the cohorts. The higher BMI among younger cohorts suggests that the prevalence of arthritis, and its impact on quality of life and health care costs, will be even greater among these cohorts than among current cohorts of older people. The 1946-51 cohort, now aged in their 60s, already have higher prevalence of arthritis than the 1921-26 cohort did when they were aged in their 70s.
Arthritis is also strongly associated with lower levels of physical activity, and women who report moderate levels of physical activity have a lower risk of developing arthritis. This effect appears to become stronger as women age, and particularly after menopause.
Stress and depression may also play a role in development of arthritis. Stress has been found to be a strong risk factor for the later development of arthritis among women in the 1946-51 cohort. Depression also increased the risk of arthritis among these women, but anxiety did not. In turn, arthritis is associated with poorer mental health over time. These findings underscore the importance of psychological well-being as a factor in both the prevention and management of this chronic condition.
Arthritis is not a common cause of death. Causes of death for women with arthritis are similar to causes of death for the cohort overall, except these women are also more likely to die of cardiovascular disease.
1.2. Asthma
Asthma prevalence is higher in the younger cohorts, and increases with age in all cohorts. These changes reflect both age and cohort effects on asthma prevalence and secular trends in diagnosis. Women in ALSWH may have had asthma at younger ages, which has subsequently undergone remission, or they may have newly diagnosed asthma in adulthood. It is recognized that asthma is poorly diagnosed among older people.
Asthma is associated with difficulty managing on income, and may affect workforce participation. Asthma is also associated with overweight and obesity, and many women with
17

asthma continue to smoke. These two risk factors also predispose women to the risk of developing comorbid chronic conditions as they age. Smoking cessation and weight loss programs that target women with asthma may provide an opportunity to improve quality of life and reduce morbidity and mortality risk among these women.
Asthma has a significant impact on survival among older women, particularly in association with comorbidity. Over 12 years of follow-up, women in the 1921-26 cohort who had asthma were 20% more likely to die than women without asthma even after other risk factors and comorbidities were taken into account. There is a particular need to improve survival and other health outcomes for older women with asthma.
In the 1973-78 cohort, women with asthma cost an average of $191 (13%) more on MBS and $125 (55%) more on PBS than women without asthma. A similar pattern occurs in the 1946-51 and 1921-26 cohorts - $375 (22%) more on MBS and $356 (54%) on PBS and $423 on MBS (15%) and $390 (27%) on PBS respectively.
Women with asthma are also likely to have higher use of complementary and alternative medicines.
1.3. Breast cancerBreast cancer is the most common form of cancer reported by women in the study. It is a common cause of death among women in the 1946-51 cohort, and the most common cause of cancer death. Around 7% of women in the 1946-51 cohort had reported a diagnosis of breast cancer by Survey 7.
Breast cancer was more common among women with lower levels of education and those with more difficulty managing on income, and smokers had higher prevalence of breast cancer. The relationship between breast cancer and BMI was more complex, with a higher incidence and prevalence of breast cancer up to Survey 6 among women in the 1946-51 cohort who were underweight at Survey 1 (when women were mostly premenopausal), but with higher incidence among overweight and obese women at Survey 7 (when women were postmenopausal).
The association between breast cancer and physical function and mental health-related quality of life is small.
18
Differences in the number of general practice consultations by women with and without breast cancer are also small. However, examination of MBS costs highlights larger differences which may reflect greater use of specialist services, more investigative procedures, and may indicate a greater uptake of additional items, such as access to allied health practitioners, by women with breast cancer. PBS costs are also much higher (approximately doubled) among women who have reported breast cancer.
Few women in the 1946-51 cohort who reported breast cancer have died (71 women). The majority of these women died of breast cancer rather than other comorbid causes.
1.4. Cardiovascular conditions
Heart and stroke conditions account for a significant burden of morbidity and mortality among Australian women. ALSWH provides important data on changes in key risk factors for these conditions, with reductions in smoking as the women age but increasing prevalence of obesity among the younger cohorts.
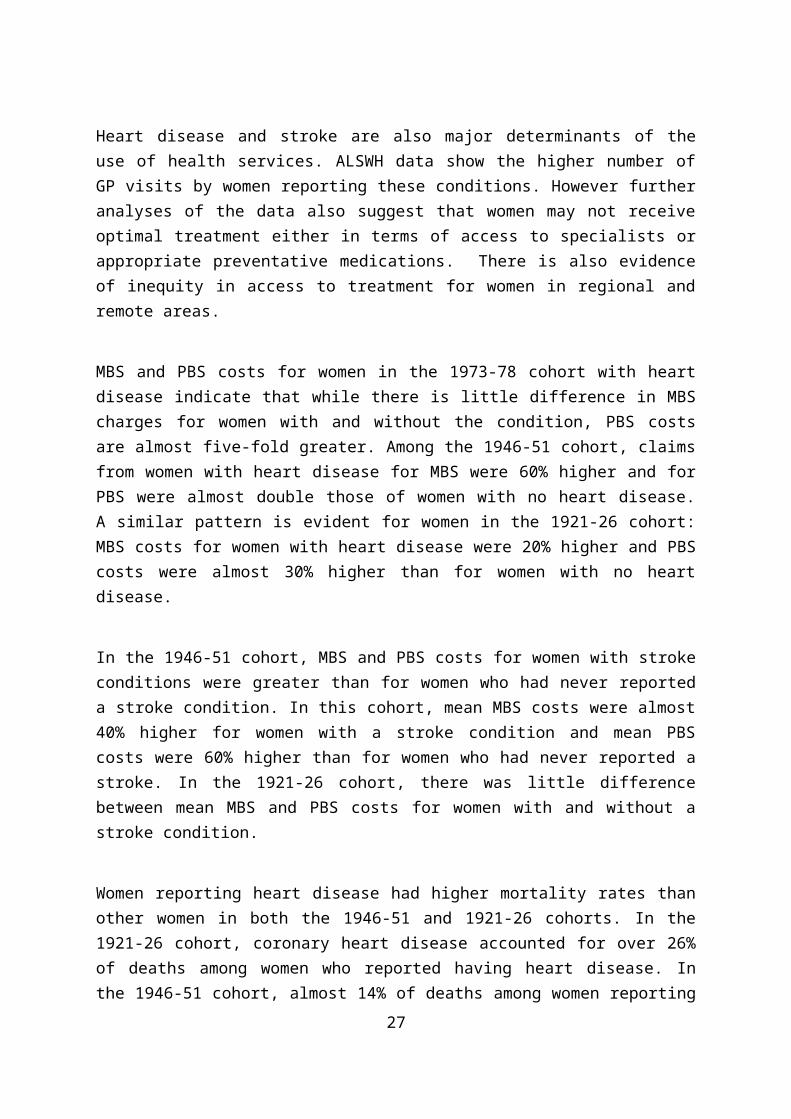
Heart disease and stroke are also major determinants of the use of health services. ALSWH data show the higher number of GP visits by women reporting these conditions. However further analyses of the data also suggest that women may not receive optimal treatment either in terms of access to specialists or appropriate preventative medications. There is also evidence of inequity in access to treatment for women in regional and remote areas.
MBS and PBS costs for women in the 1973-78 cohort with heart disease indicate that while there is little difference in MBS charges for women with and without the condition, PBS costs are almost five-fold greater. Among the 1946-51 cohort, claims from women with heart disease for MBS were 60% higher and for PBS were almost double those of women with no heart disease. A similar pattern is evident for women in the 1921-26 cohort: MBS costs for women with heart disease were 20% higher and PBS costs were almost 30% higher than for women with no heart disease.
In the 1946-51 cohort, MBS and PBS costs for women with stroke conditions were greater than for women who had never reported a stroke condition. In this cohort, mean MBS costs were almost 40% higher for women with a stroke condition and mean PBS costs were 60% higher than for women who had never reported a stroke. In the 1921-26 cohort, there was little difference between mean MBS and PBS costs for women with and without a stroke condition.
19

Women reporting heart disease had higher mortality rates than other women in both the 1946-51 and 1921-26 cohorts. In the 1921-26 cohort, coronary heart disease accounted for over 26% of deaths among women who reported having heart disease. In the 1946-51 cohort, almost 14% of deaths among women reporting heart disease were due to coronary heart disease, with breast cancer, lung cancer, cerebrovascular disease and chronic obstructive pulmonary disease also accounting for a large proportion of deaths among these women. These major causes of death are all smoking related, or smoking is a risk factor for these conditions.
Women reporting stroke also had higher mortality rates than other women in the 1946-51 and 1921-26 cohorts. However, many of these women died of causes other than cerebrovascular disease.
1.5. DiabetesDiabetes has a low prevalence among the younger cohorts but has a high incidence rate which increases with age. Consequently the prevalence of diabetes has increased rapidly in each cohort. While the highest overall prevalence of diabetes is in the oldest cohort (with over 15% of women in their late 80s reporting this condition), rates of diabetes in the 1946-51 and 1973-78 cohorts are likely to exceed this prevalence when these cohorts reach these older ages. The prevalence of diabetes in the 1946-51 cohort (in their 60s) is more than double the prevalence observed for the 1921-26 cohort when they were aged 70-75 years. This difference may reflect better survival among women with diabetes, as well as earlier diagnosis, but also reflects increasing prevalence of overweight and obesity as major risk factors. These effects are also apparent among women in the 1973-78 cohort who exhibit higher prevalence of diabetes in their mid 30s than the 1946-56 cohort did in their mid 40s. Likewise, while prevalence rates in the 1989-95 cohort are currently low, the very high levels of overweight and obesity in this cohort would suggest that the prevalence of diabetes in this cohort could also rapidly escalate.
Diabetes is strongly associated with BMI in all cohorts, and with corresponding associations with physical activity. Small changes in BMI and physical activity across the whole population could result in large reductions in the incidence of diabetes.
Prevalence and incidence of diabetes are higher in regional and remote areas, compared to major cities, and among women with lower levels of education and greater difficulty managing on income. Diabetes also has higher prevalence and incidence among current and ex-smokers in the 1973-78 and 1946-51 cohorts.
20

Poor diet quality is associated with risk of diabetes, including a higher risk with lower zinc intakes, as well as with higher intakes of monosaturated fatty acids, and lower intakes of dietary fibre. In contrast, women in the 1946-51 cohort with a Mediterranean style diet have a lower risk of developing diabetes.
An examination of mean MBS and PBS costs in 2013 indicates that these are higher for women with diabetes than for women without diabetes in all three cohorts. MBS costs may include items under the annual cycle of care (ACC), however these items are not fully utilised. MBS costs for women with diabetes in each cohort were 12% (1973-78), 30% (1946-51) and 7% (1921-26) higher than for women without diabetes. Greater differences were seen in PBS costs which were tripled for women with diabetes in the 1973-78 cohort (compared to women with no diabetes), and doubled for women with diabetes in the 1946-51 cohort.
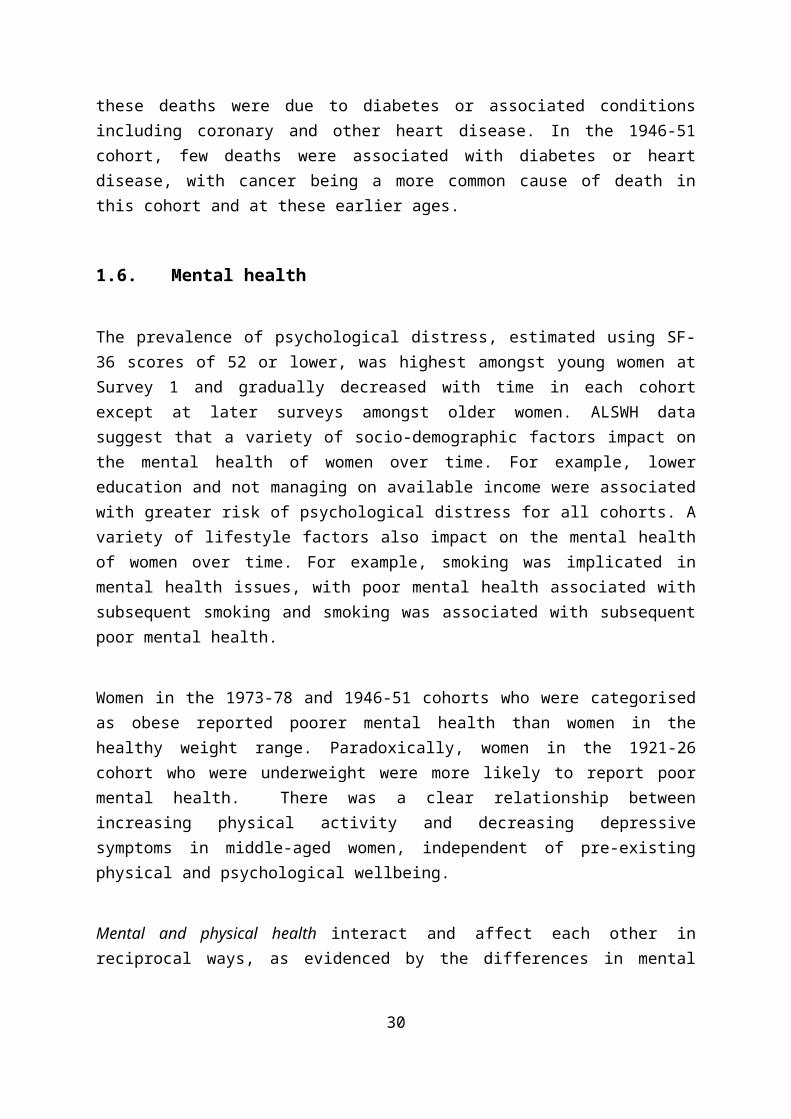
Women reporting diabetes had increased mortality rates in both the 1946-51 and 1921-26 cohorts. In the 1921-26 cohort most of these deaths were due to diabetes or associated conditions including coronary and other heart disease. In the 1946-51 cohort, few deaths were associated with diabetes or heart disease, with cancer being a more common cause of death in this cohort and at these earlier ages.
1.6. Mental health
The prevalence of psychological distress, estimated using SF-36 scores of 52 or lower, was highest amongst young women at Survey 1 and gradually decreased with time in each cohort except at later surveys amongst older women. ALSWH data suggest that a variety of socio-demographic factors impact on the mental health of women over time. For example, lower education and not managing on available income were associated with greater risk of psychological distress for all cohorts. A variety of lifestyle factors also impact on the mental health of women over time. For example, smoking was implicated in mental health issues, with poor mental health associated with subsequent smoking and smoking was associated with subsequent poor mental health.
Women in the 1973-78 and 1946-51 cohorts who were categorised as obese reported poorer mental health than women in the healthy weight range. Paradoxically, women in the 1921-26 cohort who were underweight were more likely to report poor mental health. There was a clear relationship between increasing physical activity and decreasing depressive symptoms in middle-aged women, independent of pre-existing physical and psychological wellbeing.
21

Mental and physical health interact and affect each other in reciprocal ways, as evidenced by the differences in mental health scores for women with and without chronic conditions in this report.
Women with psychological distress had more general practice visits than women with no psychological distress and MBS costs were higher for women with psychological distress. Women in the 1973-78 and 1946-51 cohorts who are psychologically distressed cost a fifth more on MBS than women who are not distressed. In the 1973-78 and 1946-51 cohorts, PBS costs for women with poor mental health are almost three times those of women who have never indicated that they are psychologically distressed
1.7. Comorbidity
Many women had more than one index condition, particularly in the older two cohorts. In the 1946-51 cohort, only around one third of the women had no conditions, another third had one condition, and the remaining third had two or more conditions. Very few women in the 1921-26 cohort had no conditions, and around half the women had two or more conditions. In both cohorts managing on their income was more difficult for women who had multiple chronic conditions.
There was also a clear relationship between obesity and having multiple chronic conditions: women who were obese or overweight had more conditions than women who were normal weight. Correspondingly, moderate or high levels of physical activity were associated with fewer chronic conditions.
Women with more comorbid conditions were also more likely to have a claim for a Chronic Disease Management Plan in their MBS data. On average, women in the 1921-26 and 1946-51 cohorts with four or more conditions had at least one chronic disease management plan item for the years 2010-2013. This rate would indicate that the use of these items is less than optimal even among the women with the most complex comorbid conditions.
1.8. Summary
This report shows that while chronic conditions are not common in younger women, their prevalence increases with age. Since 1996, the prevalence of chronic conditions has increased rapidly in each cohort as women have aged, with women in the 1946-51 and 1921-26 cohorts experiencing a high burden of the main chronic diseases of arthritis,
22

asthma, diabetes, and cardiovascular conditions. Many women have also reported cancer, with breast cancer being the most common.
The report also highlights the high burden of mental health conditions including depression and anxiety, with these conditions often comorbid with physical health problems. The issue of comorbidity is further highlighted by the one third of women in the 1946-51 cohort who have two or more chronic conditions, with obesity linked closely to the prevalence of comorbidities.
There are marked differences in the main causes of death between age cohorts. For the 1921-26 cohort the main causes of death are coronary heart disease, cerebrovascular disease, dementia, chronic obstructive pulmonary disease, and diabetes, but for the 1946-51 cohort they include the major cancers (breast, lung, colorectal, ovarian) and cerebrovascular disease.
The burden on the health system of chronic conditions is evidenced by the significantly higher MBS and PBS costs for women with these conditions. With the higher prevalence of obesity among women in the 1946-51 cohort than in the 1921-26 cohort, and the links between obesity and a range of chronic conditions, these cost differentials are likely to increase over the coming decades.
23

2. Introduction
The Australian Longitudinal Study on Women’s Health (ALSWH) is a longitudinal population-based survey examining the health of around 60,000 Australian women. The Study follows women in four age cohorts: women born 1921-26, 1946-51, 1973-78, and 1989-95. Women in the first three cohorts were first surveyed in 1996 and have since been surveyed each three years on a rolling basis. Since 2011, women in the 1921-26 cohort have been surveyed every six months. Women in the 1989-95 cohort were recruited in 2013, and completed their first follow-up survey in 2014.
For all cohorts, data have been linked to the Medicare Benefits Schedule, the Pharmaceutical Benefits Scheme, Cancer Registries, hospital data for New South Wales, Queensland, South Australia and Western Australia, and the National Death Index. Survey data for the 1921-26 cohort are also linked to aged care data. These linked data allow for verification of self-reported conditions and for detailed assessment of patterns and costs of health care utilization.
Drawing on survey data and record linkage for these cohorts, this report presents a summary of:
the prevalence and incidence of common chronic conditions
selected sociodemographic and lifestyle risk factors associated with these conditions
the impact of conditions on physical functioning and mental health
health care use
The report also presents mortality rates in the two older cohorts and how the selected conditions increase the risk of death at older ages.
2.1. Definition of chronic conditions
The Australian Institute of Health and Welfare defines a chronic condition as one that is prolonged, rarely spontaneously resolved and rarely completely cured (AIHW, 2012b). Chronic conditions may contribute to premature death or increased disability.
Features common to most chronic conditions include:
complex causality with multiple factors precipitating onset
a long development period, during which there may be no symptoms
a prolonged illness course, which may result in other health complications
24

associated functional impairment or disability (Department of Health website)
This report includes conditions identified by the National Health Priority Areas (NHPA) as those which contribute most to the burden of disease in the community, and which may be amenable to change. The NHPA identifies 8 health areas: arthritis, asthma, cancer control, cardiovascular health, diabetes mellitus, injury prevention and control, mental health and obesity. With the exception of injury prevention and control, conditions identified by the NHPA are considered in this report, including a summary of findings for mental health drawn from the ALSWH Major Report provided in 2013. The pervasive nature of the impact of obesity has led to it being included as a risk factor for other chronic conditions, rather than a stand-alone condition.
2.2. Prevalence of chronic conditions
Common chronic conditions included in this report are: arthritis, asthma, breast cancer, cardiovascular disease (ischaemic heart disease, stroke), and diabetes mellitus. The prevalence and impact of these conditions vary across the life course, with socio-demographic circumstances and lifestyle risk factors, and according to the effects of comorbid conditions.
The presence of these conditions is ascertained at each ALSWH survey, by asking the women whether they have been diagnosed with or treated for each condition within the past three years. Self-reported diagnosis is the most common means of ascertaining chronic conditions in large epidemiological surveys, although the information is subject to error if women are unaware of their diagnosis, if they are misdiagnosed, or if they omit to report their diagnosis. For each condition, this report considers the accuracy of the self-reported data used in ALSWH and their limitations. In the ALSWH, self-reported diagnosis appears to be an excellent marker for breast cancer (Stavrou et al., 2011), a good marker for diabetes (Navin et al., 2015) and arthritis (Parkinson et al., 2013, Lo et al., Under review-a), but a poor marker for cardiovascular disease (Navin et al., 2015) and stroke (Jackson et al., 2015). There are some potential problems with misdiagnosis of asthma, particularly among older women who may be under-diagnosed or diagnosed as having chronic obstructive lung disease. Mid-age women (in the 1946-51 cohort) generally tend to report diagnosed chronic conditions more accurately than older women (1921-26 cohort) (Navin et al., 2015, Jackson et al., 2015).
Once women report a condition, this report assumes the condition is enduring. That is, the condition does not resolve and the woman is assumed to have the condition at following surveys, whether or not she still has symptoms, and whether or not she is still actively being treated.
25

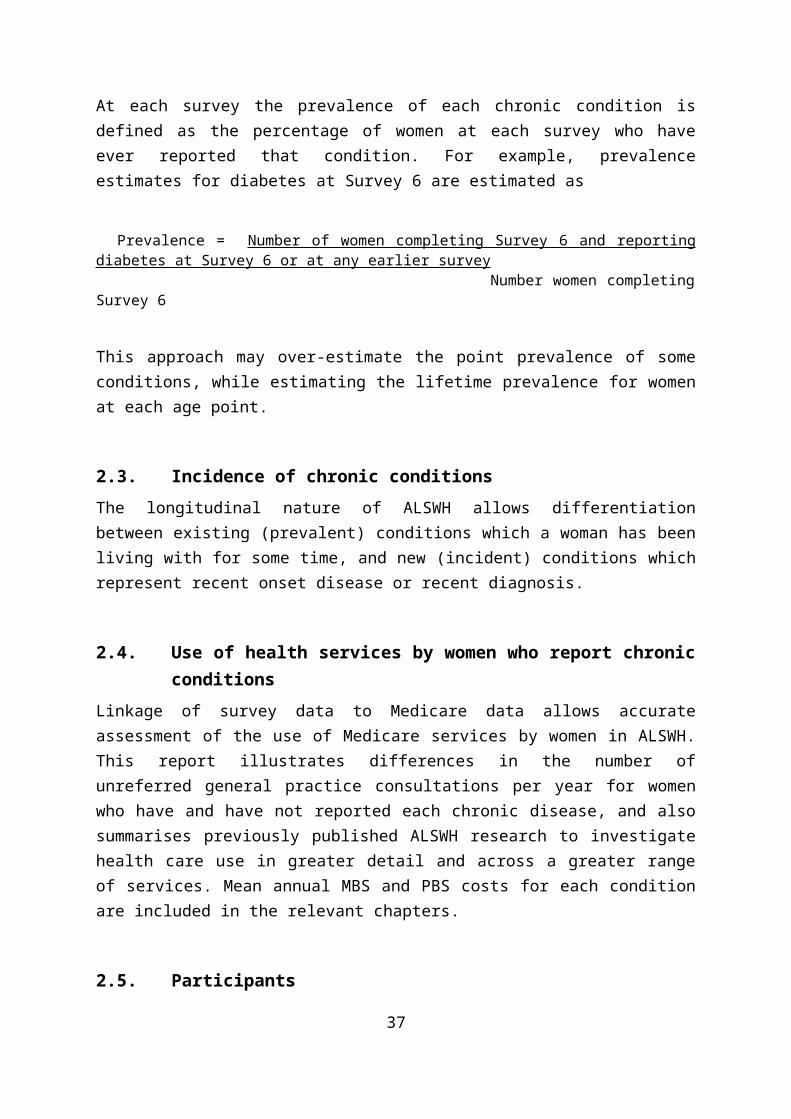
At each survey the prevalence of each chronic condition is defined as the percentage of women at each survey who have ever reported that condition. For example, prevalence estimates for diabetes at Survey 6 are estimated as
Prevalence = Number of women completing Survey 6 and reporting diabetes at Survey 6 or at any earlier survey
Number women completing Survey 6
This approach may over-estimate the point prevalence of some conditions, while estimating the lifetime prevalence for women at each age point.
2.3. Incidence of chronic conditions
The longitudinal nature of ALSWH allows differentiation between existing (prevalent) conditions which a woman has been living with for some time, and new (incident) conditions which represent recent onset disease or recent diagnosis.
2.4. Use of health services by women who report chronic conditions
Linkage of survey data to Medicare data allows accurate assessment of the use of Medicare services by women in ALSWH. This report illustrates differences in the number of unreferred general practice consultations per year for women who have and have not reported each chronic disease, and also summarises previously published ALSWH research to investigate health care use in greater detail and across a greater range of services. Mean annual MBS and PBS costs for each condition are included in the relevant chapters.
2.5. Participants
Figures and Tables presented in the rest of this report include only women who survived and returned all surveys. Cohort retention in each survey is shown in Appendix A.
26
3. Mortality
3.1. Chronic disease and death
ALSWH data are linked to the National Death Index providing accurate data on if and when ALSWH participants die. There have been few deaths among women in the 1973-78 (80 deaths up to March 2014) and 1946-51 cohorts (675 deaths). In contrast, many women in the 1921-26 cohort have died over the course of the study (6,895 deaths).
For this report, death data have been analysed to assess factors associated with mortality rates among women in the 1946-51 and 1921-26 cohorts, following women who completed Survey 2 up to 15 March 2014 (when the most up-to-date death data were available).
Causes of death for women in the 1946-51 are illustrated in Figure 3-1. The top five causes of death are breast cancer, lung cancer, colorectal cancer, cerebrovascular disease and ovarian cancer.
Other59.2%
Breast cancer16.6%
Lung cancer9.6%
Colorectal cancer5.3%
Cerebrovascular diseases4.8%
Ovarian cancer4.5%
Figure 3-1: Causes of death for women in the 1946-51 cohort: Top five causes of death are breast cancer, lung cancer, colorectal cancer, cerebrovascular disease and ovarian cancer.
27

Causes of death for women in the 1921-26 cohort are shown in Figure 3-2. The top five causes of death are coronary heart disease, cerebrovascular disease, dementia, chronic obstructive pulmonary disease and diabetes.
Other55.4%
Coronary heart diseases19.1%
Cerebrovascular diseases10.9%
Dementia and Alzheimer disease7.0%
Chronic obstructive pulmonary disease4.3%
Diabetes3.4%
Figure 3-2: Causes of death for women in the 1921-26 cohort: Top five causes of death are coronary heart disease, cerebrovascular disease, dementia, chronic obstructive pulmonary disease and diabetes.
The top five causes of death in Australian women of all ages are coronary heart disease, dementia, cerebrovascular disease, lung cancer and breast cancer (AIHW, 2015).
Probabilities of death for women with the chronic conditions examined in this report are shown in Table 3-1 and Table 3-2.
28
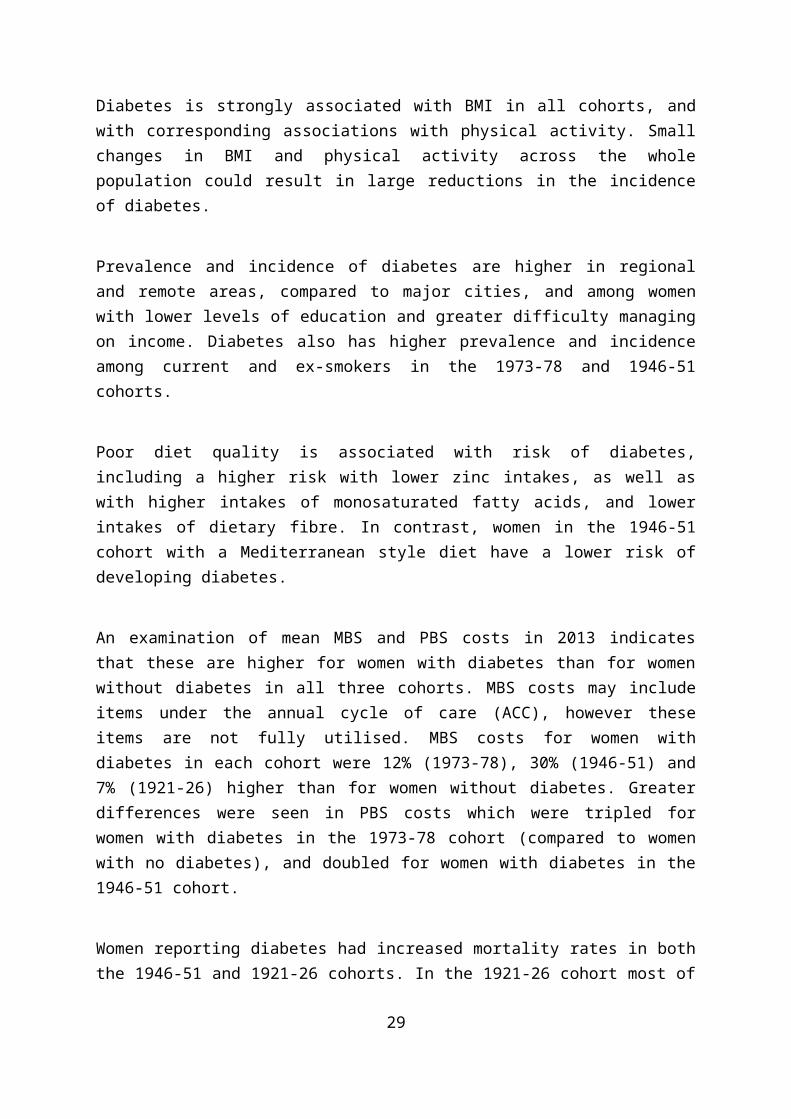
Table 3-1 Probability of death between Survey 2 (1998) and October 2014 for women with self-reported chronic conditions at Survey 1 or Survey 2, 1946-51 cohort.
Proportion deceased
Conditiona With condition % Without condition %
Asthma 6.0 5.1
Breast Cancer 19.4 4.8
Heart disease 13.0 5.0
Stroke 15.1 5.1
Diabetes 10.8 5.0a Self-report of diagnosed condition at Survey 1 or Survey 2.
In the 1946-51 cohort women with each of these conditions (except asthma) had higher mortality rates than women without the condition, even after adjusting for other risk factors (area of residence, education, difficulty managing on income, smoking, and physical activity).
Table 3-2 Probability of mortality between Survey 2 (1999) and October 2014 for women with self-reported chronic conditions at Survey 1 or Survey 2, 1921-26 cohort.
Proportion deceased
Conditiona With condition % Without condition %
Arthritis 55.2 59.7
Asthma 63.6 57.1
Heart disease 70.8 54.5
Stroke 77.0 56.6
Diabetes 73.8 56.0a Self-report of diagnosed condition at Survey1 or Survey2.
In the 1921-26 cohort women with each of these conditions had higher mortality rates than women without the condition, even after adjusting for other risk factors (area of residence, education, difficulty managing on income, smoking, and physical activity).
29
Arthritis
15% of the women in the 1946-51 cohort who had arthritis died of breast cancer, and equal proportions died of coronary heart disease and lung cancer (8%). The preponderance of breast cancer and the presence of lung cancer as cause of death is consistent with studies in other samples which have reported a link between autoimmune disorders (such as rheumatoid arthritis) and cancer mortality (Ji et al., 2011). In contrast, women with arthritis in the 1921-26 cohort were more likely to die from coronary heart disease, CVD and dementia.
Asthma
Chronic obstructive pulmonary disease accounted for more than 10% of deaths among women in both the 1946-51 and 1921-26 cohorts. Other causes of death for women with asthma were breast cancer, lung cancer and coronary heart disease (1946-51 cohort) and coronary heart disease and cerebrovascular disease (1921-26 cohort).
Breast cancer
Of women with breast cancer in the 1946-51 cohort, two-thirds of deaths were attributable to breast cancer.
Heart disease
Coronary heart disease is the number one cause of death in Australian women (AIHW, 2015 http://www.aihw.gov.au/deaths/ accessed 10 May 2015) and for women with this condition in the 1946-51 and 1921-26 cohorts it is also the most common cause of death.
Stroke
Stroke is the most common cause of death for women who reported a stroke condition in the 1946-51 cohort (13%), although coronary heart disease remains the top cause of death in the 1921-26 cohort (21%), followed by stroke (19%).
Diabetes
Women with diabetes have an elevated mortality rate, often related to cardiovascular disease (coronary heart disease and cerebrovascular disease). While this pattern was not apparent among women of the 1946-51 cohort who had diabetes, causes of death among the 1921-26 cohort were more consistent: coronary heart disease (22%), cerebrovascular disease (8%) and diabetes itself (16%).
30

In other analyses, ALSWH data have been used to identify the impact of behavioural risk factors on death within ten years for women in their 70s. Risk of death was lowest for overweight, physically active, never smokers who drank alcohol at least weekly - with women aged 71-73 years in this category having an 8% risk of dying over the next ten years. Risk of death was highest for physically inactive, current smokers who drank alcohol less than weekly (including never or rarely) and who were in either the normal weight or obese categories – with 34% of women aged 71-73 years in this category dying over the next ten years. These absolute risk charts provide a tool for understanding the combined effects of behavioural risk factors for death among older people (Dobson et al., 2012).
Women in the 1921-26 cohort who live in rural areas also have a higher risk of overall mortality. Analysis of survival to 31 October 2006, showed a higher mortality rate among women in rural areas for all cause mortality (hazard ratio (HR) = 1.09; 95% confidence interval (CI): 1.01-1.18) and for most major causes of death compared to urban women. In particular, death rates were substantially higher for lung cancer (HR = 1.52; 95% CI: 1.03-2.25) and chronic obstructive pulmonary disease (COPD) (HR = 1.83; 95% CI: 1.25-2.69) (Dobson et al., 2010).
31

4. Obesity and other common risk factorsRisk factors for chronic conditions
Many chronic conditions share a common set of risk factors. Importantly these include lifestyle factors such as body weight, physical inactivity and smoking, and social factors such as education and difficulty managing on income. This report presents the relationship between each chronic condition and these risk factors, as well as more extensive published research from ALSWH into these and other factors that are particularly associated with these conditions.
The highlighted risk factors demonstrate considerable variation between cohorts and as women age. For example the 1989-95 cohort tends to have higher levels of education and less difficulty managing on income than the oldest cohort, although there is still a high degree of variation within each of the cohorts, which is reflected in different levels of chronic disease risk.
The proportions of women who are overweight or obese have increased across the cohorts and as the women have aged (see Figure 4-3).
Obese, 30 <= BMIOverweight, 25 <= BMI < 30Acceptable weight, 18.5 <= BMI < 25Underweight, BMI < 18.5
BMI group
18 21 24 27 30 33 36 39 42 45 48 51 54 57 60 63 66 69 72 75 78 81 84 87 90
Average age at survey
0
10
20
30
40
50
60
70
80
%
1973-78 cohort 1946-51 cohort 1921-26 cohort
32

Figure 4-3: Prevalence of overweight and obesity in each cohort (1973-78, 1946-51, 1921-26) at each survey.
Over the ten year period from 1996 to 2006, women in the 1973-78 cohort were estimated to have gained around 600 grams per year for an average non-pregnant woman who initially weighed 65kg (Brown et al., 2010). By Survey 6, the mean weight of women in the 1973-78 cohort, who were then aged 34-39 years, was higher than the mean weight for the 1946-51 cohort when they were aged 45-50. Overweight and obesity is also higher among women in the 1989-95 cohort, with 19% of the women who completed the baseline survey categorised as overweight and 14% as obese. However, in the older cohort there has also been an increase in the proportion who are underweight, particularly at the oldest ages.
Among women in the 1989-95 cohort (aged 18 to 23 years in 2013), 19% were categorised as overweight and 14% as obese. Comparison with women in the same age range in 1996 indicated a marked increase by 2013 in the percentage of overweight or obese women (20% in 1996 and 33% in 2013 respectively (Mishra et al., 2014).
Figure 4-4 shows how the percentages of women who are current smokers have changed over time among women in the 1973-78, 1946-51 and 1921-26 cohorts. In 1996, smoking rates were highest among women in the 1973-78 cohort, and have declined over time. Smoking prevalence in 2013 for the 1989-95 cohort was 19% (Mishra et al., 2014). Smoking is one of the strongest risk factors for early death (Jamrozik et al., 2011).
18 21 24 27 30 33 36 39 42 45 48 51 54 57 60 63 66 69 72 75 78 81 84 87 90
Average age at survey
0
10
20
30
% c
urre
nt s
mok
er
1973-78 cohort 1946-51 cohort 1921-26 cohort
33

Figure 4-4: Prevalence of smoking in each cohort (1973-78, 1946-51, 1921-26) at each survey.
34

Analysis of changes in smoking behaviour among women in the 1973-78 cohort shows that women who continued to smoke from Survey 1 to Survey 4 were more likely to be living in a rural or remote area and had lower educational attainment. Getting married or being in a committed relationship was associated with quitting, remaining an ex-smoker and not starting to smoke. Smoking was also associated with other lifestyle factors, with physical activity levels also associated positively with remaining an ex-smoker. Risky or high-risk drinking and illicit drug use predicted continued smoking, relapse after quitting and smoking adoption (McDermott et al., 2009).
A study of changes in smoking and alcohol consumption among women in the 1973-78 cohort who were pregnant at Surveys 2, 3 or 4 shows that while 22% of women were concurrent drinkers and smokers before pregnancy, 73% decreased drinking and 72% decreased smoking during pregnancy (53% decreased both drinking and smoking). Reduction in both drinking and smoking was more likely among women who had at least 12 years education and women who drank less, and less likely among heavy smokers, women who already had one child, and socially disadvantaged women (Powers et al., 2013).
ALSWH data also show a strong association between smoking and depression among women in the 1973-78 cohort. This association appears to be bi-directional with women who are depressed being more like to smoke, and women who smoke being more likely to have poor mental health (Leung et al., 2012).
35

HighModerateLowNi l/sedentaryPhysical activity
24 27 30 33 36 39 49 52 55 58 61 64 67 75 78 81 84 87
Average age at survey
0
10
20
30
40
50
60
70
80
90
100
%
1973-78 cohort 1946-51 cohort 1921-26 cohort
Figure 4-5: Physical activity levels in each cohort (1973-78, 1946-51, 1921-26) at each survey.
Physical activity levels are shown in Figure 4-5. At Survey 1, there are few differences in activity levels between the 1973-78 and 1946-51 cohorts, but the proportion of women with higher levels of physical activity increases in the 1946-51 cohort over time. Physical activity levels are lowest in the 1921-26 cohort, and decrease as the women age.
Women in the 1989-95 cohort were more physically active than women in the same age group in 2000 (Survey 2 of the 1973-78 cohort). Only 30% of women in 2013 were in the inactive or low physical activity categories, compared with 41% in 2000 (Mishra et al., 2014).
36
It i s easyNot too badDiffi cult sometimesDiffi cult a lwaysImposs ibleManage on income
20 24 27 30 33 36 39 47 49 52 55 58 61 64 67 72 75 78 81 84 87
Average age at survey
0
10
20
30
40
50
60
70
80
90
100
%1973-78 cohort 1946-51 cohort 1921-26 cohort
Figure 4-6: Difficulty managing on income in each cohort (1973-78, 1946-51, 1921-26) at each survey.
Figure 4-6 shows women’s ratings of difficulty managing on income. Women in the 1973-78 and 1946-51 cohort reported the greatest difficulty managing on income, and women in the 1921-26 cohort report the least difficulty. In both the 1946-51 and 1921-26 cohorts, difficulty managing on income was less at each survey.
A higher percentage of women in the 1989-95 cohort (aged 18 to 23 in 2013) reported having some level of difficulty managing on their income compared with women in the same age group in 1996 (61% and 51% respectively) (Mishra et al., 2014).
37

5. Arthritis and musculoskeletal conditions
Arthritis is one of a group of musculoskeletal conditions (including back problems and osteoporosis) which affect more than a quarter of the population (AIHW, 2014b). In the Australian Health Survey 2011-12, around 3.3 million people reported having arthritis. The overall prevalence was 14.8%, but prevalence was higher in women than men (17.7% compared with 11.8%), and increased with age (Australian Health Survey, 2012b). At ages 75 years and over, 60% of women had arthritis compared with 42.3% of men. Among people with arthritis, more than half (56%) had osteoarthritis (OA), 13.6% had rheumatoid arthritis (RA), and 37.3% had an unspecified type of arthritis. Some people had more than one type of arthritis. Both OA and RA result in pain and reduced physical functioning, but they have very different aetiologies.
Osteoarthritis is a degenerative joint condition, caused by a breakdown of the synovial cartilage, and mostly affects the hands, spine, hips, knees and ankles. Age is the strongest risk factor for the development of osteoarthritis, followed by being overweight, physical inactivity, and joint trauma or repetitive joint loading tasks, such as kneeling and squatting. Diagnosis of osteoarthritis is usually confirmed by X-rays, which typically reveal loss of cartilage, bone spurs, and in extreme cases, bone on bone friction (Sinusas, 2012).
In contrast, rheumatoid arthritis is an autoimmune disorder which affects the synovial tissues, causing joint pain, swelling and stiffness, mostly in the hands (McInnes and Schett, 2011). Diagnosis is based on: morning stiffness which lasts for more than 30 minutes, more than three tender and swollen joint areas and systemic flu-like features and fatigue. Blood tests are used to confirm the diagnosis, based on tests for specific antibodies.
To date, ALSWH work relating to arthritis has examined the role of behavioural and psychosocial variables in the aetiology of arthritis, symptoms of arthritis and the impact of arthritis on functioning and quality of life, and health care use.
5.1. Women and arthritis
Women are more likely to be affected by arthritis than men (Zhang and Jordan, 2010), and osteoarthritis particular affects women more severely and at more sites. Women with arthritis also account for more health care utilisation than men with arthritis, and health expenditure on arthritis and musculoskeletal conditions is around 30% higher for women than men.
38

5.2. Ascertainment of arthritis in ALSWH
The 1946-51 cohort was asked about arthritis in each survey from 2001 (Survey 3) to 2013 (Survey 7). The 1921-26 cohort was asked about arthritis in each survey from 1999 (Survey 2) to 2011 (Survey 6). In earlier surveys there was one question about all forms of arthritis, but since 2005 women have been asked to respond separately to questions about diagnosis with osteoarthritis or rheumatoid arthritis. (See Appendix B)
The prevalence of arthritis was ascertained from the question:
“Have you ever been told by a doctor that you have arthritis”
New cases of arthritis were ascertained at subsequent surveys by asking:
“In the last three years have you been diagnosed or treated for arthritis?”
Most epidemiological studies of arthritis use some variant of this question to ascertain arthritis, particularly for prevalence studies (Lo et al., Under review-b). However, as for all chronic conditions, self-reported arthritis may suffer from recall error. Validation studies have shown that there is good agreement between self-report data and medical records, and a recent review has concluded that the accuracy of self-reported osteoarthritis and rheumatoid arthritis is acceptable for large-scale studies in which rheumatologist examination is not feasible (Peeters et al., 2015b). To assess the validity of self-reported arthritis in ALSHW, a sample of women from the 1946-51 cohort of ALSWH were asked detailed questions about diagnosed arthritis and musculoskeletal symptoms. In this survey there was good agreement between self-reported arthritis and musculoskeletal symptoms (Lo et al., Under review-a). There is also good agreement between ALSWH women’s reports of arthritis-related surgeries, including hip and knee replacements, and hospital records (Parkinson et al., 2013).
In this report we consider arthritis to be an enduring condition, so if a woman reports arthritis on one survey she is considered to always have arthritis. In ALSWH, around half the women who report arthritis on one survey will not report arthritis on a subsequent survey. Our research has shown that this inconsistent reporting of arthritis reflects fluctuations in symptoms and functioning rather than reporting errors (Peeters et al., 2013). Considering arthritis as prevalent only when the woman has symptoms, and not also counting well controlled disease, would underestimate the prevalence of this condition.
39
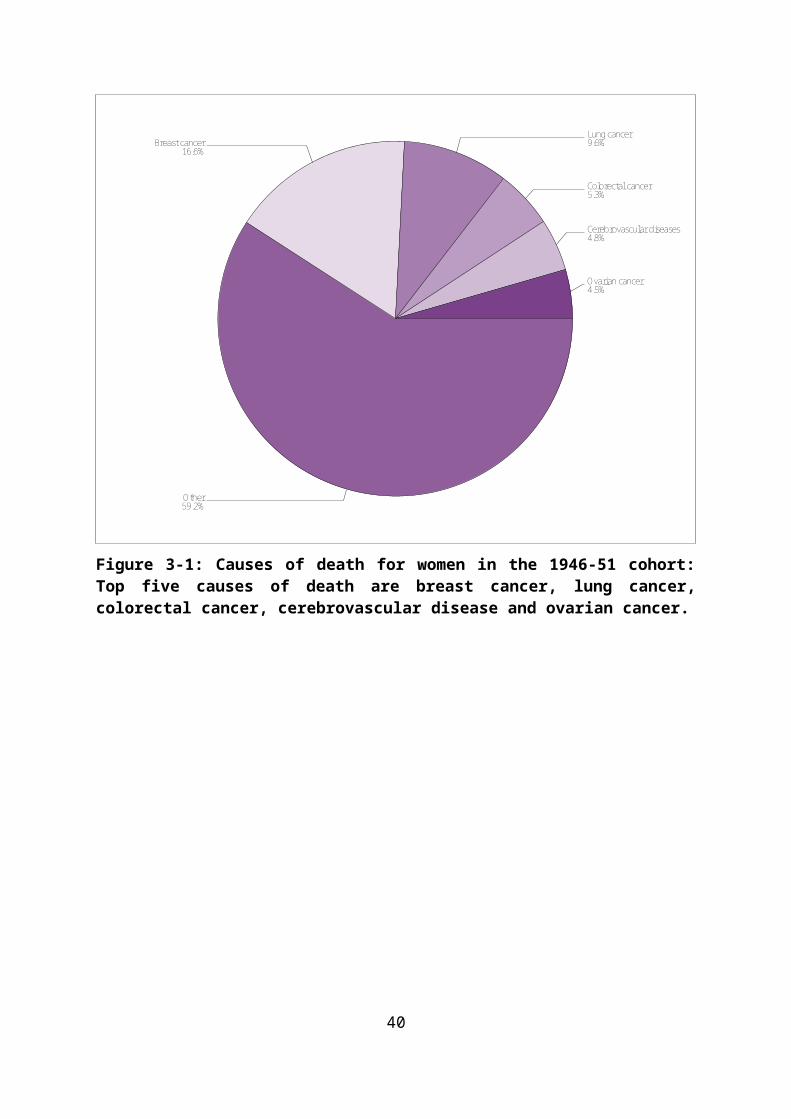
5.3. Prevalence of arthritis
Arthritis is one of the most common chronic conditions reported by women in ALSWH. The 1921-26 cohort were first asked about arthritis at Survey 2 in 1999, when the women were aged 73-78 years. At that time around four in ten women (40.8%) reported they had arthritis. The prevalence of arthritis in this cohort increased to around 70% over the next 12 years (See Figure 5-7).
Women in the 1946-51 cohort were first asked about arthritis at Survey 3 in 2000, when were aged 50-55 years. At that time around one in five women (21.5%) reported they had been diagnosed with arthritis. By 2013 (Survey 7, age 62-67), the prevalence had increased to 51.3%. This prevalence estimate was 10.5% higher than the prevalence in the 1921-26 cohort at age 73-78 (40.8%). By 2011 (Survey 6, age 85-90), the prevalence of arthritis was 70%.
45 48 51 54 57 60 63 66 69 72 75 78 81 84 87 90
Average age at survey
0
10
20
30
40
50
60
70
80
% d
iag
or tr
eat f
or a
rthr
itis
1946-51 cohort 1921-26 cohort
Figure 5-7: Prevalence of arthritis, Surveys 3-7 for the 1946-51 cohort and Surveys 2-6 for the 1921-26 cohort.
The prevalence estimates in these two ALSWH cohorts are similar to those in the Australian Health Survey (2011-12), which found that the prevalence of arthritis (including osteoarthritis, rheumatoid arthritis, and other forms of arthritis) was 22.8% in women aged
40

45-54, 40.4% for age 55-64, 54.7 for 65-74 year olds, and 60% among women aged over 80 (Australian Health Survey, 2012b).
5.4. Incidence of arthritis
Figure 5-8 shows the percentages of women who had prevalent arthritis at Survey 3 in the 1946-51 cohort, and Survey 2 in the 1921-26 cohort, and the percentages of women with first reported arthritis on a subsequent survey (incident cases). These new cases add to the cumulative prevalence at each survey.
0 20 40 60
Percent
1921-26
1946-51
Coho
rt
S7 IncidentS6 IncidentS5 IncidentS4 IncidentS3 Prevalent/IncidentS2 Prevalent
Figure 5-8: Prevalent and incident cases of arthritis, Surveys 3-7 for the 1946-51 cohort and Surveys 2-6 for the 1921-26 cohort.
5.5. Factors associated with arthritis
Apart from age and gender, and some genetic factors, the major risk factors for arthritis include overweight and obesity and risk of joint damage. These potentially modifiable risk factors may also vary according to area of residence and according to socioeconomic status.
41
5.5.1. Area of residence
S7 IncidentS6 IncidentS5 IncidentS4 IncidentS3 Preva lent/IncidentS2 Preva lent
RA a
t S1
1921-26
1946-51
0 20 40 60 80
Percent
Remote/Very Remote
Outer Regiona l
Inner Regional
Major Cities
Remote/Very Remote
Outer Regiona l
Inner Regional
Major Cities
Figure 5-9: Prevalent and incident cases of arthritis, Surveys 3-7 for the 1946-51 cohort and Surveys 2-6 for the 1921-26 cohort, according to area of residence at Survey 1.
In the 1946-51 cohort, women who were living in remote areas at Survey 1 were least likely to report arthritis by Survey 7 (44.3% prevalence, age 62-67). In contrast, in the 1921-26 cohort, those living in major cities (prevalence 72.6% at Survey 6) and remote areas (74.4%) were more likely to report arthritis at Survey 6 (compared with regional areas).
42
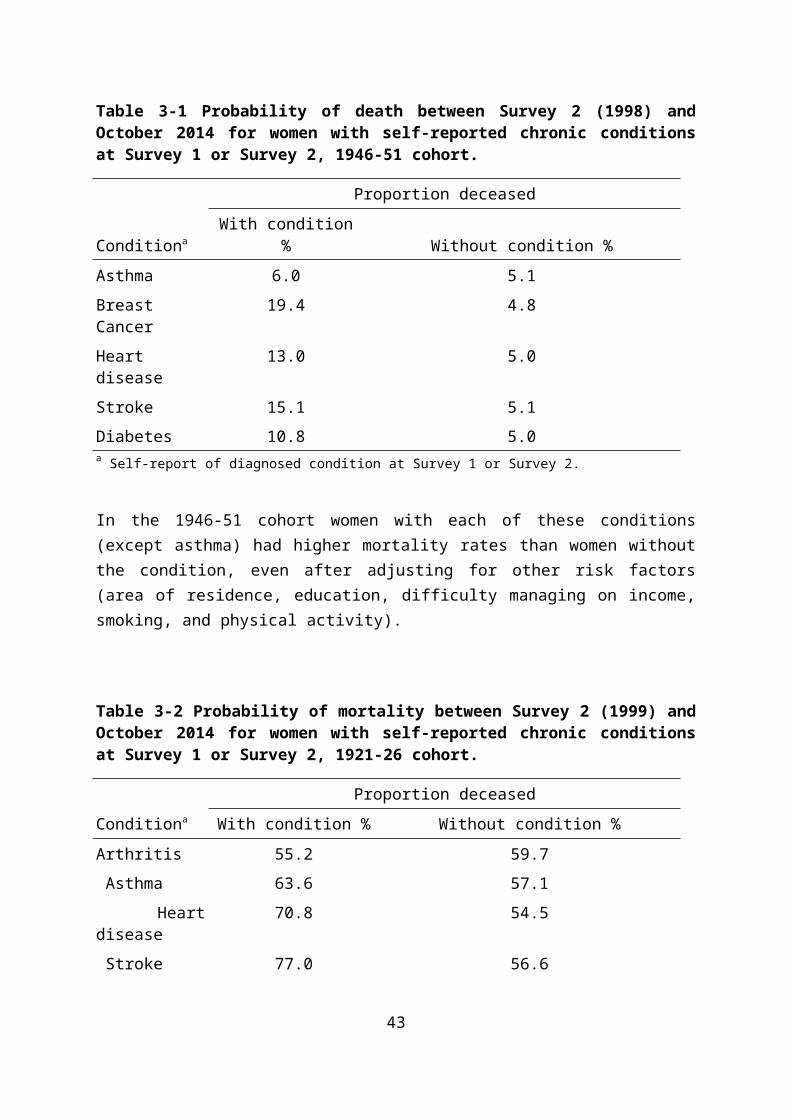
5.5.2. Highest educational qualification
S7 IncidentS6 IncidentS5 IncidentS4 IncidentS3 Preva lent/IncidentS2 Preva lent
Educ
ation
at S
1
1921-26
1946-51
0 20 40 60 80
Percent
Less than Year 12
Year 12
Certifi cate/Diploma
Univers i ty
Less than Year 12
Year 12
Certifi cate/Diploma
Univers i ty
Figure 5-10: Prevalent and incident cases of arthritis, Surveys 3-7 for the 1946-51 cohort and Surveys 2-6 for the 1921-26 cohort, according to highest educational qualification.
Relationships between education level and arthritis are shown in Figure 5-10 There were no clear associations between education and arthritis prevalence, but women with less than Year 12 education (1946-51 cohort, 54.5%; 1921-26 cohort, 70.7%) and those with a certificate/diploma (51.4% and 71.5% respectively) were slightly more likely to report
43

arthritis than women in the other education categories, in both cohorts. Education levels are associated with other risk factors for arthritis, particularly overweight and obesity.
5.5.3. Difficulty managing on income
S7 IncidentS6 IncidentS5 IncidentS4 IncidentS3 Preva lent/IncidentS2 Preva lent
Man
age
on in
com
e at
S1
1921-26
1946-51
0 20 40 60 80
Percent
Imposs ible
Diffi cult a lways
Diffi cult sometimes
Not too bad
It i s easy
Imposs ible
Diffi cult a lways
Diffi cult sometimes
Not too bad
It i s easy
Figure 5-11: Prevalent and incident cases of arthritis, Surveys 3-7 for the 1946-51 cohort and Surveys 2-6 for the 1921-26 cohort, accoring to difficulty managing on income.
There is a clear relationship between arthritis and income, with women who report most difficulty managing their income more likely to report arthritis. This difference was evident at the first survey and has persisted over time. In the older cohort, the prevalence of
44

arthritis at Survey 6, when the women were 85-90 years old, was 82.5% in those who reported that it was impossible to manage on their income.
45

5.5.1. Body Mass Index
S7 IncidentS6 IncidentS5 IncidentS4 IncidentS3 Preva lent/IncidentS2 Preva lent
BMI a
t S1
1921-26
1946-51
0 20 40 60 80
Percent
Obes e
Overweight
Hea lthy weight
Underweight
Obes e
Overweight
Hea lthy weight
Underweight
Figure 5-12: Prevalent and incident cases of arthritis, Surveys 3-7 for the 1946-51 cohort and Surveys 2-6 for the 1921-26 cohort, according to BMI category.
In both cohorts, initial estimates of the prevalence of arthritis were lowest in underweight and healthy weight women (with little difference between these two BMI categories), and highest in obese women. Over time, a clear ‘dose-response’ pattern has emerged, with the lowest prevalence in underweight women (35% of the 1946-51 cohort and 58% of the 1921-26 cohort) and the highest in obese women (65.7% and 80.8% respectively).
46

In all analyses of ALSWH data, BMI is the most powerful predictor of arthritis risk. This strong association, and the higher BMI among the 1946-56 cohort (than in the 1921-26 cohort), suggests that the prevalence of arthritis will also be much higher among the 1946-51 cohort when they are older. The overall prevalence in the 1946-51 cohort at Survey 7 (age 62-67) was already higher than it was in the 1921-26 cohort at Survey 2 when they were 73-78 years old (see Section 5.3).
5.5.1. Smoking
S7 IncidentS6 IncidentS5 IncidentS4 IncidentS3 Preva lent/IncidentS2 Preva lent
Smok
ing
at S
1
1921-26
1946-51
0 20 40 60 80
Percent
Current smoker
Ex-smoker
Never smoked
Current smoker
Ex-smoker
Never smoked
Figure 5-13: Prevalent and incident cases of arthritis, Surveys 3-7 for the 1946-51 cohort and Surveys 2-6 for the 1921-26 cohort, according to smoking status.
47

In the 1946-51 cohort, arthritis prevalence was lowest among non-smokers at every survey. In contrast, in the 1921-26 cohort the prevalence was lowest among current smokers, both at Survey 3 (37.5%) and at Survey 6 (66.7%). Smoking is not a known risk-factor for arthritis, but there is some evidence that smoking may protect against arthritis, through nicotine-related metabolic changes that may inhibit joint degeneration (Hui et al., 2011). The higher prevalence and incidence of arthritis among smokers in the 1946-51 cohort likely reflects overall poorer health and health risk behaviours rather than a direct association between smoking and arthritis. It should also be noted that few women from the 1921-26 cohort who were smokers at Survey 1 survived to Survey 6.
5.5.2. Physical activity
S7 IncidentS6 IncidentS5 IncidentS4 IncidentS3 Preva lent/IncidentS2 Preva lent
Phys
ical
acti
vity
at S
2
1921-26
1946-51
0 20 40 60 80
Percent
Inactive
Low
Moderate
High
Inactive
Low
Moderate
High
48
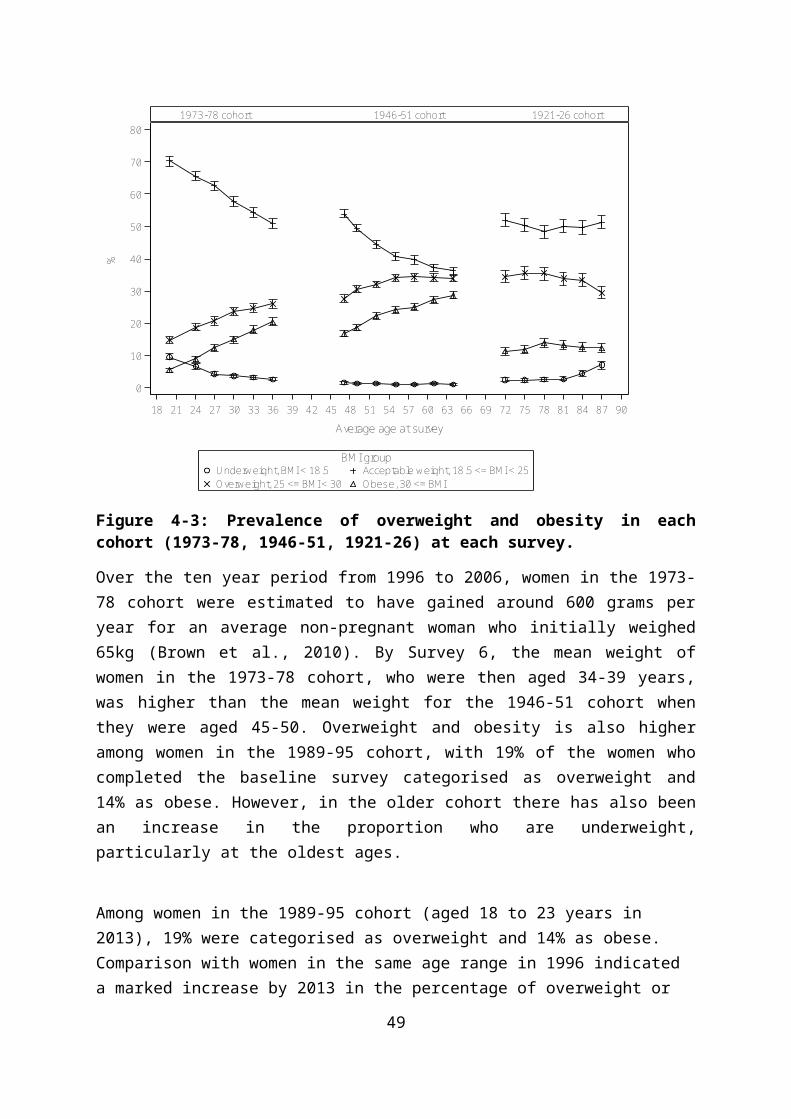
Figure 5-14: Prevalent and incident cases of arthritis, Surveys 3-7 for the 1946-51 cohort and Surveys 2-6 for the 1921-26 cohort, according to level of physical activity.
In the 1946-51 cohort arthritis prevalence was highest in the inactive women at Survey 3 (24.7%) and this pattern persisted to Survey 7, when the prevalence was 7% higher in the inactive (56.5%) than in the moderately active women (49.5%). In the 1921-26 cohort, the prevalence was highest in low active (44%) and inactive women (48%) at Survey 3, and this pattern also persisted over time. By Survey 6 (age 85-90), prevalence was lowest in the high active group (64%), and highest in the inactive women (76%).
Detailed analyses of data for women 1946-51 showed that those who reported moderate levels of physical activity in one survey were less likely to report the onset of stiff and painful joints in the following survey (Heesch et al., 2007). The same effect was seen for the older women. However, while there was a clear dose-response relationship between physical activity and arthritis symptoms in both cohorts, this effect was moderated by other factors, including BMI.
Further analysis of data from the 1921-26 cohort assessed longitudinal relationships between physical activity and arthritis across Surveys 2 to 4 (1999 to 2005). The researchers found that women who reported moderate levels of physical activity (75-150 minutes/week) had lower odds of having arthritis than women with low levels of activity. There was no additional benefit from higher levels of physical activity. Importantly, women who reported walking as their only physical also had reduced odds of developing arthritis during this period (Heesch et al., 2008).
A more recent paper has examined the effects of longer term ‘exposure’ to physical activity (from 1998 to 2004), on development of arthritis-related symptoms from 2007 to 2010. Using data from the 1946-51 cohort, Dr Geeske Peeters and colleagues (from the University of Queensland and the Utrecht University Medical Centre) found that women who accumulated moderate or high levels of physical activity were about 30% less likely to develop arthritis symptoms, than those who reported no physical activity. Relationships between physical activity and arthritis were stronger in 2001-2004, when the women were age 52-58, than in earlier surveys. One potential explanation for this differential effect is that the trophic effects of dynamic loading (from activity) on cartilage is particularly important for protecting against arthritis in post-menopausal women, who would have less protection from circulating levels of oestrogen than younger women (Peeters et al., 2015b).
49

5.6. Other factors associated with arthritis
Psychosocial factors
ALSWH data have been used to examine the relative importance of psychosocial factors as risk factors for arthritis for women from the ALSWH 1946-1951 cohort. In these analyses, stress has been found to be strongly associated with arthritis in both cross-sectional (Harris et al., 2012) and longitudinal analyses (Harris et al., 2013). The longitudinal nature of ALSWH data allowed the employment of sophisticated statistical techniques to examine the temporal (cause and effect) nature of the relationships between psychosocial factors and risk of arthritis. This study found that perceived stress was a strong risk factor for arthritis, and conferred a greater risk than that of obesity, which is a known modifiable risk factor. In particular, when the time-lag approach was applied, a dose-response was found; with women with moderate/high levels of stress experiencing a 2.4-fold increase in the odds of reporting arthritis three years later (i.e., at the next survey). Psychological factors such as perceived stress should be considered alongside other modifiable risk factors for arthritis in public health primary prevention approaches.
Depression also affected risk of arthritis onset, but anxiety did not. This result suggests that anxiety may be a consequence of arthritis, rather than a determinant.
50

5.7. Arthritis and health related quality of life
Figure 5-15 shows the changing physical function scores for women who ever reported arthritis (on any survey), compared to those who have never reported this condition.
EverNeverarthritis
45 48 51 54 57 60 63 66 69 72 75 78 81 84 87 90
Average age at survey
0
10
20
30
40
50
60
70
80
90
100
Mea
n PF
1946-51 cohort 1921-26 cohort
Figure 5-15: Physical function scores at each survey for women who have ever reported arthritis (on any survey), and women who have never reported arthritis, Surveys 1-7 (1946-51 cohort) and Surveys 1-6 (1921-26 cohort).
51

EverNeverarthritis
45 48 51 54 57 60 63 66 69 72 75 78 81 84 87 90
Average age at survey
0
10
20
30
40
50
60
70
80
90
100
Mea
n M
H1946-51 cohort 1921-26 cohort
Figure 5-16: Mental health scores at each survey for women have ever reported arthritis (on any survey), and women who have never reported arthritis, Surveys 1-7 (1946-51 cohort) and Surveys 1-6 (1921-26 cohort).
Women in both the 1946-51 and 1921-26 cohorts who reported arthritis at any time had significantly lower physical and mental well-being scores at every survey. The markedly lower physical health scores observed in women with arthritis are not surprising, as older women (aged 65 and over) with arthritis are known to experience significant functional limitations, which are greater than those seen in their male counterparts of the same age (Dunlop et al., 2005). The lower mental health scores in Figure 5-16 are also in line with other research which shows that women with arthritis are more at risk of depressive and anxiety symptoms than the general population (Eberhardt et al., 1993).
Using data from the 1921-1926 cohort, Parkinson et al. (Parkinson et al., 2010) have shown that arthritis has a significant impact on health-related quality of life over a nine year period. Women with prevalent (reported at Survey 2) or incident (reported after Survey 2) arthritis had lower scores on all the physical domains of the SF-36 than women without arthritis; in particular, physical functioning and pain levels for those with incident arthritis deteriorated over time, in line with those with prevalent arthritis. These older women however appeared
52

to be more resilient to the effects of arthritis on their mental health. Although lower scores were reported over time for existing and incident arthritis, mental health scores of women with incident arthritis were not significantly different from those in women without arthritis (Parkinson et al., 2010).
5.8. Use of health services by women who report arthritis
Figure 5-17 shows the mean number of general practice visits each year for women who have ever reported arthritis, and for those who have never reported arthritis. The data show consistently higher use of general practice services by women who ever reported arthritis.
EverNever
45 48 51 54 57 60 63 66 69 72 75 78 81 84 87 90
Average age
0
5
10
15
20
Mea
n Vi
sits
1946-51 cohort 1921-26 cohort
Figure 5-17: Number of general practice visits at each survey for women who have ever reported arthritis (on any survey), and women who have never reported arthritis, Surveys 1-7 (1946-51 cohort) and Surveys 1-6 (1921-26 cohort).
Consistent with the higher use of general practice services, costs for both MBS and PBS services are higher for women who had ever reported arthritis. MBS costs for women from the 1946-51 cohort with arthritis were almost 50% higher and PBS costs more than 60%
53

higher than for women who did not have arthritis. As would be expected, all women in the 1921-26 cohort used more MBS and PBS services than the younger cohort, but the cost discrepancy between women with and without arthritis remained apparent.
Moreover, there was a large variation in costs among older women with arthritis, with costs for women with arthritis who lived in an urban area being $975 higher on average per year (P < 0.001) compared to those who lived in a rural or remote area; women with DVA health insurance coverage incurred on average a $3,313 increase in the annual health care cost (P < 0.001) compared to those without this cover; women with private hospital insurance had $897 more in government subsidized health care (P < 0.001) than those without this cover; and women with arthritis who were single had $708 lower health care cost on average per year (P = 0.033) compared to those who were married or in a de facto relationship. Each additional comorbid condition in women with arthritis, increased costs by an average of $427 (P < 0.001), and each unit increase in the SF-36 PCS score (i.e., better physical health-related quality of life) decreased costs by $51 (P < 0.001)(Lo et al., 2015).
Table 5-3 Comparison of costs for MBS and PBS uptake in women who have never reported arthritis and those who have reported arthritis, mean cost ($) 2013 (the most recent year that data are available).
1973-78 cohort 1946-51 cohort 1921-26 cohort
MBS PBS MBS PBS MBS PBS
Never 1,422 553 2,586 1,308
Ever 2,080 916 2,883 1,548
Several detailed analyses are currently underway to assess the health care use by women with arthritis. These analyses look specifically at hip and knee replacement using linked data from the national joint replacement registries (Peeters et al., work in progress), the use of general practitioner and other health services in the periods before and after diagnosis of incident arthritis (Parkinson et al., work in progress), and the total Medicare and pharmaceutical costs for women with arthritis (Lo et al., 2015).
ALSWH data and linked PBS data provided a rare opportunity to examine individual consumer medicine use following the withdrawal of rofecoxib for the treatment of arthritis, and issuing of safety warnings on the COX-2 class of medicines. This study showed that women who had been consistent users of rofecoxib switched to another COX-2 medicine. This finding suggests that the issues leading to the discrediting of rofecoxib were not seen as
54

a COX-2 class effect by prescribers to this high use group of consumers (Parkinson et al., 2011).
Previous studies have suggested that statins may prevent development of osteoarthritis and have anti-inflammatory effects. Analysis of data for women in the 1946-51 cohort did not find any association between use of statins and new joint pain/stiffness. Pravastatin and atorvastatin were associated with poor physical functioning, and atorvastatin was also associated with poor self-rated health. However these associations were mostly explained by other factors (Peeters et al., 2015a).
5.9. Summary points
Arthritis is one of the most common conditions reported by women in ALSWH.
Arthritis is more common among women with greater difficulty managing on income.
Arthritis is strongly associated with higher Body Mass Index.
Arthritis is strongly associated with lower levels of Physical Activity.
Stress and depression may play a role in development of arthritis.
Anxiety is associated with arthritis.
Women with arthritis have worse physical function and mental health scores.
Women with arthritis have greater use of general practice services than women without arthritis.
MBS costs for women from the 1946-51 cohort with arthritis were almost 50% higher and PBS costs more than 60% higher than for women who did not have arthritis. As would be expected, all women in the 1921-26 cohort used more MBS and PBS services than the younger cohort, but the cost discrepancy between women with and without arthritis remained apparent.
55

6. Asthma
Asthma is a chronic inflammatory condition of the airways which is associated with episodes of wheezing, breathlessness and tightness in the chest due to narrowing of the airways and excess mucous production. The causes of asthma are not well understood, although genetic predisposition as well as environmental and lifestyle factors may play a role. Asthma can be triggered by viral infections, exposure to allergens and tobacco smoke or other air pollutants, exercise, and some chemicals or additives in foods. The impact of asthma can vary from mild symptoms, which cause few problems, to severe and persistent wheezing and shortness of breath, which may be life threatening.
Australia has a particularly high prevalence of asthma, with 19% of adults reporting they have ever had asthma, and around 10% had current asthma (AIHW, 2011). Asthma rates have been increasing over time, and asthma has been identified as a national health priority. The lifetime prevalence of asthma in adults is higher among women than men, particularly after 75 years of age, and women have a higher risk of asthma-related death (Gibson et al., 2010).
The prevalence of asthma also varies with age. Asthma and related symptoms such as wheeze are very common among children aged less than three years, with 17% of children in the Longitudinal Study of Australian Children experiencing asthma or wheeze by age three. By age 4-5 years 24% of the children had asthma or wheeze at some time. However many people who had asthma at this early age will not have asthma later in life, although more severe childhood asthma is likely to persist into adulthood. Adults with asthma can also experience remission of their condition, with ten year remission rates of up to 20% (Holm et al., 2007).
In the Australian Health Study 2011-12, 11.5% of women aged 45-54 reported asthma. Asthma was also reported by around 12% of women in the 55-64 age group, and around 13% of women aged 65 years and older (Australian Health Survey, 2012a).
6.1. Women and asthma
The higher prevalence of asthma in women may occur as a consequence of sex-based biological differences, including different pulmonary development in utero and in childhood, differences in adult lung function, and differences in immuno-responsiveness. Reproductive factors such as menarche, pregnancy, use of hormonal contraceptives, use of hormonal
56

therapy, and the menopause have been shown to play a role (Macsali et al., 2009, Macsali et al., 2011, Barr et al., 2004). Obesity has also been identified as a risk factor for asthma (Von Behren et al., 2009). The higher prevalence among women may also be due to different levels of exposure to allergens and other triggers associated with gender-roles (Postma, 2007).
6.2. Ascertainment of asthma in ALSWH
Clinically, a diagnosis of asthma is based on a combination of symptoms, variable airway obstruction, airway inflammation and airway hyper-responsiveness. The most reliable objective measure of lung function is spirometry, which establishes the presence and reversibility of airflow obstruction. However this investigation is not often used in primary care, so a diagnosis of asthma is often made on the basis of typical symptoms only. These symptoms may vary over time and may overlap with a number of other respiratory and non-respiratory conditions, so a definitive diagnosis in primary care may be difficult (Pekkanen et al., 2005). The diagnosis is particularly difficult among older people with airways disease who may be diagnosed with Chronic Obstructive Lung Disease (COPD) as well as or instead of asthma (Yates, 2005, de Marco et al., 2013).
Although there is currently no standard definition for asthma for use in epidemiological studies, the most commonly used methods for identifying asthma in population studies is to ask participants whether they have ever been diagnosed by a doctor with asthma, whether they still have asthma, whether they have had wheeze in the past 12 months, and whether they are currently on asthma treatment. The exact questions and combinations used to define asthma vary across studies (Sa-Sousa et al., 2014).
In ALSWH, prevalent asthma was ascertained from the question in Survey 1:
“Have you ever been told by a doctor that you have asthma?”
And new cases of asthma were ascertained at each subsequent survey:
“In the last three years have you been diagnosed or treated for asthma?”
57

6.3. Prevalence of asthma
Figure 6-18 shows the cumulative prevalence of ever reporting asthma across the four ALSWH cohorts. Asthma prevalence was highest in the younger two cohorts with around one in four women aged 18-23 years reporting they had ever been diagnosed with asthma in both the 1973-78 and 1989-95 cohorts. Prevalence is lowest among women in the oldest cohort, with around one in ten women aged 70-75 (12%) reporting ever being diagnosed with asthma.
Over time, the prevalence of asthma increases within each cohort as additional women report that they have been diagnosed or treated for asthma on each subsequent survey.
20 20 24 27 30 33 36 47 49 52 55 58 61 64 72 75 78 81 84 87
Average age at survey
0
5
10
15
20
25
30
35
% d
iag
or tr
eat f
or a
sthm
a
1989-95 cohort 1973-78 cohort 1946-51 cohort 1921-26 cohort
Figure 6-18: Prevalence of asthma at each survey among women in the 1973-78, 1946-51 and 1921-26 cohorts.
58
6.4. Incidence of asthma
Figure 6-19 shows prevalent cases of asthma at Survey 1 for each cohort, and the number of women who report asthma for the first time on each subsequent survey (incident cases). The figure shows a large number of incident cases between Survey 1 and Survey 2 for women in the 1973-78 cohort as these women aged from 18-23 years to 22-27 years.
0 10 20 30 40
Percent
1921-26
1946-51
1973-78
Coho
rt
S7 IncidentS6 IncidentS5 IncidentS4 IncidentS3 IncidentS2 IncidentS1 Prevalent
Survey
Figure 6-19: Prevalent and incident cases of asthma, Surveys 1-6 (1973-78 cohort), Surveys 1-7 (1946-51 cohort) and Surveys 1-6 (1921-26 cohort).
59

6.5. Factors associated with asthma
6.5.1. Area of residence
S7 IncidentS6 IncidentS5 IncidentS4 IncidentS3 IncidentS2 IncidentS1 Preva lent
Survey
RA a
t S1
1921-26
1946-51
1973-78
0 10 20 30 40
Percent
Remote/Very Remote
Outer Regi onal
Inner Regional
Ma jor Cities
Remote/Very Remote
Outer Regi onal
Inner Regional
Ma jor Cities
Remote/Very Remote
Outer Regi onal
Inner Regional
Ma jor Cities
Figure 6-20: Prevalent and incident cases of asthma, Surveys 1-6 (1973-78 cohort), Surveys 1-7 (1946-51 cohort) and Surveys 1-6 (1921-26 cohort), according to area of residence at Survey 1.
Figure 6-20 shows the difference in self-reported asthma ever (at Survey 1) and new reports of asthma diagnosis or treatment on each subsequent survey among women according to their area of residence at Survey 1. There is no clear evidence of an association between
60
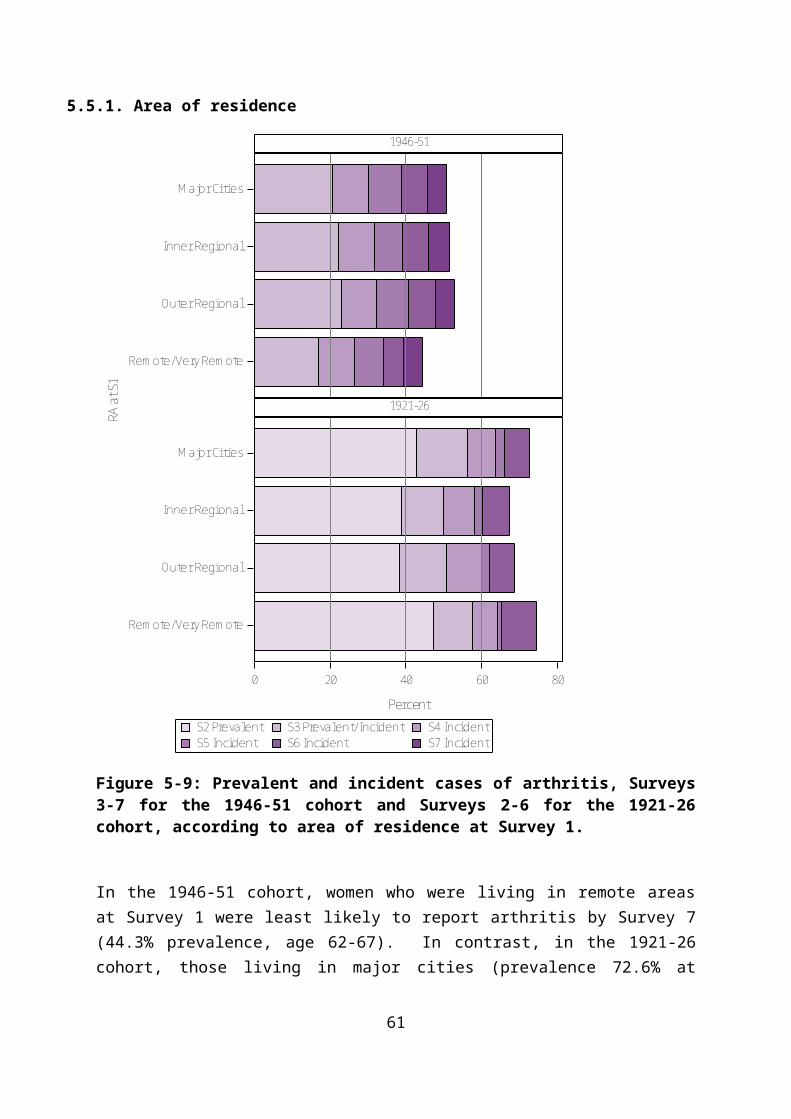
asthma and area of residence, except for a particularly high prevalence of asthma among the small number of women in the 1921-26 cohort who were living in remote areas.
6.5.2. Highest educational qualification
S7 IncidentS6 IncidentS5 Inci dentS4 IncidentS3 IncidentS2 IncidentS1 Prevalent
Survey
Educ
ation
at S
1
1921-26
1946-51
1973-78
0 10 20 30 40
Percent
Les s than Year 12
Year 12
Certifi cate/Diploma
Univers i ty
Les s than Year 12
Year 12
Certifi cate/Diploma
Univers i ty
Les s than Year 12
Year 12
Certifi cate/Diploma
Univers i ty
Figure 6-21: Prevalent and incident cases of asthma, Surveys 1-6 (1973-78 cohort), Surveys 1-7 (1946-51 cohort) and Surveys 1-6 (1921-26 cohort), according to highest educational qualification.
Figure 6-21 shows the difference in self-reported asthma ever (at Survey 1) and new reports of asthma diagnosis or treatment on each subsequent survey among women with different levels of education. There is no consistent association between the prevalence of asthma and education level among women in the 1946-51 and 1921-26 cohorts. For women in the
61

1973-78 cohort, those with university level education had the lowest prevalence asthma.
6.5.3. Difficulty managing on income
S7 IncidentS6 IncidentS5 IncidentS4 IncidentS3 IncidentS2 IncidentS1 Prevalent
Survey
Man
age
on in
com
e at
S1
1921-26
1946-51
1973-78
0 10 20 30 40
Percent
Imposs ible
Diffi cul t a lways
Diffi cul t s ometimes
Not too bad
It is easy
Imposs ible
Diffi cul t a lways
Diffi cul t s ometimes
Not too bad
It is easy
Imposs ible
Diffi cul t a lways
Diffi cul t s ometimes
Not too bad
It is easy
Figure 6-22: Prevalent and incident cases of asthma, Surveys 1-6 (1973-78 cohort), Surveys 1-7 (1946-51 cohort) and Surveys 1-6 (1921-26 cohort, according to difficulty managing on income.
Figure 6-22 shows the difference in self-reported asthma ever (at Survey 1) and new reports of asthma diagnosis or treatment on each subsequent survey among women with different degrees of difficulty managing on their income. There is a clear trend towards higher asthma prevalence and incidence among women with more difficulty managing on income for the 1973-78 and 1946-51 cohorts. This trend may reflect both the higher risk of asthma among economically disadvantaged women as well as the impact of asthma on women’s workforce participation and earning capacity. Preliminary results of a detailed analysis of
62
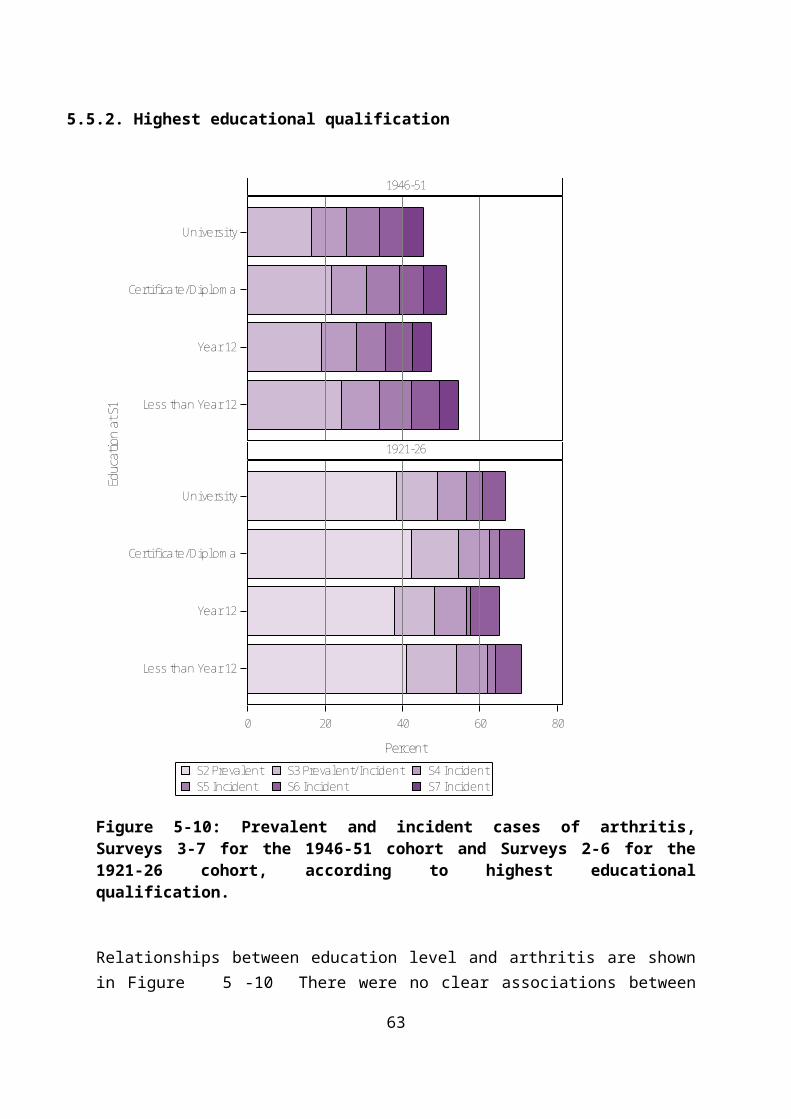
the impact of asthma on mid-age women’s workforce participation over the period of the study shows that asthma is associated with being not in paid work or with leaving the workforce early (Majeed et al., 2015).
6.5.1. Body Mass Index
S7 IncidentS6 IncidentS5 IncidentS4 IncidentS3 IncidentS2 IncidentS1 Preva lent
Survey
BMI a
t S1
1921-26
1946-51
1973-78
0 10 20 30 40
Percent
Obese
Overweight
Hea lthy weight
Underweight
Obese
Overweight
Hea lthy weight
Underweight
Obese
Overweight
Hea lthy weight
Underweight
Figure 6-23: Prevalent and incident cases of asthma, Surveys 1-6 (1973-78 cohort), Surveys 1-7 (1946-51 cohort) and Surveys 1-6 (1921-26 cohort), according to BMI category.
Obesity has been shown to be a risk factor for asthma (Von Behren et al., 2009). There is a clear trend towards higher asthma prevalence and incidence among women who were
63

overweight or obese. The systemic inflammatory effect and the mechanical effect of obesity may explain this well-established relationship (Dixon et al., 2010).
6.5.2. Smoking
Smoking is an important trigger for asthma and increases asthma mortality (Craig et al., 2008). Smoking is also a major risk factor for COPD. However, many adults with asthma will continue to smoke despite the effects on their respiratory condition. Figure 6-24 shows higher rates of asthma among both ex-smokers and current smokers in all cohorts. It also illustrates the higher prevalence and incidence of asthma among current smokers in the 1946-51 and 1921-26 cohort, and highlights an opportunity to improve quality of life and reduce mortality risk among women with asthma. The higher baseline prevalence in ex-smokers may indicate that women quit smoking as their respiratory symptoms developed.
Figure 6-24: Prevalent and incident cases of asthma, Surveys 1-6 (1973-78 cohort), Surveys 1-7 (1946-51 cohort) and Surveys 1-6 (1921-26 cohort), according to smoking status at Survey 1.
64
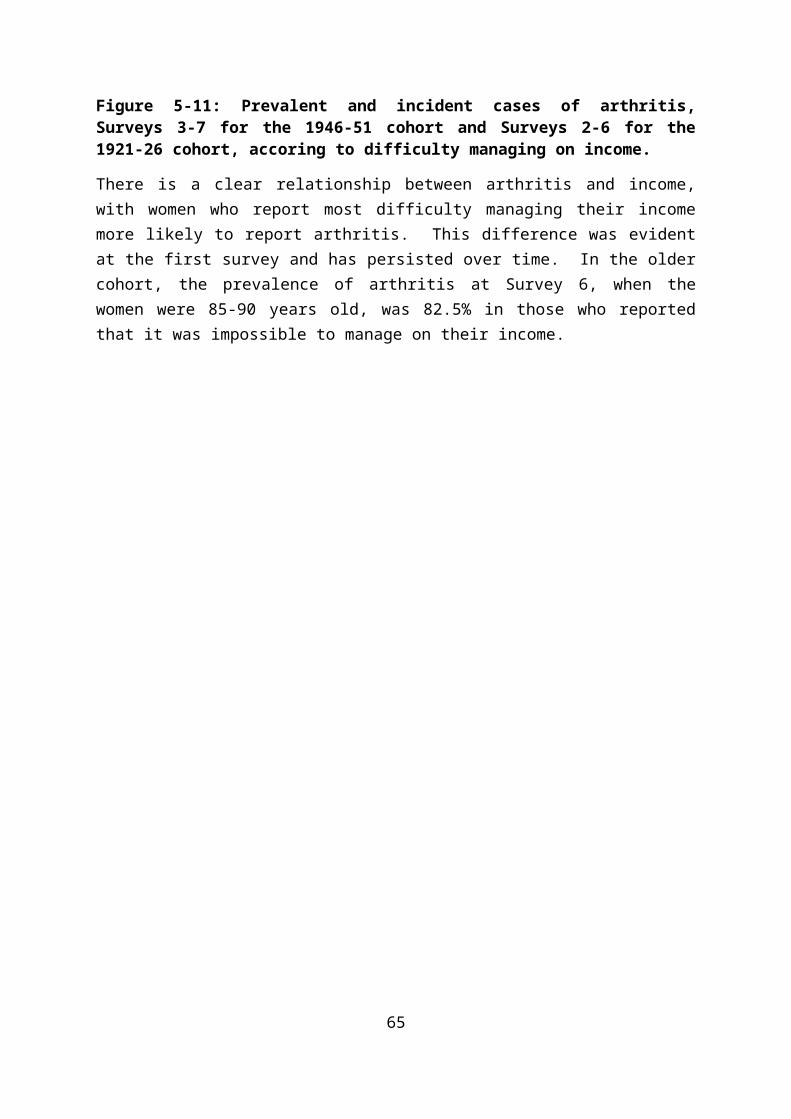
6.5.3. Physical activity
S7 IncidentS6 IncidentS5 IncidentS4 IncidentS3 IncidentS2 IncidentS1 Preva lent
Survey
Phys
ical
acti
vity
at S
2
1921-26
1946-51
1973-78
0 10 20 30 40
Percent
Inactive
Low
Moderate
High
Inactive
Low
Moderate
High
Inactive
Low
Moderate
High
Figure 6-25: Prevalent and incident cases of asthma, Surveys 1-6 (1973-78 cohort), Surveys 1-7 (1946-51 cohort) and Surveys 1-6 (1921-26 cohort), according to level of physical activity.
Figure 6-25 shows the difference in prevalent and incident asthma according to level of physical activity. There is no consistent association between asthma and physical activity across the cohorts. Episodes of asthma can be triggered by exercise, and this may inhibit some women from participating in physical activity or limit their exercise capacity. However these potential effects of asthma on physical activity are not strongly evident among women in ALSWH.
65

6.5.4. Comorbid conditions
Research using ALSWH data has shown that asthma and respiratory symptoms are associated with increased risk of back pain (Smith et al., 2006). A physiological explanation for this association may include changes to spinal control among women with breathing difficulty. Longitudinal analysis also shows that women who developed breathing problems over the course of the study were more likely to develop back pain than women without such problems (Smith et al., 2009). These studies highlight how the effects of asthma are not limited to one body system and how they can have wide ranging effects on quality of life.
6.6. Asthma and health-related quality of life
Asthma can contribute to poorer health-related quality of life across the life course. Figure6-26 shows the changing physical function scores for women who ever reported asthma (on any survey), compared to those who have never reported this condition. Physical function scores are lower for women with asthma, with the largest differences apparent among the 1946-51 and 1921-26 cohorts.
EverNeverasthma
18 21 24 27 30 33 36 39 42 45 48 51 54 57 60 63 66 69 72 75 78 81 84 87 90
Average age at survey
0
10
20
30
40
50
60
70
80
90
100
Mea
n PF
1973-78 cohort 1946-51 cohort 1921-26 cohort
Figure 6-26: Mean physical function scores at each survey for women who have ever reported asthma (on any survey), and women who have never reported asthma, Surveys 1-6 (1973-78 cohort), Surveys 1-7 (1946-51 cohort) and Surveys 1-6 (1921-26 cohort).
66

EverNeverasthma
18 21 24 27 30 33 36 39 42 45 48 51 54 57 60 63 66 69 72 75 78 81 84 87 90
Average age at survey
0
10
20
30
40
50
60
70
80
90
100
Mea
n M
H1973-78 cohort 1946-51 cohort 1921-26 cohort
Figure 6-27: Mean mental health scores at each survey for women who have ever reported asthma (on any survey), and women who have never reported asthma, Surveys 1-6 (1973-78 cohort), Surveys 1-7 (1946-51 cohort) and Surveys 1-6 (1921-26 cohort).
Figure 6-27 shows changes in scores on the mental health sub-scale of the SF-36. While women with asthma do have lower mental health scores than those without, across all cohorts and most surveys, the differences are not as large as seen for physical function.
67
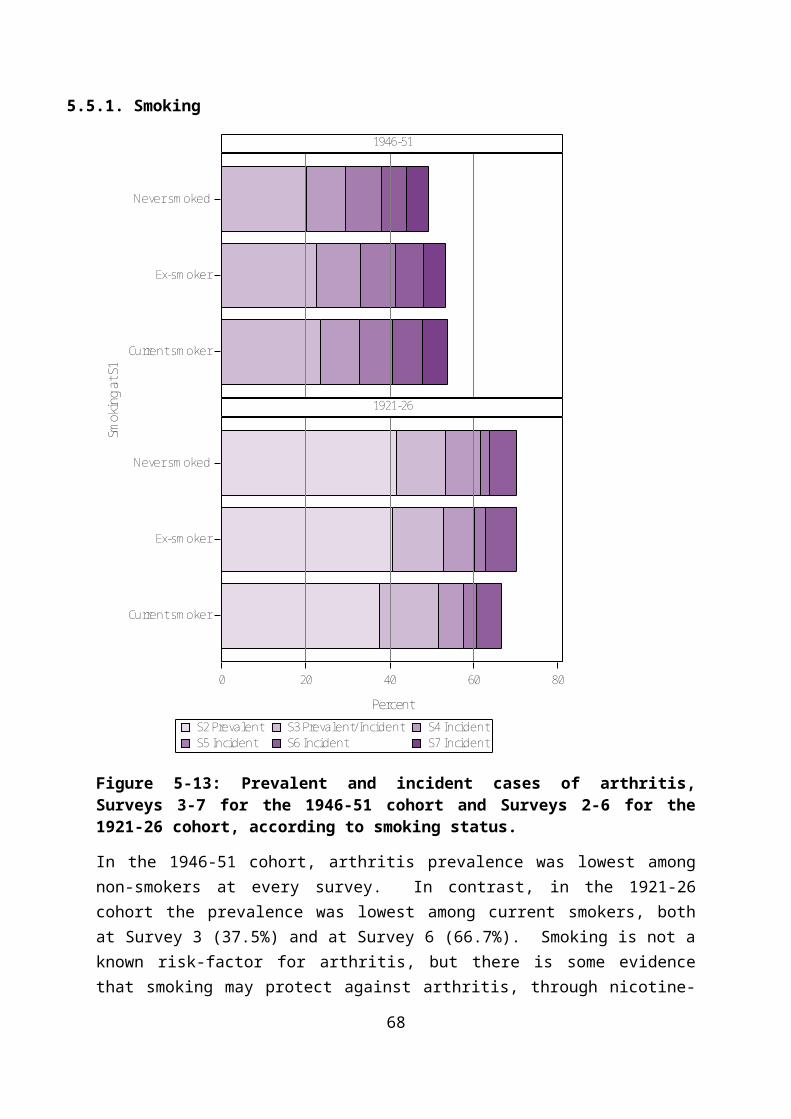
6.7. Use of health services by women who report asthma
The number of Medicare claims for general practice consultations increases with age and across cohorts and is higher among women reporting asthma, particularly at older ages (see Figure 6-28).
EverNever
18 21 24 27 30 33 36 39 42 45 48 51 54 57 60 63 66 69 72 75 78 81 84 87 90
Average age
0
5
10
15
20
Mea
n Vi
sits
1973-78 cohort 1946-51 cohort 1921-26 cohort
Figure 6-28: Mean number of general practice visits each year for women who have ever reported asthma (on any survey) and women who have never reported asthma, Surveys 1-6 (1973-78 cohort), Surveys 1-7 (1946-51 cohort) and Surveys 1-6 (1921-26 cohort).
As would be expected, the costs for both MBS and PBS services for women with asthma across all three cohorts are higher than for women without asthma. Using the most recent data (2013), in the 1973-78 cohort, women with asthma cost an average of $191 (13%) more on MBS, and $125 (55%) more on PBS, than women without asthma. A similar pattern occurs in the 1946-51 and 1921-26 cohorts – with costs of $375 (22%) more on MBS and $356 (54%) on PBS and $423 on MBS (15%) and $390 (27%) on PBS respectively.
68

Table 6-4 Comparison of costs for MBS and PBS uptake in women who have never reported asthma and those who have reported asthma, mean cost ($) 2013 (the most recent year that data are available).
1973-78 cohort 1946-51 cohort 1921-26 cohort
MBS PBS MBS PBS MBS PBS
Never 1,498 227 1,679 664 2,740 1,431
Ever 1,689 352 2,054 1,020 3,163 1,821
Women with asthma are also like to have higher use of complementary and alternative medicines (CAM). Among women in the 1973-78 cohort, around 19% of women with asthma had used some form of CAM at Survey 2, increasing to 36% at Survey 4. Women were more likely to use CAM the longer they had asthma. Use of naturopathy/herbalists was more common among women with asthma than those without asthma (Sibbritt et al., 2011).
6.8. Impact of asthma on survival
ALSWH has been used to assess differences in survival for women in the 1921-26 cohort who reported they had a recent diagnosis or treatment for asthma and those without this condition. Over twelve years of follow-up women with asthma were around 20% more likely to die than women without asthma, even after comorbidities and other risk factors were taken into account (Eftekhari et al., Under review). This finding is consistent with recent evidence that mortality from asthma has not declined among older people, whereas improvements in quality of care have resulted in significant mortality reductions in younger populations (Tsai et al., 2013). The findings highlight the need to consider opportunities to improve quality of life and survival outcomes for older women with asthma.
69

6.9. Summary points
Asthma prevalence is higher in the younger cohorts, and increases with age in all cohorts.
Asthma is associated with difficulty managing on income, and may affect workforce participation.
Many women with asthma continue to smoke.
Asthma is more common among overweight and obese women.
Asthma has a significant impact on survival among older women, particularly in association with comorbidity.
Using the most recent data (2013), in the 1973-78 cohort, women with asthma cost an average of $191 (13%) more on MBS and $125 (55%) more on PBS than women without asthma. A similar pattern occurs in the 1946-51 and 1921-26 cohorts - $375 (22%) more on MBS and $356 (54%) on PBS and $423 on MBS (15%) and $390 (27%) on PBS respectively.
70

7. Breast cancer Breast cancer is the most commonly diagnosed cancer in women, accounting for 28% of all female cancers in 2008 (AIHW, 2012a). Breast cancer occurs when abnormal cells in the breast multiply and form an invasive tumour. Such tumours can invade surrounding tissue and spread to other parts of the body through the lymphatic or vascular systems. Without appropriate treatment, these tumours can result in death. Not all breast cancers are malignant however; some are benign while others are in-situ lesions contained in the milk ducts (ductal carcinoma in situ). These in-situ lesions are not invasive and nearly all can be cured. However, some researchers and clinicians regard their presence as being associated with an increased risk of the subsequent development of an invasive breast cancer.
Breast cancer is a survivable disease: between 2006 and 2010, the one year survival for Australian women with breast cancer was 98%. Five and ten year survival was somewhat lower at 89% and 83% respectively. Survival rates differ by age, with ten year survival highest in those aged 40-49 through to 60-69 at diagnosis, with significantly lower survival estimates for those under 40 and over 70 (AIHW, 2012a). These discrepant survival rates may relate to more aggressive cancers diagnosed in younger women and older women being offered less aggressive treatments and having more comorbid conditions.
The risk factors for breast cancer include a family history of breast cancer, a high degree of breast density, early menarche, late menopause, use of the oral contraceptive pill or combined hormone replacement therapy, no history of having children or having a first birth at a late age, as well as lifestyle factors including increasing age, higher socioeconomic status, taller height, overweight or obesity, low physical activity and alcohol consumption (AIHW, 2012a).
7.1. Ascertainment of breast cancer in ALSWH
In Australia, detection and diagnosis of breast cancer usually involves a number of procedures, such as physical examinations, mammograms, ultrasounds and biopsies. In 1991, BreastScreen Australia, was established to provide cost-free mammography and diagnostic services for Australian women aged 40 years and older. The recommended guideline for screening is every two years for women aged 50 years and older, in order to detect cancer before the symptoms are present.
At diagnosis, the stage of cancer is determined. Staging is carried out by following the TNM (tumour, nodes, metastasis) Classification of Malignant Tumours, which is the gold standard cancer classification tool and takes into consideration the size and spread of tumour. Stages are rated from 0 to IV, with the higher stages being indicative of more severe cancer.
71
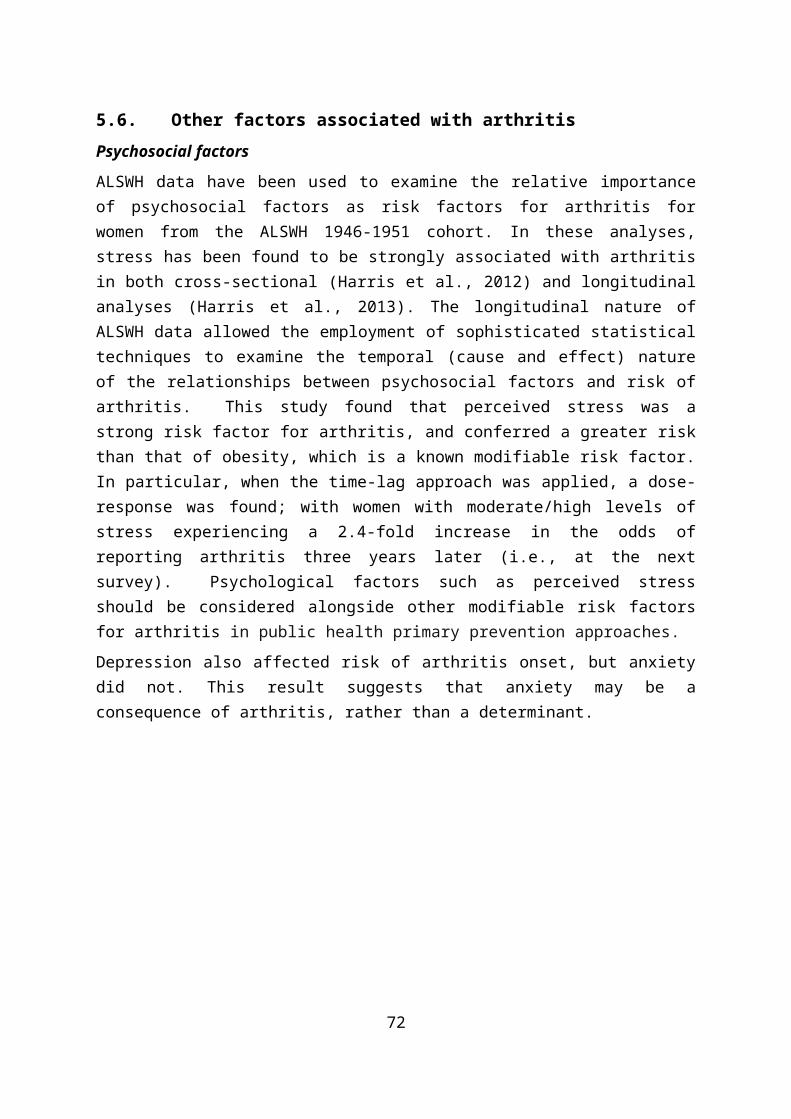
In ALSWH questions about breast cancer have been asked of the 1946-51 cohort (all surveys) and the 1921-26 cohort (Surveys 1 and 2 only).
Prevalent breast cancer was ascertained from the question in Survey 1:
“Have you ever been told by a doctor that you have breast cancer?”
New cases of breast cancer were ascertained at each subsequent survey:
“In the last three years have you been diagnosed or treated for breast cancer?”
Using linked cancer registry data, ALSWH researchers have investigated the validity of self-reported breast cancer among women of the 1921-26 cohort who were residing in NSW: overall, at baseline (prevalent cases) and at follow-up (incident cases) (Stavrou et al., 2011). Their results demonstrated high sensitivity and specificity of self-reported prevalent and incident breast cancer (sensitivity 93% and 83%, respectively; specificity 98% and 99%) indicating good concurrent validity of self-reported cancers when compare against objective data drawn from the Cancer Registry.
72
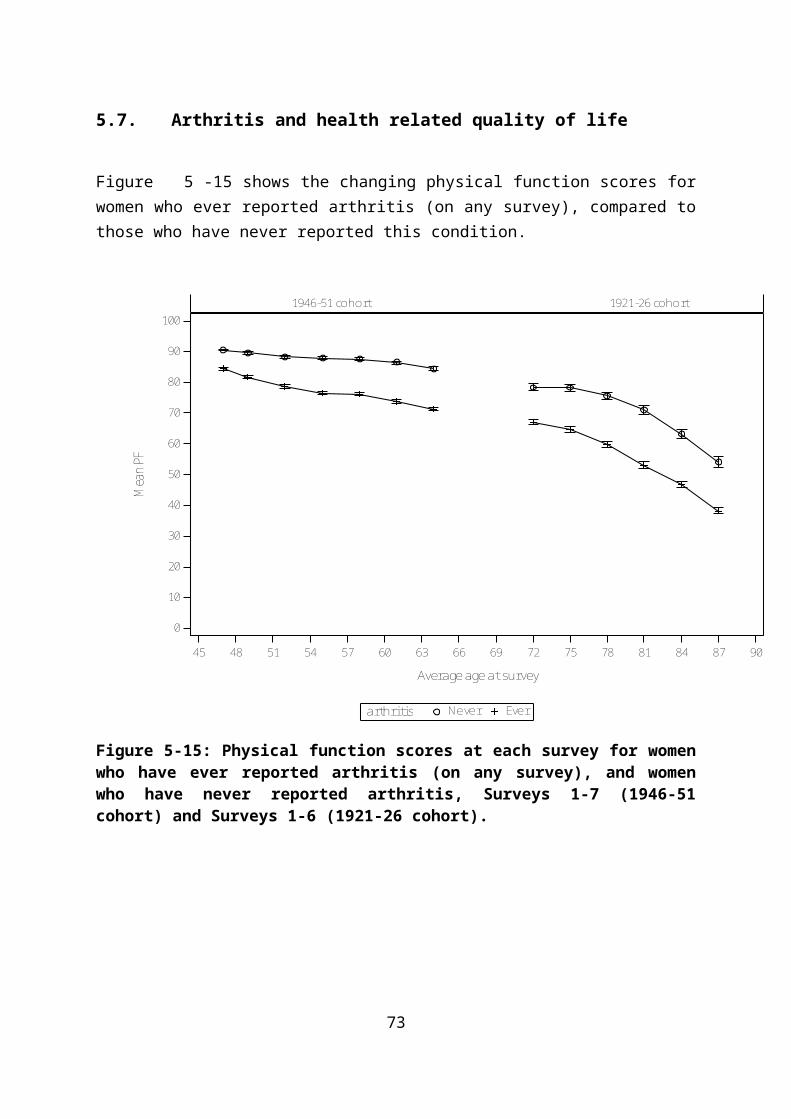
7.2. Prevalence of breast cancer
45 48 51 54 57 60 63 66 69 72 75 78 81 84 87 90
Average age at survey
0
5
10
% d
iag
or tr
eat f
or b
reas
t ca
1946-51 cohort 1921-26 cohort
Figure 7-29: Prevalence of breast cancer at each survey (1 to 7) in the 1946-51 cohort and at Surveys 1 and 2 in the 1921-26 cohort.
illustrates the cumulative prevalence of breast cancer among the 1946-51 cohort and over Surveys 1 and 2 of the 1921-26 cohort. The most common age for diagnosis of breast cancer is between 40 and 69 when more than 69% of breast cancers are diagnosed (AIHW, 2012a).
73
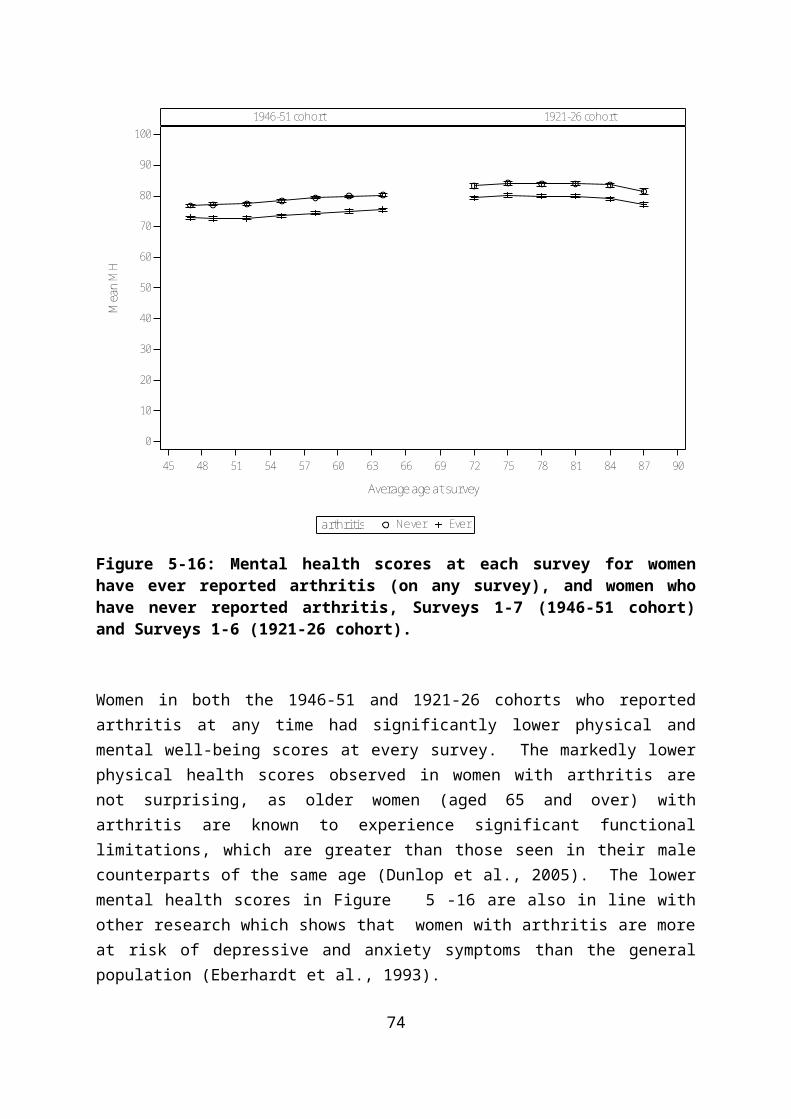
0 2 4 6 8 10
Percent
1946-51
Coho
rt
S7 IncidentS6 IncidentS5 IncidentS4 IncidentS3 IncidentS2 IncidentS1 Prevalent
survey
Figure 7-30: Prevalent and incident cases of breast cancer, Surveys 1–7, in the 1946-51 cohort.
Although it is the most commonly diagnosed cancer, breast cancer is a relatively uncommon condition in young women with the risk of a breast cancer diagnosis increasing with age. At Survey 1, fewer than 2% of the women in the 1946-51 cohort (then aged 45 to 50) reported a diagnosis of breast cancer. Between Surveys 2 to 4, the incidence of breast cancer was steady at around 0.6%, increasing at Survey 5 to about 1.2%, at Survey 6 to 1.3% and at Survey 7, incidence was about 1.2%. By Survey 7, about 7.4% of the women (then aged 62-67) had reported a diagnosis of breast cancer.
74

7.3. Factors associated with breast cancer
7.3.1. Area of residence
S7 IncidentS6 IncidentS5 IncidentS4 IncidentS3 IncidentS2 IncidentS1 Prevalentsurvey
1946-51
0 2 4 6 8 10
Percent
Remote/Very Remote
Outer Regional
Inner Regional
Major Cities
RA a
t S1
Figure 7-31: Prevalent and incident cases of breast cancer in the 1946-51 cohort, Surveys 1-7, according to area of residence.
Women living in major cities and inner or outer regional areas of Australia had similar prevalence and incidence of breast cancer. However, those living in remote areas were more likely to report breast cancer, particularly at Survey 5, when the women were 56-61.
Programs which provide no-cost mammograms to women involve substantial government investment (e.g., BreastScreen Australia). ALSWH data for the 1946-51 cohort have been analysed to describe longitudinal patterns of mammogram service use, clinical breast examination (CBE) and breast self-examination (BSE) from Survey 3 (2001) to Survey 6
75

(2010) (Leung et al., 2014). Most of the women had a mammogram in the past 2 years, in accordance with current recommendations. Women living in rural areas had similar screening rates to their urban counterparts. However, women living in rural areas were less likely to have clinical breast examination and more likely to conduct breast self-examination. All patterns of screening behaviour were generally consistent over time. The poorer survival from breast cancer that has been observed among rural women is therefore unlikely to be explained by differences in access to mammograms.
7.3.2. Highest educational qualification
S7 IncidentS6 IncidentS5 IncidentS4 IncidentS3 IncidentS2 IncidentS1 Prevalentsurvey
1946-51
0 2 4 6 8 10
Percent
Les s than Year 12
Year 12
Certifi cate/Diploma
Univers i ty
Educ
ation
at S
1
Figure 7-32: Prevalent and incident cases of breast cancer in the 1946-51 cohort, Surveys 1-7, according to highest educational qualification.
At Survey 1, women with a university education had the lowest prevalence of breast cancer (1.6%), followed by those with less than Year 12 education (1.7%), those who had achieved
76

Year 12 (1.9%) and women with a certificate or diploma had the highest prevalence (2.1%). Across Surveys 2 to 7, the incidence of breast cancer was highest in women with a Year 12 education, followed by those who had less than Year 12, and women with a certificate or diploma. The lowest incidence over Surveys 2 to 7 was among women with a university education. Over all the surveys (1 to 7), the highest prevalence was among women who had a Year 12 education (7.8%).
7.3.3. Difficulty managing on income
S7 IncidentS6 IncidentS5 IncidentS4 IncidentS3 IncidentS2 IncidentS1 Prevalentsurvey
1946-51
0.0 2.5 5.0 7.5 10.0 12.5 15.0
Percent
Impos s ible
Diffi cult a lways
Diffi cult s ometimes
Not too bad
It i s easy
Man
age
on in
com
e at
S1
Figure 7-33: Prevalent and incident cases of breast cancer in the 1946-51 cohort, Surveys 1-7, according to difficulty managing on income.
Women who found it “difficult always” to manage on their income had the highest prevalence of breast cancer at Survey 1. The effect of income was not consistent across all
77

surveys, however women who reported that they found it “impossible” to manage on their income had the highest incidence at Survey 5 (3.1%) and Survey 7 (2.5%). Among the other income categories, incidence remained fairly steady at <1.0% until Survey 5, when the women were 56 to 61, at which time incidence began to increase, reflecting the greater overall risk of a breast cancer diagnosis associated with increasing age.
7.3.1. Body Mass Index
Figure 7-34: Prevalent and incident cases of breast cancer in the 1946-51 cohort, Surveys 1-7, according to BMI category.
78

Figure 7-34 shows a higher incidence and prevalence of breast cancer up to Survey 6 among women who were underweight at Survey 1, but with higher incidence among overweight and obese women at Survey 7. This finding is consistent with many other studies which show that obesity reduces the risk of pre-menopausal breast cancer and increases the risk of postmenopausal breast cancer (Anderson and Neuhouser, 2012).
7.3.2. Smoking
S7 IncidentS6 IncidentS5 IncidentS4 IncidentS3 IncidentS2 IncidentS1 Prevalentsurvey
1946-51
0 2 4 6 8 10
Percent
Current s moker
Ex-smoker
Never smoked
Smok
ing
at S
1
Figure 7-35: Prevalent and incident cases of breast cancer in the 1946-51 cohort, Surveys 1-7, according to smoking status.
Women who were current smokers reported a higher prevalence of breast cancer at Survey 1 (2%) than ex-smokers (1.8%) and never smokers (1.7%). Incidence of breast cancer among ex-smokers and those women who had never smoked was fairly similar across Surveys 2 to
79

7. Among women who currently smoked, incidence between Surveys 2 to 4 remained stable at about 0.6% but then increased at Survey 5 (1.2%) and Survey 6 (1.7%) but dropped again to 1% at Survey 7. By Survey 7, the overall prevalence of breast cancer among women who were current smokers was 7.8%, compared with ex-smokers and never smokers (7.2%).
7.3.3. Physical activity
S7 IncidentS6 IncidentS5 IncidentS4 IncidentS3 IncidentS2 IncidentS1 Prevalentsurvey
1946-51
0 2 4 6 8 10
Percent
Inactive
Low
Moderate
High
Phys
ical
acti
vity
at S
2
Figure 7-36: Prevalent and incident cases of breast cancer in the 1946-51 cohort, Surveys 1-7, according to level of physical activity.
There is no consistent relationship between physical activity and breast cancer (Figure 7-36).
80

7.3.4. Other factors associated with breast cancer
Recently, two case-control studies showed that vasomotor menopausal symptoms (VMS), that is, hot flushes (HF) and night sweats (NS), were associated with a decreased risk of breast cancer. However, no prior studies have prospectively examined the association between VMS and breast cancer incidence. Data from Surveys 2 (1998) to 6 (2010) for the 1946-51 cohort have been analysed to test the association between VMS and breast cancer incidence (ascertained from cancer registries). In these analyses, VMS were not associated with breast cancer risk (van den Berg et al., 2014). However, research in this area is scarce and additional large prospective population-based studies are required to confirm or refute these findings.
7.4. Health-related quality of life in women with breast cancer
EverNeverbreast cancer
45 48 51 54 57 60 63 66
Average age at survey
0
10
20
30
40
50
60
70
80
90
100
Mea
n PF
1946-51 cohort
Figure 7-37: Mean physical function scores at each survey for women who have ever reported breast cancer (on any survey), and women who have never reported breast cancer, Surveys 1-7 (1946-51 cohort).
81
There were small differences in physical function scores (Figure 7-37) and mental health scores (Figure 7-38) for women who ever reported breast cancer and those who have never reported breast cancer.
EverNeverbreast cancer
45 48 51 54 57 60 63 66
Average age at survey
0
10
20
30
40
50
60
70
80
90
100
Mea
n M
H
1946-51 cohort
Figure 7-38: Mean mental health scores at each survey for women who have ever reported breast cancer (on any survey), and women who have never reported breast cancer, Surveys 1-7 (1946-51 cohort).
(Leung et al., 2014) examined longitudinal relationships among breast cancer diagnosis, social support and health-related quality of life. Baseline breast cancer diagnosis was defined as a new diagnosis of breast cancer between 1998 (Survey 2) and 2007 (Survey 5). Pre-diagnosis data were drawn from the survey immediately preceding the report of the cancer diagnosis (baseline) and follow-up data were drawn from the survey immediately after. The final sample included 412 incident cases of breast cancer with valid data pre and post baseline data. Compared with pre-diagnosis quality of life scores, women reporting a new diagnosis of breast cancer had significantly poorer SF-36 sub-scale scores for pain, physical functioning and health and vitality at baseline. At three-year follow up, health-related quality of life had improved in most domains to levels consistent with pre-diagnosis. Levels of social support remained stable over time and were positively predictive of better
82

physical and mental health-related quality of life at three-year follow-up. These longitudinal analyses indicate that social support is an important predictor of health-related quality of life in women diagnosed with breast cancer. In particular, positive emotional and informational support that may normally be provided by a partner is important in maintaining health-related quality of life.
An exploration of the impact of life events on quality of life following a diagnosis of breast cancer considered the possible mediation effect of perceived stress (Beatty et al., 2009). This analysis used three waves of data (Surveys 1, 2 and 3) and applied the bio-behavioural model of cancer stress and disease course to assess the predictive relationship between two traditional measures of stress - stressful life events and perceived stress – before the onset of breast cancer on subsequent health-related quality of life. The results of this analysis indicated that as the number of life events before breast cancer increased, women were significantly more likely to experience corresponding increases in perceived stress over the three surveys and to experience deteriorations in several domains of health-related quality of life. As the level of perceived stress before breast cancer increased, women were more likely to experience deteriorations in a number of domains of health-related quality of life over time. Moreover, perceived stress fully mediated the relationship between life events and scores on the emotional and social functioning sub-scales of the SF-36 health-related quality of life measure.
83

7.5. Use of health services by women who report breast cancer
EverNever
45 48 51 54 57 60 63 66
Average age
0
5
10
15
20
Mea
n Vi
sits
1946-51 cohort
Figure 7-39: Mean number of general practice visits each year for women who have ever reported breast cancer (on any survey) and women who have never reported breast cancer, Surveys 1-7 (1946-51 cohort).
As shown in Figure 7-39 there are small differences in the number of claims for general practice services for women with and without a diagnosis of breast cancer. In 2013, women who had ever reported a breast cancer diagnosis cost on average 64% more ($1,092) for MBS and almost double ($624) for PBS than women who had never reported breast cancer (Table 7-5). Although Figure 7-39 would indicate that there are small differences in general practice consultations, the MBS includes additional items, such as allied health consultations, that may be taken up by the women and increase the overall cost to MBS.
84

Table 7-5 Comparison of costs for MBS and PBS uptake in women of the 1946-51 cohort who have never reported breast cancer and those who have reported breast cancer, mean cost ($) 2013 (the most recent year that data are available).
1973-78 cohort 1946-51 cohort 1921-26 cohort
MBS PBS MBS PBS MBS PBS
Never 1,687 690
Ever 2,779 1,314
7.6. Summary Points
Around 7% of women in the 1946-51 cohort had reported a diagnosis of breast cancer by Survey 7.
Breast cancer was more common among women with lower levels of education and more difficulty managing on income.
Smokers had higher prevalence of breast cancer.
There is a higher incidence and prevalence of breast cancer up to Survey 6 among women in the 1946-51 cohort who were underweight at Survey 1, but with higher incidence among overweight and obese women at Survey 7.
The association between breast cancer and physical function and mental health-related quality of life is small.
Differences in the number of general practice consultations by women with and without breast cancer are small. However, examination of MBS costs highlights larger differences which may indicate a greater uptake of additional items, such as access to allied health practitioners, by women who have ever reported breast cancer.
85

8. Cardiovascular conditions
Heart disease and stroke are commonly used terms for describing the most prevalent forms of cardiovascular disease. However these terms cover many different diagnoses and pathologies. For example, heart disease includes acute myocardial infarction (heart attack), angina, arrhythmias, and heart failure, which are mainly due to atherosclerosis, as well as rheumatic heart disease which has an infectious origin, valvular disease, and congenital heart problems. The most common forms of “heart disease” in Australia are coronary heart disease (including acute myocardial infraction, angina and other ischaemic heart disease) and heart failure.
Similarly, while stroke is due to loss of blood supply to the brain, usually due to atherosclerosis, it may not be readily distinguished from transient ischaemic attacks which are sometimes called ‘mini-strokes’ or other conditions that produce similar symptoms (sometimes called ‘stroke mimics’) (Hankey and Blacker, 2015).
Cardiovascular disease, which includes both heart disease and stroke, is the leading cause of death for women and men in Australia, although the rates have declined by about two-thirds over the last 30 years (AIHW, 2014a). Heart disease death rates are 1.8 times higher for men than women but death rates for stroke are similar for both sexes. Death from cardiovascular disease is rare among women aged below about 65 years but rates increase with age so that in 2011 87% of all female deaths from cardiovascular disease occurred in women aged 75 or more. In contrast, self-reported prevalence of these conditions increases approximately linearly with age and is higher among men than women at all ages (AIHW, 2014b). However, a consequence of the diversity of conditions covered by the terms “heart disease” and “stroke” is that when people self-report a condition they may not all be referring to the same clinical disease. Also differences in the wording of survey questions limit comparability between different surveys.
8.1. Ascertainment of heart disease and stroke in ALSWH
In ALSWH, pre-existing heart disease was ascertained from the question in Survey 1:
“Have you ever been told by a doctor that you have heart disease?”
New cases of heart disease were ascertained at each subsequent survey from responses to the question:
86

“In the last three years have you been diagnosed or treated for heart disease?”
Several ALSWH sub-studies have been conducted with women who reported they had heart disease. Follow-up of 233 women in the 1946-51 cohort who reported “heart disease” on Survey 1 indicated that only 25% of women were referring to ischaemic heart disease, with others referring to arrhythmias, valvular heart disease, rheumatic fever, congenital heart disease, and cardiac failure (Guillemin, 2004). In later surveys the term ‘heart disease’ was explained as ‘heart disease (including heart attack, angina)’ or, for the 1921-26 cohort the item for heart disease was replaced by three separate items: heart attack, angina and other heart problems.
In other ALSWH sub-studies, where the study team contacted the participants and asked more detailed questions, for example about the tests or treatment they had, almost half the women said they did not in fact have heart disease. Possibly they had experienced symptoms and sought medical attention, but subsequent investigations had revealed an alternative explanation for their symptoms. A more specific check of the validity of self-reported heart disease was undertaken by comparing hospital records for women living in New South Wales who had at least one hospital admission. In this study there was poor (1921-26 cohort) to moderate (1946-51 cohort) agreement between women’s self-report of a diagnosis of heart disease and a diagnosis of heart disease in hospital records (ICD-10 120-125) (Navin et al., 2015).
Similar questions were asked about stroke, but without any explanation or changes in the wording over time.
“In the last three years have you been diagnosed or treated for stroke?”
A comparison of self-reported survey data and hospital records showed the agreement between self-report and hospital-recorded stroke was only fair to moderate. Of the self-reported strokes that were not verified in the hospital data, many were due to the women reporting transient ischaemic attacks, strokes that occurred before the study, and possibly other stroke-like conditions. In the older cohort, a large proportion of women with unverified strokes had hospital records of other cerebrovascular diseases (Jackson et al., 2015).
In this report the terms ‘heart conditions’ and ‘stroke conditions’ are used to emphasise that these self-reported conditions are not specific clinically diagnosed diseases, but rather a range of related conditions.
87

8.2. Prevalence of heart disease and stroke
8.2.1. Heart conditions
Figure 8-40 shows the cumulative prevalence of self-reported heart conditions among ALSWH participants. As expected this proportion increased with age and with the most rapid increase among the 1921-26 cohort, with over 40% of women reporting this condition by Survey 6. The prevalence estimates are higher than reported for coronary heart disease alone from the Australian Health Survey 2011-12, as might be expected based on the broader description used in the ALSWH surveys (AIHW, 2014b).
20 20 24 27 30 33 36 47 49 52 55 58 61 64 72 75 78 81 84 87
Average age at survey
0
10
20
30
40
50
% d
iag
or tr
eat f
or h
eart
dis
ease
1989-95 cohort 1973-78 cohort 1946-51 cohort 1921-26 cohort
Figure 8-40: Prevalence of self-reported heart disease in the 1973-78 cohort (Survey 1), the 1946-51 cohort (Surveys 1-7) and the 1921-26 cohort (Surveys 1-6).
8.2.2. Stroke conditions
Figure 8-41 shows the cumulative prevalence of self-reported stroke conditions among ALSWH participants. The prevalence estimates are similar to those for stroke reported from the Australian Health Survey, and from the Australian Bureau of Statistics 2012 Survey of Disability, Ageing and Carers (AIHW, 2014b).
88

45 48 51 54 57 60 63 66 69 72 75 78 81 84 87 90
Average age at survey
0
5
10
15
% d
iag
or tr
eat f
or s
trok
e
1946-51 cohort 1921-26 cohort
Figure 8-41: Prevalence of stroke conditions in the 1946-51 cohort (Surveys 1-7) and the 1921-26 cohort (Surveys 1-6).
8.3. Women and heart and stroke conditions
It is well documented that men have higher rates of heart conditions and stroke than women, and they may also receive different investigations and treatment. Women are also less likely to be offered cardiac rehabilitation, even though they are just as likely to benefit from such programs (Stewart Williams et al., 2010). A sub-study involving in-depth interviews with ALSWH participants in the 1946-51 cohort highlighted the delay in diagnosis that women often experience, with their cardiac symptoms being attributed to non-cardiac causes by themselves and by their doctors (Guillemin, 2004). The women clearly had a perception that heart disease primarily affects men, particularly at younger ages. Both the women and their doctors appeared to be working on a premise that heart disease is unlikely to affect middle aged women. The women also commented on the lack of appropriate patient education materials and cardiac rehabilitation for women of their age (48-53 years at that time). These findings have important implications for health care practice, health promotion and disease prevention. Health care practitioners should be encouraged to question their assumptions about likely candidacy of women for heart disease; they need to
89
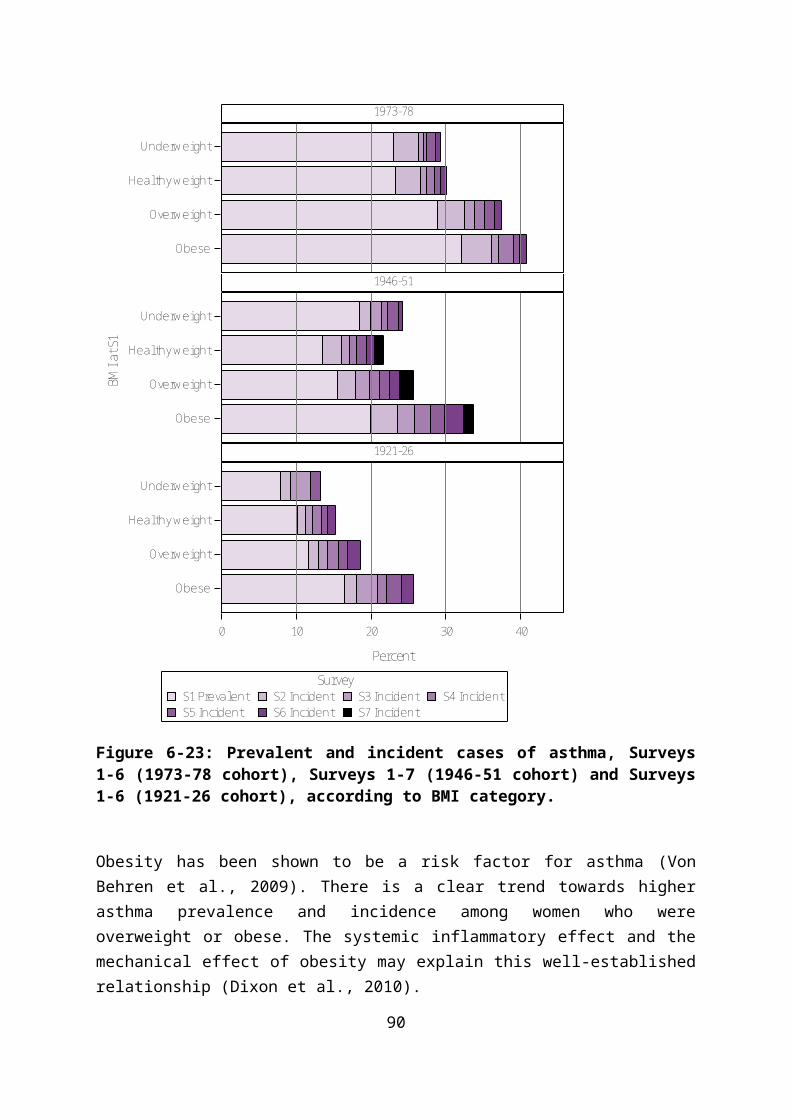
become more aware that heart disease should be considered in women in mid-age. In addition, there is a need for practitioners to be better informed about non-characteristic, cardiac presentations in women.
8.4. Area of residence and heart and stroke conditions
Rates of heart disease and stroke, including death rates from these conditions, are typically higher in regional, rural and remote areas of Australia than in the major cities (AIHW, 2014a, AIHW, 2014b). Detailed analysis of data from Surveys 1-6 for the 1946-51 cohort showed that, after adjusting for survey and age, women living in inner regional and remote areas were more likely to report heart disease than women in urban areas. While most of these differences were associated with modifiable lifestyle factors, significant differences remained for women in in remote areas after further adjusting for sociodemographic factors, BMI, smoking, alcohol and exercise. The findings suggested that factors such as inequities in health services and environmental hazards should be considered (McLaughlin et al., 2013).
In a sub-study of women in the 1921-26 cohort who reported having heart disease, researchers examined the hypothesis that women in rural areas may have poorer health services in more detail. They concluded that differential use of some health services might help explain higher cardiovascular mortality among rural compared with urban women (Jordan et al., 2011).
8.5. Risk factors for heart and stroke conditions
The established risk factors for heart and stroke conditions include: high blood pressure (hypertension, especially for stroke); smoking; high cholesterol; diabetes; overweight and obesity; lack of physical activity; high alcohol consumption (for heart disease and stroke) and no alcohol consumption (for heart disease) (Mozaffarian et al., 2015). These associations were confirmed in ALSWH data (Lucke et al., 2007), and changes in the prevalence of these risk factors are likely to have an impact on the future burden of cardiovascular disease (Brown et al., 2014).
Figure 8-42 shows the steadily increasing prevalence of self-reported hypertension with age among the ALSWH participants. For each cohort the increase is approximately linear but the level is relatively higher for the 1946-51 cohort than for the 1921-26 cohort.
90
18 21 24 27 30 33 36 39 42 45 48 51 54 57 60 63 66 69 72 75 78 81 84 87 90
Average age at survey
0
10
20
30
40
50
60
70
80
% d
iag
or tr
eat f
or h
yper
tens
ion
1973-78 cohort 1946-51 cohort 1921-26 cohort
Figure 8-42: Prevalence of hypertension in the 1973-78 cohort (Surveys 1-6), the 1946-51 cohort (Surveys 1-7) and the 1921-26 cohort (Surveys 1-6).
Data from ALSWH show declining rates of smoking across cohorts and with age (see Section 4). Smoking is associated with a greater risk of reporting heart disease among women in the 1946-51 and 1921-26 cohorts.
Obesity is increasingly prevalent among Australian women, increasing with age within the 1946-51 and 1973-78 cohorts, and with each younger cohort (1973-78, 1989-95) having a higher prevalence of obesity than previous cohorts.
Another related risk factor for heart and stroke conditions is lack of physical activity. This behavioural factor varies considerably for the same woman over time and between women, according to their social circumstances and health.
Overweight, obesity and physical activity have also been found to be associated with the risk of hypertension, with physical activity partially mitigating against the effects of weight. Among women in the 1946-51 cohort, the odds of developing hypertension were almost doubled among overweight women and more than three times higher among obese women compared to women in the healthy weight range. The effect of physical activity on hypertension risk was less strong, with the odds of developing hypertension being 26% higher in those with low physical activity compared to high physical activity. However when the joint effects of these two risk factors were considered, the odds of developing hypertension were 37% higher in healthy weight inactive women than in healthy weight highly active women (Jackson et al., 2014a).
91

Another analysis of ALSWH data for women in the 1946-51 cohort modelled the relationship between BMI at Survey 1 and the probability of a woman reporting incident hypertension (at Survey 2, 3 or 4). The probability of hypertension increased steadily across the entire BMI distribution, with the increased risk not exclusive to the overweight or obese group. Importantly, a hypothetical one unit change in the entire BMI distribution, where every woman loses weight, was estimated to result in a 10.3% reduction in the proportion of women with hypertension. In contrast, if BMI were shifted by three units in the top 20% of the distribution (BMI > 29) (where only very overweight or obese women lose weight), the corresponding reduction in incidence would be only 7.3%. This analysis demonstrates the importance of a whole-population strategy to disease prevention, rather only attempting to achieve greater weight loss among the most overweight (Brown et al., 2007).
Sitting time has also been implicated as a risk factor for cardiovascular disease. However, analysis of ALSWH data for the 1946-51 cohort did not find an association between sitting time and incident heart disease (Herber-Gast et al., 2013).
8.6. Socio-economic position and heart and stroke conditions
Risk factors for cardiovascular disease increase with socioeconomic disadvantage. Assessment of the prevalence of three cardiovascular risk factors (smoking, obesity and physical activity) across levels of socio-economic position in all three initial ALSWH cohorts showed how each of these risk factors was less common among the most advantaged compared with the least advantaged. There were however some cohort differences, particularly for smoking. Among women in the 1921-26 cohort, those with the highest educational attainment were more likely to have ever smoked than those with the lowest level of attainment. In contrast, this association was reversed among women in the other two cohorts. Moreover, the association between low levels of education and ever smoking was stronger among women in the 1973-78 cohort than among women in the 1946-51 cohort. Similarly, among older women, those in the most skilled occupational classes were most likely to have ever smoked, with opposite findings for women in the 1946-51 cohort. Education was also differently associated with physical inactivity across the three cohorts. Older women who were most educated were least likely to be physically inactive, whereas among the younger and mid-age cohorts there was little or no effect of education on physical inactivity (Lawlor et al., 2005).
Longitudinal analysis of data from the 1946-51 cohort also showed a strong association between socio-economic position and stroke. Education and home ownership, but not occupation or managing on income, were significantly associated with stroke, even after lifestyle and biological factors had been taken into account (Jackson et al., 2014b).
92

8.7. Mental health and heart and stroke conditions
While mental health problems, particularly depression, have not in the past been widely accepted as risk factors for cardiovascular disease there is a growing body of evidence that suggests they are indeed predictive of heart and stroke conditions (Glozier et al., 2013). However it is often difficult to determine whether people with a history of depression are more likely to develop heart and stroke conditions, or whether these conditions lead to mental health problem. Several analyses and sub-studies involving ALSWH participants have been conducted with a view to improving understanding of the relationships between depression and anxiety and cardiovascular disease. These have consistently shown that a history of poor mental health is predictive of heart and stroke conditions (Strodl et al., 2003). Using longitudinal analysis, data from Surveys 1-6 of the 1946-51 cohort were examined to determine whether a history of depression and/or anxiety predicted subsequent heart conditions. Compared to women who did not report heart disease, women who reported heart disease for the first time were more likely to have reported depression/anxiety on a previous survey. Some of this association was explained by lifestyle factors, but the effect remained after adjusting for other risk factors such as diabetes, physical activity and smoking (Berecki-Gisolf et al., 2013). A similar longitudinal analysis also demonstrated a relationship between depression and subsequent stroke (Jackson and Mishra, 2013).
93

8.8. Use of health services by women who report heart and stroke conditions
Women who report having heart and stroke conditions have much higher use of medical services than women who never report these conditions. Figure 8-43 shows the average number of Medicare claims for unreferred general practice visits for women who have ever reported heart conditions, compared with those who have not, for each survey year for all three cohorts. On average, women with these conditions have between 2 and 3 more general practice visits per year.
NoYes
18 21 24 27 30 33 36 39 42 45 48 51 54 57 60 63 66 69 72 75 78 81 84 87 90
Average age
0
5
10
15
20
Mea
n Vi
sits
1973-78 cohort 1946-51 cohort 1921-26 cohort
Figure 8-43: Mean number of general practice visits each survey year for women reporting heart disease, Surveys 1-6 (1973-78 cohort), Surveys 1-7 (1946-51 cohort) and Surveys 1-6 (1921-26 cohort).
94

MBS and PBS costs for women in the 1973-78 cohort with heart disease indicate that while there is little difference in MBS charges for women with and without the condition, PBS costs are almost five-fold greater (Table 8-6). Among the 1946-51 cohort, claims from women with heart disease for MBS were 60% higher and for PBS were almost double those of women with no heart disease. A similar pattern is evident for women in the 1921-26 cohort: MBS costs for women with heart disease were 20% higher and PBS costs almost 30% higher than for women with no heart disease.
Table 8-6 Comparison of costs for MBS and PBS uptake in women who have never reported heart disease and those who have reported heart disease, mean cost ($) 2013 (the most recent year that data are available).
1973-78 cohort 1946-51 cohort 1921-26 cohort
MBS PBS MBS PBS MBS PBS
Never 1,561 253 1,661 676 2,592 1,347
Ever 1,628 1,258 2,627 1,319 3,109 1,720
95

Figure 8-44 shows the average number of Medicare claims for unreferred general practice visits for women who have ever reported stroke conditions, compared with those who have not, for each survey year for the 1946-51 and 1921-26 cohorts. As for heart conditions, the women with stroke conditions had, on average, more general practice visits than women without stroke.
NoYes
45 48 51 54 57 60 63 66 69 72 75 78 81 84 87 90
Average age
0
5
10
15
20
Mea
n Vi
sits
1946-51 cohort 1921-26 cohort
Figure 8-44: Mean number of general practice visits each survey year for women reporting stroke conditions, Surveys 1-7 (1946-51 cohort) and Surveys 1-6 (1921-26 cohort).
96

In the 1946-51 cohort, MBS and PBS costs for women with stroke conditions were greater than for women who had never reported a stroke condition (see Table 8-7). In this cohort, mean MBS costs were almost 40% higher for women with a stroke condition and mean PBS costs were 60% higher than for women who had never reported a stroke. In the 1921-26 cohort, there was little difference between mean MBS and PBS costs for women with and without a stroke condition.
Table 8-7 Comparison of costs for MBS and PBS uptake in women who have never reported stroke conditions and those who have reported stroke conditions, mean cost ($) 2013 (the most recent year that data are available).
1973-78 cohort 1946-51 cohort 1921-26 cohort
MBS PBS MBS PBS MBS PBS
Never 1,753 739 2,811 1,492
Ever 2,452 1,189 2,900 1,594
One approach for prevention of cardiovascular disease is through medical management of risk factors such as hypertension and high serum cholesterol. A study linking ALSWH data to prescription records (from the Pharmaceutical Benefits Scheme) show that use of statins and antihypertensive medications has increased over time and as the women age. The highest use was observed in the 1921-26 cohort, with around 70% of women having PBS claims for statins or antihypertensive medications (alone or in combination) in 2007. Women in the 1946-51 cohort were much less likely to be taking these medications with only 25% having claims for statins and/or antihypertensive medication. Many of the women who had reported heart disease were not taking these medications, despite an expectation that women would be prescribed these drugs as secondary prevention against future cardiovascular events. This result may reflect under-treatment of women at high risk of cardiovascular disease, but must also be considered against the difficulty in correctly ascertaining specific cardiovascular conditions using self-reported diagnosis of “heart disease” (Stewart et al., 2013).
In a sub-study of women in the 1921-26 cohort who reported having heart disease, the researchers examined the use of health services in more detail. This sub-study asked women to indicate whether they had ischaemic heart disease, congestive cardiac failure, or atrial fibrillation, with many women reporting more than one of these conditions. Most women (80%) who reported ischaemic heart disease said they had ever consulted a cardiologist. Recent cardiology consultations, within the past 12 months, were more commonly reported by women in major cities (55.5%) than those in inner regional (41.6%) or outer
97

regional/remote areas (37.2%). Similar results were reported by women with heart failure, with 64% of women in cities, 48% of women in inner regional, and 51% of women in remote areas having consulted a cardiologist in the past 12 months. Use of recommended medications did not vary by residential area, with 29% of women reporting ischaemic heart disease also reporting use of Angiotensin-converting enzyme (ACE) inhibitors, 69% reporting use of anti-platelet medication, and 58% reporting use of a statin. Reported use of ACE inhibitors was also low among women reporting heart failure (32%); with 52% taking either an ACE inhibitor or an Angiotensin II receptor blocker. Only 10% of these women reported use of beta-blockers (Jordan et al., 2011).
8.9. Deaths among women reporting heart and stroke conditions
A sub-study of ALSWH collected detailed information on angina symptoms from women in the 1921-26 cohort who had reported heart disease at any of Surveys 1-3. Women who reported more physical limitations on the angina questionnaire, and more frequent episodes of angina, were more likely to die over the next four and half years. Other factors associated with death in this period included history of myocardial infarction, smoking status, lung disease, kidney disease, and older age. This study established, for the first time, that a questionnaire developed in Seattle to assess the severity of angina symptoms predicted mortality in women as well as it had previously been shown to do for men. The researchers concluded that the questionnaire was a useful tool for risk assessment in older women (Jordan et al., 2011).
Women in the 1921-26 cohort have also been followed to compare 12-year death rates in older women reporting prevalent stroke (reported at Survey 1), incident stroke (at Survey 2), and no stroke (on either survey). After 12 years, 66% of women in the ‘no stroke’ group were still alive, compared to 50% in the ‘prevalent stroke’ group and only 38% in the ‘incident stroke’ group, and reported stroke was found to be significantly associated with mortality risk even after adjustment for other factors. Comorbid conditions were also significantly associated with mortality risk, and accounted for some of the difference between women who reported stroke and those who had not. Smoking (being an ex-smoker or current smoker at Survey 2) and BMI were also risk factors for mortality, with current smokers having almost double the mortality hazard of women who never smoked. Likewise, women classified as obese and those who were underweight also had higher risk of death compared to women in the healthy weight range (overweight had a protective effect). Living outside a major city and being unmarried (single, divorced or widowed) were also associated with a small increase in risk of death. This study highlights the long-term impacts of reported stroke on life expectancy, with few studies following stroke survivors for longer than a few years. The study also highlights the importance of understanding and managing comorbidities and other lifestyle factors which can affect post-stroke survival (Byles et al., 2015).
98

8.10. Summary points
Heart and stroke conditions account for a significant burden of morbidity and mortality among Australian women.
ALSWH provides important data on changes in key risk factors for these conditions, with reductions in smoking as the women age but increasing prevalence of obesity among the younger cohorts.
Heart disease and stroke are major determinants of the use of health services. ALSWH data show the higher use of GP visits by women reporting these conditions. However further analyses of the data also suggest that women may not receive optimal treatment either in terms of access to specialists or appropriate preventative medications.
There is evidence of inequity in access to treatment for women in regional and remote areas.
MBS and PBS costs for women in the 1973-78 cohort with heart disease indicate that while there is little difference in MBS charges for women with and without the condition, PBS costs are almost five-fold greater. Among the 1946-51 cohort, claims from women with heart disease for MBS were 60% higher and for PBS were almost double those of women with no heart disease. A similar pattern is evident for women in the 1921-26 cohort: MBS costs for women with heart disease were 20% higher and PBS costs almost 30% higher than for women with no heart disease.
In the 1946-51 cohort, MBS and PBS costs for women with stroke conditions were greater than for women who had never reported a stroke condition. In this cohort, mean MBS costs were almost 40% higher for women with a stroke condition and mean PBS costs were 60% higher than for women who had never reported a stroke. In the 1921-26 cohort, there was little difference between mean MBS and PBS costs for women with and without a stroke condition.
99

9. Diabetes
Diabetes represents a set of chronic conditions caused by disordered glucose metabolism. There are two major types: Type 1 which is due to dysfunction of insulin producing cells of the pancreas, and Type 2 which is due to a combination of insulin resistance and insufficient insulin production. Type 2 is the most common condition affecting older adults. Gestational diabetes is a transient form of diabetes that occurs during pregnancy, and can predispose development of Type 2 diabetes in later life.
The risk of diabetes increases with age, and may, depending on the method of ascertainment, be more prevalent in women. Risk of developing diabetes increases by a factor of two if there is a parent or sibling with the disease. These age, sex and genetic risk factors are not modifiable. The major modifiable risk factors include overweight and obesity and high waist circumference, with an exponential increase in risk with increasing body mass index. High calorie, low fibre, high fat diets, and physical inactivity, increase diabetes risk. Some studies also suggest that smoking may also increase risk of developing diabetes.
Over the long-term, high levels of circulating glucose cause damage to small and large blood vessels. People with diabetes are at greatly increased risk of cardiovascular disease, diabetic retinopathy, renal disease, neuropathies that affect heart and blood pressure responses, digestion, urination, and peripheral sensation and musculature (Little et al., 2007).
9.1. Women and diabetes
Diabetes prevalence rises sharply following menopause in women, and gestational diabetes is a complication in approximately 3 – 11% of pregnancies in the USA and Australia. Women with gestational diabetes and their babies are at increased risk for prenatal morbidity and later development of Type 2 diabetes (van der Ploeg, et al, 2011). Diabetes prevalence among women surpasses the prevalence in men by age 70 (Barr et al., 2006). Gender also has a significant impact on the development of diabetes-related complications and co-morbidities (Shalev et al., 2005) as well as effects on diabetes management and attitudes. In particular, compared with men, women with diabetes have been found to have a two-fold increased risk for all-cause and cardiovascular-related death (Hu, 2003). Likewise, women with diabetes are at increased risk of poor psychosocial outcomes. Women with diabetes are at double the risk of developing depression, compared with their male counterparts (Shea and Owens-Gary, 2009). Psychiatric comorbidity in diabetes has implications for management, self-care, and the development of disease-related complications, including blood glucose control (Lustman and Clouse, 2005). More recently, a systematic review and meta-analysis of 26 studies, including data from more than 200,000 men and women, concluded that women with Type 1 diabetes have a roughly 40% greater excess risk of all-
100

cause mortality, and twice the excess risk of fatal and non-fatal vascular events, compared with men with Type 1 diabetes (Huxley et al., 2015). Given these particular considerations for women, the 2010 Victorian gender impact assessment report (Yeats and Tipper, 2010)recommended taking a single gender approach to diabetes.
9.2. Ascertainment of diabetes in ALSWH
Diagnosis of diabetes is generally made on the basis of fasting blood glucose levels and impaired glucose tolerance, according to criteria established by the World Health Organisation (see Box).
WHO Criteria for Diabetes
Fasting plasma glucose >=7mmol/l (126mg/dl)
plasma glucose 2 hours after ingesting 75g oral glucose load
>=11.1 mmol/l (200mg/dl)
In asymptomatic people, abnormal results on at least two separate measurement occasions are required to make a diagnosis of diabetes. Less extreme glucose abnormalities may be classified as impaired glucose tolerance, or impaired fasting glucose. These additional categories of impaired glucose metabolism (sometimes referred to as pre-diabetes), combined with inaccurate recall, can lead to inaccuracies in self-reported diabetes in epidemiological surveys.
In ALSWH, prevalent diabetes was ascertained from the question in Survey 1:
“Have you ever been told by a doctor that you have diabetes?”
New cases of diabetes were ascertained at each subsequent survey*:
“In the last three years have you been diagnosed or treated for diabetes?”
We have checked the agreement between these self-reported cases of diabetes and hospital records for women living in New South Wales and admitted to any New South Wales hospital. This comparison shows substantial agreement between women’s self-reported diabetes and hospital records, indicating that self-reported doctor diagnosis is a good marker for prevalent and incident cases of diabetes (Navin et al., 2015).
101

9.3. Prevalence of diabetes
The cumulative prevalence of diabetes in each cohort at each time point is shown in Figure9-45. These prevalence estimates are higher than those reported in the Australian Health Survey for women aged 25-34 (0.7%), 35-44 (1.7%), 45-54 (3.9%) 55-64 (8.6%) and 85+ (10.8%).
20 20 24 27 30 33 36 47 49 52 55 58 61 64 72 75 78 81 84 87
Average age at survey
0
5
10
15
20
% d
iag
or tr
eat f
or d
iabe
tes
1989-95 cohort 1973-78 cohort 1946-51 cohort 1921-26 cohort
Figure 9-45: Prevalence of diabetes at each survey among women in the 1989-95, 1973-78, 1946-51 and 1921-26 cohorts.
As Type 1 diabetes is a relatively uncommon condition among women, the increasing prevalence among ALSWH participants largely reflects the development of Type 2 diabetes, which is clearly related to lifestyle behaviours, and obesity.
102
9.4. Incidence of diabetes
Prevalent and incident (new) cases of diabetes reported over successive surveys are shown for each cohort in Figure 9-46.
0 5 10 15 20
Percent
1921-26
1946-51
1973-78
Coho
rt
S7 IncidentS6 IncidentS5 IncidentS4 IncidentS3 IncidentS2 IncidentS1 Prevalent
Survey
Figure 9-46: Prevalent and incident cases of diabetes, Surveys 1-6 (1973-78 cohort), Surveys 1-7 (1946-51 cohort), and Surveys 1-6, (1921-26 cohort).
The highest incidence of diabetes was observed among the older women with around 2-3% of women reporting new onset of diabetes at each survey from Survey 2 to Survey 6, so that the prevalence of diabetes in the older women was around 16% by Survey 6. Incidence of diabetes was lower in the 1946-51 cohort in Surveys 2 and 3, but the rate of reporting of new cases began to increase at Survey 4, so that newly reported diabetes was 2.3% at Survey 7. Prevalence of diabetes in this cohort was 11.8% by Survey 7. Incidence rates were lowest in the 1973-78 cohort, who also had the lowest prevalence of existing cases at Survey 1 when the women were aged 18-23 (less than 1%). By Survey 6, the prevalence of diabetes in this cohort was slightly more than 3%.
103

9.5. Factors associated with diabetes
9.5.1. Area of residence
S7 IncidentS6 IncidentS5 IncidentS4 IncidentS3 IncidentS2 IncidentS1 Preva lent
Survey
RA a
t S1
1921-26
1946-51
1973-78
0 5 10 15 20 25
Percent
Remote/Very Remote
Outer Regiona l
Inner Regional
Major Cities
Remote/Very Remote
Outer Regiona l
Inner Regional
Major Cities
Remote/Very Remote
Outer Regiona l
Inner Regional
Major Cities
Figure 9-47: Prevalent and incident cases of diabetes, Surveys 1-6 (1973-78 cohort), Surveys 1-7 (1946-51 cohort), and Surveys 1-6 (1921-26 cohort), according to area of residence at Survey 1.
Living in inner regional or outer regional areas was associated with the higher prevalence and incidence of diabetes. Older women in remote and very remote areas appear to have very high incidence rates in later surveys, but numbers of women in this group are small and these effects may be over-estimated.
104

9.5.2. Highest educational qualification
S7 IncidentS6 IncidentS5 IncidentS4 IncidentS3 IncidentS2 IncidentS1 Preva lent
Survey
Educ
ation
at S
1
1921-26
1946-51
1973-78
0 5 10 15 20
Percent
Less than Year 12
Year 12
Certifi cate/Diploma
Univers i ty
Less than Year 12
Year 12
Certifi cate/Diploma
Univers i ty
Less than Year 12
Year 12
Certifi cate/Diploma
Univers i ty
Figure 9-48: Prevalent and incident cases of diabetes, Surveys 1-6 (1973-78 cohort), Surveys 1-7 (1946-51 cohort), and Surveys 1-6 (1921-26 cohort), according to highest educational qualification at Survey 1.
Across all three cohorts, the prevalence of diabetes at Survey 1 was highest among women with less than Year 12 education, and higher levels of education were generally associated with lower incidence. Among women in the 1921-26 cohort, the prevalence at Survey 1 ranged from less than 2% in the university-educated, to 6.2% among women with less than
105

Year 12 education. By Survey 6, prevalence was lowest (6.0%) among women with a university education and highest (9.8%) among those with less than Year 12 (or equivalent for this cohort). By Survey 7 of the 1946-51 cohort, 14% of the women with less than Year 12 education reported a diagnosis of diabetes, compared with 11% who had achieved Year 12, 9% with a certificate or diploma and 8% with a university degree. Among the 1973-78 cohort the relationship between education and diabetes was less clear, although those women who had less than Year 12 education by Survey 6 had the highest prevalence and incidence of diabetes (7%), which was consistent with the two older cohorts.
106

9.5.3. Difficulty managing on income
S7 IncidentS6 IncidentS5 IncidentS4 IncidentS3 IncidentS2 IncidentS1 Preva lent
Survey
Man
age
on in
com
e at
S1
1921-26
1946-51
1973-78
0 5 10 15 20 25
Percent
Imposs ible
Diffi cult a lways
Diffi cult sometimes
Not too bad
It i s easy
Imposs ible
Diffi cult a lways
Diffi cult sometimes
Not too bad
It i s easy
Imposs ible
Diffi cult a lways
Diffi cult sometimes
Not too bad
It i s easy
Figure 9-49: Prevalent and incident cases of diabetes, Surveys 1-6 (1973-78 cohort), Surveys 1-7 (1946-51 cohort), and Surveys 1-6 (1921-26 cohort), according to difficulty managing on income at Survey 1.
The effect of income was apparent in the three cohorts, with those who reported that managing on income was “difficult sometimes”, “difficult always” and “impossible” more likely to report diabetes at Survey 1. This trend continued over time across all surveys and cohorts, with higher incidence of diabetes between Survey 2 and Survey 6 (1973-78 and 1921-26 cohorts) and Survey 2 and Survey 7 (1946-51 cohort) among women who reported difficulty managing on income. It should be noted that few women in the older cohort
107

reported managing on income was impossible, so the estimates for women in this category are less precise.
9.5.1. Body Mass Index
S7 IncidentS6 IncidentS5 Incident
S4 IncidentS3 IncidentS2 IncidentS1 Preva lentSurvey
BMI a
t S1
1921-26
1946-51
1973-78
0 10 20 30
Percent
Obese
Overweight
Hea lthy weight
Underweight
Obese
Overweight
Hea lthy weight
Underweight
Obese
Overweight
Hea lthy weight
Underweight
Figure 9-50: Prevalent and incident cases of diabetes, Surveys 1-6 (1973-78 cohort), Surveys 1-7 (1946-51 cohort), and Surveys 1-6 (1921-26 cohort), according to BMI category at Survey 1.
Body Mass Index (BMI) in the overweight or obese categories is one of the strongest risk factors for diabetes. As shown in Figure 9-50, BMI in the obese range was strongly associated with higher prevalence and incidence of diabetes in all three cohorts. In 2010, ALSWH research led by Dr Jannique van Uffelen confirmed the consistent associations between increasing BMI and increasing incidence and prevalence of diabetes in the older
108

cohort. The prevalence of diabetes ranged from 6% to 13% in women in the healthy BMI range, whereas it ranged from 20% to more than 30% in women with a BMI ≥30kg/m 2 (van Uffelen et al., 2010).
In 2007, ALSWH researchers (Brown, Hockey and Dobson) used data from eight years’ follow-up of middle-aged women in the Australian Longitudinal Study on Women’s Health to estimate the reductions in incidence of diabetes that would result if the BMI distribution were shifted to the left in various ways. Models were developed based on the work of Geoffrey Rose (Rose, 1992), who proposed that the impact of risk factors on disease at the population level varies according to whether a ‘high risk’ or whole population approach is taken. Although this principle is well documented for conditions like hypertension, which has a relatively direct or linear relationship with risk factors such as body mass index (BMI), it has not been examined for health problems like diabetes, where the incidence is exponentially greater in people who are in the overweight and obese categories of BMI.
The ALSWH data showed that, if all women with BMI over 24 reduced BMI by 2 points (approximately 5.5 kg), the incidence of diabetes would be reduced by 23%. Assuming that each kilogram of stored fat is equivalent to 7000 kcals (29,400 kJ), and that this energy is converted with an efficiency of 50%, then closing the “energy gap” by 200 kcals (840kJ) per day (for example through an additional 20 minutes or 2000 steps of brisk walking and reducing energy intake by 100 kcal (420kJ) [the equivalent of one chocolate biscuit]) every day for one year, would substantially contribute to achieving this goal. As suggested in the WHO Global Strategy on Diet, Physical Activity and Health (DPAS) (resolution WHA57.17, May 2004), these data suggest that small changes in two of the main risk factors could result in significant reductions in risk of diabetes in women. This level of behaviour change is however likely to require considerable social, cultural and environmental support, to encourage more active living among today’s time-pressured women (Brown et al., 2007).
ALSWH researchers have also investigated the impact of weight change on the subsequent incidence of diabetes. Using data from 7,239 participants in the 1946-51 cohort, we assessed the impact of BMI at Survey 1 and weight change between Survey 1 and 2, and Survey 2 and 3, on the subsequent development of diabetes at Survey 3 or Survey 4. After controlling for menopausal status, physical activity, education, smoking status and area of residence, BMI at Survey 1 was much more strongly associated with the development of diabetes than shorter term weight gains or losses over the two to three years before the diagnosis. Compared with women who had a BMI <25 kg/m2, those with BMI ≥ 25 kg/m2 had higher incidence of diabetes (P < 0.0001), with odd ratios reaching 12.1 (95% C1 7.6-19.3) for women in the very obese group (BMI ≥ 35 kg/m2). There was no association between shorter-term weight gain or weight loss on first-reported diagnosis of diabetes (p = 0.08).
109

This strong association with initial BMI at Survey 1 may reflect underlying issues: the role of duration of obesity as a risk factor for diabetes; the timing of weight change during a critical period before Survey 1, such as during early adulthood; and the latency of the effect of weight gain on diabetes (Mishra et al., 2007).
As BMI is closely related to diet and overall nutrition, ALSWH data have been used to investigate the role of diet quality, including macronutrient and zinc intake, in the development of Type 2 diabetes in the 1946-51 cohort. The ability of two diet quality scores to predict the incidence of Type 2 diabetes was considered in 2014. Using data from women who were free of Type 2 diabetes at Survey 1 and who had completed the food frequency questionnaire (FFQ), researchers examined the associations between the Australian Recommended Food Score (ARFS) and the Dietary Guideline Index (DGI), with Type 2 diabetes risk, using multiple logistic regression models (adjusting for sociodemographic characteristics, lifestyle factors and energy intake). During 6 years of follow-up, 311 incident cases of Type 2 diabetes were reported. The DGI score was inversely associated with Type 2 diabetes risk (odds ratio (OR) comparing the highest with the lowest quintile of DGI was 0·51; 95 % CI 0·35, 0·76; p for trend = 0·01). There was no statistically significant association between the ARFS and Type 2 diabetes risk (OR comparing the highest with the lowest quintile of ARFS was 0·99; 95 % CI 0·68, 1·43; p for trend = 0·42). These results indicate that the DGI score, which assesses compliance with established dietary guidelines, was predictive of Type 2 diabetes risk in Australian women. The risk of Type 2 diabetes among women in the highest quintile of DGI was approximately 50% lower than that in women in the lowest quintile. The ARFS was not significantly predictive of Type 2 diabetes (Alhazmi et al., 2014a).
Dietary zinc and its role in the risk of developing diabetes was the focus of further analyses of data from the 1946-51 cohort. Molecular and cellular studies have demonstrated that the mineral zinc plays a key role in the synthesis and action of insulin under normal physiological conditions and in type 2 diabetes. Protective effects of zinc supplementation have been demonstrated in rodent models, but this has not been properly tested in humans. A validated food frequency questionnaire (FFQ) was used to assess dietary intake and other nutrients. Predictors of 6-year incidence of Type 2 diabetes were examined using multivariable logistic regression. From 8,921 participants, 333 incident cases of Type 2 diabetes were identified over 6 years of follow-up. After adjustment for dietary and non-dietary factors, women in the highest quintile of dietary zinc intake had almost half the odds of developing Type 2 diabetes (OR = 0.50, 95% C.I. 0.32–0.77) compared with the lowest quintile. Similar findings were observed for the zinc/iron ratio; the highest quintile had half the odds of developing Type 2 diabetes (OR = 0.50, 95% C.I 0.30-0.83) after multivariable adjustment of covariates. The conclusion was that higher total dietary zinc intake and high zinc/iron ratio are associated with lower risk of Type 2 diabetes in women. This finding is a
110

positive step towards further research to determine if zinc supplementation may reduce the risk of developing Type 2 diabetes (Vashum et al., 2013).
Further research examined the role of macronutrient intake on the risk of diabetes. After adjusting for sociodemographic, lifestyle and other dietary risk factors, monounsaturated fatty acids (MUFA), total n-3 polyunsaturated fatty acids (PUFA), α-linolenic acid and total n-6 PUFA intakes were positively associated with incidence of Type 2 diabetes. The relative risks for Type 2 diabetes for the highest compared with the lowest quintiles were 1.64 (95 % CI 1.06, 2.54), p = 0.04 for MUFA; 1.55 (95 % CI 1.03, 2.32), p = 0.01 for n-3 PUFA; 1.84 (95 % CI 1.25, 2.71), p < 0.01 for α-linolenic acid; and 1.60 (95 % CI 1.03, 2.48), p = 0.04 for n-6 PUFA. Other dietary macronutrients were not significantly associated with diabetes risk. These data indicate that consumption of MUFA, n-3 PUFA and n-6 PUFA may influence the risk of developing Type 2 diabetes in women (Alhazmi et al., 2014b).
ALSWH research has also shown that women in the 1946-51 cohort who have a diet (measured at Survey 3) high in saturated fat and low in dietary fibre were more likely to have been diagnosed with diabetes between Survey 3 and Survey 6 (after adjusting for confounders such as BMI). Women who consumed items from the dietary patterns labeled as “cooked vegetables” and “Mediterranean style” were less likely to have been diagnosed with diabetes between Survey 3 and Survey 6 than none/low consumers. Women who consumed items in the dietary patterns “processed meat, meat, and takeaway” and “high-fat and sugar foods” were more likely to have been diagnosed between Survey 3 and Survey 6, than none/low consumers (Schoenaker et al., 2013).
Further analyses of dietary factors in the 1946-51 cohort have also shown that a ‘Western’ dietary pattern is significantly associated with development of diabetes [highest quintile: OR = 1.94 (95% CI: 1.25, 3.00); p-trend = 0.001 (Schoenaker et al., 2013).
111

9.5.2. Smoking
S7 IncidentS6 IncidentS5 IncidentS4 IncidentS3 IncidentS2 IncidentS1 Preva lent
Survey
Smok
ing
at S
1
1921-26
1946-51
1973-78
0 5 10 15 20
Percent
Current smoker
Ex-smoker
Never smoked
Current smoker
Ex-smoker
Never smoked
Current smoker
Ex-smoker
Never smoked
Figure 9-51: Prevalent and incident cases of diabetes, Surveys 1-6 (1973-78 cohort), Surveys 1-7 (1946-51 cohort), and Surveys 1-6 (1921-26 cohort), according to smoking status at Survey 1.
The association between smoking and diabetes is illustrated in Figure 9-51. Around 15% of the 1946-51 cohort and 4% of the 1973-78 cohort who were current smokers had a diagnosis of diabetes by the most recent survey (Survey 7 in the 1946-51 cohort and Survey 6 in the 1973-78 cohort).
112

9.5.3. Physical activity
S7 IncidentS6 IncidentS5 IncidentS4 IncidentS3 IncidentS2 IncidentS1 Preva lent
Survey
Phys
ical
acti
vity
at S
2
1921-26
1946-51
1973-78
0 5 10 15 20
Percent
Inactive
Low
Moderate
High
Inactive
Low
Moderate
High
Inactive
Low
Moderate
High
Figure 9-52: Prevalent and incident cases of diabetes, Surveys 1-6 (1973-78 cohort), Surveys 1-7 (1946-51 cohort), and Surveys 1-6 (1921-26 cohort), according to level of physical activity at Survey 2.
Consistent with the relationship previously observed between BMI and diabetes, women who were physically inactive were more likely to report diabetes. Physical activity, in conjunction with a healthy diet and BMI in the normal range, is regarded as an important lifestyle behaviour for reducing the risk of diabetes. Australian and US guidelines recommend that adults should accumulate 150-300 minutes of at least moderate intensity
113

activity each week. There is also growing evidence to suggest that more than 6 hours/day of sitting is associated with poorer health outcomes.
In 2013 ALSWH researchers aimed to quantify the increase in physical activity and decrease in sitting that would be needed to achieve a 20% reduction in incidence rates of diabetes. As for the work on relationships between BMI and diabetes (described previously), the researchers used concepts drawn from the work of Geoffrey Rose (Rose, 1992) to examine ‘whole population’, ‘high risk’ and ‘middle road’ approaches to reducing diabetes incidence. The modelling suggested that there would be a 12.5% reduction in incidence with a ‘middle road’ approach which encourages all those not meeting physical activity guidelines to do so (Peeters et al., 2014).
9.5.4. Other risk factors for diabetes among women in ALSWH
Lifestage-specific risk factors for diabetes have also been examined for gestational diabetes and menopausal symptoms. Gestational diabetes mellitus (GDM) complicates approximately 3–11% of pregnancies and increases the risk of prenatal morbidity and later development of Type 2 diabetes mellitus. Physical activity and sedentary behaviour are thought to play a role in the development of GDM, independent of overweight and obesity. The aim of this study was to examine the relationships between physical activity, sedentary behaviour and the development of GDM using a population-based prospective cohort study. Data from the 1973–1978 cohort (n = 2913) were used to determine the influences of self-reported physical activity, and sedentary behaviour in 2000 and 2003 on the development of GDM over subsequent three year periods, with adjustment for socio-demographic and lifestyle factors. Physical activity and sedentary behaviour in 2000 and 2003 were not associated with the development of GDM in the subsequent three years. In adjusted models, odds ratios for the development of GDM were 1.92 (95% CI 1.25–2.96) for overweight women (BMI 25–30 kg/m2) and 3.11 (1.92–5.03) for obese women (BMI≥30 kg/m2) compared with normal weight women. Those with lower education and women born in an Asian country also had higher risk of developing GDM than more highly educated and Australian born women, respectively. In conclusion, pre-pregnancy physical activity and sedentary behaviour appear to be less important in the development of GDM in this cohort than overweight and obesity (van der Ploeg et al., 2011).
The relationships between menopausal symptoms and diabetes have also been examined. Vasomotor menopausal symptoms (VMS), i.e., hot flushes and night sweats, are experienced by up to 70% of women around menopause. Previous cross-sectional studies have found that women with VMS have unfavourable cardiovascular disease risk profiles. However, there is little research on whether profiles or trajectories of VMS through menopause are associated with long-term health outcomes. This study examined the associations between VMS profiles and risk of diabetes, at a stage when the prevalence of
114

diabetes was 9.0%. Compared with mild VMS, the odds of diabetes were higher in those with a late severe profile of VMS (though not statistically significant; adjusted odds ratio, 1.28; 95% CI, 0.97-1.68) and in those with an early severe profile (adjusted odds ratio, 1.67; 95% CI, 1.20-2.32). Adjustment for BMI attenuated this association, but the odds of diabetes were still significantly higher in women with an early severe profile than in women with mild VMS (odds ratio, 1.55; 95% CI, 1.11-2.17). The moderate profile was not associated with diabetes (Herber-Gast and Mishra, 2014).
9.6. Impact of diabetes on health-related quality of life (HRQOL)
EverNeverT2 Diabetes
18 21 24 27 30 33 36 39 42 45 48 51 54 57 60 63 66 69 72 75 78 81 84 87 90
Average age at survey
0
10
20
30
40
50
60
70
80
90
100
Mea
n PF
1973-78 cohort 1946-51 cohort 1921-26 cohort
Figure 9-53: Mean physical function scores for women who have ever reported diabetes (at any survey) and women who have never reported diabetes, Surveys 1-6 (1973-78 cohort), Surveys 1-7 (1946-51 cohort), and Surveys 1-6 (1921-26 cohort).
For each cohort and at every survey, physical function for women with existing or incident diabetes (ever) was lower than for women with no diagnosis of diabetes (Figure 9-53).
115
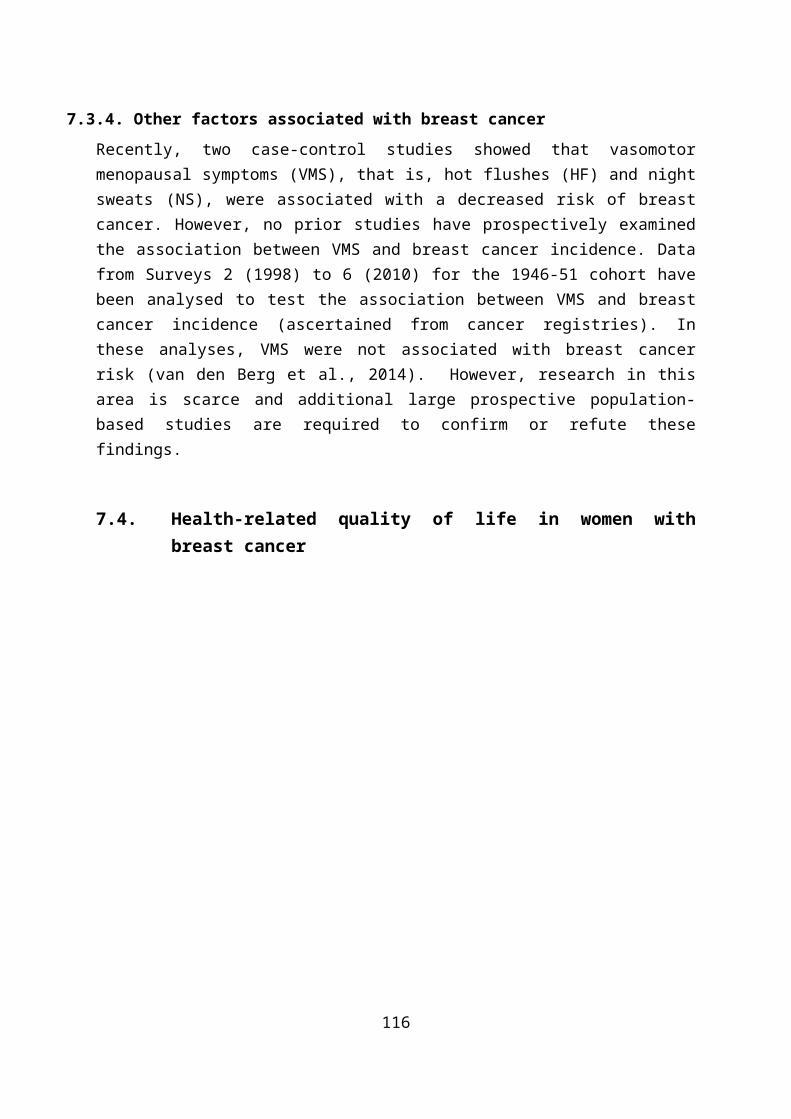
EverNeverT2 Diabetes
18 21 24 27 30 33 36 39 42 45 48 51 54 57 60 63 66 69 72 75 78 81 84 87 90
Average age at survey
0
10
20
30
40
50
60
70
80
90
100
Mea
n M
H1973-78 cohort 1946-51 cohort 1921-26 cohort
Figure 9-54: Mean mental health scores for women who have ever reported diabetes (at any survey) and women who have never reported diabetes, Surveys 1-6 (1973-78 cohort), Surveys 1-7 (1946-51 cohort), and Surveys 1-6 (1921-26 cohort).
Women who ever report diabetes have slightly lower mental health scores than women who do not.
116
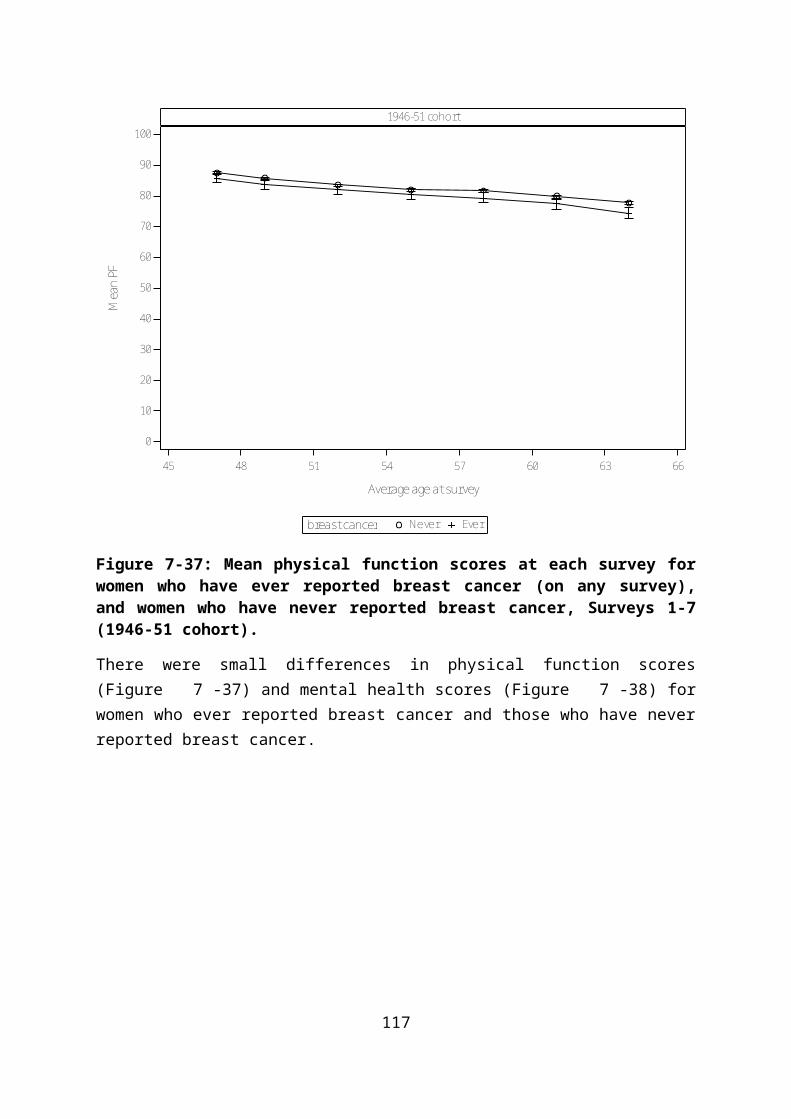
9.7. Use of health services by women who report diabetes
EverNever
18 21 24 27 30 33 36 39 42 45 48 51 54 57 60 63 66 69 72 75 78 81 84 87 90
Average age
0
5
10
15
20
Mea
n Vi
sits
1973-78 cohort 1946-51 cohort 1921-26 cohort
Figure 9-55: Mean number of general practice visits for women who have ever reported diabetes (at any survey) and women who have never reported diabetes, Surveys 1-6 (1973-78 cohort), Surveys 1-7 (1946-51 cohort), and Surveys 1-6 (1921-26 cohort).
The number of general practice visits made by women in each survey year are shown for each cohort in Figure 9-55. At every age, women with diabetes in all three cohorts had higher numbers of general practice visits than women with no diabetes. There were few differences between women with existing and newly diagnosed diabetes.
An examination of mean MBS and PBS costs in 2013 indicates that these are higher for women with diabetes than for women without diabetes in all three cohorts (Table 9-8). MBS costs may include items under the annual cycle of care (ACC, described below). However, differences in MBS costs for women with and without diabetes in each cohort were 12% (1973-78), 30% (1946-51) and 7% (1921-26), which are relatively modest in comparison to the differences in PBS costs. In particular, PBS costs for women in the 1973-78 cohort with diabetes are triple that of women without diabetes and women with diabetes in the 1946-51 cohort have PBS costs which are twice that of women without diabetes.
117

Table 9-8 Comparison of costs for MBS and PBS uptake in women who have never reported diabetes and those who have reported diabetes, mean cost ($) 2013 (the most recent year that data are available)
1973-78 cohort 1946-51 cohort 1921-26 cohort
MBS PBS MBS PBS MBS PBS
Never 1,553 249 1,715 675 2,786 1,445
Ever 1,744 795 2,243 1,305 2,980 1,760
Diabetes is a costly chronic disease which is associated with a number of complications including blindness, kidney failure, heart disease, limb amputation, nerve damage and premature mortality. Appropriate management, and adherence to guidelines, can prevent, delay or reduce the complications from poorly controlled diabetes. Guidelines for optimal diabetes care include testing HbA1c every 3 to 6 months for insulin treated patients, and every 6 to 12 months for non-insulin treated patients, and testing blood lipids and microalbuminuria annually. Research conducted by ALSWH researchers (Young et al., 2005)using data from the 1946-51 and 1921-26 cohorts revealed that women with diabetes used more health services and accounted for a higher proportion of health care spending than women without diabetes. Despite this, compliance with guidelines for best practice care for diabetes was suboptimal, although at the time this study was conducted, the situation appeared to be improving. In the 2001-2002 budget, the federal government provided funding for a national diabetes integrated program that provided incentives for GPs to encourage early detection and more effective management of diabetes. These extra payments started in November 2001, and by January 2006, more than 4,000 general practices were registered for these incentives. The system provided for GPs to establish a diabetes register and included additional payments for each patient who had completed an annual cycle of care (ACC). The ACC was a bundle of items including pathology risks (HbA1c, lipids, microalbuminuria) and lifestyle risk factor assessment (BMI, blood pressure, nutrition, smoking, alcohol and physical activity measures) as well as screening for retinopathy and foot problems. Data from the 1946-51 and 1921-26 cohorts indicated that fewer than half the women with diabetes accessed the ACC between 2001 and 2005 (Lowe et al., 2010). Moreover, fewer than 60% of women with diabetes had HbA1c tests annually and microalbuminaria and lipid testing rates were similarly low, although there was a trend for increasing uptake of these services. Uptake of the ACC was more common when women saw their GP more frequently, took more medications, received bulk-billed consultations and who were overweight. However, uptake was not more likely among women with significant comorbid conditions that are commonly associated with diabetes (hypertension, heart disease, stroke). Two possible reasons for this have been suggested. Women and their doctors may be more concerned about the threat to health offered by the comorbid
118
conditions, and care may be primarily directed to these. Alternatively, the same quality of care may have been provided under the umbrella of another comprehensive care item, such as the 75 plus health assessment. ACC items appear to have been widely adopted and are now a mainstream component of primary care, and there is equitable provision of services across all areas, but the rate of completion of care processes is substantially lower than similar items in other comparable countries (e.g. the UK).
Good diabetes care does not simply rely on medical care, but includes self-management practices as well. Self-management can be complex, involving close daily monitoring of the condition and maintenance of self-care behaviours. Women with diabetes must make frequent changes to medications, diet, physical activity and other lifestyle factors, and self-management requires that women are knowledgeable about their condition, its treatment and monitoring. To explore these factors among ALSWH women, a sub-study of women with diabetes in the 1946-51 and 1921-26 cohorts was conducted in 2001, to assess knowledge of diabetes, self-management and health outcomes (Byles et al., 2010). Knowledge of diabetes among the women required improvement: less than 60% of the 1946-51 cohort and 30% of the 1921-26 cohort had heard of a HbA1c test; 72% and 49% of the 1946-51 and 1921-26 cohorts respectively knew the normal range for blood glucose; 71% of the 1946-51 cohort and 76% of the 1921-26 cohort understood the risk of being overweight on health outcomes; and 65% of the 1946-51 cohort and 68% of the 1921-26 cohort understood good control of diabetes. Better knowledge was correlated with better self-management behaviours (in both age groups) and with better health outcomes (among older women). These results indicate that there is an urgent need for diabetes education to improve self-management and ultimately health outcomes for women with diabetes.
9.8. Summary points
Diabetes has a high incidence, which increases with age.
Prevalence and incidence are higher in regional and remote areas, compared to major cities.
Prevalence and incidence is higher among women with lower levels of education, and greater difficulty managing on income.
Diabetes has higher prevalence and incidence among current and ex-smokers in the 1973-78 and 1946-51 cohorts
Diabetes is strongly associated with BMI in all cohorts, and with corresponding associations with physical activity. Small changes in BMI and Physical Activity across the whole population could result in large reductions in the incidence of diabetes.
Diet quality is associated with risk of diabetes including a higher risk with lower zinc intakes, as well as with higher intakes of monosaturated fatty acids, and lower intakes of dietary fibre.
119

There are apparent opportunities to improve the use of Medicare items for diabetes care, and to improve self-care for women with diabetes.
An examination of mean MBS and PBS costs in 2013 indicates that these are higher for women with diabetes than for women without diabetes in all three cohorts. MBS costs may include items under the annual cycle of care (ACC). However, differences in MBS costs for women with and without diabetes in each cohort were 12% (1973-78), 30% (1946-51) and 7% (1921-26), which are relatively modest in comparison to the differences in PBS costs. In particular, PBS costs for women in the 1973-78 cohort with diabetes are triple that of women without diabetes and women with diabetes in the 1946-51 cohort have PBS costs which are twice that of women without diabetes.
120

10. Mental health
Mental health is an essential component of overall health. The World Health Organisation (WHO) constitution states: “Health is a state of complete physical, mental and social well-being and not merely the absence of disease or infirmity.” An important consequence of this definition is that mental health is described as more than the absence of mental disorders or disabilities.
Mental health is a state of well-being in which an individual realizes his or her own abilities, can cope with the normal stresses of life, can work productively and is able to make a contribution to his or her community. In this positive sense, mental health is the foundation for individual well-being and the effective functioning of a community. (WHO Mental Health Fact Sheet September 2010 http://www.who.int/mediacentre/factsheets/fs220/en/index.html) The ALSWH 2013 major report “Mental Health: Findings from the Australian Longitudinal Study on Women’s Health” used data from the cohorts born 1973-78, 1946-51 and 1921-26 to explore patterns of mental health among Australian women as well as their use of mental health services. It included analyses of factors associated with poor mental health as well as specific areas such as perinatal mental health, interpersonal relationships and mental health, and comorbidity of physical and mental health.
Assessing psychological distress among women in ALSWH: At each survey women are asked to complete a series of questions to measure their health-related quality of life with a commonly used scale known as the SF-36 (Ware et al., 1993). One of the subscales of the SF-36 is the five-item mental health index (referred to as the SF-36 MHI). The five items are used to generate a score of 0 to 100 with higher scores indicating better mental health (Rumph, 2001). We applied the commonly used cut-point of ≤ 52 to categorise women as having psychological distress (Holmes, 1998; Silveira, 2005). Figure 10-56 below shows the prevalence of psychological distress by age. The circles indicate the prevalence estimate and the vertical lines indicate the reliability of the estimate with 95% confidence intervals. This figure shows that the prevalence of psychological distress was highest amongst young women at Survey 1 and gradually decreased with time in each cohort except at later surveys amongst older women.
121

18 21 24 27 30 33 36 39 42 45 48 51 54 57 60 63 66 69 72 75 78 81 84 87 90
Average age at survey
0
5
10
15
20
25
% M
HI ≤
52
1973-78 cohort 1946-51 cohort 1921-26 cohort
Figure 10-56: Percentage of women with psychological distress (SF-36 MHI ≤52) in the past four weeks, plotted against the average age of women at that survey for Surveys 1 to 6 of the 1973-78 and 1921-26 cohorts and Surveys 1 to 7 of the 1946-51 cohort.
122
Patterns of psychological distress by area of residence showed that women of the 1921-26 cohort who lived in remote or very remote areas reported the least psychological distress (Figure 10-57). There were few regional differences in psychological distress in the 1973-78 cohort and the 1946-51 cohort, although reported poor mental health fluctuated somewhat among areas of residence in these two cohorts.
Remote/Very RemoteOuter RegionalInner RegionalMajor CitiesRA at S1
18 21 24 27 30 33 36 39 42 45 48 51 54 57 60 63 66 69 72 75 78 81 84 87 90
Average age at survey
0
5
10
15
20
25
% M
HI ≤
52
1973-78 cohort 1946-51 cohort 1921-26 cohort
Figure 10-57: Prevalence of psychological distress (SF-36 MHI ≤52) for Surveys 1 to 6 of the 1973-78 and 1921-26 cohorts and Surveys 1 to 7 of the 1946-51 cohort by area of residence
123

Level of education is associated with mental health – across all three cohorts, women with less than a Year 12 education had poorer mental health than women with higher levels of education (Figure 10-58). In the 1973-78 and 1946-51 cohorts, women with a university education reported lower psychological distress than their peers. This pattern is not so clear in the 1921-26 cohort, probably because small numbers of women in that cohort achieved a university education.
UniversityTrade/certYear 12Less than Y12Education at S1
18 21 24 27 30 33 36 39 42 45 48 51 54 57 60 63 66 69 72 75 78 81 84 87 90
Average age at survey
0
5
10
15
20
25
% M
HI ≤
52
1973-78 cohort 1946-51 cohort 1921-26 cohort
Figure 10-58: Prevalence of psychological distress (SF-36 MHI ≤52) for Surveys 1 to 6 of the 1973-78 and 1921-26 cohorts and Surveys 1 to 7 of the 1946-51 cohort by education.
124

Similarly, women who found it easy, not too bad or difficult sometimes to manage on their income were less likely to report psychological distress than women who found managing on their income difficult always or impossible (Figure 10-59).
It is easyNot too badDifficult sometimesDifficult alwaysImpossibleMOI at S1
18 21 24 27 30 33 36 39 42 45 48 51 54 57 60 63 66 69 72 75 78 81 84 87 90
Average age at survey
0
5
10
15
20
25
30
35
% M
HI ≤
52
1973-78 cohort 1946-51 cohort 1921-26 cohort
Figure 10-59: Prevalence of psychological distress (SF-36 MHI ≤52) for Surveys 1 to 6 of the 1973-78, Surveys 1 to 7 of the 1946-51 cohort and Surveys 1 to 6 of the 1921-26 cohort by managing on income.
125
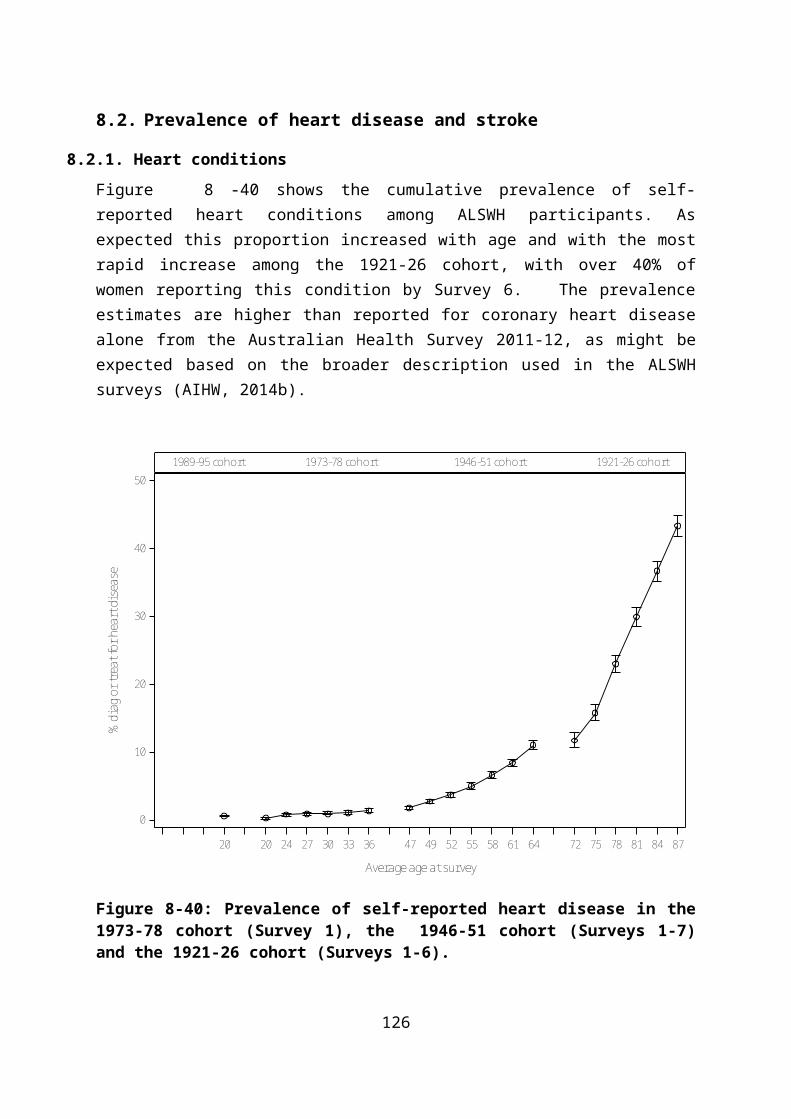
Women in the 1973-78 and 1946-51 cohorts who were categorised as obese reported poorer mental health than women in the healthy weight range (Figure 10-60). Paradoxically, women in the 1921-26 cohort who were underweight were more likely to report poor mental health.
ObeseOverweightHealthy weightUnderweightBMI at S1
18 21 24 27 30 33 36 39 42 45 48 51 54 57 60 63 66 69 72 75 78 81 84 87 90
Average age at survey
0
5
10
15
20
25
% M
HI ≤
52
1973-78 cohort 1946-51 cohort 1921-26 cohort
Figure 10-60: Prevalence of psychological distress (SF-36 MHI ≤52) for Surveys 1 to 6 of the 1973-78 and 1921-26 cohorts and Surveys 1 to 7 of the 1946-51 cohort by BMI category.
126

Previous ALSWH research has reported that there is a strong association between smoking and poor mental health, particularly in the 1973-78 cohort (Leung et al., 2011). Figure 10-61 illustrates this pattern and also shows that there is a consistent relationship between poor mental health and smoking in the two older cohorts.
Current smokerEx-smokerNever smokedSmoking at S1
18 21 24 27 30 33 36 39 42 45 48 51 54 57 60 63 66 69 72 75 78 81 84 87 90
Average age at survey
0
5
10
15
20
25
% M
HI ≤
52
1973-78 cohort 1946-51 cohort 1921-26 cohort
Figure 10-61: Prevalence of psychological distress (SF-36 MHI ≤52) for Surveys 1 to 6 of the 1973-78 and 1921-26 cohorts and Surveys 1 to 7 of the 1946-51 cohort by smoking status.
127
There is good evidence that exercise has at least transient positive effects on mood, although the evidence on its capacity to alleviate severe mental illness is less convincing. ALSWH researchers reported that in the 1946-51 cohort, there was a clear relationship between increasing physical activity and decreasing depressive symptoms in middle-aged women, independent of pre-existing physical and psychological health (Brown et al., 2005). Figure 10-62 illustrates the consistency of the benefits of physical activity in all three cohorts.
HighModerateLowInactivePA at S2
18 21 24 27 30 33 36 39 42 45 48 51 54 57 60 63 66 69 72 75 78 81 84 87 90
Average age at survey
0
5
10
15
20
25
30
% M
HI ≤
52
1973-78 cohort 1946-51 cohort 1921-26 cohort
Figure 10-62: Prevalence of psychological distress (SF-36 MHI ≤52) for Surveys 1 to 6 of the 1973-78 and 1921-26 cohorts and Surveys 1 to 7 of the 1946-51 cohort by physical activity.
128

Women with psychological distress report more general practice visits than women with no psychological distress (Figure 10-63).
EverNever
18 21 24 27 30 33 36 39 42 45 48 51 54 57 60 63 66 69 72 75 78 81 84 87 90
Average age
0
5
10
15
20
Mea
n Vi
sits
1973-78 cohort 1946-51 cohort 1921-26 cohort
Figure 10-63: Mean number of general practice visits for women who have ever reported psychological distress (at any survey) and women who have never reported psychological distress, Surveys 1-6 (1973-78 cohort), Surveys 1-7 (1946-51 cohort), and Surveys 1-6 (1921-26 cohort).
129
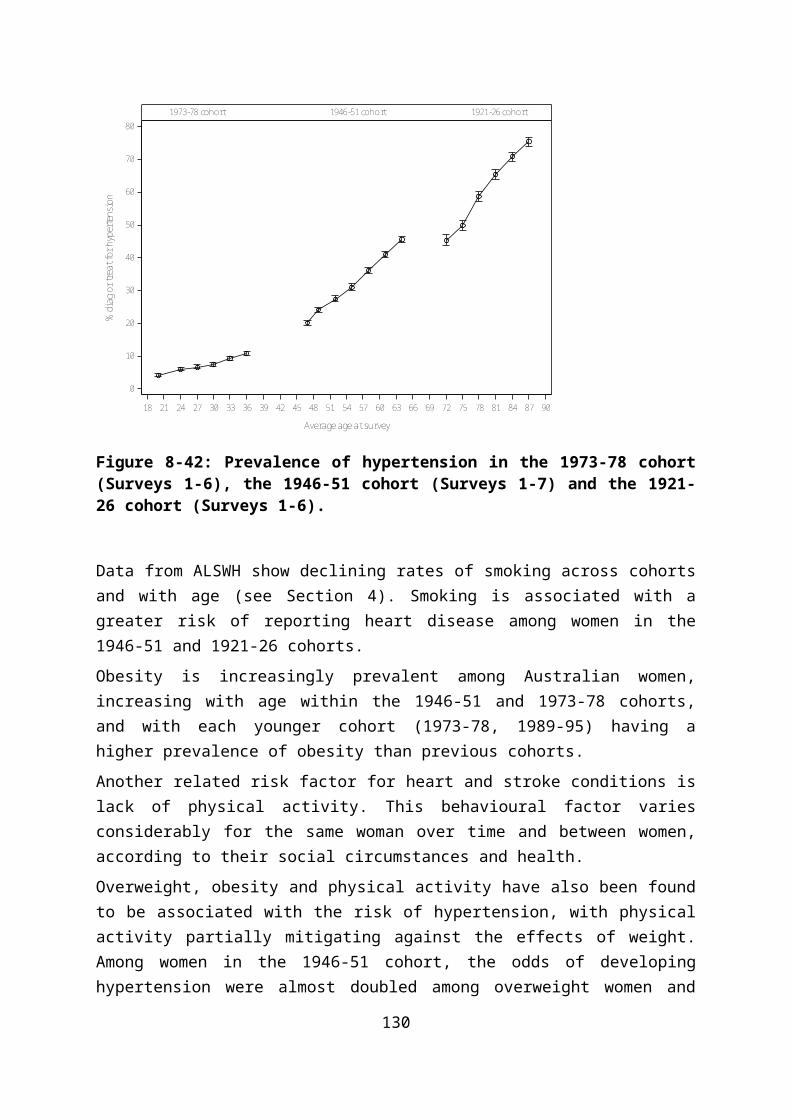
Costs associated with the uptake of Medicare items are shown in Table 10-9. Women in the 1973-78 and 1946-51 cohorts who are psychologically distressed cost a fifth more on MBS than women who are not distressed. Further analyses conducted as part of the ALSWH Major Report, “Mental Health: Findings from the Australian Longitudinal Study on Women’s Health” in 2013 indicate a steady increase in the use of Better Access Scheme (BAS) Medicare items since the scheme’s introduction in 2006. By December 2010, around 18% of the 1973-78 cohort, 10% of the 1946-51 cohort, and 3% of the 1921-26 cohort had claimed for at least one BAS Medicare item.
Table 10-9 Comparison of costs for MBS and PBS uptake in women who have never reported psychological distress and those who have reported psychological distress, mean cost ($) 2013 (the most recent year that data are available).
1973-78 cohort 1946-51 cohort 1921-26 cohort
MBS PBS MBS PBS MBS PBS
Never 1,392 186 1,628 373 2,802 1,411
Ever 1,685 373 2,016 914 2,947 1,806
Women who have ever reported psychological distress use considerably more PBS resources than women with no psychological distress. In the 1973-78 and 1946-51 cohorts, PBS costs for women with poor mental health are almost three times those of women who have never indicated that they are psychologically distressed.
130

A summary of the key messages reported in the ALSWH Major Report H, “Mental Health: Findings from the Australian Longitudinal Study on Women’s Health” in 2013 is reproduced below:
Summary points
Women with psychological distress report more general practice visits than women with no psychological distress and MBS costs for women with psychological distress. Women in the 1973-78 and 1946-51 cohorts who are psychologically distressed cost a fifth more on MBS than women who are not distressed.
In the 1973-78 and 1946-51 cohorts, PBS costs for women with poor mental health are almost three times those of women who have never indicated that they are psychologically distressed.
ALSWH data suggest that a variety of socio-demographic factors impact on the mental health of women over time. For example, lower education and not managing on available income were associated with greater risk of psychological distress for all cohorts.
A variety of lifestyle factors impact on the mental health of women over time. For example, smoking was implicated in mental health issues; poor mental health was associated with subsequent smoking and smoking was associated with subsequent poor mental health.
Mental and physical health interact and affect each other in reciprocal ways.
131
11. Comorbidities
11.1. Multimorbidity and Comorbidity
Multimorbidity (the coexistence of multiple diseases in the same individual) and comorbidity (the coexistence of chronic conditions within the context of an index condition) are important measures of chronic disease. The number of coexistent conditions has been shown to be associated with many important health outcomes such as quality of life, activities of daily living, health service utilization, and mortality (Tooth et al., 2008).
A multimorbidity score can be created by adding up the number of conditions reported on each survey. The following three figures illustrate the increasing multimorbidity experienced by the women as they age. The conditions selected for each cohort are represented in this report, however because some chronic conditions vary according to age, each figure considers conditions relevant for the particular cohort. Figure 11-64 which looks at the 1973-78 cohort, considers asthma, heart disease and diabetes and the number of women who have none, one, two or all of these conditions. Most of the women have no chronic condition, but over time the percentage with one condition increases from about 25% to about 35%. Next, Figure 11-65 considers the 1946-51 cohort and includes asthma, heart disease, diabetes, arthritis, stroke and breast cancer. By the time the women are around 64, the majority have from one to more than four conditions (about 65%). Finally, Figure 11-66 shows the increasing multimorbidity present with age, with about 90% of the women at an average age of 87 reporting one to more than four conditions.
132

3210no. conditions
20 24 27 30 33 36
Average age at survey
0
20
40
60
80
100
%1973-78 cohort
Figure 11-64: Number of chronic conditions (asthma, heart disease and diabetes) reported by women in the 1973-78 cohort at each survey by average age at that survey.
133

4+3210no. conditions
47 49 52 55 58 61 64
Average age at survey
0
20
40
60
80
100
%1946-51 cohort
Figure 11-65: Number of chronic conditions (asthma, heart disease, diabetes, arthritis, stroke and breast cancer) reported by women in the 1946-51 cohort at each survey by average age at that survey.
134

4+3210no. conditions
72 75 78 81 84 87
Average age at survey
0
20
40
60
80
100
%1921-26 cohort
Figure 11-66: Number of chronic conditions (asthma, heart disease, diabetes, arthritis, and stroke) reported by women in the 1921-26 cohort at each survey by average age at that survey.
135

The following figures examine the number of chronic conditions reported by each of the three cohorts by area of residence, difficulty managing on income, BMI, smoking and physical activity.
11.2. Area of residence
Few differences were apparent among the women in each of the three cohorts by area of residence.
0 20 40 60 80 100
Percent
Remote/Very Remote
Outer Regiona l
Inner Regional
Major Cities
RA a
t S1
3210No. of conditions
Figure 11-67: Number of conditions reported at Survey 6 by women in the 1973-78 cohort according to remoteness area at Survey 1.
136
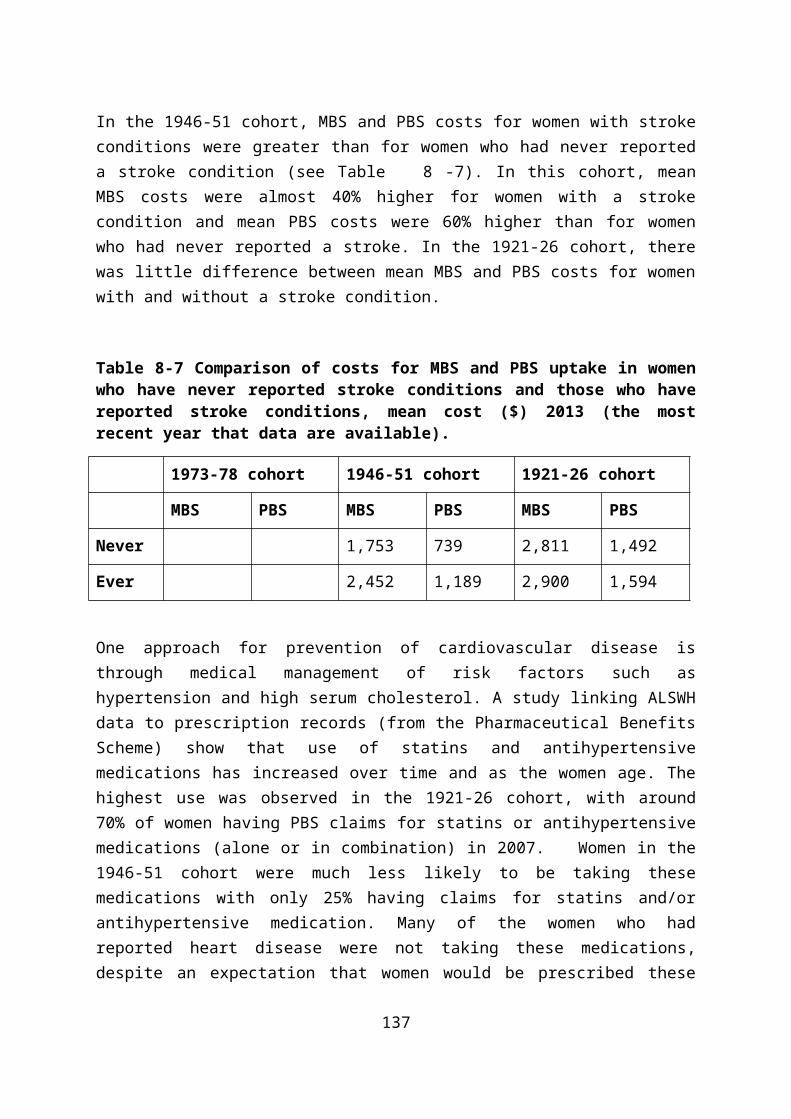
0 20 40 60 80 100
Percent
Remote/Very Remote
Outer Regiona l
Inner Regional
Major Cities
RA a
t S1
4+3210No. of conditions
Figure 11-68: Number of conditions reported at Survey 7 by women in the 1946-51 cohort according to remoteness area at Survey 1.
137
0 20 40 60 80 100
Percent
Remote/Very Remote
Outer Regiona l
Inner Regional
Major Cities
RA a
t S1
4+3210No. of conditions
Figure 11-69: Number of conditions reported at Survey 6 by women in the 1921-26 cohort according to remoteness area at Survey 1.
138

11.3. Difficulty managing on income
For all cohorts, more chronic conditions were associated with finding it impossible or difficult always to manage on their income.
0 20 40 60 80 100
Percent
It i s easy
Not too bad
Diffi cult sometimes
Diffi cult a lways
Imposs ible
Man
age
on in
com
e at
S1
3210No. of conditions
Figure 11-70: Number of conditions reported at Survey 6 by women in the 1973-78 cohort according to manage on income at Survey 1.
139

0 20 40 60 80 100
Percent
It i s easy
Not too bad
Diffi cult sometimes
Diffi cult a lways
Imposs ible
Man
age
on in
com
e at
S1
4+3210No. of conditions
Figure 11-71: Number of conditions reported at Survey 7 by women in the 1946-51 cohort according to manage on income at Survey 1.
140

0 20 40 60 80 100
Percent
It i s easy
Not too bad
Diffi cult sometimes
Diffi cult a lways
Imposs ible
Man
age
on in
com
e at
S1
4+3210No. of conditions
Figure 11-72: Number of conditions reported at Survey 6 by women in the 1921-26 cohort according to manage on income at Survey 1.
141
11.4. Body mass index (BMI)
Higher BMI (in the overweight or obese category) was associated with more conditions in the 1973-78 cohort, with almost half of the women who were obese reporting one or more conditions.
0 20 40 60 80 100
Percent
Obese
Overweight
Hea lthy weight
Underweight
BMI a
t S1
3210No. of conditions
Figure 11-73: Number of conditions reported at Survey 6 by women in the 1973-78 cohort according to BMI at Survey 1.
142
A similar pattern was apparent in the 1946-51 cohort in which 95% of obese women had one or more conditions. Almost 10% of the obese women reported having four or more chronic conditions.
0 20 40 60 80 100
Percent
Obese
Overweight
Hea lthy weight
Underweight
BMI a
t S1
4+3210No. of conditions
Figure 11-74: Number of conditions reported at Survey 7 by women in the 1946-51 cohort according to BMI at Survey 1.
143

Multimorbidity increases with age and this is evident in the 1921-26 cohort in which more than 80% of the women in any BMI category had at least one chronic condition.
0 20 40 60 80 100
Percent
Obese
Overweight
Hea lthy weight
Underweight
BMI a
t S1
4+3210No. of conditions
Figure 11-75: Number of conditions reported at Survey 6 by women in the 1921-26 cohort according to BMI at Survey 1.
144

11.5. Smoking
Small differences were apparent among the women in the 1973-78 and 1946-51 cohorts, with those who had never smoked slightly more likely to report no chronic conditions.
0 20 40 60 80 100
Percent
Current smoker
Ex-smoker
Never smoked
Smok
ing
at S
1
3210No. of conditions
Figure 11-76: Number of conditions reported at Survey 6 by women in the 1921-26 cohort according to smoking status at Survey 1.
145

0 20 40 60 80 100
Percent
Current smoker
Ex-smoker
Never smoked
Smok
ing
at S
1
4+3210No. of conditions
Figure 11-77: Number of conditions reported at Survey 7 by women in the 1946-51 cohort according to smoking status at Survey 1.
146
0 20 40 60 80 100
Percent
Current smoker
Ex-smoker
Never smoked
Smok
ing
at S
1
4+3210No. of conditions
Figure 11-78: Number of conditions reported at Survey 6 by women in the 1921-26 cohort according to smoking status at Survey 1.
147

11.6. Physical activity
Small differences were apparent in the 1973-78 cohort between women who were inactive, or who reported low, moderate or high levels of activity. In the 1946-51 and 1921-26 cohorts, women who reported moderate or high levels of physical activity had fewer chronic conditions than those who were inactive or who had low levels of physical activity. (Physical activity questions were first asked at Survey 2).
0 20 40 60 80 100
Percent
High
Moderate
Low
Inactive
Phys
ical
acti
vity
at S
2
3210No. of conditions
Figure 11-79: Number of conditions reported at Survey 6 by women in the 1973-78 cohort according to physical activity status at Survey 2.
148

0 20 40 60 80 100
Percent
High
Moderate
Low
Inactive
Phys
ical
acti
vity
at S
2
4+3210No. of conditions
Figure 11-80: Number of conditions reported at Survey 7 by women in the 1946-51 cohort according to physical activity status at Survey 2.
149

0 20 40 60 80 100
Percent
High
Moderate
Low
Inactive
Phys
ical
acti
vity
at S
2
4+3210No. of conditions
Figure 11-81: Number of conditions reported at Survey 6 by women in the 1921-26 cohort according to physical activity status at Survey 2.
150

11.7. Health service use
For women in the 1946-51 and 1921-26 cohorts, as the number of chronic conditions reported by each woman increased, there was a corresponding increase in the mean number of GP visits.
4+3210No. of conditions
48 51 54 57 60 63
Average age
0
5
10
15
20
Mea
n Vi
sits
1946-51 cohort
Figure 11-82: Mean number of general practice visits since 1996 for women in the 1946-51 cohort by number of chronic conditions reported at Survey 7.
151

4+3210No. of conditions
72 75 78 81 84 87
Average age
0
5
10
15
20
Mea
n Vi
sits
1921-26 cohort
Figure 11-83: Mean number of general practice visits since 1996 for women in the 1921-26 cohort by number of chronic conditions reported at Survey 7.
152
11.8. GP Chronic Disease Management Plan
A chronic medical condition is one that has been, or is likely to be, present for at least 6 months or is terminal. Anyone with a chronic or terminal medical condition can have a GP Management Plan in place.
This plan of action is agreed between the patient and their GP and includes:
Identification of specific health care needs sets out the services to be provided by the GP and lists the actions that the patient needs to take
Table 11-10 illustrates a comparison of average annual GP visits and mean annual costs between 2010 and 2013 for women who are accessing Medicare Benefits under a Chronic Disease Management Plan.
Table 11-10 Comparison of costs for Chronic Disease Management (MBS items 721 to 732) uptake in women who have reported 1, 2, 3 or 4+ conditions compared to women with no conditions; number of women in each group, average annual number of general practice visits and mean annual cost ($) 2010-2013
Conditions 1973-78 cohort
1946-51 cohort 1921-26 cohort
N Mean Visits
Mean $
N Mean Visits
Mean $
N Mean Visits
Mean $
None 4,818 0.05 5.38 2,577 0.12 12.84 382 0.63 63.71
One 2,398 0.1 10.77 3,379 0.33 33.95 890 0.82 81.31
Two 98 0.4 39.77 1,836 0.56 57.00 804 0.96 95.71
Three 49 0.1 11.46 544 0.87 86.23 344 1.19 115.00
Four+ 197 1.23 120.96 101 1.17 116.92
153

11.9. Summary points
Managing on their income was more difficult for women who had multiple chronic conditions.
The relationship between obesity and chronic conditions was clear: women who were obese or overweight had more conditions than women who were normal weight.
Moderate or high levels of physical activity were associated with fewer chronic conditions.
Women of the 1946-51 cohort who were on a Chronic Disease Management Plan and who had four or more chronic conditions cost on average 10 times more than women with no conditions. For the 1921-26 cohort, costs were twice as much.
154

12. Appendix A: Cohort AttritionCohort attrition
The 1973-78 cohort has been a highly mobile age group, with the main reason for non-response being inability to contact the women, despite using all possible methods of maintaining contact. Women in their twenties are characterised by high levels of mobility, change of surnames on marriage, often not having telephone listings, not being registered to vote, and making extended trips outside Australia for work, education, or recreation. Despite these losses, there is no serious bias in estimates of associations between risk factors and health outcomes in longitudinal models (Powers and Loxton, 2010).
Table 12-11 Participation and retention across surveys between 1996 and 2013 for women from the 1973-1978, 1946-1951 and 1921-1926 cohorts
Survey 2 Survey 3 Survey 4 Survey 5 Survey 6 Survey 71973-1978 cohort: 14,247 women aged 18-23 years at Survey 1 (1996)Age (years) 22-27 25-30 28-33 31-36 34-39 -
Deceased* 22 33 49 57 76 -
Non-respondents 4537 5133 5053 5990 6161 -
Respondents 9688 9081 9145 8200 8010 -1946-51 cohort: 13,715 women aged 45-50 years at Survey 1 (1996)Age (years) 47-52 50-55 53-58 56-61 59-64 62-67
Deceased* 50 119 216 327 472 646
Non-respondents 1327 2370 2594 2750 3232 3918
Respondents 12338 11226 10905 10638 10011 91511921-26 cohort: 12,432 women aged 70-75 years at Survey 1 (1996)Age (years) 73-78 76-81 79-84 82-87 85-90 -
Deceased* 551 1240 2290 3622 5276 -
Non-respondents 1447 2545 2984 3250 3101 -
Respondents 10434 8647 7158 5560 4055 -*numbers for deceased are cumulative over surveys
Retention has been much higher among the 1946-51 cohort of women. The major reasons for non-response among the 1946-51 cohort has been that the research team has been unable to contact the women, in addition to the non-return of questionnaires by women who could be contacted.

Among the 1921-26 cohort, the major reason for non-response has been non-return of the questionnaire, although some participants could not be contacted. Non-respondent women tended to report poorer self-rated health at Survey 1 than respondents. The effects of these losses have been evaluated in terms of losses due to death and non-death. Non-death losses are potentially a greater source of bias than effects of death, however the effects of this bias are small (Brilleman et al., 2010).

13. Appendix B: Survey Questions – Chronic ConditionsDIABETES1973-78 cohort
Survey Questions Response options
1 Q15 (a): Have you ever been told by a doctor you have diabetes (high blood sugar)? Yes/No
2 Q12 (a): Have you ever been told by a doctor that you have gestational diabetes (during pregnancy)?
Q12 (b): Have you ever been told by a doctor that you have insulin dependent (Type I) diabetes?
Q12 (c): Have you ever been told by a doctor that you have non-insulin dependent (Type II) diabetes?
Yes, in the last 4 yearsYes, more than 4 years ago
Yes, in the last 4 yearsYes, more than 4 years ago
Yes, in the last 4 yearsYes, more than 4 years ago
3 Q12 (a): In the last 3 years have you been treated for gestational diabetes (during pregnancy)?
Q12 (b): In the last 3 years have you been treated for insulin dependent (Type I) diabetes?
Q12 (c): In the last 3 years have you been treated for non-insulin dependent (Type II) diabetes?
Yes, in the last 3 years
Yes, in the last 3 years
Yes, in the last 3 years
4 Q12 (a): In the last 3 years have you been treated for gestational diabetes (during pregnancy)?
Q12 (b): In the last 3 years have you been treated for insulin dependent (Type I) diabetes?
Q12 (c): In the last 3 years have you been treated for non-insulin dependent (Type II) diabetes?
Yes, in the last 3 years
Yes, in the last 3 years
Yes, in the last 3 years
5 Q12 (a): In the last 3 years have you been treated for insulin dependent (Type 1) diabetes?
Q12 (b): In the last 3 years have you been diagnosed or treated for non-insulin dependent (Type 2) diabetes?
Yes, in the last 3 years
Yes, in the last 3 years
6 Q12 (a): In the last 3 years have you been treated for insulin dependent (Type I) diabetes?Q12 (b): In the last 3 years have you been diagnosed or treated for non-insulin dependent (Type 2) diabetes?
Yes, in the last 3 yearsYes, in the last 3 years

1946-51 cohort
Survey Question Response options
1 Q15 (a): Have you ever been told by a doctor you have diabetes (high blood sugar)? Yes/No2 Q20: Have you ever been told by a doctor you have insulin dependent (type 1) diabetes?
Q20: Have you ever been told by a doctor you have non-insulin dependent (type 2) diabetes?
Yes, in the last 2 yearsYes, more than 2 years ago
Yes in the last 2 yearsYes, more than 2 years ago
3 Q35 (b): In the past 3 years, have you been diagnosed or treated for insulin dependent (type 1) diabetes?
Q35 (c): In the past 3 years, have you been diagnosed or treated for non- insulin dependent (type 2) diabetes?
Yes, in the last 3 years
Yes, in the last 3 years
4 Q32 (c): In the past 3 years, have you been diagnosed or treated for diabetes (high blood sugar)? Yes, in the last 3 years5 Q38 (a): In the past 3 years, have you been diagnosed or treated for diabetes (high blood sugar)? Yes, in the last 3 years6 Q38 (a): In the past 3 years, have you been diagnosed or treated for diabetes (high blood sugar)? Yes, in the past 3 years7 Q32 (a): In the past 3 years, have you been diagnosed or treated for diabetes (high blood sugar)? Yes, in the past 3 years
1921-26 cohort
Survey Question Response options1 Q16 (a): Have you ever been told by a doctor you have diabetes (high blood sugar)? Yes/No2 Q1 (b): In the last 3 years, have you been told by a doctor that you have diabetes (high blood sugar)? Yes - in the last 3 years3 Q1 (g): In the last 3 years, have you been diagnosed or treated for diabetes (high blood sugar)? Yes4 Q1 (i): In the last 3 years, have you been diagnosed or treated for diabetes (high blood sugar)? Yes5 Q1 (h): In the last 3 years, have you been diagnosed or treated for diabetes (high blood sugar)? Yes6 Q1 (j): In the last 3 years, have you been diagnosed or treated for diabetes (high blood sugar)? Yes

HEART DISEASE AND STROKE
1973-78 cohort
Survey
Questions Response options
1 Q15 (b): Have you ever been told by a doctor you have heart disease?Q15 (c): Have you ever been told by a doctor you have hypertension (high blood pressure)?
Yes/NoYes/No
2 Q12 (d): Have you ever been told by a doctor that you have heart disease?
Q12 (e): Have you ever been told by a doctor that you have hypertension (high blood pressure) during pregnancy?
Q12 (f): Have you ever been told by a doctor that you have hypertension (high blood pressure) other than during pregnancy?
Yes, in the last 4 yearsYes, more than 4 years ago
Yes, in the last 4 yearsYes, more than 4 years ago
Yes, in the last 4 yearsYes, more than 4 years ago
3 Q12 (d): In the last 3 years, have you been diagnosed or treated for heart disease?
Q12 (e): In the last 3 years, have you been diagnosed or treated for hypertension (high blood pressure) during pregnancy?
Q12 (f): In the last 3 years, have you been diagnosed or treated for hypertension (high blood pressure) other than during pregnancy?
Yes, in the last 3 years
Yes, in the last 3 years
Yes, in the last 3 years
4 Q12 (d): In the last 3 years, have you been diagnosed or treated for heart disease?
Q12 (e): In the last 3 years, have you been diagnosed or treated for hypertension (high blood pressure) during pregnancy?
Q12 (f): In the last 3 years, have you been diagnosed or treated for hypertension (high blood pressure) other than during pregnancy?
Yes, in the last 3 years
Yes, in the last 3 years
Yes, in the last 3 years
5 Q12 (c): In the last 3 years, have you been diagnosed or treated for heart disease?Q12 (d): In the last 3 years, have you been diagnosed or treated for hypertension (high blood pressure)?
Yes, in the last 3 yearsYes, in the last 3 years
6 Q12 (c): In the last 3 years, have you been diagnosed or treated for heart disease? Yes, in the last 3 years

Q12 (d): In the last 3 years, have you been diagnosed or treated for hypertension (high blood pressure)? Yes, in the last 3 years
1946-51 cohort
Survey
Questions Response options
1 Q15 (b): Have you ever been told by a doctor you have heart disease?Q15 (c): Have you ever been told by a doctor you have hypertension (high blood pressure)?Q15 (d): Have you ever been told by a doctor you have stroke?
Yes/NoYes/NoYes/No
2 Q20: Have you ever been told by a doctor you have heart disease?
Q20: Have you ever been told by a doctor you have hypertension (high blood pressure)?
Q20: Have you ever been told by a doctor you have stroke?
Yes in the last 2 yearsYes, more than 2 years ago
Yes in the last 2 yearsYes, more than 2 years ago
Yes in the last 2 yearsYes, more than 2 years ago
3 Q35 (e): In the past 3 years, have you been diagnosed or treated for heart disease (including heart attack, angina)?Q35 (f): In the past 3 years, have you been diagnosed or treated for hypertension (high blood pressure)?Q35 (g): In the past 3 years, have you been diagnosed or treated for stroke?
Yes, in the past 3 yearsYes, in the past 3 yearsYes, in the past 3 years
4 Q32 (d): In the past 3 years, have you been diagnosed or treated for heart disease (including heart attack, angina)?Q32 (e): In the past 3 years, have you been diagnosed or treated for hypertension (high blood pressure)?Q32 (f): In the past 3 years, have you been diagnosed or treated for stroke?
Yes, in the past 3 yearsYes, in the past 3 yearsYes, in the past 3 years
5 Q38 (f): In the past 3 years, have you been diagnosed or treated for heart disease (including heart attack, angina)?Q38 (g): In the past 3 years, have you been diagnosed or treated for hypertension (high blood pressure)?Q38 (h): In the past 3 years, have you been diagnosed or treated for stroke?
Yes, in the past 3 yearsYes, in the past 3 yearsYes, in the past 3 years
6 Q38 (f): In the past 3 years, have you been diagnosed or treated for heart disease (including heart attack, angina)?Q38 (g): In the past 3 years, have you been diagnosed or treated for thrombosis (a blood clot)?Q38 (g): In the past 3 years, have you been diagnosed or treated for hypertension (high blood pressure)?Q38 (h): In the past 3 years, have you been diagnosed or treated for stroke?
Yes, in the past 3 yearsYes, in the past 3 yearsYes, in the past 3 yearsYes, in the past 3 years
7 Q32 (i): In the past 3 years, have you been diagnosed or treated for heart disease (including heart attack, angina)?Q32 (j): In the past 3 years, have you been diagnosed or treated for thrombosis (a blood clot)?
Yes, in the past 3 yearsYes, in the past 3 years
Q32 (k): In the past 3 years, have you been diagnosed or treated for hypertension (high blood pressure)?Q32 (l): In the past 3 years, have you been diagnosed or treated for stroke?
Yes, in the past 3 yearsYes, in the past 3 years
1921-26 cohort
Survey Questions Response optionsSurvey 1
Q16 (b): Have you ever been told by a doctor you have heart disease?Q16 (c): Have you ever been told by a doctor you have hypertension (high blood pressure)?Q16 (d): Have you ever been told by a doctor you have stroke?
Yes/NoYes/No Yes/No
2 Q1 (c): In the last 3 years have you been told by a doctor that you have heart disease?Q1 (c): In the last 3 years have you been told by a doctor that you have hypertension (high blood pressure)?Q1 (c): In the last 3 years have you been told by a doctor that you have stroke?Q1 (f): In the last 3 years have you been told by a doctor that you have thrombosis?
Yes – in the last 3 yearsYes – in the last 3 yearsYes – in the last 3 yearsYes – in the last 3 years
3 Q1 (a): In the last 3 years have you been diagnosed or treated for hypertension (high blood pressure)?Q1 (d): In the last 3 years have you been diagnosed or treated for angina?Q1 (e): In the last 3 years have you been diagnosed or treated for heart disease?Q1 (f): In the last 3 years have you been diagnosed or treated for other heart problems?Q1 (j): In the last 3 years have you been diagnosed or treated for stroke?
YesYesYesYesYes
4 Q1 (a): In the last 3 years have you been diagnosed or treated for hypertension (high blood pressure)?Q1 (f): In the last 3 years have you been diagnosed or treated for angina?Q1 (g): In the last 3 years have you been diagnosed or treated for heart disease?Q1 (h): In the last 3 years have you been diagnosed or treated for other heart problems?Q1 (l): In the last 3 years have you been diagnosed or treated for stroke?
YesYesYesYesYes
5 Q1 (a): In the last 3 years have you been diagnosed or treated for hypertension (high blood pressure)?Q1 (e): In the last 3 years have you been diagnosed or treated for angina?Q1 (f): In the last 3 years have you been diagnosed or treated for heart disease?Q1 (g): In the last 3 years have you been diagnosed or treated for other heart problems?Q1 (k): In the last 3 years have you been diagnosed or treated for stroke?
YesYesYesYesYes
6 Q1 (a): In the last 3 years have you been diagnosed or treated for hypertension (high blood pressure)?Q1 (g): In the last 3 years have you been diagnosed or treated for angina?Q1 (h): In the last 3 years have you been diagnosed or treated for heart disease?Q1 (i): In the last 3 years have you been diagnosed or treated for other heart problems?
YesYesYesYes
Q1 (m): In the last 3 years have you been diagnosed or treated for stroke? Yes
ASTHMA1973-78 cohort
Survey Questions Response options1 Q15 (e): Have you ever been told by a doctor you have asthma? Yes/No2 Q12 (h): Have you ever been told by a doctor that you have asthma? Yes, in the last 4 years
Yes, more than 4 years ago3 Q12 (h): In the last 3 years, have you been diagnosed or treated for asthma? Yes, in the last 3 years4 Q12 (h): In the last 3 years, have you been diagnosed or treated for asthma? Yes, in the last 3 years5 Q12 (f): In the last 3 years, have you been diagnosed or treated for asthma? Yes, in the last 3 years6 Q12 (f): In the last 3 years, have you been diagnosed or treated for asthma? Yes, in the last 3 years
1946-51 cohort
Survey Questions Response options1 Q15 (g): Have you ever been told by a doctor you have asthma? Yes/No2 Q20: Have you ever been told by a doctor that you asthma? Yes, in the last 2 years
Yes, more than 2 years ago3 Q35 (j): In the past 3 years, have you been diagnosed or treated for asthma? Yes, in the past 3 years4 Q32 (i): In the past 3 years, have you been diagnosed or treated for asthma? Yes, in the past 3 years5 Q38 (j): In the past 3 years, have you been diagnosed or treated for asthma? Yes, in the past 3 years6 Q38 (k): In the past 3 years, have you been diagnosed or treated for asthma? Yes, in the past 3 years7 Q32 (s): In the past 3 years, have you been diagnosed or treated for asthma? Yes, in the past 3 years
1921-26 cohort
Survey Questions Response options1 Q16 (g): Have you ever been told by a doctor you have asthma? Yes/No2 Q1 (h): In the last 3 years, have you been told by a doctor that you have asthma? Yes, in the last 3 years3 Q1 (h): In the last 3 years, have you been diagnosed or treated for asthma? Yes4 Q1 (j): In the last 3 years, have you been diagnosed or treated for asthma? Yes

5 Q1 (i): In the last 3 years, have you been diagnosed or treated for asthma? Yes6 Q1 (k): In the last 3 years, have you been diagnosed or treated for asthma? Yes
ARTHRITISQuestions on arthritis were not asked for any cohort at Survey 1. The 1921-26 cohort have been asked about arthritis since Survey 2 (in 1999) and the 1946-51 cohort have been asked about it since Survey 3 (in 2001).
1946-51 cohort
Survey
Questions Response options
3 Q35 (a): In the past 3 years, have you been diagnosed or treated for arthritis/rheumatism? Yes, in the past 3 years4 Q32 (a): In the past 3 years, have you been diagnosed or treated for arthritis/rheumatism? Yes, in the past 3 years5 Q38 (c): In the past 3 years, have you been diagnosed or treated for osteoarthritis?
Q38 (d): In the past 3 years, have you been diagnosed or treated for rheumatoid arthritis?Q38 (e): In the past 3 years, have you been diagnosed or treated for other arthritis?
Yes, in the past 3 yearsYes, in the past 3 yearsYes, in the past 3 years
6 Q38 (c): In the past 3 years, have you been diagnosed or treated for osteoarthritis?Q38 (d): In the past 3 years, have you been diagnosed or treated for rheumatoid arthritis?Q38 (e): In the past 3 years, have you been diagnosed or treated for other arthritis?
Yes, in the past 3 yearsYes, in the past 3 yearsYes, in the past 3 years
7 Q32 (c): In the past 3 years, have you been diagnosed or treated for osteoarthritis?Q32 (d): In the past 3 years, have you been diagnosed or treated for rheumatoid arthritis?Q32 (e): In the past 3 years, have you been diagnosed or treated for other arthritis?
Yes, in the past 3 yearsYes, in the past 3 yearsYes, in the past 3 years
1921-26 cohort
Survey
Questions Response options
2 Q1 (a): In the last 3 years, have you been told by a doctor that you have arthritis (including osteoarthritis, rheumatoid arthritis)?
Yes, in the last 3 years
3 Q1 (b): In the last 3 years, have you been diagnosed or treated for arthritis (including osteoarthritis, rheumatoid arthritis)?
Yes
4 Q1 (b): In the last 3 years, have you been diagnosed or treated for osteoarthritis?Q1 (c): In the last 3 years, have you been diagnosed or treated for rheumatoid arthritis?Q1 (d): In the last 3 years, have you been diagnosed or treated for other arthritis?
YesYesYes

5 Q1 (b): In the last 3 years, have you been diagnosed or treated for osteoarthritis? Yes6 Q1 (b): In the last 3 years, have you been diagnosed or treated for osteoarthritis?
Q1 (c): In the last 3 years, have you been diagnosed or treated for rheumatoid arthritis?Q1 (d): In the last 3 years, have you been diagnosed or treated for other arthritis?
YesYesYes
BREAST CANCERThe 1973-78 cohort have not been asked questions about breast cancer. The 1921-26 cohort ceased to be asked questions about breast cancer after their second survey (in 1999).
1946-51 cohort
Survey
Questions Response options
1 Q15 (j): Have you ever been told by a doctor that you have breast cancer? Yes/No2 Q20: Have you ever been told by a doctor that you have breast cancer? Yes, in the last 2 years
Yes, more than 2 years ago3 Q35 (m): In the past 3 years, have you been diagnosed or treated for breast cancer? Yes, in the past 3 years4 Q32 (l): In the past 3 years, have you been diagnosed or treated for breast cancer? Yes, in the past 3 years5 Q38 (m): In the past 3 years, have you been diagnosed or treated for breast cancer? Yes, in the past 3 years6 Q38 (n): In the past 3 years, have you been diagnosed or treated for breast cancer? Yes, in the past 3 years7 Q32 (v): In the past 3 years, have you been diagnosed or treated for breast cancer? Yes, in the past 3 years
1921-26 cohort
Survey
Questions Response options
1 Q16 (k): Have you ever been told by a doctor you have breast cancer? Yes/No2 Q1 (k): In the last 3 years, have you been told by a doctor that you have breast cancer? Yes, in the last 3 years

14. References
AIHW 2011. Asthma in Australia 2011: with a focus chapter on chronic obstructive pulmonary disease. Asthma series no. 4. Cat. no. ACM 22. Canberra: AIHW.
AIHW 2012a. Breast cancer in Australia: an overview. Cancer series no. 71. Cat. no. CAN 67. Canberra: AIHW.AIHW 2012b. Risk factors contributing to chronic disease. Canberra: AIHW.AIHW 2014a. Cardiovascular disease, diabetes and chronic kidney disease: Australian facts mortality. Cardiovascular, diabetes and chronic kidney
disease series no. 1. Cat. no. CDK 1. Canberra: AIHW.AIHW 2014b. Cardiovascular disease, diabetes and chronic kidney disease: Australian facts: prevalence and incidence. Cardiovascular, diabetes
and chronic kidney disease series no. 2. Cat. no. CDK 2. Canberra: AIHW.ALHAZMI, A., STOJANOVSKI, E., MCEVOY, M., BROWN, W. & GARG, M. L. 2014a. Diet quality score is a predictor of type 2 diabetes risk in women:
the Australian Longitudinal Study on Women's Health. British Journal of Nutrition, 112, 945-51.ALHAZMI, A., STOJANOVSKI, E., MCEVOY, M. & GARG, M. L. 2014b. Macronutrient intake and type 2 diabetes risk in middle-aged Australian
women. Results from the Australian Longitudinal Study on Women's Health. Public Health Nutrition, 17, 1587-94.AUSTRALIAN HEALTH SURVEY. 2012a. First Results, 2011-12 , Asthma [Online]. Canberra: ABS. Available:
http://www.abs.gov.au/ausstats/[email protected]/Lookup/by%20Subject/4338.0~2011-13~Main%20Features~Asthma~15 [Accessed 25 March 2015].
AUSTRALIAN HEALTH SURVEY. 2012b. First Results, 2011-12, Arthritis and osteoporosis [Online]. Canberra: ABS. Available: http://www.abs.gov.au/ausstats/[email protected]/Lookup/by%20Subject/4338.0~2011-13~Main%20Features~Arthritis%20and%20osteoporosis~27 [Accessed 25 March 2015].
BARR, E., MAGLIANO, D., ZIMMET, P., POLKINGHORNE, K., ATKINS, R., DUNSTAN, D., MURRAY, S. & SHAW, J. 2006. AusDiab 2005. The Australian Diabetes, Obesity and Lifestyle Study. Tracking the accelerating epidemic: its causes and outcomes. Melbourne: International Diabetes Institute.
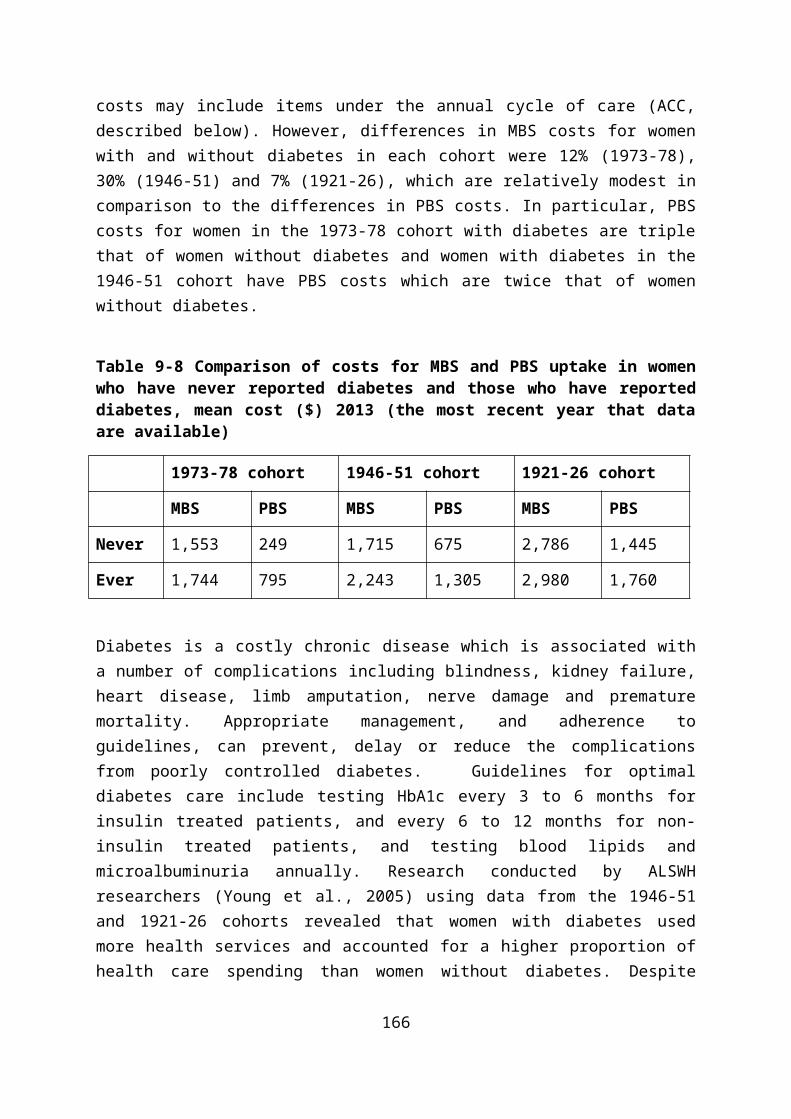
BARR, R. G., WENTOWSKI, C. C., GRODSTEIN, F., SOMERS, S. C., STAMPFER, M. J., SCHWARTZ, J., SPEIZER, F. E. & CAMARGO, C. A., JR. 2004. Prospective study of postmenopausal hormone use and newly diagnosed asthma and chronic obstructive pulmonary disease. Archives of Internal Medicine, 164, 379-86.
BEATTY, L., LEE, C. & WADE, T. D. 2009. A prospective examination of perceived stress as a mediator of the relationship between life-events and QOL following breast cancer. British Journal of Health Psychology, 14, 789-804.
BERECKI-GISOLF, J., MCKENZIE, S. J., DOBSON, A. J., MCFARLANE, A. & MCLAUGHLIN, D. 2013. A history of comorbid depression and anxiety predicts new onset of heart disease. Journal of Behavioral Medicine, 36, 347-53.
BRILLEMAN, S. L., PACHANA, N. A. & DOBSON, A. J. 2010. The impact of attrition on the representativeness of cohort studies of older people. BMC Medical Research Methodology, 10, 71.
BROWN, W., FORD, J. H., BURTON, N. W., MARSHALL, A. L. & DOBSON, A. J. 2005. Prospective study of physical activity and depressive symptoms in middle-aged women. American Journal of Preventive Medicine, 29, 265-272.
BROWN, W. J., HOCKEY, R. & DOBSON, A. 2007. Rose revisited: A "middle road" prevention strategy to reduce noncommunicable chronic disease risk. Bulletin of the World Health Organization, 85, 886-7.
BROWN, W. J., HOCKEY, R. & DOBSON, A. J. 2010. Effects of having a baby on weight gain. American Journal of Preventive Medicine, 38, 163-70.BROWN, W. J., PAVEY, T. & BAUMAN, A. E. 2014. Comparing population attributable risks for heart disease across the adult lifespan in women.
British Journal of Sports Medicine.BYLES, J. E., FRANCIS, J. L., CHOJENTA, C. L. & HUBBARD, I. J. 2015. Long-term survival of older Australian women with a history of stroke. Journal
of Stroke and Cerebrovascular Diseases : The Official Journal of National Stroke Association, 24, 53-60.BYLES, J. E., YOUNG, A. F. & LOWE, J. M. 2010. Women‘s knowledge and self-management of diabetes. In Diabetes in Women (Ed. Eliza I. Swahn).
New York: Nova Science Publishers.CRAIG, B. M., KRAUS, C. K., CHEWNING, B. A. & DAVIS, J. E. 2008. Quality of care for older adults with chronic obstructive pulmonary disease and
asthma based on comparisons to practice guidelines and smoking status. BMC Health Services Research, 8, 144.DE MARCO, R., PESCE, G., MARCON, A., ACCORDINI, S., ANTONICELLI, L., BUGIANI, M., CASALI, L., FERRARI, M., NICOLINI, G., PANICO, M. G.,
PIRINA, P., ZANOLIN, M. E., CERVERI, I. & VERLATO, G. 2013. The coexistence of asthma and chronic obstructive pulmonary disease (COPD): prevalence and risk factors in young, middle-aged and elderly people from the general population. PloS One, 8, e62985.
DIXON, A. E., HOLGUIN, F., SOOD, A., SALOME, C. M., PRATLEY, R. E., BEUTHER, D. A., CELEDON, J. C. & SHORE, S. A. 2010. An official American Thoracic Society Workshop report: obesity and asthma. Proceedings of the American Thoracic Society, 7, 325-35.
DOBSON, A., MCLAUGHLIN, D., ALMEIDA, O., BROWN, W., BYLES, J., FLICKER, L., LEUNG, J., LOPEZ, D., MCCAUL, K. & HANKEY, G. J. 2012. Impact of behavioural risk factors on death within 10 years for women and men in their 70s: absolute risk charts. BMC Public Health, 12, 669.
DOBSON, A., MCLAUGHLIN, D., VAGENAS, D. & WONG, K. Y. 2010. Why are death rates higher in rural areas? Evidence from the Australian Longitudinal Study on Women's Health. Australian and New Zealand Journal of Public Health, 34, 624-8.
DUNLOP, D. D., SEMANIK, P., SONG, J., MANHEIM, L. M., SHIH, V. & CHANG, R. W. 2005. Risk factors for functional decline in older adults with arthritis. Arthritis and Rheumatism, 52, 1274-82.
EBERHARDT, K., LARSSON, B. M. & NIVED, K. 1993. Early rheumatoid arthritis--some social, economical, and psychological aspects. Scandinavian Journal of Rheumatology, 22, 119-23.
EFTEKHARI, P., FORDER, P., MAJEED, T. & BYLES, J. Under review. Impact of asthma on mortality in older women: an Australian cohort study of 10413 women. under review.
GIBSON, P. G., MCDONALD, V. M. & MARKS, G. B. 2010. Asthma in older adults. Lancet, 376, 803-13.GLOZIER, N., TOFLER, G. H., COLQUHOUN, D. M., BUNKER, S. J., CLARKE, D. M., HARE, D. L., HICKIE, I. B., TATOULIS, J., THOMPSON, D. R., WILSON,
A. & BRANAGAN, M. G. 2013. Psychosocial risk factors for coronary heart disease. The Medical Journal of Australia, 199, 179-80.GUILLEMIN, M. 2004. Heart disease and mid-age women: focusing on gender and age. Health Sociology Review, 13, 7-14.HANKEY, G. J. & BLACKER, D. J. 2015. Is it a stroke? BMJ, 350, h56.HARRIS, M. L., LOXTON, D., SIBBRITT, D. W. & BYLES, J. E. 2012. The relative importance of psychosocial factors in arthritis: findings from 10,509
Australian women. Journal of Psychosomatic Research, 73, 251-6.HARRIS, M. L., LOXTON, D., SIBBRITT, D. W. & BYLES, J. E. 2013. The influence of perceived stress on the onset of arthritis in women: findings from
the Australian Longitudinal Study on women's health. Annals of Behavioral Medicine : A Publication of the Society of Behavioral Medicine, 46, 9-18.
HEESCH, K. C., BYLES, J. E. & BROWN, W. J. 2008. Prospective association between physical activity and falls in community-dwelling older women. Journal of Epidemiology and Community Health, 62, 421-6.
HEESCH, K. C., MILLER, Y. D. & BROWN, W. J. 2007. Relationship between physical activity and stiff or painful joints in mid-aged women and older women: a 3-year prospective study. Arthritis Research & Therapy, 9, R34.

HERBER-GAST, G. C., JACKSON, C. A., MISHRA, G. D. & BROWN, W. J. 2013. Self-reported sitting time is not associated with incidence of cardiovascular disease in a population-based cohort of mid-aged women. The International Journal of Behavioral Nutrition and Physical Activity, 10, 55.
HERBER-GAST, G. C. & MISHRA, G. D. 2014. Early severe vasomotor menopausal symptoms are associated with diabetes. Menopause, 21, 855-60.HOLM, M., OMENAAS, E., GISLASON, T., SVANES, C., JOGI, R., NORRMAN, E., JANSON, C. & TOREN, K. 2007. Remission of asthma: a prospective
longitudinal study from northern Europe (RHINE study). The European Respiratory Journal, 30, 62-5.HU, G. 2003. Gender difference in all-cause and cardiovascular mortality related to hyperglycaemia and newly-diagnosed diabetes. Diabetologia,
46, 608-17.HUI, M., DOHERTY, M. & ZHANG, W. 2011. Does smoking protect against osteoarthritis? Meta-analysis of observational studies. Annals of the
Rheumatic Diseases, 70, 1231-7.HUXLEY, R. R., PETERS, S. A., MISHRA, G. D. & WOODWARD, M. 2015. Risk of all-cause mortality and vascular events in women versus men with
type 1 diabetes: a systematic review and meta-analysis. The Lancet. Diabetes & Endocrinology, 3, 198-206.JACKSON, C., HERBER-GAST, G. C. & BROWN, W. 2014a. Joint effects of physical activity and BMI on risk of hypertension in women: a longitudinal
study. Journal of Obesity, 2014, 271532.JACKSON, C. A., JONES, M. & MISHRA, G. D. 2014b. Educational and homeownership inequalities in stroke incidence: a population-based
longitudinal study of mid-aged women. European Journal of Public Health, 24, 231-6.JACKSON, C. A. & MISHRA, G. D. 2013. Depression and risk of stroke in midaged women: a prospective longitudinal study. Stroke; A Journal of
Cerebral Circulation, 44, 1555-60.JACKSON, C. A., MISHRA, G. D., TOOTH, L., BYLES, J. & DOBSON, A. 2015. Moderate agreement between self-reported stroke and hospital-
recorded stroke in two cohorts of Australian women: a validation study. BMC Medical Research Methodology, 15, 7.JAMROZIK, K., MCLAUGHLIN, D., MCCAUL, K., ALMEIDA, O. P., WONG, K. Y., VAGENAS, D. & DOBSON, A. 2011. Women who smoke like men die
like men who smoke: findings from two Australian cohort studies. Tobacco Control, 20, 258-65.JI, J., LIU, X., SUNDQUIST, K. & SUNDQUIST, J. 2011. Survival of cancer in patients with rheumatoid arthritis: a follow-up study in Sweden of
patients hospitalized with rheumatoid arthritis 1 year before diagnosis of cancerRheumatology, 50, 1513-1518.

JORDAN, S., WILSON, A. & DOBSON, A. 2011. Management of heart conditions in older rural and urban Australian women. Internal Medicine Journal, 41, 722-9.
LAWLOR, D. A., TOOTH, L., LEE, C. & DOBSON, A. 2005. A comparison of the association between socioeconomic position and cardiovascular disease risk factors in three age cohorts of Australian women: findings from the Australian Longitudinal Study on Women's Health. Journal of Public Health, 27, 378-87.
LEUNG, J., GARTNER, C., DOBSON, A., LUCKE, J. & HALL, W. 2011. Psychological distress is associated with tobacco smoking and quitting behaviour in the Australian population: Evidence from national cross-sectional surveys Australian and New Zealand Journal of Psychiatry, 45, 170-178.
LEUNG, J., GARTNER, C., HALL, W., LUCKE, J. & DOBSON, A. 2012. A longitudinal study of the bi-directional relationship between tobacco smoking and psychological distress in a community sample of young Australian women. Psychological Medicine, 42, 1273-82.
LEUNG, J., MCKENZIE, S., MARTIN, J., DOBSON, A. & MCLAUGHLIN, D. 2014. Longitudinal patterns of breast cancer screening: mammography, clinical, and breast self-examinations in a rural and urban setting. Women's Health Issues : Official Publication of the Jacobs Institute of Women's Health, 24, e139-46.
LO, T., PARKINSON, L., CUNICH, M. & BYLES, J. 2015. Factors associated with higher healthcare costs in individuals living with arthritis: evidence from the quantile regression approach. Expert Review of Pharmacoeconomics and Outcomes Research, 20, 1-9.
LO , T., PARKINSON, L., CUNICH, M. & BYLES, J. Under review-a. Good agreement between self-reported arthritis and musculoskeletal symptoms in older women.
LO , T., PARKINSON, L., CUNICH, M. & BYLES, J. Under review-b. What are the most commonly used case-definitions of arthritis? A systematic review of international epidemiological studies of arthritis from 2005-2011.
LOWE, J., BYLES, J., DOLJA-GORE, X. & YOUNG, A. 2010. Does systematically organized care improve outcomes for women with diabetes? Journal of Evaluation in Clinical Practice, 16, 887-94.
LUCKE, J., WATERS, B., HOCKEY, R., SPALLEK, M., GIBSON, R., BYLES, J. & DOBSON, A. 2007. Trends in women's risk factors and chronic conditions: findings from the Australian Longitudinal Study on Women's Health. Women's Health, 3, 423-32.
LUSTMAN, P. J. & CLOUSE, R. E. 2005. Depression in diabetic patients: the relationship between mood and glycemic control. Journal of Diabetes and its Complications, 19, 113-22.
MACSALI, F., REAL, F. G., OMENAAS, E. R., BJORGE, L., JANSON, C., FRANKLIN, K. & SVANES, C. 2009. Oral contraception, body mass index, and asthma: a cross-sectional Nordic-Baltic population survey. The Journal of Allergy and Clinical Immunology, 123, 391-7.

MACSALI, F., REAL, F. G., PLANA, E., SUNYER, J., ANTO, J., DRATVA, J., JANSON, C., JARVIS, D., OMENAAS, E. R., ZEMP, E., WJST, M., LEYNAERT, B. & SVANES, C. 2011. Early age at menarche, lung function, and adult asthma. American Journal of Respiratory and Critical Care Medicine, 183, 8-14.
MAJEED, T., FORDER, P., MISHRA, G. & BYLES, J. 2015. Women, work and Illness: Latent Class Analysis of Longitudinal data for 11,551 Middle Age Women. Journal of Women's Health, in press.
MCDERMOTT, L., DOBSON, A. & OWEN, N. 2009. Determinants of continuity and change over 10 years in young women's smoking. Addiction, 104, 478-87.
MCINNES, I. B. & SCHETT, G. 2011. The pathogenesis of rheumatoid arthritis. The New England Journal of Medicine, 365, 2205-19.MCLAUGHLIN, D., HOCKEY, R. & MISHRA, G. 2013. Heart disease in women in remote Australia: urban-rural differences after adjusting for lifestyle
behaviours and socio-demographic factors. Australian and New Zealand Journal of Public Health, 37, 90.MISHRA, G., LOXTON, D., ANDERSON, A., HOCKEY, R., POWERS, J., BROWN, W., DOBSON, A., DUFFY, L., GRAVES, A., HARRIS, M., HARRIS, S.,
LUCKE, J., MCLAUGHLIN, D., MOONEY, R., PACHANA, N., PEASE, S., TAVENER, M., THOMSON, C., TOOTH, L., TOWNSEND, N., TUCKERMAN, R. & BYLES, J. 2014. Health and wellbeing of women aged 18 to 23 in 2013 and 1996: Findings from the Australian Longitudinal Study on Women’s Health.: Report prepared for the Australian Government Department of Health.
MISHRA, G. D., CARRIGAN, G., BROWN, W. J., BARNETT, A. G. & DOBSON, A. J. 2007. Short-term weight change and the incidence of diabetes in midlife: results from the Australian Longitudinal Study on Women's Health. Diabetes Care, 30, 1418-24.
MOZAFFARIAN, D., BENJAMIN, E., GO, A., ARNETT, D., BLAHA, M., CUSHMAN, M., DE FERRANTI, S., DESPRÉS, J., FULLERTON, H., HOWARD, V., HUFFMAN, M., JUDD, S., KISSELA, B., LACKLAND, D., LICHTMAN, J., LISABETH, L., LIU, S., MACKEY, R., MATCHAR, D., MCGUIRE, D., MOHLER, E., MOY, C., MUNTNER, P., MUSSOLINO, M., NASIR, K., NEUMAR, R., NICHOL, G., PALANIAPPAN, L., PANDEY, D., REEVES, M., RODRIGUEZ, C., SORLIE, P., STEIN, J., TOWFIGHI, A., TURAN, T., VIRANI, S., WILLEY, J., WOO, D., YEH, R. & TURNER, M. 2015. Executive summary: heart disease and stroke statistics-2015 update: a report from the american heart association. Circulation, 131, 434-41.
NAVIN, C. T. J., STEWART, W. J. A., PARKINSON, L., SIBBRITT, D. W. & BYLES, J. E. 2015. Identification of diabetes, heart disease, hypertension and stroke in mid- and older-aged women: Comparing self-report and administrative hospital data records. Geriatrics & Gerontology International.
PARKINSON, L., CURRYER, C., GIBBERD, A., CUNICH, M. & BYLES, J. E. 2013. Good agreement between self-report and centralized hospitalizations data for arthritis-related surgeries. Journal of Clinical Epidemiology, 66, 1128-34.

PARKINSON, L., DOLJAGORE, X., GIBSON, R., DORAN, E., NOTLEY, L., STEWART, W. J., KOWAL, P. & BYLES, J. E. 2011. An observational study of the discrediting of COX-2 NSAIDs in Australia: Vioxx or class effect? BMC Public Health, 11, 892.
PARKINSON, L., GIBSON, R., ROBINSON, I. & BYLES, J. 2010. Older women and arthritis: tracking impact over time. Australasian Journal on Ageing 29, 155-60.
PEETERS, G., HOCKEY, R. & BROWN, W. 2014. Should physical activity intervention efforts take a whole population, high-risk or middle road strategy? Journal of Physical Activity & Health, 11, 966-70.
PEETERS, G., PARKINSON, L., BADLEY, E., JONES, M., BROWN, W. J., DOBSON, A. J. & MISHRA, G. D. 2013. Contemporaneous severity of symptoms and functioning reflected by variations in reporting doctor-diagnosed osteoarthritis. Arthritis Care & Research, 65, 945-53.
PEETERS, G., TETT, S. E., CONAGHAN, P. G., MISHRA, G. D. & DOBSON, A. J. 2015a. Is statin use associated with new joint-related symptoms, physical function, and quality of life? Results from two population-based cohorts of women. Arthritis Care & Research, 67, 13-20.
PEETERS, G. M., ALSHURAFA, M., SCHAAP, L. & DE, V. H. C. 2015b. Diagnostic accuracy of self-reported arthritis in the general adult population is acceptable. Journal of Clinical Epidemiology, 68, 452-459.
PEKKANEN, J., SUNYER, J., ANTO, J. M. & BURNEY, P. 2005. Operational definitions of asthma in studies on its aetiology. The European Respiratory Journal, 26, 28-35.
POSTMA, D. S. 2007. Gender differences in asthma development and progression. Gender Medicine, 4 Suppl B, S133-46.POWERS, J. & LOXTON, D. 2010. The impact of attrition in an 11-year prospective longitudinal study of younger women. Annals of Epidemiology,
20, 318-21.POWERS, J. R., MCDERMOTT, L. J., LOXTON, D. J. & CHOJENTA, C. L. 2013. A prospective study of prevalence and predictors of concurrent alcohol
and tobacco use during pregnancy. Maternal and Child Health Journal, 17, 76-84.ROSE, G. 1992. The Strategy of Preventive Medicine, Oxford, Oxford University Press.SA-SOUSA, A., JACINTO, T., AZEVEDO, L. F., MORAIS-ALMEIDA, M., ROBALO-CORDEIRO, C., BUGALHO-ALMEIDA, A., BOUSQUET, J. & FONSECA, J.
A. 2014. Operational definitions of asthma in recent epidemiological studies are inconsistent. Clinical and Translational Allergy, 4, 24.SCHOENAKER, D. A., DOBSON, A. J., SOEDAMAH-MUTHU, S. S. & MISHRA, G. D. 2013. Factor analysis is more appropriate to identify overall
dietary patterns associated with diabetes when compared with Treelet transform analysis. The Journal of Nutrition, 143, 392-8.SHALEV, V., CHODICK, G., HEYMANN, A. D. & KOKIA, E. 2005. Gender differences in healthcare utilization and medical indicators among patients
with diabetes. Public Health, 119, 45-9.

SHEA, L. & OWENS-GARY, M. 2009. Dabetes and depression in older women –double the risk, double the burden. Diabetes Voice, 54, 8-11.SIBBRITT, D., ADAMS, J. & LUI, C. W. 2011. A longitudinal analysis of complementary and alternative medicine use by a representative cohort of
young Australian women with asthma, 1996-2006. The Journal of Asthma : Official Journal of the Association for the Care of Asthma, 48, 380-6.
SINUSAS, K. 2012. Osteoarthritis: diagnosis and treatment. American Family Physician, 85, 49-56.SMITH, M. D., RUSSELL, A. & HODGES, P. W. 2006. Disorders of breathing and continence have a stronger association with back pain than obesity
and physical activity. The Australian Journal of Physiotherapy, 52, 11-6.SMITH, M. D., RUSSELL, A. & HODGES, P. W. 2009. Do incontinence, breathing difficulties, and gastrointestinal symptoms increase the risk of
future back pain? The Journal of Pain : Official Journal of the American Pain Society, 10, 876-86.STAVROU, E., VAJDIC, C. M., LOXTON, D. & PEARSON, S. A. 2011. The validity of self-reported cancer diagnoses and factors associated with
accurate reporting in a cohort of older Australian women. Cancer Epidemiology, 35, e75-80.STEWART, W. J. A., WALLICK, C. J., BYLES, J. E. & DORAN, C. M. 2013. Assessing patterns of use of cardio-protective polypill component medicines
in Australian women. Drugs & Aging, 30, 193-203.STEWART WILLIAMS, J. A., BYLES, J. E., & INDER, K. J. 2010. Equity of access to cardiac rehabilitation: the role of system factors. International
Journal for Equity in Health, 9, 2.STRODL, E., KENARDY, J. & ARONEY, C. 2003. Perceived stress as a predictor of the self-reported new diagnosis of symptomatic CHD in older
women. International Journal of Behavioral Medicine, 10, 205-20.TOOTH, L., HOCKEY, R., BYLES, J. & DOBSON, A. 2008. Weighted multimorbidity indexes predicted mortality, health service use, and health-
related quality of life in older women. Journal of Clinical Epidemiology, 61, 151-9.TSAI, C. L., DELCLOS, G. L., HUANG, J. S., HANANIA, N. A. & CAMARGO, C. A., JR. 2013. Age-related differences in asthma outcomes in the United
States, 1988-2006. Annals of Allergy, Asthma & Immunology : Official Publication of the American College of Allergy, Asthma, & Immunology, 110, 240-6, 246 e1.
VAN DEN BERG, J. M., MISHRA, G. D., VAN, D. S. Y. T. & HERBER-GAST, G. C. 2014. Vasomotor menopausal symptoms are not associated with incidence of breast cancer in a population-based cohort of mid-aged women. European Journal of Cancer, 50, 824-30.
VAN DER PLOEG, H. P., VAN POPPEL, M. N., CHEY, T., BAUMAN, A. E. & BROWN, W. J. 2011. The role of pre-pregnancy physical activity and sedentary behaviour in the development of gestational diabetes mellitus. Journal of Science and Medicine in Sport / Sports Medicine Australia, 14, 149-52.

VAN UFFELEN, J. G., BERECKI-GISOLF, J., BROWN, W. J. & DOBSON, A. J. 2010. What is a healthy body mass index for women in their seventies? Results from the Australian longitudinal study on women's health. The Journals of Gerontology. Series A, Biological Sciences and Medical Sciences, 65, 847-53.
VASHUM, K. P., MCEVOY, M., SHI, Z., MILTON, A. H., ISLAM, M. R., SIBBRITT, D., PATTERSON, A., BYLES, J., LOXTON, D. & ATTIA, J. 2013. Is dietary zinc protective for type 2 diabetes? Results from the Australian longitudinal study on women's health. BMC Endocrine Disorders, 13, 40.
VON BEHREN, J., LIPSETT, M., HORN-ROSS, P. L., DELFINO, R. J., GILLILAND, F., MCCONNELL, R., BERNSTEIN, L., CLARKE, C. A. & REYNOLDS, P. 2009. Obesity, waist size and prevalence of current asthma in the California Teachers Study cohort. Thorax, 64, 889-93.
YATES, M. W. 2005. How is the diagnosis of asthma in older people established in clinical practice? The Medical Journal of Australia, 183, S44-6.YEATS, B. & TIPPER, R. 2010. Women and Diabetes: Gender Impact Assessment 13. Melbourne: Women's Health Victoria.YOUNG, A. F., LOWE, J. M., BYLES, J. E. & PATTERSON, A. J. 2005. Trends in health service use for women in Australia with diabetes. Australian
and New Zealand Journal of Public Health, 29, 422-8.ZHANG, Y. & JORDAN, J. M. 2010. Epidemiology of osteoarthritis. Clinics in Geriatric Medicine, 26, 355-69.

Related Documents