National Longitudinal Study of Adolescent Health Wave III Education Data Course-Level Curriculum Component: Math and Science Textbook Study Kathryn S. Schiller, Chandra Muller, William H. Schmidt, Richard Houang, Jennifer Harris Requejo, Catherine Riegle-Crumb, Jennifer Pearson, Kenneth A. Frank ˜ ˜ ˜ ˜ ˜ Carolina Population Center University of North Carolina at Chapel Hill January 2008 This research was funded by a grant from the National Science Foundation under grant REC-0126167 to the Population Research Center, University of Texas at Austin; Chandra Muller (PI) and Pedro Reyes (Co- PI). Persons interested in obtaining data files from Add Health should contact Add Health, Carolina Population Center, 123 W. Franklin Street, Chapel Hill, NC 27516-2524 ([email protected] ).

Welcome message from author
This document is posted to help you gain knowledge. Please leave a comment to let me know what you think about it! Share it to your friends and learn new things together.
Transcript

National Longitudinal Study ofAdolescent Health
Wave IIIEducation Data
Course-Level Curriculum Component:Math and Science Textbook Study
Kathryn S. Schiller, Chandra Muller, William H. Schmidt,Richard Houang, Jennifer Harris Requejo, Catherine Riegle-Crumb,
Jennifer Pearson, Kenneth A. Frank
˜ ˜ ˜ ˜ ˜
Carolina Population CenterUniversity of North Carolina at Chapel Hill
January 2008
This research was funded by a grant from the National Science Foundation under grant REC-0126167 tothe Population Research Center, University of Texas at Austin; Chandra Muller (PI) and Pedro Reyes (Co-
PI). Persons interested in obtaining data files from Add Health should contact Add Health, CarolinaPopulation Center, 123 W. Franklin Street, Chapel Hill, NC 27516-2524 ([email protected]).

1
WAVE III EDUCATION DATA COURSE-LEVEL CURRICULUM COMPONENT
The variables in edutmcl and edutscl have the same names as those in edutmcli and edutscli. Please note if using these data in your analyses.
I. INTRODUCTION
A. Component Description
The Course-Level Curriculum Component is a supplement for edubasic, a data file of the transcripts from every AHAA student, and is designed to provide course-level indicators of the instructional materials contained in textbooks used in math and science courses taken by AHAA participants. See the Academic Courses Component and the Edubasic Component codebooks for descriptions of the indicators for course type, timing of enrollment, and student performance variables contained in edubasic, which has an entry for every course appearing on a student’s transcript. The Course-Level Curriculum Component contains indicators for curriculum content derived from detailed coding of textbooks based on curriculum frameworks developed for the Third International Math and Science Study (TIMSS), from which summary measures were created for the topics covered (content) and the types of tasks students were asked to do with this topical information (performance expectations).
More information concerning the conceptual and methodological underpinnings as well as the data collection process can be found in the codebook for the Student-Level Curriculum Component, which consists of student-level curriculum indicators suitable for use with other AHAA component measures (e.g., Academic Courses, Academic Networks, and Linking) and with Add Health survey data. Analysts interested in learning more about foundational work supporting the use of textbook-based analyses as an effective means of capturing information about students’ curricular exposure should access the AHAA website at http://www.prc.utexas.edu/ahaa/. This website also lists published materials on the impact of curriculum on student academic outcomes, as well as published work and other research-related activities using AHAA curriculum data.
Aspects of the Curriculum Component, such as the coding of math and science textbooks, were funded by a grant from the National Science Foundation (NSF) under grant REC-0126167 to the Population Research Center, University of Texas at Austin; Chandra Muller and Pedro Reyes (Co-PI).
B. Methods Summary
1. Data Collection Textbook lists (including title, authors, publisher, and date of publication) used for mathematics and science courses offered in 2001 were requested by AHAA from all

2
participating high schools. Special efforts were made to encourage all Add Health high schools and non-Add Health high schools attended by large numbers of participants to provide these lists. The school-level disposition file, eduscl, in the Primary Component indicates which schools provided textbook lists. An identification code was assigned to each textbook based on the publication information provided by schools, with the same code given to editions published within 5 years before or after the modal edition reported by AHAA schools. Although publishers frequently release new editions of textbooks every couple of years, major revisions of their textbooks tend to occur only about every 10 years. Thus, the content of a textbook tends to remain fairly similar across adjacent editions. Identification codes were created for 285 math textbooks and 303 science textbooks.
2. File Linking Procedures
The textbook lists were linked to students’ transcripts by matching course titles on schools’ booklists to those in their course catalogs. (See the study design document for details about the types of course catalogs submitted by schools, and the procedures used for linking course catalogs to student transcripts). In some cases, schools listed more than one textbook for a course, probably reflecting multiple sections of the course (such as Algebra I) for which teachers chose different textbooks or the use of two textbooks for one course. Because students’ transcripts do not allow identification of course sections, available information from all books linked to a given course ID contributed to estimates of potential curriculum for that course.
3. Selection and Coding of Textbooks
The Curriculum Component for AHAA incorporates information from textbooks coded for LSAY, Longitudinal Study of American Youth, and an additional set of textbooks coded using the same procedures for AHAA. Due to the labor-intensive nature of the coding and the related costs, the additional textbooks for AHAA were selected for coding with the goal of maximizing the coverage of courses taken by the largest number of students. The coding of textbooks adopted for math and science courses taken by students at Add Health high schools and non-Add Health high schools attended by large numbers of participants was prioritized. Within these schools, coding efforts were focused on textbooks used in core math and science courses. For example, a textbook for a general biology course was given coding priority over one for a marine biology course. Prioritizing the coding of core math and science courses ensured a high coverage rate of the student sample and compatibility between Curriculum Component and Academic Courses measures. However, textbooks linked to non-core courses taken by a significant number of students were more likely to be coded than textbooks corresponding to courses taken by a few students in only one school. Textbooks used at multiple schools were also given priority over those used at a single school.
The actual coding of textbooks’ content and the creation of the curriculum measures for AHAA were procedures carried out independently of the creation of the

3
variables for the courses in which the books were used. The coding procedures were designed to be low-inference by simply recording the topical and task-oriented content of a book, because schools frequently differ in the courses for which they use the same book (e.g., an “advanced algebra” book might be used by different schools in courses titled Algebra II, Advanced Math, and Pre-Calculus). Textbook coders, who were curriculum experts trained by the U.S. TIMSS National Research Center at Michigan State University (MSU), assigned up to eight topic codes and five performance expectation codes to each review question or exercise (referred to as blocks) for each chapter in a textbook. If a chapter did not have any review questions or exercises, the chapter summary was coded. These codes were aggregated in different ways to create six overall book summary measures as well as four sets of 29 topic-specific indicators. Both sets of measures are described in more detail in Section II: Constructed Curriculum Indicators. These variables reflect the potential exposure to a given subject or topic, assuming the entire book was covered during the course.
For AHAA, the book-level summary indices were standardized to have an average of 1 and a standard deviation of .25 across the coded books for a given subject. This standardization was conducted prior to the merging of the textbook summary measures with information on students’ transcripts. The underlying premise of this standardization is that the average book for a given subject is intended to be used for a year-long, or two-semester, course. Books, however, vary dramatically in the amount of content they include, especially when differences in complexity and challenge are incorporated into the summary measures. To some extent, books with less than a year’s worth of material reflect intended use in shorter courses (e.g., a semester course) or less demanding courses (e.g., moving at a slower pace). Conversely, books with more material most likely reflect intended suitability for more demanding courses (e.g., moving at a faster pace or covering more challenging material).
In sum, the purpose of the coding and standardization procedures implemented for the Curriculum Component of AHAA was to enable the construction of curriculum measures that allow comparisons of students’ potential curriculum exposure across different types of courses within the same school or across the same course in different schools.
C. Summary of Course-Level Curriculum Indicators and Data Files
1. Basic Structure of Course-Level Curriculum Data Files The curriculum measures created for AHAA are designed to allow comparisons of curricular content and quality between either math or science courses taken by students. Only courses taken by students for which at least one textbook was coded are included in these files. When information from two or more coded textbooks was available for a single course, the book summary indices computed for these textbooks were averaged as the best proxy measure of that course’s potentially implemented curriculum. The variables are located in two subject-specific files (edutmcl and edutscl). Each entry in these files can be identified by unique combinations of ERCSTKN and

4
ERCCRSID (more information on these variables can be found in the codebook for Edubasic).
The constructed math and science curriculum indicators are divided into two major categories: summary and topic-specific indicators. The summary curriculum indicators consist of (a) four summary index variables indicating amount of scope: unweighted scope, International Grade Placement (IGP) weighted scope, Performance Expectation (PE) weighted scope, and IGP*PE weighted scope; and (b) two summary index variables indicating overall complexity or challenge: average IGP weighted by topic frequency and average PE weighted by topic frequency. These six types of summary variables are documented in greater detail in section II below.
The topic-specific curriculum indicators are supplementary to the summary measures and provide information about the amount of textbook content related to one of 29 aggregated topics in a subject, either math or science, for a given index (a, b, c, and d). For example, the 29 topic-specific math and 29 topic-specific science variables relating to the unweighted scope index are listed first, followed by those relating to the IGP weighted index, and so on. The topic-specific variables are described in section II, following the documentation of the summary measures.
2. Special Analytical Considerations
The variables included in these files should be used only in conjunction with edubasic, which provides other information such as the type of course and when it was taken (see Edubasic codebook). The curriculum variables provide fine-grained measures of students’ likely classroom experiences and reflect their opportunities to learn complex and challenging material related to math and science. These measures should be used in conjunction with the data in edubasic, with which they can be merged using ERCSTKN and ERCCRSID.
D. Organization of Component
The next sections provide detailed documentation of the summary and topic-specific indicators. These descriptions are followed by a discussion of the conventions used to name curriculum indicators. A list of available Curriculum Component data files is also presented.
II. CONSTRUCTED CURRICULUM INDICATORS
A. Summary Curriculum Indicators
1. Section Overview
The summary curriculum indicators documented below are divided into two groups: the first includes the four summary index measures that reflect different estimates

5
of the quantity of instructional material contained in textbooks used in students’ courses. The second group consists of variables capturing information about the average level of complexity and challenge of textbooks used in students’ math and science courses.
2. Summary Index Measures
The summary index measures were each standardized to have a mean of 1 (roughly equivalent to a year of instructional material) and standard deviation of .25 (roughly one-half of a semester) prior to merging with students’ transcripts. Then, these summary index variables were averaged across coded textbooks linked to that course.
i. Summary Index A: Unweighted Scope Indicators
The most basic textbook-level summary measure, which estimates the scope of curricular material adjusted for the density of material in a textbook, was created in three stages. First, chapter-level estimates of the amount of material relating to a particular topic were created by multiplying the proportion of blocks in a chapter dealing with a topic by the length of the chapter in pages to estimate the number of “topic pages” devoted to a topic in a given chapter. Second, book-level summaries of topic coverage were created by summing the chapter-level estimates to produce an estimate of the number of “topic pages” in a book dedicated to that topic. Third, an overall estimate of the amount of curricular material in a textbook was created by summing the “topic pages” across topics. Equation 1 shows the process of aggregating coding of the review questions (or “blocks”) across chapters (also known as “units”) and topics. The variable X takes on a value of 1 if a given topic is found in a block and 0 if it is not.
∑ ∑∑
⎥⎥⎥
⎦
⎤
⎢⎢⎢
⎣
⎡
⎟⎟⎟
⎠
⎞
⎜⎜⎜
⎝
⎛=
tc
c c
bt
pagesblocks
XPagesTopicTotal *
# (1)
For AHAA, the scope variables (ETCLMAT for math and ETCLSAT for
science) were produced by standardizing the “total topic pages” across textbooks to have a mean of 1 and standard deviation of .25 prior to merging with information on students’ transcripts. These scope variables were averaged across information available from coded textbooks.
a. Math ETCLMAT – course-level unweighted scope in math overall (composite indicator of all 165 math topic categories)
b. Science ETCLSAT – course-level unweighted scope in science overall (composite indicator of all 189 aggregated science topic categories)

6
ii. Summary Index B: International Grade Placement (IGP)
Weighted Scope Indicators
Summary Index B reflects the “complexity” of the topics covered in a book by using the International Grade Placement (IGP) rating as a weight in calculating the curriculum scope in a textbook. Creation of the IGP weighted indicator of scope followed the same procedure as for unweighted scope except for the application of IGP weights (ranging from 1 to 12) in the final summation step. Thus, more complex topics (i.e., with a higher IGP) contribute more to the estimate of curriculum scope. Equation 2 shows the process of aggregating coding of the review questions (or “blocks”) across chapters (also known as “units”) and topics. The variable X takes on a value of 1 if a given topic is found in a block and 0 if it is not.
tt
cc c
bt
IGPpagesblocks
XPagesTopicTotalWeightedIGP **
#∑ ∑∑
⎥⎥⎥
⎦
⎤
⎢⎢⎢
⎣
⎡
⎟⎟⎟
⎠
⎞
⎜⎜⎜
⎝
⎛= (2)
For AHAA, the IGP weighted scope variables (ETCLMBT for math and
ETCLSBT for science) were produced by standardizing the “IGP weighted topic pages” variables across textbooks to have a mean of 1 and standard deviation of .25 prior to merging with information on students’ transcripts. These scope variables were averaged across information available from coded textbooks.
a. Math ETCLMBT – course-level IGP weighted scope in math overall
b. Science ETCLSBT – course-level IGP weighted scope in science overall
iii. Summary Index C: Performance Expectation (PE) Weighted Scope Indicators
Index C reflects the level of “challenge” in a textbook by using the performance
expectation (PE) ratings to give more weight to material involving critical thinking in the estimation of the scope of a textbook. The calculation of this index was similar to that for unweighted scope except that the indicator for whether a topic appeared in a block was multiplied by the highest PE rating (ranging from 1-5) for that block. Thus, topics in blocks with more challenging material (i.e., with a higher PE) contribute more to the estimate of curriculum scope. Equation 3 shows the process of aggregating coding of the review questions (or “blocks”) across chapters (also known as “units”) and topics. The variable X takes on a value of 1 if a given topic is found in a block and 0 if it is not.
7
∑ ∑∑
⎥⎥⎥
⎦
⎤
⎢⎢⎢
⎣
⎡
⎟⎟⎟
⎠
⎞
⎜⎜⎜
⎝
⎛=
tc
c c
bbt
pagesblocks
PEXPagesTopicTotalWeightedPE *
#
* (3)
For AHAA, the PE weighted scope variables (ETCLMCT for math and
ETCLSCT for science) were produced by standardizing the “PE weighted topic pages” variables across textbooks to have a mean of 1 and standard deviation of .25 prior to merging with information on students’ transcripts. These scope variables were averaged across information available from coded textbooks and are listed immediately below.
a. Math ETCLMCT – course-level PE weighted scope in math overall
b. Science ETCLSCT – course-level PE weighted scope in science overall
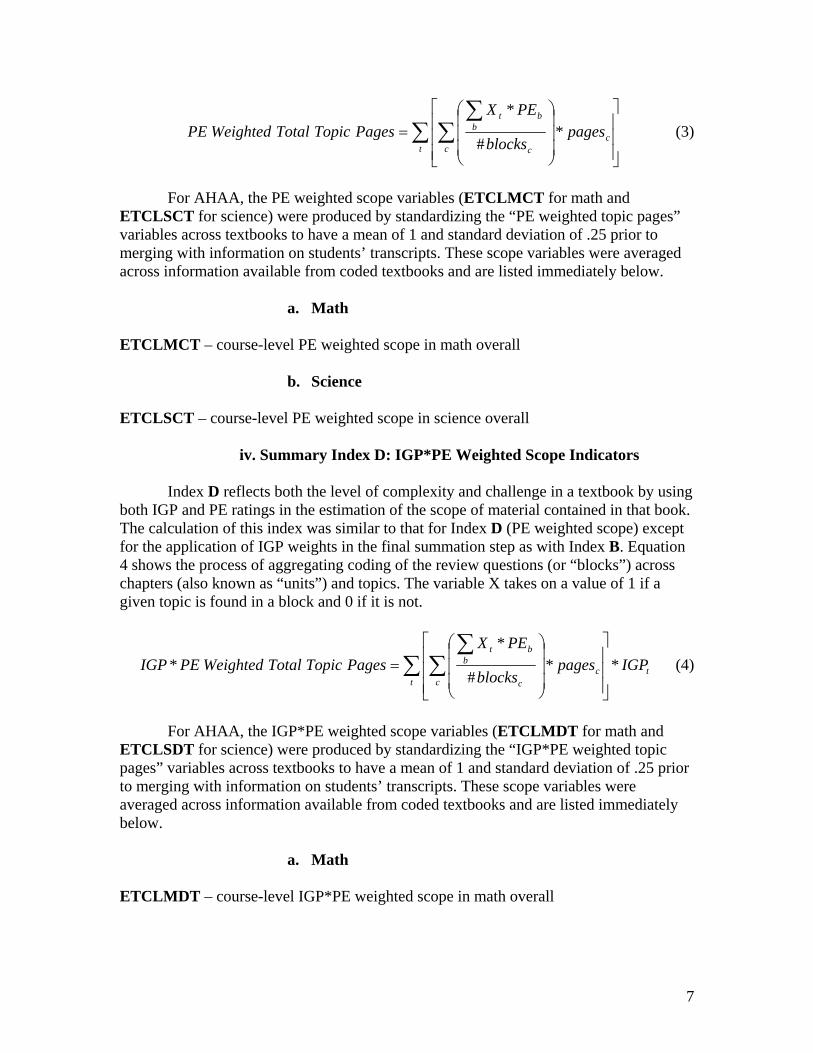
iv. Summary Index D: IGP*PE Weighted Scope Indicators
Index D reflects both the level of complexity and challenge in a textbook by using both IGP and PE ratings in the estimation of the scope of material contained in that book. The calculation of this index was similar to that for Index D (PE weighted scope) except for the application of IGP weights in the final summation step as with Index B. Equation 4 shows the process of aggregating coding of the review questions (or “blocks”) across chapters (also known as “units”) and topics. The variable X takes on a value of 1 if a given topic is found in a block and 0 if it is not.
tt
cc c
bbt
IGPpagesblocks
PEXPagesTopicTotalWeightedPEIGP **
#
** ∑ ∑
∑
⎥⎥⎥
⎦
⎤
⎢⎢⎢
⎣
⎡
⎟⎟⎟
⎠
⎞
⎜⎜⎜
⎝
⎛= (4)
For AHAA, the IGP*PE weighted scope variables (ETCLMDT for math and
ETCLSDT for science) were produced by standardizing the “IGP*PE weighted topic pages” variables across textbooks to have a mean of 1 and standard deviation of .25 prior to merging with information on students’ transcripts. These scope variables were averaged across information available from coded textbooks and are listed immediately below.
a. Math ETCLMDT – course-level IGP*PE weighted scope in math overall
8
b. Science ETCLSDT – course-level IGP*PE weighted scope in science overall
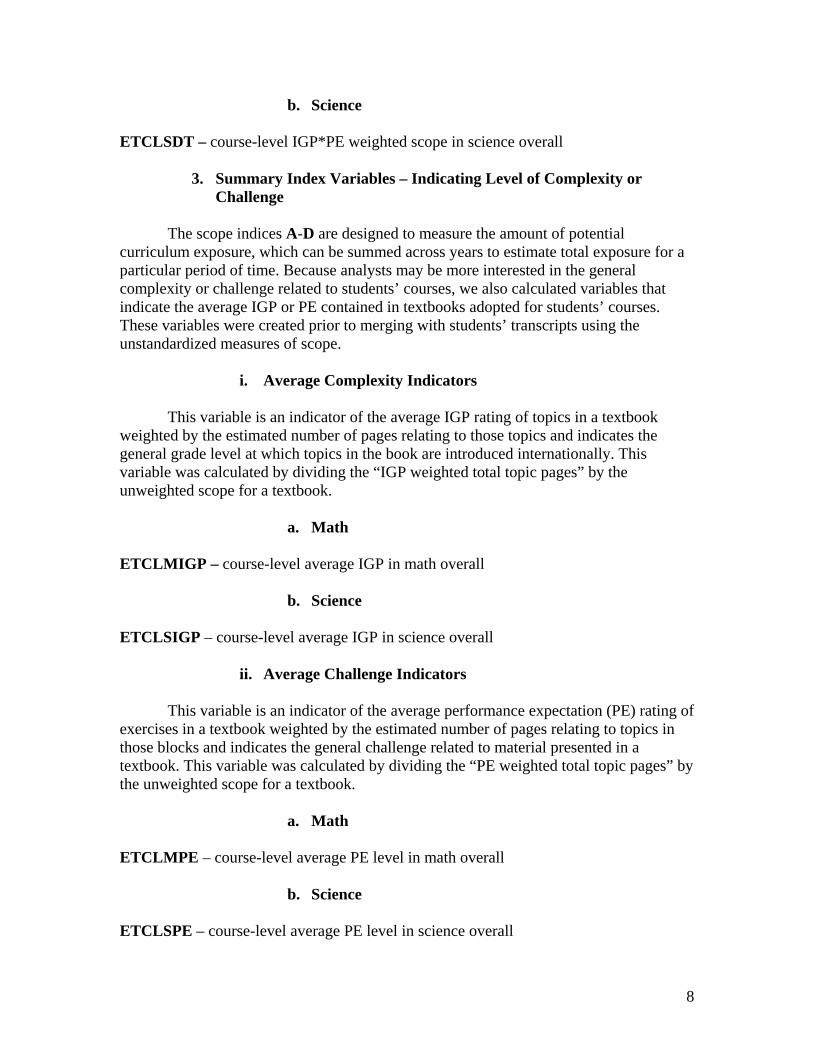
3. Summary Index Variables – Indicating Level of Complexity or Challenge
The scope indices A-D are designed to measure the amount of potential
curriculum exposure, which can be summed across years to estimate total exposure for a particular period of time. Because analysts may be more interested in the general complexity or challenge related to students’ courses, we also calculated variables that indicate the average IGP or PE contained in textbooks adopted for students’ courses. These variables were created prior to merging with students’ transcripts using the unstandardized measures of scope.
i. Average Complexity Indicators
This variable is an indicator of the average IGP rating of topics in a textbook weighted by the estimated number of pages relating to those topics and indicates the general grade level at which topics in the book are introduced internationally. This variable was calculated by dividing the “IGP weighted total topic pages” by the unweighted scope for a textbook.
a. Math
ETCLMIGP – course-level average IGP in math overall
b. Science ETCLSIGP – course-level average IGP in science overall
ii. Average Challenge Indicators
This variable is an indicator of the average performance expectation (PE) rating of exercises in a textbook weighted by the estimated number of pages relating to topics in those blocks and indicates the general challenge related to material presented in a textbook. This variable was calculated by dividing the “PE weighted total topic pages” by the unweighted scope for a textbook.
a. Math ETCLMPE – course-level average PE level in math overall
b. Science ETCLSPE – course-level average PE level in science overall

9
B. Topic-Specific Curriculum Indicators
The topic-specific curriculum indicators supplement the summary curriculum
measures and are organized according to subject: math and science. The topic-specific indicators for each subject are listed numerically from 1 to 29. These numeric designations correspond to particular aggregations of the 165 math and 189 science topic categories experts trained by the U.S. TIMSS National Research Center at MSU used to code textbooks. The framework codes are contained in the Student-Level Curriculum Component codebook.
Two tables were produced, one for math and one for science, which present the
variety of topic-specific curriculum indicators available per subject. The first column of both tables lists the general topic heading associated with each number 1-29. The second column titled ‘framework codes’ presents an exhaustive list of all the numeric codes grouped together under each general topic heading (note that these groupings are mutually exclusive). Analysts can determine the exact math and science topic categories these numeric codes refer to by examining the framework code list presented in the Student-Level Curriculum Component codebook. The remaining columns in the tables show the type of indicators available: unweighted scope, IGP weighted scope, PE weighted scope, and IGP*PE weighted scope. The following example illustrates how analysts should interpret the table contents and associated framework code list: Topic #16 in the math table corresponds with the general topic heading ‘discrete math.’ The numeric codes associated with ‘discrete math’ are 1.1.4.1, 1.1.4.5, 1.1.4.5.1, 1.1.4.5.2. Examining the math framework codes list shows that 1.1.4.1 = other number bases including binary arithmetic, 1.1.4.5 = systematic counting, 1.1.4.5.1 = tree diagrams and other informal means of systematic counting, and 1.1.4.5.2 = permutations, combinations. The next set of columns show that the unweighted scope variable names for math topic #16 is etclma16, the IGP weighted scope variable names for math topic #16 is etclmb16, and so on.
See attached tables at the end of this document for descriptions of these indicators.
III. NAMING CONVENTIONS
A. Variable Names and Labels
Curriculum variables were named and labeled according to a standard format:
1. Each variable consists of up to but not exceeding 8 upper-case characters.
2. The initial character of all variables is E, serving as a reference to the education component of Add Health, AHAA.

10
3. The second character of all variables, the letter T, stands for “textbook”
and specifies that each of these variables belongs to the Curriculum Component of the broader Add Health/AHAA data set.
4. The next two characters for all variables, the letters CL, stand for course-
level. The course-level variables share the same names as the course-level (imputed) variables, and are distinguishable only by their source data file.
5. The fifth character included in all Course-Level Curriculum Component
indicators designates the curricular subject. The letter M specifies that the indicator pertains to the subject math, and the letter S specifies the indicator relates to science.
6. The sixth character of all variables indicates index type if the variable
contains information about one of the index measures A-D. For example, the sixth character in all summary index A measures is A, the sixth character in all summary index B measures is B, and so on.
7. While the variable names consist of eight or fewer characters, the labels
assigned to each curriculum variable can contain up to 40 characters including spaces.
B. Data File Names
Curriculum data file names begin with the prefix edu, followed by the letter t
(representing “textbook” which indicates that the data file is associated with the Curriculum Component), then an m or s to signify the particular subject (math or science), and conclude with cl, denoting “course-level.”
IV. MISSING CODES
Missing codes are not applicable for these measures as only courses in the given subject with information from at least one coded textbook are included in the files.
V. DATA FILE INVENTORY
Only courses with math curriculum information are included in the math files. Likewise, only courses with science curriculum information are included in the science data files.
A. edutmcl: the math file
B. edutscl: the science file

11
VI. QUICK REFERENCE GUIDE A. Course-Level Math Curriculum Indicators
ETCLMAT Course-level unweighted scope in math overall (composite
indicator of all 165 math topic categories). ETCLMBT Course-level IGP weighted scope in math overall. ETCLMCT Course-level PE weighted scope in math overall. ETCLMDT Course-level IGP*PE weighted scope in math overall. ETCLMIGP Course-level average IGP in math overall. ETCLMPE Course-level average PE level in math overall.
B. Course-Level Science Curriculum Indicators ETCLSAT Course-level unweighted scope in science overall (composite
indicator of all 189 aggregated science topic categories). ETCLSBT Course-level IGP weighted scope in science overall. ETCLSCT Course-level PE weighted scope in science overall. ETCLSDT Course-level IGP*PE weighted scope in science overall. ETCLSIGP Course-level average IGP in science overall. ETCLSPE Course-level average PE level in science overall.
C. Constructed Math Topic-Specific Curriculum Indicators See Table 1.
D. Constructed Science Topic-Specific Curriculum Indicators See Table 2.

12
Tabl
e 1:
Indi
cato
rs o
f Gen
eral
Top
ic C
onte
nt o
f Mat
h Te
xtbo
oks.
Varia
bles
Topi
cFr
amew
ork
code
sU
nwei
ghte
d Sc
ope
IGP
wei
ghte
d sc
ope
PE w
eigh
ted
scop
eIG
P*PE
wei
ghte
d sc
ope
1A
lgeb
ra; p
re-e
quat
ion
1.6,
1.6
.1, 1
.6.2
, 1.6
.2.1
, 1.6
.2.2
etcl
ma1
etcl
mb1
etcl
mc1
etcl
md1
2A
lgeb
ra; b
asic
equ
atio
n1.
6.2.
3, 1
.6.2
.4, 1
.6.2
.8, 1
.6.2
.11
etcl
ma2
etcl
mb2
etcl
mc2
etcl
md2
3A
lgeb
ra; a
dvan
ced
equa
tion
1.6.
2.5,
1.6
.2.6
, 1.6
.2.7
,1.6
.2.9
, 1.6
.2.1
0, 1
.6.2
.12
etcl
ma3
etcl
mb3
etcl
mc3
etcl
md3
4A
lgeb
ra; n
umbe
r pat
tern
s1.
6.1.
1et
clm
a4et
clm
b4et
clm
c4et
clm
d45
Alg
ebra
; bas
ic fu
nctio
n1.
6.1.
2, 1
.6.1
.3, 1
.6.1
.4, 1
.6.1
.8et
clm
a5et
clm
b5et
clm
c5et
clm
d56
Alg
ebra
; adv
ance
d fu
nctio
n1.
6.1.
5, 1
.6.1
.6, 1
.6.1
.7et
clm
a6et
clm
b6et
clm
c6et
clm
d67
Alg
ebra
; bas
ic n
umbe
r1.
1.3.
1, 1
.1.3
.1.1
, 1.1
.3.1
.2, 1
.1.3
.1.3
, 1.1
.3.2
, 1.1
.3.2
.1, 1
.1.3
.2.2
, 1.
1.3.
2.3
etcl
ma7
etcl
mb7
etcl
mc7
etcl
md7
8A
lgeb
ra; a
dvan
ced
num
ber
1.1.
3.3,
1.1
.3.3
.1, 1
.1.3
.3.2
, 1.1
.3.3
.3, 1
.1.4
.2, 1
.1.4
.2.1
, 1.1
.4.2
.2,
1.1.
4.2.
3, 1
.1.4
.2.4
, 1.1
.4.3
, 1.1
.4.3
.1, 1
.1.4
.3.2
, 1.1
.4.3
.3et
clm
a8et
clm
b8et
clm
c8et
clm
d8
9G
eom
etry
; 2-D
1.3,
1.3
.2, 1
.3.3
etcl
ma9
etcl
mb9
etcl
mc9
etcl
md9
10G
eom
etry
; poi
nts,
lines
, sha
pes i
n th
eir p
erim
eter
s, ar
eas
and
volu
me
1.3.
4et
clm
a10
etcl
mb1
0et
clm
c10
etcl
md1
0
11G
eom
etry
; con
ic se
ctio
ns a
nd th
eir e
quat
ions
, and
eq
uatio
ns fo
r lin
es a
nd p
lane
s1.
3.1,
1.5
.3.1
etcl
ma1
1et
clm
b11
etcl
mc1
1et
clm
d11
12G
eom
etry
; tra
nsfo
rmat
ion,
con
grue
nce
and
sim
ilarit
y1.
3.5,
1.3
.6, 1
.4, 1
.4.1
, 1.4
.2, 1
.4.3
etcl
ma1
2et
clm
b12
etcl
mc1
2et
clm
d12
13N
umbe
rs a
nd a
rithm
etic
; who
le n
umbe
rs1.
1, 1
.1.1
, 1.1
.1.1
, 1.1
.1.2
, 1.1
.1.3
etcl
ma1
3et
clm
b13
etcl
mc1
3et
clm
d13
14Fr
actio
ns1.
1.2,
1.1
.2.1
, 1.1
.2.2
, 1.1
.2.3
, 1.1
.2.4
, 1.1
.2.5
etcl
ma1
4et
clm
b14
etcl
mc1
4et
clm
d14
15N
umbe
r the
ory
1.1.
4.4,
1.1
.4.4
.1, 1
.1.4
.4.2
etcl
ma1
5et
clm
b15
etcl
mc1
5et
clm
d15
16D
iscr
ete
mat
h1.
1.4.
1, 1
.1.4
.5, 1
.1.4
.5.1
, 1.1
.4.5
.2et
clm
a16
etcl
mb1
6et
clm
c16
etcl
md1
617
Estim
atio
n1.
1.5,
1.1
.5.1
, 1.1
.5.2
, 1.1
.5.3
, 1.1
.5.4
etcl
ma1
7et
clm
b17
etcl
mc1
7et
clm
d17
18M
easu
rem
ent
1.2,
1.2
.1, 1
.2.3
etcl
ma1
8et
clm
b18
etcl
mc1
8et
clm
d18
19Pe
rimet
er, a
rea,
and
vol
ume
1.2.
2et
clm
a19
etcl
mb1
9et
clm
c19
etcl
md1
920
Prob
abili
ty; p
ropo
rtion
ality
con
cept
s1.
5, 1
.5.1
etcl
ma2
0et
clm
b20
etcl
mc2
0et
clm
d20
21Pr
obab
ility
; pro
porti
onal
ity p
robl
ems
1.5.
2et
clm
a21
etcl
mb2
1et
clm
c21
etcl
md2
122
Prob
abili
ty; l
inea
r int
erpo
latio
n an
d ex
trapo
latio
n1.
5.4
etcl
ma2
2et
clm
b22
etcl
mc2
2et
clm
d22
23Tr
igon
omet
ry1.
5.3,
1.5
.3.2
etcl
ma2
3et
clm
b23
etcl
mc2
3et
clm
d23
24St
atis
tics;
dat
a re
pres
enta
tion
and
anal
ysis
1.7,
1.7
.1, 1
.7.1
.1, 1
.7.1
.2, 1
.7.1
.3, 1
.7.1
.4, 1
.7.1
.5, 1
.7.1
.6,
1.7.
1.7,
1.7
.1.8
, 1.7
.1.9
, 1.7
.1.1
0, 1
.7.1
.11
etcl
ma2
4et
clm
b24
etcl
mc2
4et
clm
d24
25St
atis
tics;
unc
erta
inty
and
pro
babi
lity
1.7.
2, 1
.7.2
.1, 1
.7.2
.2, 1
.7.2
.3, 1
.7.2
.4, 1
.7.2
.5, 1
.7.2
.6, 1
.7.2
.7,
1.7.
2.8,
1.7
.2.9
, 1.7
.2.1
0, 1
.7.2
.11,
1.7
.2.1
2, 1
.7.2
.13,
1.7
.2.1
4,
1.7.
2.15
, 1.7
.2.1
6, 1
.7.2
.17
etcl
ma2
5et
clm
b25
etcl
mc2
5et
clm
d25
26C
alcu
lus;
infin
ite p
roce
ss1.
8, 1
.8.1
, 1.8
.1.1
, 1.8
.1.2
, 1.8
.1.3
, 1.8
.1.4
, 1.8
.1.5
, 1.8
.1.6
, 1.8
.1.7
etcl
ma2
6et
clm
b26
etcl
mc2
6et
clm
d26
27C
alcu
lus;
cha
nge
1.8.
2, 1
.8.2
.1, 1
.8.2
.2, 1
.8.2
.3, 1
.8.2
.4, 1
.8.2
.5et
clm
a27
etcl
mb2
7et
clm
c27
etcl
md2
728
Val
idat
ion
and
stru
ctur
ing
1.9,
1.9
.1, 1
.9.1
.1, 1
.9.1
.2, 1
.9.1
.3, 1
.9.1
.4, 1
.9.1
.5, 1
.9.1
.6,
1.9.
1.7,
1.9
.1.8
, 1.9
.1.9
, 1.9
.2, 1
.9.2
.1, 1
.9.2
.2, 1
.9.2
.3, 1
.9.2
.4,
1.9.
2.5,
1.9
.2.6
, 1.9
.2.7
, 1.9
.2.8
, 1.9
.2.9
etcl
ma2
8et
clm
b28
etcl
mc2
8et
clm
d28
29ot
her t
opic
s1.
1.3,
1.1
.4, 1
.10,
1.1
0.1,
1.1
0.2,
1.1
0.3,
1.1
0.4,
1.1
0.5,
1.1
0.6
etcl
ma2
9et
clm
b29
etcl
mc2
9et
clm
d29

13
Tabl
e 2:
Indi
cato
rs o
f Gen
eral
Top
ic C
onte
nt o
f Sci
ence
Tex
tboo
ks.
Varia
bles
Topi
cFr
amew
ork
code
sU
nwei
ghte
d Sc
ope
IGP
wei
ghte
d sc
ope
PE w
eigh
ted
scop
eIG
P*P
E w
eigh
ted
scop
e1
Earth
feat
ures
1.1,
1.1
.1, 1
.1.1
.1, 1
.1.1
.2, 1
.1.1
.3, 1
.1.1
.4, 1
.1.1
.5, 1
.1.1
.6et
clsa
1et
clsb
1et
clsc
1et
clsd
12
Earth
pro
cess
1.1.
2, 1
.1.2
.1, 1
.1.2
.2, 1
.1.2
.3, 1
.1.2
.4et
clsa
2et
clsb
2et
clsc
2et
clsd
23
Earth
and
the
univ
erse
1.1.
3, 1
.1.3
.1, 1
.1.3
.2, 1
.1.3
.3et
clsa
3et
clsb
3et
clsc
3et
clsd
34
Plan
ts, a
nim
als,
and
thei
r life
cyc
les
1.2,
1.2
.1, 1
.2.1
.1, 1
.2.1
.1.1
, 1.2
.1.1
.2, 1
.2.1
.2, 1
.2.1
.2.1
, 1.2
.1.2
.2,
1.2.
1.3 ,
1.2
.3, 1
.2.3
.1, 1
.2.3
.1.1
, 1.2
.3.1
.2et
clsa
4et
clsb
4et
clsc
4et
clsd
4
5O
rgan
s1.
2.1.
4, 1
.2.1
.4.1
, 1.2
.1.4
.2, 1
.2.1
.4.3
etcl
sa5
etcl
sb5
etcl
sc5
etcl
sd5
6B
ioch
emis
try/m
icro
biol
ogy
1.2.
1.5,
1.2
.1.5
.1, 1
.2.1
.5.2
, 1.2
.1.5
.3, 1
.2.2
.3, 1
.2.3
.3, 1
.2.3
.3.1
, 1.
2.3.
3.2 ,
1.2
.3.5
, 1.2
.3.5
.1, 1
.2.3
.5.2
, 1.2
.3.5
.3et
clsa
6et
clsb
6et
clsc
6et
clsd
6
7B
iosy
stem
s1.
2.2,
1.2
.2.1
, 1.2
.2.1
.1, 1
.2.2
.1.2
, 1.2
.2.2
, 1.2
.2.2
.1, 1
.2.2
.2.2
, 1.2
.3.2
etcl
sa7
etcl
sb7
etcl
sc7
etcl
sd7
8Ev
olut
ion
1.1.
3.4,
1.2
.3.4
, 1.2
.3.4
.1, 1
.2.3
.4.2
, 1.2
.3.4
.3et
clsa
8et
clsb
8et
clsc
8et
clsd
89
Envi
ronm
ents
& e
colo
gy1.
2.4,
1.2
.4.1
, 1.2
.4.2
, 1.2
.4.3
, 1.2
.4.3
.1, 1
.2.4
.3.2
, 1.2
.4.4
, 1.2
.4.4
.1,
1.2.
4.4.
2, 1
.2.4
.4.3
, 1.2
.4.5
etcl
sa9
etcl
sb9
etcl
sc9
etcl
sd9
10N
utrit
ion
& d
isea
se1.
2.5,
1.2
.5.1
, 1.2
.5.2
, 1.2
.5.2
.1, 1
.2.5
.2.2
etcl
sa10
etcl
sb10
etcl
sc10
etcl
sd10
11M
atte
r1.
3, 1
.3.1
, 1.3
.1.1
, 1.3
.1.1
.1, 1
.3.1
.1.2
, 1.3
.1.2
, 1.3
.1.2
.1, 1
.3.1
.2.2
etcl
sa11
etcl
sb11
etcl
sc11
etcl
sd11
12C
hem
ical
pro
perti
es1.
3.1.
3, 1
.3.1
.3.1
, 1.3
.1.3
.2, 1
.3.1
.3.3
, 1.3
.1.3
.4, 1
.3.1
.3.5
, 1.3
.5,
1.3.
5.1 ,
1.3
.5.1
.1, 1
.3.5
.1.2
et
clsa
12et
clsb
12et
clsc
12et
clsd
12
13St
ruct
ure
of m
atte
r & p
hysi
cal c
hang
es1.
3.2,
1.3
.2.1
, 1.3
.2.1
.1, 1
.3.2
.1.2
, 1.3
.2.1
.3, 1
.2.3
.1.4
, 1.3
.2.2
, 1.3
.4,
1.3.
4.1 ,
1.3
.4.1
.1, 1
.3.4
.1.2
etcl
sa13
etcl
sb13
etcl
sc13
etcl
sd13
14Fo
rces
, ene
rgy,
& tr
ansf
orm
atio
ns1.
3.3,
1.3
.3.1
, 1.3
.3.1
.1, 1
.3.3
.1.2
, 1.3
.3.3
, 1.3
.3.5
.3, 1
.3.6
, 1.3
.6.1
, 1.
3.6.
1.1 ,
1.3
.6.1
.2, 1
.3.6
.1.3
,1.3
.6.5
etcl
sa14
etcl
sb14
etcl
sc14
etcl
sd14
15Li
ght,
soun
d, h
eat,
elec
trici
ty, &
mag
netis
m1.
3.3.
2, 1
.3.3
.2.1
, 1.3
.3.2
.2, 1
.3.3
.4, 1
.3.3
.5, 1
.3.3
.5.1
, 1.3
.3.5
.2,
1.3.
3.6,
1.3
.3.6
.1, 1
.3.3
.6.2
,1.3
.3.7
, 1.3
.3.7
.1, 1
.3.3
.7.2
etcl
sa15
etcl
sb15
etcl
sc15
etcl
sd15
16M
atte
r & tr
ansf
orm
atio
ns o
f mat
ter
1.3.
2.3,
1.3
.2.3
.1, 1
.3.2
.3.2
, 1.3
.2.3
.3, 1
.3.2
.3.4
, 1.3
.2.3
.5, 1
.3.4
.2,
1.3.
4.2.
1 , 1
.3.4
.2.2
, 1.3
.4.3
etcl
sa16
etcl
sb16
etcl
sc16
etcl
sd16
17N
ucle
ar p
hysi
cs1.
1.3.
5, 1
.3.4
.4, 1
.3.4
.4.1
, 1.3
.4.4
.2, 1
.3.6
.4, 1
.3.6
.4.1
, 1.3
.6.4
.2et
clsa
17et
clsb
17et
clsc
17et
clsd
1718
Che
mic
al c
hang
es1.
3.5.
2, 1
.3.5
.2.1
, 1.3
.5.2
.2, 1
.3.5
.2.3
, 1.3
.5.3
, 1.3
.5.3
.1, 1
.3.5
.3.2
, 1.
3.5.
4, 1
.3.5
.4.1
, 1.3
.5.4
.2, 1
.3.5
.4.3
, 1.3
.5.5
, 1.3
.5.6
, 1.3
.5.7
etcl
sa18
etcl
sb18
etcl
sc18
etcl
sd18
19M
otio
n1.
3.6.
2, 1
.3.6
.2.1
, 1.3
.6.2
.2, 1
.3.6
.2.3
, 1.3
.6.3
, 1.3
.6.3
.1, 1
.3.6
.3.2
etcl
sa19
etcl
sb19
etcl
sc19
etcl
sd19
20Sc
ienc
e, te
chno
logy
, & m
ath
1.4,
1.4
.1, 1
.4.2
, 1.4
.2.1
, 1.4
.2.2
, 1.4
.3, 1
.4.3
.1, 1
.4.3
.2et
clsa
20et
clsb
20et
clsc
20et
clsd
2021
His
tory
of s
cien
ce &
tech
nolo
gy1.
5et
clsa
21et
clsb
21et
clsc
21et
clsd
2122
Envi
ronm
ents
& re
sour
ces
1.6,
1.6
.1, 1
.6.2
, 1.6
.3, 1
.6.4
, 1.6
.5, 1
.6.6
etcl
sa22
etcl
sb22
etcl
sc22
etcl
sd22
23N
atur
e of
scie
nce
1.7,
1.7
.1, 1
.7.2
etcl
sa23
etcl
sb23
etcl
sc23
etcl
sd23
24Sc
ienc
e &
oth
er d
isci
plin
es1.
8, 1
.8.1
, 1.8
.2et
clsa
24et
clsb
24et
clsc
24et
clsd
2425
Und
erst
andi
ng2.
1, 2
.1.1
, 2.1
.2, 2
.1.3
etcl
sa25
etcl
sb25
etcl
sc25
etcl
sd25
26A
naly
zing
& so
lvin
g pr
oble
ms
2.2.
2.2
.1, 2
.2.2
, 2.2
.3, 2
.2.4
, 2.2
.5et
clsa
26et
clsb
26et
clsc
26et
clsd
2627
Usi
ng to
ols &
pro
cedu
res
2.3,
2.3
.1, 2
.3.2
, 2.3
.3, 2
.3.4
, 2.3
.5et
clsa
27et
clsb
27et
clsc
27et
clsd
2728
Inve
stig
atin
g2.
4, 2
.4.1
, 2.4
.2, 2
.4.3
, 2.4
.4, 2
.4.5
etcl
sa28
etcl
sb28
etcl
sc28
etcl
sd28
29C
omm
unic
atin
g2.
5, 2
.5.1
, 2.5
.2et
clsa
29et
clsb
29et
clsc
29et
clsd
29

Education Data - Math Course-Level Curriculum Component
Data file name: edutmcl 1-18-08
Education Data - Math Course-Level Curriculum Component
ercstkn Str 5 School where course was taken identifier NOTE: Smallest 5 and largest 5 values are displayed.
Frequency Percent Value Label
6 0.5% 002
7 0.6% 003
2 0.2% 006
3 0.3% 007
5 0.4% 008
1081 96.6% 009 -8403 NOTE: Range of values omitted from display
3 0.3% 8442
1 0.1% 8928
2 0.2% 8988
5 0.4% 9321
4 0.4% 9969
erccrsid Num 4 Course identifier within school NOTE: Smallest 5 and largest 5 values are displayed.
Frequency Percent Value Label
4 0.4% 101 101
3 0.3% 201 201
1 0.1% 202 202
1 0.1% 204 204
2 0.2% 205 205
1103 98.6% 208-34208 NOTE: Range of values omitted from display
1 0.1% 35601 35601
1 0.1% 35701 35701
1 0.1% 39409 39409
14

1 0.1% 39808 39808
1 0.1% 43009 43009
etclmat Num 8 Crslvl unweighted scope in math NOTE: Smallest 5 and largest 5 values are displayed.
Frequency Percent Value Label
2 0.2% .24553555940716 .24553555940716
5 0.4% .25305662425842 .25305662425842
1 0.1% .44710009742091 .44710009742091
6 0.5% .49222648652847 .49222648652847
5 0.4% .53133602375502 .53133602375502
1048 93.7% .55239500533855-1.39024162976886 NOTE: Range of values omitted from display
26 2.3% 1.39325005570937 1.39325005570937
2 0.2% 1.41054850486726 1.41054850486726
14 1.3% 1.42784695402516 1.42784695402516
5 0.4% 1.48049440798398 1.48049440798398
5 0.4% 1.95732991955383 1.95732991955383
etclmbt Num 8 Crslvl IGP weighted scope in math NOTE: Smallest 5 and largest 5 values are displayed.
Frequency Percent Value Label
5 0.4% .45836465860637 .45836465860637
2 0.2% .47153653888762 .47153653888762
6 0.5% .55925623010487 .55925623010487
4 0.4% .56156199987501 .56156199987501
5 0.4% .58821780912855 .58821780912855
1040 92.9% .5962177577925299-1.42402225413597 NOTE: Range of values omitted from display
15 1.3% 1.42850810741545 1.42850810741545
25 2.2% 1.44280267806703 1.44280267806703
7 0.6% 1.5499238691159 1.5499238691159
5 0.4% 1.56197006378081 1.56197006378081
5 0.4% 2.15890978054092 2.15890978054092
15

etclmct Num 8 Crslvl PE weighted scope in math NOTE: Smallest 5 and largest 5 values are displayed.
Frequency Percent Value Label
2 0.2% .56207927224445 .56207927224445
5 0.4% .56692227050783 .56692227050783
5 0.4% .60801318757157 .60801318757157
4 0.4% .65531781746428 .65531781746428
25 2.2% .65748746382311 .65748746382311
1030 92.0% .65775135335687-1.48053507909655 NOTE: Range of values omitted from display
3 0.3% 1.50060732729182 1.50060732729182
23 2.1% 1.50523007172265 1.50523007172265
10 0.9% 1.57264437239105 1.57264437239105
7 0.6% 1.66821528819551 1.66821528819551
5 0.4% 2.34451676955871 2.34451676955871
etclmdt Num 8 Crslvl IGP*PE weighted scope in math NOTE: Smallest 5 and largest 5 values are displayed.
Frequency Percent Value Label
5 0.4% .64321138482676 .64321138482676
2 0.2% .6498715649016999 .6498715649016999
4 0.4% .66517754459746 .66517754459746
1 0.1% .66853340999049 .66853340999049
5 0.4% .69280841325722 .69280841325722
1062 94.9% .69447743712001-1.46168582665407 NOTE: Range of values omitted from display
8 0.7% 1.5140133762053 1.5140133762053
17 1.5% 1.54192801939099 1.54192801939099
3 0.3% 1.58445865981762 1.58445865981762
7 0.6% 1.8140234236748 1.8140234236748
5 0.4% 2.58892084700428 2.58892084700428
etclmigp Num 8 Crslvl average IGP for math NOTE: Smallest 5 and largest 5 values are displayed.
Frequency Percent Value Label
16

4 0.4% 5.11703189768476 5.11703189768476
1 0.1% 5.14305497020657 5.14305497020657
5 0.4% 5.27863962830342 5.27863962830342
3 0.3% 5.32338186977299 5.32338186977299
1 0.1% 5.40343166558371 5.40343166558371
1072 95.8% 5.57732034237201-10.6736869940197 NOTE: Range of values omitted from display
7 0.6% 10.7297269170177 10.7297269170177
1 0.1% 10.9006263154143 10.9006263154143
5 0.4% 10.979462872044 10.979462872044
3 0.3% 10.997835177818 10.997835177818
17 1.5% 11.0950440402217 11.0950440402217
etclmpe Num 8 Crslvl average PE level for math NOTE: Smallest 5 and largest 5 values are displayed.
Frequency Percent Value Label
5 0.4% 1 1
5 0.4% 1.01124146903347 1.01124146903347
25 2.2% 1.02872503840245 1.02872503840245
2 0.2% 1.08963092136627 1.08963092136627
11 1.0% 1.0905824398725 1.0905824398725
1046 93.5% 1.09869521990815-3.62715187921261 NOTE: Range of values omitted from display
1 0.1% 3.67289567279193 3.67289567279193
5 0.4% 3.84191378695121 3.84191378695121
4 0.4% 3.90458015267175 3.90458015267175
10 0.9% 3.97131869106352 3.97131869106352
5 0.4% 4 4
etclma1 Num 8 Crslvl unweighted scope in Algebra- pre-equation NOTE: Smallest 5 and largest 5 values are displayed.
Frequency Percent Value Label
186 16.6% 0 0
2 0.2% .00046977840372 .00046977840372
1 0.1% .00052378174486 .00052378174486
17

1 0.1% .00056173878864 .00056173878864
5 0.4% .00079425369099 .00079425369099
909 81.2% .00093955680745-.10045344225899 NOTE: Range of values omitted from display
2 0.2% .10197775012617 .10197775012617
4 0.4% .11132627664847 .11132627664847
2 0.2% .11300304578013 .11300304578013
6 0.5% .19565771153133 .19565771153133
1 0.1% .41837419552487 .41837419552487
etclma2 Num 8 Crslvl unweighted scope in Algebra- basic equation NOTE: Smallest 5 and largest 5 values are displayed.
Frequency Percent Value Label
83 7.4% 0 0
2 0.2% .00320433198824 .00320433198824
2 0.2% .00330835575501 .00330835575501
25 2.2% .00340700875587 .00340700875587
1 0.1% .00377705986556 .00377705986556
964 86.1% .00405129302997-.37198265082521 NOTE: Range of values omitted from display
2 0.2% .38001823063974 .38001823063974
2 0.2% .39650083477959 .39650083477959
14 1.3% .43412666794269 .43412666794269
8 0.7% .44153584624122 .44153584624122
16 1.4% .4506118377794 .4506118377794
etclma3 Num 8 Crslvl unweighted scope in Algebra- advanced equation NOTE: Smallest 5 and largest 5 values are displayed.
Frequency Percent Value Label
122 10.9% 0 0
2 0.2% .00148219350256 .00148219350256
4 0.4% .00184463138678 .00184463138678
2 0.2% .00219157810254 .00219157810254
6 0.5% .00244738271139 .00244738271139
946 84.5% .00345454543132-.38682308680365 NOTE: Range of values omitted from display
18

2 0.2% .38764558139164 .38764558139164
8 0.7% .41242015472454 .41242015472454
1 0.1% .43917222861837 .43917222861837
1 0.1% .50146849209058 .50146849209058
25 2.2% .5423353442017 .5423353442017
etclma4 Num 8 Crslvl unweighted scope in Algebra- number patterns NOTE: Smallest 5 and largest 5 values are displayed.
Frequency Percent Value Label
693 61.9% 0 0
1 0.1% .00015847892098 .00015847892098
15 1.3% .00031695784196 .00031695784196
1 0.1% .00034681947892 .00034681947892
6 0.5% .00048578489881 .00048578489881
368 32.9% .00067675087118-.01791795886468 NOTE: Range of values omitted from display
1 0.1% .01853975868578 .01853975868578
1 0.1% .02203284921578 .02203284921578
18 1.6% .02388819151165 .02388819151165
4 0.4% .02994702910827 .02994702910827
11 1.0% .04211313825679 .04211313825679
etclma5 Num 8 Crslvl unweighted scope in Algebra- basic function NOTE: Smallest 5 and largest 5 values are displayed.
Frequency Percent Value Label
182 16.3% 0 0
1 0.1% .00014376904375 .00014376904375
2 0.2% .00021565356562 .00021565356562
7 0.6% .00043130713125 .00043130713125
9 0.8% .00168106034255 .00168106034255
861 76.9% .00231548153243-.18748639188216 NOTE: Range of values omitted from display
18 1.6% .19439903679776 .19439903679776
14 1.3% .2069082946904 .2069082946904
15 1.3% .2124366233782 .2124366233782
19

1 0.1% .21442046677437 .21442046677437
9 0.8% .29575908466064 .29575908466064
etclma6 Num 8 Crslvl unweighted scope in Algebra- advanced function NOTE: Smallest 5 and largest 5 values are displayed.
Frequency Percent Value Label
418 37.4% 0 0
1 0.1% .00049654254206 .00049654254206
12 1.1% .00060450565187 .00060450565187
3 0.3% .00099308508413 .00099308508413
4 0.4% .00120901130374 .00120901130374
647 57.8% .00124291188047-.09249297855268 NOTE: Range of values omitted from display
11 1.0% .1045802392765 .1045802392765
5 0.4% .11517681206556 .11517681206556
3 0.3% .13055589427437 .13055589427437
13 1.2% .13236413813713 .13236413813713
2 0.2% .13241830079119 .13241830079119
etclma7 Num 8 Crslvl unweighted scope in Algebra- basic number NOTE: Smallest 5 and largest 5 values are displayed.
Frequency Percent Value Label
339 30.3% 0 0
1 0.1% .0005967485175 .0005967485175
3 0.3% .00087852701011 .00087852701011
3 0.3% .00106963383714 .00106963383714
4 0.4% .00113365492584 .00113365492584
728 65.1% .001193497035-.07306158515344 NOTE: Range of values omitted from display
16 1.4% .07695403767528 .07695403767528
12 1.1% .08010054847886 .08010054847886
1 0.1% .08461935452456 .08461935452456
1 0.1% .08633441437149 .08633441437149
11 1.0% .09571479106769 .09571479106769
20

etclma8 Num 8 Crslvl unweighted scope in Algebra- advanced number NOTE: Smallest 5 and largest 5 values are displayed.
Frequency Percent Value Label
111 9.9% 0 0
10 0.9% .00051472789958 .00051472789958
1 0.1% .0008138305257 .0008138305257
3 0.3% .00087852701011 .00087852701011
1 0.1% .00129700962966 .00129700962966
966 86.3% .00174209546878-.15751203042553 NOTE: Range of values omitted from display
16 1.4% .15875718161167 .15875718161167
1 0.1% .17024596933609 .17024596933609
4 0.4% .19603085401287 .19603085401287
2 0.2% .23091548667812 .23091548667812
4 0.4% .25445821111553 .25445821111553
etclma9 Num 8 Crslvl unweighted scope in Geometry- 2-D NOTE: Smallest 5 and largest 5 values are displayed.
Frequency Percent Value Label
31 2.8% 0 0
4 0.4% .00303884471471 .00303884471471
17 1.5% .00386079177221 .00386079177221
2 0.2% .00471989384441 .00471989384441
13 1.2% .00479326473047 .00479326473047
1015 90.7% .00531316109377-.52941768850684 NOTE: Range of values omitted from display
1 0.1% .53029176035666 .53029176035666
7 0.6% .53950293072485 .53950293072485
2 0.2% .5698177045632 .5698177045632
17 1.5% .61021772061955 .61021772061955
10 0.9% .6299960948271101 .6299960948271101
etclma10 Num 8 Crslvl unweighted scope in Geometry- points, lines, shapes intheir perimeters, areas and volume NOTE: Smallest 5 and largest 5 values are displayed.
Frequency Percent Value Label
21

460 41.1% 0 0
2 0.2% .00056297698305 .00056297698305
11 1.0% .00104431501876 .00104431501876
1 0.1% .00111098645753 .00111098645753
6 0.5% .0011259539661 .0011259539661
609 54.4% .00123555861657-.09680072086613 NOTE: Range of values omitted from display
3 0.3% .09811341711136 .09811341711136
3 0.3% .09813328004475 .09813328004475
7 0.6% .10542626955815 .10542626955815
6 0.5% .10771108511223 .10771108511223
11 1.0% .1329947403824 .1329947403824
etclma11 Num 8 Crslvl unweighted scope in Geometry- conic sections and theirequations, and equations for lines and planes NOTE: Smallest 5 and largest 5 values are displayed.
Frequency Percent Value Label
31 2.8% 0 0
6 0.5% .00326286496751 .00326286496751
3 0.3% .00336083137872 .00336083137872
11 1.0% .00556109814138 .00556109814138
2 0.2% .00661625772056 .00661625772056
1043 93.2% .00668213611588-.18629163664512 NOTE: Range of values omitted from display
4 0.4% .19378311015248 .19378311015248
5 0.4% .19419577708488 .19419577708488
4 0.4% .21092303843065 .21092303843065
6 0.5% .2679339225867 .2679339225867
4 0.4% .31430500019065 .31430500019065
etclma12 Num 8 Crslvl unweighted scope in Geometry- transformation,congruence and similarity NOTE: Smallest 5 and largest 5 values are displayed.
Frequency Percent Value Label
158 14.1% 0 0
1 0.1% .00041723856339 .00041723856339
22

2 0.2% .00075088292315 .00075088292315
35 3.1% .00083447712679 .00083447712679
13 1.2% .0008499999581 .0008499999581
878 78.5% .00128693059073-.18869713751364 NOTE: Range of values omitted from display
4 0.4% .21119310353048 .21119310353048
1 0.1% .21574963769679 .21574963769679
18 1.6% .2224275241798 .2224275241798
7 0.6% .23438021835411 .23438021835411
2 0.2% .25592540187576 .25592540187576
etclma13 Num 8 Crslvl unweighted scope in Numbers and arithmetic- wholenumbers NOTE: Smallest 5 and largest 5 values are displayed.
Frequency Percent Value Label
459 41.0% 0 0
1 0.1% .00104816310945 .00104816310945
8 0.7% .00109858347634 .00109858347634
1 0.1% .00140933521118 .00140933521118
1 0.1% .0014122594228 .0014122594228
590 52.7% .00166969317748-.0875013540189 NOTE: Range of values omitted from display
1 0.1% .09612490163293 .09612490163293
49 4.4% .10242281251113 .10242281251113
1 0.1% .12696865781136 .12696865781136
3 0.3% .13006508018922 .13006508018922
5 0.4% .13944820293205 .13944820293205
etclma14 Num 8 Crslvl unweighted scope in Fractions NOTE: Smallest 5 and largest 5 values are displayed.
Frequency Percent Value Label
306 27.3% 0 0
6 0.5% .00023518748796 .00023518748796
1 0.1% .0004087586505 .0004087586505
7 0.6% .000575076175 .000575076175
23

1 0.1% .00062351847895 .00062351847895
780 69.7% .0006818081649-.27139981267707 NOTE: Range of values omitted from display
4 0.4% .38663213931489 .38663213931489
3 0.3% .41365810367926 .41365810367926
5 0.4% .41974577575315 .41974577575315
4 0.4% .5090546995158201 .5090546995158201
2 0.2% .50997584746118 .50997584746118
etclma15 Num 8 Crslvl unweighted scope in Number theory NOTE: Smallest 5 and largest 5 values are displayed.
Frequency Percent Value Label
739 66.0% 0 0
1 0.1% .00017301864408 .00017301864408
3 0.3% .00025952796613 .00025952796613
17 1.5% .00051905593226 .00051905593226
1 0.1% .00071060859879 .00071060859879
320 28.6% .00084221555087-.03231060587159 NOTE: Range of values omitted from display
4 0.4% .03577466931941 .03577466931941
16 1.4% .03634164314466 .03634164314466
5 0.4% .03716499601518 .03716499601518
9 0.8% .05331372924316 .05331372924316
4 0.4% .06462121174318 .06462121174318
etclma16 Num 8 Crslvl unweighted scope in Discrete math NOTE: Smallest 5 and largest 5 values are displayed.
Frequency Percent Value Label
466 41.6% 0 0
1 0.1% .00028953487977 .00028953487977
1 0.1% .00033989214393 .00033989214393
1 0.1% .00064437777981 .00064437777981
1 0.1% .00067978428786 .00067978428786
630 56.3% .00086860463933-.03702267123702 NOTE: Range of values omitted from display
1 0.1% .03725487212075 .03725487212075
24

11 1.0% .03914273655967 .03914273655967
1 0.1% .04393697254159 .04393697254159
4 0.4% .05363559541115 .05363559541115
2 0.2% .05734483308694 .05734483308694
etclma17 Num 8 Crslvl unweighted scope in Estimation NOTE: Smallest 5 and largest 5 values are displayed.
Frequency Percent Value Label
375 33.5% 0 0
1 0.1% .00010307146726 .00010307146726
15 1.3% .00020614293452 .00020614293452
1 0.1% .00021104085926 .00021104085926
3 0.3% .00061132458271 .00061132458271
665 59.4% .00073928285639-.03371934319098 NOTE: Range of values omitted from display
3 0.3% .0397942140057 .0397942140057
35 3.1% .0409440461283 .0409440461283
11 1.0% .04716279389195 .04716279389195
5 0.4% .04978904955738 .04978904955738
5 0.4% .05801985289701 .05801985289701
etclma18 Num 8 Crslvl unweighted scope in Measurement NOTE: Smallest 5 and largest 5 values are displayed.
Frequency Percent Value Label
392 35.0% 0 0
4 0.4% .00019754215978 .00019754215978
1 0.1% .00033727449046 .00033727449046
49 4.4% .00039508431956 .00039508431956
3 0.3% .00041919399855 .00041919399855
653 58.4% .00042499997905-.05510565428291 NOTE: Range of values omitted from display
4 0.4% .06551727976869 .06551727976869
4 0.4% .06910957163549 .06910957163549
2 0.2% .07554383815271 .07554383815271
3 0.3% .08200170544432 .08200170544432
25

4 0.4% .18132371671176 .18132371671176
etclma19 Num 8 Crslvl unweighted scope in Perimeter, area, and volume NOTE: Smallest 5 and largest 5 values are displayed.
Frequency Percent Value Label
97 8.7% 0 0
1 0.1% .00035530429939 .00035530429939
3 0.3% .00124478930238 .00124478930238
3 0.3% .00153726916767 .00153726916767
27 2.4% .00159369829508 .00159369829508
959 85.7% .00170909107815-.1188128008381 NOTE: Range of values omitted from display
10 0.9% .12422074677541 .12422074677541
1 0.1% .12991931833612 .12991931833612
2 0.2% .15431699331992 .15431699331992
6 0.5% .16642077730779 .16642077730779
10 0.9% .18091116731707 .18091116731707
etclma20 Num 8 Crslvl unweighted scope in Probability- proportionality concepts NOTE: Smallest 5 and largest 5 values are displayed.
Frequency Percent Value Label
368 32.9% 0 0
1 0.1% .00013212494557 .00013212494557
2 0.2% .00020995323393 .00020995323393
15 1.3% .00026424989115 .00026424989115
1 0.1% .00027052842833 .00027052842833
702 62.7% .00040543808569-.0310259458454 NOTE: Range of values omitted from display
15 1.3% .03488737755955 .03488737755955
2 0.2% .0566785544055 .0566785544055
4 0.4% .05993186191614 .05993186191614
4 0.4% .08852566893846 .08852566893846
5 0.4% .1125007140289 .1125007140289
etclma21 Num 8 Crslvl unweighted scope in Probability- proportionalityproblems
26

NOTE: Smallest 5 and largest 5 values are displayed.
Frequency Percent Value Label
336 30.0% 0 0
5 0.4% .00044863061091 .00044863061091
3 0.3% .00064346529536 .00064346529536
1 0.1% .00111858265287 .00111858265287
1 0.1% .00121046395379 .00121046395379
766 68.5% .00128693059073-.04768730815698 NOTE: Range of values omitted from display
1 0.1% .04914273832084 .04914273832084
1 0.1% .05286697621203 .05286697621203
2 0.2% .05445280454661 .05445280454661
1 0.1% .05671124048425 .05671124048425
2 0.2% .06785783565533 .06785783565533
etclma22 Num 8 Crslvl unweighted scope in Probability- linear interpolation andextrapolation NOTE: Smallest 5 and largest 5 values are displayed.
Frequency Percent Value Label
922 82.4% 0 0
1 0.1% .000088808084 .000088808084
5 0.4% .00017761616801 .00017761616801
49 4.4% .00035523233603 .00035523233603
2 0.2% .00053481025772 .00053481025772
102 9.1% .00058659683747-.0039709046213 NOTE: Range of values omitted from display
1 0.1% .0041557974454 .0041557974454
5 0.4% .00488025200199 .00488025200199
13 1.2% .00560658483014 .00560658483014
4 0.4% .006547866921 .006547866921
15 1.3% .0083115948908 .0083115948908
etclma23 Num 8 Crslvl unweighted scope in Trigonometry NOTE: Smallest 5 and largest 5 values are displayed.
Frequency Percent Value Label
27

243 21.7% 0 0
1 0.1% .0003912424269 .0003912424269
1 0.1% .00058686364035 .00058686364035
1 0.1% .00072615624554 .00072615624554
3 0.3% .00088132912808 .00088132912808
838 74.9% .0011737272807-.13585281790974 NOTE: Range of values omitted from display
1 0.1% .14003030481043 .14003030481043
15 1.3% .1646009417486 .1646009417486
1 0.1% .16698445159803 .16698445159803
11 1.0% .16864869775758 .16864869775758
4 0.4% .22029153973319 .22029153973319
etclma24 Num 8 Crslvl unweighted scope in Statistics- data representation andanalysis NOTE: Smallest 5 and largest 5 values are displayed.
Frequency Percent Value Label
229 20.5% 0 0
1 0.1% .00016863724523 .00016863724523
1 0.1% .00023488920186 .00023488920186
17 1.5% .00033727449046 .00033727449046
2 0.2% .00040352644709 .00040352644709
853 76.2% .00046977840372-.13967589680195 NOTE: Range of values omitted from display
3 0.3% .15235249398296 .15235249398296
9 0.8% .16442943144666 .16442943144666
1 0.1% .18078745720771 .18078745720771
2 0.2% .30005272601111 .30005272601111
1 0.1% .5768973609093599 .5768973609093599
etclma25 Num 8 Crslvl unweighted scope in Statistics- uncertainty and probabilityNOTE: Smallest 5 and largest 5 values are displayed.
Frequency Percent Value Label
175 15.6% 0 0
6 0.5% .00156698419524 .00156698419524
28

2 0.2% .0017037424261 .0017037424261
5 0.4% .00181276898717 .00181276898717
11 1.0% .0026146604908 .0026146604908
904 80.8% .00321330978803-.0947162295761 NOTE: Range of values omitted from display
1 0.1% .09754057081611 .09754057081611
9 0.8% .13218522098736 .13218522098736
3 0.3% .27389941266689 .27389941266689
1 0.1% .31643133690562 .31643133690562
2 0.2% .53616817044675 .53616817044675
etclma26 Num 8 Crslvl unweighted scope in Calculus- infinite process NOTE: Smallest 5 and largest 5 values are displayed.
Frequency Percent Value Label
525 46.9% 0 0
3 0.3% .00050580726926 .00050580726926
49 4.4% .00101161453853 .00101161453853
2 0.2% .00106505475245 .00106505475245
1 0.1% .0014539253647 .0014539253647
498 44.5% .00209579275741-.19538364556379 NOTE: Range of values omitted from display
3 0.3% .19974409477962 .19974409477962
13 1.2% .21240796922766 .21240796922766
3 0.3% .21416514874553 .21416514874553
17 1.5% .22213955253283 .22213955253283
5 0.4% .272162154532 .272162154532
etclma27 Num 8 Crslvl unweighted scope in Calculus- change NOTE: Smallest 5 and largest 5 values are displayed.
Frequency Percent Value Label
565 50.5% 0 0
14 1.3% .00109702836953 .00109702836953
1 0.1% .00152875020529 .00152875020529
1 0.1% .00189369899834 .00189369899834
1 0.1% .00229705336175 .00229705336175
29

500 44.7% .00255487442098-.49128615275728 NOTE: Range of values omitted from display
5 0.4% .50316821363051 .50316821363051
3 0.3% .5534470879935099 .5534470879935099
17 1.5% .61560802322973 .61560802322973
7 0.6% .62666256894525 .62666256894525
5 0.4% 1.00096134919608 1.00096134919608
etclma28 Num 8 Crslvl unweighted scope in Validation and structuring NOTE: Smallest 5 and largest 5 values are displayed.
Frequency Percent Value Label
418 37.4% 0 0
1 0.1% .00003531984282 .00003531984282
1 0.1% .00005297976424 .00005297976424
4 0.4% .00010595952848 .00010595952848
21 1.9% .00026641616988 .00026641616988
621 55.5% .00062190948903-.0939658661415 NOTE: Range of values omitted from display
11 1.0% .10436190495676 .10436190495676
6 0.5% .12249885144537 .12249885144537
21 1.9% .12566222195253 .12566222195253
12 1.1% .13781768469701 .13781768469701
3 0.3% .19298712103036 .19298712103036
etclma29 Num 8 Crslvl unweighted scope in other topics NOTE: Smallest 5 and largest 5 values are displayed.
Frequency Percent Value Label
321 28.7% 0 0
1 0.1% .00042245312674 .00042245312674
2 0.2% .00084490625349 .00084490625349
2 0.2% .00088772863149 .00088772863149
15 1.3% .00104692513422 .00104692513422
762 68.1% .00111390558732-.12167390557562 NOTE: Range of values omitted from display
2 0.2% .12524706077864 .12524706077864
5 0.4% .13607313494263 .13607313494263
30

4 0.4% .14802555487388 .14802555487388
4 0.4% .30034330122884 .30034330122884
1 0.1% .36709122950104 .36709122950104
etclmb1 Num 8 Crslvl IGP scope in Algebra- pre-equation NOTE: Smallest 5 and largest 5 values are displayed.
Frequency Percent Value Label
186 16.6% 0 0
2 0.2% .00041807749407 .00041807749407
1 0.1% .00061056372418 .00061056372418
5 0.4% .00071604750422 .00071604750422
1 0.1% .00081415383653 .00081415383653
909 81.2% .00083615498815-.08819402563618 NOTE: Range of values omitted from display
2 0.2% .09832547257728 .09832547257728
2 0.2% .0993961605225 .0993961605225
4 0.4% .10007281092493 .10007281092493
6 0.5% .17756580842493 .17756580842493
1 0.1% .34985661880073 .34985661880073
etclmb2 Num 8 Crslvl IGP scope in Algebra- basic equation NOTE: Smallest 5 and largest 5 values are displayed.
Frequency Percent Value Label
83 7.4% 0 0
2 0.2% .00297134794796 .00297134794796
2 0.2% .00321342063858 .00321342063858
25 2.2% .00372009148988 .00372009148988
2 0.2% .00390874619231 .00390874619231
963 86.1% .00419599572506-.38451837751996 NOTE: Range of values omitted from display
2 0.2% .39514241448574 .39514241448574
2 0.2% .41848185551899 .41848185551899
14 1.3% .43704103882344 .43704103882344
8 0.7% .45034793465987 .45034793465987
16 1.4% .48369407370817 .48369407370817
31

etclmb3 Num 8 Crslvl IGP scope in Algebra- advanced equation NOTE: Smallest 5 and largest 5 values are displayed.
Frequency Percent Value Label
122 10.9% 0 0
2 0.2% .00197962862926 .00197962862926
4 0.4% .00260171089486 .00260171089486
2 0.2% .00315585038582 .00315585038582
6 0.5% .00338629902931 .00338629902931
946 84.5% .00376859800662-.41315935756307 NOTE: Range of values omitted from display
2 0.2% .42447339284145 .42447339284145
8 0.7% .47363260279461 .47363260279461
1 0.1% .47444679114988 .47444679114988
1 0.1% .5471865226297 .5471865226297
25 2.2% .57559937766627 .57559937766627
etclmb4 Num 8 Crslvl IGP scope in Algebra- number patterns NOTE: Smallest 5 and largest 5 values are displayed.
Frequency Percent Value Label
693 61.9% 0 0
1 0.1% .00019062237085 .00019062237085
1 0.1% .00034173810116 .00034173810116
15 1.3% .00038124474171 .00038124474171
6 0.5% .00062442780938 .00062442780938
368 32.9% .00098024115957-.02099509253062 NOTE: Range of values omitted from display
1 0.1% .02240889355653 .02240889355653
18 1.6% .02877649766211 .02877649766211
1 0.1% .03375407851412 .03375407851412
4 0.4% .03951353885191 .03951353885191
11 1.0% .04976847656426 .04976847656426
etclmb5 Num 8 Crslvl IGP scope in Algebra- basic function NOTE: Smallest 5 and largest 5 values are displayed.
Frequency Percent Value Label
32

182 16.3% 0 0
1 0.1% .00012405548434 .00012405548434
2 0.2% .00018608322651 .00018608322651
7 0.6% .00037216645303 .00037216645303
9 0.8% .00186679477915 .00186679477915
861 76.9% .00189574951615-.19841809938636 NOTE: Range of values omitted from display
18 1.6% .20978801535526 .20978801535526
14 1.3% .21236360609648 .21236360609648
15 1.3% .22440193195473 .22440193195473
1 0.1% .2428444113932 .2428444113932
9 0.8% .31727008625171 .31727008625171
etclmb6 Num 8 Crslvl IGP scope in Algebra- advanced function NOTE: Smallest 5 and largest 5 values are displayed.
Frequency Percent Value Label
418 37.4% 0 0
1 0.1% .00052724247031 .00052724247031
12 1.1% .00086490806184 .00086490806184
3 0.3% .00105448494062 .00105448494062
10 0.9% .00112744358844 .00112744358844
641 57.3% .00172981612369-.0999665809519 NOTE: Range of values omitted from display
11 1.0% .12175135369992 .12175135369992
5 0.4% .12840124321057 .12840124321057
3 0.3% .13655730991148 .13655730991148
13 1.2% .14210876888675 .14210876888675
2 0.2% .18663456254937 .18663456254937
etclmb7 Num 8 Crslvl IGP scope in Algebra- basic number NOTE: Smallest 5 and largest 5 values are displayed.
Frequency Percent Value Label
339 30.3% 0 0
6 0.5% .0003078453663 .0003078453663
1 0.1% .00044687414786 .00044687414786
33

1 0.1% .00079184056542 .00079184056542
3 0.3% .0008355340809 .0008355340809
725 64.8% .00089374829572-.06860315380618 NOTE: Range of values omitted from display
16 1.4% .07155591048709 .07155591048709
12 1.1% .07261094997041 .07261094997041
4 0.4% .0810951755342 .0810951755342
1 0.1% .08114216355876 .08114216355876
11 1.0% .09072841663043 .09072841663043
etclmb8 Num 8 Crslvl IGP scope in Algebra- advanced number NOTE: Smallest 5 and largest 5 values are displayed.
Frequency Percent Value Label
111 9.9% 0 0
10 0.9% .00063337387674 .00063337387674
3 0.3% .00086010861269 .00086010861269
1 0.1% .00093219935219 .00093219935219
18 1.6% .00137499097822 .00137499097822
963 86.1% .00172021722539-.16177789134972 NOTE: Range of values omitted from display
2 0.2% .16315535033113 .16315535033113
1 0.1% .18713267013169 .18713267013169
4 0.4% .19796060196198 .19796060196198
2 0.2% .23096207403767 .23096207403767
4 0.4% .23615277113143 .23615277113143
etclmb9 Num 8 Crslvl IGP scope in Geometry- 2-D NOTE: Smallest 5 and largest 5 values are displayed.
Frequency Percent Value Label
31 2.8% 0 0
4 0.4% .00326267108857 .00326267108857
17 1.5% .00340306180402 .00340306180402
13 1.2% .00385776412506 .00385776412506
1 0.1% .00417324635138 .00417324635138
1004 89.7% .00448872857769-.43986295280474 NOTE: Range of values omitted from display
34

1 0.1% .4510526454142 .4510526454142
2 0.2% .46382822537407 .46382822537407
19 1.7% .46596942696225 .46596942696225
17 1.5% .49152058688198 .49152058688198
10 0.9% .5383664411220001 .5383664411220001
etclmb10 Num 8 Crslvl IGP scope in Geometry- points, lines, shapes in theirperimeters, areas and volume NOTE: Smallest 5 and largest 5 values are displayed.
Frequency Percent Value Label
460 41.1% 0 0
1 0.1% .00064396873791 .00064396873791
2 0.2% .00078933707915 .00078933707915
11 1.0% .0010104159426 .0010104159426
1 0.1% .00115416117481 .00115416117481
612 54.7% .00128793747582-.0832604520295 NOTE: Range of values omitted from display
7 0.6% .08813922715498 .08813922715498
3 0.3% .09133447422032 .09133447422032
6 0.5% .09269709092926 .09269709092926
5 0.4% .10057630347667 .10057630347667
11 1.0% .11037474323425 .11037474323425
etclmb11 Num 8 Crslvl IGP scope in Geometry- conic sections and theirequations, and equations for lines and planes NOTE: Smallest 5 and largest 5 values are displayed.
Frequency Percent Value Label
31 2.8% 0 0
3 0.3% .00370373860911 .00370373860911
11 1.0% .00474246256991 .00474246256991
6 0.5% .00537023023738 .00537023023738
2 0.2% .00708145665488 .00708145665488
1046 93.5% .00740649539304-.18514606042735 NOTE: Range of values omitted from display
5 0.4% .18968516549714 .18968516549714
1 0.1% .20716091124374 .20716091124374
35

4 0.4% .21540590035033 .21540590035033
6 0.5% .25625203171144 .25625203171144
4 0.4% .34706659850722 .34706659850722
etclmb12 Num 8 Crslvl IGP scope in Geometry- transformation, congruence andsimilarity NOTE: Smallest 5 and largest 5 values are displayed.
Frequency Percent Value Label
158 14.1% 0 0
1 0.1% .00023000007807 .00023000007807
2 0.2% .00038431456931 .00038431456931
35 3.1% .00046000015615 .00046000015615
13 1.2% .00062490785318 .00062490785318
875 78.2% .00072612235618-.14644981534128 NOTE: Range of values omitted from display
7 0.6% .15249046335052 .15249046335052
4 0.4% .15936987743594 .15936987743594
18 1.6% .16154754284322 .16154754284322
4 0.4% .17055793610387 .17055793610387
2 0.2% .18262022450827 .18262022450827
etclmb13 Num 8 Crslvl IGP scope in Numbers and arithmetic- whole numbers NOTE: Smallest 5 and largest 5 values are displayed.
Frequency Percent Value Label
459 41.0% 0 0
1 0.1% .00017917606888 .00017917606888
1 0.1% .00020619821915 .00020619821915
9 0.8% .00021375957866 .00021375957866
4 0.4% .00023591064393 .00023591064393
621 55.5% .00029031212643-.03483284711775 NOTE: Range of values omitted from display
6 0.5% .03571089811861 .03571089811861
3 0.3% .037178306179 .037178306179
9 0.8% .04216813901525 .04216813901525
1 0.1% .06152564622369 .06152564622369
36

5 0.4% .07615435775676 .07615435775676
etclmb14 Num 8 Crslvl IGP scope in Fractions NOTE: Smallest 5 and largest 5 values are displayed.
Frequency Percent Value Label
306 27.3% 0 0
6 0.5% .000131978686 .000131978686
1 0.1% .00026226845048 .00026226845048
1 0.1% .0003224723208 .0003224723208
12 1.1% .0004029280913 .0004029280913
775 69.3% .0004037967663-.25328950464777 NOTE: Range of values omitted from display
3 0.3% .30426906421664 .30426906421664
4 0.4% .3441727606343 .3441727606343
5 0.4% .36475008921629 .36475008921629
2 0.2% .43799721538276 .43799721538276
4 0.4% .51544567128985 .51544567128985
etclmb15 Num 8 Crslvl IGP scope in Number theory NOTE: Smallest 5 and largest 5 values are displayed.
Frequency Percent Value Label
739 66.0% 0 0
1 0.1% .00012857600706 .00012857600706
3 0.3% .00019286401059 .00019286401059
17 1.5% .00038572802119 .00038572802119
1 0.1% .0004777815958 .0004777815958
321 28.7% .00053955391256-.02915472602878 NOTE: Range of values omitted from display
16 1.4% .02969093093161 .02969093093161
4 0.4% .03266794721138 .03266794721138
4 0.4% .03861999540262 .03861999540262
9 0.8% .04046705473841 .04046705473841
4 0.4% .05139877818227 .05139877818227
etclmb16 Num 8 Crslvl IGP scope in Discrete math NOTE: Smallest 5 and largest 5 values are displayed.
37

Frequency Percent Value Label
466 41.6% 0 0
1 0.1% .00038400405197 .00038400405197
1 0.1% .00046088335236 .00046088335236
1 0.1% .00084831802841 .00084831802841
1 0.1% .00092176670473 .00092176670473
638 57.0% .0009901378222-.04457209527903 NOTE: Range of values omitted from display
3 0.3% .045446211484 .045446211484
1 0.1% .04704427863977 .04704427863977
1 0.1% .05685618136861 .05685618136861
4 0.4% .06593708589992 .06593708589992
2 0.2% .06924358967982 .06924358967982
etclmb17 Num 8 Crslvl IGP scope in Estimation NOTE: Smallest 5 and largest 5 values are displayed.
Frequency Percent Value Label
375 33.5% 0 0
1 0.1% .00003662954258 .00003662954258
15 1.3% .00007325908517 .00007325908517
1 0.1% .00008042014186 .00008042014186
2 0.2% .00044644703831 .00044644703831
660 59.0% .00065066292304-.02500059839639 NOTE: Range of values omitted from display
5 0.4% .02797520422161 .02797520422161
35 3.1% .03154329979697 .03154329979697
9 0.8% .03171545126886 .03171545126886
11 1.0% .03254536386497 .03254536386497
5 0.4% .0424984421962 .0424984421962
etclmb18 Num 8 Crslvl IGP scope in Measurement NOTE: Smallest 5 and largest 5 values are displayed.
Frequency Percent Value Label
392 35.0% 0 0
4 0.4% .00007621983339 .00007621983339
38

1 0.1% .00013576337814 .00013576337814
49 4.4% .00015243966679 .00015243966679
3 0.3% .00016167197744 .00016167197744
653 58.4% .00016824442201-.03478061040136 NOTE: Range of values omitted from display
2 0.2% .03622745761305 .03622745761305
4 0.4% .03832404676814 .03832404676814
4 0.4% .04807215814297 .04807215814297
3 0.3% .05638735117173 .05638735117173
4 0.4% .12417708863176 .12417708863176
etclmb19 Num 8 Crslvl IGP scope in Perimeter, area, and volume NOTE: Smallest 5 and largest 5 values are displayed.
Frequency Percent Value Label
97 8.7% 0 0
1 0.1% .00030856728062 .00030856728062
3 0.3% .00049086605874 .00049086605874
4 0.4% .00091886898638 .00091886898638
3 0.3% .0010253868927 .0010253868927
982 87.8% .00110340116785-.08367594141326 NOTE: Range of values omitted from display
10 0.9% .0842742274024 .0842742274024
1 0.1% .09381913085192 .09381913085192
2 0.2% .09540262289839 .09540262289839
10 0.9% .11215201294114 .11215201294114
6 0.5% .13020052575477 .13020052575477
etclmb20 Num 8 Crslvl IGP scope in Probability- proportionality concepts NOTE: Smallest 5 and largest 5 values are displayed.
Frequency Percent Value Label
368 32.9% 0 0
2 0.2% .00013593456518 .00013593456518
1 0.1% .00014086370697 .00014086370697
14 1.3% .00027186913037 .00027186913037
1 0.1% .00027519741988 .00027519741988
39

703 62.8% .00027743277256-.0252643397621 NOTE: Range of values omitted from display
15 1.3% .02725086630173 .02725086630173
4 0.4% .04065443848248 .04065443848248
2 0.2% .05219732668584 .05219732668584
4 0.4% .07840670475459 .07840670475459
5 0.4% .09676327358284 .09676327358284
etclmb21 Num 8 Crslvl IGP scope in Probability- proportionality problems NOTE: Smallest 5 and largest 5 values are displayed.
Frequency Percent Value Label
336 30.0% 0 0
5 0.4% .00031173840598 .00031173840598
3 0.3% .00062034980802 .00062034980802
2 0.2% .00121888763341 .00121888763341
17 1.5% .00124069961605 .00124069961605
740 66.1% .00129937871387-.03851130121812 NOTE: Range of values omitted from display
1 0.1% .04100843339655 .04100843339655
1 0.1% .0418594438376 .0418594438376
2 0.2% .04363654164106 .04363654164106
10 0.9% .04961280632913 .04961280632913
2 0.2% .05329105649705 .05329105649705
etclmb22 Num 8 Crslvl IGP scope in Probability- linear interpolation andextrapolation NOTE: Smallest 5 and largest 5 values are displayed.
Frequency Percent Value Label
922 82.4% 0 0
1 0.1% .0001027973579 .0001027973579
5 0.4% .00020559471581 .00020559471581
49 4.4% .00041118943163 .00041118943163
2 0.2% .0004681981181 .0004681981181
102 9.1% .00070229717715-.00409524902351 NOTE: Range of values omitted from display
1 0.1% .00464546489216 .00464546489216
40

13 1.2% .00578152648966 .00578152648966
5 0.4% .00595066267978 .00595066267978
4 0.4% .0061982531594 .0061982531594
15 1.3% .00929092978433 .00929092978433
etclmb23 Num 8 Crslvl IGP scope in Trigonometry NOTE: Smallest 5 and largest 5 values are displayed.
Frequency Percent Value Label
243 21.7% 0 0
1 0.1% .00049248081306 .00049248081306
1 0.1% .00073872121959 .00073872121959
1 0.1% .00081970091923 .00081970091923
3 0.3% .00109904781774 .00109904781774
835 74.6% .00147744243919-.1498700446063 NOTE: Range of values omitted from display
4 0.4% .15024703738306 .15024703738306
15 1.3% .17020130161513 .17020130161513
11 1.0% .17275674130275 .17275674130275
1 0.1% .18512131083294 .18512131083294
4 0.4% .24373886991876 .24373886991876
etclmb24 Num 8 Crslvl IGP scope in Statistics- data representation and analysis NOTE: Smallest 5 and largest 5 values are displayed.
Frequency Percent Value Label
229 20.5% 0 0
1 0.1% .00019410740796 .00019410740796
1 0.1% .00022975340917 .00022975340917
5 0.4% .00038821481592 .00038821481592
2 0.2% .00042386081714 .00042386081714
860 76.9% .00045950681835-.13187568921385 NOTE: Range of values omitted from display
13 1.2% .13633174025601 .13633174025601
2 0.2% .13997584353723 .13997584353723
3 0.3% .16295115062755 .16295115062755
2 0.2% .32087655628754 .32087655628754
41

1 0.1% .67302697663051 .67302697663051
etclmb25 Num 8 Crslvl IGP scope in Statistics- uncertainty and probability NOTE: Smallest 5 and largest 5 values are displayed.
Frequency Percent Value Label
175 15.6% 0 0
11 1.0% .00114244634721 .00114244634721
6 0.5% .00209716738507 .00209716738507
5 0.4% .00227702804715 .00227702804715
2 0.2% .00267374894127 .00267374894127
904 80.8% .00314428322038-.11450701132397 NOTE: Range of values omitted from display
1 0.1% .11948675916893 .11948675916893
9 0.8% .15136061076821 .15136061076821
3 0.3% .36621186289129 .36621186289129
1 0.1% .41311025872317 .41311025872317
2 0.2% .71775124886387 .71775124886387
etclmb26 Num 8 Crslvl IGP scope in Calculus- infinite process NOTE: Smallest 5 and largest 5 values are displayed.
Frequency Percent Value Label
525 46.9% 0 0
3 0.3% .0006605452717 .0006605452717
49 4.4% .00132109054341 .00132109054341
2 0.2% .00154024228219 .00154024228219
1 0.1% .00223275859018 .00223275859018
498 44.5% .00260454659114-.2534838088483 NOTE: Range of values omitted from display
3 0.3% .25878608377365 .25878608377365
3 0.3% .27649784700587 .27649784700587
13 1.2% .28146090017553 .28146090017553
17 1.5% .28544936000398 .28544936000398
5 0.4% .31856517804064 .31856517804064
etclmb27 Num 8 Crslvl IGP scope in Calculus- change NOTE: Smallest 5 and largest 5 values are displayed.
42

Frequency Percent Value Label
565 50.5% 0 0
1 0.1% .00126129703581 .00126129703581
14 1.3% .00142054562927 .00142054562927
15 1.3% .00218369589 .00218369589
1 0.1% .00248205947083 .00248205947083
490 43.8% .00252259407162-.6066905435733601 NOTE: Range of values omitted from display
1 0.1% .6387646184942301 .6387646184942301
3 0.3% .7102856936344401 .7102856936344401
7 0.6% .73116957628517 .73116957628517
17 1.5% .7818067687746501 .7818067687746501
5 0.4% 1.15560696818487 1.15560696818487
etclmb28 Num 8 Crslvl IGP scope in Validation and structuring NOTE: Smallest 5 and largest 5 values are displayed.
Frequency Percent Value Label
418 37.4% 0 0
1 0.1% .00003547174122 .00003547174122
1 0.1% .00005320761183 .00005320761183
4 0.4% .00010641522367 .00010641522367
21 1.9% .00030073635074 .00030073635074
621 55.5% .00071469986208-.10564644679948 NOTE: Range of values omitted from display
11 1.0% .12752302277272 .12752302277272
6 0.5% .14054972954813 .14054972954813
21 1.9% .14278158841285 .14278158841285
12 1.1% .16218964830899 .16218964830899
3 0.3% .23049876198607 .23049876198607
etclmb29 Num 8 Crslvl IGP scope in other topics NOTE: Smallest 5 and largest 5 values are displayed.
Frequency Percent Value Label
321 28.7% 0 0
1 0.1% .00047520333605 .00047520333605
43

2 0.2% .00078453042598 .00078453042598
2 0.2% .00095040667211 .00095040667211
4 0.4% .00112750955325 .00112750955325
773 69.1% .00114027453706-.13255599559939 NOTE: Range of values omitted from display
4 0.4% .13443311691779 .13443311691779
2 0.2% .14904691201845 .14904691201845
4 0.4% .21828143758007 .21828143758007
5 0.4% .24205220405796 .24205220405796
1 0.1% .44670928426686 .44670928426686
etclmc1 Num 8 Crslvl PE scope in Algebra- pre-equation NOTE: Smallest 5 and largest 5 values are displayed.
Frequency Percent Value Label
186 16.6% 0 0
2 0.2% .00025370618499 .00025370618499
5 0.4% .00050741236999 .00050741236999
1 0.1% .00060162282139 .00060162282139
1 0.1% .00079535368908 .00079535368908
907 81.1% .00093797839833-.10931024500387 NOTE: Range of values omitted from display
4 0.4% .12403949923683 .12403949923683
8 0.7% .12464456438267 .12464456438267
2 0.2% .13309020579074 .13309020579074
2 0.2% .15139965787006 .15139965787006
1 0.1% .40417187220948 .40417187220948
etclmc2 Num 8 Crslvl PE scope in Algebra- basic equation NOTE: Smallest 5 and largest 5 values are displayed.
Frequency Percent Value Label
83 7.4% 0 0
2 0.2% .00134537028932 .00134537028932
25 2.2% .00278262765873 .00278262765873
1 0.1% .00287647639104 .00287647639104
18 1.6% .00314702242225 .00314702242225
44

941 84.1% .00439627019292-.3826721298252 NOTE: Range of values omitted from display
1 0.1% .39469011341381 .39469011341381
9 0.8% .40002003757292 .40002003757292
7 0.6% .41639653922958 .41639653922958
16 1.4% .41730501829474 .41730501829474
16 1.4% .43412463781661 .43412463781661
etclmc3 Num 8 Crslvl PE scope in Algebra- advanced equation NOTE: Smallest 5 and largest 5 values are displayed.
Frequency Percent Value Label
122 10.9% 0 0
2 0.2% .0006261713353 .0006261713353
6 0.5% .0010240777319 .0010240777319
1 0.1% .00163850482356 .00163850482356
4 0.4% .00225293191521 .00225293191521
930 83.1% .00239182097394-.3530898991471 NOTE: Range of values omitted from display
2 0.2% .36958044475231 .36958044475231
25 2.2% .38252909348281 .38252909348281
18 1.6% .3833208140877 .3833208140877
1 0.1% .46369976860475 .46369976860475
8 0.7% .48261472345026 .48261472345026
etclmc4 Num 8 Crslvl PE scope in Algebra- number patterns NOTE: Smallest 5 and largest 5 values are displayed.
Frequency Percent Value Label
693 61.9% 0 0
1 0.1% .00007298065845 .00007298065845
15 1.3% .00014596131691 .00014596131691
4 0.4% .00037943955047 .00037943955047
11 1.0% .00047006388841 .00047006388841
346 30.9% .00065548446655-.02402436515347 NOTE: Range of values omitted from display
18 1.6% .02489305516033 .02489305516033
5 0.4% .02567508027084 .02567508027084
45

11 1.0% .02586123100964 .02586123100964
11 1.0% .02873920182975 .02873920182975
4 0.4% .04665016272151 .04665016272151
etclmc5 Num 8 Crslvl PE scope in Algebra- basic function NOTE: Smallest 5 and largest 5 values are displayed.
Frequency Percent Value Label
182 16.3% 0 0
1 0.1% .00006793042251 .00006793042251
2 0.2% .00010189563376 .00010189563376
7 0.6% .00020379126753 .00020379126753
1 0.1% .00113526746526 .00113526746526
882 78.8% .00143150467557-.18286187615268 NOTE: Range of values omitted from display
9 0.8% .19051875197408 .19051875197408
1 0.1% .1926553430409 .1926553430409
3 0.3% .21224227681733 .21224227681733
18 1.6% .21273122175652 .21273122175652
13 1.2% .22441630298208 .22441630298208
etclmc6 Num 8 Crslvl PE scope in Algebra- advanced function NOTE: Smallest 5 and largest 5 values are displayed.
Frequency Percent Value Label
418 37.4% 0 0
1 0.1% .00023249734077 .00023249734077
12 1.1% .00035576768357 .00035576768357
3 0.3% .00046499468155 .00046499468155
4 0.4% .00071153536715 .00071153536715
661 59.1% .00090444872966-.09475983469857 NOTE: Range of values omitted from display
1 0.1% .1178376482127 .1178376482127
1 0.1% .12153930371421 .12153930371421
3 0.3% .16399327524095 .16399327524095
13 1.2% .17339978205743 .17339978205743
2 0.2% .2301344636687 .2301344636687
46

etclmc7 Num 8 Crslvl PE scope in Algebra- basic number NOTE: Smallest 5 and largest 5 values are displayed.
Frequency Percent Value Label
339 30.3% 0 0
1 0.1% .00028381745483 .00028381745483
4 0.4% .00045377575137 .00045377575137
3 0.3% .00049159033714 .00049159033714
1 0.1% .00054879727311 .00054879727311
749 66.9% .00056763490966-.05877372094767 NOTE: Range of values omitted from display
1 0.1% .05908167286581 .05908167286581
1 0.1% .06162153962048 .06162153962048
11 1.0% .08317415461774 .08317415461774
5 0.4% .08911900120338 .08911900120338
4 0.4% .09710136701659 .09710136701659
etclmc8 Num 8 Crslvl PE scope in Algebra- advanced number NOTE: Smallest 5 and largest 5 values are displayed.
Frequency Percent Value Label
111 9.9% 0 0
10 0.9% .00017731235435 .00017731235435
1 0.1% .00066376266626 .00066376266626
3 0.3% .00070617296483 .00070617296483
2 0.2% .00076878302247 .00076878302247
978 87.4% .00140649774398-.12500152273556 NOTE: Range of values omitted from display
1 0.1% .12587300056096 .12587300056096
6 0.5% .12627531498009 .12627531498009
4 0.4% .15263665736744 .15263665736744
1 0.1% .18213508331513 .18213508331513
2 0.2% .33731768896286 .33731768896286
etclmc9 Num 8 Crslvl PE scope in Geometry- 2-D NOTE: Smallest 5 and largest 5 values are displayed.
Frequency Percent Value Label
47

31 2.8% 0 0
13 1.2% .00247638840842 .00247638840842
1 0.1% .00295963974295 .00295963974295
4 0.4% .00344289107748 .00344289107748
2 0.2% .00453325652588 .00453325652588
1017 90.9% .00453684215098-.56149330830449 NOTE: Range of values omitted from display
3 0.3% .6093220722775901 .6093220722775901
2 0.2% .6109347202098599 .6109347202098599
19 1.7% .61477466679334 .61477466679334
17 1.5% .61606682741854 .61606682741854
10 0.9% .89314624611551 .89314624611551
etclmc10 Num 8 Crslvl PE scope in Geometry- points, lines, shapes in theirperimeters, areas and volume NOTE: Smallest 5 and largest 5 values are displayed.
Frequency Percent Value Label
460 41.1% 0 0
11 1.0% .00049330981813 .00049330981813
13 1.2% .00049951220023 .00049951220023
1 0.1% .00058437362739 .00058437362739
10 0.9% .00065955723425 .00065955723425
599 53.5% .00090739450951-.09752074988797 NOTE: Range of values omitted from display
1 0.1% .1090582010923 .1090582010923
5 0.4% .10982432061916 .10982432061916
6 0.5% .11484534833256 .11484534833256
2 0.2% .12120824368247 .12120824368247
11 1.0% .12748073174692 .12748073174692
etclmc11 Num 8 Crslvl PE scope in Geometry- conic sections and theirequations, and equations for lines and planes NOTE: Smallest 5 and largest 5 values are displayed.
Frequency Percent Value Label
31 2.8% 0 0
3 0.3% .00159734846971 .00159734846971
48

6 0.5% .00280870596004 .00280870596004
11 1.0% .00281939864414 .00281939864414
8 0.7% .00319469693942 .00319469693942
1039 92.9% .00359198987067-.18365110955153 NOTE: Range of values omitted from display
4 0.4% .18934857481682 .18934857481682
7 0.6% .20417818400372 .20417818400372
5 0.4% .21820857639677 .21820857639677
1 0.1% .2303134491228 .2303134491228
4 0.4% .31666198904674 .31666198904674
etclmc12 Num 8 Crslvl PE scope in Geometry- transformation, congruence andsimilarity NOTE: Smallest 5 and largest 5 values are displayed.
Frequency Percent Value Label
158 14.1% 0 0
1 0.1% .00037080259861 .00037080259861
2 0.2% .00039179925221 .00039179925221
4 0.4% .00070998520872 .00070998520872
35 3.1% .00074160519723 .00074160519723
887 79.3% .00078359850443-.17932465946797 NOTE: Range of values omitted from display
1 0.1% .19044154204327 .19044154204327
7 0.6% .19920788025101 .19920788025101
18 1.6% .20003387460635 .20003387460635
4 0.4% .20119418375255 .20119418375255
2 0.2% .22900576388285 .22900576388285
etclmc13 Num 8 Crslvl PE scope in Numbers and arithmetic- whole numbers NOTE: Smallest 5 and largest 5 values are displayed.
Frequency Percent Value Label
459 41.0% 0 0
8 0.7% .00046909267748 .00046909267748
1 0.1% .00073475495805 .00073475495805
1 0.1% .00076111855499 .00076111855499
49

1 0.1% .00079041513068 .00079041513068
634 56.7% .00081900176966-.07188734001052 NOTE: Range of values omitted from display
6 0.5% .07271427652104 .07271427652104
2 0.2% .08371845690968 .08371845690968
1 0.1% .08501082855025 .08501082855025
1 0.1% .16325285278771 .16325285278771
5 0.4% .20913990766746 .20913990766746
etclmc14 Num 8 Crslvl PE scope in Fractions NOTE: Smallest 5 and largest 5 values are displayed.
Frequency Percent Value Label
306 27.3% 0 0
1 0.1% .00027439863655 .00027439863655
6 0.5% .00028184376548 .00028184376548
12 1.1% .00040126227226 .00040126227226
3 0.3% .00054879727311 .00054879727311
773 69.1% .00055240897885-.43536598979299 NOTE: Range of values omitted from display
4 0.4% .53329734807945 .53329734807945
4 0.4% .57791704795692 .57791704795692
3 0.3% .59107604587496 .59107604587496
5 0.4% .62952114791753 .62952114791753
2 0.2% .80338371256541 .80338371256541
etclmc15 Num 8 Crslvl PE scope in Number theory NOTE: Smallest 5 and largest 5 values are displayed.
Frequency Percent Value Label
739 66.0% 0 0
1 0.1% .00027453253768 .00027453253768
1 0.1% .0003269661434 .0003269661434
2 0.2% .00033636880008 .00033636880008
3 0.3% .0004904492151 .0004904492151
338 30.2% .00088788110567-.02870957917911 NOTE: Range of values omitted from display
2 0.2% .0293203215866 .0293203215866
50

16 1.4% .0293633467461 .0293633467461
9 0.8% .03181240150647 .03181240150647
4 0.4% .03357465781786 .03357465781786
4 0.4% .03385478901292 .03385478901292
etclmc16 Num 8 Crslvl PE scope in Discrete math NOTE: Smallest 5 and largest 5 values are displayed.
Frequency Percent Value Label
466 41.6% 0 0
1 0.1% .00013680432311 .00013680432311
1 0.1% .00019381044207 .00019381044207
1 0.1% .00027817821881 .00027817821881
1 0.1% .00038762088414 .00038762088414
636 56.8% .00041041296933-.04371838955336 NOTE: Range of values omitted from display
1 0.1% .04619468925918 .04619468925918
3 0.3% .04651639516368 .04651639516368
3 0.3% .04945326925368 .04945326925368
4 0.4% .07417453737915 .07417453737915
2 0.2% .08453409984583 .08453409984583
etclmc17 Num 8 Crslvl PE scope in Estimation NOTE: Smallest 5 and largest 5 values are displayed.
Frequency Percent Value Label
375 33.5% 0 0
1 0.1% .00009493027214 .00009493027214
15 1.3% .00018986054428 .00018986054428
1 0.1% .00022130315843 .00022130315843
2 0.2% .00039925341744 .00039925341744
691 61.8% .00056036645486-.03988849587158 NOTE: Range of values omitted from display
9 0.8% .04871567753012 .04871567753012
4 0.4% .05530757948344 .05530757948344
11 1.0% .05564077259213 .05564077259213
5 0.4% .06920682424373 .06920682424373
51

5 0.4% .07883203539529 .07883203539529
etclmc18 Num 8 Crslvl PE scope in Measurement NOTE: Smallest 5 and largest 5 values are displayed.
Frequency Percent Value Label
392 35.0% 0 0
4 0.4% .00009815992532 .00009815992532
49 4.4% .00019631985064 .00019631985064
1 0.1% .00025494903164 .00025494903164
2 0.2% .000403757729 .000403757729
653 58.4% .00050989806328-.05024256135162 NOTE: Range of values omitted from display
4 0.4% .06362351625542 .06362351625542
1 0.1% .07065758482972 .07065758482972
5 0.4% .07480096108823 .07480096108823
4 0.4% .07589615074777 .07589615074777
4 0.4% .26233406034681 .26233406034681
etclmc19 Num 8 Crslvl PE scope in Perimeter, area, and volume NOTE: Smallest 5 and largest 5 values are displayed.
Frequency Percent Value Label
97 8.7% 0 0
1 0.1% .00013726626884 .00013726626884
5 0.4% .00100767672149 .00100767672149
5 0.4% .00123919053201 .00123919053201
1 0.1% .00144716015836 .00144716015836
963 86.1% .00154401441666-.15390844619542 NOTE: Range of values omitted from display
6 0.5% .15796002955285 .15796002955285
19 1.7% .15910401934044 .15910401934044
2 0.2% .17892781526082 .17892781526082
10 0.9% .20705012767613 .20705012767613
10 0.9% .24927955164256 .24927955164256
etclmc20 Num 8 Crslvl PE scope in Probability- proportionality concepts NOTE: Smallest 5 and largest 5 values are displayed.
52

Frequency Percent Value Label
368 32.9% 0 0
1 0.1% .0000608444673 .0000608444673
15 1.3% .00012168893461 .00012168893461
1 0.1% .00014184171691 .00014184171691
1 0.1% .00016280417932 .00016280417932
701 62.6% .00028847613487-.02711475869246 NOTE: Range of values omitted from display
17 1.5% .03503170605663 .03503170605663
2 0.2% .07725983618161 .07725983618161
4 0.4% .07726932976661 .07726932976661
4 0.4% .13232343630817 .13232343630817
5 0.4% .16872493477735 .16872493477735
etclmc21 Num 8 Crslvl PE scope in Probability- proportionality problems NOTE: Smallest 5 and largest 5 values are displayed.
Frequency Percent Value Label
336 30.0% 0 0
5 0.4% .00025112097936 .00025112097936
1 0.1% .0009044422087 .0009044422087
3 0.3% .00094395432597 .00094395432597
1 0.1% .00105067217642 .00105067217642
754 67.4% .0012540486627-.05775448026765 NOTE: Range of values omitted from display
1 0.1% .0630689183586 .0630689183586
4 0.4% .06827767434392 .06827767434392
2 0.2% .07880086842019 .07880086842019
10 0.9% .08038388874719 .08038388874719
2 0.2% .08100026257984 .08100026257984
etclmc22 Num 8 Crslvl PE scope in Probability- linear interpolation andextrapolation NOTE: Smallest 5 and largest 5 values are displayed.
Frequency Percent Value Label
922 82.4% 0 0
53

1 0.1% .00008825857633 .00008825857633
5 0.4% .00017651715266 .00017651715266
49 4.4% .00035303430533 .00035303430533
2 0.2% .00041044377903 .00041044377903
82 7.3% .00044787630824-.00327430346092 NOTE: Range of values omitted from display
10 0.9% .00390624427976 .00390624427976
4 0.4% .00415746338905 .00415746338905
15 1.3% .00446492650537 .00446492650537
16 1.4% .00646431887321 .00646431887321
13 1.2% .00702852089742 .00702852089742
etclmc23 Num 8 Crslvl PE scope in Trigonometry NOTE: Smallest 5 and largest 5 values are displayed.
Frequency Percent Value Label
243 21.7% 0 0
1 0.1% .00026993137884 .00026993137884
1 0.1% .00040489706826 .00040489706826
3 0.3% .00041888139433 .00041888139433
4 0.4% .00080979413653 .00080979413653
855 76.4% .00083776278867-.14657378253008 NOTE: Range of values omitted from display
2 0.2% .16817052204029 .16817052204029
4 0.4% .16889666929736 .16889666929736
1 0.1% .16990556913518 .16990556913518
1 0.1% .19505525596255 .19505525596255
4 0.4% .26171241690865 .26171241690865
etclmc24 Num 8 Crslvl PE scope in Statistics- data representation and analysis NOTE: Smallest 5 and largest 5 values are displayed.
Frequency Percent Value Label
229 20.5% 0 0
1 0.1% .00025370618499 .00025370618499
1 0.1% .00025494903164 .00025494903164
5 0.4% .00050741236999 .00050741236999
54

2 0.2% .00050865521664 .00050865521664
870 77.7% .00050989806328-.14280238033244 NOTE: Range of values omitted from display
1 0.1% .15232205443901 .15232205443901
4 0.4% .17135869700514 .17135869700514
3 0.3% .18135394750625 .18135394750625
2 0.2% .35386331737465 .35386331737465
1 0.1% .62172230293493 .62172230293493
etclmc25 Num 8 Crslvl PE scope in Statistics- uncertainty and probability NOTE: Smallest 5 and largest 5 values are displayed.
Frequency Percent Value Label
175 15.6% 0 0
2 0.2% .00071976747174 .00071976747174
5 0.4% .00101469741996 .00101469741996
11 1.0% .00120166526857 .00120166526857
2 0.2% .00193690366482 .00193690366482
903 80.7% .00267214206106-.12546801135786 NOTE: Range of values omitted from display
6 0.5% .12775394864496 .12775394864496
9 0.8% .13834720514731 .13834720514731
3 0.3% .34094044772045 .34094044772045
1 0.1% .38014607212442 .38014607212442
2 0.2% .6630861679604499 .6630861679604499
etclmc26 Num 8 Crslvl PE scope in Calculus- infinite process NOTE: Smallest 5 and largest 5 values are displayed.
Frequency Percent Value Label
525 46.9% 0 0
3 0.3% .00025133877159 .00025133877159
49 4.4% .00050267754319 .00050267754319
2 0.2% .00057518816513 .00057518816513
1 0.1% .00082904510358 .00082904510358
498 44.5% .00115037633026-.24531264275752 NOTE: Range of values omitted from display
3 0.3% .24720285047764 .24720285047764
55

3 0.3% .25264035725226 .25264035725226
13 1.2% .26457563376969 .26457563376969
17 1.5% .27855575934367 .27855575934367
5 0.4% .34080957012509 .34080957012509
etclmc27 Num 8 Crslvl PE scope in Calculus- change NOTE: Smallest 5 and largest 5 values are displayed.
Frequency Percent Value Label
565 50.5% 0 0
10 0.9% .00121498873481 .00121498873481
1 0.1% .0020974307018 .0020974307018
7 0.6% .00225228423313 .00225228423313
14 1.3% .00228965065838 .00228965065838
489 43.7% .00248355025691-.56914347398332 NOTE: Range of values omitted from display
1 0.1% .5960438994981599 .5960438994981599
3 0.3% .6940317769857 .6940317769857
7 0.6% .76116149291721 .76116149291721
17 1.5% .79201965447325 .79201965447325
5 0.4% 1.24366655239323 1.24366655239323
etclmc28 Num 8 Crslvl PE scope in Validation and structuring NOTE: Smallest 5 and largest 5 values are displayed.
Frequency Percent Value Label
418 37.4% 0 0
1 0.1% .00004239124112 .00004239124112
1 0.1% .00006358686169 .00006358686169
4 0.4% .00012717372338 .00012717372338
1 0.1% .0002931570789 .0002931570789
651 58.2% .00034811382941-.1245378432023 NOTE: Range of values omitted from display
12 1.1% .1337711772797 .1337711772797
15 1.3% .13542584809621 .13542584809621
2 0.2% .13820440367705 .13820440367705
11 1.0% .14098295925789 .14098295925789
56

3 0.3% .178703776977 .178703776977
etclmc29 Num 8 Crslvl PE scope in other topics NOTE: Smallest 5 and largest 5 values are displayed.
Frequency Percent Value Label
321 28.7% 0 0
1 0.1% .00028099370905 .00028099370905
4 0.4% .00041776180285 .00041776180285
2 0.2% .00056198741811 .00056198741811
15 1.3% .0005624003386 .0005624003386
760 67.9% .00070796574447-.10536955111838 NOTE: Range of values omitted from display
2 0.2% .11552109374653 .11552109374653
5 0.4% .12969902727888 .12969902727888
4 0.4% .22126068424236 .22126068424236
1 0.1% .34433240750452 .34433240750452
4 0.4% .48214463083551 .48214463083551
etclmd1 Num 8 Crslvl IGP*PE scope in Algebra- pre-equation NOTE: Smallest 5 and largest 5 values are displayed.
Frequency Percent Value Label
186 16.6% 0 0
2 0.2% .00025172096721 .00025172096721
1 0.1% .00047291360925 .00047291360925
5 0.4% .00050344193442 .00050344193442
21 1.9% .00069638340786 .00069638340786
887 79.3% .00069854003962-.09232788359769 NOTE: Range of values omitted from display
8 0.7% .10339675172324 .10339675172324
4 0.4% .1139312632466 .1139312632466
2 0.2% .11498403645225 .11498403645225
2 0.2% .13786391277836 .13786391277836
1 0.1% .34342479743716 .34342479743716
etclmd2 Num 8 Crslvl IGP*PE scope in Algebra- basic equation NOTE: Smallest 5 and largest 5 values are displayed.
57

Frequency Percent Value Label
83 7.4% 0 0
2 0.2% .00108908532831 .00108908532831
1 0.1% .00267008529722 .00267008529722
25 2.2% .00284911251707 .00284911251707
18 1.6% .00417204745095 .00417204745095
940 84.0% .00440711237902-.38618395708665 NOTE: Range of values omitted from display
2 0.2% .38637623162938 .38637623162938
7 0.6% .38869486940759 .38869486940759
9 0.8% .3978631756879 .3978631756879
16 1.4% .43138474579356 .43138474579356
16 1.4% .43664333191643 .43664333191643
etclmd3 Num 8 Crslvl IGP*PE scope in Algebra- advanced equation NOTE: Smallest 5 and largest 5 values are displayed.
Frequency Percent Value Label
122 10.9% 0 0
2 0.2% .00085565890468 .00085565890468
6 0.5% .00151848751918 .00151848751918
1 0.1% .00203785910335 .00203785910335
1 0.1% .00254679274337 .00254679274337
933 83.4% .00255723068751-.38054006032917 NOTE: Range of values omitted from display
2 0.2% .40283853419837 .40283853419837
18 1.6% .41529655643261 .41529655643261
25 2.2% .4228634331997 .4228634331997
8 0.7% .50465817263349 .50465817263349
1 0.1% .51174230805799 .51174230805799
etclmd4 Num 8 Crslvl IGP*PE scope in Algebra- number patterns NOTE: Smallest 5 and largest 5 values are displayed.
Frequency Percent Value Label
693 61.9% 0 0
1 0.1% .00008998394981 .00008998394981
58

15 1.3% .00017996789963 .00017996789963
4 0.4% .00045711330173 .00045711330173
11 1.0% .00072189153406 .00072189153406
367 32.8% .00072206866828-.0315127621778 NOTE: Range of values omitted from display
1 0.1% .03359223039804 .03359223039804
7 0.6% .03454209403954 .03454209403954
5 0.4% .03473671854701 .03473671854701
11 1.0% .04148917157929 .04148917157929
4 0.4% .06718446079608 .06718446079608
etclmd5 Num 8 Crslvl IGP*PE scope in Algebra- basic function NOTE: Smallest 5 and largest 5 values are displayed.
Frequency Percent Value Label
182 16.3% 0 0
1 0.1% .00006553013701 .00006553013701
2 0.2% .00009829520552 .00009829520552
7 0.6% .00019659041105 .00019659041105
3 0.3% .00094295650565 .00094295650565
880 78.6% .00134261962029-.18691661897359 NOTE: Range of values omitted from display
1 0.1% .19656662006141 .19656662006141
9 0.8% .20753111378072 .20753111378072
3 0.3% .21586662223707 .21586662223707
18 1.6% .21770220255561 .21770220255561
13 1.2% .22666306341783 .22666306341783
etclmd6 Num 8 Crslvl IGP*PE scope in Algebra- advanced function NOTE: Smallest 5 and largest 5 values are displayed.
Frequency Percent Value Label
418 37.4% 0 0
1 0.1% .00024454105271 .00024454105271
3 0.3% .00048908210543 .00048908210543
12 1.1% .00051864435794 .00051864435794
4 0.4% .00090521874222 .00090521874222
59

661 59.1% .00097816421086-.09413657365237 NOTE: Range of values omitted from display
1 0.1% .11705337622995 .11705337622995
1 0.1% .14449325155923 .14449325155923
3 0.3% .16288698138512 .16288698138512
13 1.2% .17103367722634 .17103367722634
2 0.2% .27296599133511 .27296599133511
etclmd7 Num 8 Crslvl IGP*PE scope in Algebra- basic number NOTE: Smallest 5 and largest 5 values are displayed.
Frequency Percent Value Label
339 30.3% 0 0
6 0.5% .00013804431992 .00013804431992
1 0.1% .00022327166913 .00022327166913
4 0.4% .00041897788419 .00041897788419
11 1.0% .00044654333826 .00044654333826
736 65.8% .00048949156069-.05806649495967 NOTE: Range of values omitted from display
1 0.1% .05888093995486 .05888093995486
1 0.1% .06845830065354 .06845830065354
11 1.0% .08367658136452 .08367658136452
5 0.4% .09201812715214 .09201812715214
4 0.4% .10256331387527 .10256331387527
etclmd8 Num 8 Crslvl IGP*PE scope in Algebra- advanced number NOTE: Smallest 5 and largest 5 values are displayed.
Frequency Percent Value Label
111 9.9% 0 0
10 0.9% .00021120922014 .00021120922014
3 0.3% .00063348023771 .00063348023771
2 0.2% .0006524474317 .0006524474317
1 0.1% .00078949742862 .00078949742862
978 87.4% .00126696047542-.11814813869143 NOTE: Range of values omitted from display
1 0.1% .11928590476537 .11928590476537
6 0.5% .14573909212139 .14573909212139
60

4 0.4% .15931875988273 .15931875988273
1 0.1% .2657416442473 .2657416442473
2 0.2% .31880941069538 .31880941069538
etclmd9 Num 8 Crslvl IGP*PE scope in Geometry- 2-D NOTE: Smallest 5 and largest 5 values are displayed.
Frequency Percent Value Label
31 2.8% 0 0
13 1.2% .00200802208562 .00200802208562
1 0.1% .00215299101202 .00215299101202
4 0.4% .00229795993843 .00229795993843
2 0.2% .00312336968742 .00312336968742
1017 90.9% .00344401056328-.47290922705364 NOTE: Range of values omitted from display
3 0.3% .47567694812578 .47567694812578
17 1.5% .50642136458858 .50642136458858
2 0.2% .53156788434485 .53156788434485
19 1.7% .5451438607352 .5451438607352
10 0.9% .73756120878473 .73756120878473
etclmd10 Num 8 Crslvl IGP*PE scope in Geometry- points, lines, shapes in theirperimeters, areas and volume NOTE: Smallest 5 and largest 5 values are displayed.
Frequency Percent Value Label
460 41.1% 0 0
11 1.0% .00048859904961 .00048859904961
1 0.1% .00050673260034 .00050673260034
10 0.9% .00056646512758 .00056646512758
13 1.2% .00066191150561 .00066191150561
598 53.4% .00071473659352-.08417735804777 NOTE: Range of values omitted from display
7 0.6% .0860378272508 .0860378272508
1 0.1% .09983383308934 .09983383308934
11 1.0% .10547011160789 .10547011160789
2 0.2% .11594117300825 .11594117300825
61

5 0.4% .12601931754058 .12601931754058
etclmd11 Num 8 Crslvl IGP*PE scope in Geometry- conic sections and theirequations, and equations for lines and planes NOTE: Smallest 5 and largest 5 values are displayed.
Frequency Percent Value Label
31 2.8% 0 0
3 0.3% .00180797346899 .00180797346899
11 1.0% .00243488613986 .00243488613986
8 0.7% .00361594693798 .00361594693798
6 0.5% .00405170975047 .00405170975047
1039 92.9% .00407774063974-.18134075036214 NOTE: Range of values omitted from display
4 0.4% .19327471223532 .19327471223532
7 0.6% .19938111346979 .19938111346979
5 0.4% .21599192419083 .21599192419083
1 0.1% .24590224498151 .24590224498151
4 0.4% .34470151179739 .34470151179739
etclmd12 Num 8 Crslvl IGP*PE scope in Geometry- transformation, congruenceand similarity NOTE: Smallest 5 and largest 5 values are displayed.
Frequency Percent Value Label
158 14.1% 0 0
2 0.2% .00021481533573 .00021481533573
1 0.1% .00026498034267 .00026498034267
4 0.4% .00029939146141 .00029939146141
14 1.3% .00042963067146 .00042963067146
904 80.8% .00052996068535-.14837690452697 NOTE: Range of values omitted from display
7 0.6% .1484625546015 .1484625546015
2 0.2% .15917751507724 .15917751507724
5 0.4% .16056467092768 .16056467092768
18 1.6% .17130190502201 .17130190502201
4 0.4% .17220259495207 .17220259495207
62

etclmd13 Num 8 Crslvl IGP*PE scope in Numbers and arithmetic- wholenumbers NOTE: Smallest 5 and largest 5 values are displayed.
Frequency Percent Value Label
459 41.0% 0 0
1 0.1% .00010083197369 .00010083197369
1 0.1% .00010788041451 .00010788041451
9 0.8% .00015080801868 .00015080801868
4 0.4% .00020166394738 .00020166394738
625 55.9% .00021576082903-.03272815029744 NOTE: Range of values omitted from display
4 0.4% .03447385319667 .03447385319667
2 0.2% .04239656875276 .04239656875276
8 0.7% .04927441175108 .04927441175108
1 0.1% .10180309255796 .10180309255796
5 0.4% .10641109917621 .10641109917621
etclmd14 Num 8 Crslvl IGP*PE scope in Fractions NOTE: Smallest 5 and largest 5 values are displayed.
Frequency Percent Value Label
306 27.3% 0 0
1 0.1% .000132124496 .000132124496
6 0.5% .0001696479386 .0001696479386
12 1.1% .00024161687285 .00024161687285
3 0.3% .00026424899201 .00026424899201
773 69.1% .00048323374571-.40069882212782 NOTE: Range of values omitted from display
3 0.3% .47627120887744 .47627120887744
4 0.4% .48138756489599 .48138756489599
5 0.4% .50966824567147 .50966824567147
4 0.4% .58916090469436 .58916090469436
2 0.2% .6555860865740401 .6555860865740401
etclmd15 Num 8 Crslvl IGP*PE scope in Number theory NOTE: Smallest 5 and largest 5 values are displayed.
Frequency Percent Value Label
63

739 66.0% 0 0
1 0.1% .00018778148296 .00018778148296
1 0.1% .0002481745237 .0002481745237
2 0.2% .00029981858468 .00029981858468
3 0.3% .00037226178555 .00037226178555
344 30.7% .00066890918405-.02565214012376 NOTE: Range of values omitted from display
1 0.1% .02759820527042 .02759820527042
4 0.4% .02829682947064 .02829682947064
4 0.4% .02891194741775 .02891194741775
4 0.4% .0305143600618 .0305143600618
16 1.4% .03196874054178 .03196874054178
etclmd16 Num 8 Crslvl IGP*PE scope in Discrete math NOTE: Smallest 5 and largest 5 values are displayed.
Frequency Percent Value Label
466 41.6% 0 0
1 0.1% .00020284341538 .00020284341538
1 0.1% .00028208779825 .00028208779825
1 0.1% .00036795685323 .00036795685323
1 0.1% .0005641755965 .0005641755965
634 56.7% .00060853024615-.05502373226436 NOTE: Range of values omitted from display
3 0.3% .05505118973881 .05505118973881
3 0.3% .05572911487425 .05572911487425
3 0.3% .06041584691561 .06041584691561
4 0.4% .08572147180119 .08572147180119
2 0.2% .09174372831533 .09174372831533
etclmd17 Num 8 Crslvl IGP*PE scope in Estimation NOTE: Smallest 5 and largest 5 values are displayed.
Frequency Percent Value Label
375 33.5% 0 0
1 0.1% .00003458220467 .00003458220467
15 1.3% .00006916440934 .00006916440934
64

1 0.1% .00008278121732 .00008278121732
2 0.2% .00026880203284 .00026880203284
691 61.8% .00043000351666-.02427918887787 NOTE: Range of values omitted from display
5 0.4% .03609434534242 .03609434534242
11 1.0% .03799488734375 .03799488734375
4 0.4% .0402978911482 .0402978911482
9 0.8% .05104474885923 .05104474885923
5 0.4% .05776495545095 .05776495545095
etclmd18 Num 8 Crslvl IGP*PE scope in Measurement NOTE: Smallest 5 and largest 5 values are displayed.
Frequency Percent Value Label
392 35.0% 0 0
4 0.4% .00003978273407 .00003978273407
49 4.4% .00007956546815 .00007956546815
1 0.1% .00010481897043 .00010481897043
17 1.5% .00020963794087 .00020963794087
624 55.8% .00021766289845-.03316613994479 NOTE: Range of values omitted from display
15 1.3% .03429946431679 .03429946431679
4 0.4% .04496117705077 .04496117705077
5 0.4% .04859922782947 .04859922782947
4 0.4% .04973228567498 .04973228567498
4 0.4% .17009845574975 .17009845574975
etclmd19 Num 8 Crslvl IGP*PE scope in Perimeter, area, and volume NOTE: Smallest 5 and largest 5 values are displayed.
Frequency Percent Value Label
97 8.7% 0 0
1 0.1% .00012127554107 .00012127554107
1 0.1% .0008041161072 .0008041161072
5 0.4% .00086026302198 .00086026302198
8 0.7% .00087452387992 .00087452387992
978 87.4% .00105012277704-.09963492188813 NOTE: Range of values omitted from display
65

1 0.1% .10134485456214 .10134485456214
2 0.2% .11702137086926 .11702137086926
6 0.5% .13469270852517 .13469270852517
10 0.9% .14287850299471 .14287850299471
10 0.9% .14959593415582 .14959593415582
etclmd20 Num 8 Crslvl IGP*PE scope in Probability- proportionality concepts NOTE: Smallest 5 and largest 5 values are displayed.
Frequency Percent Value Label
368 32.9% 0 0
1 0.1% .00006649520034 .00006649520034
1 0.1% .00010903881169 .00010903881169
15 1.3% .00013299040068 .00013299040068
1 0.1% .00015917301058 .00015917301058
701 62.6% .00017660487723-.02083793819686 NOTE: Range of values omitted from display
17 1.5% .02590373973394 .02590373973394
4 0.4% .05223020807257 .05223020807257
2 0.2% .06629564316774 .06629564316774
4 0.4% .10966589164049 .10966589164049
5 0.4% .13520810371386 .13520810371386
etclmd21 Num 8 Crslvl IGP*PE scope in Probability- proportionality problems NOTE: Smallest 5 and largest 5 values are displayed.
Frequency Percent Value Label
336 30.0% 0 0
5 0.4% .00018275384983 .00018275384983
3 0.3% .00083894397095 .00083894397095
1 0.1% .0008612979438 .0008612979438
2 0.2% .00105633293088 .00105633293088
753 67.3% .00106434853444-.04424630865583 NOTE: Range of values omitted from display
1 0.1% .05021834488042 .05021834488042
4 0.4% .05403674382053 .05403674382053
2 0.2% .06460851299831 .06460851299831
66

2 0.2% .06616576388107 .06616576388107
10 0.9% .08942537527592 .08942537527592
etclmd22 Num 8 Crslvl IGP*PE scope in Probability- linear interpolation andextrapolation NOTE: Smallest 5 and largest 5 values are displayed.
Frequency Percent Value Label
922 82.4% 0 0
1 0.1% .00010730960096 .00010730960096
5 0.4% .00021461920192 .00021461920192
2 0.2% .00036122679017 .00036122679017
49 4.4% .00042923840385 .00042923840385
82 7.3% .0004903268187-.00332873382507 NOTE: Range of values omitted from display
4 0.4% .00420832879078 .00420832879078
10 0.9% .00467290191743 .00467290191743
15 1.3% .00549165230344 .00549165230344
16 1.4% .00665746765014 .00665746765014
13 1.2% .00687599305326 .00687599305326
etclmd23 Num 8 Crslvl IGP*PE scope in Trigonometry NOTE: Smallest 5 and largest 5 values are displayed.
Frequency Percent Value Label
243 21.7% 0 0
1 0.1% .00031950137113 .00031950137113
1 0.1% .0004792520567 .0004792520567
3 0.3% .00053649825361 .00053649825361
4 0.4% .0009585041134 .0009585041134
855 76.4% .00100158077798-.15577912099198 NOTE: Range of values omitted from display
4 0.4% .17995611163058 .17995611163058
1 0.1% .18496540773383 .18496540773383
2 0.2% .19259822043599 .19259822043599
1 0.1% .19400858847725 .19400858847725
4 0.4% .27741125622723 .27741125622723
67

etclmd24 Num 8 Crslvl IGP*PE scope in Statistics- data representation andanalysis NOTE: Smallest 5 and largest 5 values are displayed.
Frequency Percent Value Label
229 20.5% 0 0
1 0.1% .00023374089812 .00023374089812
1 0.1% .00035477189994 .00035477189994
5 0.4% .00046748179625 .00046748179625
1 0.1% .00056484894964 .00056484894964
859 76.8% .00058851279806-.11926788935871 NOTE: Range of values omitted from display
4 0.4% .13555136207004 .13555136207004
13 1.2% .1388994569749 .1388994569749
3 0.3% .17886015688107 .17886015688107
2 0.2% .34790707959826 .34790707959826
1 0.1% .66870166935618 .66870166935618
etclmd25 Num 8 Crslvl IGP*PE scope in Statistics- uncertainty and probability NOTE: Smallest 5 and largest 5 values are displayed.
Frequency Percent Value Label
175 15.6% 0 0
11 1.0% .00053895531037 .00053895531037
2 0.2% .00115567993747 .00115567993747
5 0.4% .00133488730873 .00133488730873
16 1.4% .00190354409476 .00190354409476
889 79.4% .00191386145627-.15448825692402 NOTE: Range of values omitted from display
9 0.8% .16151816596978 .16151816596978
6 0.5% .16277922287781 .16277922287781
3 0.3% .41057265650237 .41057265650237
1 0.1% .4494062793729 .4494062793729
2 0.2% .79704032170286 .79704032170286
etclmd26 Num 8 Crslvl IGP*PE scope in Calculus- infinite process NOTE: Smallest 5 and largest 5 values are displayed.
Frequency Percent Value Label
68

525 46.9% 0 0
3 0.3% .00034476980229 .00034476980229
49 4.4% .00068953960458 .00068953960458
2 0.2% .00092736701331 .00092736701331
1 0.1% .00136657996324 .00136657996324
500 44.7% .00185473402663-.29517701734204 NOTE: Range of values omitted from display
1 0.1% .2984837852974 .2984837852974
3 0.3% .30998201200443 .30998201200443
13 1.2% .32236178731225 .32236178731225
17 1.5% .33139976912887 .33139976912887
5 0.4% .39692247268852 .39692247268852
etclmd27 Num 8 Crslvl IGP*PE scope in Calculus- change NOTE: Smallest 5 and largest 5 values are displayed.
Frequency Percent Value Label
565 50.5% 0 0
10 0.9% .0017411553834 .0017411553834
1 0.1% .00205043555713 .00205043555713
1 0.1% .00238656817561 .00238656817561
15 1.3% .00283960996951 .00283960996951
494 44.1% .00317609594476-.65009406675573 NOTE: Range of values omitted from display
1 0.1% .70801473787465 .70801473787465
3 0.3% .81720456856257 .81720456856257
7 0.6% .8432034185863601 .8432034185863601
17 1.5% .9263943992504901 .9263943992504901
5 0.4% 1.4263370265434 1.4263370265434
etclmd28 Num 8 Crslvl IGP*PE scope in Validation and structuring NOTE: Smallest 5 and largest 5 values are displayed.
Frequency Percent Value Label
418 37.4% 0 0
1 0.1% .00003850887214 .00003850887214
1 0.1% .00005776330821 .00005776330821
69

4 0.4% .00011552661643 .00011552661643
1 0.1% .00035926634807 .00035926634807
660 59.0% .00041898639616-.14506068754463 NOTE: Range of values omitted from display
6 0.5% .15245638649665 .15245638649665
12 1.1% .15566043440041 .15566043440041
2 0.2% .16048338385325 .16048338385325
11 1.0% .17590608016186 .17590608016186
3 0.3% .20881593628189 .20881593628189
etclmd29 Num 8 Crslvl IGP*PE scope in other topics NOTE: Smallest 5 and largest 5 values are displayed.
Frequency Percent Value Label
321 28.7% 0 0
1 0.1% .00030392814127 .00030392814127
4 0.4% .00040841541652 .00040841541652
2 0.2% .00060785628254 .00060785628254
15 1.3% .00067398973336 .00067398973336
757 67.6% .00078073153215-.11916339777701 NOTE: Range of values omitted from display
5 0.4% .13608288965699 .13608288965699
5 0.4% .18328550811141 .18328550811141
4 0.4% .18802891511567 .18802891511567
4 0.4% .32699496592239 .32699496592239
1 0.1% .41250934203865 .41250934203865
70

Education Data - Science Course-Level Curriculum Component
Data file name: edutscl 1-18-08
Education Data - Science Course-Level Curriculum Component
ercstkn Str 5 School where course was taken identifier NOTE: Smallest 5 and largest 5 values are displayed.
Frequency Percent Value Label
7 0.7% 002
8 0.8% 003
7 0.7% 007
24 2.4% 008
6 0.6% 009
940 93.3% 010 -271 NOTE: Range of values omitted from display
1 0.1% 6894
4 0.4% 6996
1 0.1% 8928
5 0.5% 9321
5 0.5% 9969
erccrsid Num 4 Course identifier within school NOTE: Smallest 5 and largest 5 values are displayed.
Frequency Percent Value Label
1 0.1% 101 101
3 0.3% 201 201
1 0.1% 301 301
1 0.1% 303 303
1 0.1% 304 304
996 98.8% 306-31702 NOTE: Range of values omitted from display
1 0.1% 31802 31802
1 0.1% 36301 36301
1 0.1% 36401 36401
71

1 0.1% 36501 36501
1 0.1% 37808 37808
etclsat Num 8 Crslvl unweighted scope in science NOTE: Smallest 5 and largest 5 values are displayed.
Frequency Percent Value Label
10 1.0% .26920581421718 .26920581421718
2 0.2% .38478725110255 .38478725110255
1 0.1% .53134927931801 .53134927931801
1 0.1% .63978134897336 .63978134897336
15 1.5% .6779113075334799 .6779113075334799
931 92.4% .70174253163355-1.52034507947115 NOTE: Range of values omitted from display
3 0.3% 1.5334522527262 1.5334522527262
1 0.1% 1.53941005875122 1.53941005875122
1 0.1% 1.57158221128632 1.57158221128632
34 3.4% 1.58349782333635 1.58349782333635
9 0.9% 1.71099487227176 1.71099487227176
etclsbt Num 8 Crslvl IGP weighted scope in science NOTE: Smallest 5 and largest 5 values are displayed.
Frequency Percent Value Label
10 1.0% .36459250497178 .36459250497178
2 0.2% .45851973112171 .45851973112171
1 0.1% .53897102077332 .53897102077332
1 0.1% .67173573487271 .67173573487271
5 0.5% .6896118878475 .6896118878475
953 94.5% .68991339184089-1.50500389302663 NOTE: Range of values omitted from display
10 1.0% 1.57354616998 1.57354616998
3 0.3% 1.59617877726883 1.59617877726883
9 0.9% 1.60567843274316 1.60567843274316
13 1.3% 1.6778910432841 1.6778910432841
1 0.1% 1.80791520721832 1.80791520721832
72

etclsct Num 8 Crslvl PE weighted scope in science NOTE: Smallest 5 and largest 5 values are displayed.
Frequency Percent Value Label
10 1.0% .68901925042628 .68901925042628
2 0.2% .7157552462454 .7157552462454
1 0.1% .7533029159635301 .7533029159635301
1 0.1% .79798986895433 .79798986895433
8 0.8% .80373849779298 .80373849779298
948 94.0% .8132174717376-1.71730347295167 NOTE: Range of values omitted from display
1 0.1% 1.74075856748642 1.74075856748642
24 2.4% 1.93076784316833 1.93076784316833
10 1.0% 1.94259457370244 1.94259457370244
2 0.2% 1.99129265598223 1.99129265598223
1 0.1% 2.05181746879613 2.05181746879613
etclsdt Num 8 Crslvl IGP*PE weighted scope in science NOTE: Smallest 5 and largest 5 values are displayed.
Frequency Percent Value Label
10 1.0% .73005482203938 .73005482203938
2 0.2% .7504511055740199 .7504511055740199
1 0.1% .77057240410102 .77057240410102
8 0.8% .81188731002528 .81188731002528
2 0.2% .81531716093481 .81531716093481
947 93.9% .8153746383656-1.74612273814153 NOTE: Range of values omitted from display
1 0.1% 1.83512475536709 1.83512475536709
24 2.4% 1.89545461717966 1.89545461717966
2 0.2% 1.96872400673849 1.96872400673849
10 1.0% 2.00868577530309 2.00868577530309
1 0.1% 2.04199339629732 2.04199339629732
etclsigp Num 8 Crslvl average IGP in science NOTE: Smallest 5 and largest 5 values are displayed.
Frequency Percent Value Label
73

1 0.1% 5.64447956173619 5.64447956173619
1 0.1% 5.94696162947937 5.94696162947937
9 0.9% 6.03947269303201 6.03947269303201
1 0.1% 6.04948201527469 6.04948201527469
2 0.2% 6.07769957983193 6.07769957983193
969 96.1% 6.21445707070707-9.37839046835157 NOTE: Range of values omitted from display
3 0.3% 9.379344942618429 9.379344942618429
3 0.3% 9.387273410053711 9.387273410053711
5 0.5% 9.447314748744169 9.447314748744169
1 0.1% 9.58124681858405 9.58124681858405
13 1.3% 9.611915342823121 9.611915342823121
etclspe Num 8 Crslvl average PE level in science NOTE: Smallest 5 and largest 5 values are displayed.
Frequency Percent Value Label
2 0.2% .91764705882352 .91764705882352
16 1.6% .9256965944272399 .9256965944272399
2 0.2% .95850746268656 .95850746268656
1 0.1% .96284829721362 .96284829721362
1 0.1% .96769656530578 .96769656530578
949 94.1% .9731707317073101-4.43091996830828 NOTE: Range of values omitted from display
24 2.4% 4.59193827715825 4.59193827715825
6 0.6% 5.00811058752885 5.00811058752885
2 0.2% 5.0091541292656 5.0091541292656
1 0.1% 5.42636998137294 5.42636998137294
4 0.4% 5.94539750218142 5.94539750218142
etclsa1 Num 8 Crslvl unweighted scope in Earth features NOTE: Smallest 5 and largest 5 values are displayed.
Frequency Percent Value Label
331 32.8% 0 0
1 0.1% .00025545660291 .00025545660291
1 0.1% .00027468470982 .00027468470982
74

2 0.2% .00035946378424 .00035946378424
7 0.7% .0003835862709 .0003835862709
646 64.1% .00040238570716-.23532151674886 NOTE: Range of values omitted from display
11 1.1% .24508533940272 .24508533940272
1 0.1% .26420234492958 .26420234492958
3 0.3% .29842251290251 .29842251290251
1 0.1% .33564562345702 .33564562345702
4 0.4% .34882213049887 .34882213049887
etclsa2 Num 8 Crslvl unweighted scope in Earth process NOTE: Smallest 5 and largest 5 values are displayed.
Frequency Percent Value Label
236 23.4% 0 0
1 0.1% .00010210750172 .00010210750172
1 0.1% .00015316125259 .00015316125259
19 1.9% .00030632250518 .00030632250518
4 0.4% .00038116259376 .00038116259376
734 72.8% .00047627991525-.28633319976703 NOTE: Range of values omitted from display
1 0.1% .31956217329619 .31956217329619
1 0.1% .34140436419215 .34140436419215
1 0.1% .35088123310504 .35088123310504
4 0.4% .36324655508812 .36324655508812
6 0.6% .48917777408531 .48917777408531
etclsa3 Num 8 Crslvl unweighted scope in Earth and the universe NOTE: Smallest 5 and largest 5 values are displayed.
Frequency Percent Value Label
483 47.9% 0 0
10 1.0% .00008288616973 .00008288616973
3 0.3% .00012432925459 .00012432925459
8 0.8% .00015247226345 .00015247226345
12 1.2% .00024865850919 .00024865850919
467 46.3% .00027476757006-.11953854779883 NOTE: Range of values omitted from display
75

11 1.1% .12810931071805 .12810931071805
6 0.6% .14585746214369 .14585746214369
1 0.1% .15249675368482 .15249675368482
4 0.4% .15303286739755 .15303286739755
3 0.3% .17180610299479 .17180610299479
etclsa4 Num 8 Crslvl unweighted scope in Plants, animals, and their life cyclesNOTE: Smallest 5 and largest 5 values are displayed.
Frequency Percent Value Label
265 26.3% 0 0
4 0.4% .00006264865374 .00006264865374
1 0.1% .00009349729814 .00009349729814
2 0.2% .00009397298062 .00009397298062
4 0.4% .00014024594721 .00014024594721
668 66.3% .00018794596124-.46663320246746 NOTE: Range of values omitted from display
8 0.8% .47501010528111 .47501010528111
1 0.1% .47879164378819 .47879164378819
34 3.4% .49163156355475 .49163156355475
12 1.2% .50729944798723 .50729944798723
9 0.9% .60240929210654 .60240929210654
etclsa5 Num 8 Crslvl unweighted scope in Organs NOTE: Smallest 5 and largest 5 values are displayed.
Frequency Percent Value Label
406 40.3% 0 0
3 0.3% .00020432814535 .00020432814535
3 0.3% .00025730183238 .00025730183238
2 0.2% .00033934414682 .00033934414682
1 0.1% .00046581847698 .00046581847698
571 56.6% .00051460366477-.40654376561152 NOTE: Range of values omitted from display
6 0.6% .45153545923825 .45153545923825
1 0.1% .46829968531737 .46829968531737
3 0.3% .48506391139649 .48506391139649
76

5 0.5% .70836462769923 .70836462769923
7 0.7% .716888012678 .716888012678
etclsa6 Num 8 Crslvl unweighted scope in Biochemistry/microbiology NOTE: Smallest 5 and largest 5 values are displayed.
Frequency Percent Value Label
358 35.5% 0 0
1 0.1% .00003757758995 .00003757758995
6 0.6% .00005636638492 .00005636638492
3 0.3% .00011273276985 .00011273276985
2 0.2% .00018026091405 .00018026091405
589 58.4% .00020987267985-.2324661900485 NOTE: Range of values omitted from display
1 0.1% .25301818000363 .25301818000363
34 3.4% .25629793512584 .25629793512584
9 0.9% .26180169736846 .26180169736846
4 0.4% .27654036033287 .27654036033287
1 0.1% .30196699980189 .30196699980189
etclsa7 Num 8 Crslvl unweighted scope in Biosystems NOTE: Smallest 5 and largest 5 values are displayed.
Frequency Percent Value Label
248 24.6% 0 0
1 0.1% .00018796599679 .00018796599679
4 0.4% .00028194899518 .00028194899518
4 0.4% .00033756997969 .00033756997969
2 0.2% .00038595274857 .00038595274857
730 72.4% .00043057655151-.25933572145039 NOTE: Range of values omitted from display
7 0.7% .26660770375288 .26660770375288
7 0.7% .29597602527772 .29597602527772
1 0.1% .3097416602141 .3097416602141
3 0.3% .35055117458794 .35055117458794
1 0.1% .48520081079474 .48520081079474
77

etclsa8 Num 8 Crslvl unweighted scope in Evolution NOTE: Smallest 5 and largest 5 values are displayed.
Frequency Percent Value Label
459 45.5% 0 0
2 0.2% .00012950288842 .00012950288842
2 0.2% .00020103497653 .00020103497653
1 0.1% .00025900577684 .00025900577684
3 0.3% .00040206995307 .00040206995307
478 47.4% .00046939681723-.09879123819785 NOTE: Range of values omitted from display
4 0.4% .09939495570864 .09939495570864
4 0.4% .10220534625118 .10220534625118
12 1.2% .10504103741362 .10504103741362
34 3.4% .11229669015745 .11229669015745
9 0.9% .14187284509353 .14187284509353
etclsa9 Num 8 Crslvl unweighted scope in Environments & ecology NOTE: Smallest 5 and largest 5 values are displayed.
Frequency Percent Value Label
419 41.6% 0 0
4 0.4% .00013823272718 .00013823272718
5 0.5% .00027646545437 .00027646545437
16 1.6% .00029223855096 .00029223855096
8 0.8% .00031823073843 .00031823073843
537 53.3% .00033379012635-.16197306445421 NOTE: Range of values omitted from display
2 0.2% .16771550755677 .16771550755677
5 0.5% .17069608866335 .17069608866335
7 0.7% .17402539866688 .17402539866688
3 0.3% .18343420278117 .18343420278117
2 0.2% .38842861995062 .38842861995062
etclsa10 Num 8 Crslvl unweighted scope in Nutrition & disease NOTE: Smallest 5 and largest 5 values are displayed.
Frequency Percent Value Label
78

276 27.4% 0 0
5 0.5% .00018209408433 .00018209408433
4 0.4% .00027292392315 .00027292392315
2 0.2% .00030871227702 .00030871227702
6 0.6% .00032666301179 .00032666301179
702 69.6% .00043476391184-.24729877817981 NOTE: Range of values omitted from display
1 0.1% .29207767798502 .29207767798502
3 0.3% .33204914566677 .33204914566677
2 0.2% .34835978237993 .34835978237993
1 0.1% .39251197255033 .39251197255033
6 0.6% .43927434061499 .43927434061499
etclsa11 Num 8 Crslvl unweighted scope in Matter NOTE: Smallest 5 and largest 5 values are displayed.
Frequency Percent Value Label
66 6.5% 0 0
3 0.3% .00026450993319 .00026450993319
1 0.1% .00069003508874 .00069003508874
1 0.1% .00074176287168 .00074176287168
1 0.1% .0010696222571 .0010696222571
917 91.0% .00107378585419-.20024608479367 NOTE: Range of values omitted from display
1 0.1% .20426929802687 .20426929802687
7 0.7% .20685776372337 .20685776372337
4 0.4% .20829251126006 .20829251126006
4 0.4% .23116836908277 .23116836908277
3 0.3% .24202441213708 .24202441213708
etclsa12 Num 8 Crslvl unweighted scope in Chemical properties NOTE: Smallest 5 and largest 5 values are displayed.
Frequency Percent Value Label
108 10.7% 0 0
12 1.2% .00020390327026 .00020390327026
1 0.1% .00024537389385 .00024537389385
79
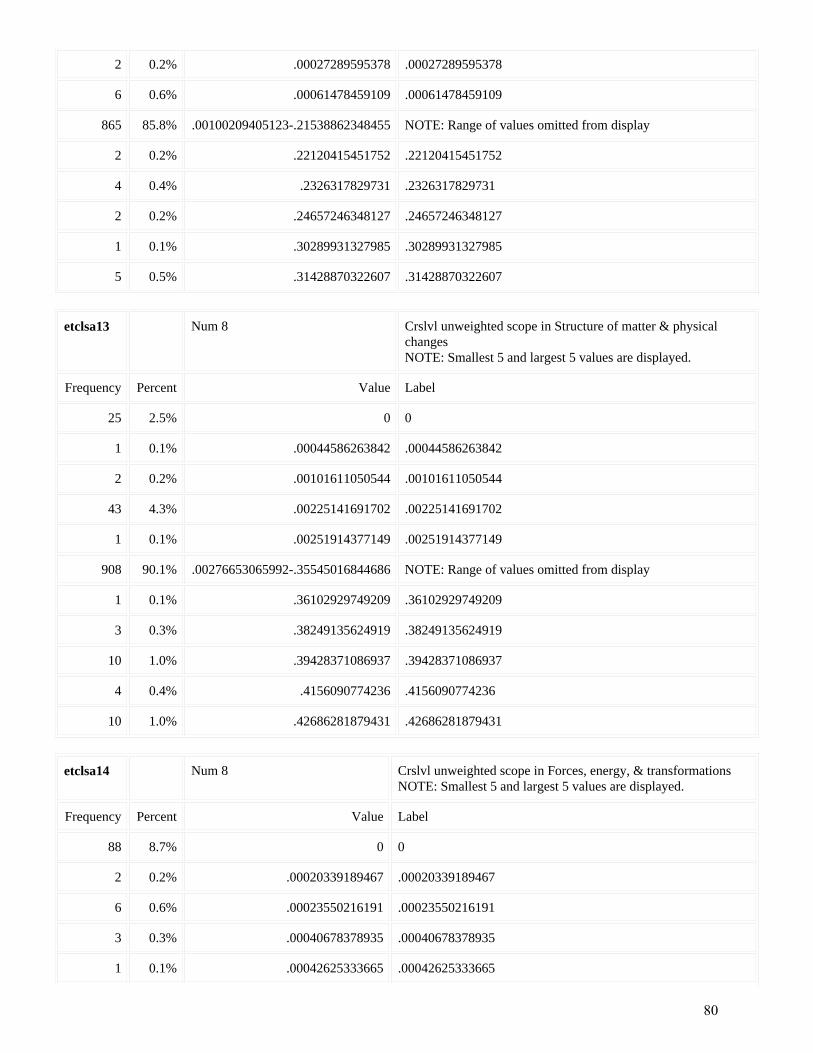
2 0.2% .00027289595378 .00027289595378
6 0.6% .00061478459109 .00061478459109
865 85.8% .00100209405123-.21538862348455 NOTE: Range of values omitted from display
2 0.2% .22120415451752 .22120415451752
4 0.4% .2326317829731 .2326317829731
2 0.2% .24657246348127 .24657246348127
1 0.1% .30289931327985 .30289931327985
5 0.5% .31428870322607 .31428870322607
etclsa13 Num 8 Crslvl unweighted scope in Structure of matter & physicalchanges NOTE: Smallest 5 and largest 5 values are displayed.
Frequency Percent Value Label
25 2.5% 0 0
1 0.1% .00044586263842 .00044586263842
2 0.2% .00101611050544 .00101611050544
43 4.3% .00225141691702 .00225141691702
1 0.1% .00251914377149 .00251914377149
908 90.1% .00276653065992-.35545016844686 NOTE: Range of values omitted from display
1 0.1% .36102929749209 .36102929749209
3 0.3% .38249135624919 .38249135624919
10 1.0% .39428371086937 .39428371086937
4 0.4% .4156090774236 .4156090774236
10 1.0% .42686281879431 .42686281879431
etclsa14 Num 8 Crslvl unweighted scope in Forces, energy, & transformations NOTE: Smallest 5 and largest 5 values are displayed.
Frequency Percent Value Label
88 8.7% 0 0
2 0.2% .00020339189467 .00020339189467
6 0.6% .00023550216191 .00023550216191
3 0.3% .00040678378935 .00040678378935
1 0.1% .00042625333665 .00042625333665
80

847 84.0% .00080487108217-.2563305532183 NOTE: Range of values omitted from display
16 1.6% .25980376333425 .25980376333425
2 0.2% .26493886677151 .26493886677151
24 2.4% .27354718032473 .27354718032473
2 0.2% .28070847338731 .28070847338731
17 1.7% .2878697664499 .2878697664499
etclsa15 Num 8 Crslvl unweighted scope in Light, sound, heat, electricity, &magnetism NOTE: Smallest 5 and largest 5 values are displayed.
Frequency Percent Value Label
56 5.6% 0 0
14 1.4% .00045965460852 .00045965460852
3 0.3% .00052901986639 .00052901986639
2 0.2% .00106800201287 .00106800201287
6 0.6% .00113784765219 .00113784765219
892 88.5% .00121528586483-.43221231511803 NOTE: Range of values omitted from display
1 0.1% .45320647866697 .45320647866697
2 0.2% .49613835621907 .49613835621907
24 2.4% .53907023377117 .53907023377117
2 0.2% .5712225181084301 .5712225181084301
6 0.6% .6378068543577 .6378068543577
etclsa16 Num 8 Crslvl unweighted scope in Matter & transformations of matter NOTE: Smallest 5 and largest 5 values are displayed.
Frequency Percent Value Label
125 12.4% 0 0
1 0.1% .00031852275375 .00031852275375
2 0.2% .00056285422925 .00056285422925
1 0.1% .00062660631242 .00062660631242
1 0.1% .00063704550751 .00063704550751
847 84.0% .00067872476858-.12212901113008 NOTE: Range of values omitted from display
2 0.2% .12620115124665 .12620115124665
81
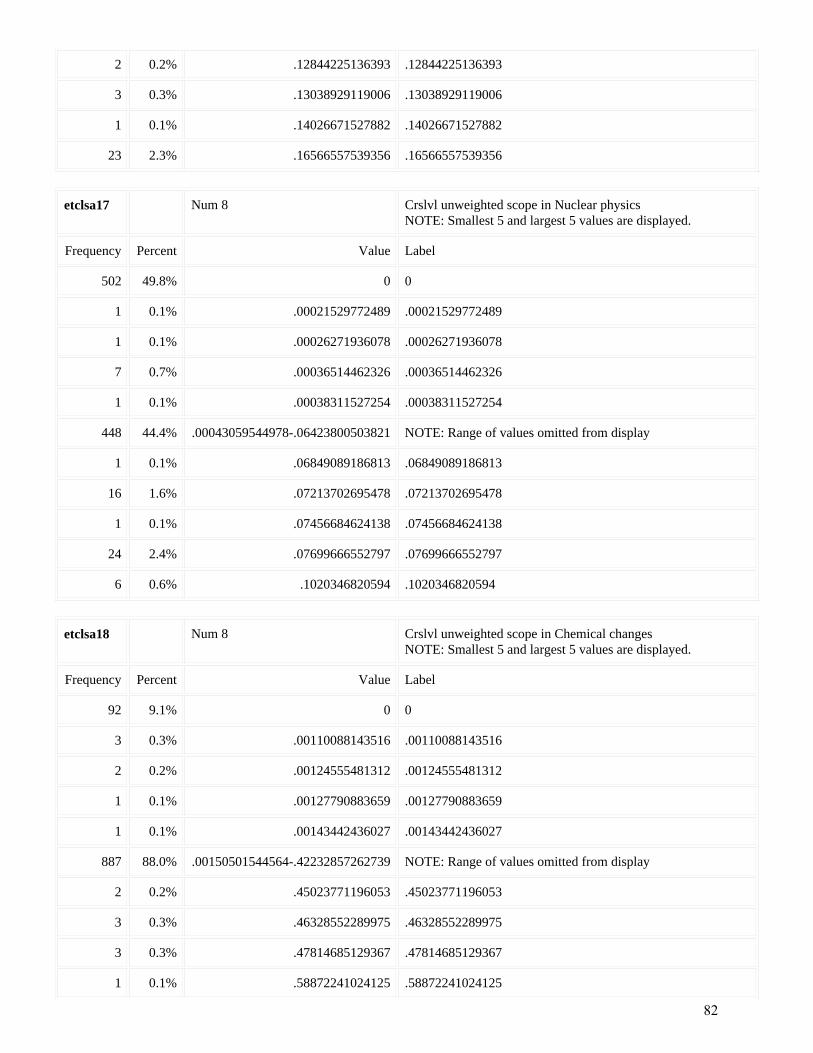
2 0.2% .12844225136393 .12844225136393
3 0.3% .13038929119006 .13038929119006
1 0.1% .14026671527882 .14026671527882
23 2.3% .16566557539356 .16566557539356
etclsa17 Num 8 Crslvl unweighted scope in Nuclear physics NOTE: Smallest 5 and largest 5 values are displayed.
Frequency Percent Value Label
502 49.8% 0 0
1 0.1% .00021529772489 .00021529772489
1 0.1% .00026271936078 .00026271936078
7 0.7% .00036514462326 .00036514462326
1 0.1% .00038311527254 .00038311527254
448 44.4% .00043059544978-.06423800503821 NOTE: Range of values omitted from display
1 0.1% .06849089186813 .06849089186813
16 1.6% .07213702695478 .07213702695478
1 0.1% .07456684624138 .07456684624138
24 2.4% .07699666552797 .07699666552797
6 0.6% .1020346820594 .1020346820594
etclsa18 Num 8 Crslvl unweighted scope in Chemical changes NOTE: Smallest 5 and largest 5 values are displayed.
Frequency Percent Value Label
92 9.1% 0 0
3 0.3% .00110088143516 .00110088143516
2 0.2% .00124555481312 .00124555481312
1 0.1% .00127790883659 .00127790883659
1 0.1% .00143442436027 .00143442436027
887 88.0% .00150501544564-.42232857262739 NOTE: Range of values omitted from display
2 0.2% .45023771196053 .45023771196053
3 0.3% .46328552289975 .46328552289975
3 0.3% .47814685129367 .47814685129367
1 0.1% .58872241024125 .58872241024125
82

13 1.3% .61418668139692 .61418668139692
etclsa19 Num 8 Crslvl unweighted scope in Motion NOTE: Smallest 5 and largest 5 values are displayed.
Frequency Percent Value Label
467 46.3% 0 0
4 0.4% .00015158818128 .00015158818128
1 0.1% .00015521988095 .00015521988095
2 0.2% .00016452449437 .00016452449437
9 0.9% .00023282982143 .00023282982143
495 49.1% .00024678674155-.18840623194465 NOTE: Range of values omitted from display
2 0.2% .19311231958506 .19311231958506
1 0.1% .21107152398865 .21107152398865
24 2.4% .24737958495085 .24737958495085
2 0.2% .28128697003801 .28128697003801
1 0.1% .31519435512517 .31519435512517
etclsa20 Num 8 Crslvl unweighted scope in Science, technology, & math NOTE: Smallest 5 and largest 5 values are displayed.
Frequency Percent Value Label
26 2.6% 0 0
5 0.5% .00030406830395 .00030406830395
6 0.6% .00071979530447 .00071979530447
4 0.4% .00080153332223 .00080153332223
6 0.6% .0010228075634 .0010228075634
951 94.3% .00107997820999-.07850751324043 NOTE: Range of values omitted from display
4 0.4% .08015550422977 .08015550422977
2 0.2% .08467620529377 .08467620529377
1 0.1% .08992132736081 .08992132736081
1 0.1% .09224104428802 .09224104428802
2 0.2% .09784330162693 .09784330162693
etclsa21 Num 8 Crslvl unweighted scope in History of science & technology NOTE: Smallest 5 and largest 5 values are displayed.
83

Frequency Percent Value Label
141 14.0% 0 0
2 0.2% .00008633525894 .00008633525894
1 0.1% .00012385782586 .00012385782586
1 0.1% .00017267051789 .00017267051789
3 0.3% .00024771565172 .00024771565172
832 82.5% .00039754260141-.03589498730743 NOTE: Range of values omitted from display
1 0.1% .03779995754694 .03779995754694
16 1.6% .04206083425507 .04206083425507
7 0.7% .0426480759143 .0426480759143
2 0.2% .0612988095343 .0612988095343
2 0.2% .07201057151194 .07201057151194
etclsa22 Num 8 Crslvl unweighted scope in Environments & resources NOTE: Smallest 5 and largest 5 values are displayed.
Frequency Percent Value Label
156 15.5% 0 0
2 0.2% .00003980093863 .00003980093863
12 1.2% .00011940281591 .00011940281591
1 0.1% .00045106515697 .00045106515697
2 0.2% .00051334549565 .00051334549565
815 80.9% .00055602045847-.2765859219152 NOTE: Range of values omitted from display
1 0.1% .28690021505281 .28690021505281
1 0.1% .29689369049014 .29689369049014
15 1.5% .29721450819041 .29721450819041
1 0.1% .3752776666933 .3752776666933
2 0.2% .45366164289647 .45366164289647
etclsa23 Num 8 Crslvl unweighted scope in Nature of science NOTE: Smallest 5 and largest 5 values are displayed.
Frequency Percent Value Label
186 18.5% 0 0
1 0.1% .00024865059205 .00024865059205
84

1 0.1% .00037297588808 .00037297588808
1 0.1% .00052593592858 .00052593592858
1 0.1% .00060762643384 .00060762643384
775 76.9% .00074595177617-.04802460872644 NOTE: Range of values omitted from display
1 0.1% .04947255210154 .04947255210154
5 0.5% .05676358422634 .05676358422634
7 0.7% .06715163994382 .06715163994382
23 2.3% .07497321950295 .07497321950295
7 0.7% .07838372423938 .07838372423938
etclsa24 Num 8 Crslvl unweighted scope in Science & other disciplines NOTE: Smallest 5 and largest 5 values are displayed.
Frequency Percent Value Label
135 13.4% 0 0
1 0.1% .00004702398812 .00004702398812
3 0.3% .00009404797624 .00009404797624
5 0.5% .00034314745553 .00034314745553
1 0.1% .00048928341756 .00048928341756
821 81.4% .00049757696419-.12001763399615 NOTE: Range of values omitted from display
2 0.2% .12181730172754 .12181730172754
10 1.0% .12546391828315 .12546391828315
1 0.1% .14889129453305 .14889129453305
17 1.7% .1699219837282 .1699219837282
12 1.2% .20880944512879 .20880944512879
etclsa25 Num 8 Crslvl unweighted scope in Understanding NOTE: Smallest 5 and largest 5 values are displayed.
Frequency Percent Value Label
865 85.8% 0 0
1 0.1% .00008771684064 .00008771684064
1 0.1% .00010076568883 .00010076568883
1 0.1% .00010481199065 .00010481199065
1 0.1% .00010594792722 .00010594792722
85

95 9.4% .00010964605081-.0005595240208 NOTE: Range of values omitted from display
2 0.2% .00069368421552 .00069368421552
13 1.3% .00072318780055 .00072318780055
9 0.9% .00104813044083 .00104813044083
18 1.8% .0011190480416 .0011190480416
2 0.2% .00204533211418 .00204533211418
etclsa26 Num 8 Crslvl unweighted scope in Analyzing & solving problems NOTE: Smallest 5 and largest 5 values are displayed.
Frequency Percent Value Label
907 90.0% 0 0
8 0.8% .00006985552795 .00006985552795
5 0.5% .00007329350076 .00007329350076
1 0.1% .00011709316156 .00011709316156
10 1.0% .0001397110559 .0001397110559
43 4.3% .00015892189083-.00174659969201 NOTE: Range of values omitted from display
3 0.3% .00250995928688 .00250995928688
2 0.2% .00260131580823 .00260131580823
2 0.2% .00261989953802 .00261989953802
24 2.4% .00501991857377 .00501991857377
3 0.3% .00812258217619 .00812258217619
etclsa27 Num 8 Crslvl unweighted scope in Using tools & procedures NOTE: Smallest 5 and largest 5 values are displayed.
Frequency Percent Value Label
879 87.2% 0 0
1 0.1% .00003669094138 .00003669094138
9 0.9% .00005503641208 .00005503641208
10 1.0% .00011007282416 .00011007282416
1 0.1% .00013623892015 .00013623892015
57 5.7% .00020435838023-.00385833282364 NOTE: Range of values omitted from display
3 0.3% .00448132893327 .00448132893327
4 0.4% .00531674891608 .00531674891608
86

7 0.7% .00633464498734 .00633464498734
36 3.6% .00640967837654 .00640967837654
1 0.1% .02131157001058 .02131157001058
etclsa28 Num 8 Crslvl unweighted scope in Investigating
Frequency Percent Value Label
998 99.0% 0 0
1 0.1% .00040386623388 .00040386623388
7 0.7% .00115357549987 .00115357549987
2 0.2% .00329500002376 .00329500002376
etclsa29 Num 8 Crslvl unweighted scope in Communicating
Frequency Percent Value Label
999 99.1% 0 0
1 0.1% .00036379358077 .00036379358077
5 0.5% .00072758716154 .00072758716154
3 0.3% .00314422535852 .00314422535852
etclsb1 Num 8 Crslvl IGP scope in Earth features NOTE: Smallest 5 and largest 5 values are displayed.
Frequency Percent Value Label
331 32.8% 0 0
1 0.1% .00018954638018 .00018954638018
1 0.1% .00028446694736 .00028446694736
1 0.1% .0002879781139 .0002879781139
7 0.7% .00035070856475 .00035070856475
647 64.2% .0004020052349-.22182186302992 NOTE: Range of values omitted from display
11 1.1% .2276965832109 .2276965832109
1 0.1% .2443476083714 .2443476083714
3 0.3% .25561090250483 .25561090250483
1 0.1% .30419246497081 .30419246497081
4 0.4% .3233675380939 .3233675380939
87

etclsb2 Num 8 Crslvl IGP scope in Earth process NOTE: Smallest 5 and largest 5 values are displayed.
Frequency Percent Value Label
236 23.4% 0 0
1 0.1% .00004731565949 .00004731565949
1 0.1% .00007097348923 .00007097348923
19 1.9% .00014194697847 .00014194697847
4 0.4% .00028929659746 .00028929659746
734 72.8% .00054802725366-.25054005567655 NOTE: Range of values omitted from display
1 0.1% .27794596826117 .27794596826117
1 0.1% .29265786004163 .29265786004163
1 0.1% .29854224903672 .29854224903672
4 0.4% .30736975182209 .30736975182209
6 0.6% .42445088030039 .42445088030039
etclsb3 Num 8 Crslvl IGP scope in Earth and the universe NOTE: Smallest 5 and largest 5 values are displayed.
Frequency Percent Value Label
483 47.9% 0 0
10 1.0% .00006931260246 .00006931260246
3 0.3% .00010396890369 .00010396890369
8 0.8% .0001981123071 .0001981123071
12 1.2% .00020793780739 .00020793780739
467 46.3% .00029957190417-.11303563610849 NOTE: Range of values omitted from display
11 1.1% .12010825962959 .12010825962959
4 0.4% .13788782812806 .13788782812806
6 0.6% .13829630008678 .13829630008678
1 0.1% .14014068932586 .14014068932586
3 0.3% .15270065754759 .15270065754759
etclsb4 Num 8 Crslvl IGP scope in Plants, animals, and their life cycles NOTE: Smallest 5 and largest 5 values are displayed.
Frequency Percent Value Label
88

265 26.3% 0 0
4 0.4% .00003477185998 .00003477185998
2 0.2% .00005215778997 .00005215778997
1 0.1% .00008766740239 .00008766740239
1 0.1% .00010431557995 .00010431557995
671 66.6% .00013150110359-.34930315569722 NOTE: Range of values omitted from display
1 0.1% .35517192122612 .35517192122612
8 0.8% .36030628681826 .36030628681826
34 3.4% .36104068675502 .36104068675502
12 1.2% .38381522794502 .38381522794502
9 0.9% .43089861709854 .43089861709854
etclsb5 Num 8 Crslvl IGP scope in Organs NOTE: Smallest 5 and largest 5 values are displayed.
Frequency Percent Value Label
406 40.3% 0 0
3 0.3% .00017297548014 .00017297548014
3 0.3% .00021518676374 .00021518676374
2 0.2% .0003309634725 .0003309634725
6 0.6% .00043037352748 .00043037352748
566 56.2% .00045502188145-.33982394301307 NOTE: Range of values omitted from display
3 0.3% .37996361918923 .37996361918923
1 0.1% .38469402137982 .38469402137982
6 0.6% .38942442357041 .38942442357041
7 0.7% .56739238208648 .56739238208648
5 0.5% .57079753215614 .57079753215614
etclsb6 Num 8 Crslvl IGP scope in Biochemistry/microbiology NOTE: Smallest 5 and largest 5 values are displayed.
Frequency Percent Value Label
363 36.0% 0 0
1 0.1% .00003357889269 .00003357889269
6 0.6% .00005036833904 .00005036833904
89

3 0.3% .00010073667809 .00010073667809
6 0.6% .00023952121054 .00023952121054
578 57.3% .00024204186601-.26564285915655 NOTE: Range of values omitted from display
3 0.3% .26772338332354 .26772338332354
4 0.4% .27605610617547 .27605610617547
34 3.4% .32136233445535 .32136233445535
9 0.9% .33375339741459 .33375339741459
1 0.1% .36341375059258 .36341375059258
etclsb7 Num 8 Crslvl IGP scope in Biosystems NOTE: Smallest 5 and largest 5 values are displayed.
Frequency Percent Value Label
248 24.6% 0 0
1 0.1% .00016203227729 .00016203227729
4 0.4% .00024304841593 .00024304841593
4 0.4% .0003250654837 .0003250654837
2 0.2% .00034071237592 .00034071237592
730 72.4% .00043247551933-.26152180566541 NOTE: Range of values omitted from display
7 0.7% .27854193202745 .27854193202745
1 0.1% .30962297372267 .30962297372267
3 0.3% .35291487278602 .35291487278602
7 0.7% .3601390172396 .3601390172396
1 0.1% .48504376757107 .48504376757107
etclsb8 Num 8 Crslvl IGP scope in Evolution NOTE: Smallest 5 and largest 5 values are displayed.
Frequency Percent Value Label
459 45.5% 0 0
2 0.2% .00011580335108 .00011580335108
2 0.2% .0002251505326 .0002251505326
1 0.1% .00023160670217 .00023160670217
3 0.3% .0004503010652 .0004503010652
481 47.7% .00064522363045-.12064837411096 NOTE: Range of values omitted from display
90

4 0.4% .12068231220982 .12068231220982
1 0.1% .12171842397388 .12171842397388
12 1.2% .1268359030869 .1268359030869
34 3.4% .13540159179591 .13540159179591
9 0.9% .1748466149015 .1748466149015
etclsb9 Num 8 Crslvl IGP scope in Environments & ecology NOTE: Smallest 5 and largest 5 values are displayed.
Frequency Percent Value Label
427 42.4% 0 0
4 0.4% .00015755389659 .00015755389659
8 0.8% .00022769620347 .00022769620347
16 1.6% .00023084365192 .00023084365192
1 0.1% .00027833595082 .00027833595082
526 52.2% .00029323041411-.1391010129926 NOTE: Range of values omitted from display
1 0.1% .13953877925274 .13953877925274
15 1.5% .13997654551289 .13997654551289
3 0.3% .14106839271751 .14106839271751
5 0.5% .14358267581623 .14358267581623
2 0.2% .34489916150791 .34489916150791
etclsb10 Num 8 Crslvl IGP scope in Nutrition & disease NOTE: Smallest 5 and largest 5 values are displayed.
Frequency Percent Value Label
276 27.4% 0 0
5 0.5% .00015458617321 .00015458617321
4 0.4% .00022436296473 .00022436296473
6 0.6% .0003045245813 .0003045245813
3 0.3% .00033347964172 .00033347964172
697 69.1% .00037451904968-.20095844857564 NOTE: Range of values omitted from display
5 0.5% .2144033529691 .2144033529691
2 0.2% .26535027638946 .26535027638946
3 0.3% .29103135335456 .29103135335456
91

1 0.1% .30132446608039 .30132446608039
6 0.6% .39541823756719 .39541823756719
etclsb11 Num 8 Crslvl IGP scope in Matter NOTE: Smallest 5 and largest 5 values are displayed.
Frequency Percent Value Label
66 6.5% 0 0
3 0.3% .00031940003129 .00031940003129
1 0.1% .00057069621003 .00057069621003
1 0.1% .00067048919953 .00067048919953
1 0.1% .00089023415234 .00089023415234
906 89.9% .00097277042939-.18302642879474 NOTE: Range of values omitted from display
12 1.2% .18504952544291 .18504952544291
4 0.4% .19699953327858 .19699953327858
7 0.7% .2089277377895 .2089277377895
4 0.4% .21093023550144 .21093023550144
3 0.3% .22290475091261 .22290475091261
etclsb12 Num 8 Crslvl IGP scope in Chemical properties NOTE: Smallest 5 and largest 5 values are displayed.
Frequency Percent Value Label
108 10.7% 0 0
12 1.2% .0002330361102 .0002330361102
1 0.1% .00027994566905 .00027994566905
2 0.2% .00031444719705 .00031444719705
6 0.6% .00071030548096 .00071030548096
865 85.8% .00128017351139-.24529283561444 NOTE: Range of values omitted from display
2 0.2% .2502968997537 .2502968997537
4 0.4% .25561568116173 .25561568116173
2 0.2% .27976029725648 .27976029725648
1 0.1% .3372813917867 .3372813917867
5 0.5% .35775459375342 .35775459375342
92

etclsb13 Num 8 Crslvl IGP scope in Structure of matter & physical changes NOTE: Smallest 5 and largest 5 values are displayed.
Frequency Percent Value Label
25 2.5% 0 0
1 0.1% .00055351796828 .00055351796828
2 0.2% .0008921587768 .0008921587768
43 4.3% .00242633451668 .00242633451668
1 0.1% .00297874667097 .00297874667097
908 90.1% .00319637466432-.39640256894146 NOTE: Range of values omitted from display
1 0.1% .40106185163845 .40106185163845
3 0.3% .42317252937916 .42317252937916
10 1.0% .43219974667965 .43219974667965
4 0.4% .46667999926908 .46667999926908
10 1.0% .475891392687 .475891392687
etclsb14 Num 8 Crslvl IGP scope in Forces, energy, & transformations energy NOTE: Smallest 5 and largest 5 values are displayed.
Frequency Percent Value Label
89 8.8% 0 0
2 0.2% .00023181512722 .00023181512722
6 0.6% .00027944668551 .00027944668551
1 0.1% .00044764780547 .00044764780547
3 0.3% .00046363025444 .00046363025444
846 83.9% .00088979472368-.28622738138536 NOTE: Range of values omitted from display
2 0.2% .28834453647945 .28834453647945
16 1.6% .28889554453253 .28889554453253
24 2.4% .29046169157355 .29046169157355
2 0.2% .2998099672291 .2998099672291
17 1.7% .30915824288464 .30915824288464
etclsb15 Num 8 Crslvl IGP scope in Light, sound, heat, electricity, &magnetism NOTE: Smallest 5 and largest 5 values are displayed.
Frequency Percent Value Label
93

56 5.6% 0 0
14 1.4% .00043874763668 .00043874763668
3 0.3% .00048750531093 .00048750531093
6 0.6% .00104803584237 .00104803584237
12 1.2% .0011178453236 .0011178453236
882 87.5% .00125929481627-.45698417177589 NOTE: Range of values omitted from display
1 0.1% .45766031605172 .45766031605172
2 0.2% .50953463820386 .50953463820386
24 2.4% .56140896035601 .56140896035601
2 0.2% .59761071247568 .59761071247568
6 0.6% .68689847482711 .68689847482711
etclsb16 Num 8 Crslvl IGP scope in Matter & transformations of matter NOTE: Smallest 5 and largest 5 values are displayed.
Frequency Percent Value Label
125 12.4% 0 0
1 0.1% .00040750158315 .00040750158315
2 0.2% .00069592540401 .00069592540401
1 0.1% .00072962158994 .00072962158994
7 0.7% .00078091917335 .00078091917335
841 83.4% .00081500316631-.14041294942384 NOTE: Range of values omitted from display
2 0.2% .14362123213769 .14362123213769
2 0.2% .14812473144247 .14812473144247
3 0.3% .14837588352886 .14837588352886
1 0.1% .15892431841712 .15892431841712
23 2.3% .1917230557197 .1917230557197
etclsb17 Num 8 Crslvl IGP scope in Nuclear physics NOTE: Smallest 5 and largest 5 values are displayed.
Frequency Percent Value Label
541 53.7% 0 0
1 0.1% .00031462321485 .00031462321485
1 0.1% .00041241539075 .00041241539075
94

7 0.7% .00052302786917 .00052302786917
1 0.1% .00054054837546 .00054054837546
409 40.6% .00059165451074-.09378163588866 NOTE: Range of values omitted from display
1 0.1% .09389998433538 .09389998433538
24 2.4% .09413668122883 .09413668122883
1 0.1% .10038799421135 .10038799421135
16 1.6% .10663930719387 .10663930719387
6 0.6% .14664403803955 .14664403803955
etclsb18 Num 8 Crslvl IGP scope in Chemical changes NOTE: Smallest 5 and largest 5 values are displayed.
Frequency Percent Value Label
92 9.1% 0 0
3 0.3% .00132366609891 .00132366609891
2 0.2% .00161938993853 .00161938993853
1 0.1% .00166178931034 .00166178931034
2 0.2% .00199378659589 .00199378659589
886 87.9% .00202239004133-.53617994232941 NOTE: Range of values omitted from display
2 0.2% .55693211645348 .55693211645348
3 0.3% .56218476994737 .56218476994737
3 0.3% .57768429057755 .57768429057755
1 0.1% .72659805272768 .72659805272768
13 1.3% .75019613099076 .75019613099076
etclsb19 Num 8 Crslvl IGP scope in Motion NOTE: Smallest 5 and largest 5 values are displayed.
Frequency Percent Value Label
467 46.3% 0 0
1 0.1% .000176068204 .000176068204
4 0.4% .00017758842891 .00017758842891
2 0.2% .00019457563909 .00019457563909
6 0.6% .00022531887832 .00022531887832
496 49.2% .000264102306-.20693767105591 NOTE: Range of values omitted from display
95

4 0.4% .2085123497109 .2085123497109
1 0.1% .22810440801927 .22810440801927
24 2.4% .25178835740448 .25178835740448
2 0.2% .30123775142358 .30123775142358
1 0.1% .35068714544267 .35068714544267
etclsb20 Num 8 Crslvl IGP scope in Science, technology, & math NOTE: Smallest 5 and largest 5 values are displayed.
Frequency Percent Value Label
26 2.6% 0 0
5 0.5% .00030707567829 .00030707567829
4 0.4% .00073250414833 .00073250414833
6 0.6% .00100873786552 .00100873786552
1 0.1% .00108650911101 .00108650911101
949 94.1% .00122519050673-.08046055933185 NOTE: Range of values omitted from display
9 0.9% .08186946887471 .08186946887471
1 0.1% .08476216452183 .08476216452183
2 0.2% .09312064497036 .09312064497036
1 0.1% .09732276928225 .09732276928225
4 0.4% .09748754960905 .09748754960905
etclsb21 Num 8 Crslvl IGP scope in History of science & technology NOTE: Smallest 5 and largest 5 values are displayed.
Frequency Percent Value Label
146 14.5% 0 0
2 0.2% .00006389150404 .00006389150404
1 0.1% .00009445915712 .00009445915712
1 0.1% .00012778300809 .00012778300809
3 0.3% .00018891831425 .00018891831425
798 79.2% .00030438701769-.0385406324224 NOTE: Range of values omitted from display
4 0.4% .03988761675813 .03988761675813
7 0.7% .04078803568747 .04078803568747
42 4.2% .046271069134 .046271069134
96

2 0.2% .04686938931577 .04686938931577
2 0.2% .04719173228288 .04719173228288
etclsb22 Num 8 Crslvl IGP scope in Environments & resources NOTE: Smallest 5 and largest 5 values are displayed.
Frequency Percent Value Label
163 16.2% 0 0
2 0.2% .00004548752901 .00004548752901
12 1.2% .00013646258705 .00013646258705
1 0.1% .00043045389844 .00043045389844
2 0.2% .00046649026226 .00046649026226
808 80.2% .00079863412402-.28072707424308 NOTE: Range of values omitted from display
1 0.1% .28450782726857 .28450782726857
1 0.1% .29428972825971 .29428972825971
15 1.5% .31444052012594 .31444052012594
1 0.1% .3580639664009 .3580639664009
2 0.2% .42183820454208 .42183820454208
etclsb23 Num 8 Crslvl IGP scope in Nature of science NOTE: Smallest 5 and largest 5 values are displayed.
Frequency Percent Value Label
186 18.5% 0 0
1 0.1% .00022429456567 .00022429456567
1 0.1% .00033644184851 .00033644184851
1 0.1% .00054704550224 .00054704550224
1 0.1% .00059856004658 .00059856004658
775 76.9% .00067288369703-.04818649029336 NOTE: Range of values omitted from display
1 0.1% .05180138441566 .05180138441566
5 0.5% .05397314186416 .05397314186416
23 2.3% .07089792214093 .07089792214093
7 0.7% .07114418586658 .07114418586658
7 0.7% .0784788784594 .0784788784594
97

etclsb24 Num 8 Crslvl IGP scope in Science & other disciplines NOTE: Smallest 5 and largest 5 values are displayed.
Frequency Percent Value Label
135 13.4% 0 0
1 0.1% .00004034526711 .00004034526711
3 0.3% .00008069053422 .00008069053422
5 0.5% .00029635964705 .00029635964705
29 2.9% .00041771252354 .00041771252354
759 75.3% .00042324878026-.13259043590768 NOTE: Range of values omitted from display
36 3.6% .13629013966338 .13629013966338
1 0.1% .13683936672176 .13683936672176
10 1.0% .14962092610093 .14962092610093
17 1.7% .16641000182866 .16641000182866
12 1.2% .25531233617779 .25531233617779
etclsb25 Num 8 Crslvl IGP scope in Understanding
Frequency Percent Value Label
988 98.0% 0 0
1 0.1% .00009355686967 .00009355686967
9 0.9% .00014033530451 .00014033530451
10 1.0% .00028067060902 .00028067060902
etclsb26 Num 8 Crslvl IGP scope in Analyzing & solving problems
Frequency Percent Value Label
1000 99.2% 0 0
7 0.7% .00009705324594 .00009705324594
1 0.1% .00131698074062 .00131698074062
etclsb27 Num 8 Crslvl IGP scope in Using tools & procedures
Frequency Percent Value Label
940 93.3% 0 0
1 0.1% .00004912638716 .00004912638716
9 0.9% .00007368958074 .00007368958074
98

10 1.0% .00014737916149 .00014737916149
1 0.1% .00122232274988 .00122232274988
1 0.1% .00150494286286 .00150494286286
10 1.0% .00225741429429 .00225741429429
36 3.6% .00451482858859 .00451482858859
etclsb28 Num 8 Crslvl IGP scope in Investigating
Frequency Percent Value Label
1001 99.3% 0 0
7 0.7% .00043420778292 .00043420778292
etclsb29 Num 1 Crslvl IGP scope in Communicating
Frequency Percent Value Label
1008 100.0% 0 0
etclsc1 Num 8 Crslvl PE scope in Earth features NOTE: Smallest 5 and largest 5 values are displayed.
Frequency Percent Value Label
331 32.8% 0 0
1 0.1% .00009375536689 .00009375536689
1 0.1% .00010746798023 .00010746798023
13 1.3% .00021493596046 .00021493596046
1 0.1% .00062171604672 .00062171604672
641 63.6% .00063686865513-.2331341415087 NOTE: Range of values omitted from display
3 0.3% .23892777475318 .23892777475318
11 1.1% .25382683958786 .25382683958786
1 0.1% .2955623725488 .2955623725488
1 0.1% .33582687032073 .33582687032073
4 0.4% .41308461766135 .41308461766135
etclsc2 Num 8 Crslvl PE scope in Earth process NOTE: Smallest 5 and largest 5 values are displayed.
Frequency Percent Value Label
99

236 23.4% 0 0
1 0.1% .00004327282734 .00004327282734
1 0.1% .00006490924101 .00006490924101
19 1.9% .00012981848203 .00012981848203
4 0.4% .00034811203364 .00034811203364
734 72.8% .00078803623756-.28781013080932 NOTE: Range of values omitted from display
1 0.1% .31681745855572 .31681745855572
1 0.1% .34807395000597 .34807395000597
1 0.1% .36331160520334 .36331160520334
4 0.4% .37933044145623 .37933044145623
6 0.6% .51595661086815 .51595661086815
etclsc3 Num 8 Crslvl PE scope in Earth and the universe NOTE: Smallest 5 and largest 5 values are displayed.
Frequency Percent Value Label
483 47.9% 0 0
8 0.8% .00014013443773 .00014013443773
8 0.8% .0002083344731 .0002083344731
10 1.0% .00024972173753 .00024972173753
10 1.0% .00028026887547 .00028026887547
464 46.0% .00029133449458-.12717718005283 NOTE: Range of values omitted from display
11 1.1% .1320632546052 .1320632546052
3 0.3% .13279546760338 .13279546760338
6 0.6% .15162911033539 .15162911033539
4 0.4% .1610325934152 .1610325934152
1 0.1% .16167650350464 .16167650350464
etclsc4 Num 8 Crslvl PE scope in Plants, animals, and their life cycles NOTE: Smallest 5 and largest 5 values are displayed.
Frequency Percent Value Label
265 26.3% 0 0
1 0.1% .0000874337668 .0000874337668
4 0.4% .00011160832801 .00011160832801
100

3 0.3% .00013099865004 .00013099865004
4 0.4% .0001311506502 .0001311506502
687 68.2% .00016741249202-.40276313929317 NOTE: Range of values omitted from display
1 0.1% .41299137359317 .41299137359317
14 1.4% .41977282596826 .41977282596826
12 1.2% .44110607277793 .44110607277793
8 0.8% .45580335141307 .45580335141307
9 0.9% .48995336334501 .48995336334501
etclsc5 Num 8 Crslvl PE scope in Organs NOTE: Smallest 5 and largest 5 values are displayed.
Frequency Percent Value Label
406 40.3% 0 0
9 0.9% .00026571900911 .00026571900911
2 0.2% .00029998816974 .00029998816974
3 0.3% .00031073604955 .00031073604955
3 0.3% .00037446702264 .00037446702264
550 54.6% .00053143801823-.383389012815 NOTE: Range of values omitted from display
1 0.1% .39066204948312 .39066204948312
16 1.6% .43953225497998 .43953225497998
6 0.6% .4406327004847 .4406327004847
7 0.7% .48723270909761 .48723270909761
5 0.5% .54549243955978 .54549243955978
etclsc6 Num 8 Crslvl PE scope in Biochemistry/microbiology NOTE: Smallest 5 and largest 5 values are displayed.
Frequency Percent Value Label
358 35.5% 0 0
1 0.1% .0000229558328 .0000229558328
6 0.6% .0000344337492 .0000344337492
3 0.3% .00006886749841 .00006886749841
1 0.1% .00031308270045 .00031308270045
608 60.3% .00035850976866-.1888138689824 NOTE: Range of values omitted from display
101

9 0.9% .19946016949185 .19946016949185
1 0.1% .19951740033278 .19951740033278
4 0.4% .20776498316308 .20776498316308
16 1.6% .24518015335556 .24518015335556
1 0.1% .27092699602551 .27092699602551
etclsc7 Num 8 Crslvl PE scope in Biosystems NOTE: Smallest 5 and largest 5 values are displayed.
Frequency Percent Value Label
248 24.6% 0 0
1 0.1% .00017577593638 .00017577593638
6 0.6% .00020683255884 .00020683255884
1 0.1% .00020767621872 .00020767621872
4 0.4% .00026366390457 .00026366390457
720 71.4% .00031422674886-.21588695278044 NOTE: Range of values omitted from display
1 0.1% .23898274940834 .23898274940834
16 1.6% .25939130799658 .25939130799658
3 0.3% .27617645997111 .27617645997111
7 0.7% .28463630148249 .28463630148249
1 0.1% .31487007392962 .31487007392962
etclsc8 Num 8 Crslvl PE scope in Evolution NOTE: Smallest 5 and largest 5 values are displayed.
Frequency Percent Value Label
459 45.5% 0 0
2 0.2% .00026916036204 .00026916036204
3 0.3% .00040550585445 .00040550585445
2 0.2% .00042286273599 .00042286273599
1 0.1% .00046536517497 .00046536517497
501 49.7% .00052894705776-.08503459808558 NOTE: Range of values omitted from display
1 0.1% .08958271853366 .08958271853366
12 1.2% .09947840650994 .09947840650994
14 1.4% .10444216472616 .10444216472616
102

4 0.4% .10573081563551 .10573081563551
9 0.9% .1172752100476 .1172752100476
etclsc9 Num 8 Crslvl PE scope in Environments & ecology NOTE: Smallest 5 and largest 5 values are displayed.
Frequency Percent Value Label
419 41.6% 0 0
4 0.4% .00006599739647 .00006599739647
5 0.5% .00013199479294 .00013199479294
1 0.1% .00016840276938 .00016840276938
1 0.1% .00029485696312 .00029485696312
544 54.0% .00036690868814-.15562922602102 NOTE: Range of values omitted from display
7 0.7% .15983120000656 .15983120000656
9 0.9% .16866355727144 .16866355727144
1 0.1% .1756445672828 .1756445672828
15 1.5% .20775079798444 .20775079798444
2 0.2% .36393411222593 .36393411222593
etclsc10 Num 8 Crslvl PE scope in Nutrition & disease NOTE: Smallest 5 and largest 5 values are displayed.
Frequency Percent Value Label
276 27.4% 0 0
5 0.5% .00008294610812 .00008294610812
3 0.3% .00026633459566 .00026633459566
4 0.4% .00052445257749 .00052445257749
3 0.3% .00053280576234 .00053280576234
695 68.9% .00054319437514-.23245433559927 NOTE: Range of values omitted from display
5 0.5% .23443231653105 .23443231653105
8 0.8% .23706512666278 .23706512666278
1 0.1% .25471984189958 .25471984189958
6 0.6% .35172683834709 .35172683834709
2 0.2% .35783859425972 .35783859425972
103

etclsc11 Num 8 Crslvl PE scope in Matter NOTE: Smallest 5 and largest 5 values are displayed.
Frequency Percent Value Label
66 6.5% 0 0
3 0.3% .00014136256139 .00014136256139
1 0.1% .0003360583155 .0003360583155
1 0.1% .00059136213046 .00059136213046
10 1.0% .000672116631 .000672116631
900 89.3% .00073539188144-.16685741659903 NOTE: Range of values omitted from display
12 1.2% .16688214071042 .16688214071042
7 0.7% .1746876965122 .1746876965122
1 0.1% .17833558810291 .17833558810291
3 0.3% .18816486436206 .18816486436206
4 0.4% .18981375960679 .18981375960679
etclsc12 Num 8 Crslvl PE scope in Chemical properties NOTE: Smallest 5 and largest 5 values are displayed.
Frequency Percent Value Label
108 10.7% 0 0
12 1.2% .00007143666084 .00007143666084
2 0.2% .00043138122045 .00043138122045
1 0.1% .00043713261806 .00043713261806
2 0.2% .00067979462037 .00067979462037
863 85.6% .0011108937597-.22226282604815 NOTE: Range of values omitted from display
2 0.2% .22393173690775 .22393173690775
2 0.2% .25678417489971 .25678417489971
10 1.0% .27983545875555 .27983545875555
5 0.5% .30554764545382 .30554764545382
1 0.1% .34221607267877 .34221607267877
etclsc13 Num 8 Crslvl PE scope in Structure of matter & physical changes NOTE: Smallest 5 and largest 5 values are displayed.
Frequency Percent Value Label
104

25 2.5% 0 0
1 0.1% .00021459620991 .00021459620991
6 0.6% .00091703025038 .00091703025038
43 4.3% .00176718157602 .00176718157602
4 0.4% .00182813629693 .00182813629693
899 89.2% .00182966485262-.44885223611287 NOTE: Range of values omitted from display
3 0.3% .44975032338063 .44975032338063
10 1.0% .45345892414173 .45345892414173
3 0.3% .46750658820213 .46750658820213
4 0.4% .55553124862023 .55553124862023
10 1.0% .5812013074657 .5812013074657
etclsc14 Num 8 Crslvl PE scope in Forces, energy, & transformations energy NOTE: Smallest 5 and largest 5 values are displayed.
Frequency Percent Value Label
88 8.7% 0 0
2 0.2% .0000877927575 .0000877927575
3 0.3% .00017558551501 .00017558551501
6 0.6% .00046837566551 .00046837566551
1 0.1% .00052039947844 .00052039947844
875 86.8% .00063202849492-.31085771661522 NOTE: Range of values omitted from display
2 0.2% .37065041776978 .37065041776978
24 2.4% .40304728172883 .40304728172883
2 0.2% .40424705852525 .40424705852525
1 0.1% .40544683532168 .40544683532168
4 0.4% .43132824273098 .43132824273098
etclsc15 Num 8 Crslvl PE scope in Light, sound, heat, electricity, & magnetism NOTE: Smallest 5 and largest 5 values are displayed.
Frequency Percent Value Label
56 5.6% 0 0
3 0.3% .00028272512279 .00028272512279
14 1.4% .00059450231058 .00059450231058
105

2 0.2% .00104423809494 .00104423809494
8 0.8% .00142983128987 .00142983128987
890 88.3% .00153234783899-.64918844469755 NOTE: Range of values omitted from display
24 2.4% .7229003791334 .7229003791334
2 0.2% .7335593727388 .7335593727388
2 0.2% .73866623442296 .73866623442296
1 0.1% .74421836634421 .74421836634421
6 0.6% 1.06802571611078 1.06802571611078
etclsc16 Num 8 Crslvl PE scope in Matter & transformations of matter NOTE: Smallest 5 and largest 5 values are displayed.
Frequency Percent Value Label
125 12.4% 0 0
1 0.1% .00013882451593 .00013882451593
1 0.1% .00027764903187 .00027764903187
2 0.2% .000441795394 .000441795394
5 0.5% .00057168134574 .00057168134574
838 83.1% .00064416525565-.12211736965252 NOTE: Range of values omitted from display
3 0.3% .12688587180039 .12688587180039
2 0.2% .13045765713442 .13045765713442
2 0.2% .13830540250036 .13830540250036
6 0.6% .14972493320032 .14972493320032
23 2.3% .14973140078707 .14973140078707
etclsc17 Num 8 Crslvl PE scope in Nuclear physics NOTE: Smallest 5 and largest 5 values are displayed.
Frequency Percent Value Label
502 49.8% 0 0
1 0.1% .00010664577425 .00010664577425
1 0.1% .00012567646939 .00012567646939
7 0.7% .00015596550535 .00015596550535
29 2.9% .0002132915485 .0002132915485
434 43.1% .00023404188915-.07508218593046 NOTE: Range of values omitted from display
106

2 0.2% .08150633179128 .08150633179128
1 0.1% .08533599514213 .08533599514213
1 0.1% .09265456498469 .09265456498469
24 2.4% .11804675488206 .11804675488206
6 0.6% .16653197665541 .16653197665541
etclsc18 Num 8 Crslvl PE scope in Chemical changes NOTE: Smallest 5 and largest 5 values are displayed.
Frequency Percent Value Label
92 9.1% 0 0
2 0.2% .00082529884313 .00082529884313
1 0.1% .00086769447883 .00086769447883
2 0.2% .00118677942103 .00118677942103
1 0.1% .00134605558346 .00134605558346
880 87.3% .0013550864532-.50906364112481 NOTE: Range of values omitted from display
13 1.3% .5430190223967299 .5430190223967299
10 1.0% .57081985879784 .57081985879784
3 0.3% .57985081452582 .57985081452582
3 0.3% .61591799945654 .61591799945654
1 0.1% .65082937978874 .65082937978874
etclsc19 Num 8 Crslvl PE scope in Motion NOTE: Smallest 5 and largest 5 values are displayed.
Frequency Percent Value Label
467 46.3% 0 0
1 0.1% .00007559460754 .00007559460754
9 0.9% .00011339191131 .00011339191131
10 1.0% .00022678382263 .00022678382263
2 0.2% .0003137877303 .0003137877303
487 48.3% .00039471881399-.30317339082187 NOTE: Range of values omitted from display
1 0.1% .32785007318603 .32785007318603
4 0.4% .34629485686509 .34629485686509
24 2.4% .41607323155712 .41607323155712
107
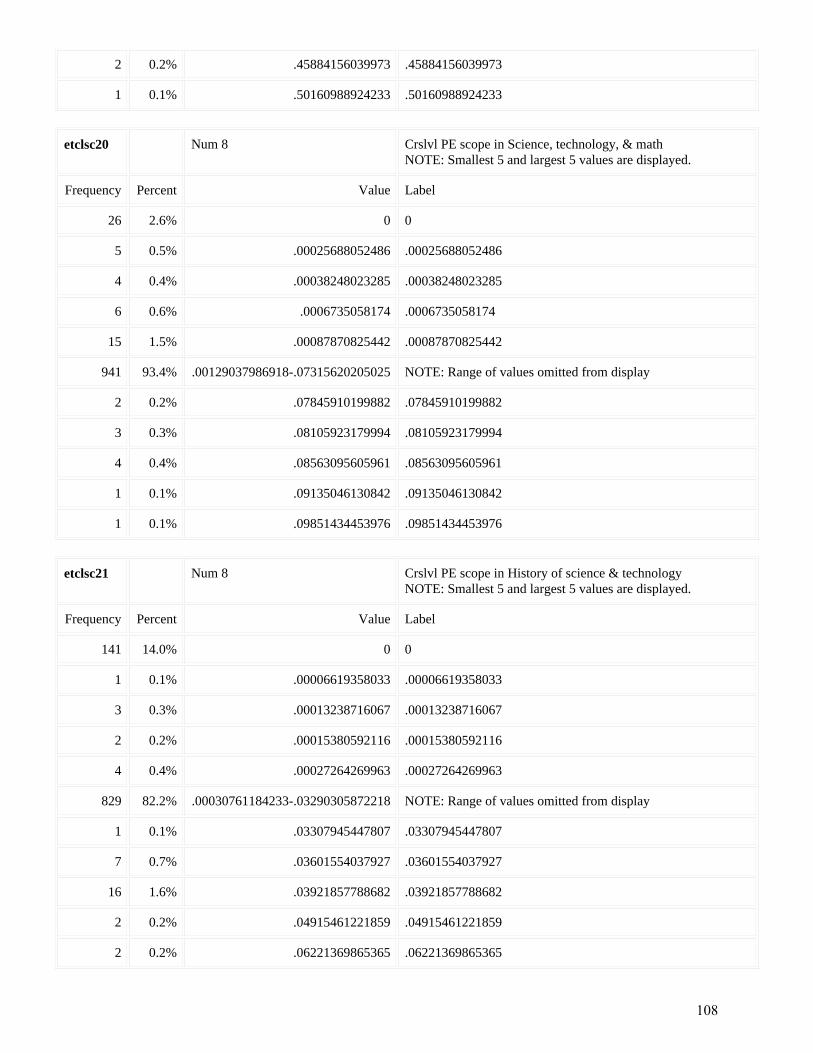
2 0.2% .45884156039973 .45884156039973
1 0.1% .50160988924233 .50160988924233
etclsc20 Num 8 Crslvl PE scope in Science, technology, & math NOTE: Smallest 5 and largest 5 values are displayed.
Frequency Percent Value Label
26 2.6% 0 0
5 0.5% .00025688052486 .00025688052486
4 0.4% .00038248023285 .00038248023285
6 0.6% .0006735058174 .0006735058174
15 1.5% .00087870825442 .00087870825442
941 93.4% .00129037986918-.07315620205025 NOTE: Range of values omitted from display
2 0.2% .07845910199882 .07845910199882
3 0.3% .08105923179994 .08105923179994
4 0.4% .08563095605961 .08563095605961
1 0.1% .09135046130842 .09135046130842
1 0.1% .09851434453976 .09851434453976
etclsc21 Num 8 Crslvl PE scope in History of science & technology NOTE: Smallest 5 and largest 5 values are displayed.
Frequency Percent Value Label
141 14.0% 0 0
1 0.1% .00006619358033 .00006619358033
3 0.3% .00013238716067 .00013238716067
2 0.2% .00015380592116 .00015380592116
4 0.4% .00027264269963 .00027264269963
829 82.2% .00030761184233-.03290305872218 NOTE: Range of values omitted from display
1 0.1% .03307945447807 .03307945447807
7 0.7% .03601554037927 .03601554037927
16 1.6% .03921857788682 .03921857788682
2 0.2% .04915461221859 .04915461221859
2 0.2% .06221369865365 .06221369865365
108

etclsc22 Num 8 Crslvl PE scope in Environments & resources NOTE: Smallest 5 and largest 5 values are displayed.
Frequency Percent Value Label
175 17.4% 0 0
2 0.2% .00008366455774 .00008366455774
12 1.2% .00025099367322 .00025099367322
3 0.3% .00043228496343 .00043228496343
5 0.5% .00045008473234 .00045008473234
783 77.7% .00055697925382-.30884886806469 NOTE: Range of values omitted from display
1 0.1% .3532248163596 .3532248163596
1 0.1% .36644987660001 .36644987660001
15 1.5% .37259103714053 .37259103714053
2 0.2% .37967493684042 .37967493684042
9 0.9% .38413994315629 .38413994315629
etclsc23 Num 8 Crslvl PE scope in Nature of science NOTE: Smallest 5 and largest 5 values are displayed.
Frequency Percent Value Label
186 18.5% 0 0
1 0.1% .00032681519317 .00032681519317
1 0.1% .00049022278976 .00049022278976
1 0.1% .00055011726935 .00055011726935
10 1.0% .00061085801499 .00061085801499
778 77.2% .00064088381718-.04804868864535 NOTE: Range of values omitted from display
11 1.1% .04881867256387 .04881867256387
7 0.7% .05670836369714 .05670836369714
5 0.5% .05811062813824 .05811062813824
1 0.1% .06087625438666 .06087625438666
7 0.7% .07538061011187 .07538061011187
etclsc24 Num 8 Crslvl PE scope in Science & other disciplines NOTE: Smallest 5 and largest 5 values are displayed.
Frequency Percent Value Label
109

135 13.4% 0 0
1 0.1% .00007539336607 .00007539336607
3 0.3% .00015078673215 .00015078673215
5 0.5% .00015672026903 .00015672026903
18 1.8% .00031344053807 .00031344053807
805 79.9% .00047402137119-.15797172639897 NOTE: Range of values omitted from display
17 1.7% .17218999516041 .17218999516041
1 0.1% .19012983553393 .19012983553393
10 1.0% .20044562525599 .20044562525599
1 0.1% .20266839995461 .20266839995461
12 1.2% .37271763685885 .37271763685885
etclsc25 Num 8 Crslvl PE scope in Understanding
Frequency Percent Value Label
948 94.0% 0 0
1 0.1% .0000510451448 .0000510451448
1 0.1% .00005385240434 .00005385240434
9 0.9% .0000765677172 .0000765677172
3 0.3% .00010770480868 .00010770480868
10 1.0% .00015313543441 .00015313543441
7 0.7% .00023627495414 .00023627495414
9 0.9% .00082393376737 .00082393376737
18 1.8% .00164786753475 .00164786753475
2 0.2% .00406568272197 .00406568272197
etclsc26 Num 8 Crslvl PE scope in Analyzing & solving problems
Frequency Percent Value Label
922 91.5% 0 0
1 0.1% .00008990649266 .00008990649266
1 0.1% .000134859739 .000134859739
8 0.8% .00016108186308 .00016108186308
3 0.3% .00022885956665 .00022885956665
110
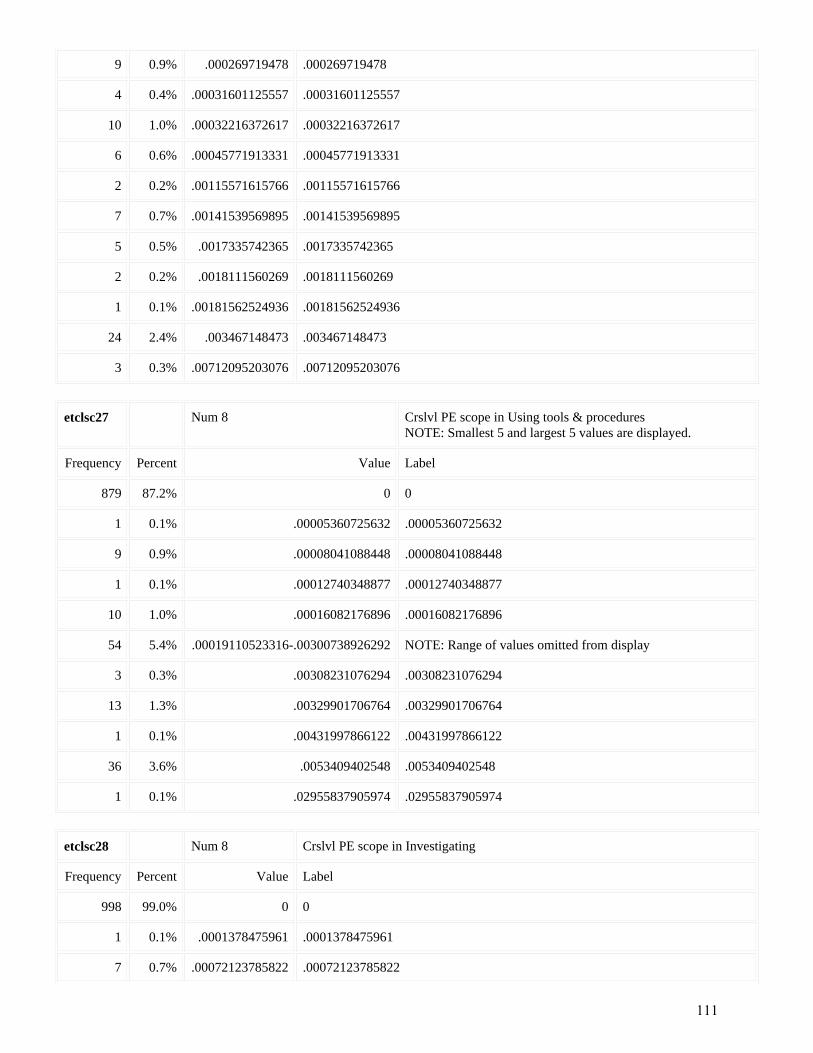
9 0.9% .000269719478 .000269719478
4 0.4% .00031601125557 .00031601125557
10 1.0% .00032216372617 .00032216372617
6 0.6% .00045771913331 .00045771913331
2 0.2% .00115571615766 .00115571615766
7 0.7% .00141539569895 .00141539569895
5 0.5% .0017335742365 .0017335742365
2 0.2% .0018111560269 .0018111560269
1 0.1% .00181562524936 .00181562524936
24 2.4% .003467148473 .003467148473
3 0.3% .00712095203076 .00712095203076
etclsc27 Num 8 Crslvl PE scope in Using tools & procedures NOTE: Smallest 5 and largest 5 values are displayed.
Frequency Percent Value Label
879 87.2% 0 0
1 0.1% .00005360725632 .00005360725632
9 0.9% .00008041088448 .00008041088448
1 0.1% .00012740348877 .00012740348877
10 1.0% .00016082176896 .00016082176896
54 5.4% .00019110523316-.00300738926292 NOTE: Range of values omitted from display
3 0.3% .00308231076294 .00308231076294
13 1.3% .00329901706764 .00329901706764
1 0.1% .00431997866122 .00431997866122
36 3.6% .0053409402548 .0053409402548
1 0.1% .02955837905974 .02955837905974
etclsc28 Num 8 Crslvl PE scope in Investigating
Frequency Percent Value Label
998 99.0% 0 0
1 0.1% .0001378475961 .0001378475961
7 0.7% .00072123785822 .00072123785822
111
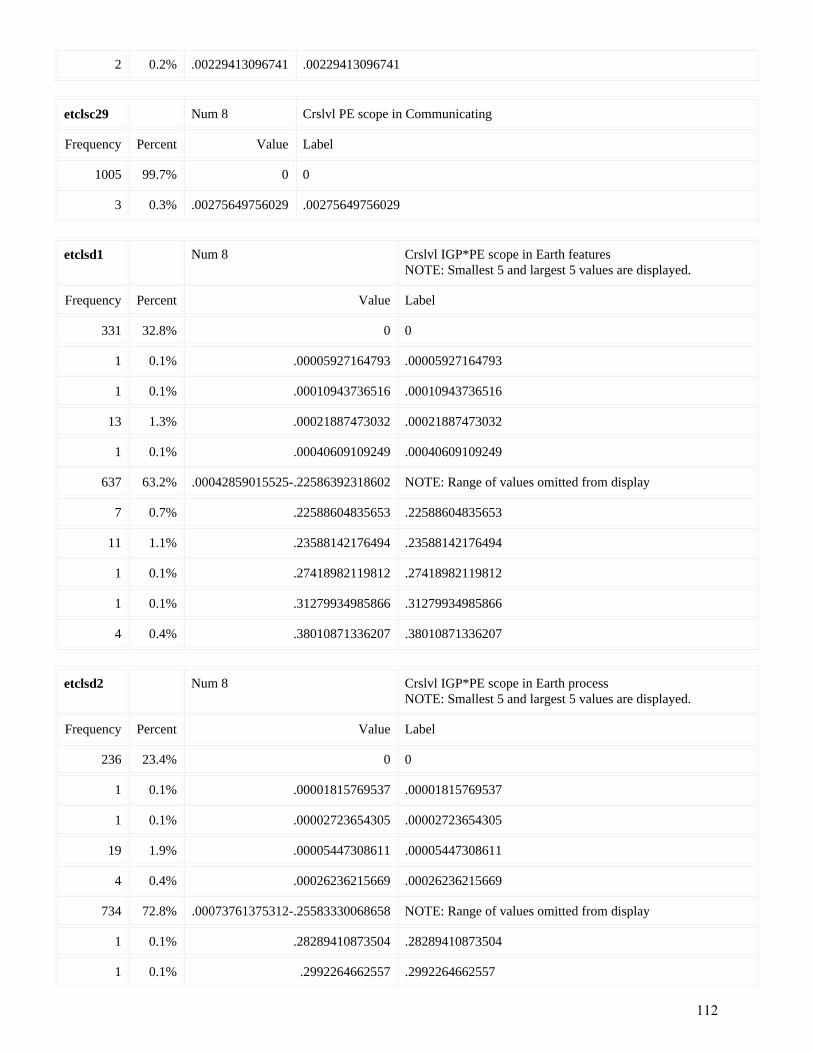
2 0.2% .00229413096741 .00229413096741
etclsc29 Num 8 Crslvl PE scope in Communicating
Frequency Percent Value Label
1005 99.7% 0 0
3 0.3% .00275649756029 .00275649756029
etclsd1 Num 8 Crslvl IGP*PE scope in Earth features NOTE: Smallest 5 and largest 5 values are displayed.
Frequency Percent Value Label
331 32.8% 0 0
1 0.1% .00005927164793 .00005927164793
1 0.1% .00010943736516 .00010943736516
13 1.3% .00021887473032 .00021887473032
1 0.1% .00040609109249 .00040609109249
637 63.2% .00042859015525-.22586392318602 NOTE: Range of values omitted from display
7 0.7% .22588604835653 .22588604835653
11 1.1% .23588142176494 .23588142176494
1 0.1% .27418982119812 .27418982119812
1 0.1% .31279934985866 .31279934985866
4 0.4% .38010871336207 .38010871336207
etclsd2 Num 8 Crslvl IGP*PE scope in Earth process NOTE: Smallest 5 and largest 5 values are displayed.
Frequency Percent Value Label
236 23.4% 0 0
1 0.1% .00001815769537 .00001815769537
1 0.1% .00002723654305 .00002723654305
19 1.9% .00005447308611 .00005447308611
4 0.4% .00026236215669 .00026236215669
734 72.8% .00073761375312-.25583330068658 NOTE: Range of values omitted from display
1 0.1% .28289410873504 .28289410873504
1 0.1% .2992264662557 .2992264662557
112

1 0.1% .31170836430633 .31170836430633
4 0.4% .31555882377636 .31555882377636
6 0.6% .46085442834885 .46085442834885
etclsd3 Num 8 Crslvl IGP*PE scope in Earth and the universe NOTE: Smallest 5 and largest 5 values are displayed.
Frequency Percent Value Label
483 47.9% 0 0
8 0.8% .00012786017137 .00012786017137
10 1.0% .00020870646298 .00020870646298
10 1.0% .00025572034275 .00025572034275
8 0.8% .0002726153884 .0002726153884
464 46.0% .00030760727543-.11607145788594 NOTE: Range of values omitted from display
11 1.1% .12353923069639 .12353923069639
3 0.3% .12955872141906 .12955872141906
4 0.4% .14238958358005 .14238958358005
6 0.6% .14767639535957 .14767639535957
1 0.1% .15314229864277 .15314229864277
etclsd4 Num 8 Crslvl IGP*PE scope in Plants, animals, and their life cycles NOTE: Smallest 5 and largest 5 values are displayed.
Frequency Percent Value Label
265 26.3% 0 0
4 0.4% .00005685134751 .00005685134751
1 0.1% .00007524806366 .00007524806366
2 0.2% .00008527702127 .00008527702127
3 0.3% .00009894293277 .00009894293277
689 68.4% .00011287209549-.30974389601004 NOTE: Range of values omitted from display
14 1.4% .326532061703 .326532061703
1 0.1% .32694106209252 .32694106209252
12 1.2% .33432213830356 .33432213830356
8 0.8% .34943651852276 .34943651852276
9 0.9% .35146145908605 .35146145908605
113

etclsd5 Num 8 Crslvl IGP*PE scope in Organs NOTE: Smallest 5 and largest 5 values are displayed.
Frequency Percent Value Label
406 40.3% 0 0
9 0.9% .00017818530133 .00017818530133
2 0.2% .00020521446536 .00020521446536
3 0.3% .00024052597045 .00024052597045
3 0.3% .00034902976711 .00034902976711
549 54.5% .00035637060267-.33112899108968 NOTE: Range of values omitted from display
2 0.2% .33861655093349 .33861655093349
16 1.6% .34302672421858 .34302672421858
6 0.6% .38882178892137 .38882178892137
7 0.7% .40620388491864 .40620388491864
5 0.5% .46249281281211 .46249281281211
etclsd6 Num 8 Crslvl IGP*PE scope in Biochemistry/microbiology NOTE: Smallest 5 and largest 5 values are displayed.
Frequency Percent Value Label
363 36.0% 0 0
1 0.1% .00002258515308 .00002258515308
6 0.6% .00003387772963 .00003387772963
3 0.3% .00006775545926 .00006775545926
1 0.1% .00030980227332 .00030980227332
596 59.1% .00039161274614-.21997924778768 NOTE: Range of values omitted from display
8 0.8% .22026038064024 .22026038064024
4 0.4% .22753306912314 .22753306912314
9 0.9% .25459972079941 .25459972079941
16 1.6% .29222374856293 .29222374856293
1 0.1% .32351707976325 .32351707976325
etclsd7 Num 8 Crslvl IGP*PE scope in Biosystems NOTE: Smallest 5 and largest 5 values are displayed.
Frequency Percent Value Label
114

248 24.6% 0 0
1 0.1% .0001390780927 .0001390780927
6 0.6% .00016477887696 .00016477887696
1 0.1% .00019883856371 .00019883856371
4 0.4% .00020861713905 .00020861713905
720 71.4% .00027163713517-.24525791852196 NOTE: Range of values omitted from display
1 0.1% .28231053712295 .28231053712295
3 0.3% .28560463628433 .28560463628433
16 1.6% .2858521946154 .2858521946154
7 0.7% .32812580411751 .32812580411751
1 0.1% .34753539331134 .34753539331134
etclsd8 Num 8 Crslvl IGP*PE scope in Evolution NOTE: Smallest 5 and largest 5 values are displayed.
Frequency Percent Value Label
459 45.5% 0 0
2 0.2% .00022089239167 .00022089239167
2 0.2% .00043236482434 .00043236482434
1 0.1% .00044178478335 .00044178478335
3 0.3% .0005501121416 .0005501121416
501 49.7% .00066438069356-.1074583652525 NOTE: Range of values omitted from display
1 0.1% .11183020147921 .11183020147921
12 1.2% .12057387393263 .12057387393263
4 0.4% .13141508061144 .13141508061144
14 1.4% .13237168876254 .13237168876254
9 0.9% .14515734344623 .14515734344623
etclsd9 Num 8 Crslvl IGP*PE scope in Environments & ecology NOTE: Smallest 5 and largest 5 values are displayed.
Frequency Percent Value Label
427 42.4% 0 0
4 0.4% .00006909099578 .00006909099578
1 0.1% .00012318383433 .00012318383433
115

5 0.5% .00013818199156 .00013818199156
1 0.1% .00023311811261 .00023311811261
541 53.7% .00023971268763-.13787922633064 NOTE: Range of values omitted from display
2 0.2% .14007770244522 .14007770244522
9 0.9% .14979155686643 .14979155686643
1 0.1% .16408902627262 .16408902627262
15 1.5% .18810035010003 .18810035010003
2 0.2% .32839927003184 .32839927003184
etclsd10 Num 8 Crslvl IGP*PE scope in Nutrition & disease NOTE: Smallest 5 and largest 5 values are displayed.
Frequency Percent Value Label
276 27.4% 0 0
5 0.5% .00006577557999 .00006577557999
3 0.3% .00019937908437 .00019937908437
4 0.4% .0003936725665 .0003936725665
3 0.3% .00043113076089 .00043113076089
695 68.9% .0005213534554-.2096477540783 NOTE: Range of values omitted from display
5 0.5% .21364575473208 .21364575473208
1 0.1% .21589993282046 .21589993282046
8 0.8% .22585211256877 .22585211256877
2 0.2% .29349506882093 .29349506882093
6 0.6% .33355865105216 .33355865105216
etclsd11 Num 8 Crslvl IGP*PE scope in Matter NOTE: Smallest 5 and largest 5 values are displayed.
Frequency Percent Value Label
66 6.5% 0 0
3 0.3% .00017541679704 .00017541679704
1 0.1% .00027969965528 .00027969965528
1 0.1% .00049345908299 .00049345908299
10 1.0% .00055939931056 .00055939931056
900 89.3% .00068242560129-.1416884196057 NOTE: Range of values omitted from display
116

1 0.1% .15694214193694 .15694214193694
12 1.2% .15837018760614 .15837018760614
3 0.3% .174766877092 .174766877092
7 0.7% .17580382999087 .17580382999087
4 0.4% .17819283745107 .17819283745107
etclsd12 Num 8 Crslvl IGP*PE scope in Chemical properties NOTE: Smallest 5 and largest 5 values are displayed.
Frequency Percent Value Label
108 10.7% 0 0
12 1.2% .00007410222153 .00007410222153
2 0.2% .00044624253677 .00044624253677
1 0.1% .00045770598763 .00045770598763
2 0.2% .00071692223157 .00071692223157
863 85.6% .00126462538879-.2335016325533 NOTE: Range of values omitted from display
2 0.2% .23402642202622 .23402642202622
2 0.2% .26729284809654 .26729284809654
10 1.0% .2896845194634 .2896845194634
5 0.5% .31937990855901 .31937990855901
1 0.1% .34874441429532 .34874441429532
etclsd13 Num 8 Crslvl IGP*PE scope in Structure of matter & physical changes NOTE: Smallest 5 and largest 5 values are displayed.
Frequency Percent Value Label
25 2.5% 0 0
1 0.1% .00027241077836 .00027241077836
6 0.6% .00094846904159 .00094846904159
2 0.2% .00179892163802 .00179892163802
43 4.3% .00204153268925 .00204153268925
901 89.4% .00214415701676-.4507097577504 NOTE: Range of values omitted from display
10 1.0% .45464498547358 .45464498547358
3 0.3% .45506792881051 .45506792881051
3 0.3% .47683235081048 .47683235081048
117

4 0.4% .56709818866393 .56709818866393
10 1.0% .59403794024871 .59403794024871
etclsd14 Num 8 Crslvl IGP*PE scope in Forces, energy, & transformationsenergy NOTE: Smallest 5 and largest 5 values are displayed.
Frequency Percent Value Label
93 9.2% 0 0
2 0.2% .00010497856442 .00010497856442
3 0.3% .00020995712884 .00020995712884
6 0.6% .00049752589947 .00049752589947
1 0.1% .00054033640685 .00054033640685
870 86.3% .0005958001782-.31829524503299 NOTE: Range of values omitted from display
2 0.2% .38407543749212 .38407543749212
24 2.4% .39637721747212 .39637721747212
2 0.2% .40633205290516 .40633205290516
1 0.1% .4162868883382 .4162868883382
4 0.4% .44242003767717 .44242003767717
etclsd15 Num 8 Crslvl IGP*PE scope in Light, sound, heat, electricity, &magnetism NOTE: Smallest 5 and largest 5 values are displayed.
Frequency Percent Value Label
56 5.6% 0 0
3 0.3% .00026774142706 .00026774142706
14 1.4% .00056268198319 .00056268198319
2 0.2% .00126779565188 .00126779565188
8 0.8% .00154570593793 .00154570593793
890 88.3% .00159679183956-.63847753598548 NOTE: Range of values omitted from display
1 0.1% .69112188522787 .69112188522787
2 0.2% .69592512047453 .69592512047453
24 2.4% .7007283557212 .7007283557212
2 0.2% .7036675740773199 .7036675740773199
6 0.6% 1.02868864717818 1.02868864717818
118

etclsd16 Num 8 Crslvl IGP*PE scope in Matter & transformations of matter NOTE: Smallest 5 and largest 5 values are displayed.
Frequency Percent Value Label
125 12.4% 0 0
1 0.1% .00017165042016 .00017165042016
1 0.1% .00034330084032 .00034330084032
2 0.2% .00058555588761 .00058555588761
5 0.5% .00073883711772 .00073883711772
838 83.1% .00079765827229-.12808673533403 NOTE: Range of values omitted from display
3 0.3% .13051945150346 .13051945150346
2 0.2% .13784714363014 .13784714363014
2 0.2% .14313828549198 .14313828549198
6 0.6% .1557571194805 .1557571194805
23 2.3% .15976468840599 .15976468840599
etclsd17 Num 8 Crslvl IGP*PE scope in Nuclear physics NOTE: Smallest 5 and largest 5 values are displayed.
Frequency Percent Value Label
541 53.7% 0 0
1 0.1% .00014626566594 .00014626566594
1 0.1% .00019932949048 .00019932949048
7 0.7% .00020481625669 .00020481625669
29 2.9% .00029253133188 .00029253133188
395 39.2% .00036357267407-.09787590169068 NOTE: Range of values omitted from display
1 0.1% .10558843197273 .10558843197273
2 0.2% .10593372119057 .10593372119057
1 0.1% .11263068804632 .11263068804632
24 2.4% .12738547440197 .12738547440197
6 0.6% .21501102505493 .21501102505493
etclsd18 Num 8 Crslvl IGP*PE scope in Chemical changes NOTE: Smallest 5 and largest 5 values are displayed.
Frequency Percent Value Label
119

92 9.1% 0 0
2 0.2% .0010884294278 .0010884294278
1 0.1% .0011014643453 .0011014643453
2 0.2% .00175564152949 .00175564152949
1 0.1% .00185922251911 .00185922251911
880 87.3% .00187555928045-.5730958316436801 NOTE: Range of values omitted from display
13 1.3% .60609476036534 .60609476036534
10 1.0% .61753339166979 .61753339166979
3 0.3% .64657630680662 .64657630680662
3 0.3% .67826913481246 .67826913481246
1 0.1% .7386786673083 .7386786673083
etclsd19 Num 8 Crslvl IGP*PE scope in Motion NOTE: Smallest 5 and largest 5 values are displayed.
Frequency Percent Value Label
467 46.3% 0 0
1 0.1% .00008629147188 .00008629147188
9 0.9% .00012943720783 .00012943720783
10 1.0% .00025887441566 .00025887441566
2 0.2% .00037563908642 .00037563908642
487 48.3% .00038575137441-.29495941574424 NOTE: Range of values omitted from display
1 0.1% .32669063059329 .32669063059329
4 0.4% .34805208684626 .34805208684626
24 2.4% .39261078604087 .39261078604087
2 0.2% .45247971560966 .45247971560966
1 0.1% .51234864517845 .51234864517845
etclsd20 Num 8 Crslvl IGP*PE scope in Science, technology, & math NOTE: Smallest 5 and largest 5 values are displayed.
Frequency Percent Value Label
26 2.6% 0 0
5 0.5% .00028015463748 .00028015463748
4 0.4% .00037187087539 .00037187087539
120

15 1.5% .00084473124677 .00084473124677
6 0.6% .00096582858241 .00096582858241
928 92.1% .00129267233227-.075748403935 NOTE: Range of values omitted from display
3 0.3% .07748425953105 .07748425953105
15 1.5% .07939224083329 .07939224083329
1 0.1% .08190461512566 .08190461512566
4 0.4% .09524485445422 .09524485445422
1 0.1% .10319595884564 .10319595884564
etclsd21 Num 8 Crslvl IGP*PE scope in History of science & technology NOTE: Smallest 5 and largest 5 values are displayed.
Frequency Percent Value Label
146 14.5% 0 0
1 0.1% .00005187764925 .00005187764925
3 0.3% .0001037552985 .0001037552985
2 0.2% .0001044614266 .0001044614266
1 0.1% .00020892285321 .00020892285321
789 78.3% .00021913795707-.03432140206718 NOTE: Range of values omitted from display
16 1.6% .03537344014449 .03537344014449
2 0.2% .03838781830274 .03838781830274
42 4.2% .03941314578153 .03941314578153
4 0.4% .03978503346778 .03978503346778
2 0.2% .04197192404517 .04197192404517
etclsd22 Num 8 Crslvl IGP*PE scope in Environments & resources NOTE: Smallest 5 and largest 5 values are displayed.
Frequency Percent Value Label
182 18.1% 0 0
2 0.2% .00008678638557 .00008678638557
12 1.2% .00026035915673 .00026035915673
5 0.5% .00040924661886 .00040924661886
2 0.2% .00061370002466 .00061370002466
777 77.1% .00061944325882-.32113883698157 NOTE: Range of values omitted from display
121

1 0.1% .33830907219625 .33830907219625
1 0.1% .35390478075377 .35390478075377
2 0.2% .36950048931128 .36950048931128
15 1.5% .38591505545438 .38591505545438
9 0.9% .39429296182479 .39429296182479
etclsd23 Num 8 Crslvl IGP*PE scope in Nature of science NOTE: Smallest 5 and largest 5 values are displayed.
Frequency Percent Value Label
186 18.5% 0 0
1 0.1% .00026512339404 .00026512339404
1 0.1% .00039768509106 .00039768509106
10 1.0% .00052572232081 .00052572232081
1 0.1% .00055689093303 .00055689093303
778 77.2% .00056628309855-.04355761464758 NOTE: Range of values omitted from display
11 1.1% .04963014339847 .04963014339847
7 0.7% .05986481493198 .05986481493198
1 0.1% .06222322218081 .06222322218081
5 0.5% .06897828511505 .06897828511505
7 0.7% .07150279161116 .07150279161116
etclsd24 Num 8 Crslvl IGP*PE scope in Science & other disciplines NOTE: Smallest 5 and largest 5 values are displayed.
Frequency Percent Value Label
135 13.4% 0 0
1 0.1% .00006647373361 .00006647373361
3 0.3% .00013294746723 .00013294746723
5 0.5% .00013733589692 .00013733589692
18 1.8% .00027467179384 .00027467179384
805 79.9% .00052019996476-.17200438280456 NOTE: Range of values omitted from display
17 1.7% .17870151467164 .17870151467164
1 0.1% .18018512070197 .18018512070197
1 0.1% .21148426639811 .21148426639811
122

10 1.0% .21841521943724 .21841521943724
12 1.2% .41391097372809 .41391097372809
etclsd25 Num 8 Crslvl IGP*PE scope in Understanding
Frequency Percent Value Label
988 98.0% 0 0
1 0.1% .00004585245834 .00004585245834
9 0.9% .00006877868751 .00006877868751
10 1.0% .00013755737502 .00013755737502
etclsd26 Num 8 Crslvl IGP*PE scope in Analyzing & solving problems
Frequency Percent Value Label
1000 99.2% 0 0
7 0.7% .00030016408853 .00030016408853
1 0.1% .00182946661185 .00182946661185
etclsd27 Num 8 Crslvl IGP*PE scope in Using tools & procedures
Frequency Percent Value Label
940 93.3% 0 0
1 0.1% .00007223089962 .00007223089962
9 0.9% .00010834634944 .00010834634944
10 1.0% .00021669269888 .00021669269888
1 0.1% .00120794947202 .00120794947202
1 0.1% .00169797369912 .00169797369912
10 1.0% .00181192420804 .00181192420804
36 3.6% .00362384841608 .00362384841608
etclsd28 Num 8 Crslvl IGP*PE scope in Investigating
Frequency Percent Value Label
1001 99.3% 0 0
7 0.7% .0001918440044 .0001918440044
etclsd29 Num 1 Crslvl IGP*PE scope in Communicating
123

Frequency Percent Value Label
1008 100.0% 0 0
124
Related Documents