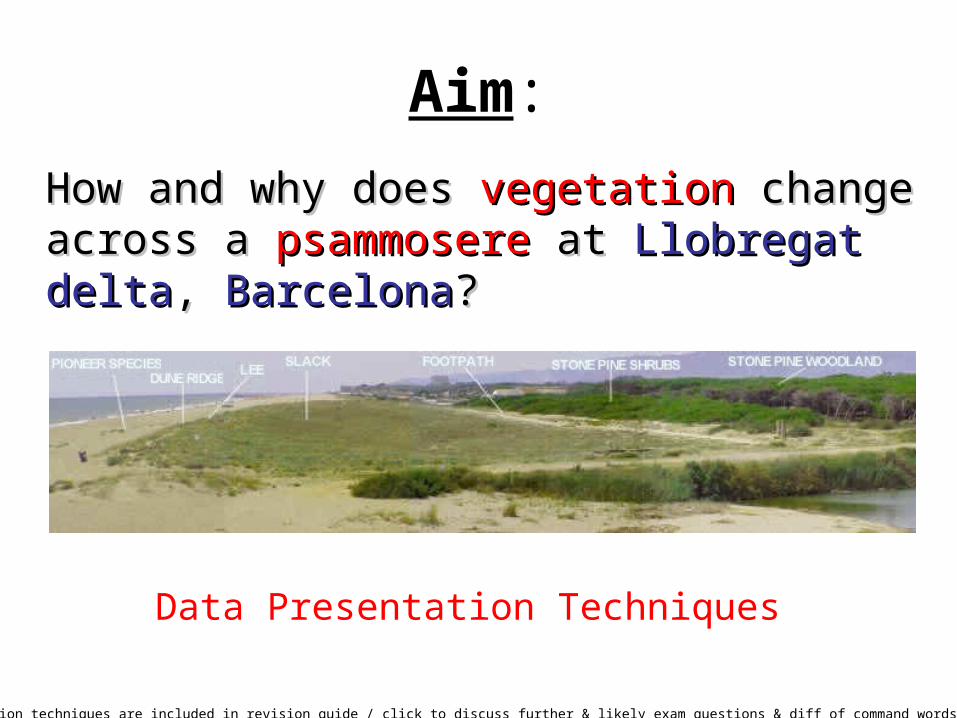
Aim : How and why does How and why does vegetation vegetation change change across a across a psammosere psammosere at at Llobregat Llobregat delta delta , , Barcelona Barcelona ? ? Data Presentation Techniques ion techniques are included in revision guide / click to discuss further & likely exam questions & diff of command words

Welcome message from author
This document is posted to help you gain knowledge. Please leave a comment to let me know what you think about it! Share it to your friends and learn new things together.
Transcript
Aim:
How and why does How and why does vegetationvegetation change across a change across a psammoserepsammosere at at Llobregat deltaLlobregat delta, , BarcelonaBarcelona??
Data Presentation Techniques
Discuss data presentation techniques are included in revision guide / click to discuss further & likely exam questions & diff of command words e.g. desc & outline

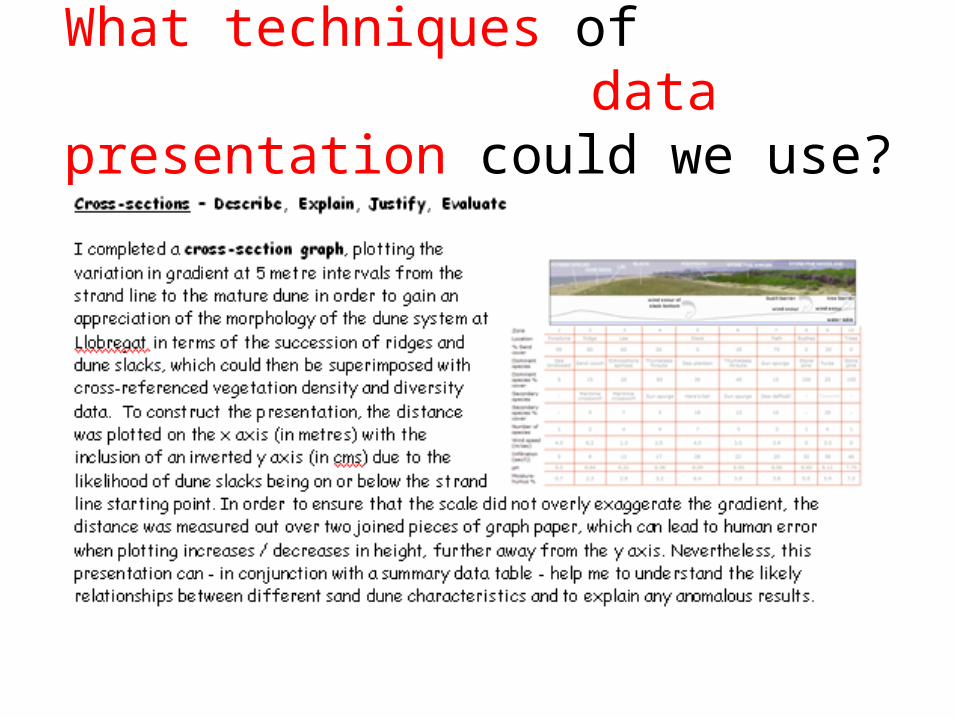
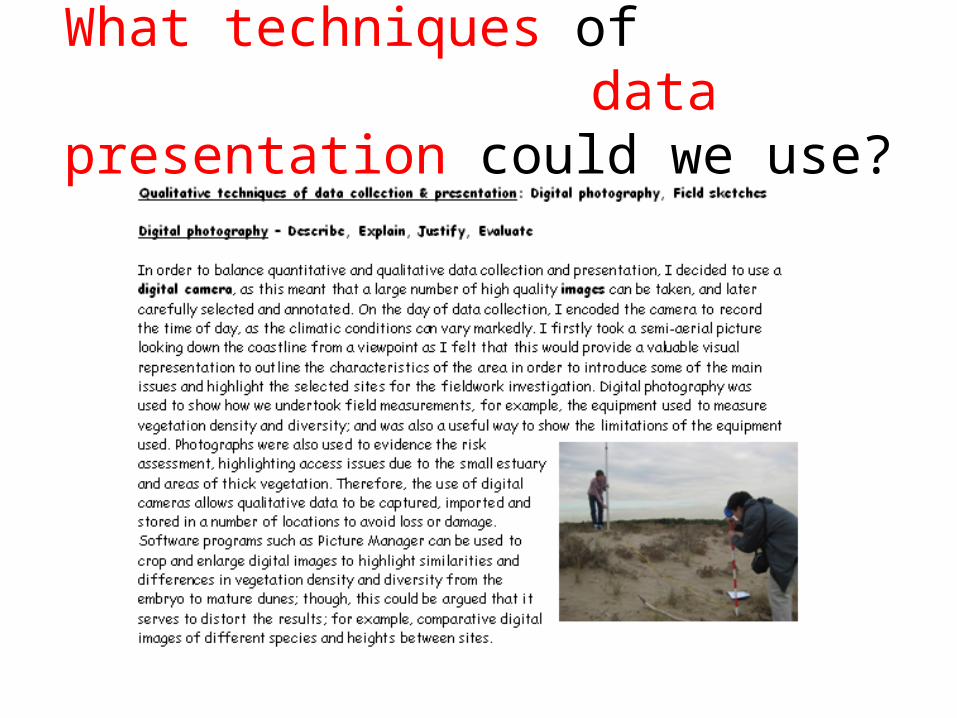
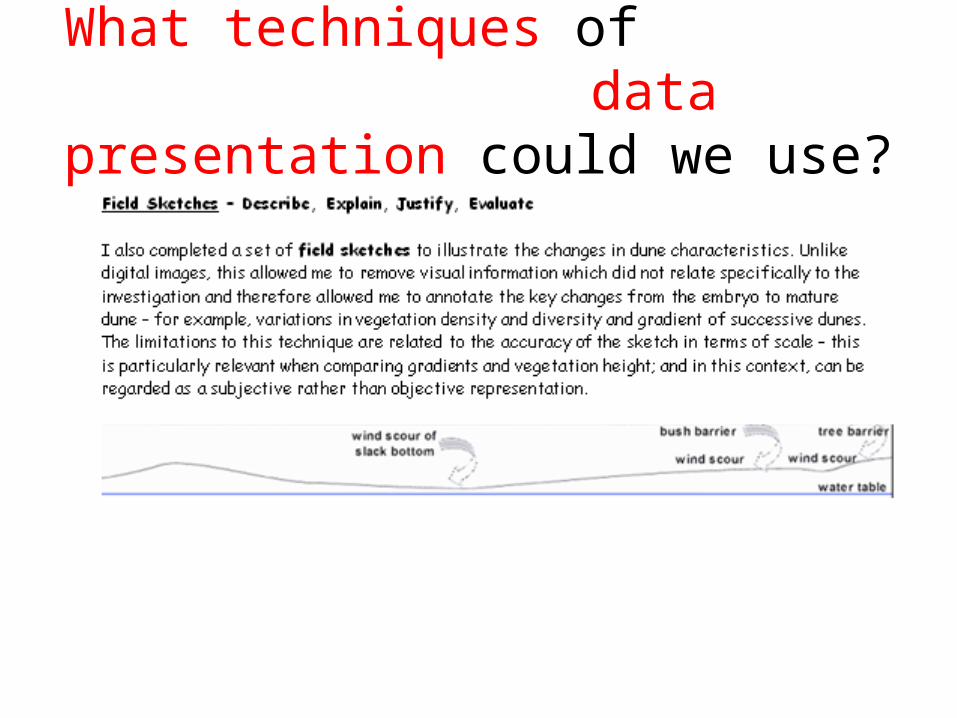
What techniques of data presentation could we use?
Discuss difference between quantitative & qualitative

What techniques of data presentation could we use?
Mention independent variable x axis/ dependent variable – y axis
What techniques of data presentation could we use?

What techniques of data presentation could we use?
What techniques of data presentation could we use?
What techniques of data presentation could we use?
Practising Data Presentations
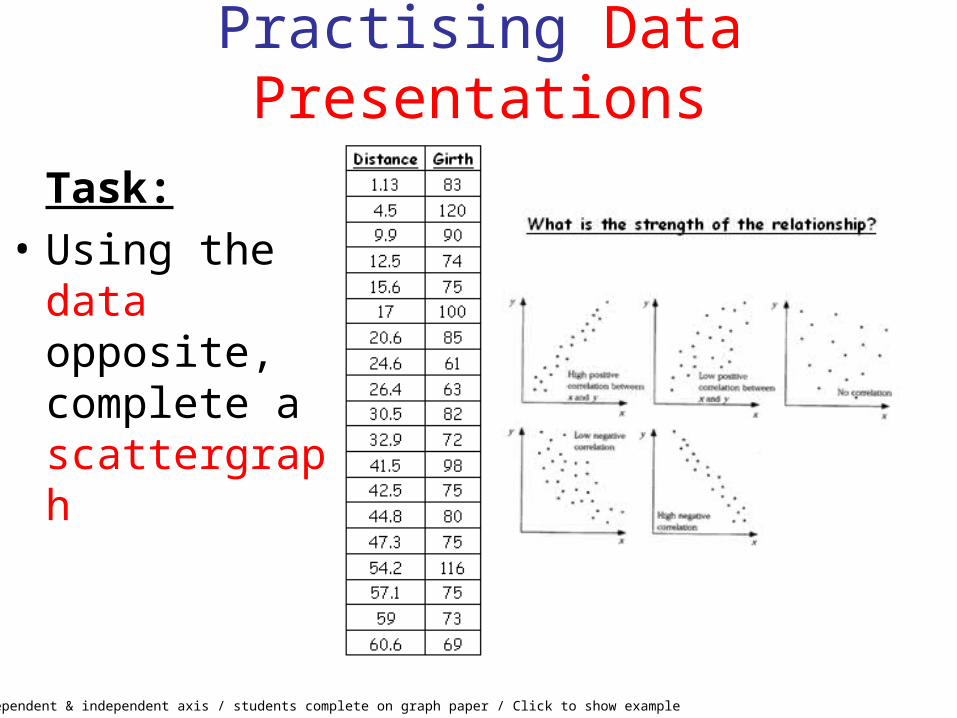
Task:
• Using the data opposite, complete a scattergraph
Discuss dependent & independent axis / students complete on graph paper / Click to show example
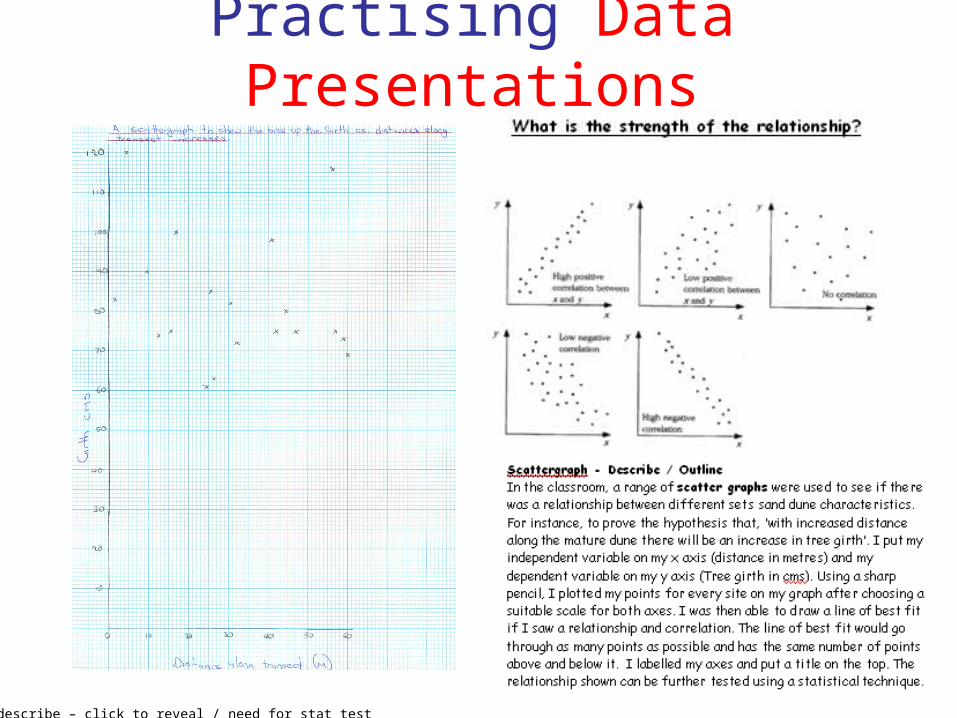
Practising Data Presentations
Discuss describe – click to reveal / need for stat test

Spearman’s Rank Correlation Co-efficient
Why (Justify)?:• A correlation can easily be drawn as a
scatter graph, but the most precise way to compare several pairs of data is to use a statistical test.
• SRCC establishes whether the correlation is really (scientifically) significant or if it could have been the result of chance alone.
• SRCC establishes whether the relationship is positive or negative and within at least 95% certainty that two variables are related.
Spearman’s Rank Correlation Co-efficient
Hypothesis:• We might expect to find that tree girth increases with distance along
a psammosere as the coniferous woodland establishes itself as the climax vegetation.
The hypothesis might be written like this: • Tree girths increase with distance inland along a mature dune.
• The more objective scientific research method is always to assume that no such girth-distance relationship exists and to express the null hypothesis as:‘There is no significant relationship between tree girths distance inland along a mature dune’.

Spearman’s Rank Correlation Co-efficient
What can go wrong?:Having decided upon the wording of the hypothesis, you should consider whether there are any other factors that may influence the study. Some factors that may influence tree girths and their measurement may include:
• Inconsistency in the collection of data. E.g. Failing to record the girths at a point which is 1.3 metres up the tree.
• Inaccuracy in measuring the distance between trees. E.g. Not always ensuring the measuring tape is taught before recording the data.
• Cumulative sampling may distort the expected girth-distance gradient if several trees cluster within a short area along the transect line followed by a considerable gap before the next group of trees.
• The influence of human intervention and management within the psammosere. Is the coniferous woodland a plagio-climax; planted in order to protect the psammosere?
You should mention such factors in your answer.
Students should note

Spearman’s Rank
Correlation
Click to reveal

Ans = -0.31

Discuss pairs & 95% & 99% sign
Spearman’s Rank Correlation Co-efficient
Other factors to consider:• The result will always be between 1 and -1.• Even if two variables correlate cannot prove
anything - only further research can actually prove that one thing affects the other.
• Data reliability is related to the size of the sample. The more data you collect, the more reliable your result.
Students should note
Starter lesson 4
Question 1 Question 3 Question 5
Question 2 Question 4 Question 6
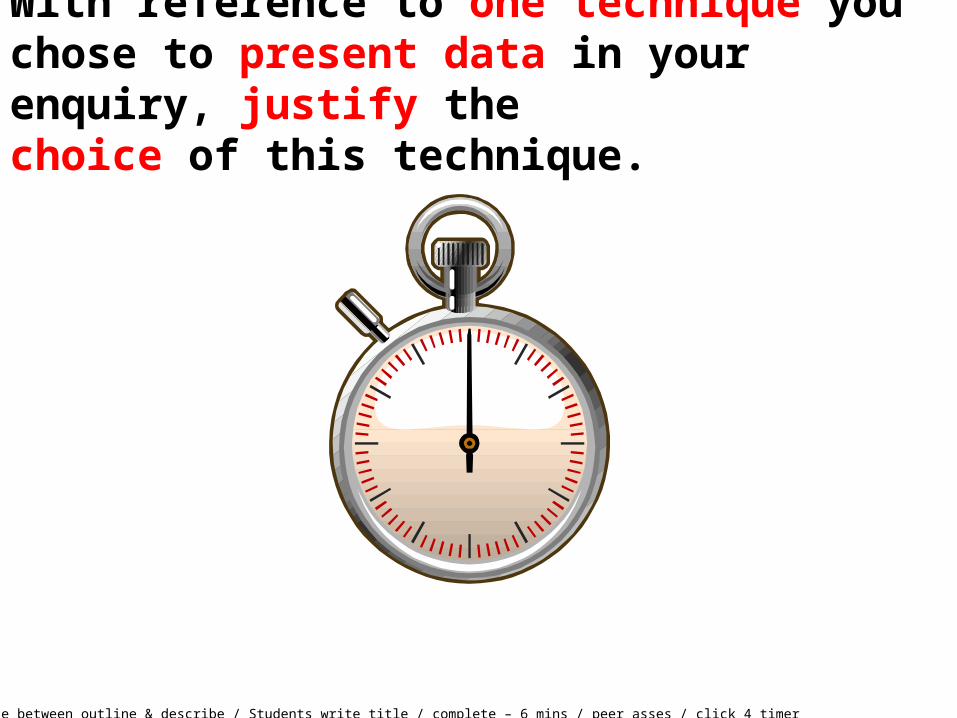
With reference to one technique you chose to present data in your enquiry, justify thechoice of this technique.
Discuss difference between outline & describe / Students write title / complete – 6 mins / peer asses / click 4 timer
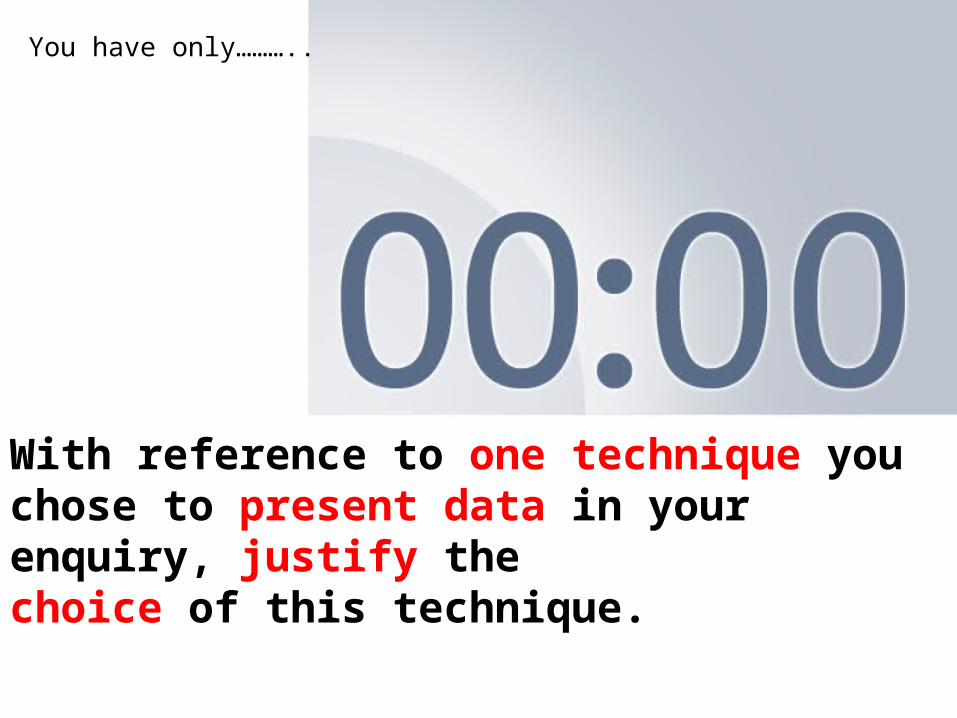
You have only………..
With reference to one technique you chose to present data in your enquiry, justify thechoice of this technique.
Peer assess mark to level – WWW & EBI
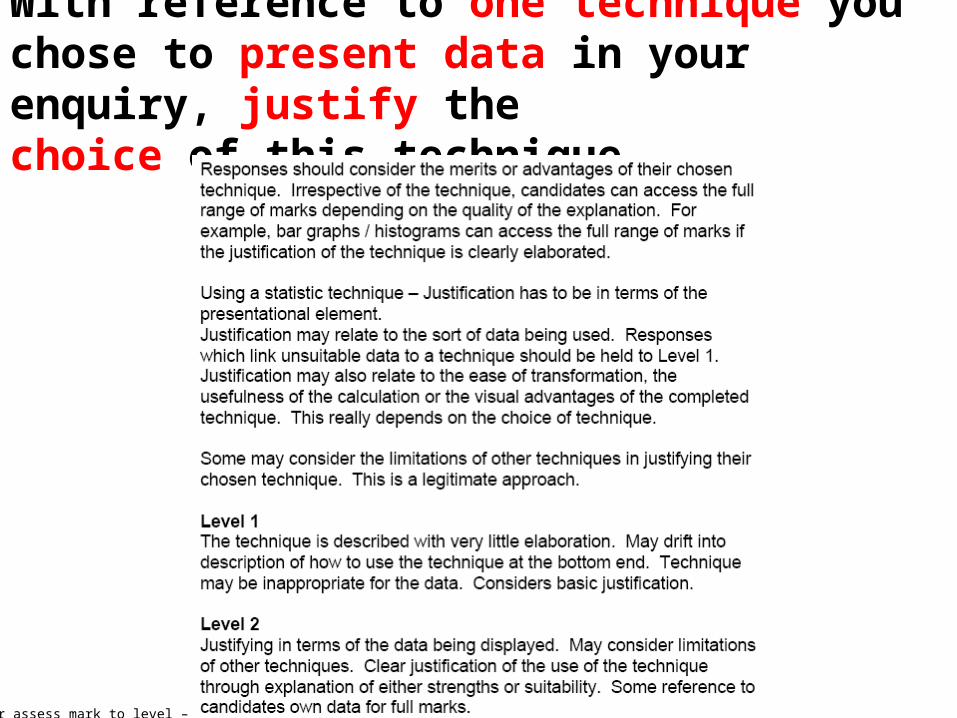
With reference to one technique you chose to present data in your enquiry, justify thechoice of this technique.
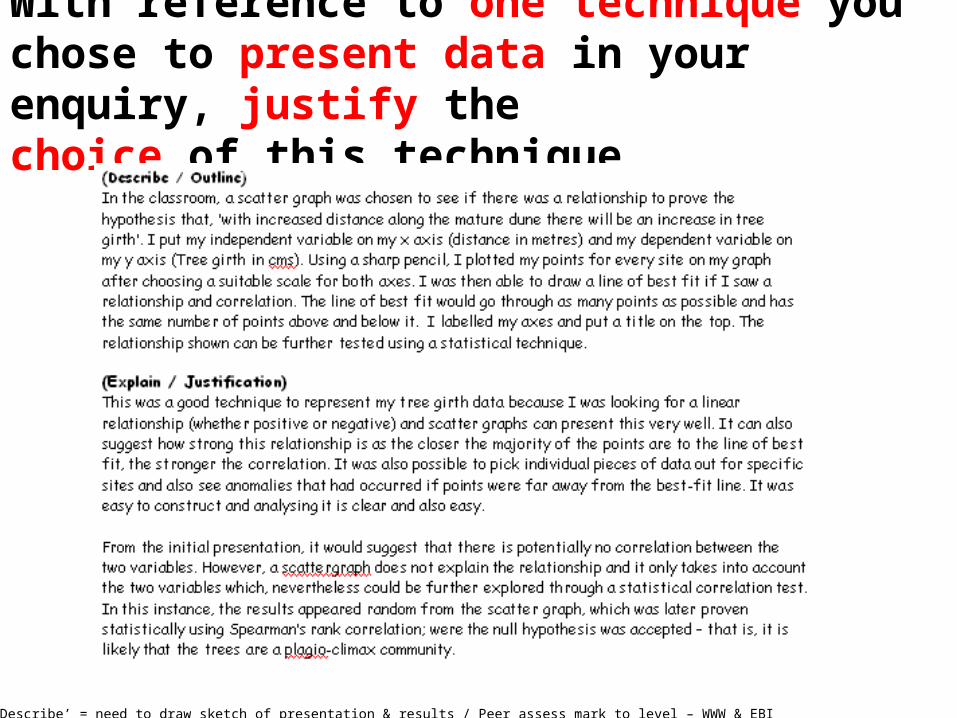
Discuss – if ‘Describe’ = need to draw sketch of presentation & results / Peer assess mark to level – WWW & EBI
With reference to one technique you chose to present data in your enquiry, justify thechoice of this technique.

What are other likely opening questions at AS Level?
Mention about ICT questions
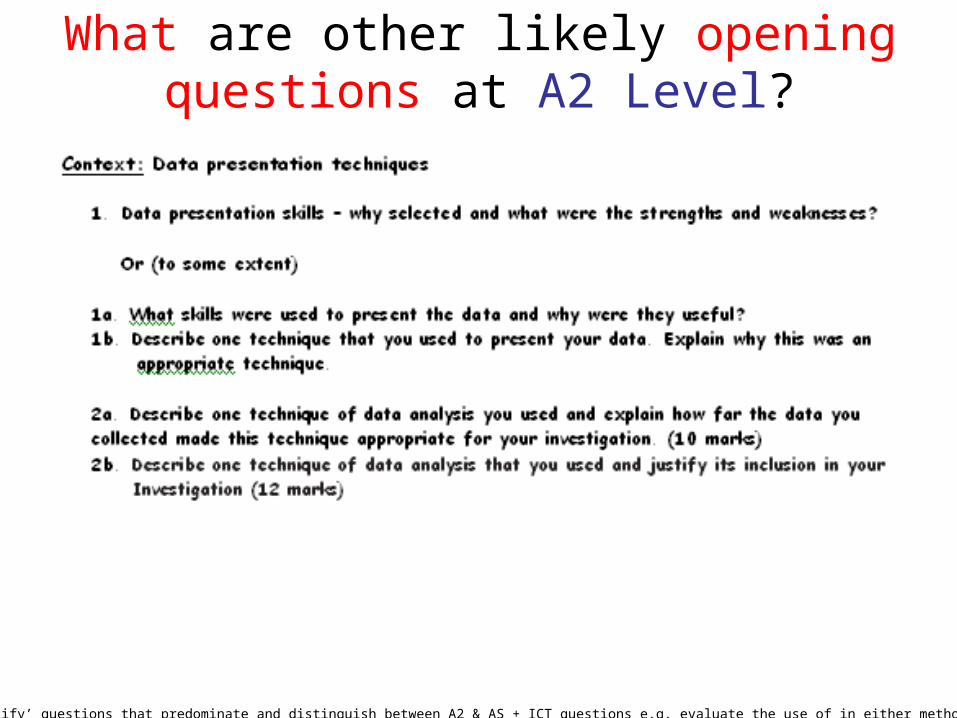
What are other likely opening questions at A2 Level?
Refer to explain / justify’ questions that predominate and distinguish between A2 & AS + ICT questions e.g. evaluate the use of in either methods / pres / aanlysis

Related Documents