MARINE MAMMAL SCIENCE, 24(3): 664–676 (July 2008) C 2008 by the Society for Marine Mammalogy DOI: 10.1111/j.1748-7692.2008.00199.x Age-specific birth rates of California sea lions (Zalophus californianus) in the Gulf of California, Mexico CLAUDIA J. HERN ´ ANDEZ-CAMACHO Laboratorio de Ecolog´ ıa de Pinn´ ıpedos “Burney J. Le Boeuf,” Centro Interdisciplinario de Ciencias Marinas, Instituto Polit´ ecnico Nacional, Ave. IPN s/n Colonia Playa Palo de Santa Rita, La Paz, Baja California Sur, Mexico 23096 and School of Life Sciences, Arizona State University, P. O. Box 874601, Tempe, Arizona 85287-4601, U.S.A. E-mail: [email protected] DAVID AURIOLES-GAMBOA Laboratorio de Ecolog´ ıa de Pinn´ ıpedos “Burney J. Le Boeuf,” Centro Interdisciplinario de Ciencias Marinas, Instituto Polit´ ecnico Nacional, Ave. IPN s/n Colonia Playa Palo de Santa Rita, La Paz, Baja California Sur, Mexico 23096 LEAH R. GERBER School of Life Sciences, Arizona State University, P. O. Box 874601, Tempe, Arizona 85287-4601, U.S.A. ABSTRACT Estimates of demographic parameters are essential for assessing the status of populations and assigning conservation priority. In light of the difficulties associated with obtaining such estimates, vital rates are rarely available even for well-studied species. We present the first estimates of age-specific birth rates for female California sea lions (Zalophus californianus) >10 yr of age. These rates were estimated from the reproductive histories of five cohorts of animals branded as pups between 1980 and 1984 at Los Islotes colony in the Gulf of California, Mexico. Age-specific birth rates varied among age classes and ranged between 0.06 and 0.80. The highest birth rates were observed for females between 10 and 15 yr of age, with decreased birth rates among older females. The effect of age, year, and resighting effort were explored using logistic regression analysis. Based on Akaike Information Criteria, birth rates were best explained by female age, while year and resighting effort did not have a significant effect. The odds ratio of producing a pup decreased with age but did not change significantly for middle-aged females. Our estimates of age-specific birth rates are consistent with general patterns observed for other large vertebrates. 664

Welcome message from author
This document is posted to help you gain knowledge. Please leave a comment to let me know what you think about it! Share it to your friends and learn new things together.
Transcript
MARINE MAMMAL SCIENCE, 24(3): 664–676 (July 2008)C© 2008 by the Society for Marine MammalogyDOI: 10.1111/j.1748-7692.2008.00199.x
Age-specific birth rates of California sea lions (Zalophuscalifornianus) in the Gulf of California, Mexico
CLAUDIA J. HERNANDEZ-CAMACHO
Laboratorio de Ecologıa de Pinnıpedos “Burney J. Le Boeuf,”Centro Interdisciplinario de Ciencias Marinas,
Instituto Politecnico Nacional,Ave. IPN s/n Colonia Playa Palo de Santa Rita,
La Paz, Baja California Sur, Mexico 23096and
School of Life Sciences,Arizona State University,
P. O. Box 874601, Tempe, Arizona 85287-4601, U.S.A.E-mail: [email protected]
DAVID AURIOLES-GAMBOA
Laboratorio de Ecologıa de Pinnıpedos “Burney J. Le Boeuf,”Centro Interdisciplinario de Ciencias Marinas,
Instituto Politecnico Nacional,Ave. IPN s/n Colonia Playa Palo de Santa Rita,
La Paz, Baja California Sur, Mexico 23096
LEAH R. GERBER
School of Life Sciences,Arizona State University,
P. O. Box 874601, Tempe, Arizona 85287-4601, U.S.A.
ABSTRACT
Estimates of demographic parameters are essential for assessing the status ofpopulations and assigning conservation priority. In light of the difficulties associatedwith obtaining such estimates, vital rates are rarely available even for well-studiedspecies. We present the first estimates of age-specific birth rates for female Californiasea lions (Zalophus californianus) >10 yr of age. These rates were estimated from thereproductive histories of five cohorts of animals branded as pups between 1980 and1984 at Los Islotes colony in the Gulf of California, Mexico. Age-specific birth ratesvaried among age classes and ranged between 0.06 and 0.80. The highest birth rateswere observed for females between 10 and 15 yr of age, with decreased birth ratesamong older females. The effect of age, year, and resighting effort were exploredusing logistic regression analysis. Based on Akaike Information Criteria, birth rateswere best explained by female age, while year and resighting effort did not have asignificant effect. The odds ratio of producing a pup decreased with age but did notchange significantly for middle-aged females. Our estimates of age-specific birthrates are consistent with general patterns observed for other large vertebrates.
664

HERNANDEZ-CAMACHO ET AL.: CALIFORNIA SEA LION FECUNDITY 665
Key words: fecundity, California sea lion, Zalophus californianus, logistic regressionanalysis.
Age-specific survival and fecundity estimates are essential for understanding theevolution of life history traits and the dynamics of animal populations (Fox 1993,Caswell 2001). Age-specific fecundity rates in long-lived species can be estimated intwo ways: by following naturally or artificially marked individuals through time, andby examining the reproductive organs of sacrificed animals (Bester 1995, Coulsonet al. 2000). The first approach requires years of data collection for multiple cohorts,which can be very labor intensive. The second approach may underestimate fecundityrates because an unknown proportion of pregnant females fail to give birth (McKenzieet al. 2005). As a result of these challenges, detailed fecundity estimates do not exist formany long-lived species such as California sea lions, limiting the predictive abilityof quantitative population models that rely on age-specific survival and fecundityestimates (Morris and Doak 2002).
The California sea lion (Zalophus californianus) is one of the most widely distributedpinnipeds in the North Pacific (King 1983, Le Boeuf et al. 1983). Breeding coloniesare distributed from the Channel Islands in California to the southern tip of the BajaCalifornia Peninsula in Mexico, including the Gulf of California (GoC; King 1983,Le Boeuf et al. 1983). Females reach sexual maturity at 4 or 5 yr of age (Lluch-Belda1969, Mate 1978, Melin 2002) and generally produce one pup per year, althoughbirths of twins have been reported infrequently (King 1983). Birthing is concentratedin a relatively short period of time, from the end of May to the middle of July, witha peak between 15 and 21 June (Odell 1975, Garcıa-Aguilar and Aurioles-Gamboa2003a). The lactation period generally lasts 1 yr although juveniles may suckle fortwo or more years (Peterson and Bartholomew 1967, Francis and Heath 1991, Bonner1984, Newsome et al. 2006). Despite the widespread distribution of California sealions, little is known about the basic population biology of the species. Detailedbirth rates are not available and survival rates have only recently been estimated(Hernandez-Camacho et al., in press).
California sea lions occupy 13 island breeding sites in the GoC (Fig. 1). Thesecolonies have been monitored regularly since the mid-1970s (Szteren et al. 2006).Previous studies suggest that colonies are fairly isolated units (Maldonado et al. 1995,Hernandez-Camacho 2001, Schramm-Urrutia 2002, Bowen et al. 2006), althoughsome limited movement of individuals occurs between them (Young et al. 2007). Thestudy site, Los Islotes, is the southernmost breeding colony in the entire range for thespecies. Its current population is estimated at 400 individuals (Szteren et al. 2006).Los Islotes is one of the few colonies in the GoC that has exhibited a consistent increasein abundance over the past two decades (Szteren et al. 2006). This site is also a populartourist destination due to its proximity to the city of La Paz (Labrada-Martagon et al.2005).
California sea lions were intensively harvested throughout their range in the 19thcentury, causing a dramatic reduction in their population number (Cass 1985, Zavalaand Mellink 2000). During the 20th century the population exhibited a remarkablerecovery as the species was protected by both Mexican (i.e., NOM-059-ECOL-1994)and United States laws (i.e., Marine Mammal Protection Act) (Cass 1985, Zavala andMellink 2000). However, despite this recovery, some populations in the GoC havedeclined in recent years (Szteren et al. 2006). A greater understanding of demographic

666 MARINE MAMMAL SCIENCE, VOL. 24, NO. 3, 2008
Figure 1. Map of the study area. Los Islotes rookery (13) is located in the southern partof the Gulf of California. Breeding colonies: 1. Rocas Consag, 2. San Jorge, 3. Isla Lobos, 4.Isla Granito, 5. Los Cantiles, 6. Los Machos, 7. El Partido, 8. Rasito, 9. San Esteban, 10. SanPedro Martir, 11. San Pedro Nolasco, 12. Farallon de San Ignacio, 13. Los Islotes.
parameters is critical to ensuring an accurate assessment of population status forCalifornia sea lions.
We estimated age-specific birth rates for females greater than 10 yr of age from thereproductive histories of five California sea lion cohorts (1980–1984) at Los Islotes,GoC, Mexico. We also evaluated the effect of age and other covariates on birth ratesusing logistic regression analysis.

HERNANDEZ-CAMACHO ET AL.: CALIFORNIA SEA LION FECUNDITY 667
METHODS
Field Methods
Branding—Ninety-four female pups born during the breeding season ( June–July)between 1980 and 1984 were captured and hot-branded on the dorsal surface usinga unique code of letters or numbers (Table 1). Individuals were branded during thesecond week of July of each year when they were approximately 1-mo old (Aurioles-Gamboa and Sinsel 1988). The mean birth date for this colony is 11–12 June (Garcıa-Aguilar and Aurioles-Gamboa 2003a). Pups were captured at random and held ina small stone corral in the shade. Individuals were measured and weighed beforebranding. The brands were legible throughout the study period (>25 yr). Brandingdid not compromise the survival of young sea lions. Early survival was >0.90 duringthe first 6 mo of age and was not different from that of unbranded pups (Aurioles-Gamboa and Sinsel 1988).
Resighting effort—Resighting trips were conducted during the years immediatelyfollowing branding as part of a separate study on survival (Hernandez-Camacho et al.,in press). However, we did not record whether branded females were with a pup until1994. We conducted three resighting trips ( June, July, and August) per year atLos Islotes between 1994 and 2006 (except 1995). Only two trips ( June and July)were made in 1997 and 1998. Sampling occurred during and/or after the peak ofbirthing (Garcıa-Aguilar and Aurioles-Gamboa 2003a). Visits to the study site lastedbetween 6 and 8 d and consisted of 6–8 continuous h of observation per day. Duringeach resighting trip, two or three observers searched for branded animals. This fieldstrategy was designed to provide adequate time to locate and identify marked females.At Los Islotes, females alternate 2.05 (SD 0.87) d of foraging with 1.22 (SD 1.33) dof nursing on land (Garcıa-Aguilar and Aurioles-Gamboa 2003b); thus females areexpected to visit land every two to four days. Surveys at the colony were conductedon land and from a small boat approximately 50 m from shore (three times per day)using 20 × 50 power binoculars. When we initiated our study in 1994, brandedfemales were between 10 and 14 yr of age. Birth rates for animals between 5 (the ageof sexual maturity, Melin 2002) and 9-yr old were therefore not estimated.
For each observation of marked individuals, we recorded the date, time, age, andreproductive status of females (with or without pup). A female was considered to bewith a pup when it was observed on at least one occasion giving birth, engaged inmother-response calls, or nursing, nuzzling, or sniffing the pup. Females that were not
Table 1. Number of females branded and alive at the beginning of this study (breedingseason 1994) at Los Islotes rookery, GoC (Modified from Hernandez-Camacho 2001). Thepercentage of branded female pups in a cohort is also given. Females alive in 1994 includethose seen that year or in any subsequent year.
Branded Females Branded (%) (relativeCohort females alive 1994 to total population)
1980 8 2 451981 17 3 761982 18 6 681983 26 11 1001984 25 18 88Total 94 40 80

668 MARINE MAMMAL SCIENCE, VOL. 24, NO. 3, 2008
observed nursing a pup or were absent during the breeding season, but known to bealive because they were seen in subsequent years, were considered to be without a pup.
Data Analysis
Our estimates represent apparent birth rates because an unknown number of fe-males may have been missed, died, or emigrated to other colonies during the studyperiod. Because our sample size was small, we pooled the number of branded femalesinto five age-classes to estimate apparent birth rates and examine the effect of ageand other covariates on birth rates: (1) 10–12-yr old, (2) 13–15- yr old, (3) 16–18-yrold, (4) 19–21-yr old, and (5) 22–25-yr old. Apparent birth rates were estimated asthe number of branded females in a given age-class that were lactating divided bythe number of branded females of that age-class known to be alive. The number offemales known to be alive (observed during the study period; Hernandez-Camacho2001) and the number of females estimated to be alive (capture-recapture analysis)(Hernandez-Camacho et al., in press) were very similar (0.95 and 0.91, respectively),thus it was not necessary to adjust our estimate of total females.
Reproductive status is a binary response variable (with pup = 1, without pup =0), so we used logistic regression analysis to determine the effect of age, resightingeffort (two or three resighting trips during the breeding season) and year on birthrates (Kutner et al. 2005). We grouped years into two classes: normal years (1996,1998–2001, 2003, 2005–2006) and El Nino years (1994, 1997, 2002, and 2004).Resighting effort was considered a covariate with reproductive status because of thepotential influence on the probability of detecting a female with a pup during a specificbreeding season. Similarly, year was considered as a covariate because variations inenvironmental conditions may influence the probability of giving birth (e.g., foodavailability during El Nino years).
We first constructed a global model (all variables included) and tested its goodness-of-fit using the Hosmer and Lemeshow test (Kutner et al. 2005). This test, appropriatefor data sets with few replicates, groups data into classes with similar fitted values tocompute a chi-square value (Kutner et al. 2005). We then explored a set of candidatemodels to determine how well each variable explained the probability of giving birth.
The most parsimonious model was selected using Akaike Information Criterion(AIC). Models with �AIC < 2 and highest AIC weights were considered to havesubstantial support (Burnham and Anderson 2002). The relative importance of eachpredictor variable was estimated by summing the Akaike weights across all the modelsin the set where each variable occurs. Variables with larger values are considered tobe more important relative to the other variables (Burnham and Anderson 2002).We tested the significance of the odds ratio for independent variables using the Waldstatistic (Kutner et al. 2005). The Wald statistic is the squared ratio of the logisticcoefficient to its standard error. If the test is significant, the variable is significantin the model. All estimates were computed using SAS System for Windows (release9.1.3 SAS Institute, Inc., Cary, NC).
RESULTS
Apparent Birth Rates
Birth rate varied by age class (Z = 33.10, df = 1, P < 0.0001) with the youngestand middle-age classes having a significantly higher birth rate than the older age

HERNANDEZ-CAMACHO ET AL.: CALIFORNIA SEA LION FECUNDITY 669
Table 2. Apparent birth rates for California sea lion females branded at Los Islotes rookery,Bahia de La Paz, Mexico. Birth rates were calculated as the number of branded females in agiven age-class that were lactating divided by the number of branded females of that age-classknown to be alive.
Age group Number of females Birth rate
10–12 50 0.8013–15 86 0.7316–18 70 0.6119–21 48 0.5222–25 16 0.06
classes (Table 2). Only 50% of the females between 19 and 21 yr of age had a pupduring the breeding season. Few females over 22 yr of age gave birth during thebreeding season.
Model Selection
The global model (all variables included) had a good fit to the data (� 2 = 6.22,df = 7, P = 0.51), thus we proceeded to explore our set of candidate models. The mostparsimonious model included female age as a single explanatory variable (Table 3).However, the second and third most parsimonious models (female age and effort,female age and year, respectively) represented a reasonable fit to apparent birth ratedata. These models were less than two AIC units (� ∼ 2) from the best model andseemed relatively plausible for these data (AIC weight ∼0.2). Although the AICweight for the best model was not very large relative to the weight for models twoand three, the relative importance of age was notably greater compared to the othervariables (year = 1, effort = 0.29, and year = 0.29).
According to the best model, the odds of producing a pup decreased with age(Table 4). There was a significant difference in the odds of producing a pup between
Table 3. Summary of the Akaike’s information criterion (AIC) and associated statistics forseven candidate models for the logistic regression analysis of birth rate data in California sealions.
Number ofID Model parameters AIC �i wi
1 Age 2 322.390 0 0.5082 Age + Effort 3 324.218 1.828 0.2043 Age + Year 3 324.234 1.844 0.2024 Age + Effort + Year 4 325.926 3.536 0.0875 Effort 2 360.411 38.021 06 Year + Effort 3 362.222 39.832 07 Year 2 364.961 42.571 0
Age = Age group: (1) 10–12-yr old, (2) 13–15-yr old, (3) 16–18-yr old, (4) 19–21-yr old,(5) 22–25-yr old.
Effort = Two or three visits per month.Year = Normal year or El Nino year.�I = AIC differences, wi = Akaike weights.

670 MARINE MAMMAL SCIENCE, VOL. 24, NO. 3, 2008
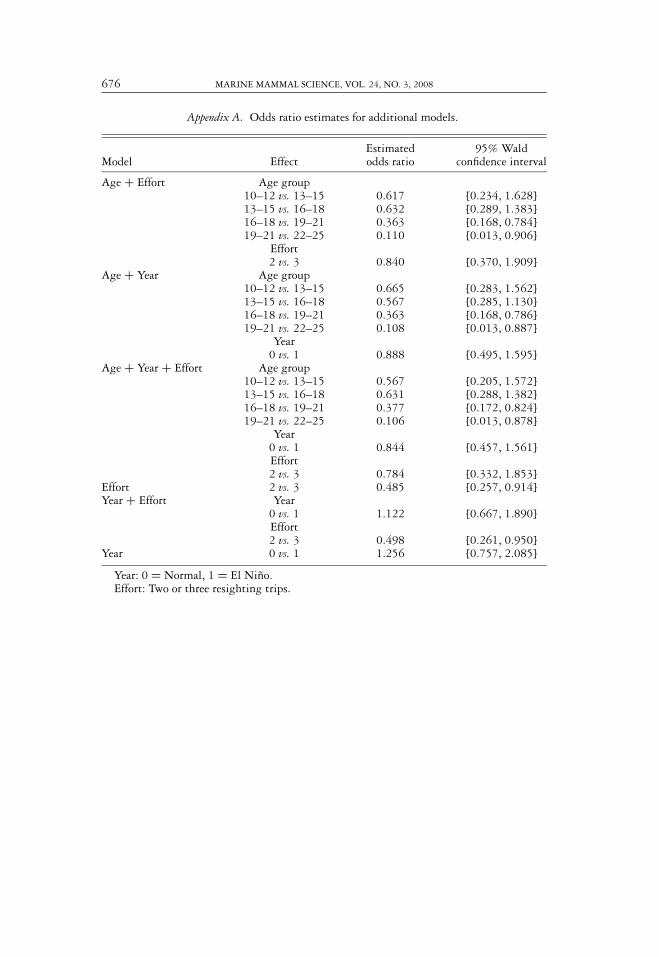
Table 4. Odds ratio estimates for the best model (Age). Odds ratio estimates for additionalmodels are shown in Appendix A.
Estimated 95% WaldModel Effect odds ratio confidence interval
Age Age group10–12 vs. 13–15 0.685 [0.295, 1.589]13–15 vs. 16–18 0.581 [0.295, 1.145]16–18 vs. 19–21 0.356 [0.165, 0.765]19–21 vs. 22–25 0.110 [0.013, 0.906]
the third (16–18-yr old) and fourth (19–21-yr old) age groups, and between the fourthand fifth (22–25-yr old) age groups. However, there was no significant difference inthe odds of producing a pup between the first (10–12-yr old) and second (13–15-yrold) age groups, or between the second and third age groups. As expected, the oddsof producing a pup were not significantly different when effort (two or three monthsof resighting) or year type (normal or El Nino conditions) varied when all othervariables remained constant (Appendix A).
DISCUSSION
This study provides a first estimate of fecundity for California sea lions and offersinsight into understanding the effect of age on reproductive rates. The small size of thecolony and the lack of emigration to other colonies allowed us to obtain relatively highresighting rates at Los Islotes. Only three branded sea lions (two 1-yr old juvenilesand one 5-yr old adult female) were resighted at other colonies in the GoC duringannual censuses conducted from 1980 to 2005. Both juveniles were resighted as adultanimals at Los Islotes in subsequent reproductive seasons. Thus, while our estimatesrepresent apparent birth rates, in light of our high resighting rates, we believe thatour results provide an accurate estimate of fecundity for California sea lions.
Birth Rates and Environmental Variability
Pinniped birth rates may vary with changes in environmental conditions (Trillmichand Ono 1991, Pistorius et al. 2001). In our model, the variable “year” was relativelyunimportant and the odds of producing a pup did not vary according to year type(normal or El Nino). This result suggests three possible scenarios: (1) prey abundancedid not vary enough to influence birth rates (vital rate plasticity), (2) the variable “yeartype” was not for detecting the effect of fluctuations in environmental conditions onbirth rates, or (3) variation in prey abundance affected another life history trait (e.g.,survival) rather than birth rates. We think the first two explanations are most plausiblefor California sea lions. Our study was conducted during a period of increasingabundance and pup births at Los Islotes colony (Szteren et al. 2006). This suggeststhat favorable environmental conditions prevailed in the area during the study period,even though one of the strongest El Nino events (1997–1998) occurred during thestudy period. Previous research suggests that the impact of El Nino events on primaryproducers and some higher trophic levels is negligible in the GoC (Alvarez-Borregoand Lara-Lara 1991, Aurioles-Gamboa and Le Boeuf 1991, Lluch-Cota et al. 2007).
HERNANDEZ-CAMACHO ET AL.: CALIFORNIA SEA LION FECUNDITY 671
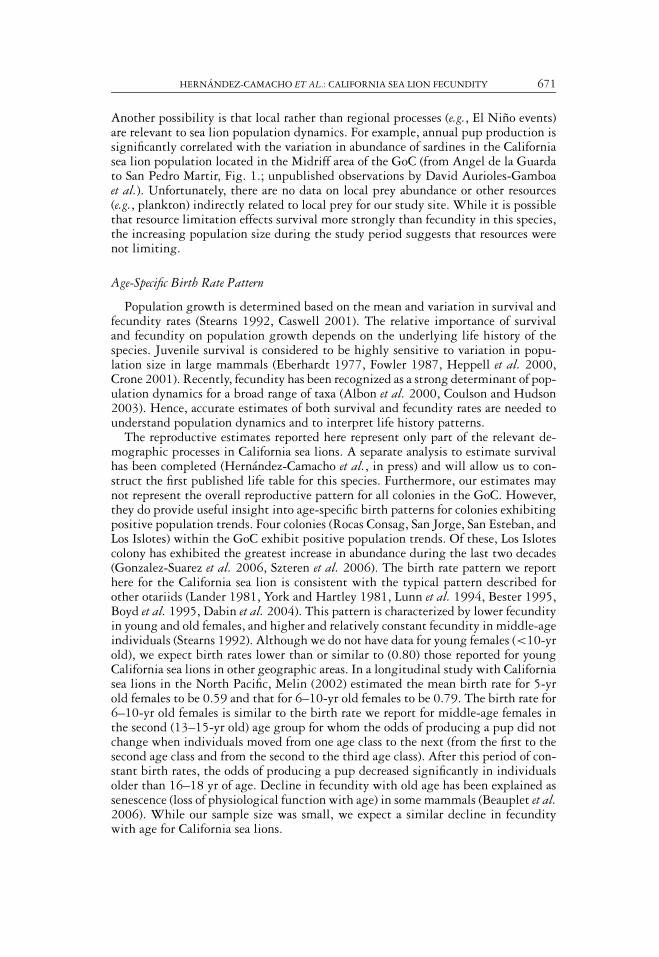
Another possibility is that local rather than regional processes (e.g., El Nino events)are relevant to sea lion population dynamics. For example, annual pup production issignificantly correlated with the variation in abundance of sardines in the Californiasea lion population located in the Midriff area of the GoC (from Angel de la Guardato San Pedro Martir, Fig. 1.; unpublished observations by David Aurioles-Gamboaet al.). Unfortunately, there are no data on local prey abundance or other resources(e.g., plankton) indirectly related to local prey for our study site. While it is possiblethat resource limitation effects survival more strongly than fecundity in this species,the increasing population size during the study period suggests that resources werenot limiting.
Age-Specific Birth Rate Pattern
Population growth is determined based on the mean and variation in survival andfecundity rates (Stearns 1992, Caswell 2001). The relative importance of survivaland fecundity on population growth depends on the underlying life history of thespecies. Juvenile survival is considered to be highly sensitive to variation in popu-lation size in large mammals (Eberhardt 1977, Fowler 1987, Heppell et al. 2000,Crone 2001). Recently, fecundity has been recognized as a strong determinant of pop-ulation dynamics for a broad range of taxa (Albon et al. 2000, Coulson and Hudson2003). Hence, accurate estimates of both survival and fecundity rates are needed tounderstand population dynamics and to interpret life history patterns.
The reproductive estimates reported here represent only part of the relevant de-mographic processes in California sea lions. A separate analysis to estimate survivalhas been completed (Hernandez-Camacho et al., in press) and will allow us to con-struct the first published life table for this species. Furthermore, our estimates maynot represent the overall reproductive pattern for all colonies in the GoC. However,they do provide useful insight into age-specific birth patterns for colonies exhibitingpositive population trends. Four colonies (Rocas Consag, San Jorge, San Esteban, andLos Islotes) within the GoC exhibit positive population trends. Of these, Los Islotescolony has exhibited the greatest increase in abundance during the last two decades(Gonzalez-Suarez et al. 2006, Szteren et al. 2006). The birth rate pattern we reporthere for the California sea lion is consistent with the typical pattern described forother otariids (Lander 1981, York and Hartley 1981, Lunn et al. 1994, Bester 1995,Boyd et al. 1995, Dabin et al. 2004). This pattern is characterized by lower fecundityin young and old females, and higher and relatively constant fecundity in middle-ageindividuals (Stearns 1992). Although we do not have data for young females (<10-yrold), we expect birth rates lower than or similar to (0.80) those reported for youngCalifornia sea lions in other geographic areas. In a longitudinal study with Californiasea lions in the North Pacific, Melin (2002) estimated the mean birth rate for 5-yrold females to be 0.59 and that for 6–10-yr old females to be 0.79. The birth rate for6–10-yr old females is similar to the birth rate we report for middle-age females inthe second (13–15-yr old) age group for whom the odds of producing a pup did notchange when individuals moved from one age class to the next (from the first to thesecond age class and from the second to the third age class). After this period of con-stant birth rates, the odds of producing a pup decreased significantly in individualsolder than 16–18 yr of age. Decline in fecundity with old age has been explained assenescence (loss of physiological function with age) in some mammals (Beauplet et al.2006). While our sample size was small, we expect a similar decline in fecunditywith age for California sea lions.

672 MARINE MAMMAL SCIENCE, VOL. 24, NO. 3, 2008
Although birth rate patterns in otariids are qualitatively similar, birth rates appearto range among species. For example, the average birth rate for individuals 10–12-yr old is 0.65 for the Subantarctic fur seal (Arctocephalus tropicalis, Dabin et al.2004), 0.77 for the Antarctic fur seal (Arctocephalus gazella, Lunn et al. 1994), 0.35for the Steller sea lion (Eumetopias jubatus, Holmes et al. 2007), and 0.80 for theCalifornia sea lion (this study). Similarly, the birth rate peak (and the age at it whichoccurs) varied among species: 0.63 (8–13-yr old) for the Subantartic fur seal, 0.80(7–9-yr old) for the Antarctic fur seal, 0.35 (10–15-yr old) for the Steller sea lion,and an estimated 0.80 (10–12-yr old) for the California sea lion. Although thesedata are limited to four species and methodologies may have differed among thesestudies, the wide range of values suggests there may be considerable plasticity inotariid birth rates. This possibility should be further explored by comparing birthrates from multiple populations within a species exposed to different constraints andpressures.
This work represents a first step in advancing our knowledge of the life historytraits of California sea lions. Additional estimates of age- and sex-specific vital ratesas well as information on population trends and environmental conditions for LosIslotes and other California sea lion colonies are needed to: (1) provide a foundationfor a more comprehensive analysis of the life history patterns of this species, (2)estimate the magnitude of variation in demographic traits (plasticity), (3) character-ize the mechanisms of population regulation in this species, and (4) understand theextent to which variation in extrinsic factors (e.g., food resources) shape life historypatterns (Monson et al. 2000). This information is critical for determining the ap-propriate scale for demographic parameter estimation in applications to conservationand management.
ACKNOWLEDGMENTS
We greatly appreciate the funding provided by CONABIO (H081), CONACyT (SEP-2004-C01-46806), and IPN DEPI (968013) during different stages of the study. This researchwas partially supported by a grant to Leah Gerber from the National Science Foundation (An-imal Behavior, Biological Oceanography, and International Programs; Award # 0347960).This study was done under the Research permits SEMARNAT: No. 240996-213-03, DOO750.-4172/97, DOO 750.-4443/98, NUM/SGPA/DGVS 04311, 04160, 05325, and 03269.The methods of handing and marking the animals in this study were those recommended bythe American Society of Mammalogist’s Animal Care and Use Guidelines (Guidelines for thecapture, handling, and care of mammals, www.mammalsociety.org/committees/index.asp).We would like to thank Carlos Vazquez for helping with data collection during the 2002breeding season. Manuela Gonzalez, Daniel Monson, James Estes, and two anonymous re-viewers offered comments and suggestions that improved this manuscript. We also thank Dr.Norman Silverberg for translating an earlier version of the article into English and for hishelpful suggestions on the document, Trent Lalonde for his invaluable statistical advice, andCaterina D’Agrosa for her assistance with Figure 1.
LITERATURE CITED
ALBON, S. D., T. N. COULSON, D. BROWN, F. E. GUINNESS, J. M. PEMBERTON AND T. H.CLUTTON-BROCK. 2000. Temporal changes in key factors and key age groups influencingthe population dynamics of female red deer. Journal of Animal Ecology 69:1099–1110.
ALVAREZ-BORREGO, S., AND J. R. LARA-LARA. 1991. The physical environment and primaryproductivity of the Gulf of California. Pages 555–567 in J. P. Dauphin AND B. R. T.

HERNANDEZ-CAMACHO ET AL.: CALIFORNIA SEA LION FECUNDITY 673
Simoneit, eds. The Gulf and Peninsula Province of the California’s. Volume 47. AmericanAssociation of Petroleum Geologist Memoir, Tulsa, OK.
AURIOLES-GAMBOA, D., AND B. J. LE BOEUF. 1991. Effects of the El Nino 1982-1983 onCalifornia sea lions in Mexico. Pages 112–118 in F. Trillmich AND K. A. Ono, eds.Pinnipeds and El Nino. Responses to environmental stress. Springer-Verlag, Berlin,Germany.
AURIOLES-GAMBOA, D., AND F. SINSEL. 1988. Mortality of California sea lion pups at LosIslotes Baja California Sur, Mexico. Journal of Mammalogy 69:180–183.
BEAUPLET, G., C. BARBRAUD, W. DABIN, C. KUSSENER AND C. GUINET. 2006. Age-specificsurvival and reproductive performances in fur seals: Evidence of senescence and individualquality. Oikos 112:430–441.
BESTER, M. N. 1995. Reproduction in the female Subantartic fur seal, Arctocephalus tropicalis.Marine Mammal Science 11:362–375.
BONNER, W. N. 1984. Lactation strategies in pinnipeds: Problems for a marine mammaliangroup. Symposium of the Zoological Society of London 51:253–272.
BOWEN, L., B. M. ALDRIDGE, R. DELONG, S. MELIN, C. GODıNEZ, A. ZAVALA, F. GULLAND, L.LOWENSTINE, J. L. SCOTT AND M. L. JOHNSON. 2006. MHC gene configuration variationin geographically disparate populations of California sea lions (Zalophus californianus).Molecular Ecology 15:529–533.
BOYD, I. L., J. P. CROXALL, N. J. LUNN AND K. REID. 1995. Population demography ofAntarctic fur seals: The cost of reproduction and implications for life-histories. Journalof Animal Ecology 64:505–518.
BURNHAM, K. P., AND D. R. ANDERSON. 2002. Model selection and multimodel inference.A practical information-theoretic approach. Springer, New York, NY.
CASS, V. L. 1985. Exploitation of California sea lions, Zalophus californianus, prior to 1972.Marine Fisheries Review 47:36–38.
CASWELL, H. 2001. Matrix population models. Sinauer Associates, Inc. Publishers, Sunder-land, MA.
COULSON, T., AND E. HUDSON. 2003. When is the birth rate the key factor associated withpopulation dynamics? Pages 555–567 in W. V. Holt, A. R. Pickard, J. C. Rodger and D.E. Wildt, eds. Reproductive science and integrated conservation. Cambridge UniversityPress, Cambridge, UK.
COULSON, T., E. J. MILNER-GULLAND AND T. CLUTTON-BROCK. 2000. The relative rolesof density and climatic variation on population dynamics and fecundity rates in threecontrasting ungulate species. Proceedings of the Royal Society Biological Sciences SeriesB 267:1771–1779.
CRONE, E. E. 2001. Is survivorship a better fitness surrogate than fecundity? Evolution55:2611–2614.
DABIN, W., G. BEAUPLET, E. A. CRESPO AND C. GUINET. 2004. Age structure, growth,and demographic parameters in breeding-age female subantartic fur seals, Arctocephalustropicalis. Canadian Journal of Zoology 82:1043–1050.
EBERHARDT, L. L. 1977. Optimal policy for conservation of large mammals, with specialreference to marine ecosystems. Environmental Conservation 4:205–212.
FOWLER, C. W. 1987. A review of density-dependence in populations of large mammals.Current Mammalogy 1:401–441.
FOX, G. A. 1993. Life history evolution and demographic stochasticity. Evolutionary Ecology7:1–14.
FRANCIS, J. M., AND C. B. HEATH. 1991. The effects of El Nino on the frequency and sex ratioof suckling yearlings in the California sea lion. Pages 193–201 in F. Trillmich and K. A.Ono, eds. Pinnipeds and El Nino. Responses to environmental stress. Springer-Verlag,Berlin, Germany.
GARCıA-AGUILAR, M. C., AND D. AURIOLES-GAMBOA. 2003a. Breeding season of the Califor-nia sea lion (Zalophus californianus) in the Gulf of California, Mexico. Aquatic Mammals29:67–76.

674 MARINE MAMMAL SCIENCE, VOL. 24, NO. 3, 2008
GARCıA-AGUILAR, M. C., AND D. AURIOLES-GAMBOA. 2003b. Cuidado materno en el lobomarino de California de Los Islotes, Golfo de California, Mexico. Ciencias Marinas29:573–583.
GONZALEZ-SUAREZ, M., K. E. MCCLUNEY, D. AURIOLES AND L. R. GERBER. 2006. Incorpo-rating uncertainty in spatial structure for viability predictions: A case study of Californiasea lions (Zalophus californianus). Animal Conservation 9:219–227.
HEPPELL, S. S., H. CASWELL AND L. B. CROWDER. 2000. Life histories and elasticity pat-terns: Perturbation analysis for species with minimal demography data. Ecology 81:654–665.
HERNANDEZ-CAMACHO, C. J. 2001. Tabla de vida del lobo marino de California Zalophuscalifornianus en la lobera Los Islotes, B.C.S., Mexico. M.S. thesis, Centro Interdisciplinariode Ciencias Marinas IPN, La Paz, B.C.S., Mexico.
HERNANDEZ-CAMACHO, C. J., D. AURIOLES-GAMBOA, J. LAAKE AND L. R. GERBER. Inpress. Survival rates of the California sea lion, Zalophus californianus, in Mexico. Journalof Mammalogy.
HOLMES, E. E., L. W. FRITZ, A. E. YORK AND K. SWEENEY. 2007. Age-structured mod-eling reveals long-term declines in the natality of western Steller sea lions. EcologicalApplications 17:2214–2232.
KING, J. E. 1983. Seals of the world. British Museum (Natural History). Cornell UniversityPress, Ithaca, NY.
KUTNER, H. M., C. J. NACHTSHEIM, J. NETER AND W. LI. 2005. Applied linear statisticalmodels. McGraw-Hill, New York, NY.
LABRADA-MARTAGON, V., D. AURIOLES-GAMBOA AND S. F. MARTıNEZ-DıAZ. 2005. Naturaland human disturbance in a rookery of the California sea lion (Zalophus californianus) inthe Gulf of California, Mexico. Latin American Journal of Aquatic Mammals 4:175–185.
LANDER, R. H. 1981. A life table and biomass estimate for Alaska fur seals. Fisheries Research1:55–70.
LE BOEUF, B. J., D. AURIOLES-GAMBOA, R. CONDIT, C. FOX, R. GISINER, R. ROMERO ANDF. SINSEL. 1983. Size and distribution of the California sea lion population in Mexico.Proceedings of the California Academy of Sciences 43:77–85.
LLUCH-BELDA, D. 1969. Crecimiento y mortalidad del lobo marino de California. Anales delInstituto Nacional de Ciencias Biologicas 18:167–189.
LLUCH-COTA, S. E., A. E. ARAGON-NORIEGA, F. ARREGUıN-SANCHEZ, D. AURIOLES-GAMBOA, J. J. BAUTISTA-ROMERO, R. C. BRUSCA, R. CERVANTES-DUARTE, R. CORTES-ALTAMIRANO, P. DEL-MONTE-LUNA, A. ESQUIVEL-HERRERA, G. FERNANDEZ, M. E.HENDRICKX, S. HERNANDEZ-VAZQUEZ, H. HERRERA-CERVANTES, M. KAHRU, M.LAVIN, D. LLUCH-BELDA, D. B. LLUCH-COTA, J. LOPEZ-MARTıNEZ, S. G. MARI-NONE, M. O. NEVAREZ-MARTıNEZ, S. ORTEGA-GARCıA, E. PALACIOS-CASTRO, A.PARES-SIERRA, G. PONCE-DıAZ, M. RAMıREZ-RODRIGUEZ, C. A. SALINAS-ZAVALA,R. A. SCHWARTZLOSE AND A. P. SIERRA-BELTRAN. 2007. The Gulf of California: Re-view of ecosystem status and sustainability challenges. Progress in Oceanography 73:1–26.
LUNN, N. J., I. L. BOYD AND J. P. CROXALL. 1994. Reproductive performance of femaleAntarctic fur seals: The influence of age, breeding experience, environmental variationand individual quality. Journal of Animal Ecology 63:827–840.
MALDONADO, J. E., F. D. ORTA, B. S. STEWART, E. GEFFEN AND K. R. WAYNE. 1995.Intraspecific genetic differentiation in California sea lions (Zalophus californianus) fromsouthern California and the Gulf of California. Marine Mammal Science 11:46–58.
MATE, B. R. 1978. California sea lion. Pages 172–177 in D. Haley, ed. Marine mammals ofeastern North Pacific and arctic waters. Pacific Search Press, Seattle, WA.
MCKENZIE, J., L. J. PARRY, B. PAGE AND S. D. GOLDSWORTHY. 2005. Estimation of preg-nancy rates and reproductive failure in New Zealand fur seals (Arctocephalus forsteri).Journal of Mammalogy 86:1237–1246.

HERNANDEZ-CAMACHO ET AL.: CALIFORNIA SEA LION FECUNDITY 675
MELIN, S. R. 2002. The foraging ecology and reproduction of the California sea lion (Zalophuscalifornianus). Ph.D. thesis, University of Minnesota, Minneapolis, MN. 150 pp.
MONSON, D. H., J. A. ESTES, J. L. BODKIN AND D. B. SINIFF. 2000. Life history plasticityand population regulation in sea otters. Oikos 90:457–468.
MORRIS, W. F., AND D. F. DOAK. 2002. Quantitative conservation biology. Theory andpractice of population viability analysis. Sinauer Associates, Sunderland, MA.
NEWSOME, S. D., A. M. ETNIER, D. AURIOLES-GAMBOA AND P. L. KOCH. 2006. Using carbonand nitrogen isotopes to investigate reproductive strategies in Northeast Pacific otariids.Marine Mammal Science 22:556–572.
ODELL, D. K. 1975. Breeding biology of the California sea lion, Zalophus californianus. Rapportset Proces-verbeaux des Reunions. Conseil international pour l’Exploration de la Mer169:374–378.
PETERSON, R. S., AND G. A. BARTHOLOMEW. 1967. The natural history and behavior of theCalifornia sea lion. Special Publication No. 1, The American Society of Mammalogists,Lawrence, KS.
PISTORIUS, P. A., M. N. BESTER, S. P. KIRKMAN AND F. E. TAYLOR. 2001. Temporal changesin fecundity and age at sexual maturity of southern elephant seals at Marion Island. PolarBiology 24:343–348.
SCHRAMM-URRUTIA, Y. 2002. Estructura genetica y filografica del lobo marino de California(Zalophus californianus) en aguas adyacentes a la penınsula de Baja California, Mexico.Ph.D. thesis, Universidad Autonoma de Baja California, Mexico. 146 pp.
STEARNS, S. C. 1992. The evolution of life histories. Oxford University Press, Oxford, UK.SZTEREN, D., D. AURIOLES AND L. GERBER. 2006. Population status and trends of the
California sea lion (Zalophus californianus) in the Gulf of California, Mexico. Pages 369–384 in A. W. Trites, S. K. Atkinson, D. P. DeMaster, L. W. Fritz, S. T. Gelatt, L. D.Rea and K. M. Wynne, eds. Sea lions of the world. Alaska Sea Grant College Program,University of Alaska, Fairbanks, AK.
TRILLMICH, F., AND K. A. ONO. 1991. Pinnipeds and El Nino. Responses to environmentalstress. Springer-Verlag, Berlin, Germany.
YORK, A. E., AND J. R. HARTLEY. 1981. Pup production following harvest of female northernfur seals. Canadian Journal of Fisheries and Aquatic Sciences 38:84–90.
YOUNG, J. K., C. J. HERNANDEZ-CAMACHO AND L. GERBER. 2007. Long-distance movementof a pinniped neonate. Marine Mammal Science 23:926–930.
ZAVALA, G. A., AND E. MELLINK. 2000. Historical exploitation of the California sea lion,Zalophus californianus, in Mexico. Marine Fisheries Review 62:35–40.
Received: 15 May 2007Accepted: 26 February 2008
676 MARINE MAMMAL SCIENCE, VOL. 24, NO. 3, 2008
Appendix A. Odds ratio estimates for additional models.
Estimated 95% WaldModel Effect odds ratio confidence interval
Age + Effort Age group10–12 vs. 13–15 0.617 [0.234, 1.628]13–15 vs. 16–18 0.632 [0.289, 1.383]16–18 vs. 19–21 0.363 [0.168, 0.784]19–21 vs. 22–25 0.110 [0.013, 0.906]
Effort2 vs. 3 0.840 [0.370, 1.909]
Age + Year Age group10–12 vs. 13–15 0.665 [0.283, 1.562]13–15 vs. 16–18 0.567 [0.285, 1.130]16–18 vs. 19–21 0.363 [0.168, 0.786]19–21 vs. 22–25 0.108 [0.013, 0.887]
Year0 vs. 1 0.888 [0.495, 1.595]
Age + Year + Effort Age group10–12 vs. 13–15 0.567 [0.205, 1.572]13–15 vs. 16–18 0.631 [0.288, 1.382]16–18 vs. 19–21 0.377 [0.172, 0.824]19–21 vs. 22–25 0.106 [0.013, 0.878]
Year0 vs. 1 0.844 [0.457, 1.561]Effort2 vs. 3 0.784 [0.332, 1.853]
Effort 2 vs. 3 0.485 [0.257, 0.914]Year + Effort Year
0 vs. 1 1.122 [0.667, 1.890]Effort2 vs. 3 0.498 [0.261, 0.950]
Year 0 vs. 1 1.256 [0.757, 2.085]
Year: 0 = Normal, 1 = El Nino.Effort: Two or three resighting trips.
Related Documents