ADA Notice For individuals with sensory disabilities, this document is available in alternate formats. For alternate format information, contact the Forms Management Unit at (916) 445-1233, TTY 711, or write to Records and Forms Management, 1120 N Street, MS-89, Sacramento, CA 95814. STATE OF CALIFORNIA • DEPARTMENT OF TRANSPORTATION TECHNICAL REPORT DOCUMENTATION PAGE TR0003 (REV 10/98) 1. REPORT NUMBER CA17-2693A 2. GOVERNMENT ASSOCIATION NUMBER 3. RECIPIENT'S CATALOG NUMBER 4. TITLE AND SUBTITLE Development of Recommended Guidelines for Preservation Treatments for Bicycle Routes 5. REPORT DATE January 2017 6. PERFORMING ORGANIZATION CODE 7. AUTHOR H. Li, J. Buscheck, J. Harvey, D. Fitch, D. Reger, R. Wu, R. Ketchell, J. Hernandez, B. Hayne 8. PERFORMING ORGANIZATION REPORT NO. UCPRC-RR-2016-02 9. PERFORMING ORGANIZATION NAME AND ADDRESS University of California Pavement Research Center Department of Civil and Environmental Engineering, UC Davis One Shields Avenue Davis, CA 95616 10. WORK UNIT NUMBER 11. CONTRACT OR GRANT NUMBER 65A0542 13. TYPE OF REPORT AND PERIOD COVERED Research Report, May 2015 - January 2016 12. SPONSORING AGENCY AND ADDRESS California Department of Transportation Division of Research, Innovation and System Information P.O. Box 942873 Sacramento, CA 94273-0001 14. SPONSORING AGENCY CODE 15. SUPPLEMENTARY NOTES Additional author C. Thigpen 16. ABSTRACT This project was a continuation of a previous study that focused on the effects of pavement macrotexture on bicycle ride quality using input from bicycle club members and their bicycles on state highways, and considered changes to Caltrans chip seal specifications that resulted in seals with larger maximum size stones being typically used. This second project included a wider range of bicycle riders and bicycle types, considered pavement roughness and distresses in addition to macrotexture, and included measurements on urban preservation treatments and city streets as well as on treatments on state highways and county roads. This study also examined preservation treatment aggregate gradations and the mechanistic responses of bicycles to pavement macrotexture and roughness. The results of both projects were used to prepare recommended guidelines for the selection of preservation treatments that are best suited to bicycle routes on California’s state highways and local streets. Macrotexture, roughness, and pavement distresses were measured for different preservation treatments on 67 road sections distributed in five northern California and Nevada cities (Davis, Richmond, Sacramento, Reno, and Chico) and on a number of Caltrans highway sections and county roads. Bicycle ride quality surveys were conducted with a total of 155 participants. Correlations of the measurements and ride surveys were preliminarily explored. Models for bicycle ride quality and physical rolling resistance were also developed. Long-term monitoring of pavement macrotexture for larger stone seals on highway LA-2, SLO-1, and Mon-198. 17. KEY WORDS chip seal, macrotexture, bicycle vibration, bicycle ride quality, MPD, IRI 18. DISTRIBUTION STATEMENT No restrictions. This document is available to the public through the National Technical Information Service, Springfield, VA 22161 19. SECURITY CLASSIFICATION (of this report) Unclassified 20. NUMBER OF PAGES 19 21. COST OF REPORT CHARGED None Reproduction of completed page authorized.

Welcome message from author
This document is posted to help you gain knowledge. Please leave a comment to let me know what you think about it! Share it to your friends and learn new things together.
Transcript
ADA Notice For individuals with sensory disabilities, this document is available in alternate formats. For alternate format information, contact the Forms Management Unit at (916) 445-1233, TTY 711, or write to Records and Forms Management, 1120 N Street, MS-89, Sacramento, CA 95814.
STATE OF CALIFORNIA • DEPARTMENT OF TRANSPORTATION TECHNICAL REPORT DOCUMENTATION PAGE TR0003 (REV 10/98)
1. REPORT NUMBER
CA17-2693A
2. GOVERNMENT ASSOCIATION NUMBER 3. RECIPIENT'S CATALOG NUMBER
4. TITLE AND SUBTITLE
Development of Recommended Gu idelines for Preservation Treatments for Bicycle Routes 5. REPORT DATE
January 2017 6. PERFORMING ORGANIZATION CODE
7. AUTHOR
H. Li, J. Buscheck, J. Harvey, D. Fitch, D. Reger, R. Wu, R. Ketchell, J. Hernandez, B. Hayne
8. PERFORMING ORGANIZATION REPORT NO.
UCPRC-RR-2016-02 9. PERFORMING ORGANIZATION NAME AND ADDRESS
University of California Pavement Research Center Department of Civil and Environmental Engineering, UC Davis One Shields Avenue Davis, CA 95616
10. WORK UNIT NUMBER
11. CONTRACT OR GRANT NUMBER
65A0542 13. TYPE OF REPORT AND PERIOD COVERED
Research Report, May 2015 - January 2016 12. SPONSORING AGENCY AND ADDRESS
California Department of Transportation Division of Research, Innovation and System Information P.O. Box 942873 Sacramento, CA 94273-0001
14. SPONSORING AGENCY CODE
15. SUPPLEMENTARY NOTES
Additional author C. Thigpen
16. ABSTRACT
This project was a continuation of a previous study that focused on the effects of pavement macrotexture on bicycle ride quality using input from bicycle club members and their bicycles on state highways, and considered changes to Caltrans chip seal specifications that resulted in seals with larger maximum size stones being typically used. This second project included a wider range of bicycle riders and bicycle types, considered pavement roughness and distresses in addition to macrotexture, and included measurements on urban preservation treatments and city streets as well as on treatments on state highways and county roads. This study also examined preservation treatment aggregate gradations and the mechanistic responses of bicycles to pavement macrotexture and roughness. The results of both projects were used to prepare recommended guidelines for the selection of preservation treatments that are best suited to bicycle routes on California’s state highways and local streets. Macrotexture, roughness, and pavement distresses were measured for different preservation treatments on 67 road sections distributed in five northern California and Nevada cities (Davis, Richmond, Sacramento, Reno, and Chico) and on a number of Caltrans highway sections and county roads. Bicycle ride quality surveys were conducted with a total of 155 participants. Correlations of the measurements and ride surveys were preliminarily explored. Models for bicycle ride quality and physical rolling resistance were also developed. Long-term monitoring of pavement macrotexture for larger stone seals on highway LA-2, SLO-1, and Mon-198.
17. KEY WORDS
chip seal, macrotexture, bicycle vibration, bicycle ride quality, MPD, IRI
18. DISTRIBUTION STATEMENT
No restrictions. This document is available to the public through the National Technical Information Service, Springfield, VA 22161
19. SECURITY CLASSIFICATION (of this report)
Unclassified
20. NUMBER OF PAGES
19
21. COST OF REPORT CHARGED
None Reproduction of completed page authorized.
DISCLAIMER STATEMENT
This document is disseminated in the interest of information exchange. The contents of this report reflect the
views of the authors who are responsible for the facts and accuracy of the data presented herein. The contents do
not necessarily reflect the official views or policies of the State of California or the Federal Highway
Administration. This publication does not constitute a standard, specification or regulation. This report does not
constitute an endorsement by the Department of any product described herein.
For individuals with sensory disabilities, this document is available in alternate formats. For information, call
(916) 654-8899, TTY 711, or write to California Department of Transportation, Division of Research,
Innovation and System Information, MS-83, P.O. Box 942873, Sacramento, CA 94273-0001.
UCPRC-RR-2016-02 x
January 2017 Research Report: UCPRC-RR-2016-02
Development of Recommended Guidelines for Preservation Treatments
for Bicycle Routes
Version 2 Authors:
H. Li, J. Buscheck, J. Harvey, D. Fitch, D. Reger, R. Wu, R. Ketchell, J. Hernandez, B. Haynes, and C. Thigpen
Part of Partnered Pavement Research Program (PPRC) Strategic Plan Element 4.57: Development of Guidelines for Preservation Treatments for Bicycle Routes
PREPARED FOR: PREPARED BY:
California Department of Transportation University of California Division of Research, Innovation, and System Information Pavement Research Center Office of Materials and Infrastructure UC Davis, UC Berkeley
TABLE OF CONTENTS
LIST OF TABLES ............................................................................................................................................... vi
LIST OF ABBREVIATIONS .......................................................................................................................... xxiii LIST OF TEST METHODS AND SPECIFICATIONS............................................................................... xxiii
LIST OF FIGURES ............................................................................................................................................ vii DISCLAIMER STATEMENT ............................................................................................................................. x ACKNOWLEDGMENTS ................................................................................................................................... xi PROJECT OBJECTIVES ................................................................................................................................. xiii EXECUTIVE SUMMARY ................................................................................................................................. xv
1 INTRODUCTION .......................................................................................................................................... 1 1.1 Background ................................................................................................................................................. 1 1.2 Goal and Scope of the Study ....................................................................................................................... 2 1.3 Scope and Organization of This Report ...................................................................................................... 3
2 LITERATURE REVIEW .............................................................................................................................. 5 2.1 Pavement Texture Measurement and Ride Quality ..................................................................................... 5 2.2 Bicycle Vibration and Bicycle Ride Quality ............................................................................................... 6 2.3 Pavement Macrotexture and Bicycle Ride Quality ..................................................................................... 7 2.4 Correlations between Macrotexture and Treatment Specifications............................................................. 8 2.5 Modeling for Bicycle Ride Quality ............................................................................................................. 9 2.6 Modeling for Physical Rolling Resistance ................................................................................................ 10
2.6.1 A Model and Test Considerations for Physical Resistance........................................................... 10 2.6.2 Test Considerations ....................................................................................................................... 12
3 METHODOLOGY FOR URBAN FIELD MEASUREMENTS AND SURVEYS ................................. 15 3.1 Road Sections Used for Urban Texture Measurements and Bicyclist Surveys ......................................... 15 3.2 Summary of Urban Pavement Sections for Bicyclist Surveys .................................................................. 16 3.3 Summary of Macrotexture Specification Comparison Sections and Rolling Resistance Measurement
Sections ..................................................................................................................................................... 22 3.4 Macrotexture Measurement Methods........................................................................................................ 24 3.5 Bicycle Vibration Measurement Method .................................................................................................. 25
3.5.1 Instrumentation ............................................................................................................................. 25 3.5.2 Data Processing Procedure............................................................................................................ 31 3.5.3 Development of Data Collection................................................................................................... 32
3.6 Bicycle Ride Quality Survey Method ........................................................................................................ 32 3.6.1 Survey Sample of Surface Treatments and Participants................................................................ 32 3.6.2 Survey Method for City Surveys................................................................................................... 33 3.6.3 Participating Cycling Groups and Road Sections Used in the Survey .......................................... 33
3.7 Macrotexture and Roughness Measurement Methods............................................................................... 34 3.8 Distress Survey Method ............................................................................................................................ 36 3.9 Methodology for Modeling Bicycle Ride Quality ..................................................................................... 36 3.10 Methodology for Measuring and Modeling Physical Rolling Resistance ................................................. 36
3.10.1 Test Equipment ............................................................................................................................. 37 3.10.2 Test Procedure............................................................................................................................... 37 3.10.3 Selection Criteria for Test Sections ............................................................................................... 40 3.10.4 Expansion of Power Meter Measurement Systems ....................................................................... 40
4 MEASUREMENT AND SURVEY RESULTS AND ANALYSIS ........................................................... 43 4.1 Macrotexture Results Measured with the Laser Texture Scanner (LTS) .................................................. 43 4.2 Macrotexture Measured by Inertial Profiler .............................................................................................. 43
4.2.1 Continuous Macrotexture Results of Different Survey Sections Using IP ................................... 43 4.3 Correlation of Macrotexture Measurements with Inertial Profiler and Laser Texture Scanner ................ 47
UCPRC-RR-2016-02 iii
4.4 IRI Measurement Results .......................................................................................................................... 48 4.5 Bicycle Vibration Results.......................................................................................................................... 51 4.6 Bicycle Survey Results .............................................................................................................................. 58
4.6.1 Acceptability ................................................................................................................................. 58 4.6.2 Ride Quality .................................................................................................................................. 59
4.7 Correlations between Texture, Vibration, and Ride Quality ..................................................................... 65 5 TRENDS BETWEEN PAVEMENT TEXTURE AND ROUGHNESS WITH PRESENCE OF
DISTRESSES ................................................................................................................................................ 73 5.1 City Section Distress Survey ..................................................................................................................... 73
5.1.1 Distress Results ............................................................................................................................. 73 5.2 Relationships between Pavement Roughness and Distresses .................................................................... 73
5.2.1 IRI and Distresses.......................................................................................................................... 73 5.2.2 MPD and Distresses ...................................................................................................................... 74 5.2.3 Correlations between Bicycle Vibration and Distresses ............................................................... 75
5.3 Preliminary Exploration of a Bicycle Ride Quality Index ........................................................................ 75 5.3.1 Correlation of Bicycle Ride Quality Index and Rider Survey ....................................................... 75 5.3.2 Correlation of Bicycle Ride Quality Index and Distress ............................................................... 78
6 CORRELATIONS BETWEEN PAVEMENT MACROTEXTURE AND TREATMENT SPECIFICATIONS ...................................................................................................................................... 81
6.1 Macrotexture Measurement Results from Caltrans Highway Sections..................................................... 81 6.2 Analysis of Chip Seal Projects .................................................................................................................. 88
6.2.1 Correlation of Macrotexture and Chip Seal Aggregate Gradation Specifications ........................ 92 6.2.2 Macrotexture versus Time............................................................................................................. 95
6.3 Analysis of Slurry Seal Sections ............................................................................................................... 96 6.3.1 Correlation of Macrotexture and Slurry Seal Aggregate Gradation Specifications ...................... 96
7 MODELING FOR BICYCLE RIDE QUALITY ...................................................................................... 99 7.1 Data Exploration........................................................................................................................................ 99 7.2 Modeling the Acceptability of Pavement .................................................................................................. 99
7.2.1 Varying Intercept Model ............................................................................................................... 99 7.2.2 Pavement Characteristic Model .................................................................................................. 100 7.2.3 Bicycle/Personal Characteristics Model...................................................................................... 101 7.2.4 Full Model ................................................................................................................................... 101
8 MODELING FOR BICYCLE ROLLING RESISTANCE..................................................................... 107 8.1 Comparing Power Meters ........................................................................................................................ 107 8.2 Establishing a Baseline Aerodynamic Drag Area for Modeling ............................................................. 108 8.3 Field Backcalculated Coefficient of Rolling Resistance ......................................................................... 110 8.4 Effects on Rider Fatigue .......................................................................................................................... 114
9 LONG-TERM MONITORING OF MACROTEXTURE CHANGE FOR DIFFERENT TREATMENTS .......................................................................................................................................... 115
9.1 LA-2 ........................................................................................................................................................ 115 9.2 SLO-1 ...................................................................................................................................................... 117 9.3 Mon-198 .................................................................................................................................................. 118 9.4 Summary of Long-Term Monitoring Results.......................................................................................... 120
10 RECOMMENDED GUIDELINES FOR SELECTING PRESERVATION TREATMENT SPECIFICATIONS FOR BICYCLE RIDE QUALITY ......................................................................... 123
10.1 Approach Used to Develop Recommended Guidelines .......................................................................... 123 10.2 Use of the Recommended Guidelines ..................................................................................................... 124
11 CONCLUSIONS AND RECOMMENDATIONS.................................................................................... 131 11.1 Summary ................................................................................................................................................. 131 11.2 Conclusions ............................................................................................................................................. 131 11.3 Recommendations ................................................................................................................................... 132
UCPRC-RR-2016-02 iv
REFERENCES .................................................................................................................................................. 133 Appendix A: Example Survey Form (Reno)................................................................................................... 136 Appendix B: Macrotexture Measured Using IP on Survey Sections............................................................ 144 Appendix C: Plots of Correlations between Texture, Vibration, and Ride Quality by Bicycle Type for
This Study.................................................................................................................................................... 163 Appendix D: Texture Results of State Highway Sections .............................................................................. 166 Appendix E: Pavement Distress Survey Results ............................................................................................ 167
UCPRC-RR-2016-02 v
LIST OF TABLES
Table 2.1: Summary of Results ............................................................................................................................... 9 Table 3.1: Summary of Road Sections and Surveys in the Study ......................................................................... 17 Table 3.2: Summary of Cyclist Surveys ................................................................................................................ 21 Table 3.3: Summary of Survey Sections............................................................................................................... 22 Table 3.4: Summary of Slurry Sections in the Study for MPD Analysis.............................................................. 22 Table 3.5: Summary of Chip Seal Sections in the Study for MPD Analysis ........................................................ 23 Table 3.6: Summary of Microsurfacing Sections in the Study for MPD Analysis ............................................... 24 Table 3.7: Summary of State and Local Highway Sections in the Study for Rolling Resistance Measurement .. 24 Table 3.8: Summary of Measurement Methods for Pavement Surface Characteristics Used in This Study ........ 25 Table 3.9: Road Bicycle Details............................................................................................................................ 27 Table 3.10: Commuter Bicycle Details ................................................................................................................. 29 Table 3.11: Mountain Bicycle Details................................................................................................................... 30 Table 3.12: Test Sequence Summary.................................................................................................................... 39 Table 4.1: Summary Macrotexture (MPD, mm) Measurements Using the Inertial Profiler for All Survey
Sections ......................................................................................................................................................... 46 Table 4.2: Summary Roughness (IRI, m/km) Measurements for All Survey Sections......................................... 50 Table 4.3: Summary Table of Bicycling Speed (mph) for Each Survey Section.................................................. 56 Table 4.4: Summary of Bicycle Vibration Dataa (g) for Each Survey Section ..................................................... 57 Table 4.5: Summary of Ride Quality Acceptability (0 or 1) for Each Survey Section Across All Cities ............ 62 Table 4.6: Summary of Ride Quality (1 to 5) for Each Survey Section Across All Cities ................................... 64 Table 4.7: Summary of Values of Variables for Each Survey Section in All Groups .......................................... 67 Table 5.1: Summary of Average Pavement Distress Survey Results by City....................................................... 73 Table 5.2: Average IRI Results for Varying Conditions of Pavement.................................................................. 74
................. 75 Table 5.3: Median MPD Results (mm) for Varying Conditions of Pavement...................................................... 74 Table 5.4: Summary of Correlations (R2) between Vibration and Percent of Sections with Cracking Table 5.5: Summary of Correlations (R2) between BRQI and Mean Survey Results (1 to 5) for Commuter
Bicycle by City.............................................................................................................................................. 76 Table 5.6: Summary of Correlations (R2) between BRQI and Mean Survey Results (1 to 5) for Mountain Bicycle
by City........................................................................................................................................................... 76 Table 5.7: Summary of Correlations (R2) between BRQI and Mean Survey Results (1 to 5) for Road Bicycle
by City........................................................................................................................................................... 76 Table 5.8: Summary of Correlations (R2) between BRQI (events/km) and Mean Survey Results (1 to 5) for
Commuter Bicycle by Surface Type ............................................................................................................. 77 Table 5.9: Summary of Correlations (R2) between BRQI (events/km) and Mean Survey Results (1 to 5) for
Mountain Bicycle by Surface Type ............................................................................................................... 77 Table 5.10: Summary of Correlations (R2) between BRQI (events/km) and Mean Survey Results (1 to 5) for
Road Bicycle by Surface Type...................................................................................................................... 78 Table 6.1: Summary of MPD (mm) Results: Chip Seals ...................................................................................... 82 Table 6.2: Summary of MPD (mm) Results: Slurry Seals .................................................................................... 84 Table 6.3: Summary of MPD (mm) Results: Microsurfacings ............................................................................. 84 Table 6.4: Summary of Median MPD Results: Chip Seals ................................................................................... 89
and #4 Sieve Bounds..................................................................................................................................... 92 Table 6.6: Summary of Laboratory Gradation Results for Reno Slurry Seal Treatments..................................... 96 Table 7.1: Coefficients Resulting from the Modeling for Acceptability............................................................. 103 Table 8.1: Comparison of Power Meter Testing Results .................................................................................... 107 Table 8.2: Summary of Inertial Profiler Testing Results .................................................................................... 110 Table 8.3: Summary of Backcalculated Global Coefficient of Friction ( Values............................................ 111
Table 6.5: Chip Seal Standard Specification Maximum Aggregate Size (first sieve with 100 percent passing)
Table 9.1: Summary of Long-Term Macrotexture Measurements on Test Sections .......................................... 120 Table 10.1: Median and 25th Percentile (Q1) MPD Values for Each Treatment Specification .......................... 126
UCPRC-RR-2016-02 vi
LIST OF FIGURES
Figure 2.1: Pavement surface texture components and their wavelengths (3). ....................................................... 5 Figure 2.2: Influence of pavement surface texture components on functional performance of motorized
vehicles (3). ..................................................................................................................................................... 6 Figure 2.3: Pavement macrotexture (MPD) ranges for different HMA mixture types on California highways
considering all ages from new to 16 years of service (7). ............................................................................... 7 Figure 2.4: Comparison of MPD values for four commonly used asphalt surface mix types in California for
different initial age categories (age category, survey years) and for five years of data collection (7). ........... 8 Figure 3.1: Geographic distribution of the cities selected for the study................................................................ 21 Figure 3.2: Road bicycle instrumented with accelerometers (solid red circles) at the typical mounting locations
and a GPS unit on the handlebar (circle of blue dashes)............................................................................... 26 Figure 3.3: Detail of front of road bicycle instrumented with accelerometer (solid red circle) at the stem
mounting location and a GPS unit on the handlebar (circle of blue dashes)................................................. 27 Figure 3.4: Detail of rear of road bicycle instrumented with accelerometer (solid red circle) at the seatpost
mounting location. ........................................................................................................................................ 27 Figure 3.5: Commuter bicycle instrumented with accelerometers (solid red circles) at the typical mounting
locations and a GPS unit on the handlebar (circle of blue dashes). .............................................................. 28 Figure 3.6: Detail of front of commuter bicycle instrumented with accelerometer (solid red circle) at the stem
mounting location and a GPS unit on the handlebar (circle of blue dashes)................................................. 28 Figure 3.7: Detail of rear of commuter bicycle instrumented with accelerometer (solid red circle) at the
seatpost mounting location. ........................................................................................................................... 28 Figure 3.8: Mountain bicycle instrumented with accelerometers (solid red circles) at the typical mounting
locations and a GPS unit on the handlebar (circle of blue dashes). .............................................................. 29 Figure 3.9: Detail of front of mountain bicycle instrumented with accelerometer (solid red circle) at the stem
mounting location and a GPS unit on the handlebar (circle of blue dashes)................................................. 30 Figure 3.10: Detail of rear of mountain bicycle instrumented with accelerometer (solid red circle) at the
seatpost mounting location. ........................................................................................................................... 30 Figure 3.11: Example extract of bicycle speed with corresponding acceleration data.......................................... 31 Figure 3.12: UCPRC intertial profiler vehicle with rear-mounted high-speed laser (red circle), in the right
wheelpath, and GPS unit (orange oval)......................................................................................................... 34 Figure 3.13: SSI lightweight inertial profiler with rear-mounted high-speed lasers, one in each wheelpath
(red circle, shows laser in right wheelpath) and GPS unit (orange oval). ..................................................... 35 Figure 3.14: SSI lightweight inertial profiler with rear-mounted high-speed lasers in both wheelpaths (red
circles) and GPS unit (orange oval). ............................................................................................................. 35 Figure 3.15: Manufacturer A power meter crank, front. ....................................................................................... 38 Figure 3.16: Manufacturer A power meter crank, rear. ......................................................................................... 38 Figure 3.17: Bicycle instrumented with the Manufacturer A power meter (solid orange circle) and mobile
weather station behind bicycle. ..................................................................................................................... 38 Figure 3.18: Test rider on baseline test section in upright riding position. ........................................................... 39 Figure 3.19: Manufacturer B cycling power meter left crank arm, front. ............................................................. 41 Figure 3.20: Manufacturer B cycling power meter left crank arm, rear................................................................ 41 Figure 4.1: Box plots of MPD from LTS measurements for bicycle lanes or the inside of the edge of
traveled way (ETW). ..................................................................................................................................... 44 Figure 4.2: Summary box plots of macrotexture measured using the inertial profiler for all survey sections
of all groups. ................................................................................................................................................. 45 Figure 4.3: Correlation of macrotexture measurements with the inertial profiler and laser texture scanner. ....... 48 Figure 4.4: Summary box plots of IRI for all the survey sections in all groups. .................................................. 49 Figure 4.5: Summary box plots of road bicycle vibration for survey sections across all cities. ........................... 52 Figure 4.6: Summary box plots of commuter bicycle vibration for survey sections across all cities. .................. 53
UCPRC-RR-2016-02 vii
Figure 4.7: Summary box plots of mountain bicycle vibration for survey sections across all cities. ................... 54 Figure 4.8: Summary box plot of bicycle vibration for all bicycle types together for survey sections across
all cities. ........................................................................................................................................................ 55 Figure 4.9: Summary plot of mean acceptability for each survey section across all cities. .................................. 60 Figure 4.10: Summary box plot of mean ride quality for each survey section across all cities. ........................... 61 Figure 4.11: Correlations between MPD, IRI, speed, vibration, ride quality level, and acceptability rate
(first study [Phases I and II] on rural pavements). ........................................................................................ 69 Figure 4.12: Correlations between MPD, IRI, speed, vibration, ride quality level, and acceptability rate
(second study on urban pavements). ............................................................................................................. 70 Figure 4.13: Correlations between MPD, IRI, speed, vibration, ride quality level, and acceptability rate
(first and second studies combined). ............................................................................................................. 71 Figure 5.1: Acceleration BQRI (events/km) versus severity of cracking (1 to 3 scale), road bike, rear mount,
4 g event threshold. ....................................................................................................................................... 79 Figure 6.1: Summary of state highway sections for comparison of specifications and MPD............................... 85 Figure 6.2: Ranges of MPD measured on chip seal sections. ............................................................................... 86 Figure 6.3: Ranges of MPD measured on slurry seal sections. ............................................................................. 87 Figure 6.4: Ranges of MPD measured on microsurfacing sections. ..................................................................... 88 Figure 6.5: Distribution of median MPD results for all projects, chip seals. ........................................................ 90 Figure 6.6: Chip seal average of median MPD results by specification type. ....................................................... 91 Figure 6.7: Maximum aggregate size (smallest sieve with 100 percent passing allowed in the specification)
versus average median MPD for each chip seal specification type. ............................................................. 93 Figure 6.8: Percent passing #4 sieve upper bound versus average median MPD for chip seal specification
types. ............................................................................................................................................................. 93 Figure 6.9: Maximum aggregate size (smallest sieve with 100 percent passing allowed in the specification)
versus median MPD for all chip seal sections............................................................................................... 94 Figure 6.10: Percent passing #4 sieve upper bound versus median MPD for all chip seal sections. .................... 94 Figure 6.11: MPD results measured in fall 2015 plotted by project award date. .................................................. 95 Figure 6.12: Correlations of percent passing the #4 sieve and median MPD (mm). ............................................ 97 Figure 6.13: Correlations of percent passing the #8 sieve and median MPD (mm). ............................................ 97 Figure 7.1: Correlations between MPD, IRI, vibration, speed, ride quality level, and acceptability level (all
groups) from the first study......................................................................................................................... 100 Figure 7.2: Counterfactual plot of the simulated predicted probability of acceptance for a simulated rider
independent of gender and other influencing personal characteristics. ....................................................... 104 Figure 7.3: Counterfactual plot of the simulated predicted probability of acceptance for the most
discriminating rider (a female rider, with at least a BA in education level, who bicycles often). .............. 105 Figure 8.1: Normalized plotted output speeds for three different riding efforts (150 watts, 250 watts,
350 watts). ................................................................................................................................................... 109 Figure 8.2: Road bicycle power and speed plot of recorded data, given CDA=0.383 m2 and a similar
standard road bicycle. ................................................................................................................................. 109 Figure 8.3: Backcalculated global coefficient of friction, , correlations to MPD (mm) with baseline value
denoted in red. ............................................................................................................................................. 111 Figure 8.4: Backcalculated global coefficient of friction, , correlations to IRI (inches/mile) with baseline
value denoted in red. ................................................................................................................................... 112 Figure 9.1: MPD over time on LA-2 by direction............................................................................................... 116 Figure 9.2: Close-up photo of pavement on LA-2. ............................................................................................. 117 Figure 9.3: MPD over time on the SLO-1 subsections (by post mile and direction) on the shoulder (SHLD)
and in the wheelpath (WP). ......................................................................................................................... 118 Figure 9.4: MPD over time on Mon-198............................................................................................................. 119 Figure 10.1: Decision tree for MPD values......................................................................................................... 125 Figure 10.2: MPD values of chip seals with different specifications.................................................................. 127 Figure 10.3: MPD values of slurry seals with different specifications. .............................................................. 128
UCPRC-RR-2016-02 viii
145
150
155
160
165
Figure 10.4: MPD values of microsurfacings with different specifications. ....................................................... 129 Figure B.1: Macrotexture measured using IP on Davis survey Sections 1 to 4. .................................................
Figure B.6: Macrotexture measured using IP on Richmond survey Sections 9 to 12.........................................
Figure B.11: Macrotexture measured using IP on Reno survey Sections 1 to 4. ................................................
Figure B.16: Macrotexture measured using IP on Chico survey Sections 5 to 8. ...............................................
Figure C.1: Correlations between MPD, IRI, speed, vibration, ride quality level, and acceptability rate
Figure B.2: Macrotexture measured using IP on Davis survey Sections 5 to 8. ................................................. 146 Figure B.3: Macrotexture measured using IP on Davis survey Section 9........................................................... 147 Figure B.4: Macrotexture measured using IP on Richmond survey Sections 1 to 4........................................... 148 Figure B.5: Macrotexture measured using IP on Richmond survey Sections 5 to 8........................................... 149
Figure B.7: Macrotexture measured using IP on Richmond survey Sections 13 to 15....................................... 151 Figure B.8: Macrotexture measured using IP on Sacramento survey Sections 1 to 4......................................... 152 Figure B.9: Macrotexture measured using IP on Sacramento survey Sections 5 to 8......................................... 153 Figure B.10: Macrotexture measured using IP on Sacramento survey Sections 9 to 11..................................... 154
Figure B.12: Macrotexture measured using IP on Reno survey Sections 5 to 8. ................................................ 156 Figure B.13: Macrotexture measured using IP on Reno survey Sections 9 to 12. .............................................. 157 Figure B.14: Macrotexture measured using IP on Reno survey Sections 13 to 16. ............................................ 158 Figure B.15: Macrotexture measured using IP on Chico survey Sections 1 to 4. ............................................... 159
Figure B.17: Macrotexture measured using IP on Chico survey Sections 9 to 12. ............................................. 161 Figure B.18: Macrotexture measured using IP on Chico survey Sections 13 to 16. ........................................... 162
(second study, road bicycles). ..................................................................................................................... 163 Figure C.2: Correlations between MPD, IRI, speed, vibration, ride quality level, and acceptability rate
(second study, commuter bicycles). ............................................................................................................ 164 Figure C.3: Correlations between MPD, IRI, speed, vibration, ride quality level, and acceptability rate
(second study, mountain bicycles). ............................................................................................................. Figure D.1: Summary of MPD of state highway sections................................................................................... 166
UCPRC-RR-2016-02 ix
ACKNOWLEDGMENTS
The authors would like to acknowledge the interest taken in this project and the assistance offered with it by the
following groups and organizations:
Industry
Dennis Scott, Nick Schaeffer, Ahren Verigin, and Mike Chadd of Surface Systems and Instruments (SSI)
for technical support and for developing the lightweight inertial profiler vehicle
Brian Harer of Lumos & Associates for providing aggregate gradation laboratory test results
Mike Hall of SRM (Schoberer Rad Messtechnik GmbH) for providing an SRM PowerMeter unit
Andy Lull of Stages Cycling for providing a power meter unit
Robby Ketchell of Winning Algorithms for coordinating industry support
Cities and Universities
Patrick Phelan and Tawfic Halaby of the City of Richmond for their support of the Richmond survey
Scott Gibson of the Washoe County Regional Transportation Commission for supporting the Reno survey
and Elie Hajj of the University of Nevada, Reno for organizing the Reno student volunteers
Mark Brown of the city of Sacramento Facilities Management Department and Ian Sanders of the Butte
County Office of Public Works for specification information
Kenneth Derucher and Russell Mills of California State University, Chico, for organizing the Chico student
volunteers and Janine Rood (Chico Velo) for supporting the Chico survey
The Work Training Center, Inc. in Chico, California for use of their facilities
Students
University of Nevada, Reno students: Dario Batioja, Farzan Kazemi, Luis Sibaja, Sandeep Pandey, Johnny
Habbouche, Sara Pournoman, Nicholas Weitzel, Ye Yuan, Wadih Zaklit, Jared Herhewe, and Hadi
Nabizadeh for staffing the Reno survey
California State University, Chico: Pedro Valdivia, Jonathan Campos, Manuel Zavala, Janette Calvillo
Solis, and Yuliana Calvillo Solis for staffing the Chico survey
Caltrans
Joe Holland and Nick Burmas of the Caltrans Division of Research, Innovation and System Information for
research support and coordination, and Sri Balasubramanian, Haiping Zhou, and Sri Holikatti of the Caltrans
Office of Asphalt Pavements for direction and report reviews
UCPRC-RR-2016-02 xi

UCPRC
UCPRC friends, students and visiting scholars: Rita Harvey, Jessica Sales, Yong Peng, and UCPRC staff
and students for their work administering the surveys
UCPRC staff: Mark Hannum and Julian Brotschi for field testing, and David Spinner for editing the report
UCPRC-RR-2016-02 xii
PROJECT OBJECTIVES
This project was a continuation of the work carried out in Caltrans/UCPRC Partnered Pavement Research
Center Strategic Plan Element (PPRC SPE) 4.47. The objective of this second project was to propose or
recommend guidelines for the design of preservation treatments suitable for bicycle routes on state highways
and local streets in California. This was achieved through the following tasks:
1. Texture and roughness measurement for different preservation treatments to:
a. Determine the typical ranges of texture and roughness for different preservation treatments, in
particular for local streets that were not included in the first study;
b. Determine what the relationships are between pavement texture (macrotexture or mean profile
depth [MPD, 0.5 to 50 mm wavelength]) and treatment specifications; and
c. Determine what the relationship is between pavement roughness (IRI, over 500 mm
wavelength) and distresses (transverse cracking, patch, joint cracking/faulting for portland
cement concrete [PCC], etc.).
2. Conduct long-term monitoring of texture and roughness change for different treatments on selected
sections.
3. Conduct bicycle use surveys to cover a wide range of riders, bicycle types and treatment textures, and
IRI, in particular including relatively low-speed commuter bicycles that were not included in the first
study.
4. Determine if there are correlations between texture (macrotexture), roughness (IRI), bicycle vibration
(frequency, amplitude, and duration), and the consequent ride quality and acceptability of pavement to
riders.
5. Develop improved models to characterize the impact of texture, roughness, and vibration on bicycle ride
quality and acceptability of pavement to riders.
6. Develop guidelines for selecting appropriate aggregate gradations for preservation treatments from
existing Caltrans specifications.
7. Prepare a report documenting the study and study results.
This report includes the results of all of the tasks.
UCPRC-RR-2016-02 xiii

(This page left blank)
UCPRC-RR-2016-02 xiv
EXECUTIVE SUMMARY
The study described in th is report is a continuation of an initial two-phase study (Strategic Plan Element 4.47)
that the UCPRC performed in 2013 to address chip seal specifications a nd bicycle ride quality. The initial study
included several surveys on bicycle ride quality in Ce
what constituted acceptable and unacceptable road conditions in terms of t he macrotexture of the surface and
bicycle ride quality. The final report delivered in May 2014 incorporated the results from both the initial and
subsequent surveys and completed the first study.
The first study examined a limited range of pavement surface treatment types, bicycle types, and bicycle riders.
It lacked some of the treatments typically used in urban areas, and instead focused almost exclusively on long-
distance, road-type bicycles, and included bicycle riders who were nearly all involved in organized, long-
distance riding clubs. To address the surface treatment condition issue more fully, it was determined that the
study needed to be extended so that it covered the different surface textures found statewide, included a larger
sample of cyclists, used additional instrumentation on bicycles, encompassed urban bicycle routes and
commuter-type bicycles, and developed recommended guidelines for the design of preservation treatments
suitable for bicycle routes.
The second study, presented in this report, filled these following specific gaps that were identified in the first
study:
1. The typical ranges of texture and roughness for different preservation treatments had not been
established, particularly for local streets with relatively low-speed commuter bicycles;
2. No relationship had been identified between pavement texture and treatment specifications, specifically
gradations;
3. No relationships had been identified between pavement roughness and distresses (that is, transverse
cracking, patch, joint cracking/faulting, etc.);
4. The change of texture (macrotexture and megatexture) and roughness of different treatments over time
was not understood;
5. The correlations between texture (macrotexture) and roughness (IRI) with bicycle vibration (frequency,
amplitude, and duration) and consequent ride quality and rider perception of pavement acceptability had
not been established;
6. Additional bicycle surveys were needed to cover a wider range of riders, bicycle types and treatment
textures, and IRI, particularly for urban and suburban routes and for riders not using high-performance
bicycles with high-pressure tires for long-distance rides;
UCPRC-RR-2016-02 xv
7. Expanded instrumentation and data collection for bicycles and improved models were needed to
characterize the impact of texture and roughness and vibration on bicycle ride quality; and
8. Recommended guidelines for the design and selection of preservation treatments for bicycle routes on
state highways and local streets were needed.
The gaps mentioned were addressed by performing the following tasks:
1. Measure texture and roughness for different preservation treatments to:
a. Determine the typical ranges of texture and roughness for different preservation treatments, in
particular for local streets, which were not included in the first study;
b. Determine what the relationships are between pavement texture (macrotexture or mean profile
depth [MPD, 0.5 to 50 mm wavelength]) and treatment specifications; and
c. Determine what the relationship is between pavement roughness (IRI, over 500 mm
wavelength) and distresses (transverse cracking, patch, joint cracking/faulting for portland
cement concrete [PCC], etc.).
2. Conduct long-term monitoring of texture and roughness change for different treatments on selected
sections.
3. Conduct bicycle use surveys to cover a wide range of riders, bicycle types and treatment textures, and
IRI, in particular including relatively low-speed commuter bicycles that were not included in the first
study.
4. Determine if there are correlations between texture (macrotexture), roughness (IRI), bicycle vibration
(frequency, amplitude, and duration), and the consequent ride quality and acceptability of pavement to
riders.
5. Develop improved models to characterize the impact of texture, roughness, and vibration on bicycle ride
quality and acceptability of pavement to riders.
6. Develop guidelines for selecting appropriate aggregate gradations for preservation treatments from
existing Caltrans specifications.
7. Prepare a report documenting the study and study results.
This report includes the results of all of these tasks. Chapter 2 includes the results of a literature review and
covers basic pavement surface texture concepts, typical texture characteristics, and the measured texture values
for several types of asphalt surfaces built by Caltrans in the past. The chapter also includes a discussion of the
available literature regarding pavement surface texture, bicycle ride quality, and physical rolling resistance. A
few studies about bicycle vibration were found in the literature, but they mostly focused on the vibration-caused
damage to bicycle frames and handlebars and on optimal frame designs for mountain bicycles and other off-road
UCPRC-RR-2016-02 xvi
bicycles. Many of the studies found investigated the interactions of human behavior and transportation mode
choice (car versus bicycle). These studies indicated that variables affecting mode choice include typical vehicle
speeds, vehicle traffic flow, road width, availability of bicycle paths, etc. However, no specific data were found
in the literature regarding whether or how pavement macrotexture-related bicycle vibration or other factors
mode choices. Despite the fact that pavement condition
can affect both the physical and psychological stress of the rider, the effect of infrastructure on mode choice and
ride quality has typically focused on the effects of different types o f bicycle facilities. The effects of the
ility of the level of service (functionality to the user),
and mode choice, were only mentioned in a few studies.
Chapter 3 describes the test sections and experimental methods used for field measurements on the surface
treatments, including the measurement methods for pavement macrotexture and bicycle vibration. This study
conducted measurements of pavement texture and ride quality, and administered bicycle ride quality surveys in
five cities (Davis, Richmond, Sacramento, Reno, and Chico). Pavement section selections for the city surveys
were based on the following characteristics: uniformity of pavement surface within sections, age, pavement
condition, and the logistics of bicycle travel between sections within each city to produce a combined route less
than 15 miles long. The UCPRC traveled the sections on bicycle and by car to ascertain the range of surface
treatments on the pavements as well as the macrotexture and roughness conditions, and also reached out to local
government and nongovernmental bicycle organizations to help select routes in each city with a range of surface
treatments and surface conditions. The bicycle surveys collected data from a total of 155 participants who rode
on 67 road sections distributed across the five cities, resulting in a total of 2,194 observations.
A number of state and local roads were also measured for pavement texture to look for correlations between
macrotexture, in terms of MPD, and treatment type, and between macrotexture and the specifications followed
by Caltrans and local governments. Sections were selected based on the availability of documentation of the
specifications used for the projects. Measurements of MPD, IRI, rolling resistance, and cycle power
requirements were also collected on a small set of local roads for use in mechanistic modeling of
bicycle/pavement interaction.
Chapter 4 presents the results and analyses of the pavement surface macrotexture measurements, including the
results and correlations of the bicycle vibration and bicycle ride quality surveys in the five selected cities. The
main observations from correlation of the combined results from both studies include the following:
UCPRC-RR-2016-02 xvii
a. Strong correlations were found between MPD, bicycle vibration, acceptability, and ride quality level.
b. Medium to weak correlations were found between IRI, bicycle vibration, acceptability, and ride quality
level.
c. A relatively weak correlation was found between bicycle vibration and bicycle speed. No significant
correlation was found between other variables and bicycle speed (small set of speeds).
d. Vibration appears to be somewhat more sensitive to MPD when MPD values are above 2 mm.
e. Vibration appears to be somewhat more sensitive to IRI when IRI values are above 317 inches/mile
(5 m/km).
f. Stronger correlations were found between bicycle vibration with acceptability and ride quality than
between MPD and IRI with acceptability and ride quality.
g. The relationship between MPD and ride quality is approximately linear.
h. The following are the approximate ranges of maximum MPD values for bicycle ride quality
for the percentage of participants who rated
80 p ercent found 1.8 mm MPD acceptable.
60 p ercent found 2.1 mm MPD acceptable.
50 p ercent found 2.3 mm MPD acceptable.
40 p ercent found 2.5 mm MPD acceptable.
i. The average ride quality level rating (on a scale of 1 to 5) is approximately:
3.5 for an MPD of 1.0 mm
3.0 for an MPD of 1.8 mm
2.5 for an MPD of 2.2 mm
1.5 for an MPD of 3.0 mm
j. the ride quality rating was 3 or greater, and the
ratings below 3 to a point where almost no one found a pavement acceptable when its ride quality rating
was about 1.
Chapter 5 presents the results of the exploration of trends between pavement roughness and distresses, and also
explores a preliminary bicycle ride quality index (BRQI). Based on the results shown in this chapter, the
relationships between distresses and MPD are unclear. On the other hand, a relationship between IRI and
distresses was found, but how this affects cyclists is unknown as IRI was developed as a measure of vehicle ride
quality. Correlations were explored between a preliminary BRQI based on the number of acceleration events
above a threshold and bicycle ride quality. The comparisons of BRQI and mean survey results among pavement
UCPRC-RR-2016-02 xviii
surface types show the strongest correlations between the HMA surface and road bicycle (R2 = 0.53 to 0.56),
commuter bicycle (R2 = 0.30 to 0.53), and mountain bicycle (R2 = 0.30 to 0.53). The comparisons between
BRQI and mean survey results showed lower R2 correlations for both the chip seal and slurry seal surface types.
The low correlations between the BRQI based on vibration events per kilometer and the survey results indicate
that there are likely other characteristics of the pavement surface that can be better correlated to the mean survey
results.
Chapter 6 presents the results of correlations between pavement texture and treatment specifications.
Correlations were identified between pavement texture measured by MPD and surface treatment specifications.
The data used to develop the correlations came from state highway sections selected because specification
information was available, and from those city and county sections used for the rider survey analysis for which
specifications were also available. The trends found for chip seals were between increasing maximum aggregate
size and increasing MPD and between decreasing percent passing the No. 4 sieve (4.76 mm) and increasing
MPD, although these correlations were very weak. Although it was found in this study that MPD can decrease
as a chip seal is subjected to traffic, no correlation between age and macrotexture was found in this analysis.
Chapters 7 and 8 present the results of modeling of bicycle ride quality and physical rolling resistance,
respectively, using the combined results of this study and the previous study. In Chapter 7, the results of the
bicycle ride quality surveys, includin
the measurements of MPD and IRI were used to develop models for predicting the pavement ratings (1 to 5) and
the acceptability of the pavement to cyclists. By simulating riders and pavement conditions and holding all other
aspects constant, the full model was used to predict the percentage of the population that would rate a given
segment as acceptable. The results of the simulations show that it is the combination of MPD and IRI which
determines acceptability, and the personal characteristics of
acceptability. Results for 80 and 90 percent ratings of acceptability versus MPD and IRI were developed.
In Chapter 8, a physical model for bicycle rolling resistance that uses the global coefficient of friction ( ) as a
measure of rolling resistance was calibrated using power meters installed on test bicycles that were ridden over a
set of test sections. Correlations between pavement macrotexture measured in MPD and the backcalculated
results had an R2 value of 0.70.
Chapter 9 presents the results of long-term monitoring of pavement macrotexture on selected sections.
Chapter 10 presents recommended guidelines for selecting macrotexture in terms of MPD for bicycle ride
quality and summarizes the range of MPD for the slurry seal, microsurfacing, and chip seal specifications
UCPRC-RR-2016-02 xix
measured a s part of this study. The simulations were performed using two groups of riders: one group
(Group 1) sampled across all ranges of personal characteristics and another group (Group 2) representing riders
with the personal characteristics associated with the most discriminating opinions about section acceptability.
Ranges of acceptable maximum MPD are giv en in the recommended guidelines, spanning the results of the
simulations for Group 1 and Group 2. Controlling the level of IRI on chip seals, surface seals, and
microsurfacing treatments as part of construction quality
but an agency can chose a particular specification for MPD, as different surface treatments have been shown to
yield different MPD ranges. Therefore, the results of the simulations were us ed to recommend a level of
maximum MPD for a given level of IRI for a segment. To make the recommended guidelines workable, the
desired IRI values were broken into three categories: <190 inches/mile, 190 to 380 inches/mile, and
>380 inches/mile [<3 m/km, 3 to 6 m/km, and >6 m/km]). Estimation of IRI into these three broad ranges
should not be difficult. Median and 25th percentile (more conservative) values of MPD for all of the different
chip seal, slurry seal and microsurfacing specifications sampled in this study are included with the
recommended guidelines, which allow the user to select the specification that meets the desired level of
acceptability of the surface treatment to bicyclists.
The scope of these recommended guidelines for choosing a surface treatment specification are based solely on
bicycle ride quality. The recommended guidelines also state that other criteria must be considered when
selecting a surface treatment specification, including motor vehicle safety in terms of skid resistance under wet
conditions, for which minimum MPD requirements should be considered, and the life-cycle cost of the
treatment.
Chapter 11 presents conclusions and recommendations. The following conclusions have been drawn from the
results and analyses presented:
Both IRI and MPD are important parameters to determine whether riders find a particular section
acceptable, and MPD is more important than IRI.
The perception of bicycle ride quality appears to depend on the interaction of MPD and IRI; the MPD
threshold at which riders will find a given segment unacceptable decreases as IRI increases.
Considering simple rider demographics or pavement condition variables such as those used in this study
does not completely capture the considerable variability among people and among sections that
influences what riders consider acceptable or unacceptable pavement condition.
Increased MPD and to a lesser extent increased IRI were found to correlate with the increased vibration
and additional power required to move a bicycle, which matches the rider survey results.
UCPRC-RR-2016-02 xx
From the measurements and surveys completed in this study and its predecessor and without
considering IRI, 80 percent of riders rated pavements with MPD values of 1.8 mm or less as acceptable
and 50 percent rated pavements with MPD values of 2.3 mm or less as acceptable.
Most treatments used in urban areas produced high acceptability across cities, however, there are some
specifications that have a high probability of resu
from bicyclists.
Pavement macrotexture generally tends to decrease over time under trafficking, with less reduction
outside the wheelpaths than in the wheelpaths.
The research was successful in identifying ranges of MPD for current Caltrans specifications for chip
seals, slurry seals, and microsurfacings, however it was not possible to find useful correlations between
MPD and individual sieve sizes within the gradations.
From laboratory gradation data on aggregate screenings used on slurry seal sections in Reno, Nevada,
correlations were found between the median MPD of a pavement surface and the percent passing the
#4 (4.75 mm) and #8 (2.36 mm) screen sizes in the constructed gradation.
The research was successful in developing recommended guidelines that allow pavement treatment
designers and pavement managers to select treatment specifications for bicycle routes that will result in
clists. The scope of the recommended guidelines
presented in this report for choosing a surface treatment specification only considers bicycle ride
quality. The recommended guidelines also state that other criteria must be considered when selecting a
surface treatment specification, including motor vehicle safety in terms of skid resistance under wet
conditions, for which minimum MPD requirements should be considered, and the life cycle cost of the
treatment.
Based on the results of this study, the following recommendations are made regarding pavement surfaces that
will be used by bicyclists:
Begin use of the recommended guidelines included in this report as part of the surface treatment
selection process along with existing guidance that considers criteria other than bicycle ride quality such
as motorist safety and treatment life cycle cost, and improve them as experience is gained. The
recommendations are for the selection of existing surface treatment specifications based on different
levels of bicycle ride quality satisfaction.
In the recommended guidelines, consider using the 90 percent acceptable MPD level on routes with
higher bicycle use as opposed to the 80 percent acceptable MPD level that is also included. Further
confidence that the treatment will have an acceptable MPD level can be obtained by selecting treatments
based on the 25th percentile MPD instead of the median MPD.
UCPRC-RR-2016-02 xxi

As new treatment specifications are developed, collect MPD data on them so that they can be included
in updated versions of the recommended guidelines.
If greater precision in developing specifications is desired than is currently possible, consider additional
research to develop methods of estimating MPD from gradations and aggregate shape (such as flakiness
index).
UCPRC-RR-2016-02 xxii
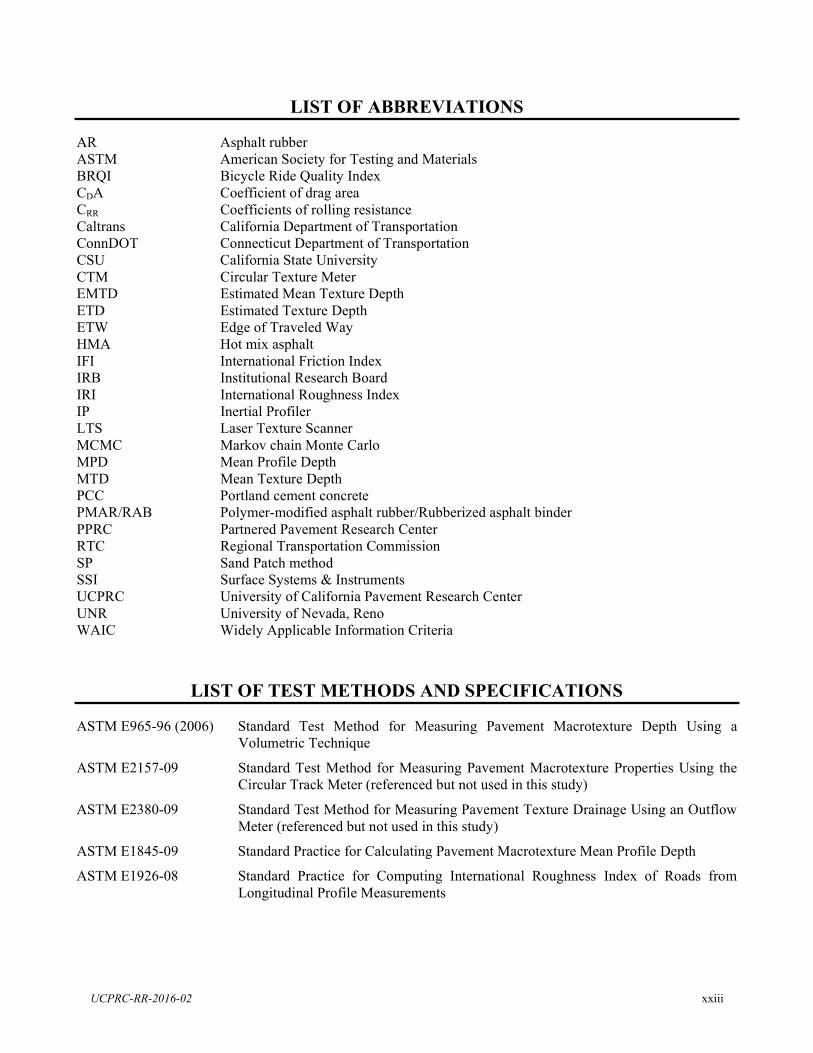
LIST OF ABBREVIATIONS
AR Asphalt rubber ASTM American Society for Testing and Materials BRQI Bicycle Ride Quality Index CDA Coefficient of drag area CRR Coefficients of rolling resistance Caltrans California Department of Transportation ConnDOT Connecticut Department of Transportation CSU California State University CTM Circular Texture Meter EMTD Estimated Mean Texture Depth ETD Estimated Texture Depth ETW Edge of Traveled Way HMA Hot mix asphalt IFI International Friction Index IRB Institutional Research Board IRI International Roughness Index IP Inertial Profiler LTS Laser Texture Scanner MCMC Markov chain Monte Carlo MPD Mean Profile Depth MTD Mean Texture Depth PCC Portland cement concrete PMAR/RAB Polymer-modified asphalt rubber/Rubberized asphalt binder PPRC Partnered Pavement Research Center RTC Regional Transportation Commission SP Sand Patch method SSI Surface Systems & Instruments UCPRC University of California Pavement Research Center UNR University of Nevada, Reno WAIC Widely Applicable Information Criteria
LIST OF TEST METHODS AND SPECIFICATIONS
ASTM E965-96 (2006) Standard Test Method for Measuring Pavement Macrotexture Depth Using a Volumetric Technique
ASTM E2157-09 Standard Test Method for Measuring Pavement Macrotexture Properties Using the Circular Track Meter (referenced but not used in this study)
ASTM E2380-09 Standard Test Method for Measuring Pavement Texture Drainage Using an Outflow Meter (referenced but not used in this study)
ASTM E1845-09 Standard Practice for Calculating Pavement Macrotexture Mean Profile Depth
ASTM E1926-08 Standard Practice for Computing International Roughness Index of Roads from Longitudinal Profile Measurements
UCPRC-RR-2016-02 xxiii
lbf/in2 poundforce per square inch 6.89 Kilopascals kPa
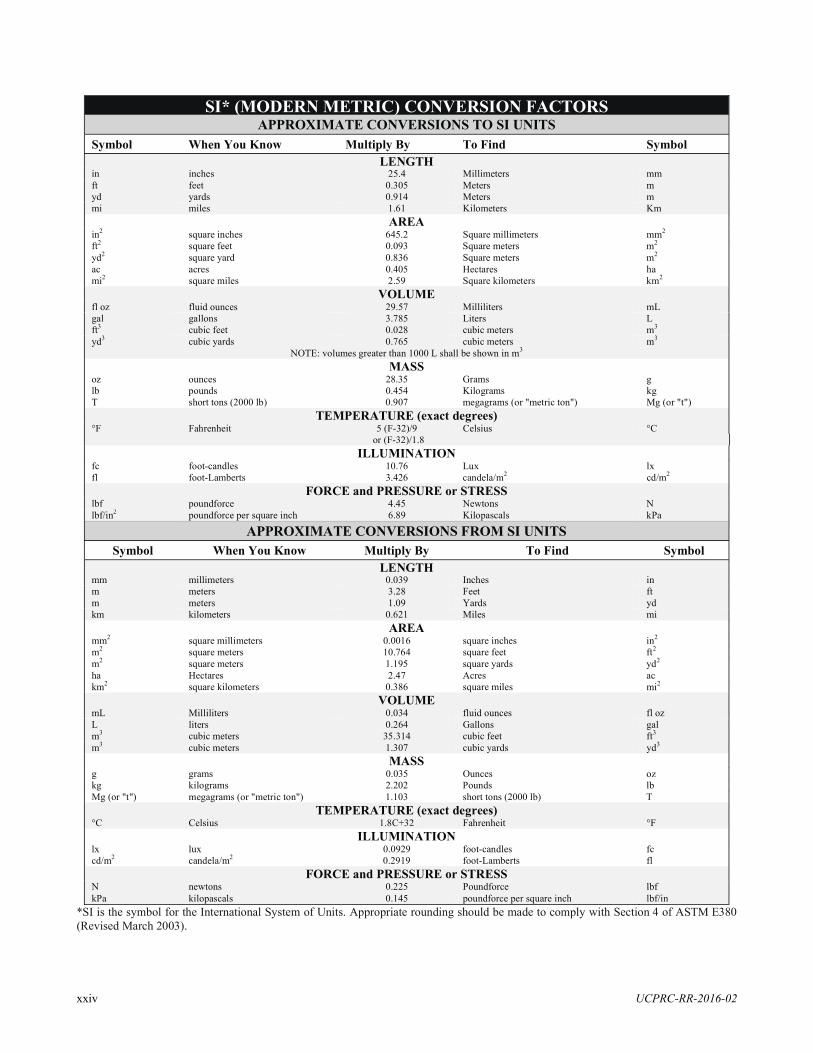
APPROXIMATE CONVERSIONS TO SI UNITS Symbol When You Know Multiply By To Find Symbol
in ft yd mi
in2
ft2
yd2
ac mi2
fl oz gal ft3
yd3
ozlb T
°F
fcfl
lbf
LENGTH inches 25.4 Millimeters feet 0.305 Meters yards 0.914 Meters miles 1.61 Kilometers
AREA square inches 645.2 Square millimeters
square feet 0.093 Square meters square yard 0.836 Square meters acres 0.405 Hectares square miles 2.59 Square kilometers
VOLUME fluid ounces 29.57 Milliliters gallons 3.785 Liters cubic feet 0.028 cubic meters cubic yards 0.765 cubic meters
3 NOTE: volumes greater than 1000 L shall be shown in mMASS
ounces 28.35 Grams pounds 0.454 Kilograms short tons (2000 lb) 0.907 megagrams (or "metric ton")
TEMPERATURE (exact degrees) Fahrenheit 5 (F-32)/9 Celsius
or (F-32)/1.8 ILLUMINATION
foot-candles 10.76 Lux foot-Lamberts 3.426 candela/m2
FORCE and PRESSURE or STRESS poundforce 4.45 Newtons
mm m m Km
2 mm2 m2 m
ha km2
mL L
3 m3 m
g kg Mg (or "t")
°C
lx cd/m2
N
APPROXIMATE CONVERSIONS FROM SI UNITS Symbol When You Know Multiply By To Find Symbol
mm m m km
2 mm2 m2 m
hakm2
mL L
3 m3 m
g kg Mg (or "t")
°C
lx cd/m2
N
LENGTH millimeters 0.039 Inches meters 3.28 Feet meters 1.09 Yards kilometers 0.621 Miles
AREA square millimeters 0.0016 square inches square meters 10.764 square feet square meters 1.195 square yards
Hectares 2.47 Acres square kilometers 0.386 square miles
VOLUME Milliliters 0.034 fluid ounces liters 0.264 Gallons cubic meters 35.314 cubic feet cubic meters 1.307 cubic yards
MASS grams 0.035 Ounces kilograms 2.202 Pounds megagrams (or "metric ton") 1.103 short tons (2000 lb)
TEMPERATURE (exact degrees) Celsius 1.8C+32 Fahrenheit
ILLUMINATION lux 0.0929 foot-candles
candela/m2 0.2919 foot-Lamberts FORCE and PRESSURE or STRESS
newtons 0.225 Poundforce
in ft yd mi
in2
ft2
yd2
ac mi2
fl oz gal ft3
yd3
oz lb T
°F
fc fl
lbf 2 kPa kilopascals 0.145 poundforce per square inch lbf/in
SI* (MODERN METRIC) CONVERSION FACTORS
*SI is the symbol for the International System of Units. Appropriate rounding should be made to comply with Section 4 of ASTM E380 (Revised March 2003).
UCPRC-RR-2016-02 xxiv
1 INTRODUCTION
1.1 Background
In late 2012, the Caltrans Division of Maintenance in District 5 asked the Division of Maintenance Office of
Asphalt Pavement and the Division of Research, Innovation and System Information to evaluate the impact of
different chip seal treatments on bicycle ride quality. In January 2013, the Office of Asphalt Pavement and
requested that the University of California Pavement Research Center (UCPRC), through the Caltrans/UCPRC
Partnered Pavement Research Center program, prepare a research work plan in response to the scoping
final version of the work plan in March 2013 but it was updated in July 2013 to include a second phase with
additional pavement sections and cyclist surveys. The initial two-phase study (Strategic Plan Element 4.47) that
the UCPRC performed in 2013 to address chip seal issues included several surveys on bicycle ride quality in
s of what constituted acceptable and unacceptable road
conditions. A technical memorandum delivered in November 2013 completed the scope of the first study and
included the results from the initial survey (1). The final report (2) delivered in May 2014 incorporated the
results from both the initial and subsequent surveys and completed Phase II of the first study.
The results of the first two-phase study examined a limited range of pavement surface treatment types, bicycle
types, and bicycle riders. It lacked some of the treatments typically used in urban areas, and instead focused
almost exclusively on long-distance, road-type bicycles, and included bicycle riders who were nearly all
involved in organized, long-distance riding clubs. To address the surface treatment condition issue more fully, it
was determined that the study needed to be extended so that it covered the different surface textures found
statewide, included a larger sample of cyclists, used additional instrumentation on bicycles, encompassed urban
bicycle routes and commuter-type bicycles, and developed recommended guidelines for the design of
preservation treatments suitable for bicycle routes. The second study, presented in this report, filled these
following specific gaps that were identified in the first study:
1. The typical ranges of texture and roughness for different preservation treatments had not been
established, particularly for local streets with relatively low-speed commuter bicycles;
2. No relationship had been identified between pavement texture and treatment specifications, specifically
gradations;
3. No relationships had been identified between pavement roughness and distresses (that is, transverse
cracking, patch, joint cracking/faulting, etc.);
UCPRC-RR-2016-02 1
4. The change of texture (macrotexture and megatexture) and roughness of different treatments over time
was not understood;
5. The correlations between texture (macrotexture) and roughness (IRI) with bicycle vibration (frequency,
amplitude, and duration) and consequent ride quality and rider perception of pavement acceptability had
not been established;
6. Additional bicycle surveys were needed to cover a wider range of riders, bicycle types and treatment
textures, and IRI, particularly for urban and suburban routes and for riders not using high-performance
bicycles with high-pressure tires for long-distance rides;
7. Expanded instrumentation and data collection for bicycles and improved models were needed to
characterize the impact of texture and roughness and vibration on bicycle ride quality; and
8. Recommended guidelines for the design and selection of preservation treatments for bicycle routes on
state highways and local streets were needed.
1.2 Goal and Scope of the Study
This project was a continuation of the work carried out in Caltrans/UCPRC Partnered Pavement Research
Center Strategic Plan Element (PPRC SPE) 4.47. The objective of this second project was to prepare
recommended guidelines for the design of preservation treatments suitable for bicycle routes on state highways
and local streets in California. This was achieved by performing the following tasks:
1. Measure texture and roughness for different preservation treatments to:
a. Determine the typical ranges of texture and roughness for different preservation treatments, in
particular for local streets, which were not included in the first study;
b. Determine what the relationships are between pavement texture (macrotexture or mean profile
depth [MPD, 0.5 to 50 mm wavelength]) and treatment specifications; and
c. Determine what the relationship is between pavement roughness (IRI, over 500 mm
wavelength) and distresses (transverse cracking, patch, joint cracking/faulting for portland
cement concrete [PCC], etc.).
2. Conduct long-term monitoring of texture and roughness change for different treatments on selected
sections.
3. Conduct bicycle use surveys to cover a wide range of riders, bicycle types and treatment textures, and
IRI, in particular including relatively low-speed commuter bicycles that were not included in the first
study.
UCPRC-RR-2016-02 2
4. Determine if there are correlations between texture (macrotexture), roughness (IRI), bicycle vibration
(frequency, amplitude, and duration), and the consequent ride quality and acceptability of pavement to
riders.
5. Develop improved models to characterize the impact of texture, roughness, and vibration on bicycle ride
quality and acceptability of pavement to riders.
6. Develop guidelines for selecting appropriate aggregate gradations for preservation treatments from
existing Caltrans specifications.
7. Prepare a report documenting the study and study results.
This report includes the results of all of these tasks.
1.3 Scope and Organization of This Report
This research report documents the results from all the tasks in this study combined with results from the
previous study. The report also presents recommendations on how to improve the selection of pavement surface
treatments for use by bicycles.
Chapter 2 includes the results of a literature review and covers basic pavement surface texture concepts, typical
texture characteristics, and the measured texture values for several types of asphalt surfaces built by Caltrans in
the past. The chapter also includes a discussion of the available literature regarding pavement surface texture,
bicycle ride quality, and physical rolling resistance. Chapter 3 describes the test sections and experimental
methods used for field measurements on the surface treatments, including the measurement methods for
pavement macrotexture and bicycle vibration. Chapter 4 presents the results and analyses of the pavement
surface macrotexture measurements, including the results and correlations of the bicycle vibration and bicycle
ride quality surveys in five selected cities. Chapters 5 presents the results of the exploration of trends between
pavement roughness and distresses, and also explores a preliminary bicycle ride quality index. Chapter 6
presents the results of correlations between pavement texture and treatment specifications. Chapters 7 and 8
present the results of modeling of bicycle ride quality and physical rolling resistance, respectively, using the
combined results of this study and the previous study. Chapter 9 presents the results of long-term monitoring of
pavement macrotexture on selected sections. Chapter 10 presents recommended guidelines for selecting
macrotexture in terms of MPD for bicycle ride quality and summarizes the range of MPD for the slurry seal,
microsurfacing, and chip seal specifications measured as part of this study. Chapter 11 presents conclusions and
recommendations. The appendixes contain the forms used in the bicycle surveys (Appendix A), detailed results
of field macrotexture measurements using the inertial profilometer (Appendix B), texture, vibration and ride
quality correlations (Appendix C), texture results of state highway sections (Appendix D), and pavement distress
survey results (Appendix E).
UCPRC-RR-2016-02 3

(This page left blank)
UCPRC-RR-2016-02 4
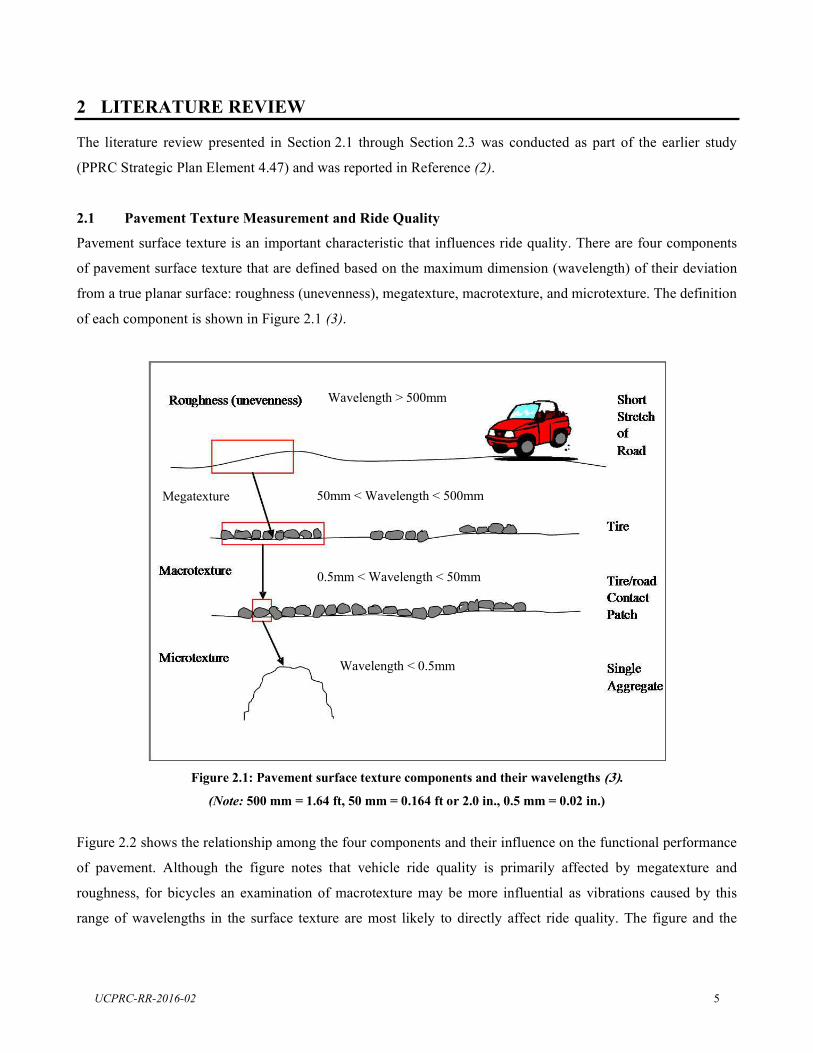
2 LITERATURE REVIEW
The literature review presented in Section 2.1 through Section 2.3 was conducted as part of the earlier study
(PPRC Strategic Plan Element 4.47) and was reported in Reference (2).
2.1 Pavement Texture Measurement and Ride Quality
Pavement surface texture is an important characteristic that influences ride quality. There are four components
of pavement surface texture that are defined based on the maximum dimension (wavelength) of their deviation
from a true planar surface: roughness (unevenness), megatexture, macrotexture, and microtexture. The definition
of each component is shown in Figure 2.1 (3).
Megatexture
Wavelength < 0.5mm
0.5mm < Wavelength < 50mm
50mm < Wavelength < 500mm
Wavelength > 500mm
Figure 2.1: Pavement surface texture components and their wavelengths .
(Note: 500 mm = 1.64 ft, 50 mm = 0.164 ft or 2.0 in., 0.5 mm = 0.02 in.)
Figure 2.2 shows the relationship among the four components and their influence on the functional performance
of pavement. Although the figure notes that vehicle ride quality is primarily affected by megatexture and
roughness, for bicycles an examination of macrotexture may be more influential as vibrations caused by this
range of wavelengths in the surface texture are most likely to directly affect ride quality. The figure and the
UCPRC-RR-2016-02 5

literature (4-6) also note that macrotexture is important for vehicle skid resistance and that macrotexture values
that are too small can lead to greater risk of wet weather skidding and hydroplaning.
.
Texture Wavelength
Figure 2.2: Influence of pavement surface texture components on functional performance of motorized vehicles .
Macrotexture is typically measured in terms of mean profile depth (MPD) or mean texture depth (MTD), two
closely related parameters. Ways to measure them include use of the sand patch method (SP, ASTM E965), the
outflow meter (OM, ASTM E2380), the laser texture scanner (LTS, ASTM E2157/ASTM E1845), or the inertial
profiler (IP, ASTM E1845).
As is shown in Figure 2.3, MPD values for most hot mix asphalt (HMA) materials historically used on
California state highways typically range from approximately 0.019 in. (0.5 mm) to 0.059 in. (1.5 mm), with the
macrotexture of some large-stone open-graded materials (F-mixes) that were used for a time on the North Coast
going as high as approximately 2.0 mm (7). Generally, the surface macrotexture of in-service asphalt pavements
with hot mix asphalt surfaces increases with time (7) due to raveling (loss of fines around large aggregates) from
traffic, oxidation of the asphalt, and rainfall, as shown in Figure 2.4. This figure also shows that for some
materials there may be an initial reduction in MPD after construction due to embedment and the polishing of
surface aggregates.
2.2 Bicycle Vibration and Bicycle Ride Quality
A few studies about bicycle vibration were found in the literature. However, these studies mostly focused on the
vibration-caused damage to bicycle frames and handlebars and on optimal frame designs for mountain bicycles
and other off-road bicycles (8-12).
UCPRC-RR-2016-02 6
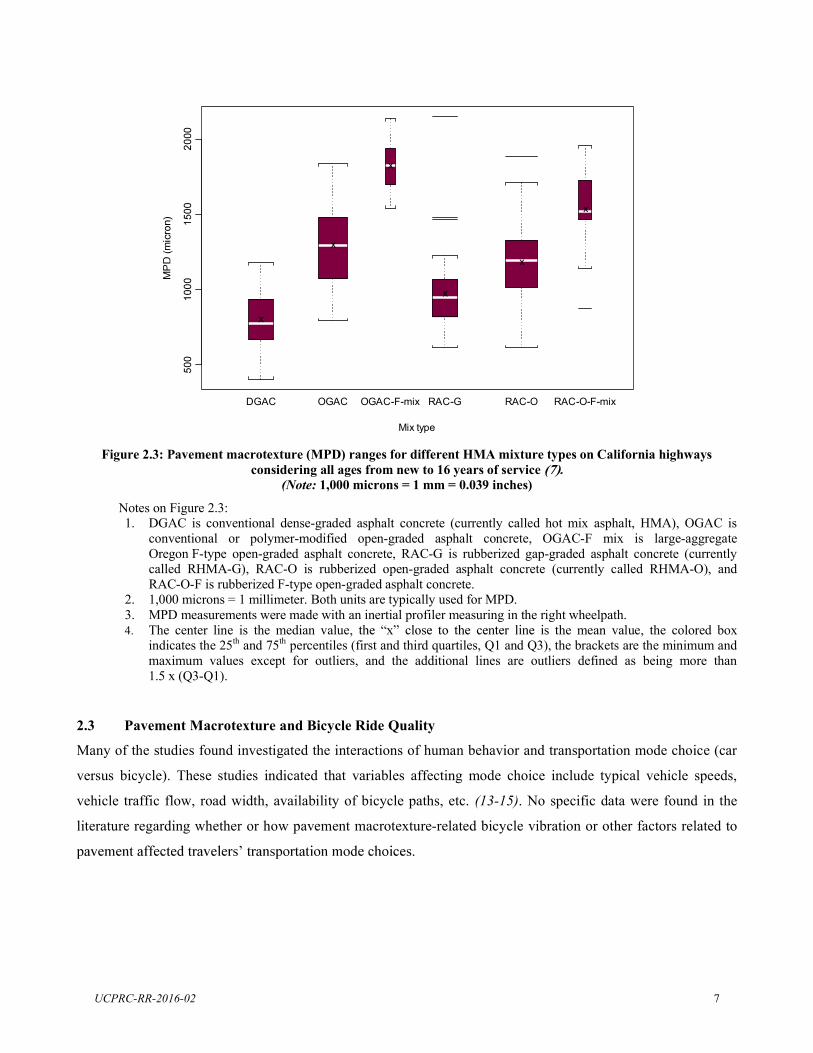
x
x
x
x
x
x
DGAC OGAC OGAC-F-mix RAC-G RAC-O RAC-O-F-mix
Mix type
Figure 2.3: Pavement macrotexture (MPD) ranges for different HMA mixture types on California highways considering all ages from new to 16 years of service
(Note: 1,000 microns = 1 mm = 0.039 inches)
Notes on Figure 2.3: 1. DGAC is conventional dense-graded asphalt concrete (currently called hot mix asphalt, HMA), OGAC is
conventional or polymer-modified open-graded asphalt concrete, OGAC-F mix is large-aggregate Oregon F-type open-graded asphalt concrete, RAC-G is rubberized gap-graded asphalt concrete (currently called RHMA-G), RAC-O is rubberized open-graded asphalt concrete (currently called RHMA-O), and RAC-O-F is rubberized F-type open-graded asphalt concrete.
2. 1,000 microns = 1 millimeter. Both units are typically used for MPD. 3. MPD measurements were made with an inertial profiler measuring in the right wheelpath. 4. The center line is the median value, the mean value, the colored box
indicates the 25th and 75th percentiles (first and third quartiles, Q1 and Q3), the brackets are the minimum and maximum values except for outliers, and the additional lines are outliers defined as being more than 1.5 x (Q3-Q1).
2.3 Pavement Macrotexture and Bicycle Ride Quality
Many of the studies found investigated the interactions of human behavior and transportation mode choice (car
versus bicycle). These studies indicated that variables affecting mode choice include typical vehicle speeds,
vehicle traffic flow, road width, availability of bicycle paths, etc. (13-15). No specific data were found in the
literature regarding whether or how pavement macrotexture-related bicycle vibration or other factors related to
UCPRC-RR-2016-02 7
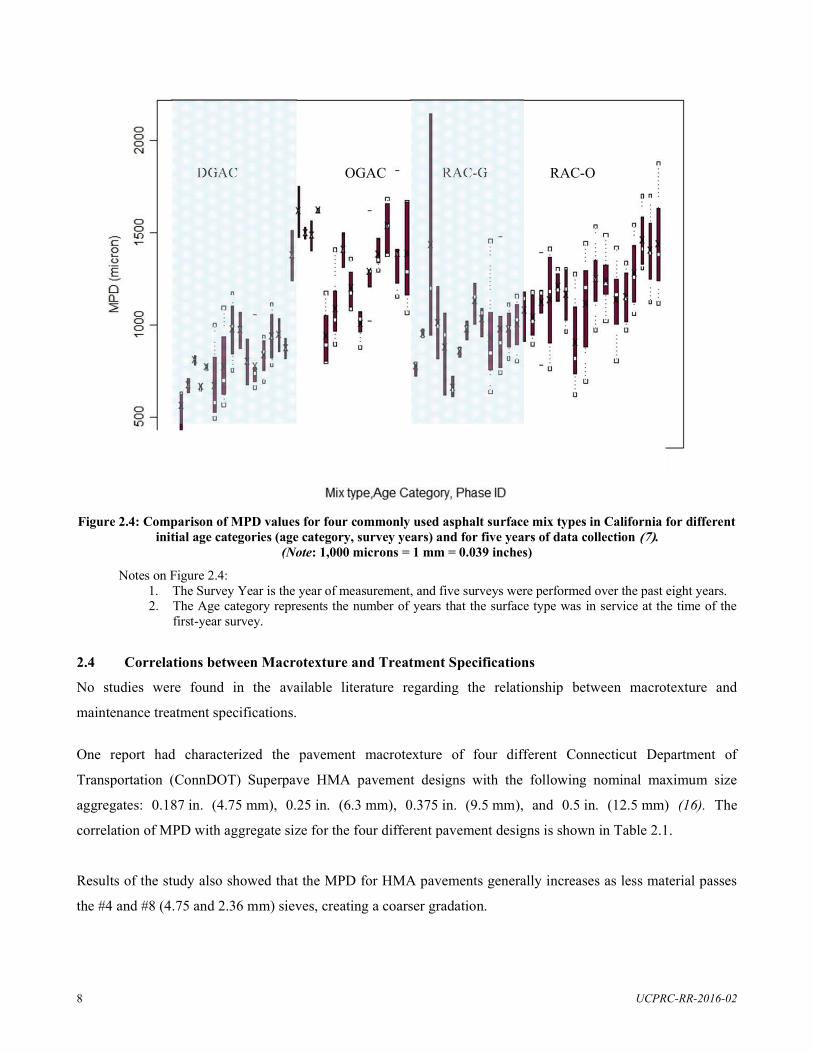
Survey Year 123 45 123 4 5 12345 12345 12345 12345 1 2 3 4 5 1 2 3 4 5 1234 5 12 3 4 5 1 2 3 4 5 1 2 3 4 5 Age Category <1 1-4 >4 <1 1-4 >4 <1 1-4 >4 <1 1-4 >4
OGAC - RAC-O
DGAC RAC G
Figure 2.4: Comparison of MPD values for four commonly used asphalt surface mix types in California for different initial age categories (age category, survey years) and for five years of data collection .
(Note: 1,000 microns = 1 mm = 0.039 inches)
Notes on Figure 2.4: 1. The Survey Year is the year of measurement, and five surveys were performed over the past eight years. 2. The Age category represents the number of years that the surface type was in service at the time of the
first-year survey.
2.4 Correlations between Macrotexture and Treatment Specifications
No studies were found in the available literature regarding the relationship between macrotexture and
maintenance treatment specifications.
One report had characterized the pavement macrotexture of four different Connecticut Department of
Transportation (ConnDOT) Superpave HMA pavement designs with the following nominal maximum size
aggregates: 0.187 in. (4.75 mm), 0.25 in. (6.3 mm), 0.375 in. (9.5 mm), and 0.5 in. (12.5 mm) (16). The
correlation of MPD with aggregate size for the four different pavement designs is shown in Table 2.1.
Results of the study also showed that the MPD for HMA pavements generally increases as less material passes
the #4 and #8 (4.75 and 2.36 mm) sieves, creating a coarser gradation.
UCPRC-RR-2016-02 8
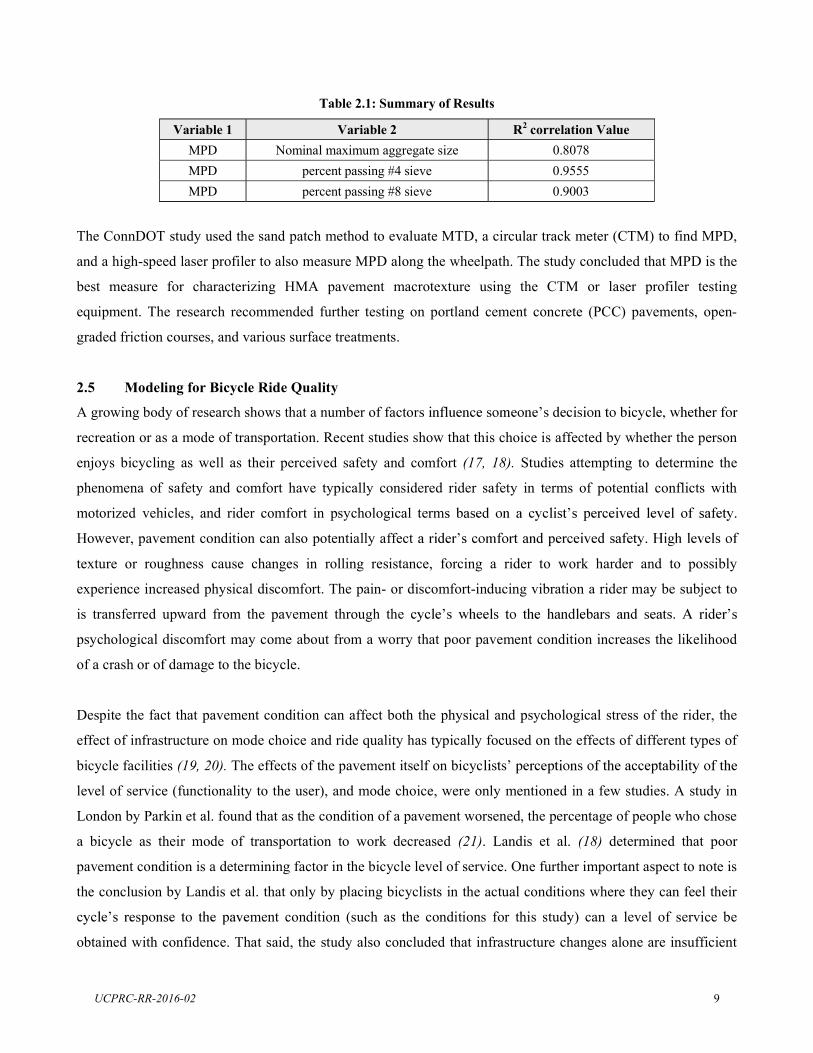
Table 2.1: Summary of Results
Variable 1 Variable 2 R2 correlation Value MPD Nominal maximum aggregate size 0.8078 MPD percent passing #4 sieve 0.9555 MPD percent passing #8 sieve 0.9003
The ConnDOT study used the sand patch method to evaluate MTD, a circular track meter (CTM) to find MPD,
and a high-speed laser profiler to also measure MPD along the wheelpath. The study concluded that MPD is the
best measure for characterizing HMA pavement macrotexture using the CTM or laser profiler testing
equipment. The research recommended further testing on portland cement concrete (PCC) pavements, open-
graded friction courses, and various surface treatments.
2.5 Modeling for Bicycle Ride Quality
A growing body of research shows that a number of factor
recreation or as a mode of transportation. Recent studies show that this choice is affected by whether the person
enjoys bicycling as well as their perceived safety and comfort (17, 18). Studies attempting to determine the
phenomena of safety and comfort have typically considered rider safety in terms of potential conflicts with
motorized vehicles, and rider comfort in psychological term
However, pavement condition can also potentially affect
texture or roughness cause changes in rolling resistance, forcing a rider to work harder and to possibly
experience increased physical discomfort. The pain- or discomfort-inducing vibration a rider may be subject to
is transferred upward from the pavement through the
psychological discomfort may come about from a worry that poor pavement condition increases the likelihood
of a crash or of damage to the bicycle.
Despite the fact that pavement condition can affect both the physical and psychological stress of the rider, the
effect of infrastructure on mode choice and ride quality has typically focused on the effects of different types of
bicycle facilities (19, 20). The effects of the pavement itself on bicyc
level of service (functionality to the user), and mode choice, were only mentioned in a few studies. A study in
London by Parkin et al. found that as the condition of a pavement worsened, the percentage of people who chose
a bicycle as their mode of transportation to work decreased (21). Landis et al. (18) determined that poor
pavement condition is a determining factor in the bicycle level of service. One further important aspect to note is
the conclusion by Landis et al. that only by placing bicyclists in the actual conditions where they can feel their
ment condition (such as the conditions for this study) can a level of service be
obtained with confidence. That said, the study also concluded that infrastructure changes alone are insufficient
UCPRC-RR-2016-02 9
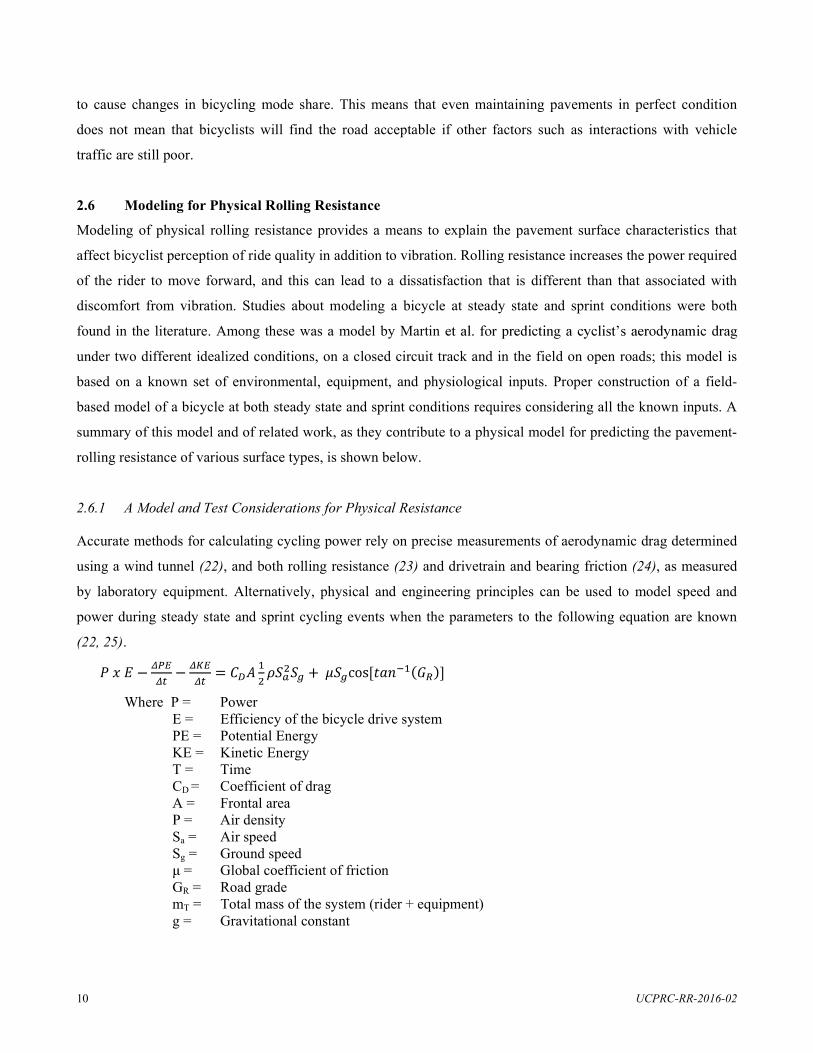
to cause changes in bicycling mode share. This means that even maintaining pavements in perfect condition
does not mean that bicyclists will find the road acceptable if other factors such as interactions with vehicle
traffic are still poor.
2.6 Modeling for Physical Rolling Resistance
Modeling of physical rolling resistance provides a means to explain the pavement surface characteristics that
affect bicyclist perception of ride quality in addition to vibration. Rolling resistance increases the power required
of the rider to move forward, and this can lead to a dissatisfaction that is different than that associated with
discomfort from vibration. Studies about modeling a bicycle at steady state and sprint conditions were both
found in the literature. Among these was a model by Martin
under two different idealized conditions, on a closed circuit track and in the field on open roads; this model is
based on a known set of environmental, equipment, and physiological inputs. Proper construction of a field-
based model of a bicycle at both steady state and sprint conditions requires considering all the known inputs. A
summary of this model and of related work, as they contribute to a physical model for predicting the pavement-
rolling resistance of various surface types, is shown below.
2.6.1 A Model and Test Considerations for Physical Resistance
Accurate methods for calculating cycling power rely on precise measurements of aerodynamic drag determined
using a wind tunnel (22), and both rolling resistance (23) and drivetrain and bearing friction (24), as measured
by laboratory equipment. Alternatively, physical and engineering principles can be used to model speed and
power during steady state and sprint cycling events when the parameters to the following equation are known
(22, 25).
Where P = Power E = Efficiency of the bicycle drive system PE = Potential Energy KE = Kinetic Energy T = Time CD = Coefficient of drag A = Frontal area
= Air density Sa = Air speed Sg = Ground speed
= Global coefficient of friction GR = Road grade mT = Total mass of the system (rider + equipment) g = Gravitational constant
UCPRC-RR-2016-02 10
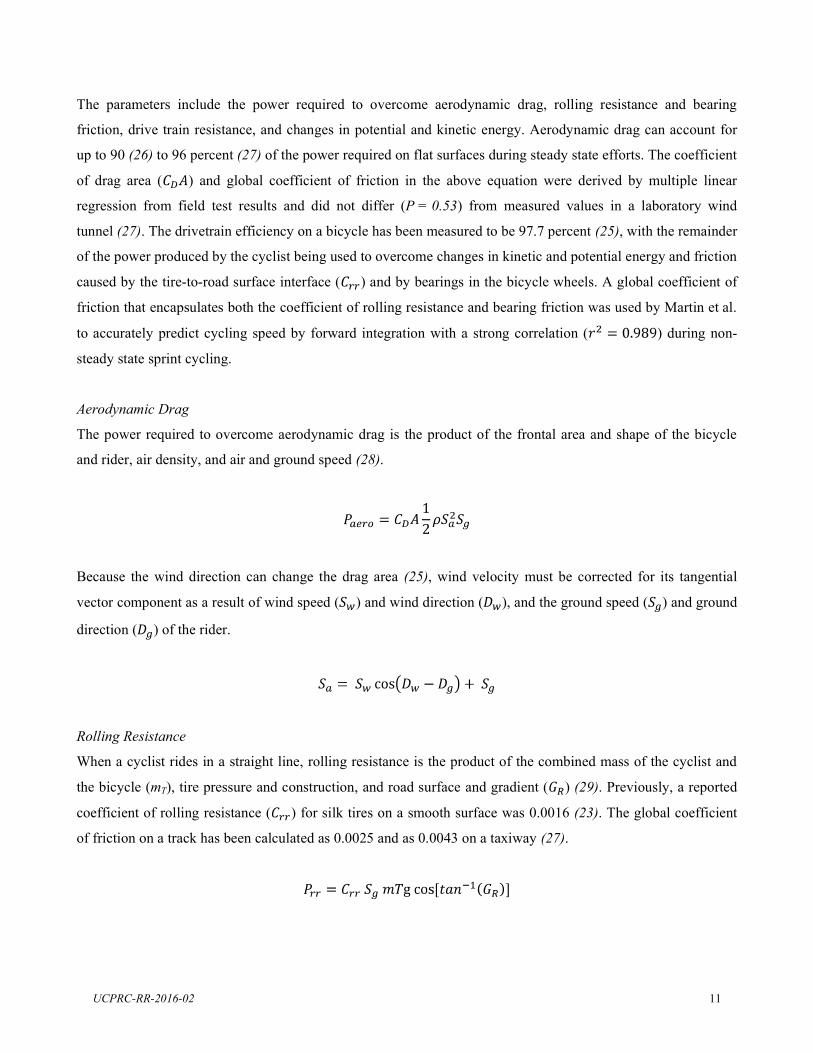
The parameters include the power required to overcome aerodynamic drag, rolling resistance and bearing
friction, drive train resistance, and changes in potential and kinetic energy. Aerodynamic drag can account for
up to 90 (26) to 96 percent (27) of the power required on flat surfaces during steady state efforts. The coefficient
of drag area ( ) and global coefficient of friction in the above equation were derived by multiple linear
regression from field test results and did not differ (P = 0.53) from measured values in a laboratory wind
tunnel (27). The drivetrain efficiency on a bicycle has been measured to be 97.7 percent (25), with the remainder
of the power produced by the cyclist being used to overcome changes in kinetic and potential energy and friction
caused by the tire-to-road surface interface ( ) and by bearings in the bicycle wheels. A global coefficient of
friction that encapsulates both the coefficient of rolling resistance and bearing friction was used by Martin et al.
to accurately predict cycling speed by forward integration with a strong correlation ( ) during non-
steady state sprint cycling.
Aerodynamic Drag
The power required to overcome aerodynamic drag is the product of the frontal area and shape of the bicycle
and rider, air density, and air and ground speed (28).
Because the wind direction can change the drag area (25), wind velocity must be corrected for its tangential
vector component as a result of wind speed ( ) and wind direction ( ), and the ground speed ( ) and ground
direction ( ) of the rider.
Rolling Resistance
When a cyclist rides in a straight line, rolling resistance is the product of the combined mass of the cyclist and
the bicycle (mT), tire pressure and construction, and road surface and gradient ( ) (29). Previously, a reported
coefficient of rolling resistance ( ) for silk tires on a smooth surface was 0.0016 (23). The global coefficient
of friction on a track has been calculated as 0.0025 and as 0.0043 on a taxiway (27).
UCPRC-RR-2016-02 11
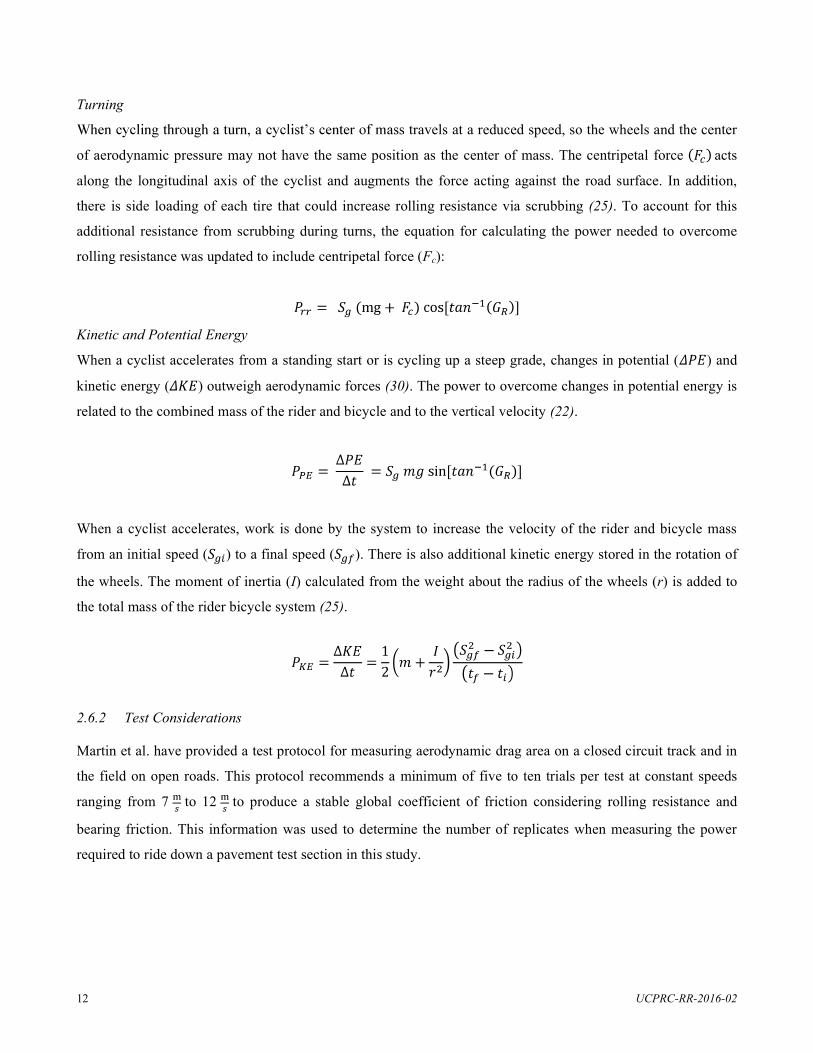
Turning
travels at a reduced speed, so the wheels and the center
of aerodynamic pressure may not have the same position as the center of mass. The centripetal force acts
along the longitudinal axis of the cyclist and augments the force acting against the road surface. In addition,
there is side loading of each tire that could increase rolling resistance via scrubbing (25). To account for this
additional resistance from scrubbing during turns, the equation for calculating the power needed to overcome
rolling resistance was updated to include centripetal force (Fc):
Kinetic and Potential Energy
When a cyclist accelerates from a standing start or is cycling up a steep grade, changes in potential ( ) and
kinetic energy ( ) outweigh aerodynamic forces (30). The power to overcome changes in potential energy is
related to the combined mass of the rider and bicycle and to the vertical velocity (22).
( )
When a cyclist accelerates, work is done by the system to increase the velocity of the rider and bicycle mass
from an initial speed to a final speed ( ). There is also additional kinetic energy stored in the rotation of
the wheels. The moment of inertia (I) calculated from the weight about the radius of the wheels (r) is added to
the total mass of the rider bicycle system (25).
2.6.2 Test Considerations
Martin et al. have provided a test protocol for measuring aerodynamic drag area on a closed circuit track and in
the field on open roads. This protocol recommends a minimum of five to ten trials per test at constant speeds
ranging from 7 to 12 to produce a stable global coefficient of friction considering rolling resistance and
bearing friction. This information was used to determine the number of replicates when measuring the power
required to ride down a pavement test section in this study.
UCPRC-RR-2016-02 12
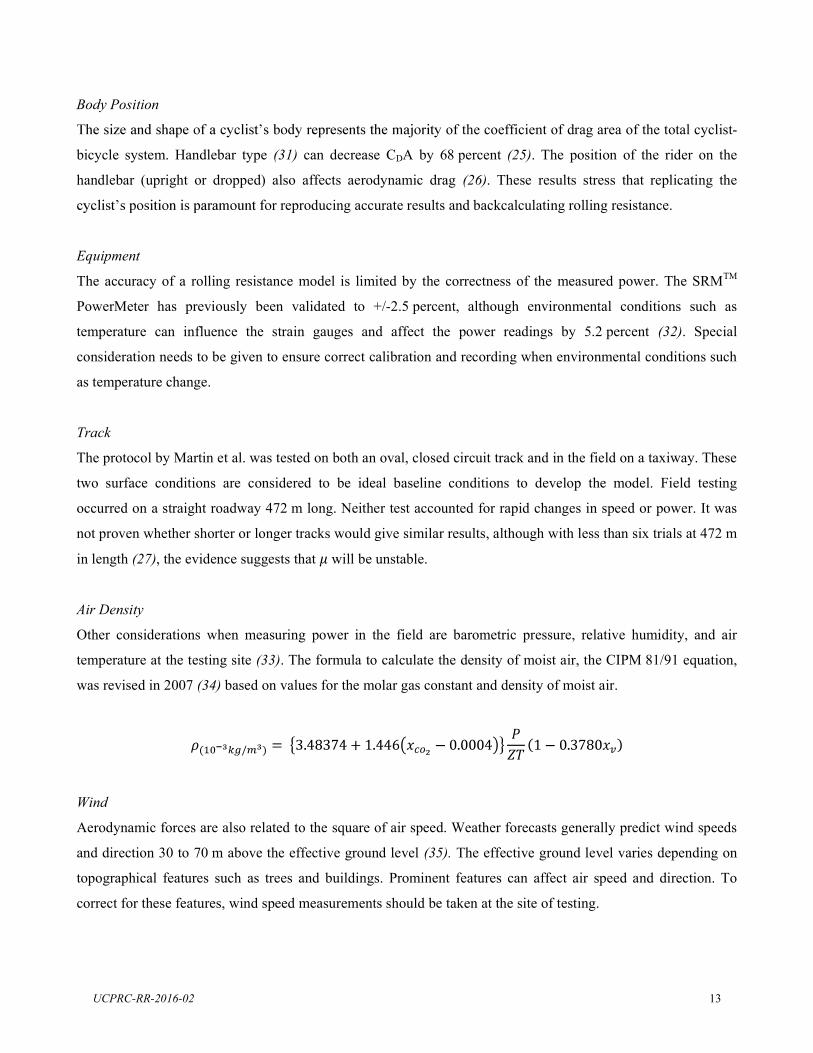
Body Position
of the coefficient of drag area of the total cyclist-
bicycle system. Handlebar type (31) can decrease CDA by 68 percent (25). The position of the rider on the
handlebar (upright or dropped) also affects aerodynamic drag (26). These results stress that replicating the
r reproducing accurate results and backcalculating rolling resistance.
Equipment
The accuracy of a rolling resistance model is limited by the correctness of the measured power. The SRMTM
PowerMeter has previously been validated to +/-2.5 percent, although environmental conditions such as
temperature can influence the strain gauges and affect the power readings by 5.2 percent (32). Special
consideration needs to be given to ensure correct calibration and recording when environmental conditions such
as temperature change.
Track
The protocol by Martin et al. was tested on both an oval, closed circuit track and in the field on a taxiway. These
two surface conditions are considered to be ideal baseline conditions to develop the model. Field testing
occurred on a straight roadway 472 m long. Neither test accounted for rapid changes in speed or power. It was
not proven whether shorter or longer tracks would give similar results, although with less than six trials at 472 m
in length (27), the evidence suggests that will be unstable.
Air Density
Other considerations when measuring power in the field are barometric pressure, relative humidity, and air
temperature at the testing site (33). The formula to calculate the density of moist air, the CIPM 81/91 equation,
was revised in 2007 (34) based on values for the molar gas constant and density of moist air.
Wind
Aerodynamic forces are also related to the square of air speed. Weather forecasts generally predict wind speeds
and direction 30 to 70 m above the effective ground level (35). The effective ground level varies depending on
topographical features such as trees and buildings. Prominent features can affect air speed and direction. To
correct for these features, wind speed measurements should be taken at the site of testing.
UCPRC-RR-2016-02 13

Summary
To date, no one has measured the bicycle rolling resistance values of the surface treatments (different types of
chip seals, microsurfacings, slurry seals, cape seals) used on California state highways. The aerodynamic drag
aerodynamics and efficiency and was followed in this study when measuring the influence of pavement on
bicycle power requirements. These protocols can be applie
baseline asphalt pavement road and to backcalculate relative rolling resistance values for pavements with
various surface treatments.
UCPRC-RR-2016-02 14
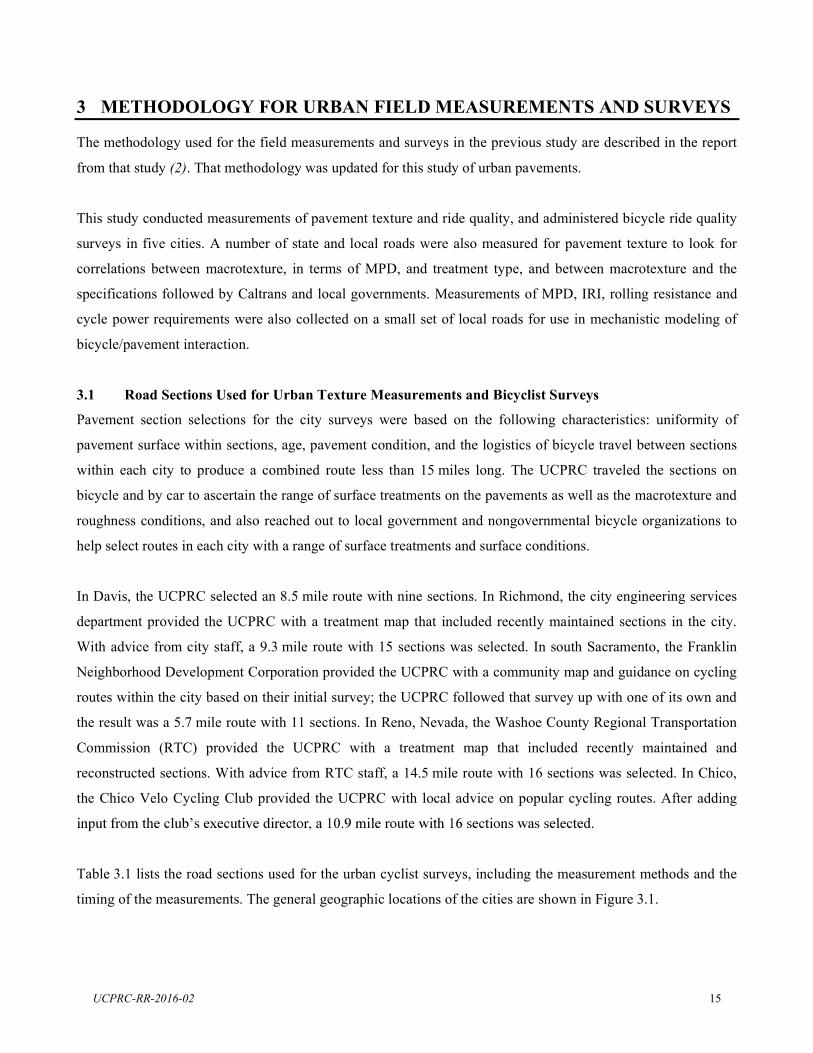
3 METHODOLOGY FOR URBAN FIELD MEASUREMENTS AND SURVEYS
The methodology used for the field measurements and surveys in the previous study are described in the report
from that study (2). That methodology was updated for this study of urban pavements.
This study conducted measurements of pavement texture and ride quality, and administered bicycle ride quality
surveys in five cities. A number of state and local roads were also measured for pavement texture to look for
correlations between macrotexture, in terms of MPD, and treatment type, and between macrotexture and the
specifications followed by Caltrans and local governments. Measurements of MPD, IRI, rolling resistance and
cycle power requirements were also collected on a small set of local roads for use in mechanistic modeling of
bicycle/pavement interaction.
3.1 Road Sections Used for Urban Texture Measurements and Bicyclist Surveys
Pavement section selections for the city surveys were based on the following characteristics: uniformity of
pavement surface within sections, age, pavement condition, and the logistics of bicycle travel between sections
within each city to produce a combined route less than 15 miles long. The UCPRC traveled the sections on
bicycle and by car to ascertain the range of surface treatments on the pavements as well as the macrotexture and
roughness conditions, and also reached out to local government and nongovernmental bicycle organizations to
help select routes in each city with a range of surface treatments and surface conditions.
In Davis, the UCPRC selected an 8.5 mile route with nine sections. In Richmond, the city engineering services
department provided the UCPRC with a treatment map that included recently maintained sections in the city.
With advice from city staff, a 9.3 mile route with 15 sections was selected. In south Sacramento, the Franklin
Neighborhood Development Corporation provided the UCPRC with a community map and guidance on cycling
routes within the city based on their initial survey; the UCPRC followed that survey up with one of its own and
the result was a 5.7 mile route with 11 sections. In Reno, Nevada, the Washoe County Regional Transportation
Commission (RTC) provided the UCPRC with a treatment map that included recently maintained and
reconstructed sections. With advice from RTC staff, a 14.5 mile route with 16 sections was selected. In Chico,
the Chico Velo Cycling Club provided the UCPRC with local advice on popular cycling routes. After adding
Table 3.1 lists the road sections used for the urban cyclist surveys, including the measurement methods and the
timing of the measurements. The general geographic locations of the cities are shown in Figure 3.1.
UCPRC-RR-2016-02 15

3.2 Summary of Urban Pavement Sections for Bicyclist Surveys
With the permission of the UC Davis Institutional Research Board (IRB) administration, which reviews
protocols for studies involving human subjects, on-road surveys of bicycle ride quality and surveys of
demographics, bicycling habits, and bicycle set-up were conducted in each of the cities. Table 3.2 lists the
number of cyclists surveyed, the number of sections they surveyed, and the number observations obtained in the
study.
UCPRC-RR-2016-02 16

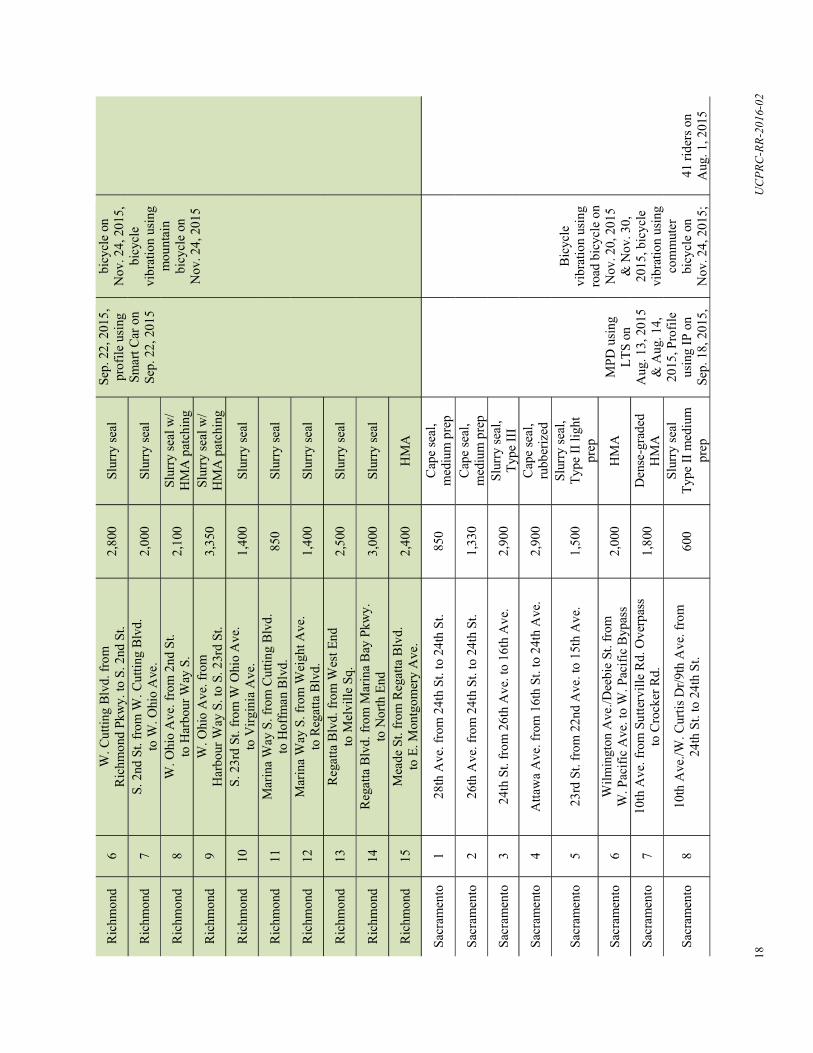
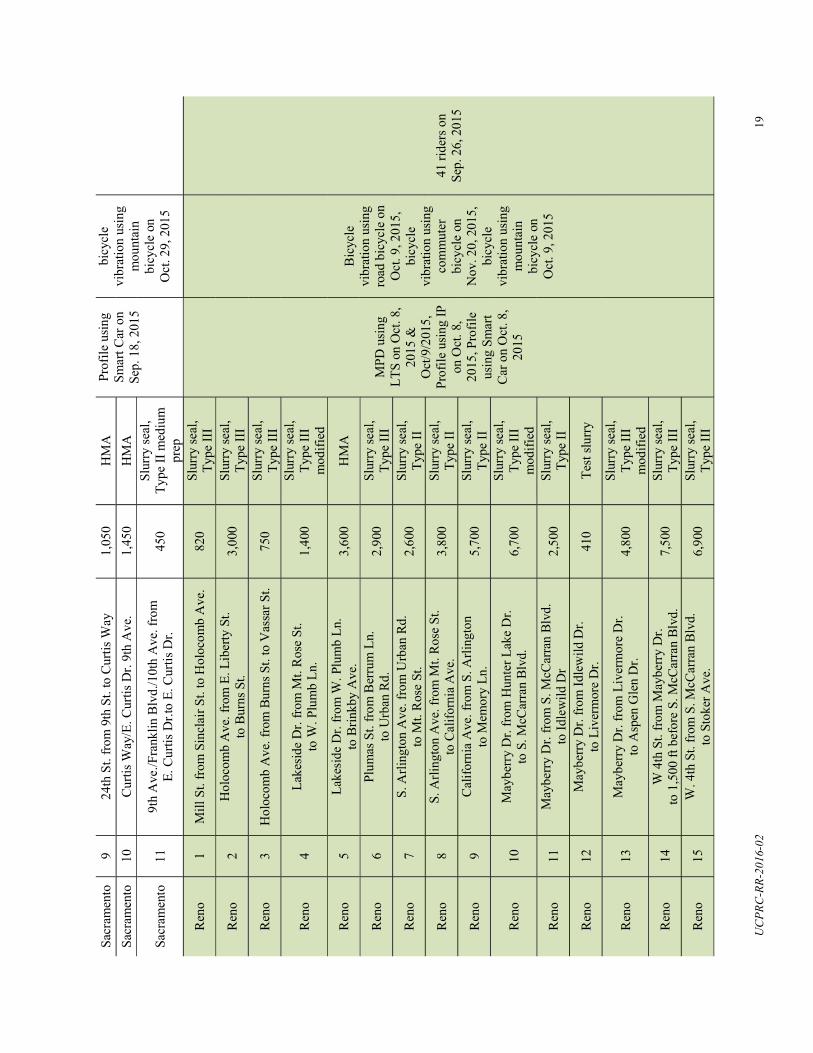
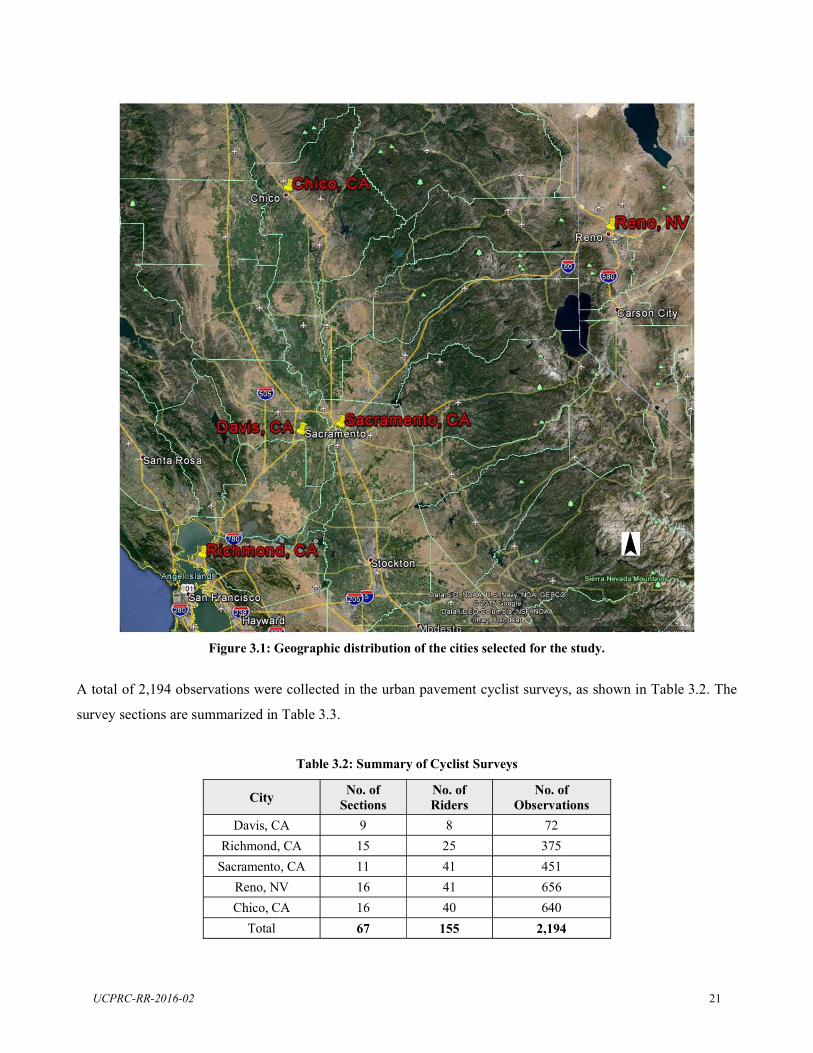
Figure 3.1: Geographic distribution of the cities selected for the study.
A total of 2,194 observations were collected in the urban pavement cyclist surveys, as shown in Table 3.2. The
survey sections are summarized in Table 3.3.
Table 3.2: Summary of Cyclist Surveys
City No. of Sections
No. of Riders
No. of Observations
Davis, CA 9 8 72 Richmond, CA 15 25 375
Sacramento, CA 11 41 451 Reno, NV 16 41 656 Chico, CA 16 40 640
Total 67 155 2,194
UCPRC-RR-2016-02 21
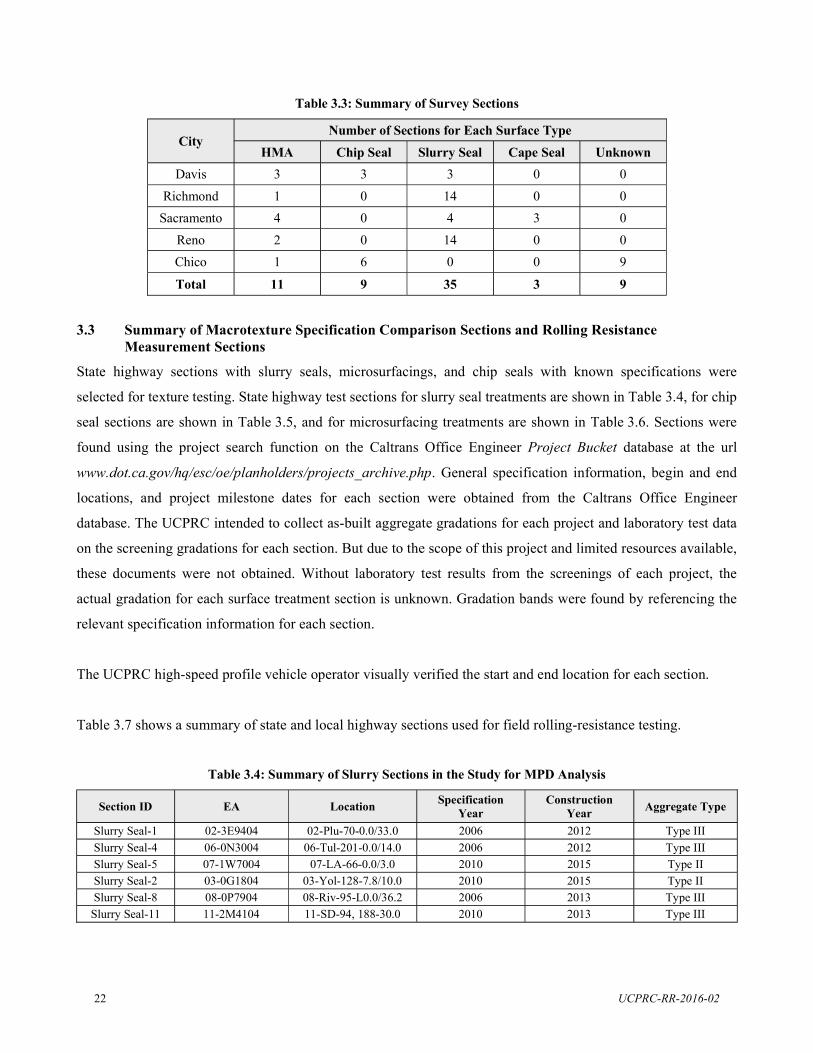
Table 3.3: Summary of Survey Sections
City Number of Sections for Each Surface Type
HMA Chip Seal Slurry Seal Cape Seal Unknown Davis 3 3 3 0 0
Richmond 1 0 14 0 0 Sacramento 4 0 4 3 0
Reno 2 0 14 0 0 Chico 1 6 0 0 9
Total 11 9 35 3 9
3.3 Summary of Macrotexture Specification Comparison Sections and Rolling Resistance Measurement Sections
State highway sections with slurry seals, microsurfacings, and chip seals with known specifications were
selected for texture testing. State highway test sections for slurry seal treatments are shown in Table 3.4, for chip
seal sections are shown in Table 3.5, and for microsurfacing treatments are shown in Table 3.6. Sections were
found using the project search function on the Caltrans Office Engineer Project Bucket database at the url
www.dot.ca.gov/hq/esc/oe/planholders/projects_archive.php. General specification information, begin and end
locations, and project milestone dates for each section were obtained from the Caltrans Office Engineer
database. The UCPRC intended to collect as-built aggregate gradations for each project and laboratory test data
on the screening gradations for each section. But due to the scope of this project and limited resources available,
these documents were not obtained. Without laboratory test results from the screenings of each project, the
actual gradation for each surface treatment section is unknown. Gradation bands were found by referencing the
relevant specification information for each section.
The UCPRC high-speed profile vehicle operator visually verified the start and end location for each section.
Table 3.7 shows a summary of state and local highway sections used for field rolling-resistance testing.
Table 3.4: Summary of Slurry Sections in the Study for MPD Analysis
Section ID EA Location Specification Year
Construction Year Aggregate Type
Slurry Seal-1 02-3E9404 02-Plu-70-0.0/33.0 2006 2012 Type III Slurry Seal-4 06-0N3004 06-Tul-201-0.0/14.0 2006 2012 Type III Slurry Seal-5 07-1W7004 07-LA-66-0.0/3.0 2010 2015 Type II Slurry Seal-2 03-0G1804 03-Yol-128-7.8/10.0 2010 2015 Type II Slurry Seal-8 08-0P7904 08-Riv-95-L0.0/36.2 2006 2013 Type III
Slurry Seal-11 11-2M4104 11-SD-94, 188-30.0 2010 2013 Type III
UCPRC-RR-2016-02 22
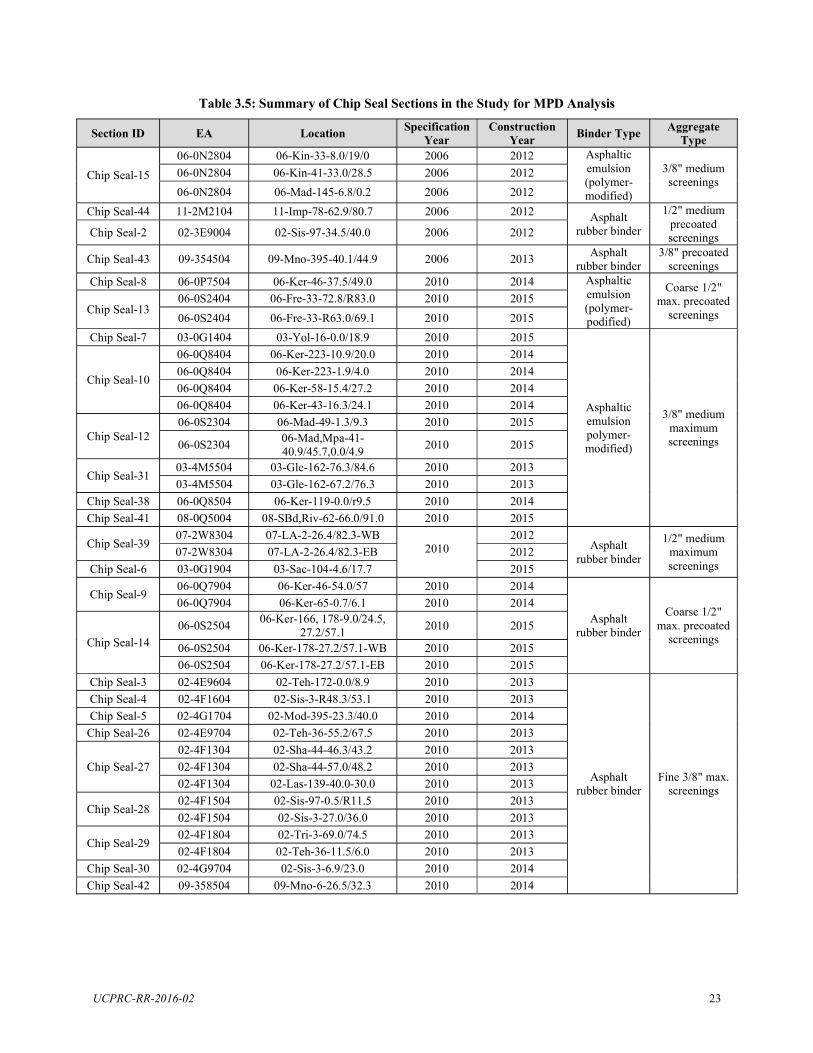
Section ID EA Location Specification Year
Construction Year Binder Type Aggregate
Type
Chip Seal-15 06-0N2804 06-Kin-33-8.0/19/0 2006 2012 Asphaltic
emulsion (polymer-modified)
3/8" medium screenings
06-0N2804 06-Kin-41-33.0/28.5 2006 2012 06-0N2804 06-Mad-145-6.8/0.2 2006 2012
Chip Seal-44 11-2M2104 11-Imp-78-62.9/80.7 2006 2012 Asphalt rubber binder
1/2" medium precoated screenings Chip Seal-2 02-3E9004 02-Sis-97-34.5/40.0 2006 2012
Chip Seal-43 09-354504 09-Mno-395-40.1/44.9 2006 2013 Asphalt rubber binder
3/8" precoated screenings
Chip Seal-8 06-0P7504 06-Ker-46-37.5/49.0 2010 2014 Asphaltic emulsion (polymer-podified)
Coarse 1/2" max. precoated
screenings Chip Seal-13 06-0S2404 06-Fre-33-72.8/R83.0 2010 2015 06-0S2404 06-Fre-33-R63.0/69.1 2010 2015
Chip Seal-7 03-0G1404 03-Yol-16-0.0/18.9 2010 2015
Asphaltic emulsion polymer-modified)
3/8" medium maximum screenings
Chip Seal-10
06-0Q8404 06-Ker-223-10.9/20.0 2010 2014 06-0Q8404 06-Ker-223-1.9/4.0 2010 2014 06-0Q8404 06-Ker-58-15.4/27.2 2010 2014 06-0Q8404 06-Ker-43-16.3/24.1 2010 2014
Chip Seal-12 06-0S2304 06-Mad-49-1.3/9.3 2010 2015
06-0S2304 06-Mad,Mpa-41-40.9/45.7,0.0/4.9 2010 2015
Chip Seal-31 03-4M5504 03-Gle-162-76.3/84.6 2010 2013 03-4M5504 03-Gle-162-67.2/76.3 2010 2013
Chip Seal-38 06-0Q8504 06-Ker-119-0.0/r9.5 2010 2014 Chip Seal-41 08-0Q5004 08-SBd,Riv-62-66.0/91.0 2010 2015
Chip Seal-39 07-2W8304 07-LA-2-26.4/82.3-WB
2010 2012
Asphalt rubber binder
1/2" medium maximum screenings
07-2W8304 07-LA-2-26.4/82.3-EB 2012 Chip Seal-6 03-0G1904 03-Sac-104-4.6/17.7 2015
Chip Seal-9 06-0Q7904 06-Ker-46-54.0/57 2010 2014
Asphalt rubber binder
Coarse 1/2" max. precoated
screenings
06-0Q7904 06-Ker-65-0.7/6.1 2010 2014
Chip Seal-14 06-0S2504 06-Ker-166, 178-9.0/24.5,
27.2/57.1 2010 2015
06-0S2504 06-Ker-178-27.2/57.1-WB 2010 2015 06-0S2504 06-Ker-178-27.2/57.1-EB 2010 2015
Chip Seal-3 02-4E9604 02-Teh-172-0.0/8.9 2010 2013
Asphalt rubber binder
Fine 3/8" max. screenings
Chip Seal-4 02-4F1604 02-Sis-3-R48.3/53.1 2010 2013 Chip Seal-5 02-4G1704 02-Mod-395-23.3/40.0 2010 2014
Chip Seal-26 02-4E9704 02-Teh-36-55.2/67.5 2010 2013
Chip Seal-27 02-4F1304 02-Sha-44-46.3/43.2 2010 2013 02-4F1304 02-Sha-44-57.0/48.2 2010 2013 02-4F1304 02-Las-139-40.0-30.0 2010 2013
Chip Seal-28 02-4F1504 02-Sis-97-0.5/R11.5 2010 2013 02-4F1504 02-Sis-3-27.0/36.0 2010 2013
Chip Seal-29 02-4F1804 02-Tri-3-69.0/74.5 2010 2013 02-4F1804 02-Teh-36-11.5/6.0 2010 2013
Chip Seal-30 02-4G9704 02-Sis-3-6.9/23.0 2010 2014 Chip Seal-42 09-358504 09-Mno-6-26.5/32.3 2010 2014
Table 3.5: Summary of Chip Seal Sections in the Study for MPD Analysis
UCPRC-RR-2016-02 23
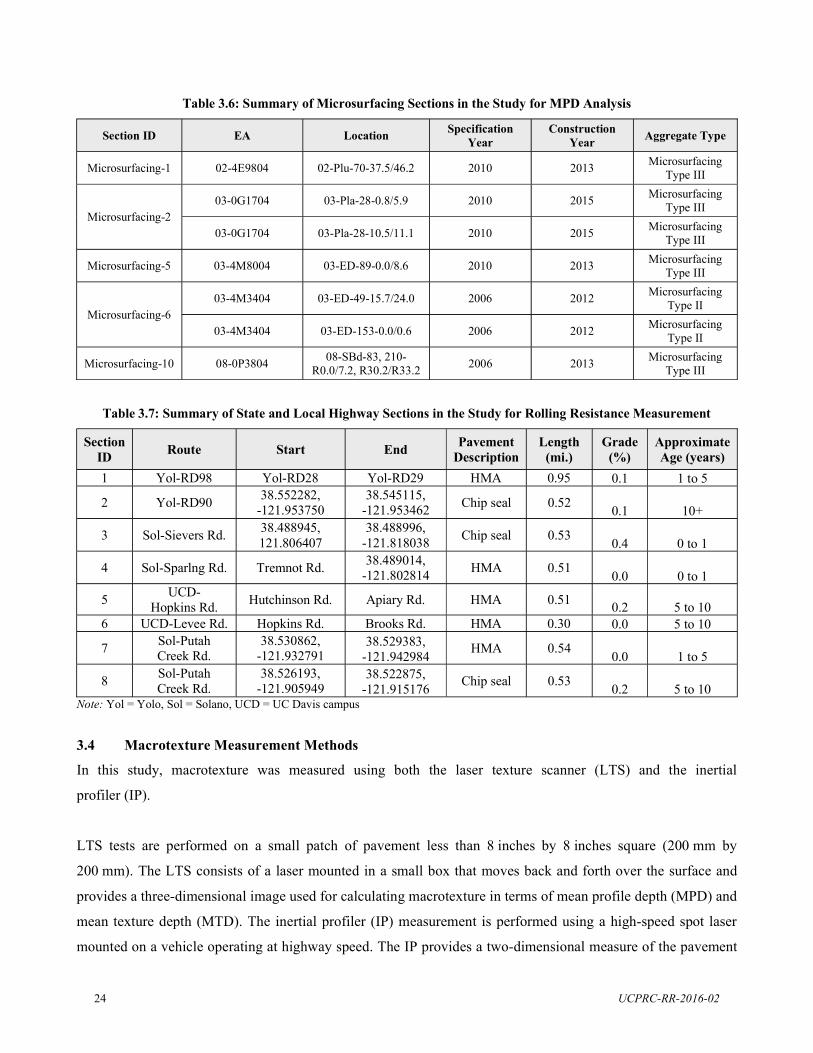
Table 3.6: Summary of Microsurfacing Sections in the Study for MPD Analysis
Section ID EA Location Specification Year
Construction Year Aggregate Type
Microsurfacing-1 02-4E9804 02-Plu-70-37.5/46.2 2010 2013 Microsurfacing Type III
Microsurfacing-2 03-0G1704 03-Pla-28-0.8/5.9 2010 2015 Microsurfacing
Type III
03-0G1704 03-Pla-28-10.5/11.1 2010 2015 Microsurfacing Type III
Microsurfacing-5 03-4M8004 03-ED-89-0.0/8.6 2010 2013 Microsurfacing Type III
Microsurfacing-6 03-4M3404 03-ED-49-15.7/24.0 2006 2012 Microsurfacing
Type II
03-4M3404 03-ED-153-0.0/0.6 2006 2012 Microsurfacing Type II
Microsurfacing-10 08-0P3804 08-SBd-83, 210-R0.0/7.2, R30.2/R33.2 2006 2013 Microsurfacing
Type III
Table 3.7: Summary of State and Local Highway Sections in the Study for Rolling Resistance Measurement
Section ID Route Start End Pavement
Description Length
(mi.) Grade
(%) Approximate Age (years)
1 Yol-RD98 Yol-RD28 Yol-RD29 HMA 0.95 0.1 1 to 5
2 Yol-RD90 38.552282, -121.953750
38.545115, -121.953462 Chip seal 0.52 0.1 10+
3 Sol-Sievers Rd. 38.488945, 121.806407
38.488996, -121.818038 Chip seal 0.53 0.4 0 to 1
4 Sol-Sparlng Rd. Tremnot Rd. 38.489014, -121.802814 HMA 0.51 0.0 0 to 1
5 UCD-Hopkins Rd. Hutchinson Rd. Apiary Rd. HMA 0.51 0.2 5 to 10
6 UCD-Levee Rd. Hopkins Rd. Brooks Rd. HMA 0.30 0.0 5 to 10
7 Sol-Putah Creek Rd.
38.530862, -121.932791
38.529383, -121.942984 HMA 0.54 0.0 1 to 5
8 Sol-Putah Creek Rd.
38.526193, -121.905949
38.522875, -121.915176 Chip seal 0.53 0.2 5 to 10
Note: Yol = Yolo, Sol = Solano, UCD = UC Davis campus
3.4 Macrotexture Measurement Methods
In this study, macrotexture was measured using both the laser texture scanner (LTS) and the inertial
profiler (IP).
LTS tests are performed on a small patch of pavement less than 8 inches by 8 inches square (200 mm by
200 mm). The LTS consists of a laser mounted in a small box that moves back and forth over the surface and
provides a three-dimensional image used for calculating macrotexture in terms of mean profile depth (MPD) and
mean texture depth (MTD). The inertial profiler (IP) measurement is performed using a high-speed spot laser
mounted on a vehicle operating at highway speed. The IP provides a two-dimensional measure of the pavement
UCPRC-RR-2016-02 24
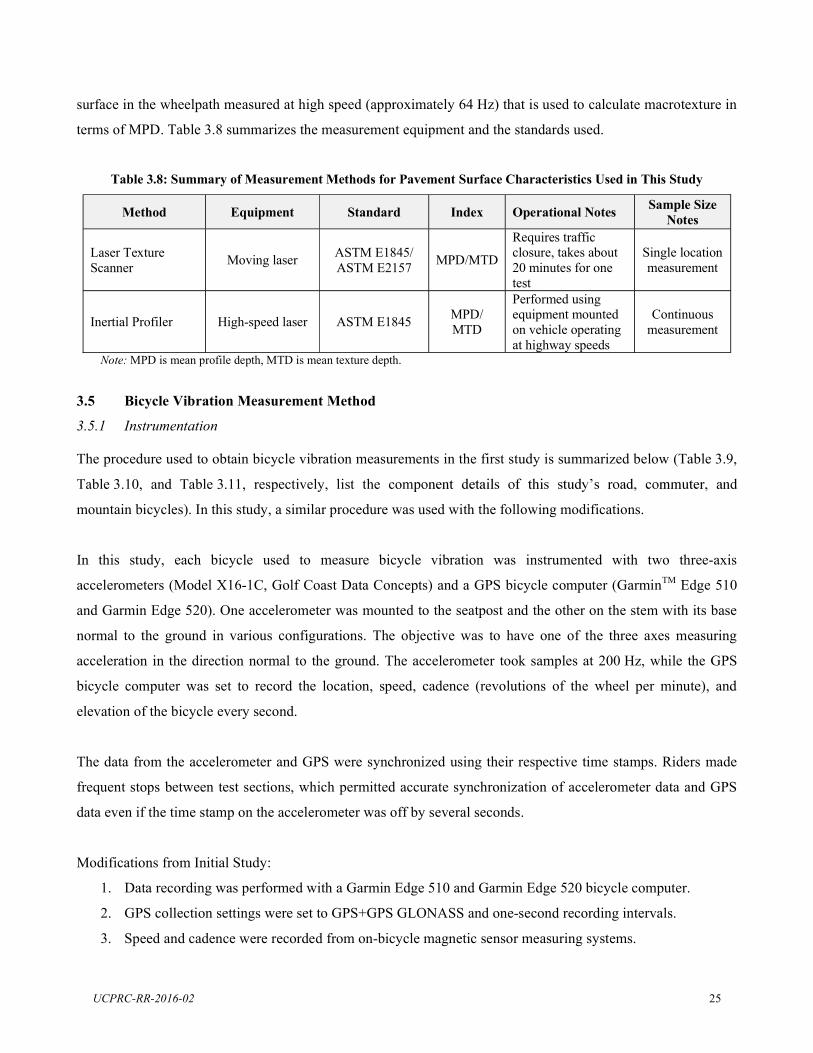
surface in the wheelpath measured at high speed (approximately 64 Hz) that is used to calculate macrotexture in
terms of MPD. Table 3.8 summarizes the measurement equipment and the standards used.
Table 3.8: Summary of Measurement Methods for Pavement Surface Characteristics Used in This Study
Method Equipment Standard Index Operational Notes Sample Size Notes
Laser Texture Scanner Moving laser ASTM E1845/
ASTM E2157 MPD/MTD
Requires traffic closure, takes about 20 minutes for one test
Single location measurement
Inertial Profiler High-speed laser ASTM E1845 MPD/ MTD
Performed using equipment mounted on vehicle operating at highway speeds
Continuous measurement
Note: MPD is mean profile depth, MTD is mean texture depth.
3.5 Bicycle Vibration Measurement Method
3.5.1 Instrumentation
The procedure used to obtain bicycle vibration measurements in the first study is summarized below (Table 3.9,
Table 3.10, and Table 3.11, respectively, list the com
mountain bicycles). In this study, a similar procedure was used with the following modifications.
In this study, each bicycle used to measure bicycle vibration was instrumented with two three-axis
accelerometers (Model X16-1C, Golf Coast Data Concepts) and a GPS bicycle computer (GarminTM Edge 510
and Garmin Edge 520). One accelerometer was mounted to the seatpost and the other on the stem with its base
normal to the ground in various configurations. The objective was to have one of the three axes measuring
acceleration in the direction normal to the ground. The accelerometer took samples at 200 Hz, while the GPS
bicycle computer was set to record the location, speed, cadence (revolutions of the wheel per minute), and
elevation of the bicycle every second.
The data from the accelerometer and GPS were synchronized using their respective time stamps. Riders made
frequent stops between test sections, which permitted accurate synchronization of accelerometer data and GPS
data even if the time stamp on the accelerometer was off by several seconds.
Modifications from Initial Study:
1. Data recording was performed with a Garmin Edge 510 and Garmin Edge 520 bicycle computer.
2. GPS collection settings were set to GPS+GPS GLONASS and one-second recording intervals.
3. Speed and cadence were recorded from on-bicycle magnetic sensor measuring systems.
UCPRC-RR-2016-02 25
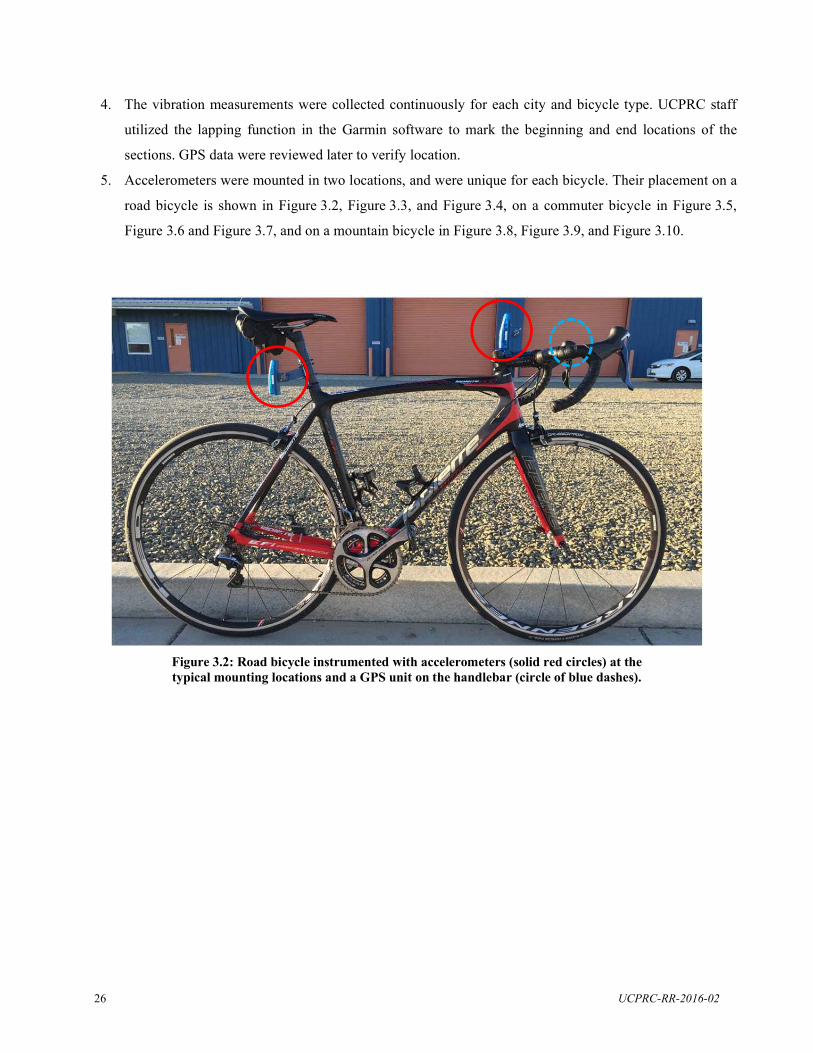
4. The vibration measurements were collected continuously for each city and bicycle type. UCPRC staff
utilized the lapping function in the Garmin software to mark the beginning and end locations of the
sections. GPS data were reviewed later to verify location.
5. Accelerometers were mounted in two locations, and were unique for each bicycle. Their placement on a
road bicycle is shown in Figure 3.2, Figure 3.3, and Figure 3.4, on a commuter bicycle in Figure 3.5,
Figure 3.6 and Figure 3.7, and on a mountain bicycle in Figure 3.8, Figure 3.9, and Figure 3.10.
Figure 3.2: Road bicycle instrumented with accelerometers (solid red circles) at the typical mounting locations and a GPS unit on the handlebar (circle of blue dashes).
UCPRC-RR-2016-02 26
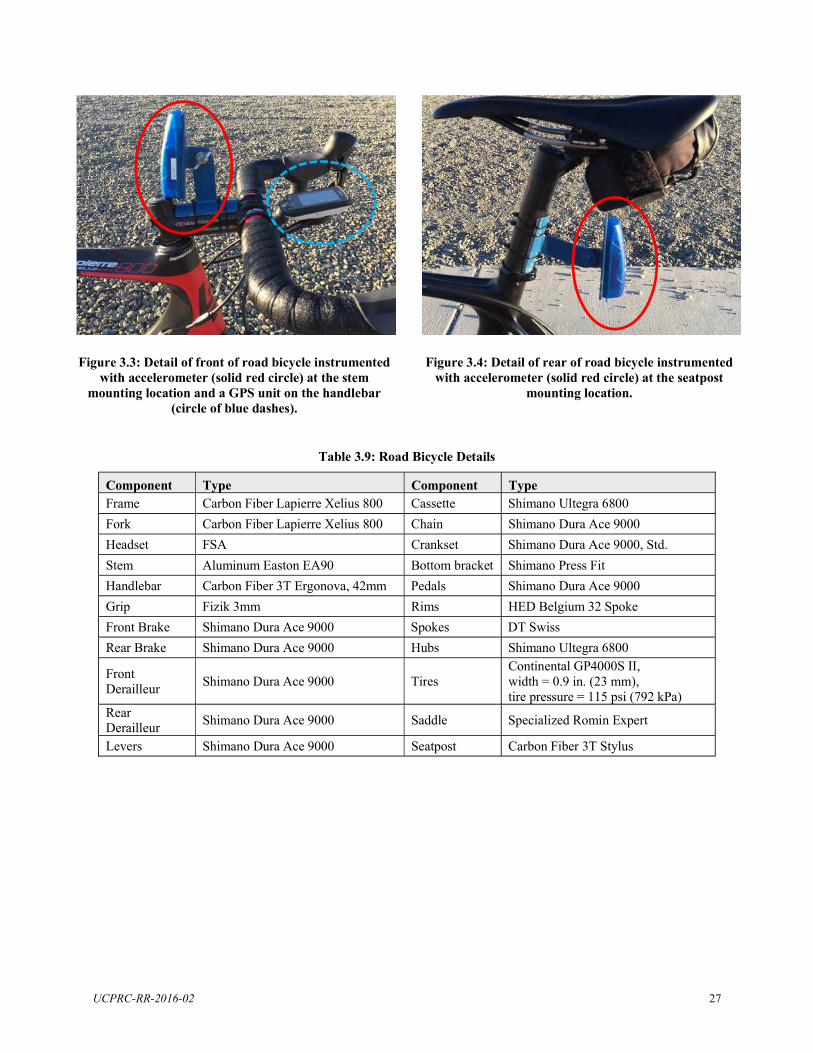
Figure 3.3: Detail of front of road bicycle instrumented with accelerometer (solid red circle) at the stem
mounting location and a GPS unit on the handlebar (circle of blue dashes).
Figure 3.4: Detail of rear of road bicycle instrumented with accelerometer (solid red circle) at the seatpost
mounting location.
Table 3.9: Road Bicycle Details
Component Type Component Type Frame Carbon Fiber Lapierre Xelius 800 Cassette Shimano Ultegra 6800 Fork Carbon Fiber Lapierre Xelius 800 Chain Shimano Dura Ace 9000 Headset FSA Crankset Shimano Dura Ace 9000, Std. Stem Aluminum Easton EA90 Bottom bracket Shimano Press Fit Handlebar Carbon Fiber 3T Ergonova, 42mm Pedals Shimano Dura Ace 9000 Grip Fizik 3mm Rims HED Belgium 32 Spoke Front Brake Shimano Dura Ace 9000 Spokes DT Swiss Rear Brake Shimano Dura Ace 9000 Hubs Shimano Ultegra 6800
Front Derailleur Shimano Dura Ace 9000 Tires
Continental GP4000S II, width = 0.9 in. (23 mm), tire pressure = 115 psi (792 kPa)
Rear Derailleur Shimano Dura Ace 9000 Saddle Specialized Romin Expert
Levers Shimano Dura Ace 9000 Seatpost Carbon Fiber 3T Stylus
UCPRC-RR-2016-02 27
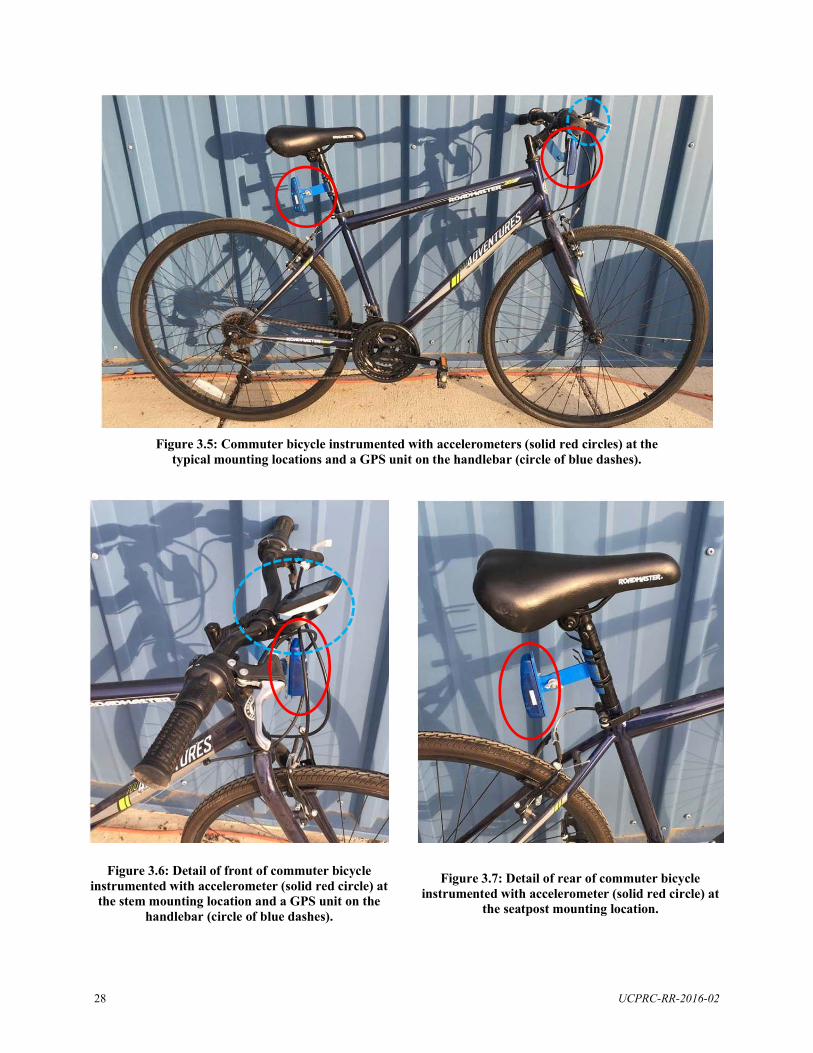
Figure 3.5: Commuter bicycle instrumented with accelerometers (solid red circles) at the typical mounting locations and a GPS unit on the handlebar (circle of blue dashes).
Figure 3.6: Detail of front of commuter bicycle Figure 3.7: Detail of rear of commuter bicycle instrumented with accelerometer (solid red circle) at instrumented with accelerometer (solid red circle) at the stem mounting location and a GPS unit on the the seatpost mounting location. handlebar (circle of blue dashes).
UCPRC-RR-2016-02 28
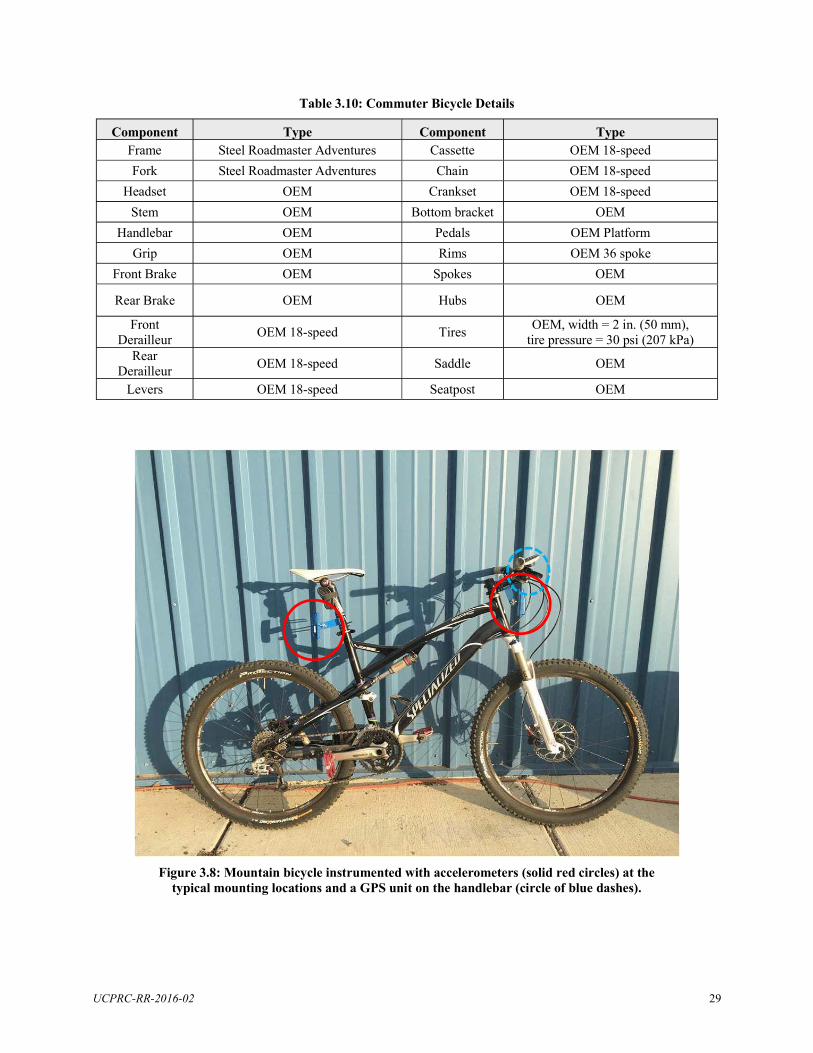
Table 3.10: Commuter Bicycle Details
Component Type Component Type Frame Steel Roadmaster Adventures Cassette OEM 18-speed Fork Steel Roadmaster Adventures Chain OEM 18-speed
Headset OEM Crankset OEM 18-speed Stem OEM Bottom bracket OEM
Handlebar OEM Pedals OEM Platform Grip OEM Rims OEM 36 spoke
Front Brake OEM Spokes OEM
Rear Brake OEM Hubs OEM
Front Derailleur OEM 18-speed Tires OEM, width = 2 in. (50 mm),
tire pressure = 30 psi (207 kPa) Rear
Derailleur OEM 18-speed Saddle OEM
Levers OEM 18-speed Seatpost OEM
Figure 3.8: Mountain bicycle instrumented with accelerometers (solid red circles) at the typical mounting locations and a GPS unit on the handlebar (circle of blue dashes).
UCPRC-RR-2016-02 29
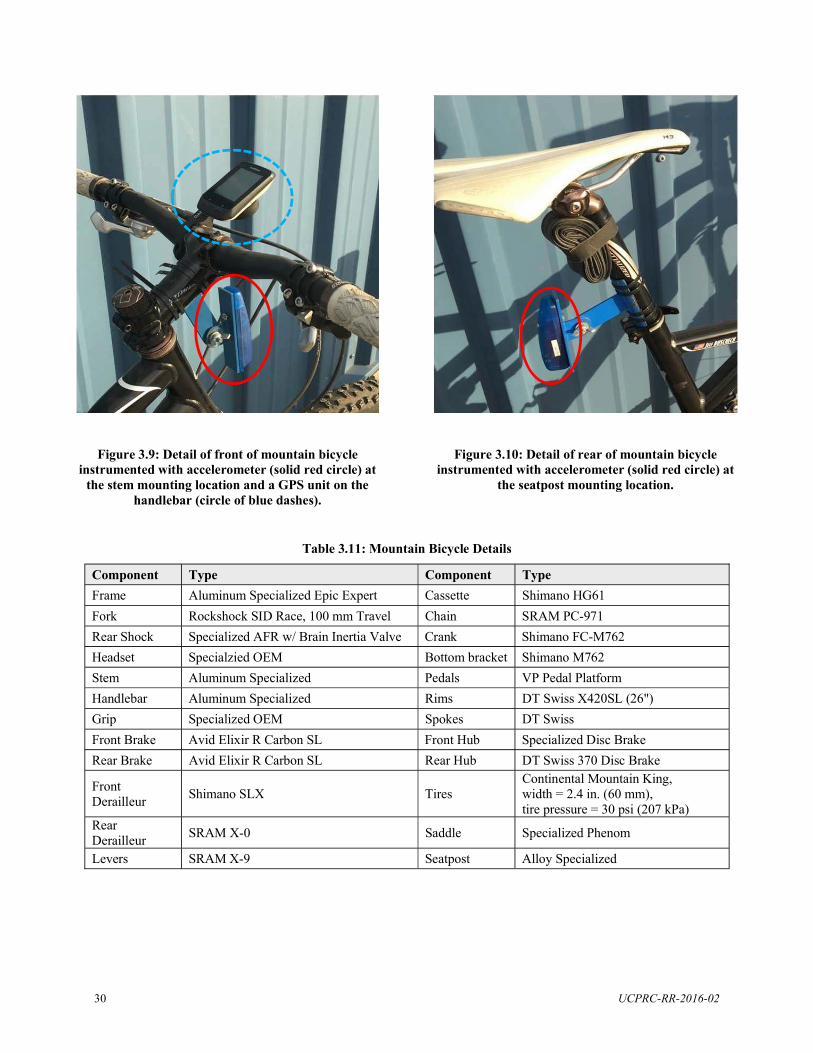
Figure 3.9: Detail of front of mountain bicycle instrumented with accelerometer (solid red circle) at
the stem mounting location and a GPS unit on the handlebar (circle of blue dashes).
Figure 3.10: Detail of rear of mountain bicycle instrumented with accelerometer (solid red circle) at
the seatpost mounting location.
Table 3.11: Mountain Bicycle Details
Component Type Component Type Frame Aluminum Specialized Epic Expert Cassette Shimano HG61 Fork Rockshock SID Race, 100 mm Travel Chain SRAM PC-971 Rear Shock Specialized AFR w/ Brain Inertia Valve Crank Shimano FC-M762 Headset Specialzied OEM Bottom bracket Shimano M762 Stem Aluminum Specialized Pedals VP Pedal Platform Handlebar Aluminum Specialized Rims DT Swiss X420SL (26") Grip Specialized OEM Spokes DT Swiss Front Brake Avid Elixir R Carbon SL Front Hub Specialized Disc Brake Rear Brake Avid Elixir R Carbon SL Rear Hub DT Swiss 370 Disc Brake
Front Derailleur Shimano SLX Tires
Continental Mountain King, width = 2.4 in. (60 mm), tire pressure = 30 psi (207 kPa)
Rear Derailleur SRAM X-0 Saddle Specialized Phenom
Levers SRAM X-9 Seatpost Alloy Specialized
UCPRC-RR-2016-02 30
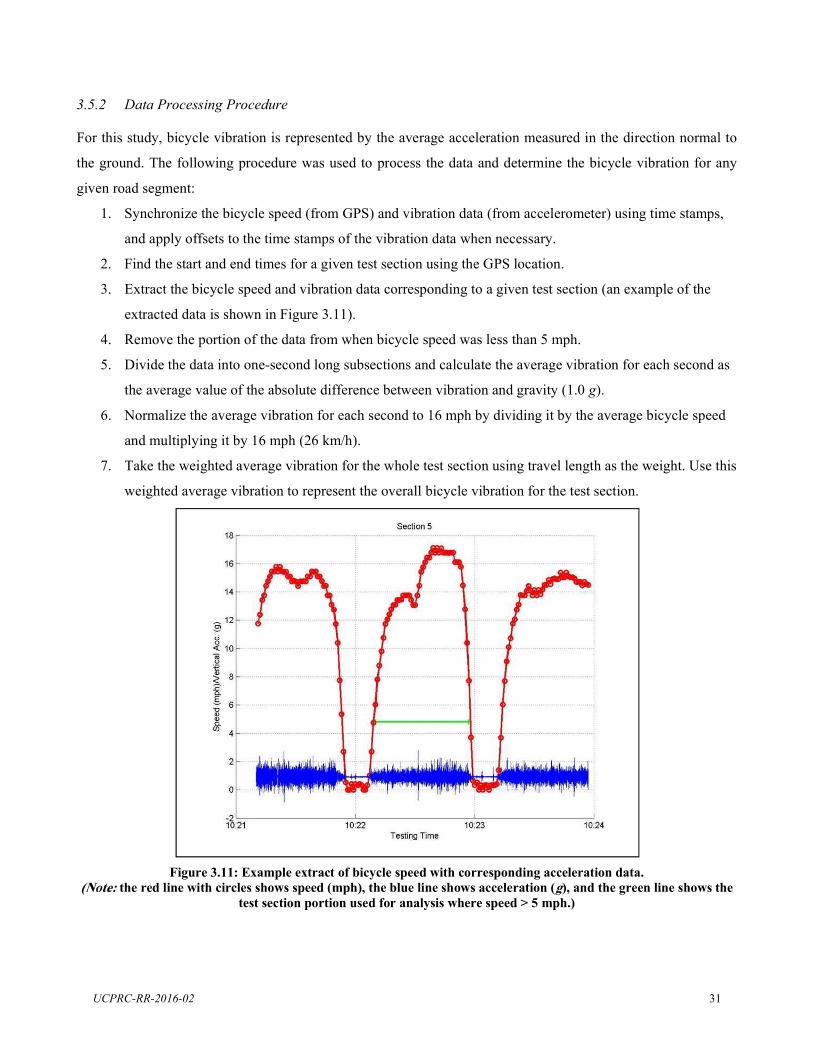
3.5.2 Data Processing Procedure
For this study, bicycle vibration is represented by the average acceleration measured in the direction normal to
the ground. The following procedure was used to process the data and determine the bicycle vibration for any
given road segment:
1. Synchronize the bicycle speed (from GPS) and vibration data (from accelerometer) using time stamps,
and apply offsets to the time stamps of the vibration data when necessary.
2. Find the start and end times for a given test section using the GPS location.
3. Extract the bicycle speed and vibration data corresponding to a given test section (an example of the
extracted data is shown in Figure 3.11).
4. Remove the portion of the data from when bicycle speed was less than 5 mph.
5. Divide the data into one-second long subsections and calculate the average vibration for each second as
the average value of the absolute difference between vibration and gravity (1.0 g).
6. Normalize the average vibration for each second to 16 mph by dividing it by the average bicycle speed
and multiplying it by 16 mph (26 km/h).
7. Take the weighted average vibration for the whole test section using travel length as the weight. Use this
weighted average vibration to represent the overall bicycle vibration for the test section.
Figure 3.11: Example extract of bicycle speed with corresponding acceleration data. the red line with circles shows speed (mph), the blue line shows acceleration ( ), and the green line shows the
test section portion used for analysis where speed > 5 mph.)
UCPRC-RR-2016-02 31
3.5.3 Development of Data Collection
A number of test rides were performed in the first study to evaluate the instrumentation system and develop the
data analysis procedure before it was used for this study. No additional evaluation of the accelerometer
instrumentation system was performed in this study.
3.6 Bicycle Ride Quality Survey Method
3.6.1 Survey Sample of Surface Treatments and Participants
Cyclists were given a survey to examine their experience riding on the urban pavement test sections in Davis,
Richmond, Sacramento, Reno, and Chico on M ay 23, July 18, August 1, September 26, and October 18, 2015,
respectively. The forms used in the
in Ap pendix E. The pre-ride survey asked t he participants demographic questions, such as their age, gender, and
income, as well as questions about their bicycle and typical riding habits. The in-ride survey asked the riders to
rate each section, first in terms of whether they cons
instructions given to define those terms), and second on a scale of 1 to 5 with 1 being the worst possible
condition and 5 being the best. The post-ride survey asked questions similar to those in the pre- and in-ride
surveys, as an aid for interpreting the results. The results of all the surveys and information regarding the
volunteers and survey results are i ncluded in Chapter 4.
The in-ride survey questions and most of the pre- and post-ride survey questions asked in this study were the
same as those asked in the first study, allowing the pooling of response data from both studies for modeling.
Volunteer cyclists were solicited in Davis through email and various social media outlets. Volunteer turnout at
the initial Davis survey was less than expected and mostly consisted of people associated with the university.
A $40 prepaid debit card was offered as an incentive in later surveys to widen the demographics of the people in
the survey. Participants for Richmond, Sacramento, Reno, and Chico were solicited through local agencies and
organizations, Craigslist, email, and various social media outlets. Altogether, 155 volunteers participated in
these urban pavement surveys.
As required by the Institutional Research Board (IRB) of the University of California, Davis, which oversees all
research involving human subjects, this was an anonymous survey and participants were identified only by a
number, except on the liability waiver form, which was separated from the survey before the volunteers
answered any questions.
UCPRC-RR-2016-02 32
3.6.2 Survey Method for City Surveys
Following are the approximate times and the tasks conducted on the days of the urban pavement surveys:
7:30 a.m. UCPRC staff and volunteers meet at start location. 9:00 a.m. Survey riders at survey start location. 9:00 a.m. to 9:30 a.m. Sign in, sign waivers, do first part of survey (pre-ride survey), safety talk, explain testing instructions. 9:30 a.m. to 11:00 a.m. Ride survey route using directions/map provided. Survey routes include 9 to 16 sections, depending on city. At the end of each section, riders stop to fill out in-ride rating form, then continue on to next section. 11:00 a.m. to 12:00 p.m. Survey riders proceed to end location to fill third part of survey (post-ride survey) and collect $40 incentive card (in Richmond, Sacramento, Reno, and Chico).
This entire process took two to three hours depending on the survey route length and survey rider speed.
Riders were given the following verbatim instructions:
1. Riders ride the survey route by following the marked cones, route arrows on the pavement, directions and map provided. Please stay to right side of the road and ride in the bicycle lane when possible.
2. Immediately rate each section (in-ride survey) with the help of UCPRC staff at the end of each section. 3. Once all sections are complete, continue along route to the end location. 4. Fill out the post-ride survey at the end location and proceed to collect $40 incentive prepaid card.
Riders agreed to follow these rules:
a. Ride at your normal speed on each section. b. Complete the in-ride survey form at the end of each section. c. Do NOT discuss your perceptions of the sections during the survey.
3.6.3 Participating Cycling Groups and Road Sections Used in the Survey
The urban pavement surveys were administered to different groups of cyclists at scheduled events coordinated
by the UCPRC in the five cities of interest. The following groups assisted with the survey events:
Richmond: City of Richmond Department of Engineering Services Sacramento: Franklin Neighborhood Development Corporation Reno: Washoe County Regional Transportation Commission and University of Nevada, Reno Department of Civil and Environmental Engineering Chico: Chico Velo Cycling Club and California State University, Chico Department of Civil Engineering
UCPRC-RR-2016-02 33
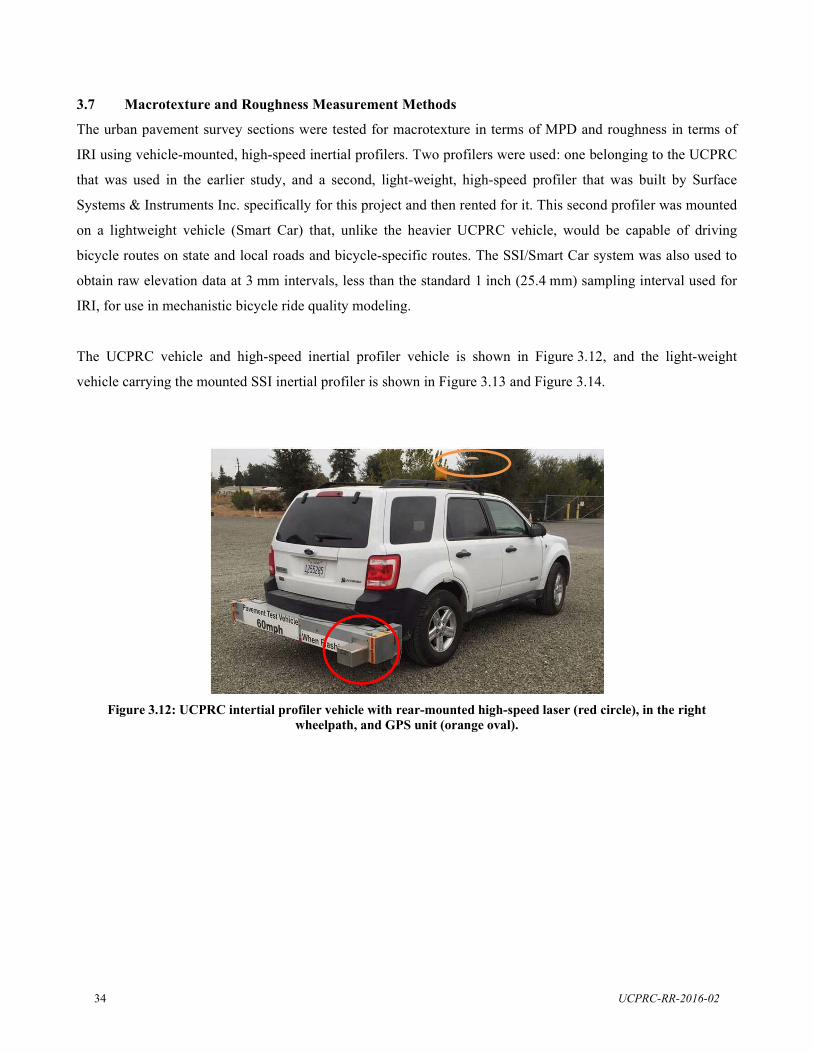
3.7 Macrotexture and Roughness Measurement Methods
The urban pavement survey sections were tested for macrotexture in terms of MPD and roughness in terms of
IRI using vehicle-mounted, high-speed inertial profilers. Two profilers were used: one belonging to the UCPRC
that was used in the earlier study, and a second, light-weight, high-speed profiler that was built by Surface
Systems & Instruments Inc. specifically for this project and then rented for it. This second profiler was mounted
on a lightweight vehicle (Smart Car) that, unlike the heavier UCPRC vehicle, would be capable of driving
bicycle routes on state and local roads and bicycle-specific routes. The SSI/Smart Car system was also used to
obtain raw elevation data at 3 mm intervals, less than the standard 1 inch (25.4 mm) sampling interval used for
IRI, for use in mechanistic bicycle ride quality modeling.
The UCPRC vehicle and high-speed inertial profiler vehicle is shown in Figure 3.12, and the light-weight
vehicle carrying the mounted SSI inertial profiler is shown in Figure 3.13 and Figure 3.14.
Figure 3.12: UCPRC intertial profiler vehicle with rear-mounted high-speed laser (red circle), in the right wheelpath, and GPS unit (orange oval).
UCPRC-RR-2016-02 34
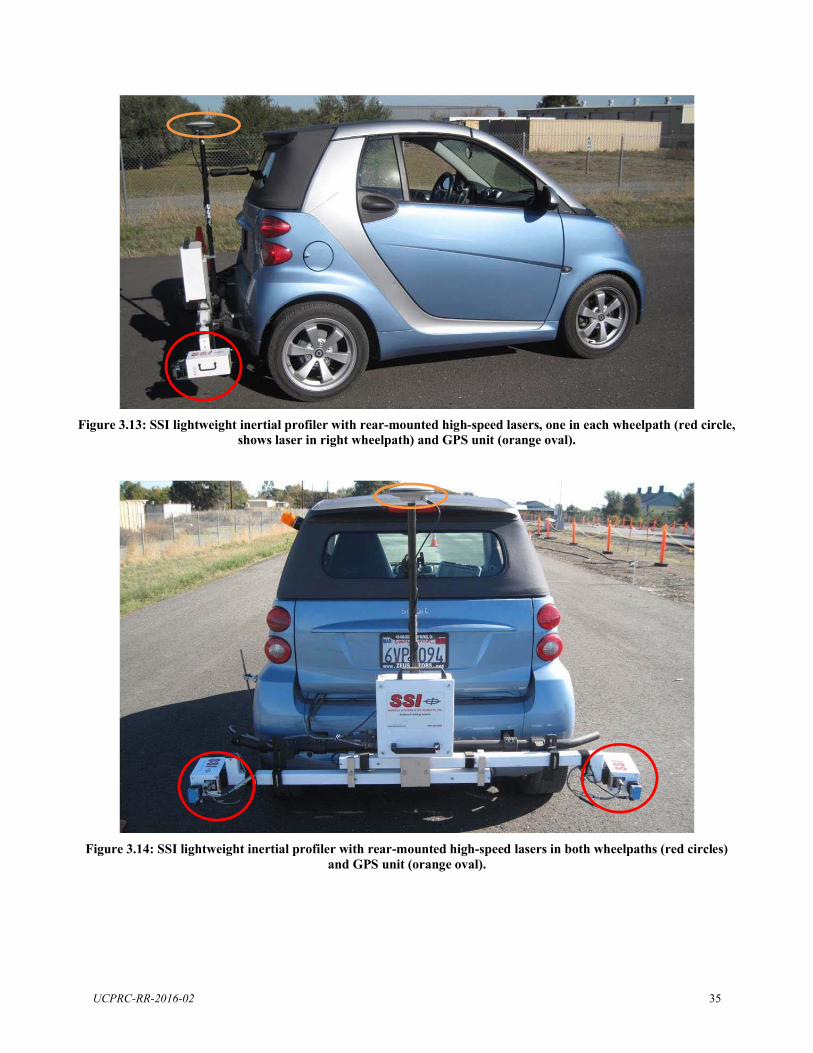
Figure 3.13: SSI lightweight inertial profiler with rear-mounted high-speed lasers, one in each wheelpath (red circle, shows laser in right wheelpath) and GPS unit (orange oval).
Figure 3.14: SSI lightweight inertial profiler with rear-mounted high-speed lasers in both wheelpaths (red circles) and GPS unit (orange oval).
UCPRC-RR-2016-02 35
3.8 Distress Survey Method
A pavement condition survey was performed on all city survey sections in order to correlate pavement
roughness (in IRI) to the extent of distresses found on the pavement. The specific distresses included patching,
utility cuts, and cracking (determined as percent of the bicycle path with cracking: >10 percent, 10 to 50 percent,
>50 percent). In determining the percentage of the bicycle path with cracking, all types of cracking were
considered to be equal. Results of the survey are shown in Appendix E. Bicycle vibration data and distress
survey correlations were performed using data from the inertial profilers.
An initial approach to a bicycle ride quality index (BQRI) was also established for correlating IRI to the percent
of the bicycle path with cracking. The BRQI value was determined by summing the total acceleration events
over a given threshold (2 g, 3 g, or 4 g) and normalizing the sum over the section length. The result, in the unit
events per km (events/km), is used to characterize the index. Correlations were also performed by comparing
rider survey feedback (on a scale of 1 to 5) and BQRI (events/km).
3.9 Methodology for Modeling Bicycle Ride Quality
repeated measures
hierarchical data structure for ride quality (i.e., multiple participant quality scores from multiple segments within
a city). Ride quality was modeled using a multilevel/hierarchical binomial regression model because it matched
the data structure and because these types of models have been shown to increase out-of-sample prediction (36).
A Bayesian analysis framework was chosen to help guard against model overfitting (i.e., modeling noise in the
sample instead of a predictable trend), and because Bayesian pro babilities have simple interpretations that would
help simplify the discussion (37). The R statistical packages rethinking and rstan were used as an interface for
the probabilistic statistical programming l anguage Stan. A No-U-Turn (NUTS) sampler, a form of Hamiltonian
Markov chain Monte Carlo (MCMC), was used to estimate the models (38). The performance of each ride
quality model was com pared through the W idely Applicable Information Criteria (WAIC), a commonly
accepted and suitable performance measure for multilevel models. Like all information criteria, WAIC is a
relative measure based on model deviance, where lower WAIC values indicate greater theoretical out of sample
prediction.
3.10 Methodology for Measuring and Modeling Physical Rolling Resistance
The local road sections to be analyzed for physical rolling-resistance modeling were tested between October
2015 and January 2016. It should be noted that although pavement-rolling resistance was not directly measured
in this part of the study, for the purposes of this report the global coefficient of friction was attributed primarily
UCPRC-RR-2016-02 36
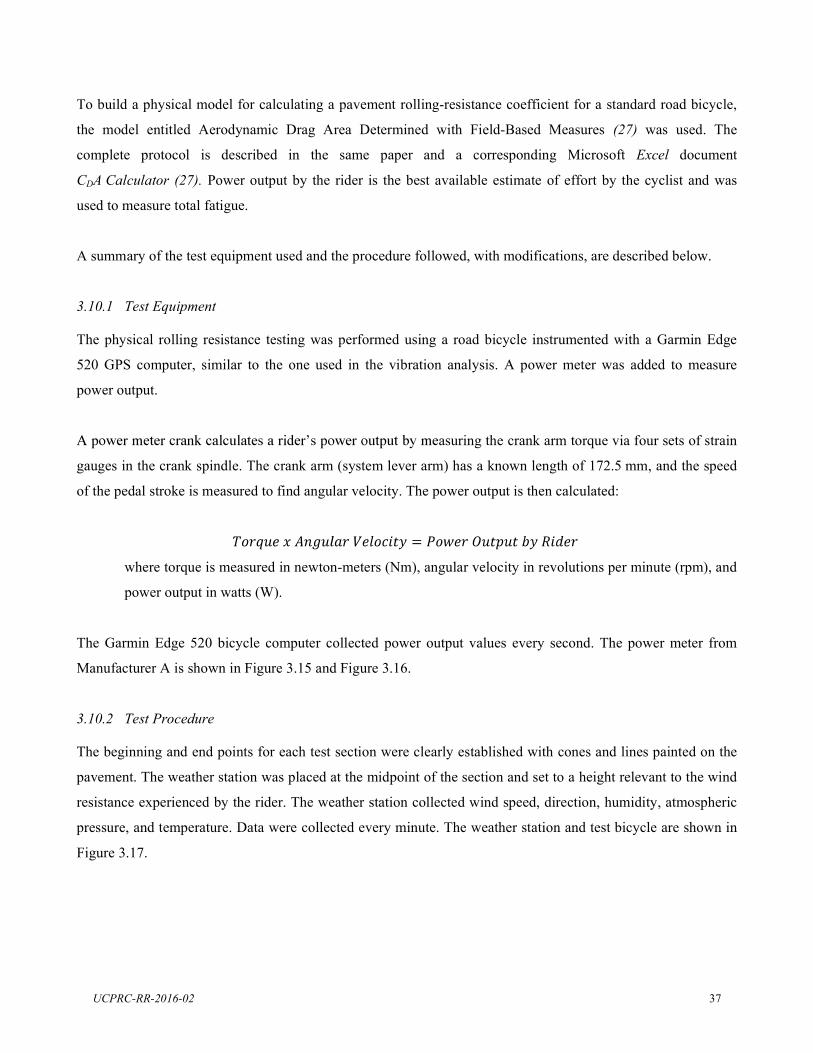
To build a physical model for calculating a pavement rolling-resistance coefficient for a standard road bicycle,
the model entitled Aerodynamic Drag Area Determined with Field-Based Measures (27) was used. The
complete protocol is described in the same paper and a corresponding Microsoft Excel document
CDA Calculator (27). Power output by the rider is the best available estimate of effort by the cyclist and was
used to measure total fatigue.
A summary of the test equipment used and the procedure followed, with modifications, are described below.
3.10.1 Test Equipment
The physical rolling resistance testing was performed using a road bicycle instrumented with a Garmin Edge
520 GPS computer, similar to the one used in the vibration analysis. A power meter was added to measure
power output.
asuring the crank arm torque via four sets of strain
gauges in the crank spindle. The crank arm (system lever arm) has a known length of 172.5 mm, and the speed
of the pedal stroke is measured to find angular velocity. The power output is then calculated:
where torque is measured in newton-meters (Nm), angular velocity in revolutions per minute (rpm), and
power output in watts (W).
The Garmin Edge 520 bicycle computer collected power output values every second. The power meter from
Manufacturer A is shown in Figure 3.15 and Figure 3.16.
3.10.2 Test Procedure
The beginning and end points for each test section were clearly established with cones and lines painted on the
pavement. The weather station was placed at the midpoint of the section and set to a height relevant to the wind
resistance experienced by the rider. The weather station collected wind speed, direction, humidity, atmospheric
pressure, and temperature. Data were collected every minute. The weather station and test bicycle are shown in
Figure 3.17.
UCPRC-RR-2016-02 37
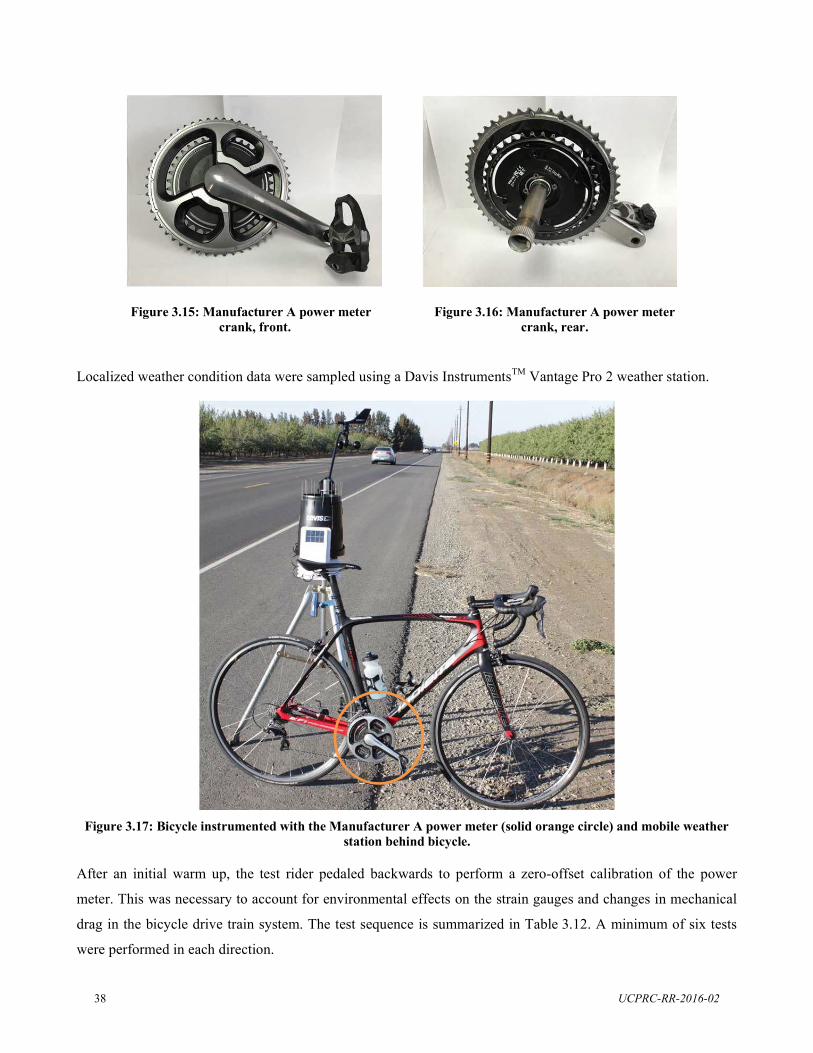
Figure 3.15: Manufacturer A power meter crank, front.
Figure 3.16: Manufacturer A power meter crank, rear.
Localized weather condition data were sampled using a Davis InstrumentsTM Vantage Pro 2 weather station.
Figure 3.17: Bicycle instrumented with the Manufacturer A power meter (solid orange circle) and mobile weather station behind bicycle.
After an initial warm up, the test rider pedaled backwards to perform a zero-offset calibration of the power
meter. This was necessary to account for environmental effects on the strain gauges and changes in mechanical
drag in the bicycle drive train system. The test sequence is summarized in Table 3.12. A minimum of six tests
were performed in each direction.
UCPRC-RR-2016-02 38
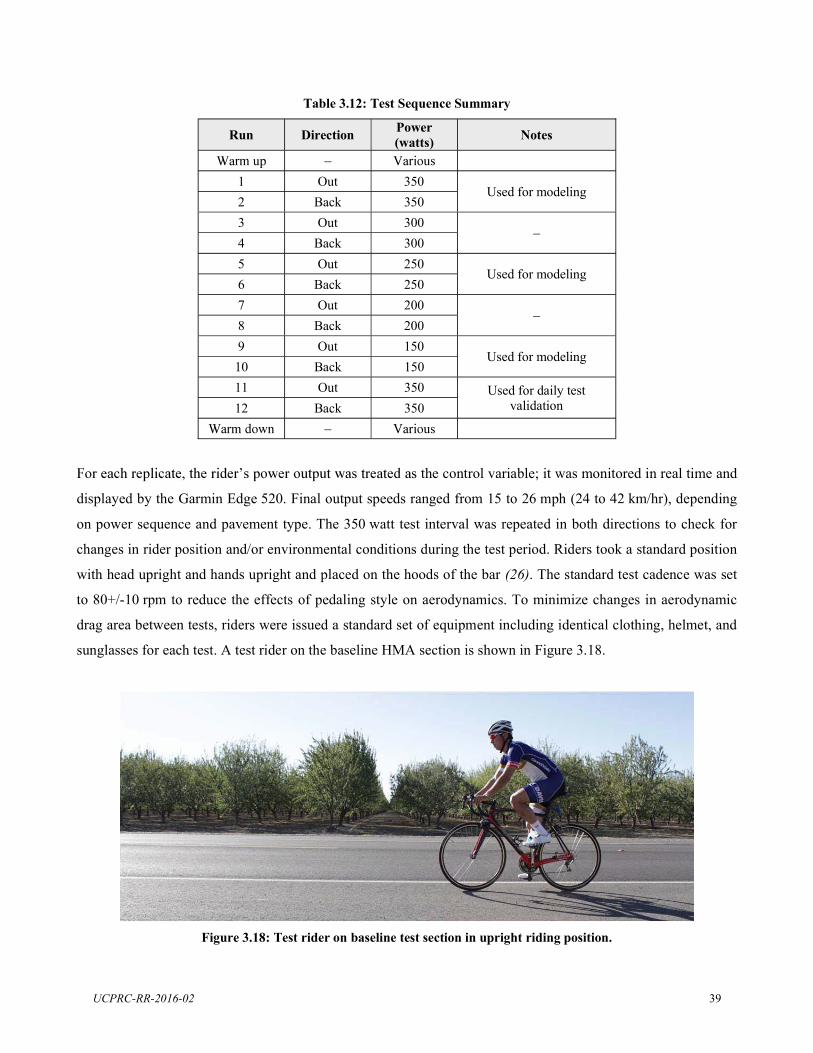
Table 3.12: Test Sequence Summary
Run Direction Power (watts) Notes
1 Out 350 Used for modeling
2 Back 350 3 Out 300 4 Back 300 5 Out 250
Used for modeling 6 Back 250 7 Out 200 8 Back 200 9 Out 150
Used for modeling 10 Back 150 11 Out 350 Used for daily test
validation 12 Back 350
the control variable; it was monitored in real time and
displayed by the Garmin Edge 520. Final output speeds ranged from 15 to 26 mph (24 to 42 km/hr), depending
on power sequence and pavement type. The 350 watt test interval was repeated in both directions to check for
changes in rider position and/or environmental conditions during the test period. Riders took a standard position
with head upright and hands upright and placed on the hoods of the bar (26). The standard test cadence was set
to 80+/-10 rpm to reduce the effects of pedaling style on aerodynamics. To minimize changes in aerodynamic
drag area between tests, riders were issued a standard set of equipment including identical clothing, helmet, and
sunglasses for each test. A test rider on the baseline HMA section is shown in Figure 3.18.
Figure 3.18: Test rider on baseline test section in upright riding position.
UCPRC-RR-2016-02 39
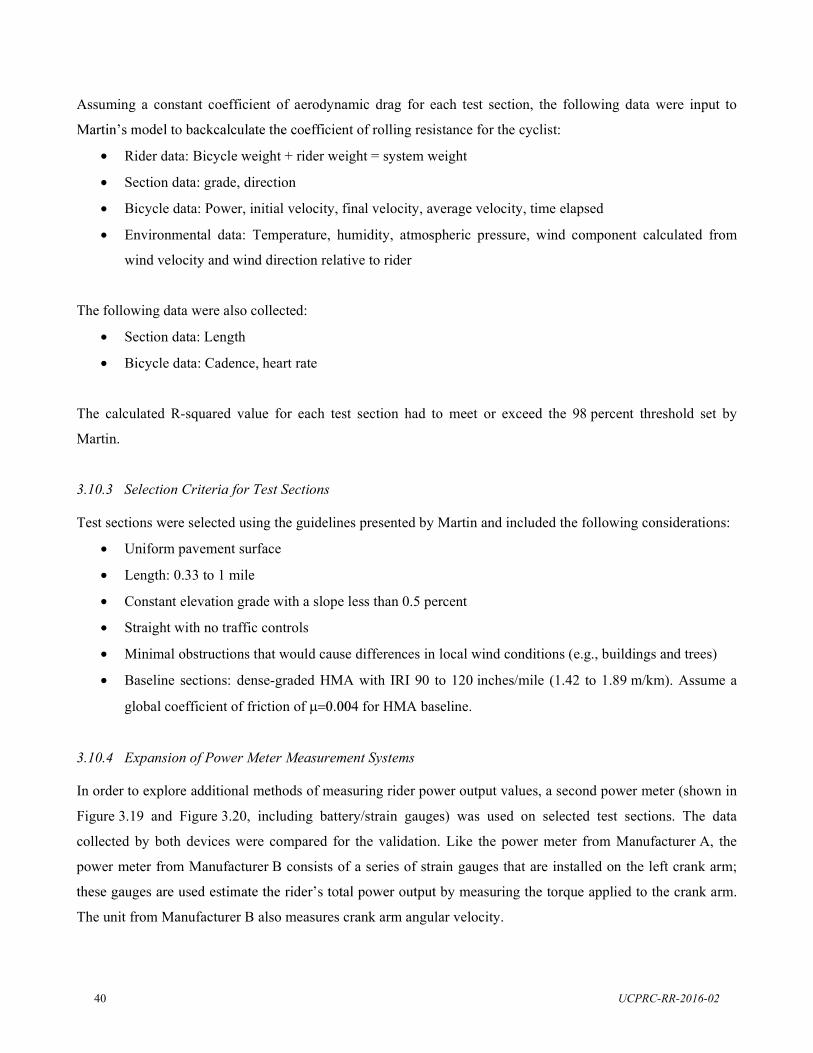
Assuming a constant coefficient of aerodynamic drag for each test section, the following data were input to
cient of rolling resistance for the cyclist:
Rider data: Bicycle weight + rider weight = system weight
Section data: grade, direction
Bicycle data: Power, initial velocity, final velocity, average velocity, time elapsed
Environmental data: Temperature, humidity, atmospheric pressure, wind component calculated from
wind velocity and wind direction relative to rider
The following data were also collected:
Section data: Length
Bicycle data: Cadence, heart rate
The calculated R-squared value for each test section had to meet or exceed the 98 percent threshold set by
Martin.
3.10.3 Selection Criteria for Test Sections
Test sections were selected using the guidelines presented by Martin and included the following considerations:
Uniform pavement surface
Length: 0.33 to 1 mile
Constant elevation grade with a slope less than 0.5 percent
Straight with no traffic controls
Minimal obstructions that would cause differences in local wind conditions (e.g., buildings and trees)
Baseline sections: dense-graded HMA with IRI 90 to 120 inches/mile (1.42 to 1.89 m/km). Assume a
global coefficient of friction of for HMA baseline.
3.10.4 Expansion of Power Meter Measurement Systems
In order to explore additional methods of measuring rider power output values, a second power meter (shown in
Figure 3.19 and Figure 3.20, including battery/strain gauges) was used on selected test sections. The data
collected by both devices were compared for the validation. Like the power meter from Manufacturer A, the
power meter from Manufacturer B consists of a series of strain gauges that are installed on the left crank arm;
by measuring the torque applied to the crank arm.
The unit from Manufacturer B also measures crank arm angular velocity.
UCPRC-RR-2016-02 40
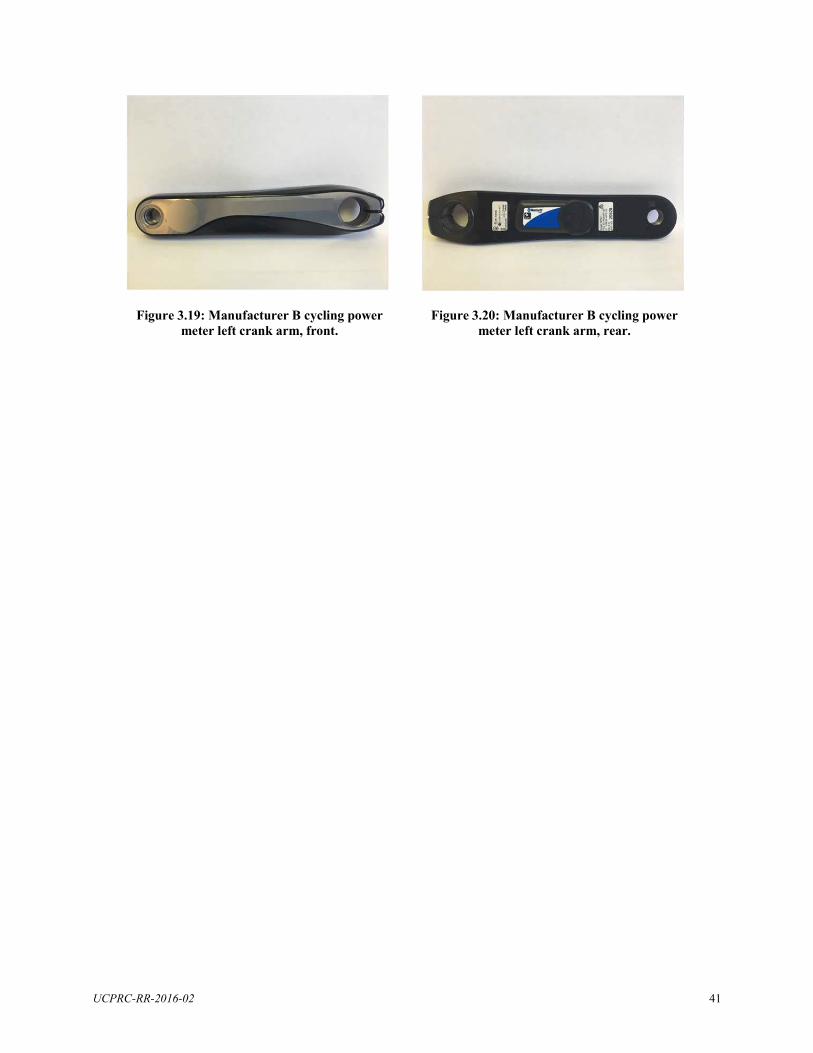
Figure 3.19: Manufacturer B cycling power meter left crank arm, front.
Figure 3.20: Manufacturer B cycling power meter left crank arm, rear.
UCPRC-RR-2016-02 41

(This page left blank.)
UCPRC-RR-2016-02 42
4 MEASUREMENT AND SURVEY RESULTS AND ANALYSIS
Following the approach described in Section 3.2, cyclists were surveyed in different cities to obtain a larger
sample of riders with broader demographic characteristics and a larger sample of pavement road sections. Using
the methods described in Section 3.4 and Section 3.5, pavement macrotexture in terms of MPD, roughness in
terms of IRI, and bicycle vibration were measured to characterize the pavement surface and dynamic response
of bicycles.
4.1 Macrotexture Results Measured with the Laser Texture Scanner (LTS)
Pavement macrotexture was measured using the laser texture scanner method at different locations on each road
section. The measurements were mainly performed at locations approximately 6 inches (150 mm) inside and
outside the white edge of traveled way (ETW) stripes, where most bicyclists ride when there is traffic. The
macrotexture results measured, in terms of MPD, from all the five cities are presented in Figure 4.1. The MPD
values ranged from approximately 0.1 mm to 4.0 mm, with the median values ranging from 0.3 mm to 2.0 mm.
4.2 Macrotexture Measured by Inertial Profiler
Measurements taken with the inertial profiler (IP) followed a continuous line for the entire length of each
section included in this study. The IP was run in the same direction and general location that the bicyclists rode
for each survey section. Wherever possible for the group survey sections and most of the sections surveyed only
for texture, the IP was run both inside (near the wheelpath) and outside the ETW stripe (on the shoulder) in the
Caltrans sections were surveyed only for texture, the IP
was run in both directions.
4.2.1 Continuous Macrotexture Results of Different Survey Sections Using IP
Figure 4.2 uses box plots to show the macrotexture measurements taken with the IP along the entire length of
each pavement section in the five cities (see Table 3.1 for details of each section). The figure shows that the
median MPD values across all the sections were in the approximate range of 0.3 mm to 1.9 mm, while the MPD
values for several sections (Sections 6 and 7 in the Davis group and Sections 13 to 15 in the Richmond group)
were around approximately 2.0 mm. The MPD values within most sections show small variations, while Chico
Sections 3 and 15 show relatively larger variations within the sections. The MPD of each section measured by
the IP for all the groups has been summarized in Table 4.1.
UCPRC-RR-2016-02 43
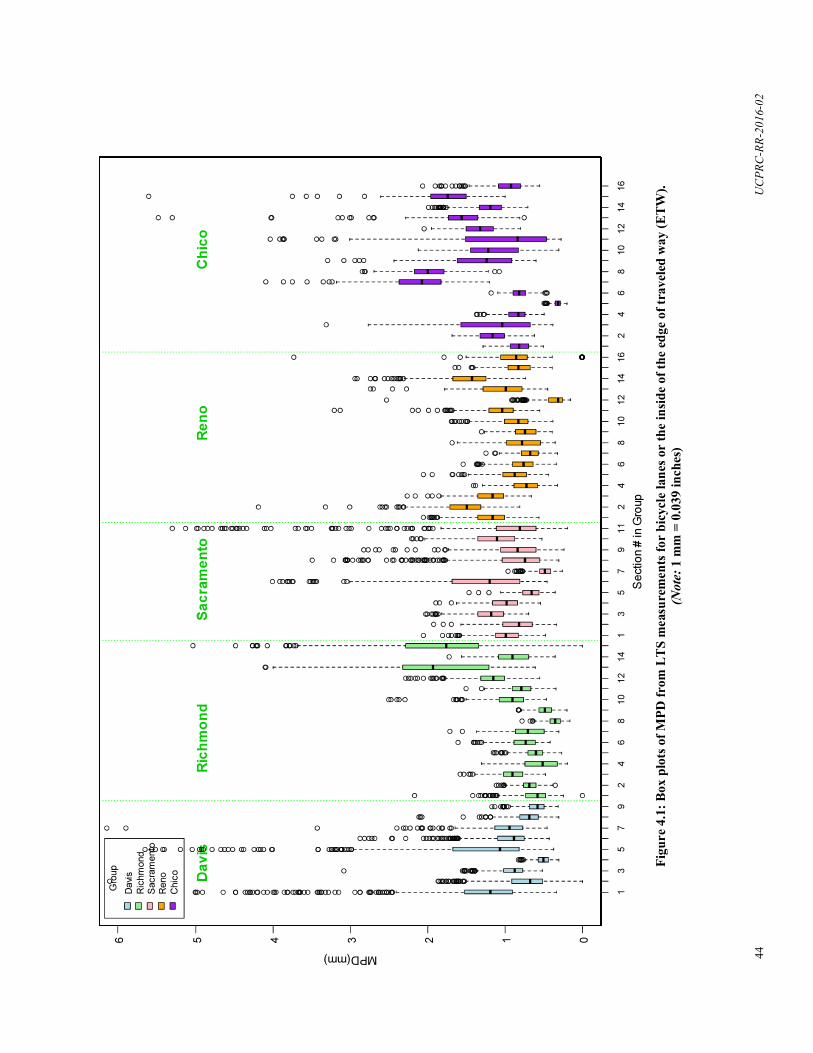
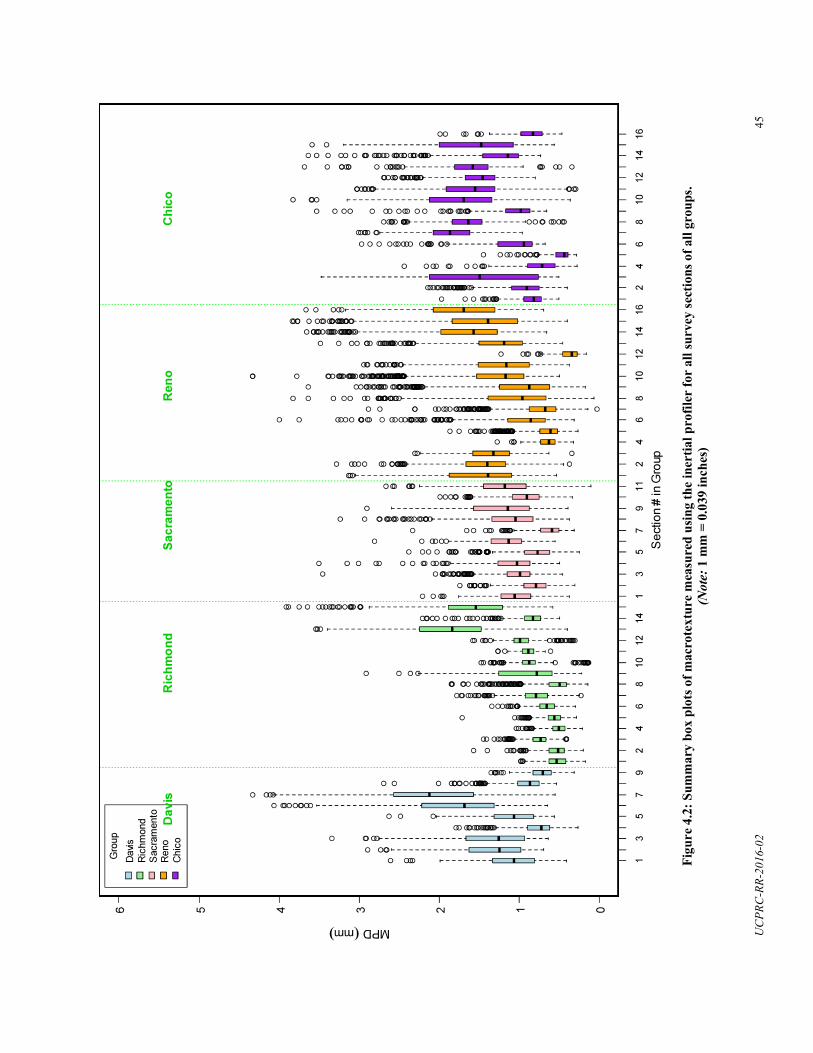
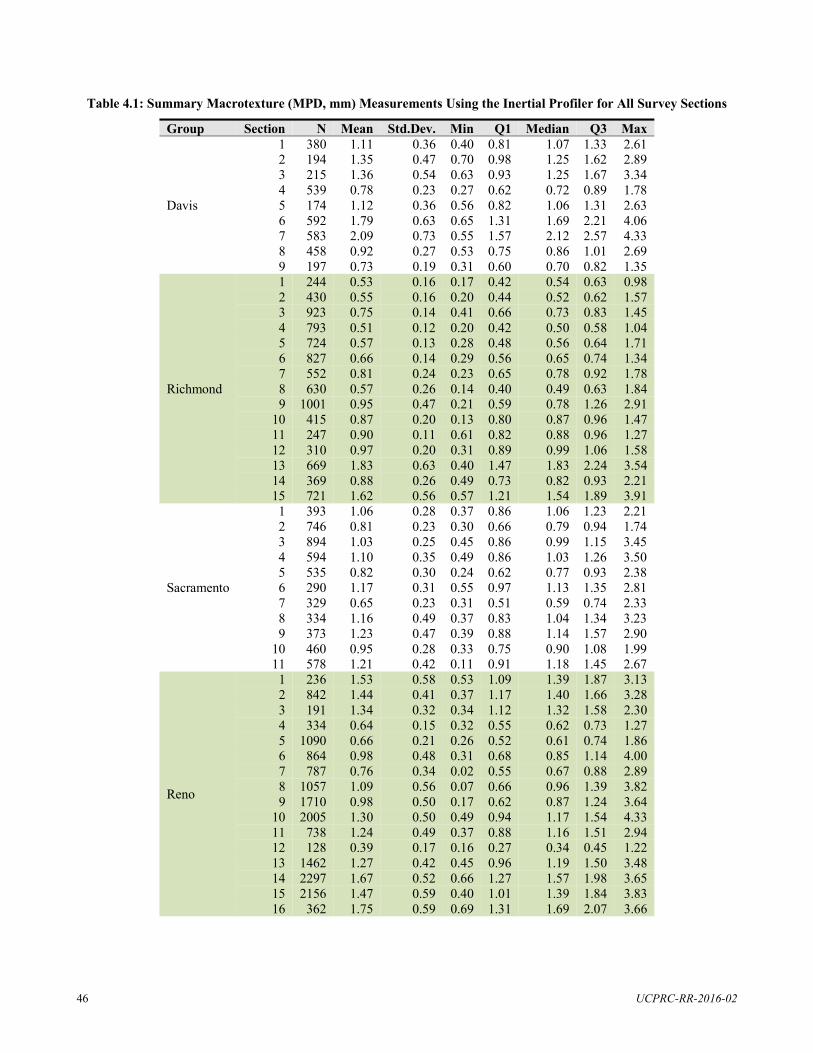
Group Section N Mean Std.Dev. Min Q1 Median Q3 Max 1 380 1.11 0.36 0.40 0.81 1.07 1.33 2.61 2 194 1.35 0.47 0.70 0.98 1.25 1.62 2.89 3 215 1.36 0.54 0.63 0.93 1.25 1.67 3.34 4 539 0.78 0.23 0.27 0.62 0.72 0.89 1.78
Davis 5 174 1.12 0.36 0.56 0.82 1.06 1.31 2.63 6 592 1.79 0.63 0.65 1.31 1.69 2.21 4.06 7 583 2.09 0.73 0.55 1.57 2.12 2.57 4.33 8 458 0.92 0.27 0.53 0.75 0.86 1.01 2.69 9 197 0.73 0.19 0.31 0.60 0.70 0.82 1.35 1 244 0.53 0.16 0.17 0.42 0.54 0.63 0.98 2 430 0.55 0.16 0.20 0.44 0.52 0.62 1.57 3 923 0.75 0.14 0.41 0.66 0.73 0.83 1.45 4 793 0.51 0.12 0.20 0.42 0.50 0.58 1.04 5 724 0.57 0.13 0.28 0.48 0.56 0.64 1.71 6 827 0.66 0.14 0.29 0.56 0.65 0.74 1.34 7 552 0.81 0.24 0.23 0.65 0.78 0.92 1.78
Richmond 8 630 0.57 0.26 0.14 0.40 0.49 0.63 1.84 9 1001 0.95 0.47 0.21 0.59 0.78 1.26 2.91
10 415 0.87 0.20 0.13 0.80 0.87 0.96 1.47 11 247 0.90 0.11 0.61 0.82 0.88 0.96 1.27 12 310 0.97 0.20 0.31 0.89 0.99 1.06 1.58 13 669 1.83 0.63 0.40 1.47 1.83 2.24 3.54 14 369 0.88 0.26 0.49 0.73 0.82 0.93 2.21 15 721 1.62 0.56 0.57 1.21 1.54 1.89 3.91 1 393 1.06 0.28 0.37 0.86 1.06 1.23 2.21 2 746 0.81 0.23 0.30 0.66 0.79 0.94 1.74 3 894 1.03 0.25 0.45 0.86 0.99 1.15 3.45 4 594 1.10 0.35 0.49 0.86 1.03 1.26 3.50 5 535 0.82 0.30 0.24 0.62 0.77 0.93 2.38
Sacramento 6 290 1.17 0.31 0.55 0.97 1.13 1.35 2.81 7 329 0.65 0.23 0.31 0.51 0.59 0.74 2.33 8 334 1.16 0.49 0.37 0.83 1.04 1.34 3.23 9 373 1.23 0.47 0.39 0.88 1.14 1.57 2.90
10 460 0.95 0.28 0.33 0.75 0.90 1.08 1.99 11 578 1.21 0.42 0.11 0.91 1.18 1.45 2.67
1 236 1.53 0.58 0.53 1.09 1.39 1.87 3.13 2 842 1.44 0.41 0.37 1.17 1.40 1.66 3.28 3 191 1.34 0.32 0.34 1.12 1.32 1.58 2.30 4 334 0.64 0.15 0.32 0.55 0.62 0.73 1.27 5 1090 0.66 0.21 0.26 0.52 0.61 0.74 1.86 6 864 0.98 0.48 0.31 0.68 0.85 1.14 4.00 7 787 0.76 0.34 0.02 0.55 0.67 0.88 2.89
Reno 8 9
1057 1710
1.09 0.98
0.56 0.50
0.07 0.17
0.66 0.62
0.96 0.87
1.39 1.24
3.82 3.64
10 2005 1.30 0.50 0.49 0.94 1.17 1.54 4.33 11 738 1.24 0.49 0.37 0.88 1.16 1.51 2.94 12 128 0.39 0.17 0.16 0.27 0.34 0.45 1.22 13 1462 1.27 0.42 0.45 0.96 1.19 1.50 3.48 14 2297 1.67 0.52 0.66 1.27 1.57 1.98 3.65 15 2156 1.47 0.59 0.40 1.01 1.39 1.84 3.83 16 362 1.75 0.59 0.69 1.31 1.69 2.07 3.66
Table 4.1: Summary Macrotexture (MPD, mm) Measurements Using the Inertial Profiler for All Survey Sections
UCPRC-RR-2016-02 46
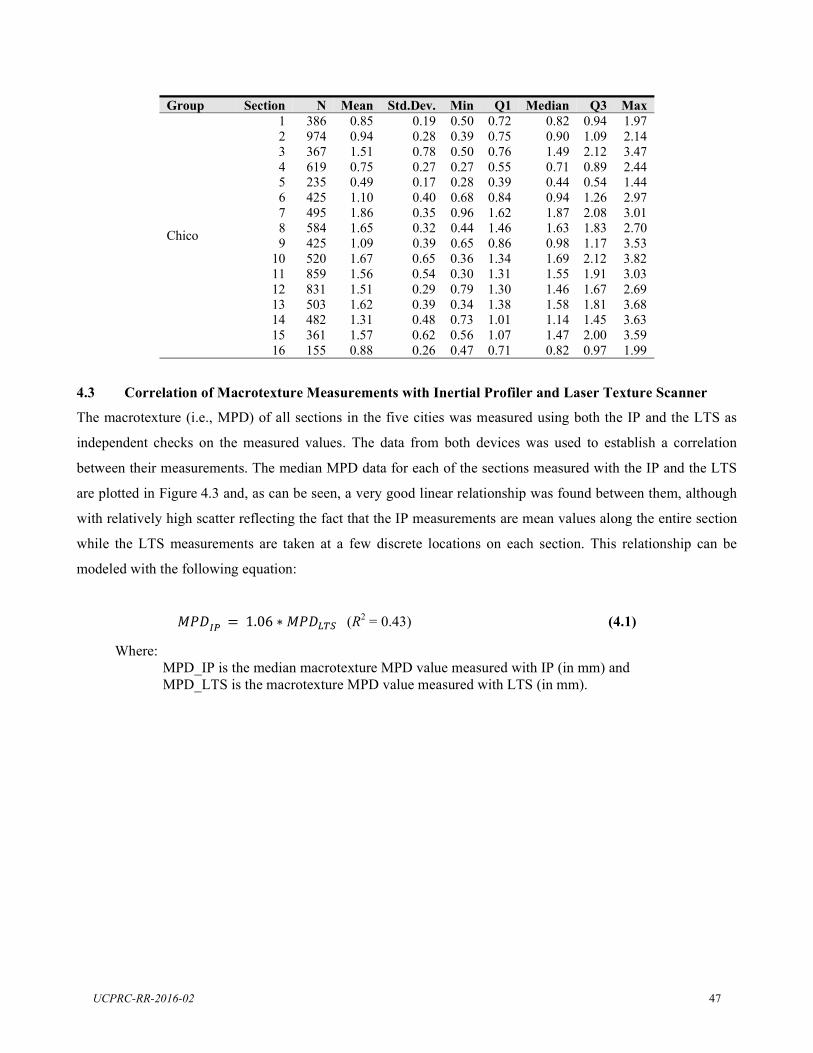
Group Section N Mean Std.Dev. Min Q1 Median Q3 Max 1 386 0.85 0.19 0.50 0.72 0.82 0.94 1.97 2 974 0.94 0.28 0.39 0.75 0.90 1.09 2.14 3 367 1.51 0.78 0.50 0.76 1.49 2.12 3.47 4 619 0.75 0.27 0.27 0.55 0.71 0.89 2.44 5 235 0.49 0.17 0.28 0.39 0.44 0.54 1.44 6 425 1.10 0.40 0.68 0.84 0.94 1.26 2.97 7 495 1.86 0.35 0.96 1.62 1.87 2.08 3.01
Chico 8 9
584 425
1.65 1.09
0.32 0.39
0.44 0.65
1.46 0.86
1.63 0.98
1.83 1.17
2.70 3.53
10 520 1.67 0.65 0.36 1.34 1.69 2.12 3.82 11 859 1.56 0.54 0.30 1.31 1.55 1.91 3.03 12 831 1.51 0.29 0.79 1.30 1.46 1.67 2.69 13 503 1.62 0.39 0.34 1.38 1.58 1.81 3.68 14 482 1.31 0.48 0.73 1.01 1.14 1.45 3.63 15 361 1.57 0.62 0.56 1.07 1.47 2.00 3.59 16 155 0.88 0.26 0.47 0.71 0.82 0.97 1.99
4.3 Correlation of Macrotexture Measurements with Inertial Profiler and Laser Texture Scanner
The macrotexture (i.e., MPD) of all sections in the five cities was measured using both the IP and the LTS as
independent checks on the measured values. The data from both devices was used to establish a correlation
between their measurements. The median MPD data for each of the sections measured with the IP and the LTS
are plotted in Figure 4.3 and, as can be seen, a very good linear relationship was found between them, although
with relatively high scatter reflecting the fact that the IP measurements are mean values along the entire section
while the LTS measurements are taken at a few discrete locations on each section. This relationship can be
modeled with the following equation:
(R2 = 0.43) (4.1)
Where: MPD_IP is the median macrotexture MPD value measured with IP (in mm) and MPD_LTS is the macrotexture MPD value measured with LTS (in mm).
UCPRC-RR-2016-02 47
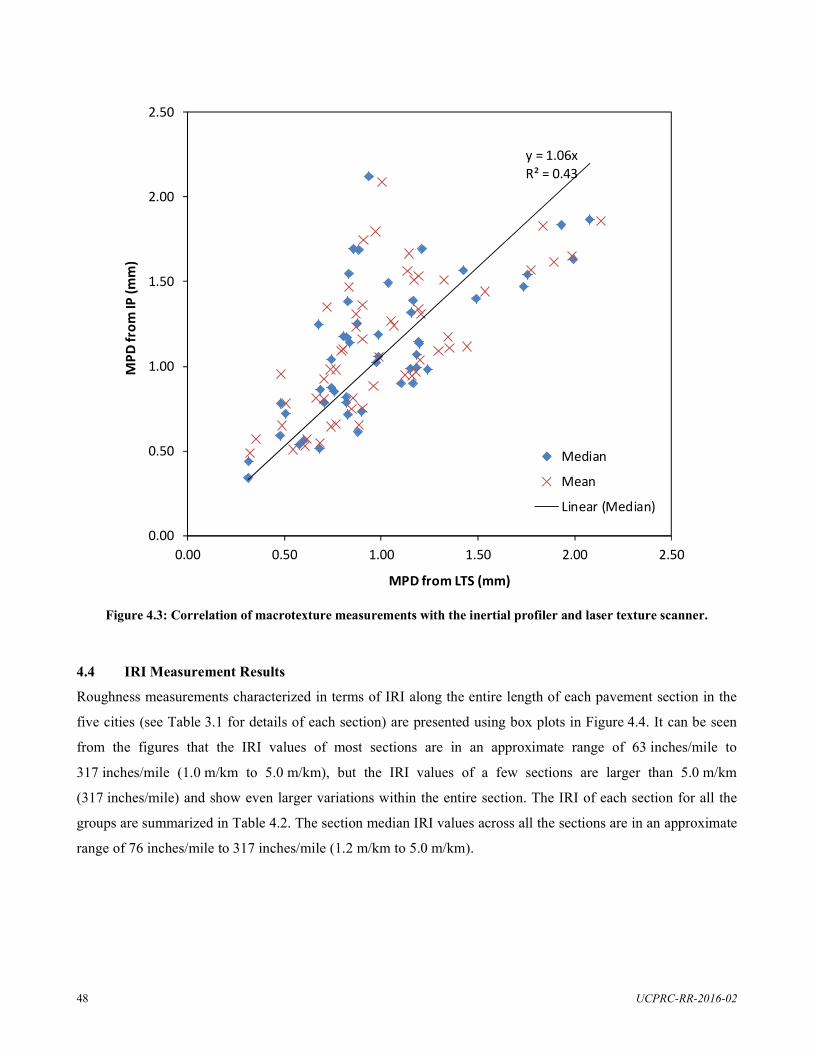
2.50
2.00
1.50
1.00
0.50
0.00
y = 1.06x R² = 0.43
Median
Mean
Linear (Median)
0.00 0.50 1.00 1.50 2.00 2.50
MPD from LTS (mm)
Figure 4.3: Correlation of macrotexture measurements with the inertial profiler and laser texture scanner.
4.4 IRI Measurement Results
Roughness measurements characterized in terms of IRI along the entire length of each pavement section in the
five cities (see Table 3.1 for details of each section) are presented using box plots in Figure 4.4. It can be seen
from the figures that the IRI values of most sections are in an approximate range of 63 inches/mile to
317 inches/mile (1.0 m/km to 5.0 m/km), but the IRI values of a few sections are larger than 5.0 m/km
(317 inches/mile) and show even larger variations within the entire section. The IRI of each section for all the
groups are summarized in Table 4.2. The section median IRI values across all the sections are in an approximate
range of 76 inches/mile to 317 inches/mile (1.2 m/km to 5.0 m/km).
UCPRC-RR-2016-02 48
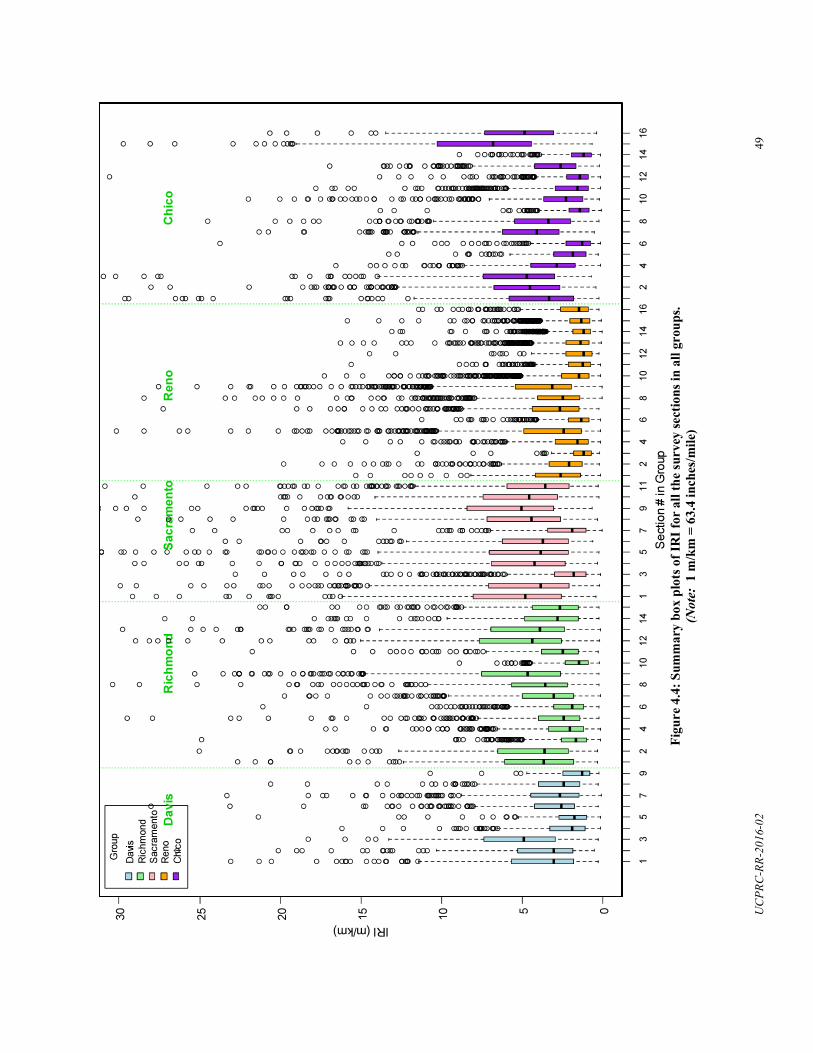
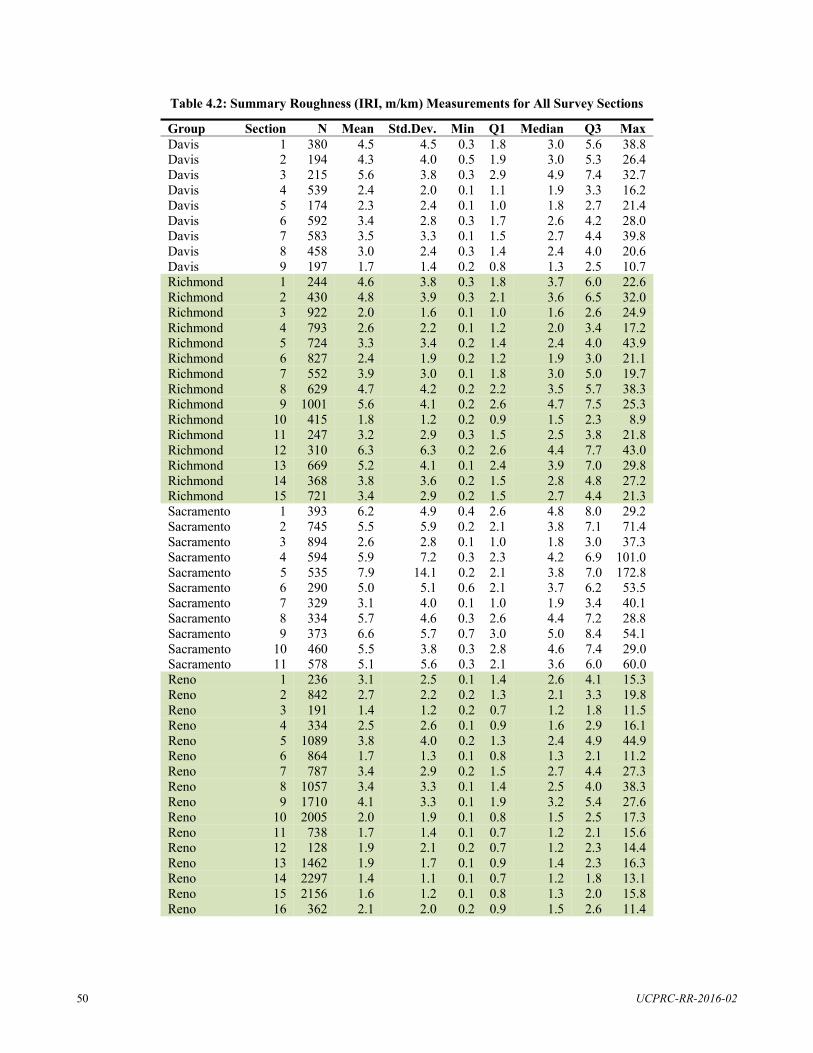
Group Davis
Section 1
N 380
Mean 4.5
Std.Dev. 4.5
Min 0.3
Q11.8
Median 3.0
Q3 5.6
Max 38.8
Davis 2 194 4.3 4.0 0.5 1.9 3.0 5.3 26.4Davis 3 215 5.6 3.8 0.3 2.9 4.9 7.4 32.7Davis 4 539 2.4 2.0 0.1 1.1 1.9 3.3 16.2Davis 5 174 2.3 2.4 0.1 1.0 1.8 2.7 21.4Davis 6 592 3.4 2.8 0.3 1.7 2.6 4.2 28.0Davis 7 583 3.5 3.3 0.1 1.5 2.7 4.4 39.8Davis 8 458 3.0 2.4 0.3 1.4 2.4 4.0 20.6Davis 9 197 1.7 1.4 0.2 0.8 1.3 2.5 10.7Richmond 1 244 4.6 3.8 0.3 1.8 3.7 6.0 22.6 Richmond 2 430 4.8 3.9 0.3 2.1 3.6 6.5 32.0 Richmond 3 922 2.0 1.6 0.1 1.0 1.6 2.6 24.9 Richmond 4 793 2.6 2.2 0.1 1.2 2.0 3.4 17.2 Richmond 5 724 3.3 3.4 0.2 1.4 2.4 4.0 43.9 Richmond 6 827 2.4 1.9 0.2 1.2 1.9 3.0 21.1 Richmond 7 552 3.9 3.0 0.1 1.8 3.0 5.0 19.7 Richmond 8 629 4.7 4.2 0.2 2.2 3.5 5.7 38.3 Richmond 9 1001 5.6 4.1 0.2 2.6 4.7 7.5 25.3 Richmond 10 415 1.8 1.2 0.2 0.9 1.5 2.3 8.9 Richmond 11 247 3.2 2.9 0.3 1.5 2.5 3.8 21.8 Richmond 12 310 6.3 6.3 0.2 2.6 4.4 7.7 43.0 Richmond 13 669 5.2 4.1 0.1 2.4 3.9 7.0 29.8 Richmond 14 368 3.8 3.6 0.2 1.5 2.8 4.8 27.2 Richmond 15 721 3.4 2.9 0.2 1.5 2.7 4.4 21.3 Sacramento 1 393 6.2 4.9 0.4 2.6 4.8 8.0 29.2 Sacramento 2 745 5.5 5.9 0.2 2.1 3.8 7.1 71.4 Sacramento 3 894 2.6 2.8 0.1 1.0 1.8 3.0 37.3 Sacramento 4 594 5.9 7.2 0.3 2.3 4.2 6.9 101.0Sacramento 5 535 7.9 14.1 0.2 2.1 3.8 7.0 172.8Sacramento 6 290 5.0 5.1 0.6 2.1 3.7 6.2 53.5Sacramento 7 329 3.1 4.0 0.1 1.0 1.9 3.4 40.1Sacramento 8 334 5.7 4.6 0.3 2.6 4.4 7.2 28.8Sacramento 9 373 6.6 5.7 0.7 3.0 5.0 8.4 54.1Sacramento 10 460 5.5 3.8 0.3 2.8 4.6 7.4 29.0 Sacramento 11 578 5.1 5.6 0.3 2.1 3.6 6.0 60.0 Reno 1 236 3.1 2.5 0.1 1.4 2.6 4.1 15.3 Reno 2 842 2.7 2.2 0.2 1.3 2.1 3.3 19.8 Reno 3 191 1.4 1.2 0.2 0.7 1.2 1.8 11.5 Reno 4 334 2.5 2.6 0.1 0.9 1.6 2.9 16.1 Reno 5 1089 3.8 4.0 0.2 1.3 2.4 4.9 44.9 Reno 6 864 1.7 1.3 0.1 0.8 1.3 2.1 11.2 Reno 7 787 3.4 2.9 0.2 1.5 2.7 4.4 27.3 Reno 8 1057 3.4 3.3 0.1 1.4 2.5 4.0 38.3 Reno 9 1710 4.1 3.3 0.1 1.9 3.2 5.4 27.6 Reno 10 2005 2.0 1.9 0.1 0.8 1.5 2.5 17.3 Reno 11 738 1.7 1.4 0.1 0.7 1.2 2.1 15.6 Reno 12 128 1.9 2.1 0.2 0.7 1.2 2.3 14.4 Reno 13 1462 1.9 1.7 0.1 0.9 1.4 2.3 16.3 Reno 14 2297 1.4 1.1 0.1 0.7 1.2 1.8 13.1 Reno 15 2156 1.6 1.2 0.1 0.8 1.3 2.0 15.8 Reno 16 362 2.1 2.0 0.2 0.9 1.5 2.6 11.4
Table 4.2: Summary Roughness (IRI, m/km) Measurements for All Survey Sections
UCPRC-RR-2016-02 50
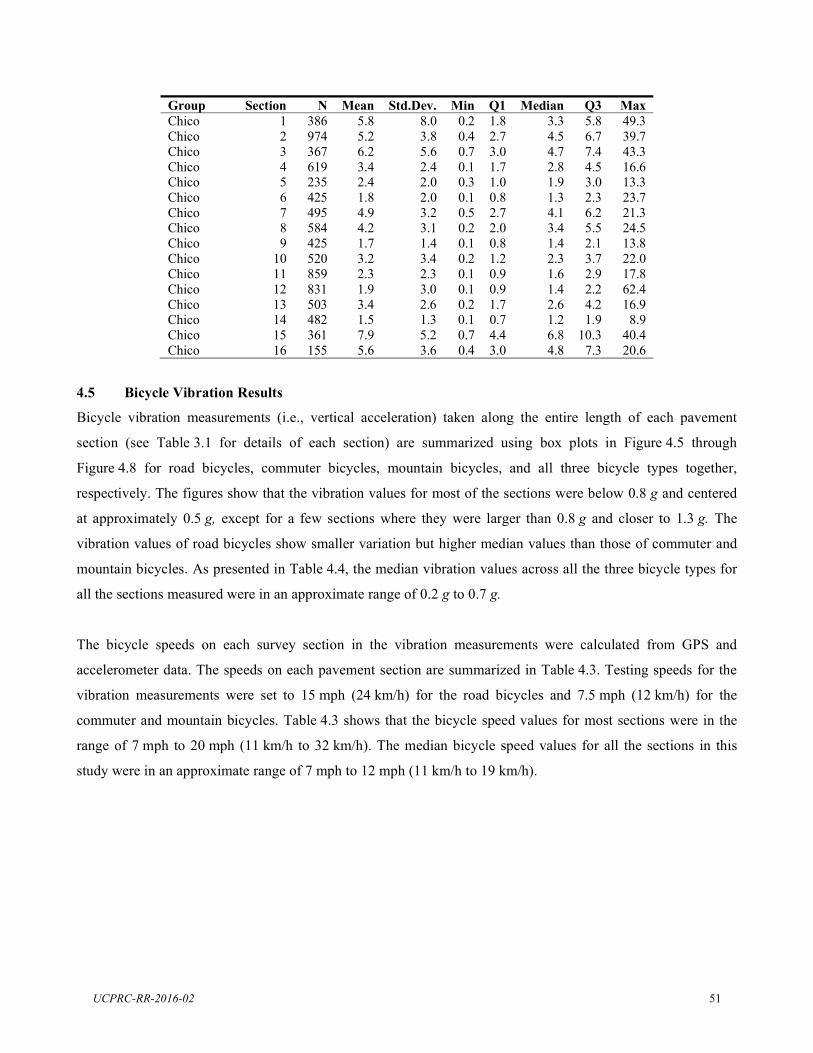
Group Chico
Section 1
N 386
Mean 5.8
Std.Dev. 8.0
Min 0.2
Q11.8
Median 3.3
Q3 5.8
Max 49.3
Chico 2 974 5.2 3.8 0.4 2.7 4.5 6.7 39.7 Chico 3 367 6.2 5.6 0.7 3.0 4.7 7.4 43.3 Chico 4 619 3.4 2.4 0.1 1.7 2.8 4.5 16.6 Chico 5 235 2.4 2.0 0.3 1.0 1.9 3.0 13.3 Chico 6 425 1.8 2.0 0.1 0.8 1.3 2.3 23.7 Chico 7 495 4.9 3.2 0.5 2.7 4.1 6.2 21.3 Chico 8 584 4.2 3.1 0.2 2.0 3.4 5.5 24.5 Chico 9 425 1.7 1.4 0.1 0.8 1.4 2.1 13.8 Chico 10 520 3.2 3.4 0.2 1.2 2.3 3.7 22.0 Chico 11 859 2.3 2.3 0.1 0.9 1.6 2.9 17.8 Chico 12 831 1.9 3.0 0.1 0.9 1.4 2.2 62.4 Chico 13 503 3.4 2.6 0.2 1.7 2.6 4.2 16.9 Chico 14 482 1.5 1.3 0.1 0.7 1.2 1.9 8.9Chico 15 361 7.9 5.2 0.7 4.4 6.8 10.3 40.4Chico 16 155 5.6 3.6 0.4 3.0 4.8 7.3 20.6
4.5 Bicycle Vibration Results
Bicycle vibration measurements (i.e., vertical acceleration) taken along the entire length of each pavement
section (see Table 3.1 for details of each section) are summarized using box plots in Figure 4.5 through
Figure 4.8 for road bicycles, commuter bicycles, mountain bicycles, and all three bicycle types together,
respectively. The figures show that the vibration values for most of the sections were below 0.8 g and centered
at approximately 0.5 g, except for a few sections where they were larger than 0.8 g and closer to 1.3 g. The
vibration values of road bicycles show smaller variation but higher median values than those of commuter and
mountain bicycles. As presented in Table 4.4, the median vibration values across all the three bicycle types for
all the sections measured were in an approximate range of 0.2 g to 0.7 g.
The bicycle speeds on each survey section in the vibration measurements were calculated from GPS and
accelerometer data. The speeds on each pavement section are summarized in Table 4.3. Testing speeds for the
vibration measurements were set to 15 mph (24 km/h) for the road bicycles and 7.5 mph (12 km/h) for the
commuter and mountain bicycles. Table 4.3 shows that the bicycle speed values for most sections were in the
range of 7 mph to 20 mph (11 km/h to 32 km/h). The median bicycle speed values for all the sections in this
study were in an approximate range of 7 mph to 12 mph (11 km/h to 19 km/h).
UCPRC-RR-2016-02 51
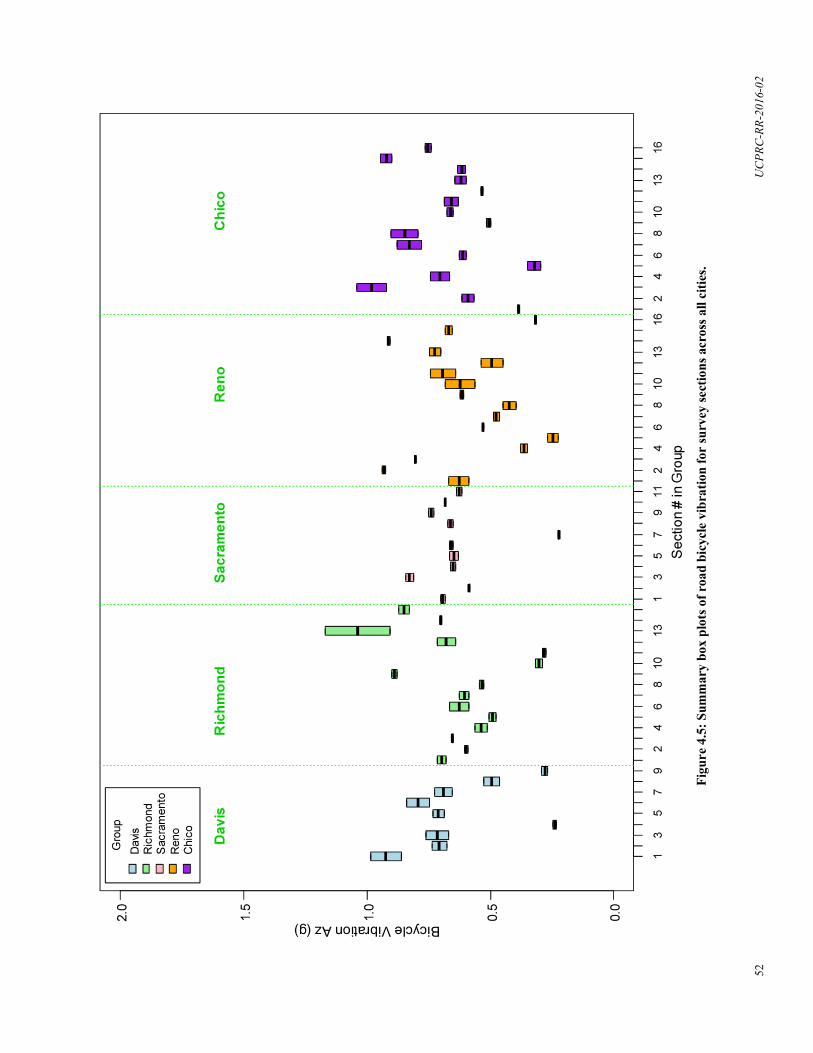
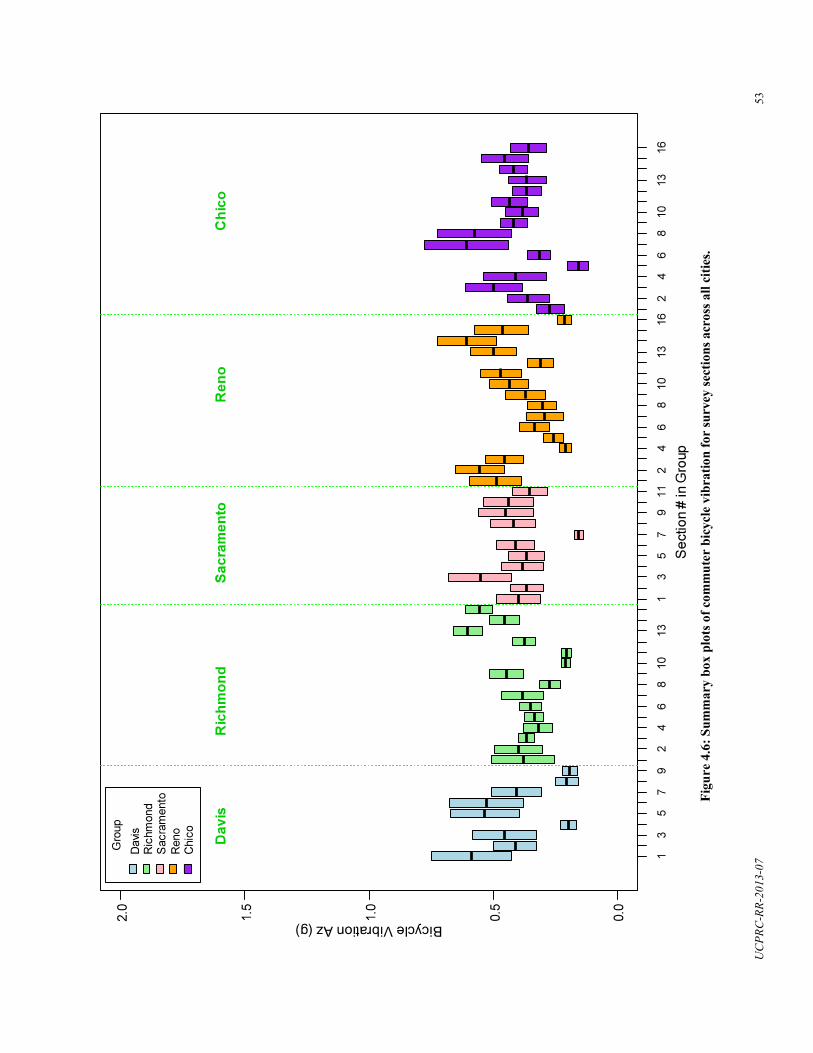
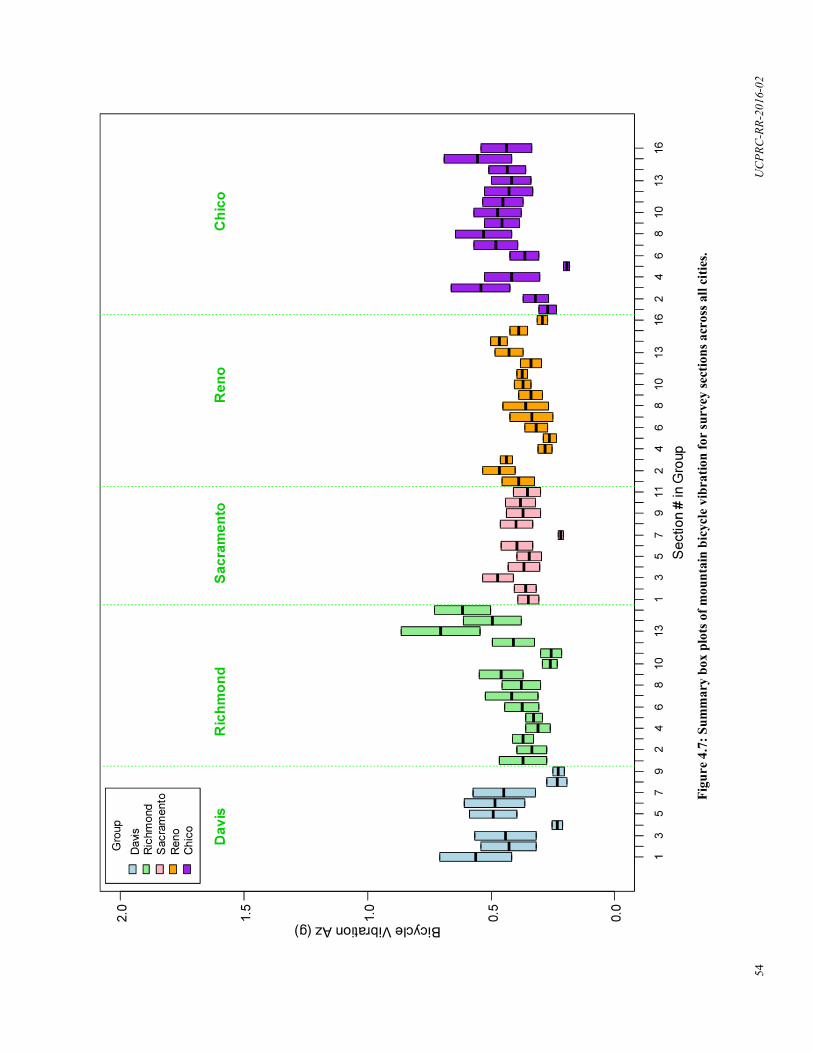
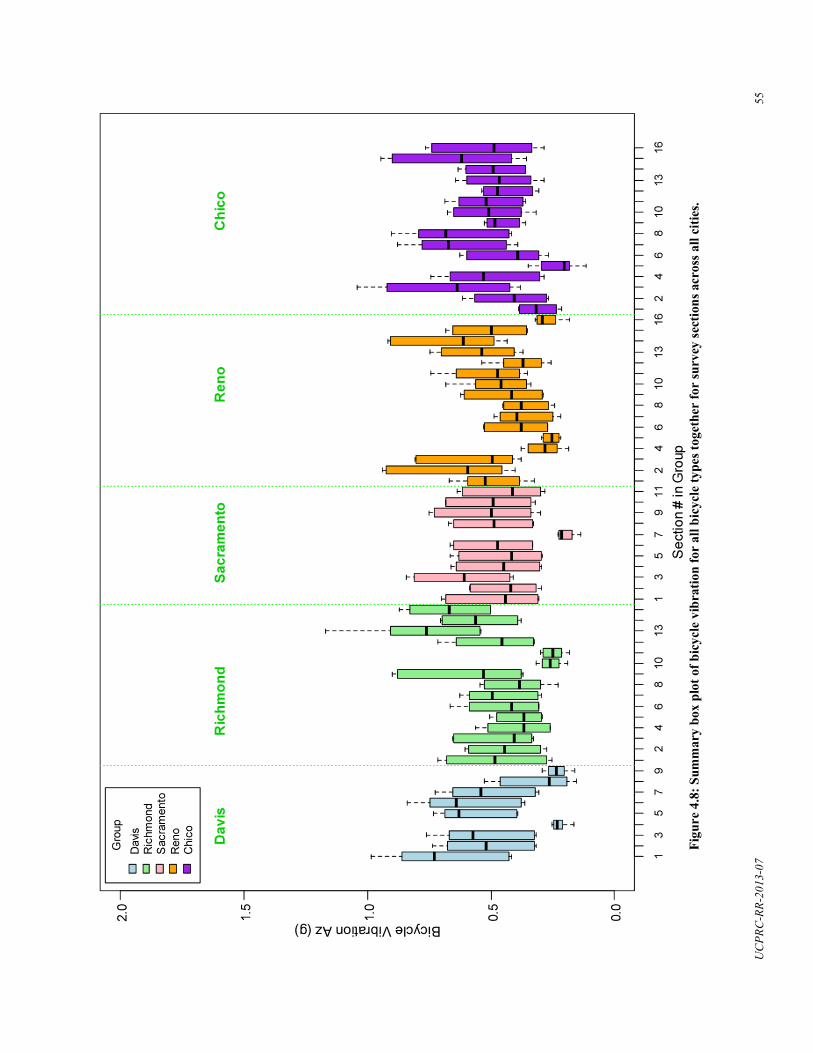
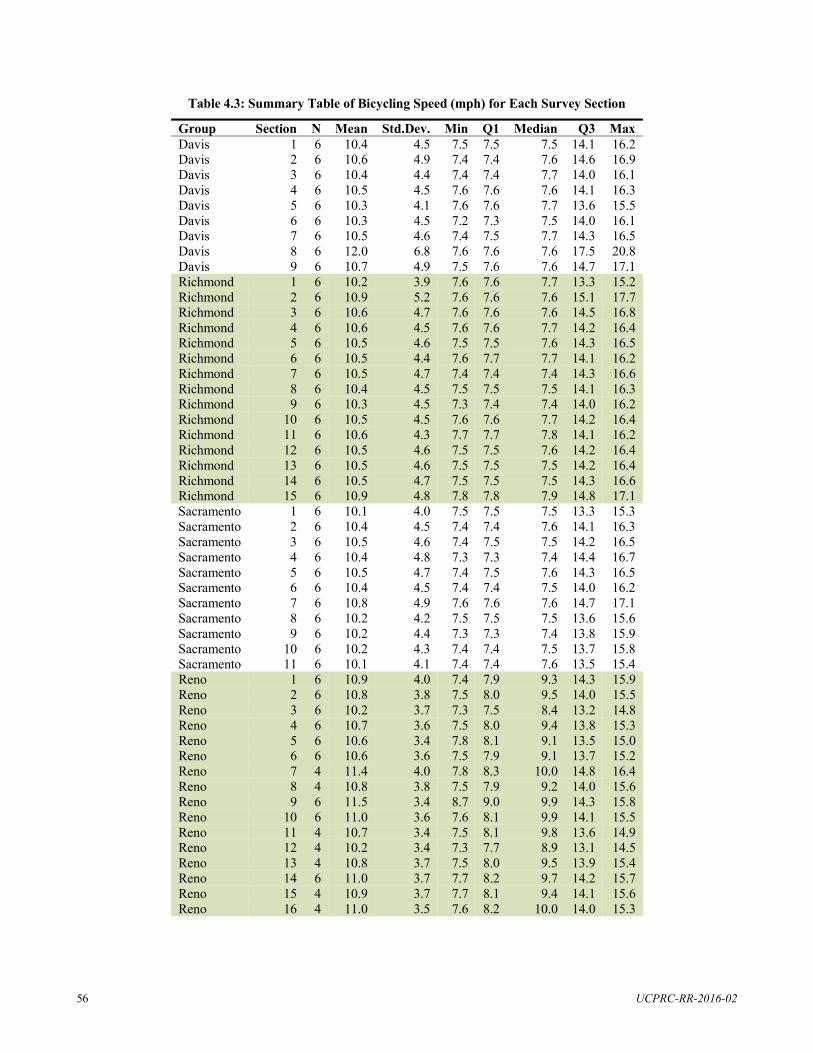
Group Davis
Section 1
N 6
Mean 10.4
Std.Dev. 4.5
Min 7.5
Q1 7.5
Median 7.5
Q3 14.1
Max 16.2
Davis 2 6 10.6 4.9 7.4 7.4 7.6 14.6 16.9Davis 3 6 10.4 4.4 7.4 7.4 7.7 14.0 16.1Davis 4 6 10.5 4.5 7.6 7.6 7.6 14.1 16.3Davis 5 6 10.3 4.1 7.6 7.6 7.7 13.6 15.5Davis 6 6 10.3 4.5 7.2 7.3 7.5 14.0 16.1Davis 7 6 10.5 4.6 7.4 7.5 7.7 14.3 16.5Davis 8 6 12.0 6.8 7.6 7.6 7.6 17.5 20.8Davis 9 6 10.7 4.9 7.5 7.6 7.6 14.7 17.1Richmond 1 6 10.2 3.9 7.6 7.6 7.7 13.3 15.2 Richmond 2 6 10.9 5.2 7.6 7.6 7.6 15.1 17.7 Richmond 3 6 10.6 4.7 7.6 7.6 7.6 14.5 16.8 Richmond 4 6 10.6 4.5 7.6 7.6 7.7 14.2 16.4 Richmond 5 6 10.5 4.6 7.5 7.5 7.6 14.3 16.5 Richmond 6 6 10.5 4.4 7.6 7.7 7.7 14.1 16.2 Richmond 7 6 10.5 4.7 7.4 7.4 7.4 14.3 16.6 Richmond 8 6 10.4 4.5 7.5 7.5 7.5 14.1 16.3 Richmond 9 6 10.3 4.5 7.3 7.4 7.4 14.0 16.2 Richmond 10 6 10.5 4.5 7.6 7.6 7.7 14.2 16.4 Richmond 11 6 10.6 4.3 7.7 7.7 7.8 14.1 16.2 Richmond 12 6 10.5 4.6 7.5 7.5 7.6 14.2 16.4 Richmond 13 6 10.5 4.6 7.5 7.5 7.5 14.2 16.4 Richmond 14 6 10.5 4.7 7.5 7.5 7.5 14.3 16.6 Richmond 15 6 10.9 4.8 7.8 7.8 7.9 14.8 17.1 Sacramento 1 6 10.1 4.0 7.5 7.5 7.5 13.3 15.3 Sacramento 2 6 10.4 4.5 7.4 7.4 7.6 14.1 16.3 Sacramento 3 6 10.5 4.6 7.4 7.5 7.5 14.2 16.5 Sacramento 4 6 10.4 4.8 7.3 7.3 7.4 14.4 16.7 Sacramento 5 6 10.5 4.7 7.4 7.5 7.6 14.3 16.5 Sacramento 6 6 10.4 4.5 7.4 7.4 7.5 14.0 16.2 Sacramento 7 6 10.8 4.9 7.6 7.6 7.6 14.7 17.1 Sacramento 8 6 10.2 4.2 7.5 7.5 7.5 13.6 15.6 Sacramento 9 6 10.2 4.4 7.3 7.3 7.4 13.8 15.9 Sacramento 10 6 10.2 4.3 7.4 7.4 7.5 13.7 15.8 Sacramento 11 6 10.1 4.1 7.4 7.4 7.6 13.5 15.4 Reno 1 6 10.9 4.0 7.4 7.9 9.3 14.3 15.9 Reno 2 6 10.8 3.8 7.5 8.0 9.5 14.0 15.5 Reno 3 6 10.2 3.7 7.3 7.5 8.4 13.2 14.8 Reno 4 6 10.7 3.6 7.5 8.0 9.4 13.8 15.3 Reno 5 6 10.6 3.4 7.8 8.1 9.1 13.5 15.0 Reno 6 6 10.6 3.6 7.5 7.9 9.1 13.7 15.2 Reno 7 4 11.4 4.0 7.8 8.3 10.0 14.8 16.4 Reno 8 4 10.8 3.8 7.5 7.9 9.2 14.0 15.6 Reno 9 6 11.5 3.4 8.7 9.0 9.9 14.3 15.8 Reno 10 6 11.0 3.6 7.6 8.1 9.9 14.1 15.5 Reno 11 4 10.7 3.4 7.5 8.1 9.8 13.6 14.9 Reno 12 4 10.2 3.4 7.3 7.7 8.9 13.1 14.5 Reno 13 4 10.8 3.7 7.5 8.0 9.5 13.9 15.4 Reno 14 6 11.0 3.7 7.7 8.2 9.7 14.2 15.7 Reno 15 4 10.9 3.7 7.7 8.1 9.4 14.1 15.6 Reno 16 4 11.0 3.5 7.6 8.2 10.0 14.0 15.3
Table 4.3: Summary Table of Bicycling Speed (mph) for Each Survey Section
UCPRC-RR-2016-02 56
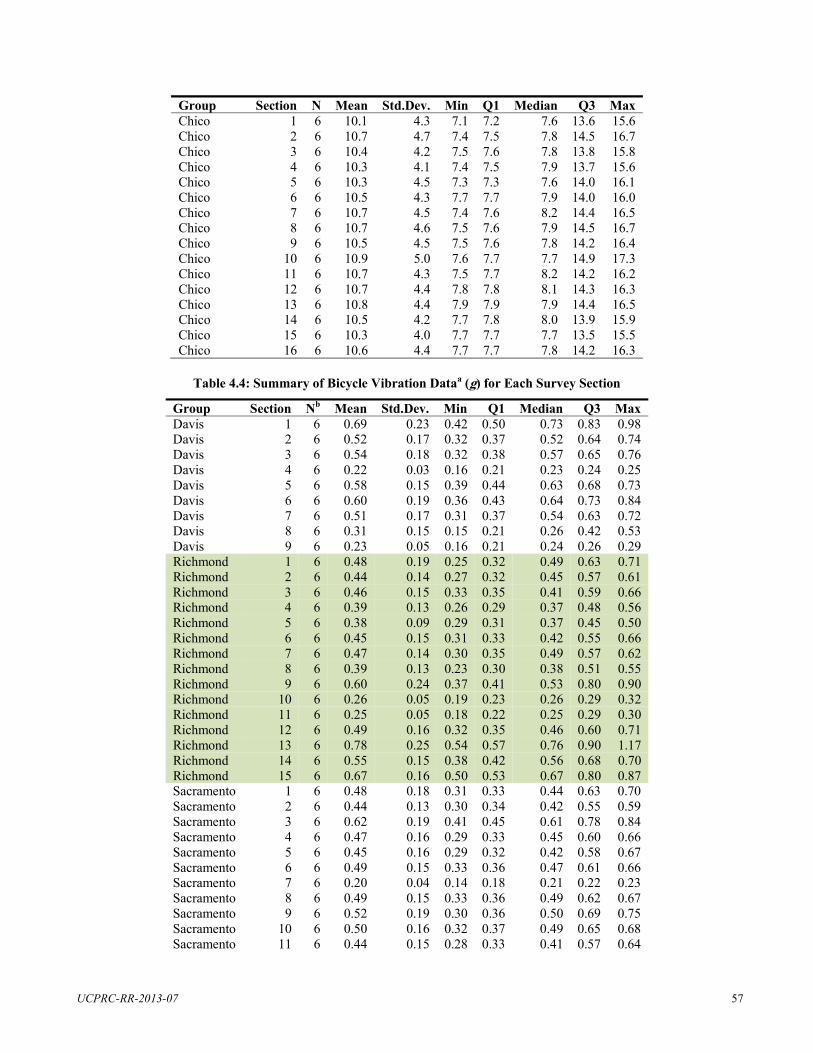
Group Chico
Section 1
N 6
Mean 10.1
Std.Dev. 4.3
Min 7.1
Q1 7.2
Median 7.6
Q3 13.6
Max 15.6
Chico 2 6 10.7 4.7 7.4 7.5 7.8 14.5 16.7Chico 3 6 10.4 4.2 7.5 7.6 7.8 13.8 15.8Chico 4 6 10.3 4.1 7.4 7.5 7.9 13.7 15.6Chico 5 6 10.3 4.5 7.3 7.3 7.6 14.0 16.1Chico 6 6 10.5 4.3 7.7 7.7 7.9 14.0 16.0Chico 7 6 10.7 4.5 7.4 7.6 8.2 14.4 16.5Chico 8 6 10.7 4.6 7.5 7.6 7.9 14.5 16.7Chico 9 6 10.5 4.5 7.5 7.6 7.8 14.2 16.4Chico 10 6 10.9 5.0 7.6 7.7 7.7 14.9 17.3Chico 11 6 10.7 4.3 7.5 7.7 8.2 14.2 16.2Chico 12 6 10.7 4.4 7.8 7.8 8.1 14.3 16.3Chico 13 6 10.8 4.4 7.9 7.9 7.9 14.4 16.5Chico 14 6 10.5 4.2 7.7 7.8 8.0 13.9 15.9Chico 15 6 10.3 4.0 7.7 7.7 7.7 13.5 15.5Chico 16 6 10.6 4.4 7.7 7.7 7.8 14.2 16.3
Group Section Nb Mean Std.Dev. Min Q1 Median Q3 Max Davis 1 6 0.69 0.23 0.42 0.50 0.73 0.83 0.98Davis 2 6 0.52 0.17 0.32 0.37 0.52 0.64 0.74Davis 3 6 0.54 0.18 0.32 0.38 0.57 0.65 0.76Davis 4 6 0.22 0.03 0.16 0.21 0.23 0.24 0.25Davis 5 6 0.58 0.15 0.39 0.44 0.63 0.68 0.73Davis 6 6 0.60 0.19 0.36 0.43 0.64 0.73 0.84Davis 7 6 0.51 0.17 0.31 0.37 0.54 0.63 0.72Davis 8 6 0.31 0.15 0.15 0.21 0.26 0.42 0.53Davis 9 6 0.23 0.05 0.16 0.21 0.24 0.26 0.29
Richmond 1 6 0.48 0.19 0.25 0.32 0.49 0.63 0.71 Richmond 2 6 0.44 0.14 0.27 0.32 0.45 0.57 0.61 Richmond 3 6 0.46 0.15 0.33 0.35 0.41 0.59 0.66 Richmond 4 6 0.39 0.13 0.26 0.29 0.37 0.48 0.56 Richmond 5 6 0.38 0.09 0.29 0.31 0.37 0.45 0.50 Richmond 6 6 0.45 0.15 0.31 0.33 0.42 0.55 0.66 Richmond 7 6 0.47 0.14 0.30 0.35 0.49 0.57 0.62 Richmond 8 6 0.39 0.13 0.23 0.30 0.38 0.51 0.55 Richmond 9 6 0.60 0.24 0.37 0.41 0.53 0.80 0.90 Richmond 10 6 0.26 0.05 0.19 0.23 0.26 0.29 0.32 Richmond 11 6 0.25 0.05 0.18 0.22 0.25 0.29 0.30 Richmond 12 6 0.49 0.16 0.32 0.35 0.46 0.60 0.71 Richmond 13 6 0.78 0.25 0.54 0.57 0.76 0.90 1.17 Richmond 14 6 0.55 0.15 0.38 0.42 0.56 0.68 0.70 Richmond 15 6 0.67 0.16 0.50 0.53 0.67 0.80 0.87
Sacramento 1 6 0.48 0.18 0.31 0.33 0.44 0.63 0.70 Sacramento 2 6 0.44 0.13 0.30 0.34 0.42 0.55 0.59 Sacramento 3 6 0.62 0.19 0.41 0.45 0.61 0.78 0.84 Sacramento 4 6 0.47 0.16 0.29 0.33 0.45 0.60 0.66 Sacramento 5 6 0.45 0.16 0.29 0.32 0.42 0.58 0.67 Sacramento 6 6 0.49 0.15 0.33 0.36 0.47 0.61 0.66 Sacramento 7 6 0.20 0.04 0.14 0.18 0.21 0.22 0.23 Sacramento 8 6 0.49 0.15 0.33 0.36 0.49 0.62 0.67 Sacramento 9 6 0.52 0.19 0.30 0.36 0.50 0.69 0.75 Sacramento 10 6 0.50 0.16 0.32 0.37 0.49 0.65 0.68 Sacramento 11 6 0.44 0.15 0.28 0.33 0.41 0.57 0.64
Table 4.4: Summary of Bicycle Vibration Dataa ( ) for Each Survey Section
UCPRC-RR-2013-07 57
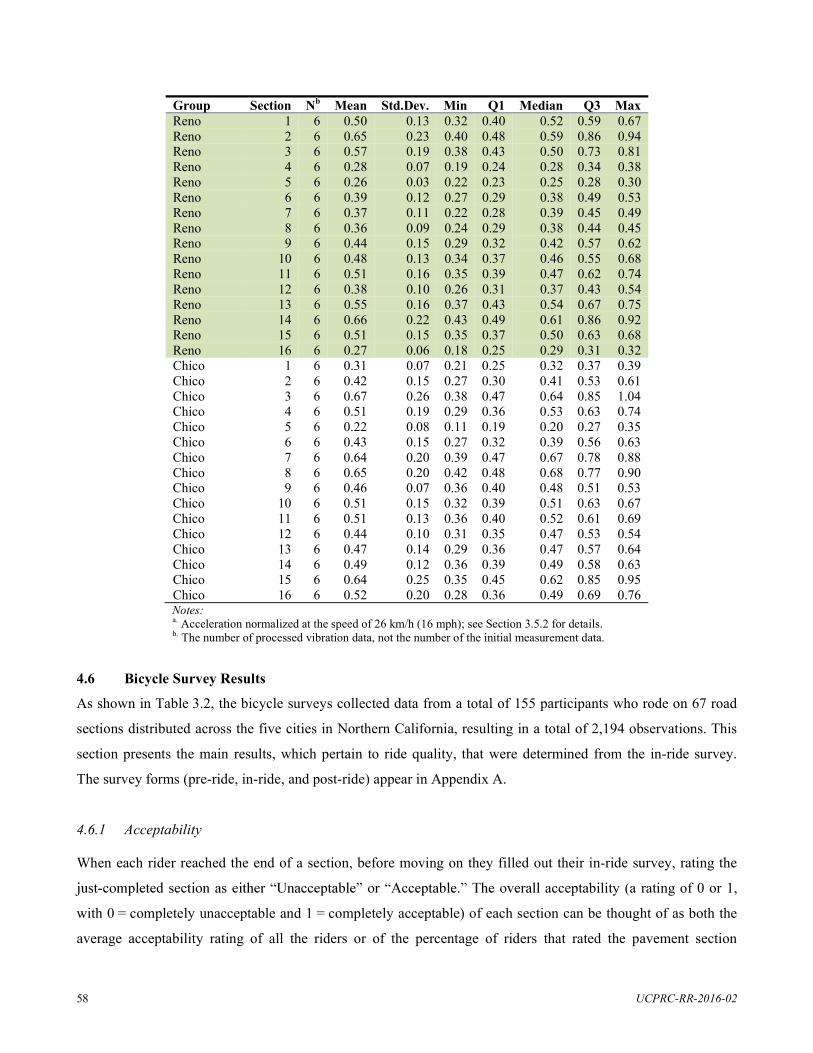
Group Section Nb Mean Std.Dev. Min Q1 Median Q3 Max Reno 1 6 0.50 0.13 0.32 0.40 0.52 0.59 0.67 Reno 2 6 0.65 0.23 0.40 0.48 0.59 0.86 0.94 Reno 3 6 0.57 0.19 0.38 0.43 0.50 0.73 0.81 Reno 4 6 0.28 0.07 0.19 0.24 0.28 0.34 0.38 Reno 5 6 0.26 0.03 0.22 0.23 0.25 0.28 0.30 Reno 6 6 0.39 0.12 0.27 0.29 0.38 0.49 0.53 Reno 7 6 0.37 0.11 0.22 0.28 0.39 0.45 0.49 Reno 8 6 0.36 0.09 0.24 0.29 0.38 0.44 0.45 Reno 9 6 0.44 0.15 0.29 0.32 0.42 0.57 0.62 Reno 10 6 0.48 0.13 0.34 0.37 0.46 0.55 0.68 Reno 11 6 0.51 0.16 0.35 0.39 0.47 0.62 0.74 Reno 12 6 0.38 0.10 0.26 0.31 0.37 0.43 0.54 Reno 13 6 0.55 0.16 0.37 0.43 0.54 0.67 0.75 Reno 14 6 0.66 0.22 0.43 0.49 0.61 0.86 0.92 Reno 15 6 0.51 0.15 0.35 0.37 0.50 0.63 0.68 Reno 16 6 0.27 0.06 0.18 0.25 0.29 0.31 0.32 Chico 1 6 0.31 0.07 0.21 0.25 0.32 0.37 0.39Chico 2 6 0.42 0.15 0.27 0.30 0.41 0.53 0.61Chico 3 6 0.67 0.26 0.38 0.47 0.64 0.85 1.04Chico 4 6 0.51 0.19 0.29 0.36 0.53 0.63 0.74Chico 5 6 0.22 0.08 0.11 0.19 0.20 0.27 0.35Chico 6 6 0.43 0.15 0.27 0.32 0.39 0.56 0.63Chico 7 6 0.64 0.20 0.39 0.47 0.67 0.78 0.88Chico 8 6 0.65 0.20 0.42 0.48 0.68 0.77 0.90Chico 9 6 0.46 0.07 0.36 0.40 0.48 0.51 0.53Chico 10 6 0.51 0.15 0.32 0.39 0.51 0.63 0.67Chico 11 6 0.51 0.13 0.36 0.40 0.52 0.61 0.69Chico 12 6 0.44 0.10 0.31 0.35 0.47 0.53 0.54Chico 13 6 0.47 0.14 0.29 0.36 0.47 0.57 0.64Chico 14 6 0.49 0.12 0.36 0.39 0.49 0.58 0.63Chico 15 6 0.64 0.25 0.35 0.45 0.62 0.85 0.95Chico 16 6 0.52 0.20 0.28 0.36 0.49 0.69 0.76
Notes: a. Acceleration normalized at the speed of 26 km/h (16 mph); see Section 3.5.2 for details. b. The number of processed vibration data, not the number of the initial measurement data.
4.6 Bicycle Survey Results
As shown in Table 3.2, the bicycle surveys collected data from a total of 155 participants who rode on 67 road
sections distributed across the five cities in Northern California, resulting in a total of 2,194 observations. This
section presents the main results, which pertain to ride quality, that were determined from the in-ride survey.
The survey forms (pre-ride, in-ride, and post-ride) appear in Appendix A.
4.6.1 Acceptability
When each rider reached the end of a section, before moving on they filled out their in-ride survey, rating the
with 0 = completely unacceptable and 1 = completely acceptable) of each section can be thought of as both the
average acceptability rating of all the riders or of the percentage of riders that rated the pavement section
acceptability (a rating of 0 or 1,
UCPRC-RR-2016-02 58
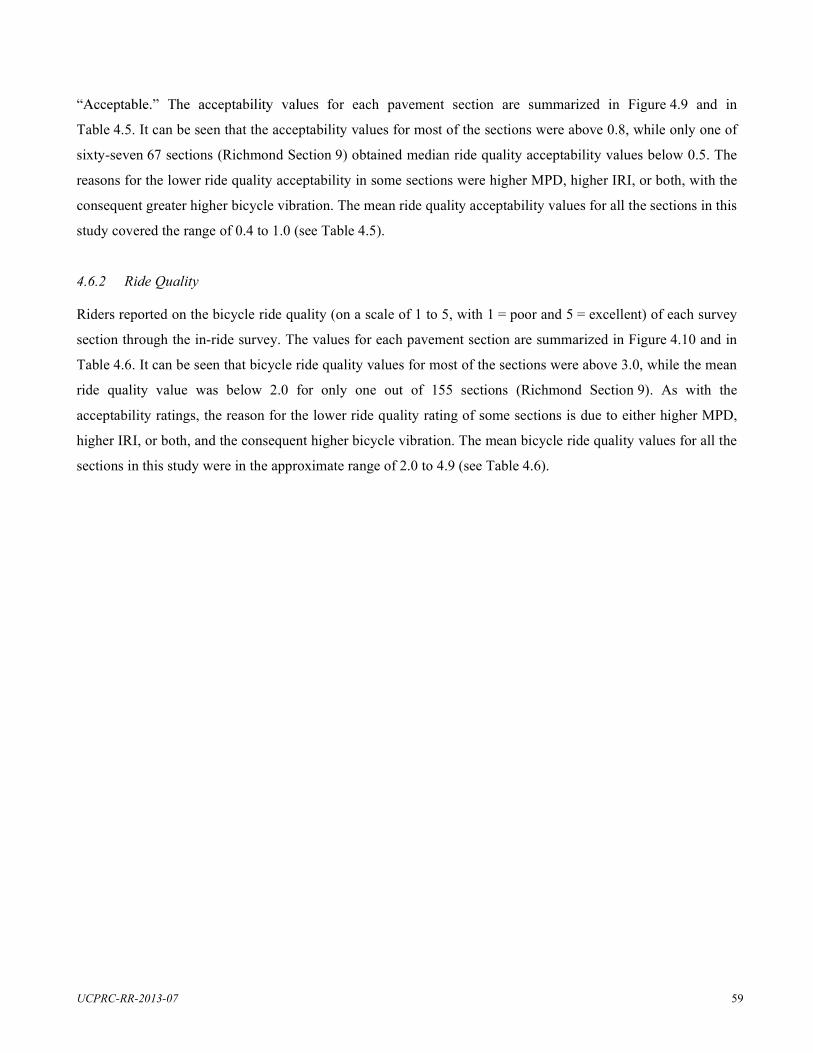
es for each pavement section are summarized in Figure 4.9 and in
Table 4.5. It can be seen that the acceptability values fo r most of the sections we re above 0. 8, while only one of
sixty-seven 67 sections (Richmond Section 9) obtained median ride quality acceptability values below 0.5. The
reasons for the lower ride quality acceptability in some sections w ere higher MPD, higher IRI, or both, with the
consequent greater higher bicycle vi bration. The mean ride quality acceptability values for all the sections in this
study covered the range of 0.4 to 1.0 (see Table 4.5).
4.6.2 Ride Quality
Riders reported on the bicycle ride quality (on a scale of 1 to 5, with 1 = poor and 5 = excellent) of each survey
section through the in-ride survey. The values for each pavement section are summarized in Figure 4.10 and in
Table 4.6. It can be seen that bicycle ride quality values for most of the sections were above 3.0, while the mean
ride quality value was below 2.0 for only one out of 155 sections (Richmond Section 9). As with the
acceptability ratings, the reason for the lower ride quality rating of some sections is due to either higher MPD,
higher IRI, or both, and the consequent higher bicycle vibration. The mean bicycle ride quality values for all the
sections in this study were in the approximate range of 2.0 to 4.9 (see Table 4.6).
UCPRC-RR-2013-07 59
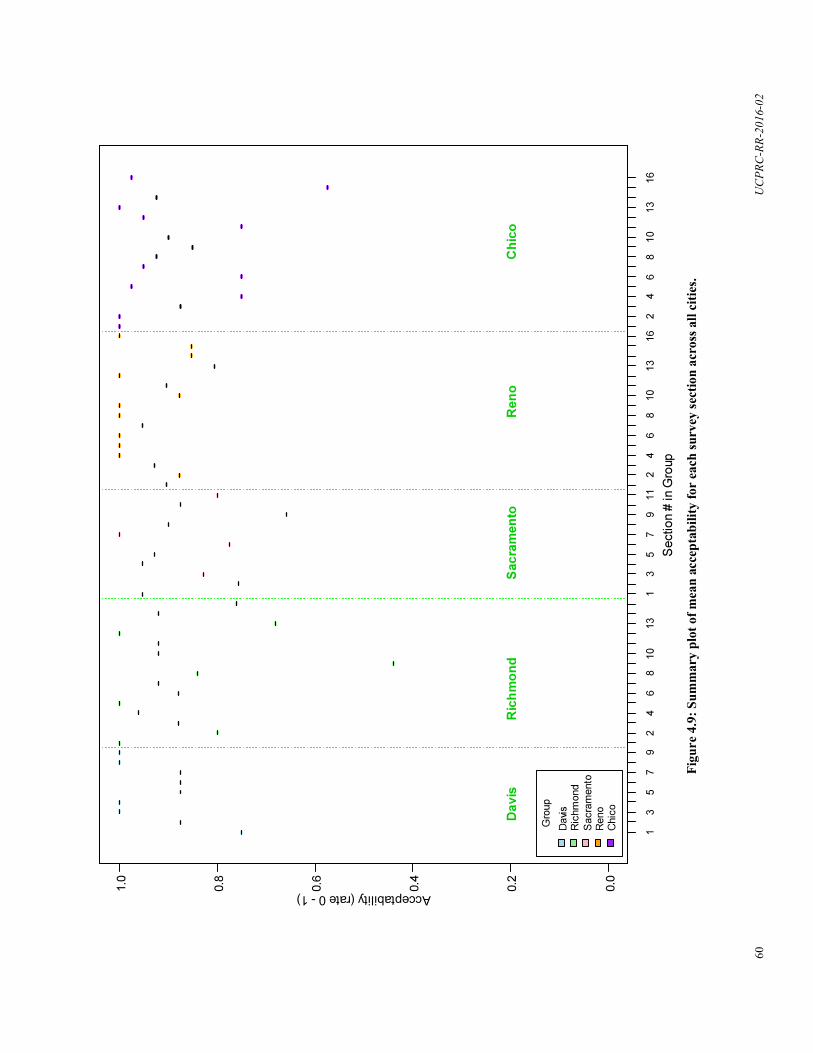
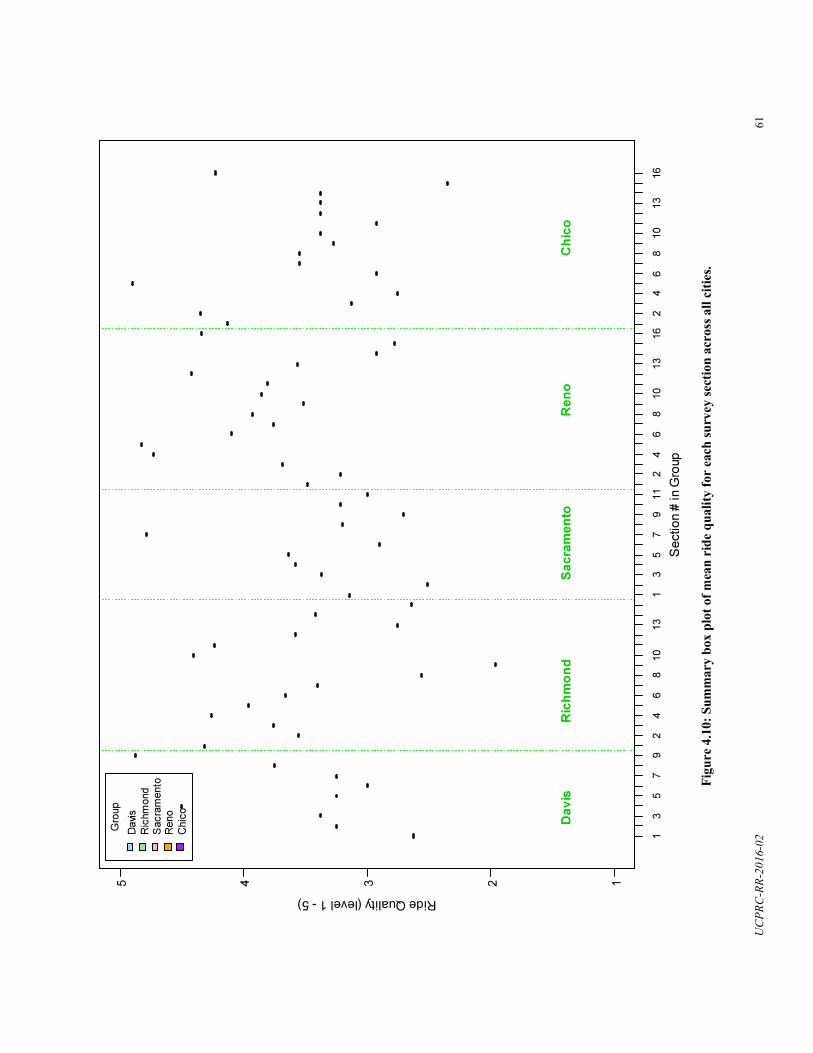
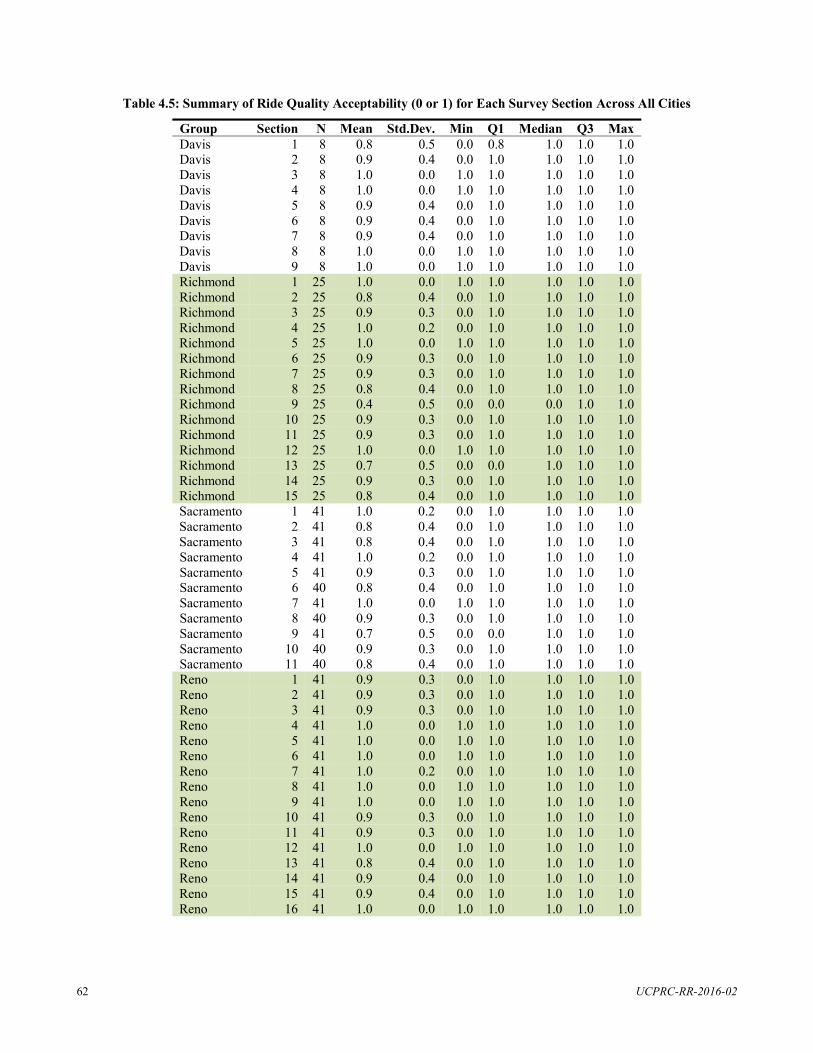
Group Davis
Section 1
N 8
Mean0.8
Std.Dev. 0.5
Min 0.0
Q1 0.8
Median 1.0
Q3 1.0
Max 1.0
Davis 2 8 0.9 0.4 0.0 1.0 1.0 1.0 1.0 Davis 3 8 1.0 0.0 1.0 1.0 1.0 1.0 1.0 Davis 4 8 1.0 0.0 1.0 1.0 1.0 1.0 1.0 Davis 5 8 0.9 0.4 0.0 1.0 1.0 1.0 1.0 Davis 6 8 0.9 0.4 0.0 1.0 1.0 1.0 1.0 Davis 7 8 0.9 0.4 0.0 1.0 1.0 1.0 1.0 Davis 8 8 1.0 0.0 1.0 1.0 1.0 1.0 1.0 Davis 9 8 1.0 0.0 1.0 1.0 1.0 1.0 1.0 Richmond 1 25 1.0 0.0 1.0 1.0 1.0 1.0 1.0 Richmond 2 25 0.8 0.4 0.0 1.0 1.0 1.0 1.0 Richmond 3 25 0.9 0.3 0.0 1.0 1.0 1.0 1.0 Richmond 4 25 1.0 0.2 0.0 1.0 1.0 1.0 1.0 Richmond 5 25 1.0 0.0 1.0 1.0 1.0 1.0 1.0 Richmond 6 25 0.9 0.3 0.0 1.0 1.0 1.0 1.0 Richmond 7 25 0.9 0.3 0.0 1.0 1.0 1.0 1.0 Richmond 8 25 0.8 0.4 0.0 1.0 1.0 1.0 1.0 Richmond 9 25 0.4 0.5 0.0 0.0 0.0 1.0 1.0 Richmond 10 25 0.9 0.3 0.0 1.0 1.0 1.0 1.0 Richmond 11 25 0.9 0.3 0.0 1.0 1.0 1.0 1.0 Richmond 12 25 1.0 0.0 1.0 1.0 1.0 1.0 1.0 Richmond 13 25 0.7 0.5 0.0 0.0 1.0 1.0 1.0 Richmond 14 25 0.9 0.3 0.0 1.0 1.0 1.0 1.0 Richmond 15 25 0.8 0.4 0.0 1.0 1.0 1.0 1.0 Sacramento 1 41 1.0 0.2 0.0 1.0 1.0 1.0 1.0 Sacramento 2 41 0.8 0.4 0.0 1.0 1.0 1.0 1.0 Sacramento 3 41 0.8 0.4 0.0 1.0 1.0 1.0 1.0 Sacramento 4 41 1.0 0.2 0.0 1.0 1.0 1.0 1.0 Sacramento 5 41 0.9 0.3 0.0 1.0 1.0 1.0 1.0 Sacramento 6 40 0.8 0.4 0.0 1.0 1.0 1.0 1.0 Sacramento 7 41 1.0 0.0 1.0 1.0 1.0 1.0 1.0 Sacramento 8 40 0.9 0.3 0.0 1.0 1.0 1.0 1.0 Sacramento 9 41 0.7 0.5 0.0 0.0 1.0 1.0 1.0 Sacramento 10 40 0.9 0.3 0.0 1.0 1.0 1.0 1.0 Sacramento 11 40 0.8 0.4 0.0 1.0 1.0 1.0 1.0 Reno 1 41 0.9 0.3 0.0 1.0 1.0 1.0 1.0 Reno 2 41 0.9 0.3 0.0 1.0 1.0 1.0 1.0 Reno 3 41 0.9 0.3 0.0 1.0 1.0 1.0 1.0 Reno 4 41 1.0 0.0 1.0 1.0 1.0 1.0 1.0 Reno 5 41 1.0 0.0 1.0 1.0 1.0 1.0 1.0 Reno 6 41 1.0 0.0 1.0 1.0 1.0 1.0 1.0 Reno 7 41 1.0 0.2 0.0 1.0 1.0 1.0 1.0 Reno 8 41 1.0 0.0 1.0 1.0 1.0 1.0 1.0 Reno 9 41 1.0 0.0 1.0 1.0 1.0 1.0 1.0 Reno 10 41 0.9 0.3 0.0 1.0 1.0 1.0 1.0 Reno 11 41 0.9 0.3 0.0 1.0 1.0 1.0 1.0 Reno 12 41 1.0 0.0 1.0 1.0 1.0 1.0 1.0 Reno 13 41 0.8 0.4 0.0 1.0 1.0 1.0 1.0 Reno 14 41 0.9 0.4 0.0 1.0 1.0 1.0 1.0 Reno 15 41 0.9 0.4 0.0 1.0 1.0 1.0 1.0 Reno 16 41 1.0 0.0 1.0 1.0 1.0 1.0 1.0
Table 4.5: Summary of Ride Quality Acceptability (0 or 1) for Each Survey Section Across All Cities
UCPRC-RR-2016-02 62
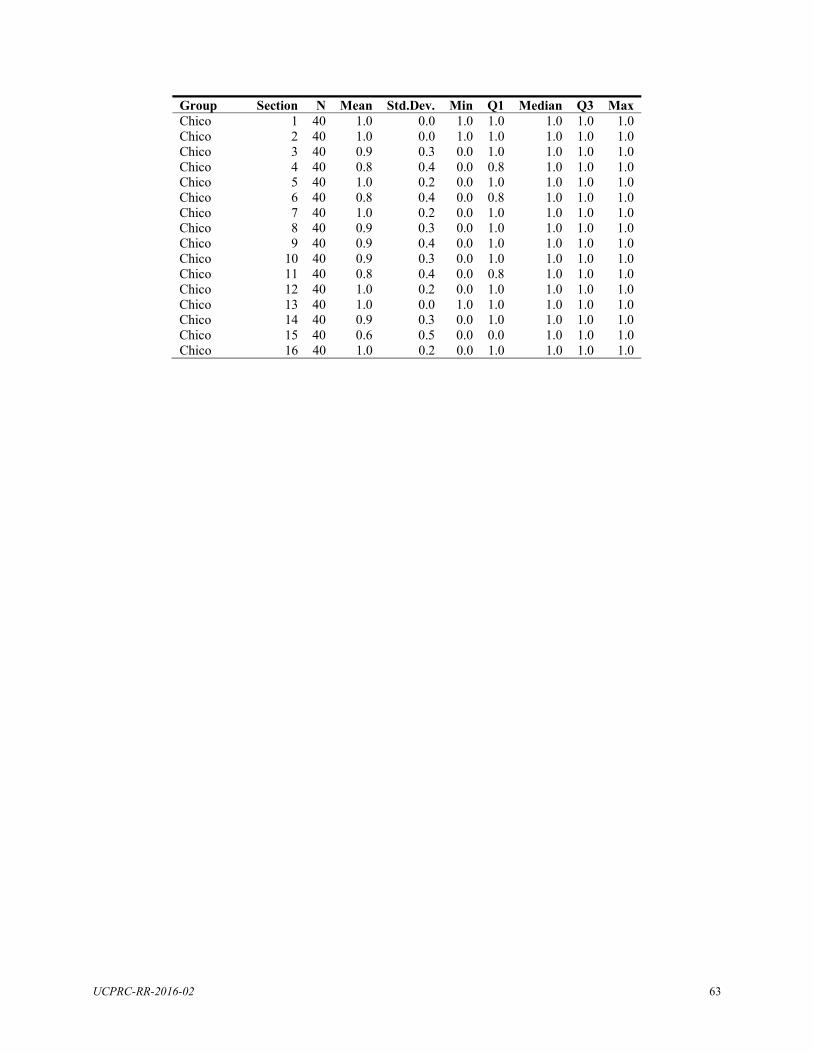
123456789
10111213141516
Group Chico
Section N 40
Mean1.0
Std.Dev. 0.0
Min 1.0
Q1 1.0
Median 1.0
Q31.0
Max 1.0
Chico 40 1.0 0.0 1.0 1.0 1.0 1.0 1.0Chico 40 0.9 0.3 0.0 1.0 1.0 1.0 1.0Chico 40 0.8 0.4 0.0 0.8 1.0 1.0 1.0Chico 40 1.0 0.2 0.0 1.0 1.0 1.0 1.0Chico 40 0.8 0.4 0.0 0.8 1.0 1.0 1.0Chico 40 1.0 0.2 0.0 1.0 1.0 1.0 1.0Chico 40 0.9 0.3 0.0 1.0 1.0 1.0 1.0Chico 40 0.9 0.4 0.0 1.0 1.0 1.0 1.0Chico 40 0.9 0.3 0.0 1.0 1.0 1.0 1.0 Chico 40 0.8 0.4 0.0 0.8 1.0 1.0 1.0 Chico 40 1.0 0.2 0.0 1.0 1.0 1.0 1.0 Chico 40 1.0 0.0 1.0 1.0 1.0 1.0 1.0 Chico 40 0.9 0.3 0.0 1.0 1.0 1.0 1.0 Chico 40 0.6 0.5 0.0 0.0 1.0 1.0 1.0 Chico 40 1.0 0.2 0.0 1.0 1.0 1.0 1.0
UCPRC-RR-2016-02 63
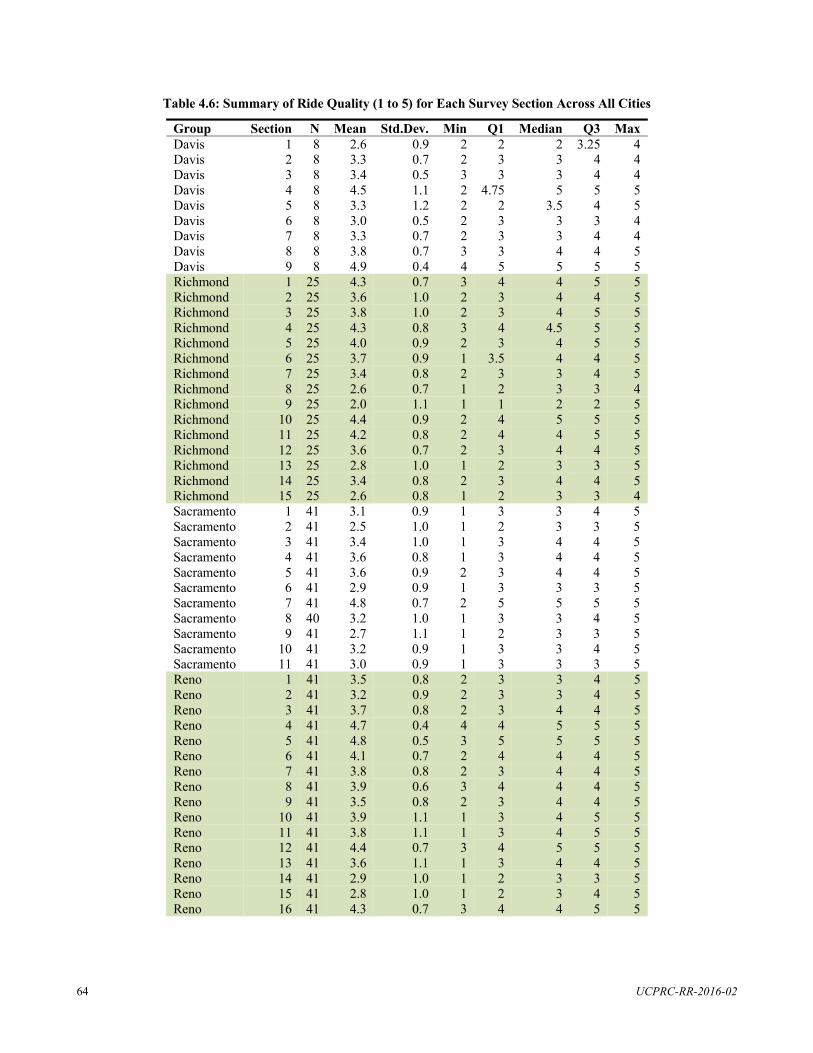
Group Davis
Section 1
N8 Mean
2.6 Std.Dev.
0.9 Min
2 Q1
2 Median
2 Q3
3.25 Max
4Davis 2 8 3.3 0.7 2 3 3 4 4Davis 3 8 3.4 0.5 3 3 3 4 4Davis 4 8 4.5 1.1 2 4.75 5 5 5Davis 5 8 3.3 1.2 2 2 3.5 4 5Davis 6 8 3.0 0.5 2 3 3 3 4Davis 7 8 3.3 0.7 2 3 3 4 4Davis 8 8 3.8 0.7 3 3 4 4 5Davis 9 8 4.9 0.4 4 5 5 5 5Richmond 1 25 4.3 0.7 3 4 4 5 5 Richmond 2 25 3.6 1.0 2 3 4 4 5 Richmond 3 25 3.8 1.0 2 3 4 5 5 Richmond 4 25 4.3 0.8 3 4 4.5 5 5 Richmond 5 25 4.0 0.9 2 3 4 5 5 Richmond 6 25 3.7 0.9 1 3.5 4 4 5 Richmond 7 25 3.4 0.8 2 3 3 4 5 Richmond 8 25 2.6 0.7 1 2 3 3 4 Richmond 9 25 2.0 1.1 1 1 2 2 5 Richmond 10 25 4.4 0.9 2 4 5 5 5 Richmond 11 25 4.2 0.8 2 4 4 5 5 Richmond 12 25 3.6 0.7 2 3 4 4 5 Richmond 13 25 2.8 1.0 1 2 3 3 5 Richmond 14 25 3.4 0.8 2 3 4 4 5 Richmond 15 25 2.6 0.8 1 2 3 3 4 Sacramento 1 41 3.1 0.9 1 3 3 4 5Sacramento 2 41 2.5 1.0 1 2 3 3 5Sacramento 3 41 3.4 1.0 1 3 4 4 5Sacramento 4 41 3.6 0.8 1 3 4 4 5Sacramento 5 41 3.6 0.9 2 3 4 4 5Sacramento 6 41 2.9 0.9 1 3 3 3 5Sacramento 7 41 4.8 0.7 2 5 5 5 5Sacramento 8 40 3.2 1.0 1 3 3 4 5Sacramento 9 41 2.7 1.1 1 2 3 3 5Sacramento 10 41 3.2 0.9 1 3 3 4 5 Sacramento 11 41 3.0 0.9 1 3 3 3 5 Reno 1 41 3.5 0.8 2 3 3 4 5 Reno 2 41 3.2 0.9 2 3 3 4 5 Reno 3 41 3.7 0.8 2 3 4 4 5 Reno 4 41 4.7 0.4 4 4 5 5 5 Reno 5 41 4.8 0.5 3 5 5 5 5 Reno 6 41 4.1 0.7 2 4 4 4 5 Reno 7 41 3.8 0.8 2 3 4 4 5 Reno 8 41 3.9 0.6 3 4 4 4 5 Reno 9 41 3.5 0.8 2 3 4 4 5 Reno 10 41 3.9 1.1 1 3 4 5 5 Reno 11 41 3.8 1.1 1 3 4 5 5 Reno 12 41 4.4 0.7 3 4 5 5 5 Reno 13 41 3.6 1.1 1 3 4 4 5 Reno 14 41 2.9 1.0 1 2 3 3 5 Reno 15 41 2.8 1.0 1 2 3 4 5 Reno 16 41 4.3 0.7 3 4 4 5 5
Table 4.6: Summary of Ride Quality (1 to 5) for Each Survey Section Across All Cities
UCPRC-RR-2016-02 64
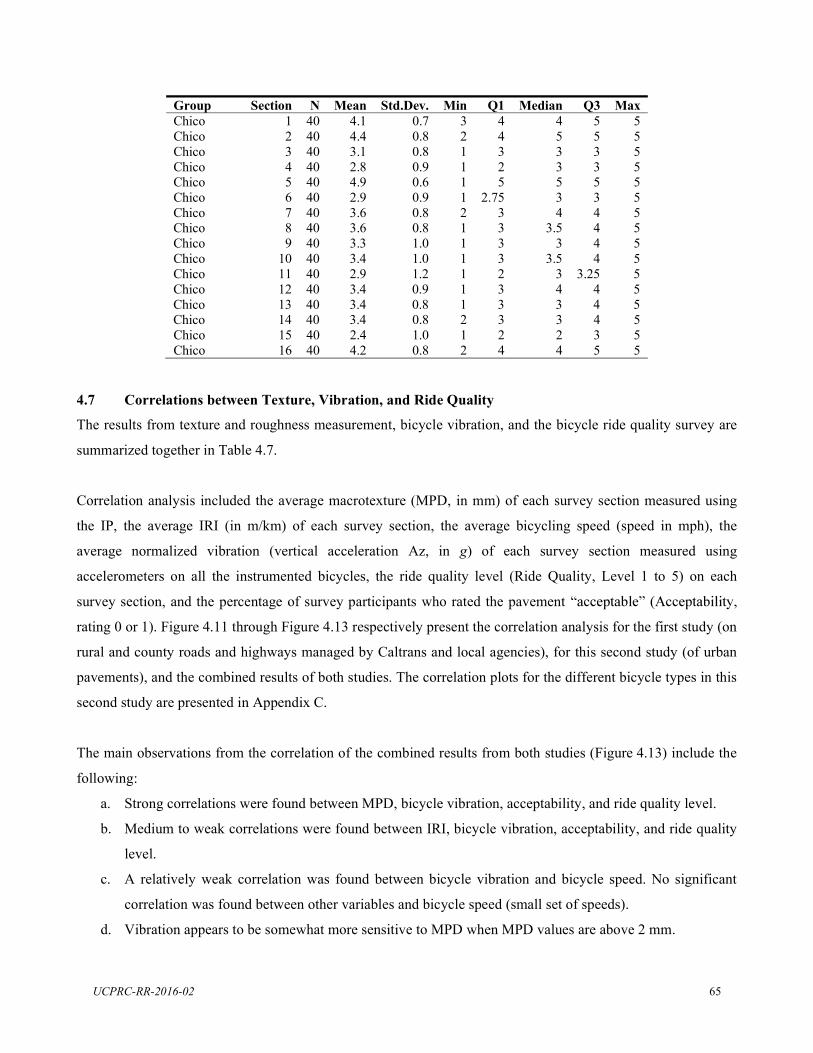
Group Chico
Section 1
N40
Mean 4.1
Std.Dev. 0.7
Min 3
Q1 4
Median 4
Q35
Max 5
Chico 2 40 4.4 0.8 2 4 5 5 5Chico 3 40 3.1 0.8 1 3 3 3 5Chico 4 40 2.8 0.9 1 2 3 3 5Chico 5 40 4.9 0.6 1 5 5 5 5Chico 6 40 2.9 0.9 1 2.75 3 3 5Chico 7 40 3.6 0.8 2 3 4 4 5Chico 8 40 3.6 0.8 1 3 3.5 4 5Chico 9 40 3.3 1.0 1 3 3 4 5Chico 10 40 3.4 1.0 1 3 3.5 4 5Chico 11 40 2.9 1.2 1 2 3 3.25 5Chico 12 40 3.4 0.9 1 3 4 4 5Chico 13 40 3.4 0.8 1 3 3 4 5Chico 14 40 3.4 0.8 2 3 3 4 5Chico 15 40 2.4 1.0 1 2 2 3 5Chico 16 40 4.2 0.8 2 4 4 5 5
4.7 Correlations between Texture, Vibration, and Ride Quality
The results from texture and roughness measurement, bicycle vibration, and the bicycle ride quality survey are
summarized together in Table 4.7.
Correlation analysis included the average macrotexture (MPD, in mm) of each survey section measured using
the IP, the average IRI (in m/km) of each survey section, the average bicycling speed (speed in mph), the
average normalized vibration (vertical acceleration Az, in g) of each survey section measured using
accelerometers on all the instrumented bicycles, the ride quality level (Ride Quality, Level 1 to 5) on each
survey section, and the percentage of survey participants who rated the pavement
rating 0 or 1). Figure 4.11 through Figure 4.13 respectively present the correlation analysis for the first study (on
rural and county roads and highways managed by Caltrans and local agencies), for this second study (of urban
pavements), and the combined results of both studies. The correlation plots for the different bicycle types in this
second study are presented in Appendix C.
The main observations from the correlation of the combined results from both studies (Figure 4.13) include the
following:
a. Strong correlations were found between MPD, bicycle vibration, acceptability, and ride quality level.
b. Medium to weak correlations were found between IRI, bicycle vibration, acceptability, and ride quality
level.
c. A relatively weak correlation was found between bicycle vibration and bicycle speed. No significant
correlation was found between other variables and bicycle speed (small set of speeds).
d. Vibration appears to be somewhat more sensitive to MPD when MPD values are above 2 mm.
UCPRC-RR-2016-02 65
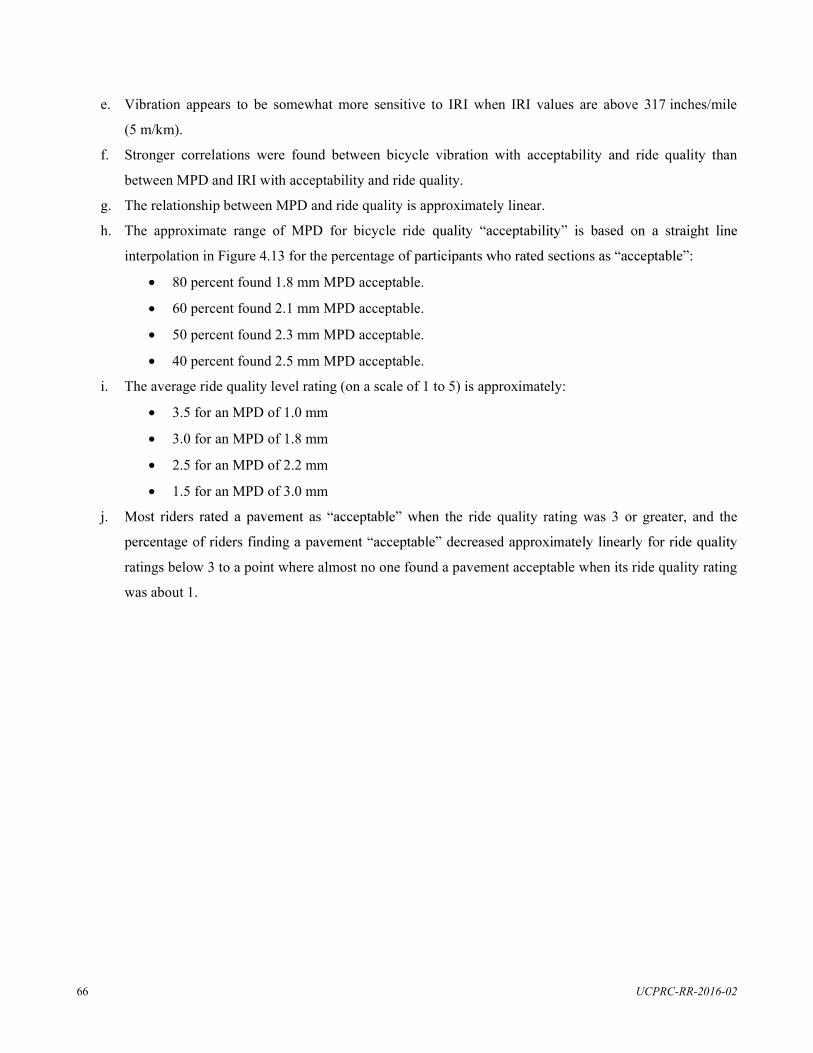
e. Vibration appears to be somewhat more sensitive to IRI when IRI values are above 317 inches/mile
(5 m/km).
f. Stronger correlations were found between bicycle vibration with acceptability and ride quality than
between MPD and IRI with acceptability and ride quality.
g. The relationship between MPD and ride quality is approximately linear.
h. The approximate range of MPD for bicycle ride
interpolation in Figure 4.13 for the percentage
80 percent found 1.8 mm MPD acceptable.
60 percent found 2.1 mm MPD acceptable.
50 percent found 2.3 mm MPD acceptable.
40 percent found 2.5 mm MPD acceptable.
i. The average ride quality level rating (on a scale of 1 to 5) is approximately:
3.5 for an MPD of 1.0 mm
3.0 for an MPD of 1.8 mm
2.5 for an MPD of 2.2 mm
1.5 for an MPD of 3.0 mm
j. the ride quality rating was 3 or greater, and the
ratings below 3 to a point where almost no one found a pavement acceptable when its ride quality rating
was about 1.
UCPRC-RR-2016-02 66
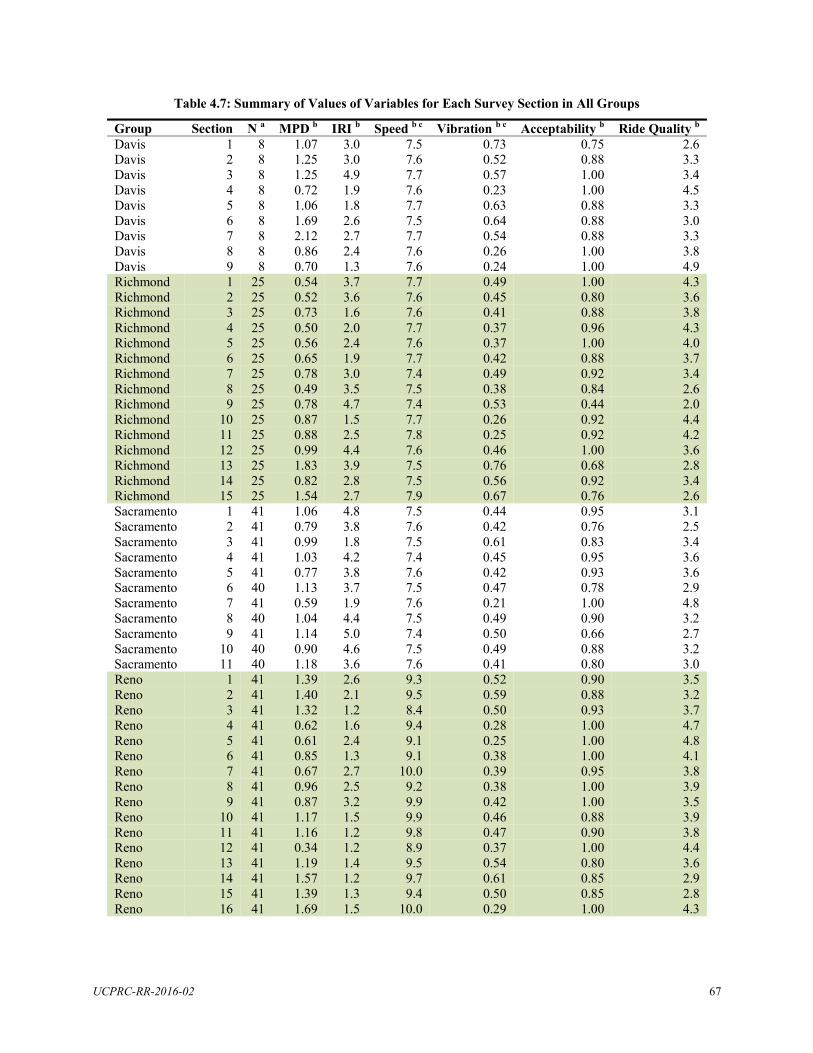
Group Davis
Section 1
N a8 MPD b
1.07 IRI b
3.0 Speed b c
7.5 Vibration b c
0.73 Acceptability b
0.75 Ride Quality b
2.6Davis 2 8 1.25 3.0 7.6 0.52 0.88 3.3Davis 3 8 1.25 4.9 7.7 0.57 1.00 3.4Davis 4 8 0.72 1.9 7.6 0.23 1.00 4.5Davis 5 8 1.06 1.8 7.7 0.63 0.88 3.3Davis 6 8 1.69 2.6 7.5 0.64 0.88 3.0Davis 7 8 2.12 2.7 7.7 0.54 0.88 3.3Davis 8 8 0.86 2.4 7.6 0.26 1.00 3.8Davis 9 8 0.70 1.3 7.6 0.24 1.00 4.9Richmond 1 25 0.54 3.7 7.7 0.49 1.00 4.3 Richmond 2 25 0.52 3.6 7.6 0.45 0.80 3.6 Richmond 3 25 0.73 1.6 7.6 0.41 0.88 3.8 Richmond 4 25 0.50 2.0 7.7 0.37 0.96 4.3 Richmond 5 25 0.56 2.4 7.6 0.37 1.00 4.0 Richmond 6 25 0.65 1.9 7.7 0.42 0.88 3.7 Richmond 7 25 0.78 3.0 7.4 0.49 0.92 3.4 Richmond 8 25 0.49 3.5 7.5 0.38 0.84 2.6 Richmond 9 25 0.78 4.7 7.4 0.53 0.44 2.0 Richmond 10 25 0.87 1.5 7.7 0.26 0.92 4.4 Richmond 11 25 0.88 2.5 7.8 0.25 0.92 4.2 Richmond 12 25 0.99 4.4 7.6 0.46 1.00 3.6 Richmond 13 25 1.83 3.9 7.5 0.76 0.68 2.8 Richmond 14 25 0.82 2.8 7.5 0.56 0.92 3.4 Richmond 15 25 1.54 2.7 7.9 0.67 0.76 2.6 Sacramento 1 41 1.06 4.8 7.5 0.44 0.95 3.1Sacramento 2 41 0.79 3.8 7.6 0.42 0.76 2.5Sacramento 3 41 0.99 1.8 7.5 0.61 0.83 3.4Sacramento 4 41 1.03 4.2 7.4 0.45 0.95 3.6Sacramento 5 41 0.77 3.8 7.6 0.42 0.93 3.6Sacramento 6 40 1.13 3.7 7.5 0.47 0.78 2.9Sacramento 7 41 0.59 1.9 7.6 0.21 1.00 4.8Sacramento 8 40 1.04 4.4 7.5 0.49 0.90 3.2Sacramento 9 41 1.14 5.0 7.4 0.50 0.66 2.7Sacramento 10 40 0.90 4.6 7.5 0.49 0.88 3.2Sacramento 11 40 1.18 3.6 7.6 0.41 0.80 3.0Reno 1 41 1.39 2.6 9.3 0.52 0.90 3.5 Reno 2 41 1.40 2.1 9.5 0.59 0.88 3.2 Reno 3 41 1.32 1.2 8.4 0.50 0.93 3.7 Reno 4 41 0.62 1.6 9.4 0.28 1.00 4.7 Reno 5 41 0.61 2.4 9.1 0.25 1.00 4.8 Reno 6 41 0.85 1.3 9.1 0.38 1.00 4.1 Reno 7 41 0.67 2.7 10.0 0.39 0.95 3.8 Reno 8 41 0.96 2.5 9.2 0.38 1.00 3.9 Reno 9 41 0.87 3.2 9.9 0.42 1.00 3.5 Reno 10 41 1.17 1.5 9.9 0.46 0.88 3.9 Reno 11 41 1.16 1.2 9.8 0.47 0.90 3.8 Reno 12 41 0.34 1.2 8.9 0.37 1.00 4.4 Reno 13 41 1.19 1.4 9.5 0.54 0.80 3.6 Reno 14 41 1.57 1.2 9.7 0.61 0.85 2.9 Reno 15 41 1.39 1.3 9.4 0.50 0.85 2.8 Reno 16 41 1.69 1.5 10.0 0.29 1.00 4.3
Table 4.7: Summary of Values of Variables for Each Survey Section in All Groups
UCPRC-RR-2016-02 67
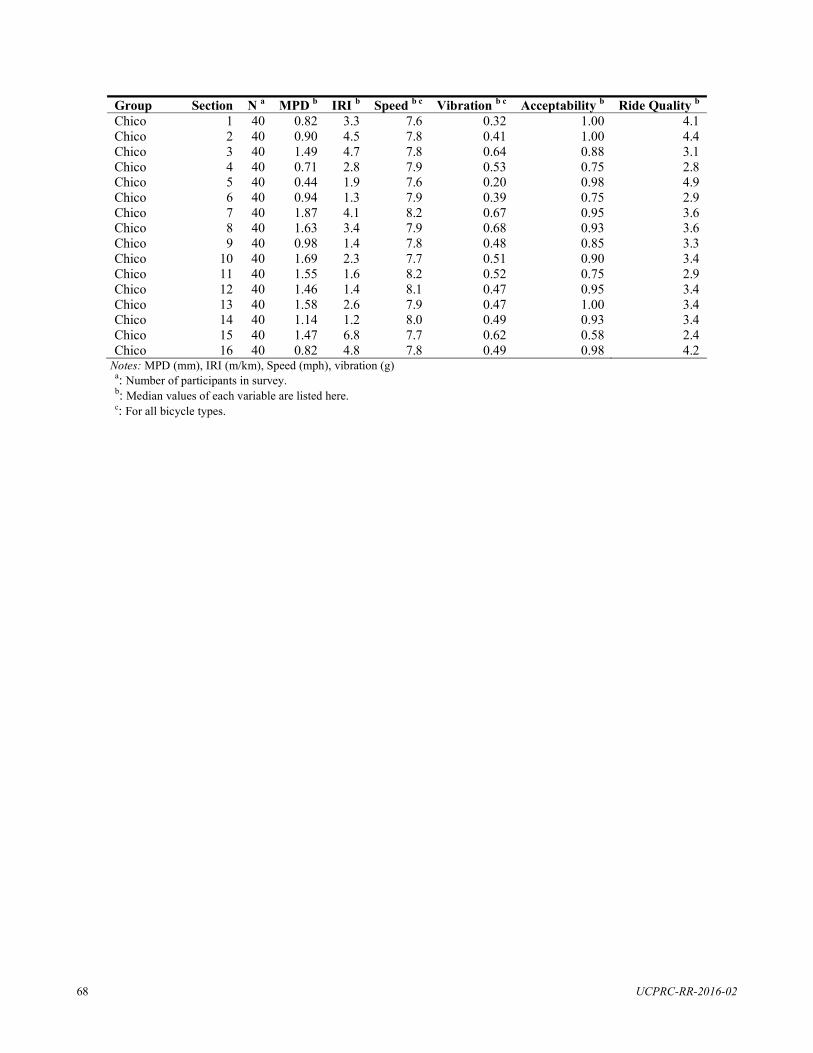
Group Chico
Section 1
N a40
MPD b0.82
IRI b3.3
Speed b c
7.6 Vibration b c
0.32 Acceptability b
1.00 Ride Quality b
4.1Chico 2 40 0.90 4.5 7.8 0.41 1.00 4.4Chico 3 40 1.49 4.7 7.8 0.64 0.88 3.1Chico 4 40 0.71 2.8 7.9 0.53 0.75 2.8Chico 5 40 0.44 1.9 7.6 0.20 0.98 4.9Chico 6 40 0.94 1.3 7.9 0.39 0.75 2.9Chico 7 40 1.87 4.1 8.2 0.67 0.95 3.6Chico 8 40 1.63 3.4 7.9 0.68 0.93 3.6Chico 9 40 0.98 1.4 7.8 0.48 0.85 3.3Chico 10 40 1.69 2.3 7.7 0.51 0.90 3.4Chico 11 40 1.55 1.6 8.2 0.52 0.75 2.9Chico 12 40 1.46 1.4 8.1 0.47 0.95 3.4Chico 13 40 1.58 2.6 7.9 0.47 1.00 3.4Chico 14 40 1.14 1.2 8.0 0.49 0.93 3.4Chico 15 40 1.47 6.8 7.7 0.62 0.58 2.4Chico 16 40 0.82 4.8 7.8 0.49 0.98 4.2
Notes: MPD (mm), IRI (m/km), Speed (mph), vibration (g)
a: Number of participants in survey. b: Median values of each variable are listed here. c: For all bicycle types.
UCPRC-RR-2016-02 68
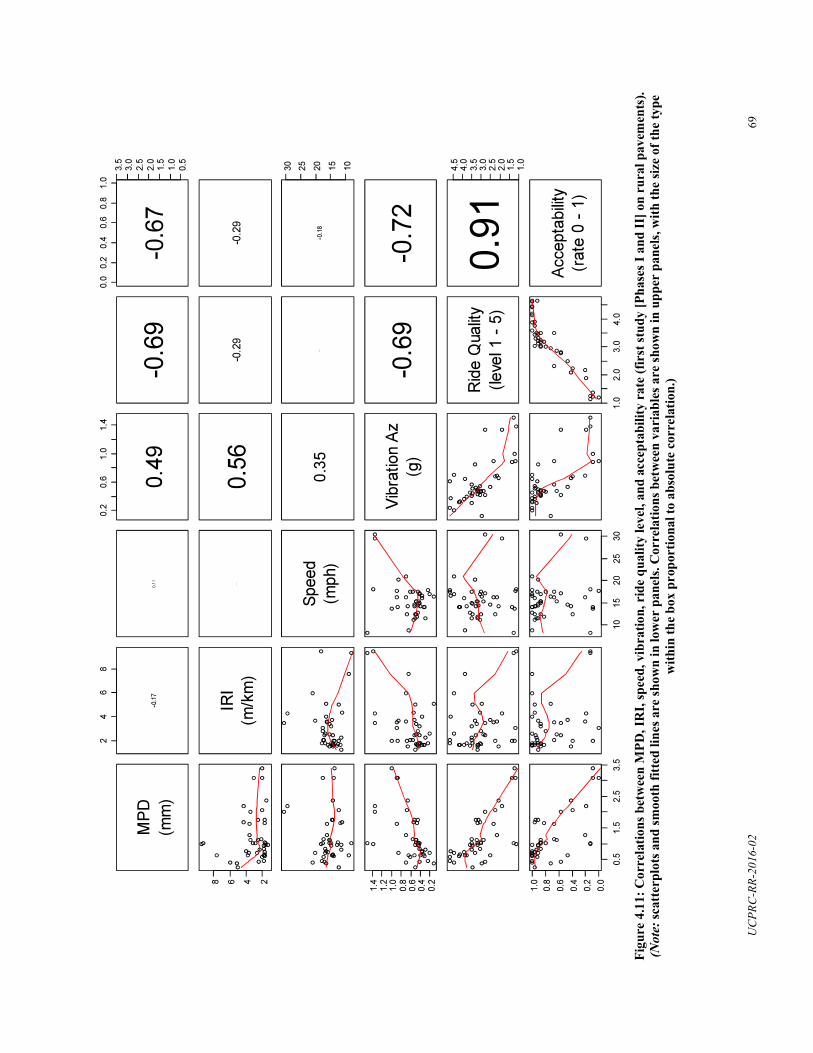
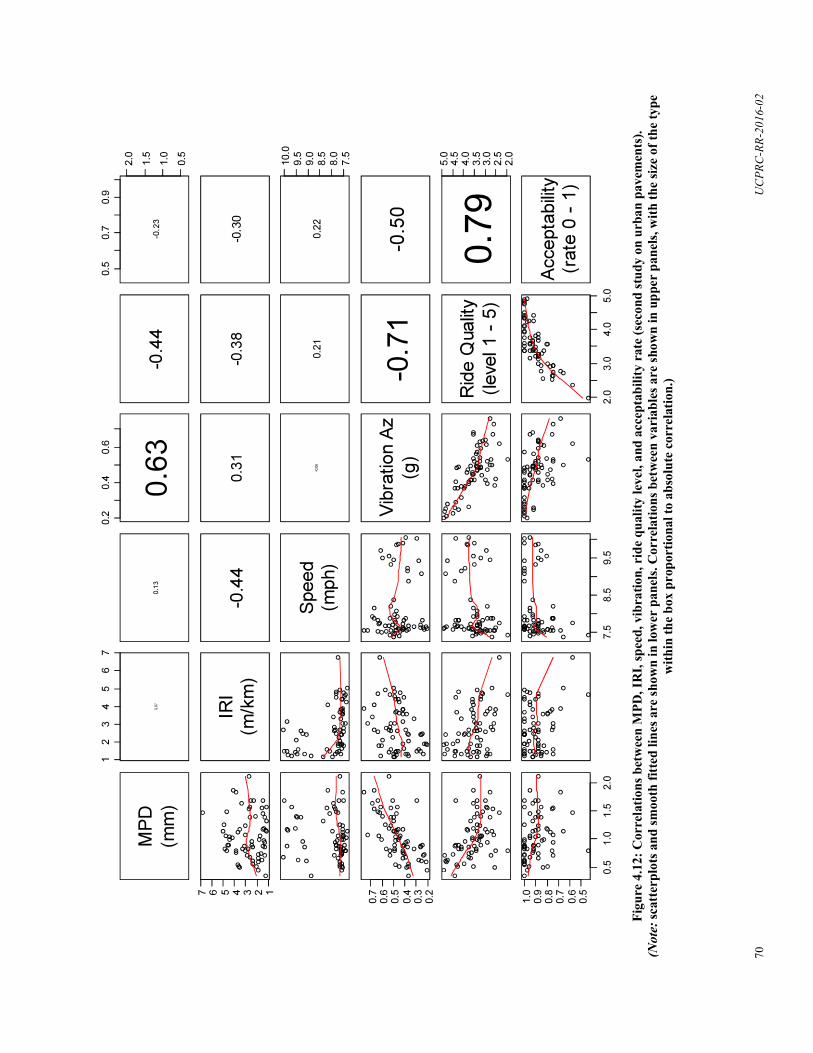
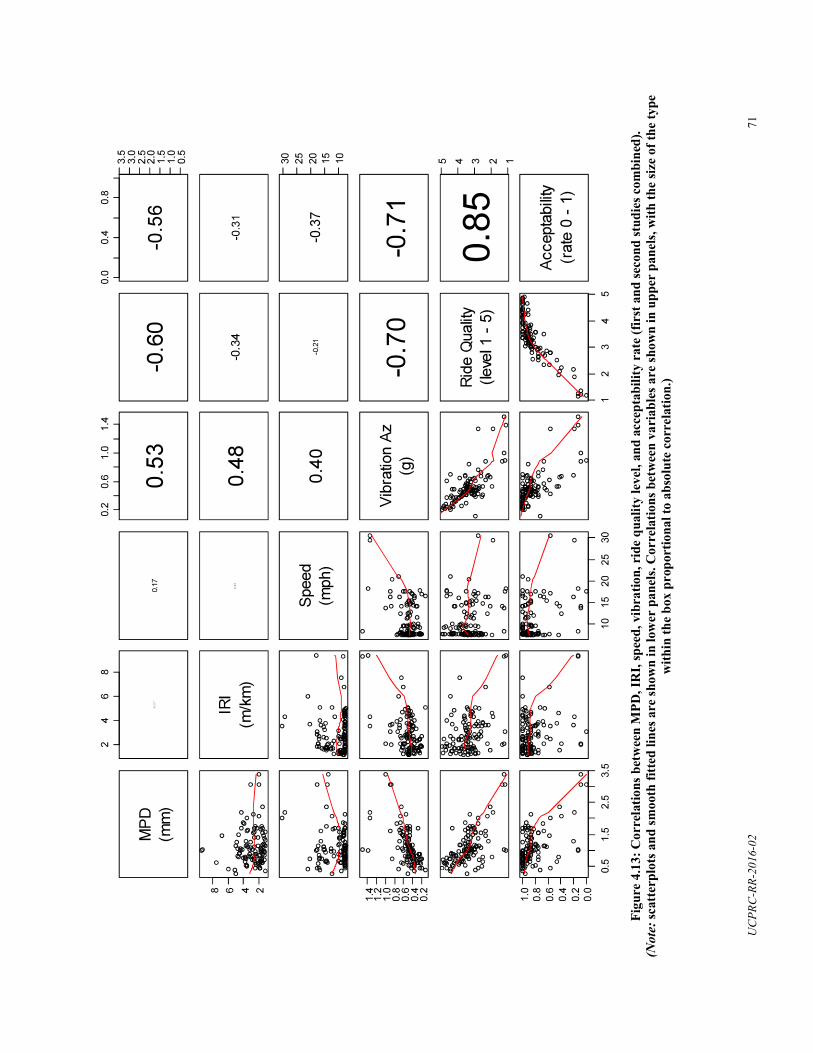

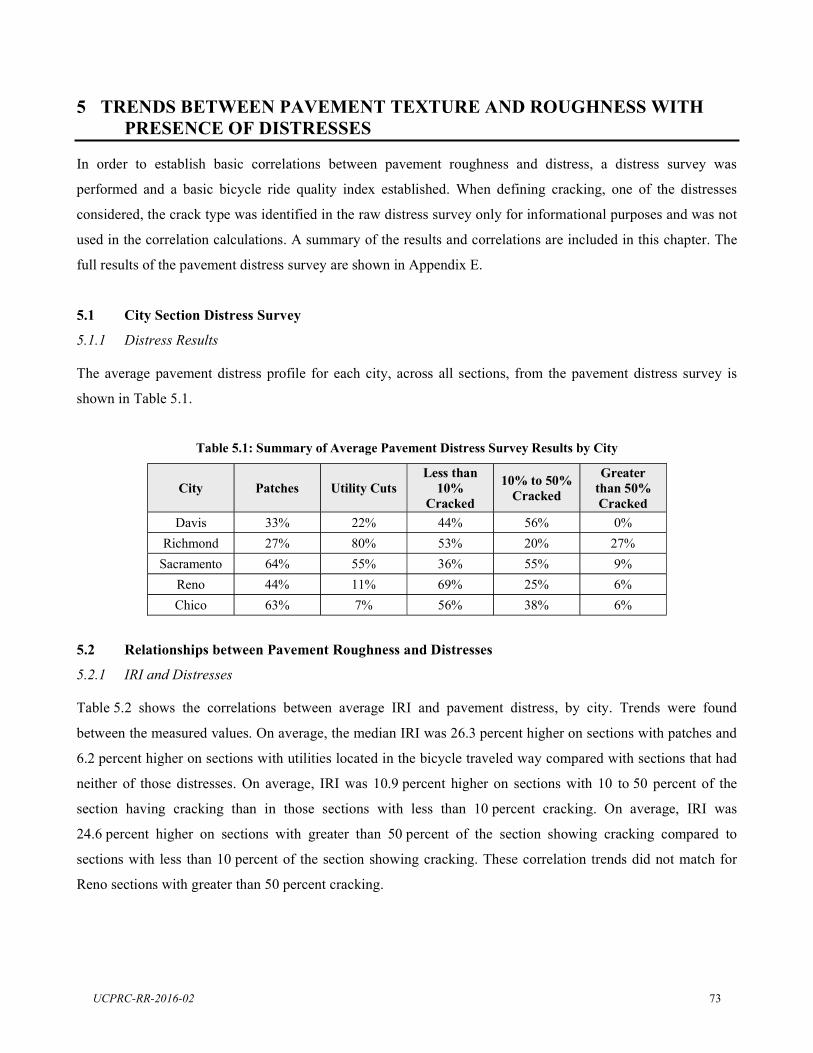
5 TRENDS BETWEEN PAVEMENT TEXTURE AND ROUGHNESS WITH PRESENCE OF DISTRESSES
In order to establish basic correlations between pavement roughness and distress, a distress survey was
performed and a basic bicycle ride quality index established. When defining cracking, one of the distresses
considered, the crack type was identified in the raw distress survey only for informational purposes and was not
used in the correlation calculations. A summary of the results and correlations are included in this chapter. The
full results of the pavement distress survey are shown in Appendix E.
5.1 City Section Distress Survey
5.1.1 Distress Results
The average pavement distress profile for each city, across all sections, from the pavement distress survey is
shown in Table 5.1.
Table 5.1: Summary of Average Pavement Distress Survey Results by City
City Patches Utility Cuts Less than
10% Cracked
10% to 50% Cracked
Greater than 50% Cracked
Davis 33% 22% 44% 56% 0% Richmond 27% 80% 53% 20% 27%
Sacramento 64% 55% 36% 55% 9% Reno 44% 11% 69% 25% 6% Chico 63% 7% 56% 38% 6%
5.2 Relationships between Pavement Roughness and Distresses
5.2.1 IRI and Distresses
Table 5.2 shows the correlations between average IRI and pavement distress, by city. Trends were found
between the measured values. On average, the median IRI was 26.3 percent higher on sections with patches and
6.2 percent higher on sections with utilities located in the bicycle traveled way compared with sections that had
neither of those distresses. On average, IRI was 10.9 percent higher on sections with 10 to 50 percent of the
section having cracking than in those sections with less than 10 percent cracking. On average, IRI was
24.6 percent higher on sections with greater than 50 percent of the section showing cracking compared to
sections with less than 10 percent of the section showing cracking. These correlation trends did not match for
Reno sections with greater than 50 percent cracking.
UCPRC-RR-2016-02 73
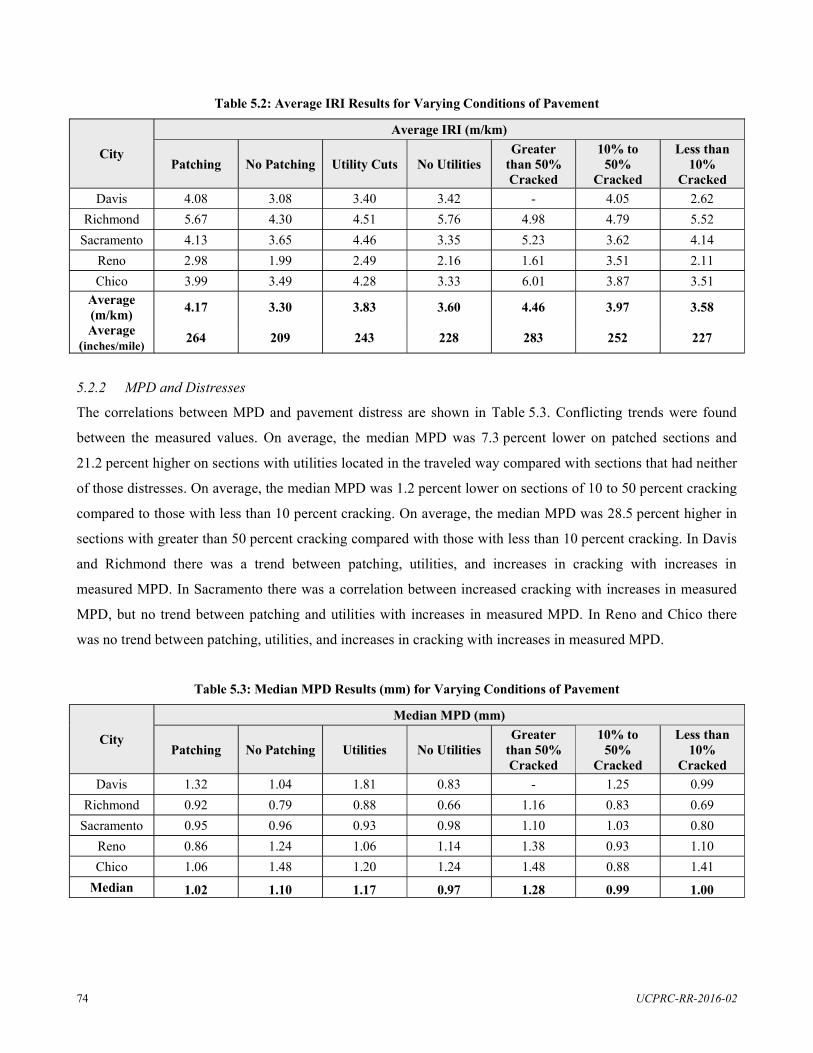
City
Median MPD (mm)
Patching No Patching Utilities No Utilities Greater
than 50% Cracked
10% to 50%
Cracked
Less than 10%
Cracked Davis 1.32 1.04 1.81 0.83 - 1.25 0.99
Richmond 0.92 0.79 0.88 0.66 1.16 0.83 0.69 Sacramento 0.95 0.96 0.93 0.98 1.10 1.03 0.80
Reno 0.86 1.24 1.06 1.14 1.38 0.93 1.10 Chico 1.06 1.48 1.20 1.24 1.48 0.88 1.41
Median 1.02 1.10 1.17 0.97 1.28 0.99 1.00
City
Average IRI (m/km)
Patching No Patching Utility Cuts No Utilities Greater
than 50% Cracked
10% to 50%
Cracked
Less than 10%
Cracked Davis 4.08 3.08 3.40 3.42 - 4.05 2.62
Richmond 5.67 4.30 4.51 5.76 4.98 4.79 5.52 Sacramento 4.13 3.65 4.46 3.35 5.23 3.62 4.14
Reno 2.98 1.99 2.49 2.16 1.61 3.51 2.11 Chico 3.99 3.49 4.28 3.33 6.01 3.87 3.51
Average (m/km) 4.17 3.30 3.83 3.60 4.46 3.97 3.58
Average (inches/mile) 264 209 243 228 283 252 227
Table 5.2: Average IRI Results for Varying Conditions of Pavement
5.2.2 MPD and Distresses
The correlations between MPD and pavement distress are shown in Table 5.3. Conflicting trends were found
between the measured values. On average, the median MPD was 7.3 percent lower on patched sections and
21.2 percent higher on sections with utilities located in the traveled way compared with sections that had neither
of those distresses. On average, the median MPD was 1.2 percent lower on sections of 10 to 50 percent cracking
compared to those with less than 10 percent cracking. On average, the median MPD was 28.5 percent higher in
sections with greater than 50 percent cracking compared with those with less than 10 percent cracking. In Davis
and Richmond there was a trend between patching, utilities, and increases in cracking with increases in
measured MPD. In Sacramento there was a correlation between increased cracking with increases in measured
MPD, but no trend between patching and utilities with increases in measured MPD. In Reno and Chico there
was no trend between patching, utilities, and increases in cracking with increases in measured MPD.
Table 5.3: Median MPD Results (mm) for Varying Conditions of Pavement
UCPRC-RR-2016-02 74
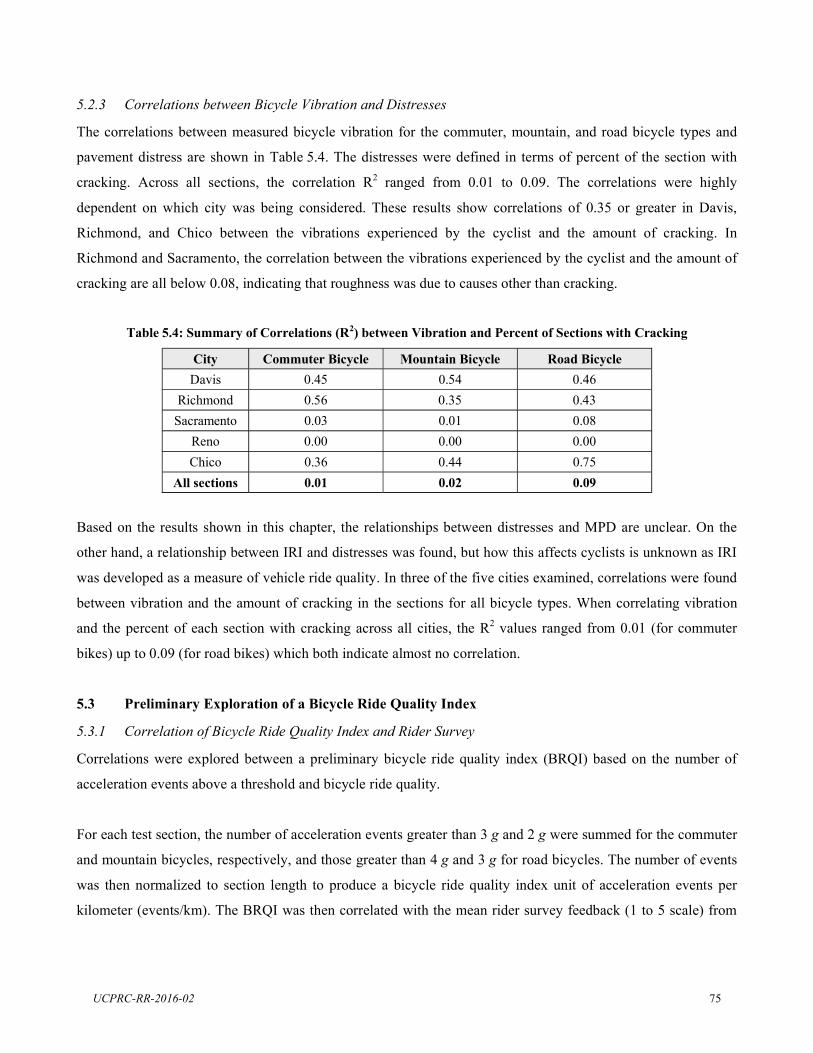
5.2.3 Correlations between Bicycle Vibration and Distresses
The correlations between measured bicycle vibration for the commuter, mountain, and road bicycle types and
pavement distress are shown in Table 5.4. The distresses were defined in terms of percent of the section with
cracking. Across all sections, the correlation R2 ranged from 0.01 to 0.09. The correlations were highly
dependent on which city was being considered. These results show correlations of 0.35 or greater in Davis,
Richmond, and Chico between the vibrations experienced by the cyclist and the amount of cracking. In
Richmond and Sacramento, the correlation between the vibrations experienced by the cyclist and the amount of
cracking are all below 0.08, indicating that roughness was due to causes other than cracking.
Table 5.4: Summary of Correlations (R2) between Vibration and Percent of Sections with Cracking
City Commuter Bicycle Mountain Bicycle Road Bicycle Davis 0.45 0.54 0.46
Richmond 0.56 0.35 0.43 Sacramento 0.03 0.01 0.08
Reno 0.00 0.00 0.00 Chico
0.01 0.36 0.44 0.75
All sections 0.02 0.09
Based on the results shown in this chapter, the relationships between distresses and MPD are unclear. On the
other hand, a relationship between IRI and distresses was found, but how this affects cyclists is unknown as IRI
was developed as a measure of vehicle ride quality. In three of the five cities examined, correlations were found
between vibration and the amount of cracking in the sections for all bicycle types. When correlating vibration
and the percent of each section with cracking across all cities, the R2 values ranged from 0.01 (for commuter
bikes) up to 0.09 (for road bikes) which both indicate almost no correlation.
5.3 Preliminary Exploration of a Bicycle Ride Quality Index
5.3.1 Correlation of Bicycle Ride Quality Index and Rider Survey
Correlations were explored between a preliminary bicycle ride quality index (BRQI) based on the number of
acceleration events above a threshold and bicycle ride quality.
For each test section, the number of acceleration events greater than 3 g and 2 g were summed for the commuter
and mountain bicycles, respectively, and those greater than 4 g and 3 g for road bicycles. The number of events
was then normalized to section length to produce a bicycle ride quality index unit of acceleration events per
kilometer (events/km). The BRQI was then correlated with the mean rider survey feedback (1 to 5 scale) from
UCPRC-RR-2016-02 75
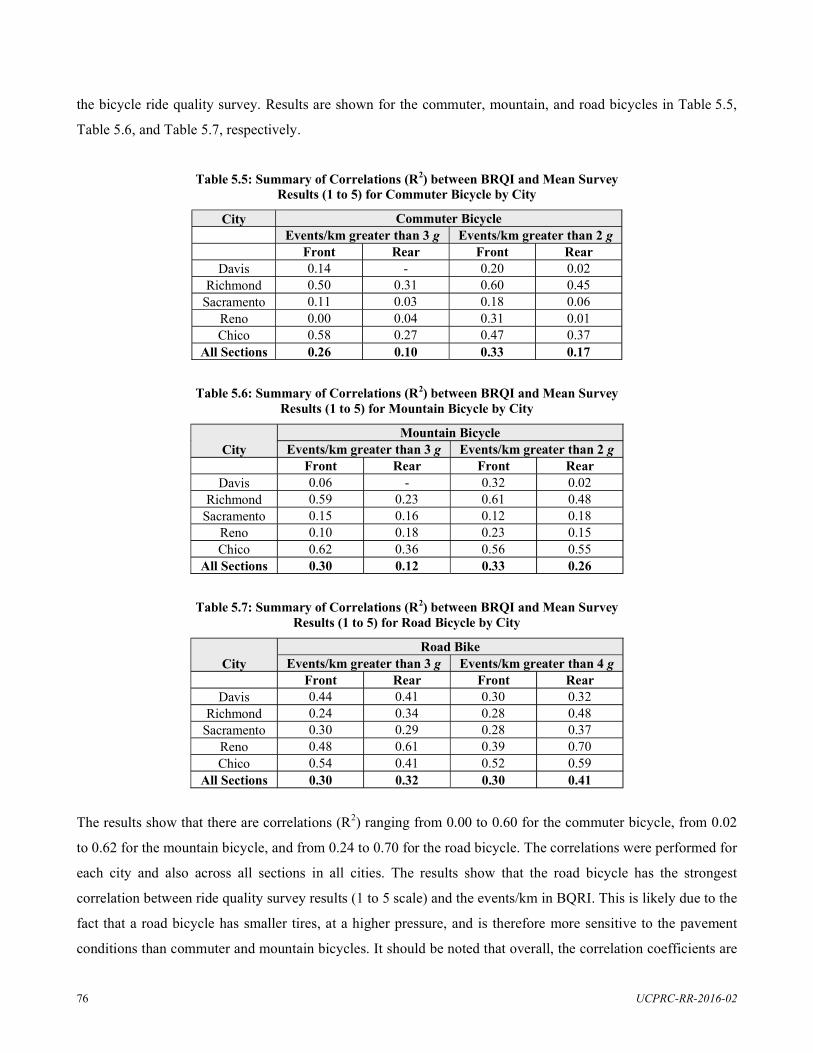
the bicycle ride quality survey. Results are shown for the commuter, mountain, and road bicycles in Table 5.5,
Table 5.6, and Table 5.7, respectively.
Table 5.5: Summary of Correlations (R2) between BRQI and Mean Survey Results (1 to 5) for Commuter Bicycle by City
City Commuter Bicycle Events/km greater than 3 g Events/km greater than 2 g
Front Rear Front Rear Davis 0.14 - 0.20 0.02
Richmond 0.50 0.31 0.60 0.45 Sacramento 0.11 0.03 0.18 0.06
Reno 0.00 0.04 0.31 0.01 Chico 0.58 0.27 0.47 0.37
All Sections 0.26 0.10 0.33 0.17
Table 5.6: Summary of Correlations (R2) between BRQI and Mean Survey Results (1 to 5) for Mountain Bicycle by City
City Mountain Bicycle
Events/km greater than 3 g Events/km greater than 2 g Front Rear Front Rear
Davis 0.06 - 0.32 0.02 Richmond 0.59 0.23 0.61 0.48
Sacramento 0.15 0.16 0.12 0.18 Reno 0.10 0.18 0.23 0.15 Chico 0.62 0.36 0.56 0.55
All Sections 0.30 0.12 0.33 0.26
Table 5.7: Summary of Correlations (R2) between BRQI and Mean Survey Results (1 to 5) for Road Bicycle by City
City Road Bike
Events/km greater than 3 g Events/km greater than 4 g Front Rear Front Rear
Davis 0.44 0.41 0.30 0.32 Richmond 0.24 0.34 0.28 0.48
Sacramento 0.30 0.29 0.28 0.37 Reno 0.48 0.61 0.39 0.70 Chico 0.54 0.41 0.52 0.59
All Sections 0.30 0.32 0.30 0.41
The results show that there are correlations (R2) ranging from 0.00 to 0.60 for the commuter bicycle, from 0.02
to 0.62 for the mountain bicycle, and from 0.24 to 0.70 for the road bicycle. The correlations were performed for
each city and also across all sections in all cities. The results show that the road bicycle has the strongest
correlation between ride quality survey results (1 to 5 scale) and the events/km in BQRI. This is likely due to the
fact that a road bicycle has smaller tires, at a higher pressure, and is therefore more sensitive to the pavement
conditions than commuter and mountain bicycles. It should be noted that overall, the correlation coefficients are
UCPRC-RR-2016-02 76
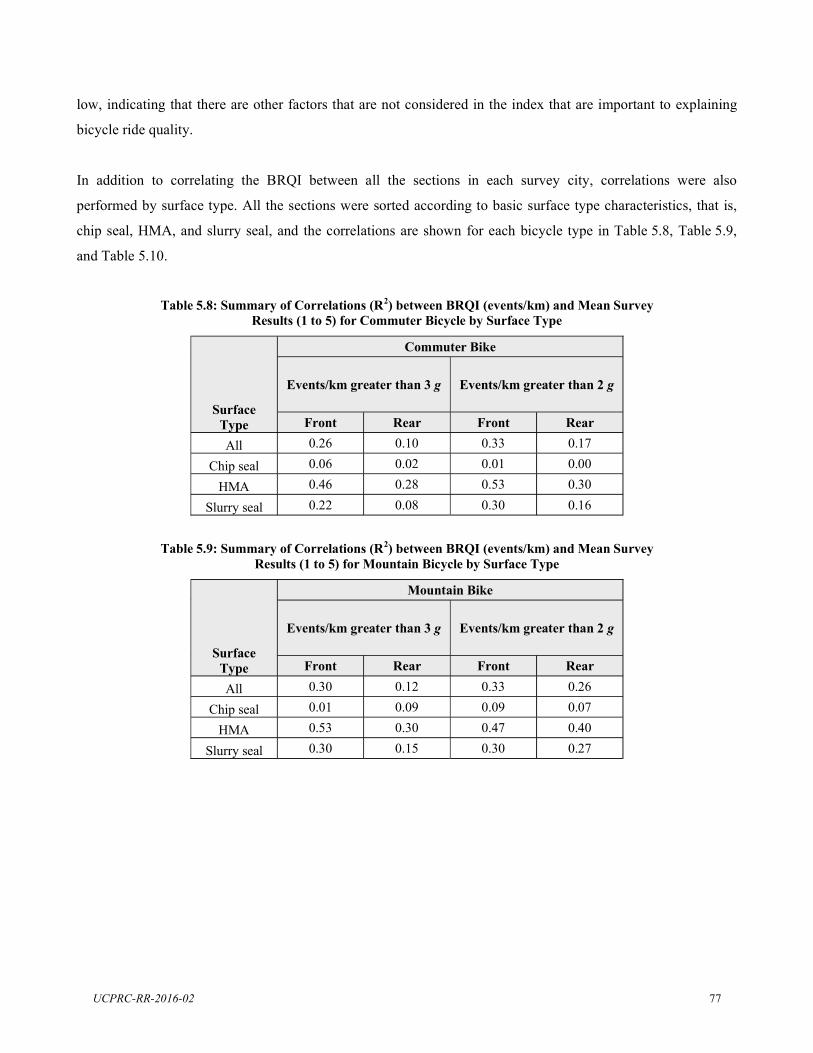
low, indicating that there are other factors that are not considered in the index that are important to explaining
bicycle ride quality.
In addition to correlating the BRQI between all the sections in each survey city, correlations were also
performed by surface type. All the sections were sorted according to basic surface type characteristics, that is,
chip seal, HMA, and slurry seal, and the correlations are shown for each bicycle type in Table 5.8, Table 5.9,
and Table 5.10.
Table 5.8: Summary of Correlations (R2) between BRQI (events/km) and Mean Survey Results (1 to 5) for Commuter Bicycle by Surface Type
Surface Type
Commuter Bike
Events/km greater than 3 g Events/km greater than 2 g
Front Rear Front Rear
All 0.26 0.10 0.33 0.17
Chip seal 0.06 0.02 0.01 0.00
HMA 0.46 0.28 0.53 0.30
Slurry seal 0.22 0.08 0.30 0.16
Table 5.9: Summary of Correlations (R2) between BRQI (events/km) and Mean Survey Results (1 to 5) for Mountain Bicycle by Surface Type
Surface Type
Mountain Bike
Events/km greater than 3 g Events/km greater than 2 g
Front Rear Front Rear
All 0.30 0.12 0.33 0.26
Chip seal 0.01 0.09 0.09 0.07
HMA 0.53 0.30 0.47 0.40
Slurry seal 0.30 0.15 0.30 0.27
UCPRC-RR-2016-02 77
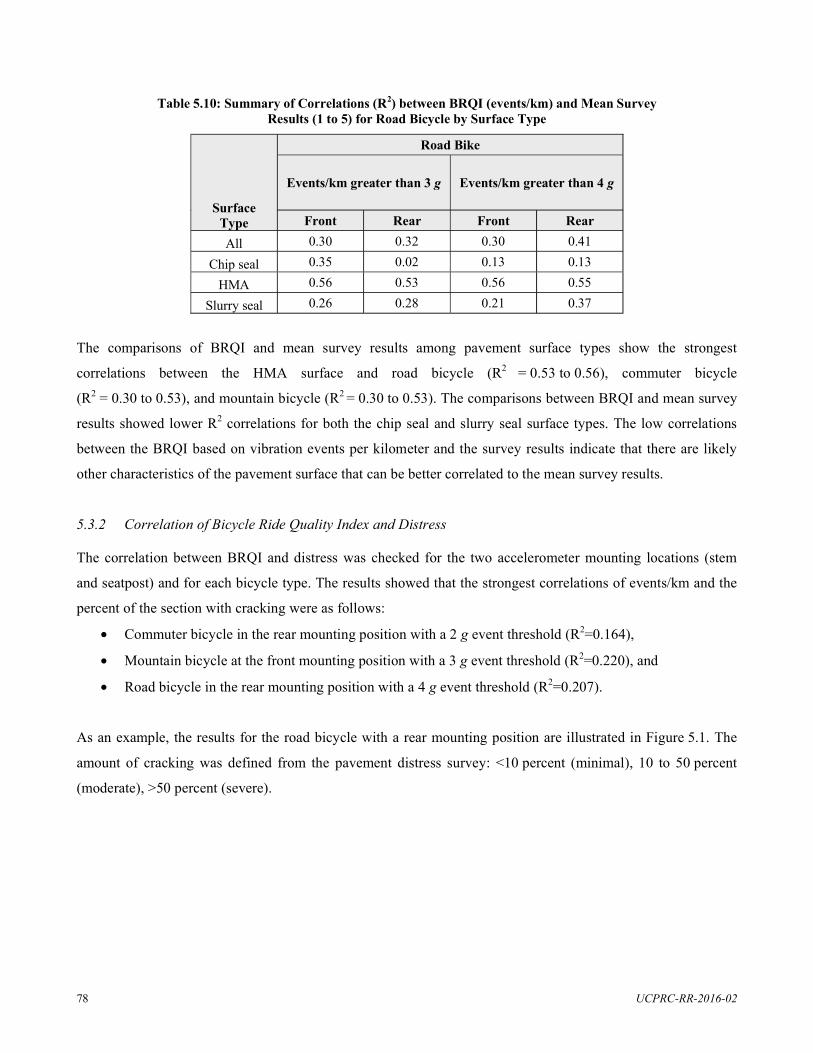
Table 5.10: Summary of Correlations (R2) between BRQI (events/km) and Mean Survey Results (1 to 5) for Road Bicycle by Surface Type
Surface Type
Road Bike
Events/km greater than 3 g Events/km greater than 4 g
Front Rear Front Rear
All 0.30 0.32 0.30 0.41
Chip seal 0.35 0.02 0.13 0.13
HMA 0.56 0.53 0.56 0.55
Slurry seal 0.26 0.28 0.21 0.37
The comparisons of BRQI and mean survey results among pavement surface types show the strongest
correlations between the HMA surface and road bicycle (R2 = 0.53 to 0.56), commuter bicycle
(R2 = 0.30 to 0.53), and mountain bicycle (R2 = 0.30 to 0.53). The comparisons between BRQI and mean survey
results showed lower R2 correlations for both the chip seal and slurry seal surface types. The low correlations
between the BRQI based on vibration events per kilometer and the survey results indicate that there are likely
other characteristics of the pavement surface that can be better correlated to the mean survey results.
5.3.2 Correlation of Bicycle Ride Quality Index and Distress
The correlation between BRQI and distress was checked for the two accelerometer mounting locations (stem
and seatpost) and for each bicycle type. The results showed that the strongest correlations of events/km and the
percent of the section with cracking were as follows:
Commuter bicycle in the rear mounting position with a 2 g event threshold (R2=0.164),
Mountain bicycle at the front mounting position with a 3 g event threshold (R2=0.220), and
Road bicycle in the rear mounting position with a 4 g event threshold (R2=0.207).
As an example, the results for the road bicycle with a rear mounting position are illustrated in Figure 5.1. The
amount of cracking was defined from the pavement distress survey: <10 percent (minimal), 10 to 50 percent
(moderate), >50 percent (severe).
UCPRC-RR-2016-02 78
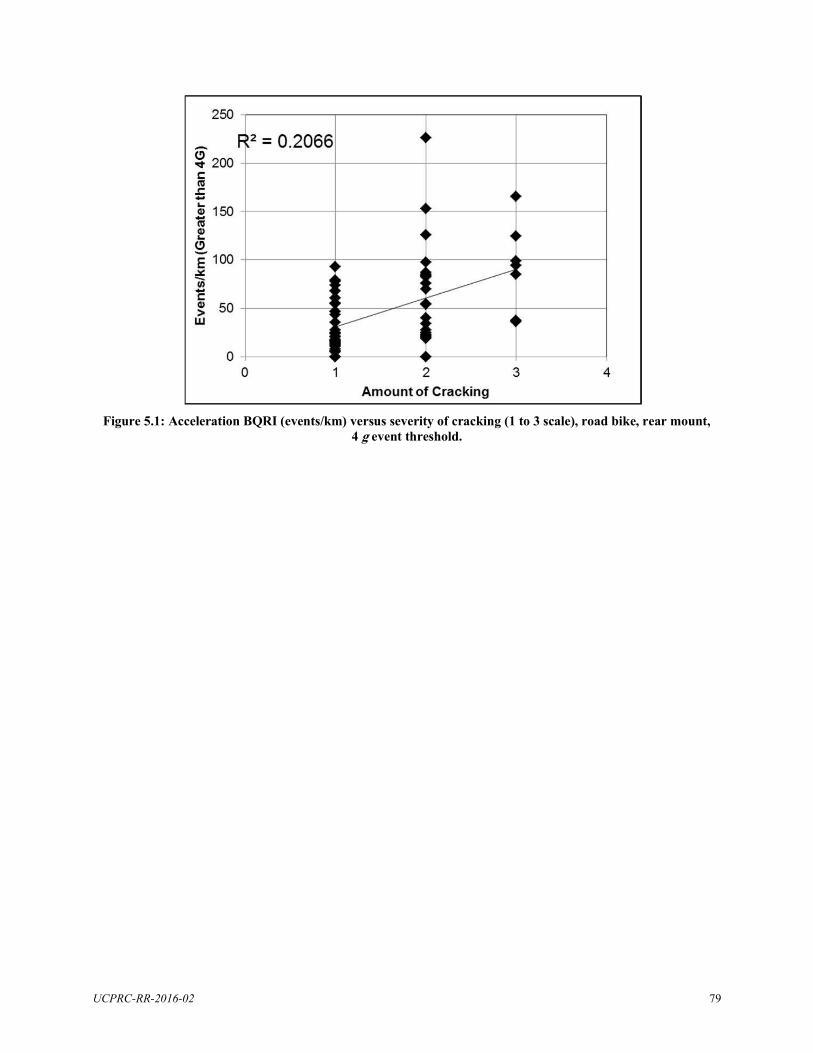
Figure 5.1: Acceleration BQRI (events/km) versus severity of cracking (1 to 3 scale), road bike, rear mount, 4 event threshold.
UCPRC-RR-2016-02 79

(This page left blank)
UCPRC-RR-2016-02 80
6 CORRELATIONS BETWEEN PAVEMENT MACROTEXTURE AND TREATMENT SPECIFICATIONS
Correlations were identified between pavement texture measured in terms of MPD and surface treatment
specifications. The data used to develop the correlations came from state highway sections selected especially
because specification information was available, and from those city and county sections used for the rider
survey analysis for which specifications were also available.
6.1 Macrotexture Measurement Results from Caltrans Highway Sections
Table 6.1, Table 6.2, and Table 6.3 respectively summarize the results of macrotexture measurement results (in
terms of MPD) on Caltrans state highway sections with chip seals, slurry seals, and microsurfacing treatments.
Figure 6.1 shows the geographic locations of the state highway sections tested. Plots of the MPD ranges
measured on each chip seal, slurry seal, and microsurfacing test section appear in Figure 6.2, Figure 6.3, and
Figure 6.4, respectively. A simple average of the median, standard deviation, and Q1 and Q3 values was taken
for comparisons between specification types throughout this report. For specifications that have only one tested
section, the statistical values were obtained from the complete, raw data set.
UCPRC-RR-2016-02 81
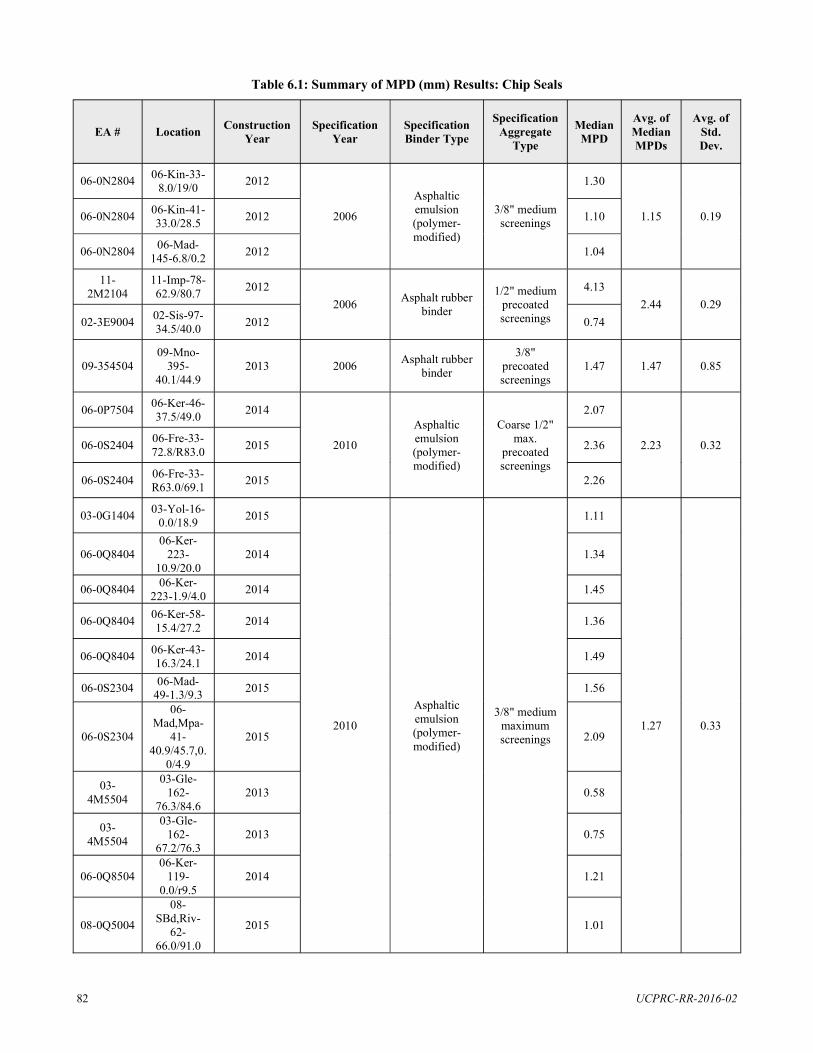
EA # Location Construction Year
Specification Year
Specification Binder Type
Specification Aggregate
Type
Median MPD
Avg. of Median MPDs
Avg. of Std. Dev.
06-0N2804 06-Kin-33-8.0/19/0 2012
2006
Asphaltic emulsion (polymer-modified)
3/8" medium screenings
1.30
1.15 0.19 06-0N2804 06-Kin-41-33.0/28.5 2012 1.10
06-0N2804 06-Mad-145-6.8/0.2 2012 1.04
11-2M2104
11-Imp-78-62.9/80.7 2012
2006 Asphalt rubber binder
1/2" medium precoated screenings
4.13 2.44 0.29
02-3E9004 02-Sis-97-34.5/40.0 2012 0.74
09-354504 09-Mno-
395-40.1/44.9
2013 2006 Asphalt rubber binder
3/8" precoated screenings
1.47 1.47 0.85
06-0P7504 06-Ker-46-37.5/49.0 2014
2010
Asphaltic emulsion (polymer-modified)
Coarse 1/2" max.
precoated screenings
2.07
2.23 0.32 06-0S2404 06-Fre-33-72.8/R83.0 2015 2.36
06-0S2404 06-Fre-33-R63.0/69.1 2015 2.26
03-0G1404 03-Yol-16-0.0/18.9 2015
2010
Asphaltic emulsion (polymer-modified)
3/8" medium maximum screenings
1.11
1.27 0.33
06-0Q8404 06-Ker-
223-10.9/20.0
2014 1.34
06-0Q8404 06-Ker-223-1.9/4.0 2014 1.45
06-0Q8404 06-Ker-58-15.4/27.2 2014 1.36
06-0Q8404 06-Ker-43-16.3/24.1 2014 1.49
06-0S2304 06-Mad-49-1.3/9.3 2015 1.56
06-0S2304
06-Mad,Mpa-
41-40.9/45.7,0.
0/4.9
2015 2.09
03-4M5504
03-Gle-162-
76.3/84.6 2013 0.58
03-4M5504
03-Gle-162-
67.2/76.3 2013 0.75
06-0Q8504 06-Ker-
119-0.0/r9.5
2014 1.21
08-0Q5004
08-SBd,Riv-
62-66.0/91.0
2015 1.01
Table 6.1: Summary of MPD (mm) Results: Chip Seals
UCPRC-RR-2016-02 82
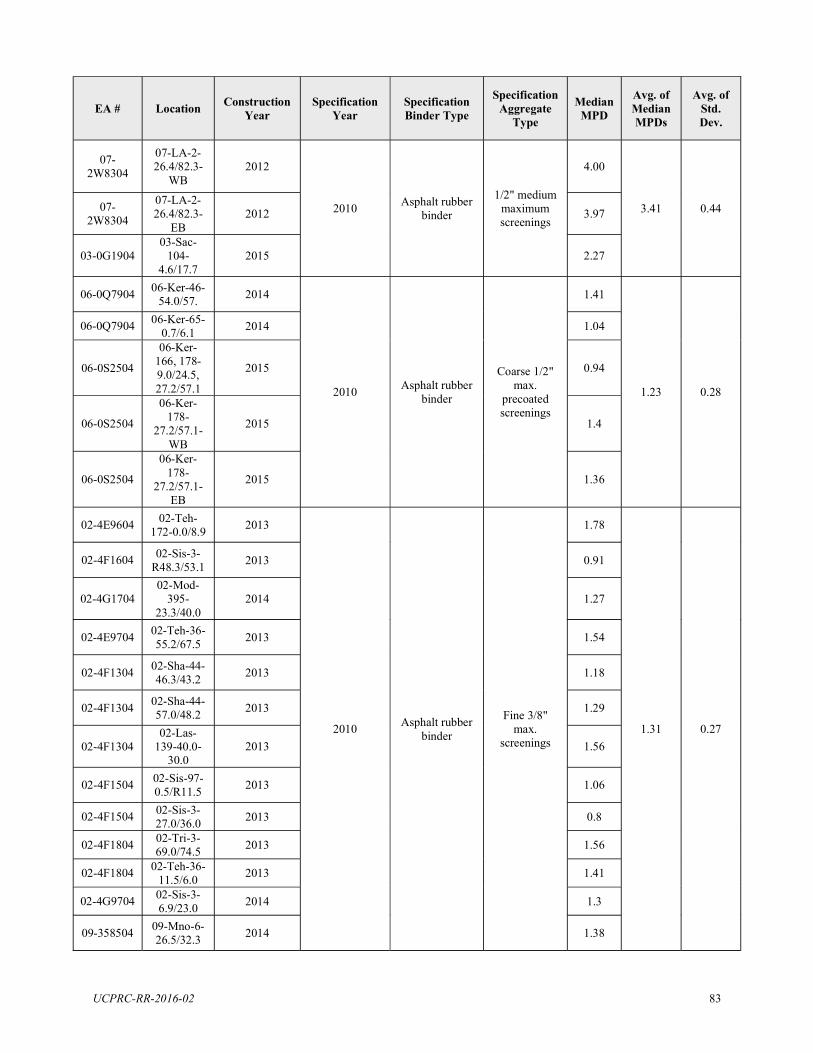
EA # Location Construction Year
Specification Year
Specification Binder Type
Specification Aggregate
Type
Median MPD
Avg. of Median MPDs
Avg. of Std. Dev.
07-2W8304
07-LA-2-26.4/82.3-
WB 2012
2010 Asphalt rubber binder
1/2" medium maximum screenings
4.00
3.41 0.44 07-2W8304
07-LA-2-26.4/82.3-
EB 2012 3.97
03-0G1904 03-Sac-
104-4.6/17.7
2015 2.27
06-0Q7904 06-Ker-46-54.0/57. 2014
2010 Asphalt rubber binder
Coarse 1/2" max.
precoated screenings
1.41
1.23 0.28
06-0Q7904 06-Ker-65-0.7/6.1 2014 1.04
06-0S2504
06-Ker-166, 178-9.0/24.5, 27.2/57.1
2015 0.94
06-0S2504
06-Ker-178-
27.2/57.1-WB
2015 1.4
06-0S2504
06-Ker-178-
27.2/57.1-EB
2015 1.36
02-4E9604 02-Teh-172-0.0/8.9 2013
2010 Asphalt rubber binder
Fine 3/8" max.
screenings
1.78
1.31 0.27
02-4F1604 02-Sis-3-R48.3/53.1 2013 0.91
02-4G1704 02-Mod-
395-23.3/40.0
2014 1.27
02-4E9704 02-Teh-36-55.2/67.5 2013 1.54
02-4F1304 02-Sha-44-46.3/43.2 2013 1.18
02-4F1304 02-Sha-44-57.0/48.2 2013 1.29
02-4F1304 02-Las-
139-40.0-30.0
2013 1.56
02-4F1504 02-Sis-97-0.5/R11.5 2013 1.06
02-4F1504 02-Sis-3-27.0/36.0 2013 0.8
02-4F1804 02-Tri-3-69.0/74.5 2013 1.56
02-4F1804 02-Teh-36-11.5/6.0 2013 1.41
02-4G9704 02-Sis-3-6.9/23.0 2014 1.3
09-358504 09-Mno-6-26.5/32.3 2014 1.38
UCPRC-RR-2016-02 83
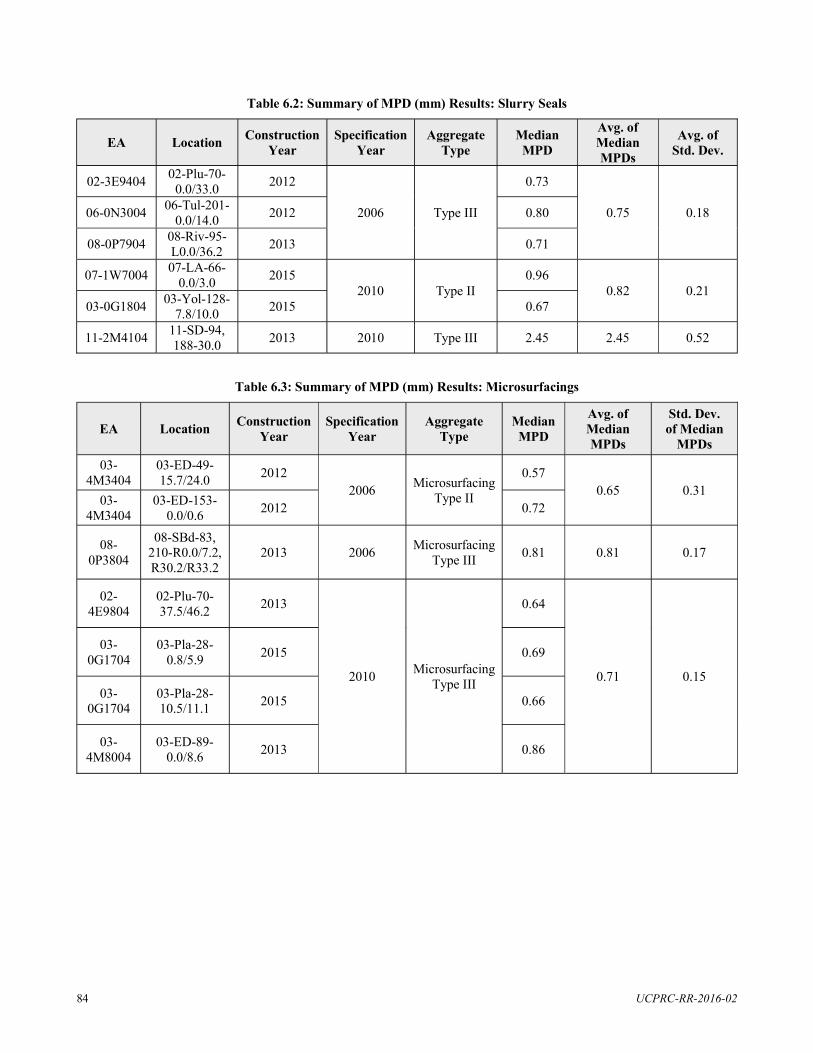
EA Location Construction Year
Specification Year
Aggregate Type
Median MPD
Avg. of Median MPDs
Avg. of Std. Dev.
02-3E9404 02-Plu-70-0.0/33.0 2012
2006 Type III
0.73
0.75 0.18 06-0N3004 06-Tul-201-0.0/14.0 2012 0.80
08-0P7904 08-Riv-95-L0.0/36.2 2013 0.71
07-1W7004 07-LA-66-0.0/3.0 2015
2010 Type II 0.96
0.82 0.21 03-0G1804 03-Yol-128-
7.8/10.0 2015 0.67
11-2M4104 11-SD-94, 188-30.0 2013 2010 Type III 2.45 2.45 0.52
EA Location Construction Year
Specification Year
Aggregate Type
Median MPD
Avg. of Median MPDs
Std. Dev. of Median
MPDs 03-
4M3404 03-ED-49-15.7/24.0 2012
2006 Microsurfacing Type II
0.57 0.65 0.31
03-4M3404
03-ED-153-0.0/0.6 2012 0.72
08-0P3804
08-SBd-83, 210-R0.0/7.2, R30.2/R33.2
2013 2006 Microsurfacing Type III 0.81 0.81 0.17
02-4E9804
02-Plu-70-37.5/46.2 2013
2010 Microsurfacing Type III
0.64
0.71 0.15
03-0G1704
03-Pla-28-0.8/5.9 2015 0.69
03-0G1704
03-Pla-28-10.5/11.1 2015 0.66
03-4M8004
03-ED-89-0.0/8.6 2013 0.86
Table 6.2: Summary of MPD (mm) Results: Slurry Seals
Table 6.3: Summary of MPD (mm) Results: Microsurfacings
UCPRC-RR-2016-02 84
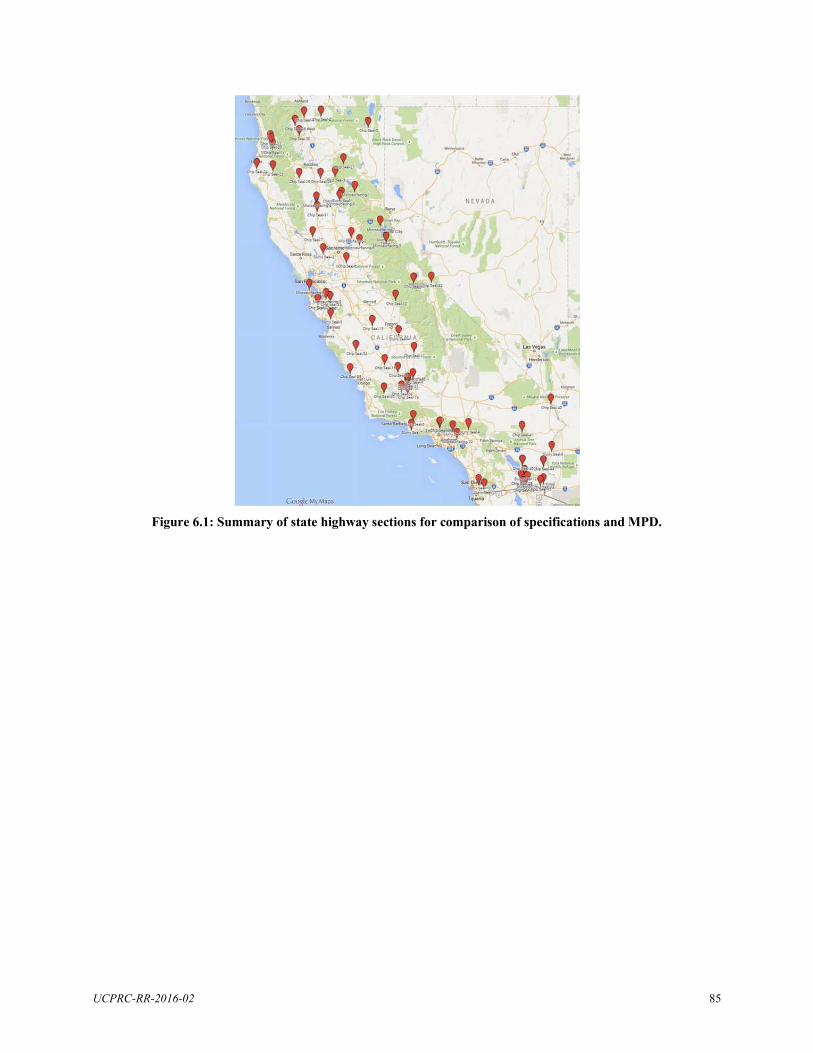
Figure 6.1: Summary of state highway sections for comparison of specifications and MPD.
UCPRC-RR-2016-02 85
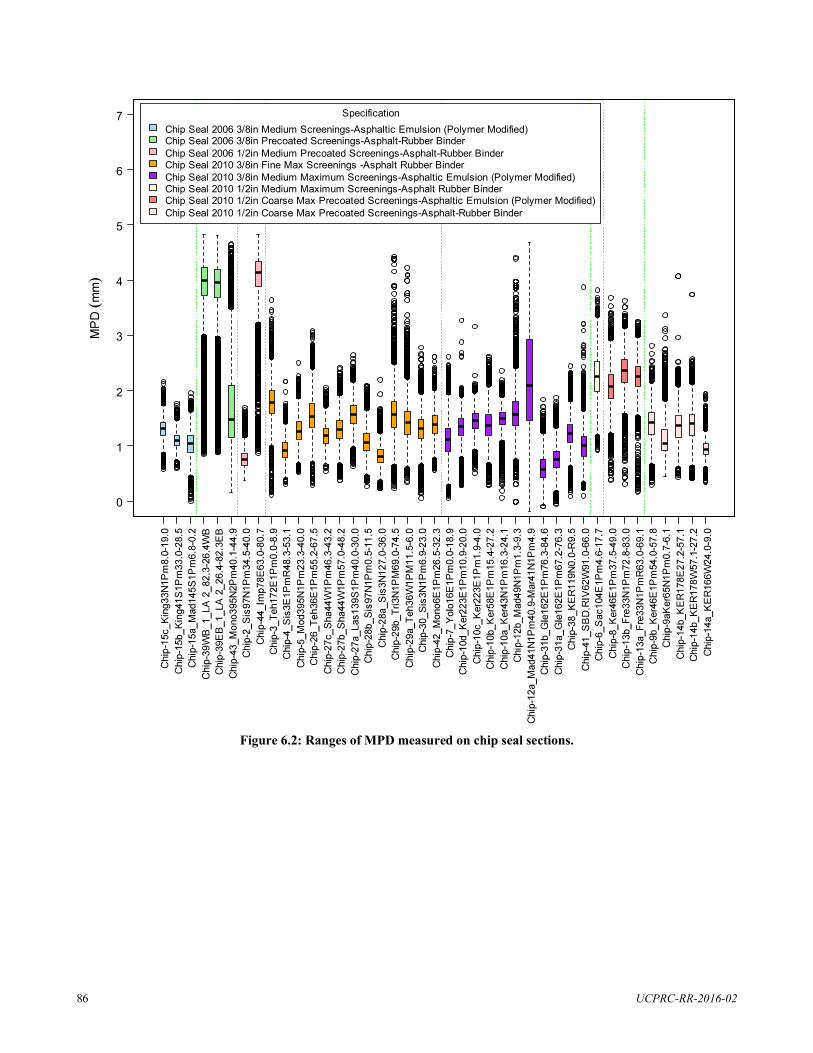
Specification 7 Chip Seal 2006 3/8in Medium Screenings-Asphaltic Emulsion (Polymer Modified) Chip Seal 2006 3/8in Precoated Screenings-Asphalt-Rubber Binder Chip Seal 2006 1/2in Medium Precoated Screenings-Asphalt-Rubber Binder Chip Seal 2010 3/8in Fine Max Screenings -Asphalt Rubber Binder 6 Chip Seal 2010 3/8in Medium Maximum Screenings-Asphaltic Emulsion (Polymer Modified) Chip Seal 2010 1/2in Medium Maximum Screenings-Asphalt Rubber Binder Chip Seal 2010 1/2in Coarse Max Precoated Screenings-Asphaltic Emulsion (Polymer Modified) Chip Seal 2010 1/2in Coarse Max Precoated Screenings-Asphalt-Rubber Binder
5
4
3
2
1
0
Figure 6.2: Ranges of MPD measured on chip seal sections.
UCPRC-RR-2016-02 86
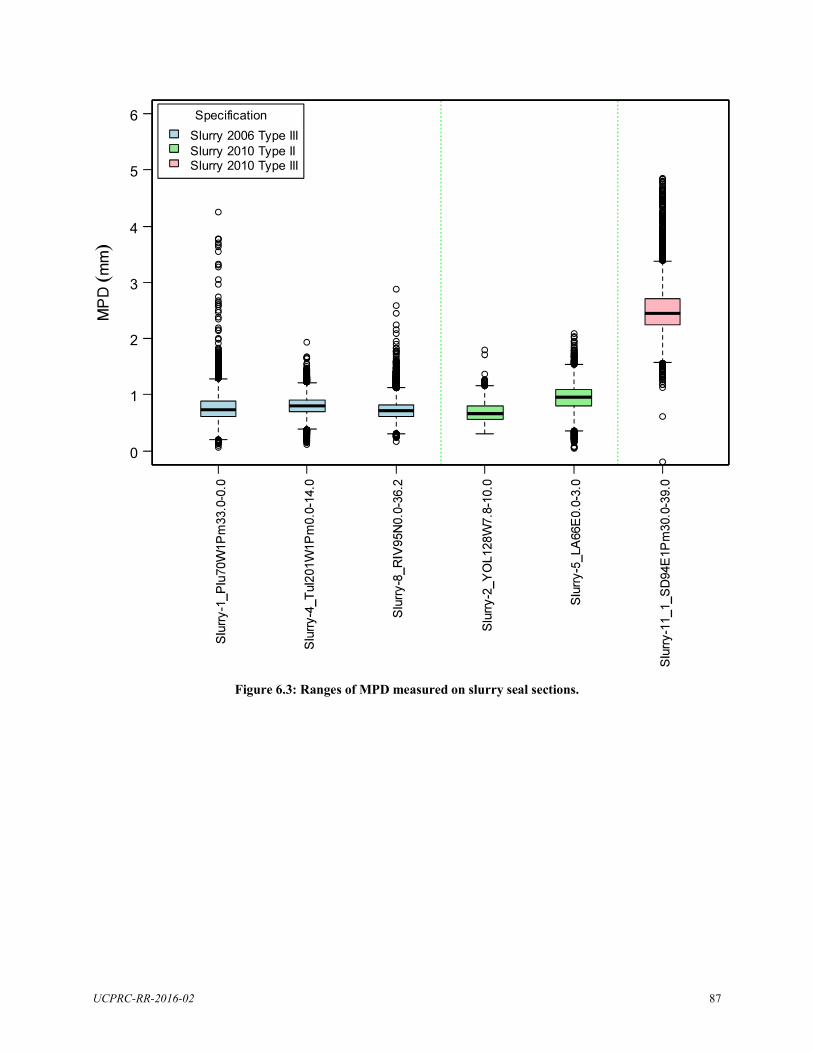
Specification Slurry 2006 Type III Slurry 2010 Type II Slurry 2010 Type III
6
5
4
3
2
1
0
Figure 6.3: Ranges of MPD measured on slurry seal sections.
UCPRC-RR-2016-02 87
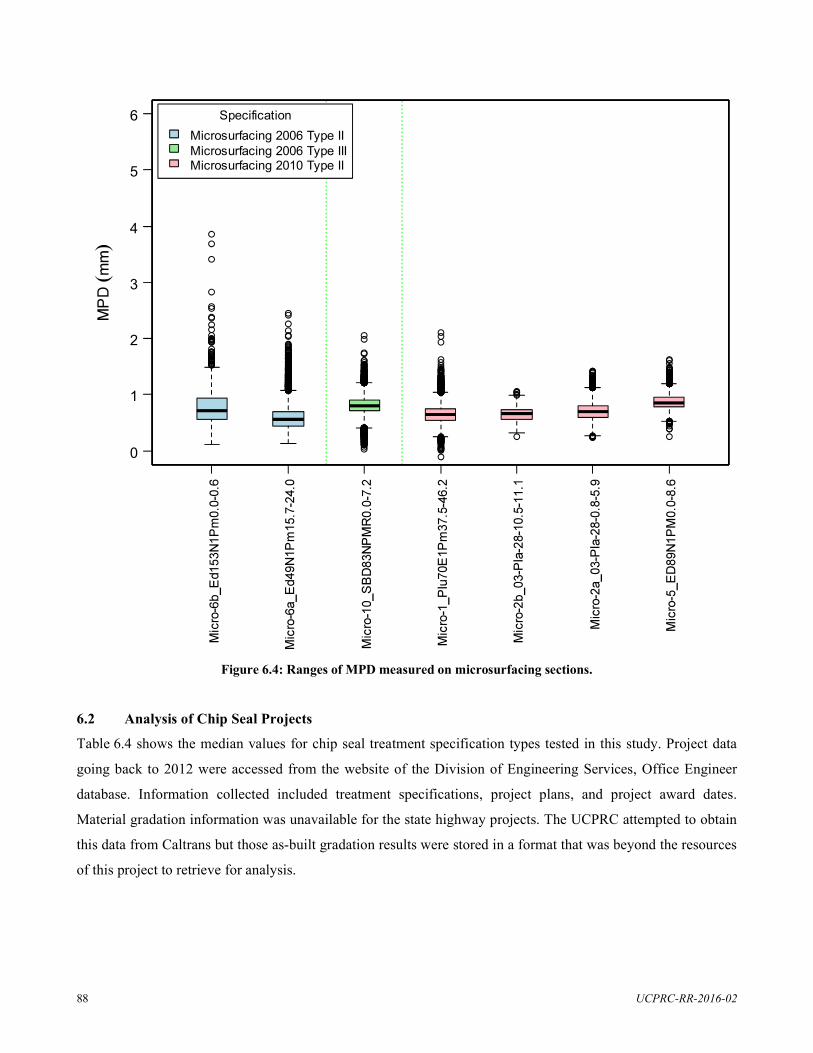
Specification Microsurfacing 2006 Type II Microsurfacing 2006 Type III Microsurfacing 2010 Type II
6
5
4
3
2
1
0
Figure 6.4: Ranges of MPD measured on microsurfacing sections.
6.2 Analysis of Chip Seal Projects
Table 6.4 shows the median values for chip seal treatment specification types tested in this study. Project data
going back to 2012 were accessed from the website of the Division of Engineering Services, Office Engineer
database. Information collected included treatment specifications, project plans, and project award dates.
Material gradation information was unavailable for the state highway projects. The UCPRC attempted to obtain
this data from Caltrans but those as-built gradation results were stored in a format that was beyond the resources
of this project to retrieve for analysis.
UCPRC-RR-2016-02 88
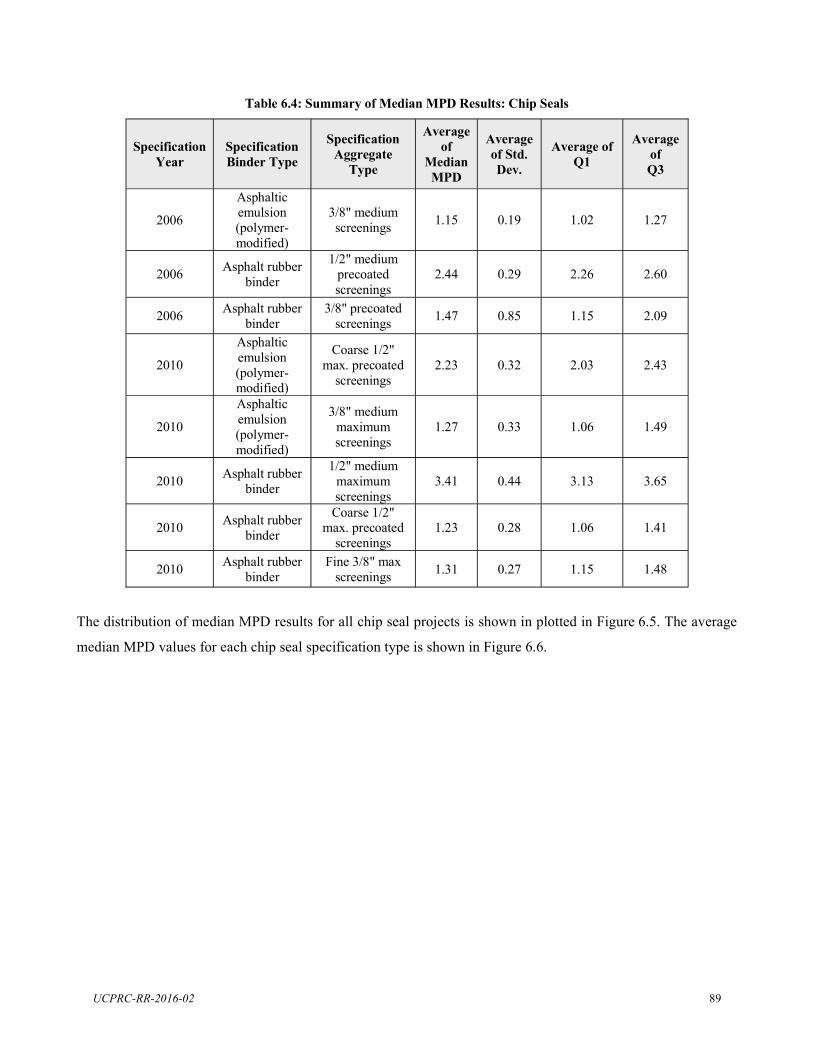
Table 6.4: Summary of Median MPD Results: Chip Seals
Specification Year
Specification Binder Type
Specification Aggregate
Type
Average of
Median MPD
Average of Std. Dev.
Average of Q1
Average of Q3
2006
Asphaltic emulsion (polymer-modified)
3/8" medium screenings 1.15 0.19 1.02 1.27
2006 Asphalt rubber binder
1/2" medium precoated screenings
2.44 0.29 2.26 2.60
2006 Asphalt rubber binder
3/8" precoated screenings 1.47 0.85 1.15 2.09
2010
Asphaltic emulsion (polymer-modified)
Coarse 1/2" max. precoated
screenings 2.23 0.32 2.03 2.43
2010
Asphaltic emulsion (polymer-modified)
3/8" medium maximum screenings
1.27 0.33 1.06 1.49
2010 Asphalt rubber binder
1/2" medium maximum screenings
3.41 0.44 3.13 3.65
2010 Asphalt rubber binder
Coarse 1/2" max. precoated
screenings 1.23 0.28 1.06 1.41
2010 Asphalt rubber binder
Fine 3/8" max screenings 1.31 0.27 1.15 1.48
The distribution of median MPD results for all chip seal projects is shown in plotted in Figure 6.5. The average
median MPD values for each chip seal specification type is shown in Figure 6.6.
UCPRC-RR-2016-02 89
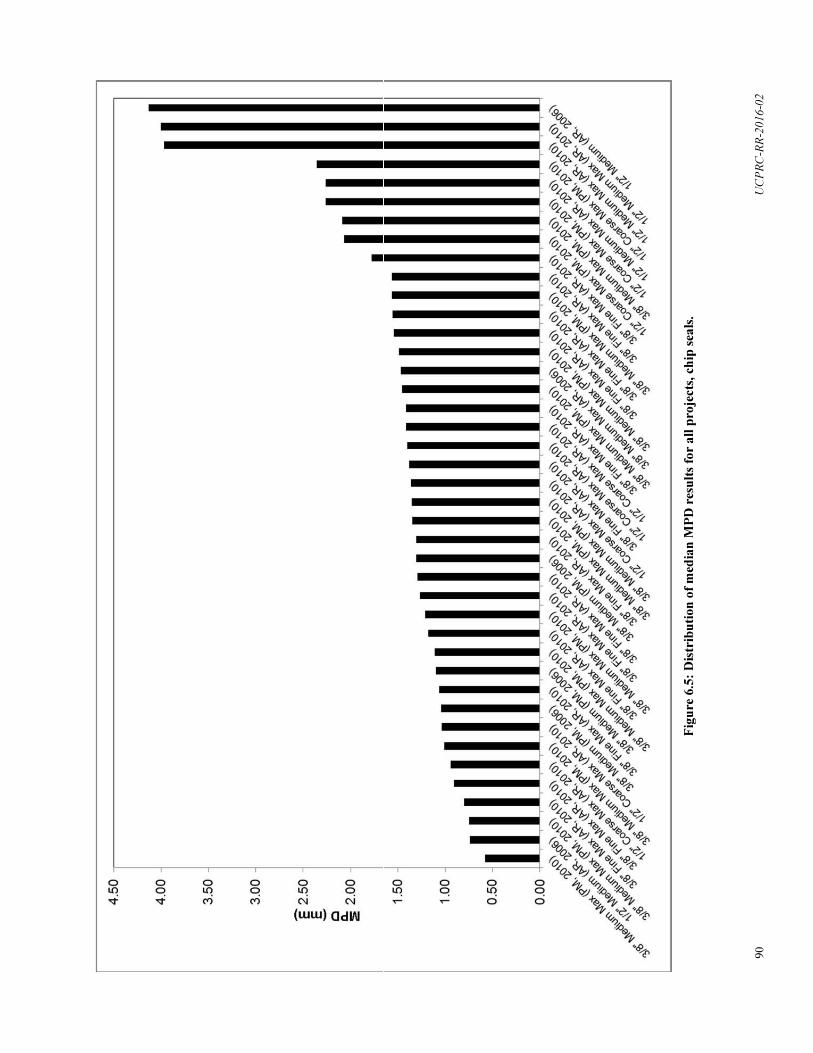
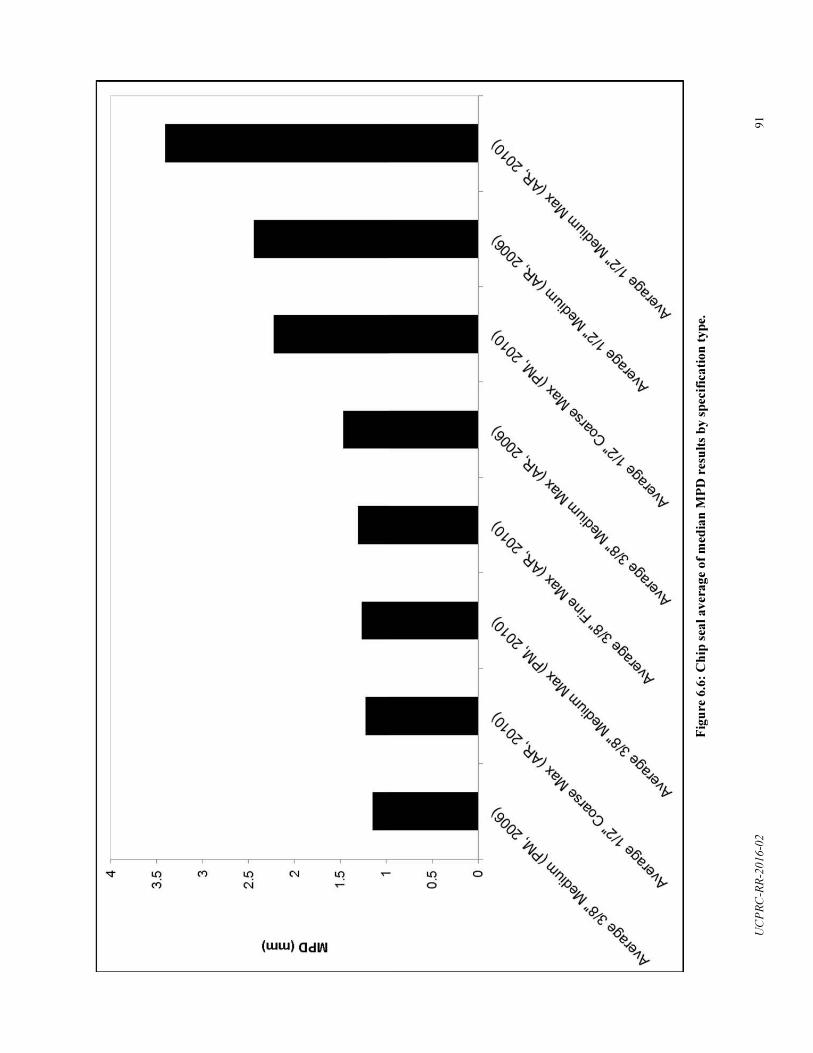
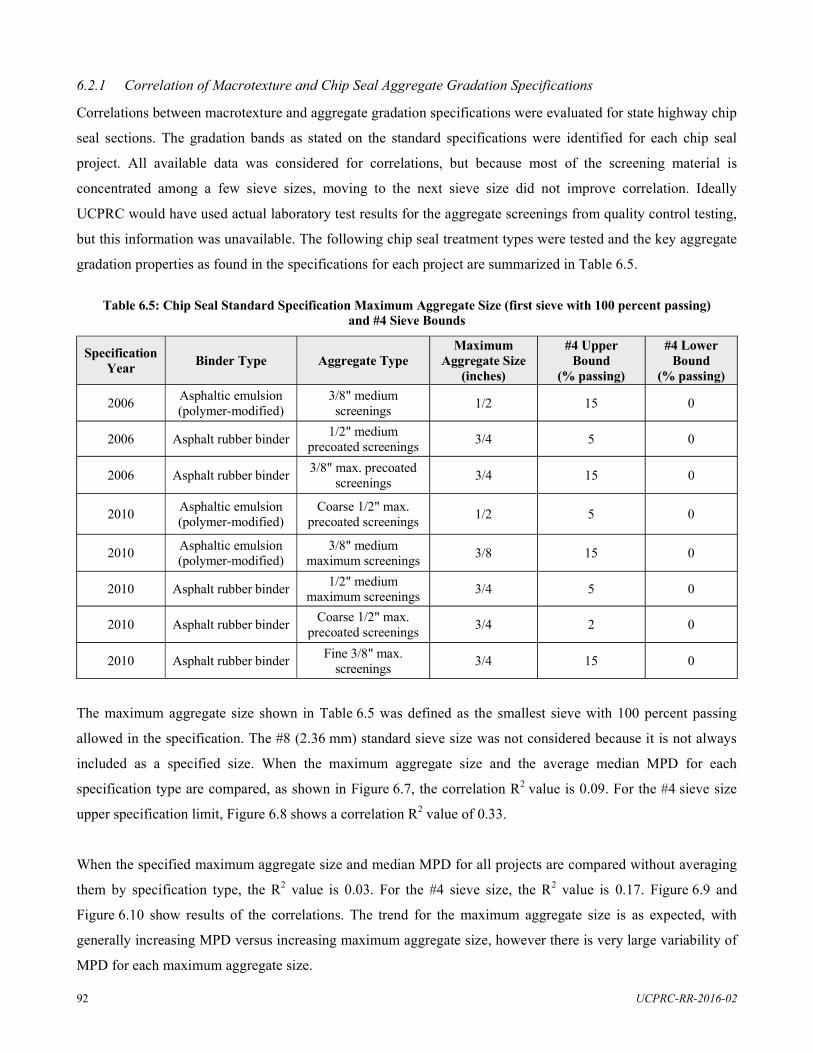
6.2.1 Correlation of Macrotexture and Chip Seal Aggregate Gradation Specifications
Correlations between macrotexture and aggregate gradation specifications were evaluated for state highway chip
seal sections. The gradation bands as stated on the standard specifications were identified for each chip seal
project. All available data was considered for correlations, but because most of the screening material is
concentrated among a few sieve sizes, moving to the next sieve size did not improve correlation. Ideally
UCPRC would have used actual laboratory test results for the aggregate screenings from quality control testing,
but this information was unavailable. The following chip seal treatment types were tested and the key aggregate
gradation properties as found in the specifications for each project are summarized in Table 6.5.
Table 6.5: Chip Seal Standard Specification Maximum Aggregate Size (first sieve with 100 percent passing) and #4 Sieve Bounds
Specification Year Binder Type Aggregate Type
Maximum Aggregate Size
(inches)
#4 Upper Bound
(% passing)
#4 Lower Bound
(% passing)
2006 Asphaltic emulsion (polymer-modified)
3/8" medium screenings 1/2 15 0
2006 Asphalt rubber binder 1/2" medium precoated screenings 3/4 5 0
2006 Asphalt rubber binder 3/8" max. precoated screenings 3/4 15 0
2010 Asphaltic emulsion (polymer-modified)
Coarse 1/2" max. precoated screenings 1/2 5 0
2010 Asphaltic emulsion (polymer-modified)
3/8" medium maximum screenings 3/8 15 0
2010 Asphalt rubber binder 1/2" medium maximum screenings 3/4 5 0
2010 Asphalt rubber binder Coarse 1/2" max. precoated screenings 3/4 2 0
2010 Asphalt rubber binder Fine 3/8" max. screenings 3/4 15 0
The maximum aggregate size shown in Table 6.5 was defined as the smallest sieve with 100 percent passing
allowed in the specification. The #8 (2.36 mm) standard sieve size was not considered because it is not always
included as a specified size. When the maximum aggregate size and the average median MPD for each
specification type are compared, as shown in Figure 6.7, the correlation R2 value is 0.09. For the #4 sieve size
upper specification limit, Figure 6.8 shows a correlation R2 value of 0.33.
When the specified maximum aggregate size and median MPD for all projects are compared without averaging
them by specification type, the R2 value is 0.03. For the #4 sieve size, the R2 value is 0.17. Figure 6.9 and
Figure 6.10 show results of the correlations. The trend for the maximum aggregate size is as expected, with
generally increasing MPD versus increasing maximum aggregate size, however there is very large variability of
MPD for each maximum aggregate size.
UCPRC-RR-2016-02 92
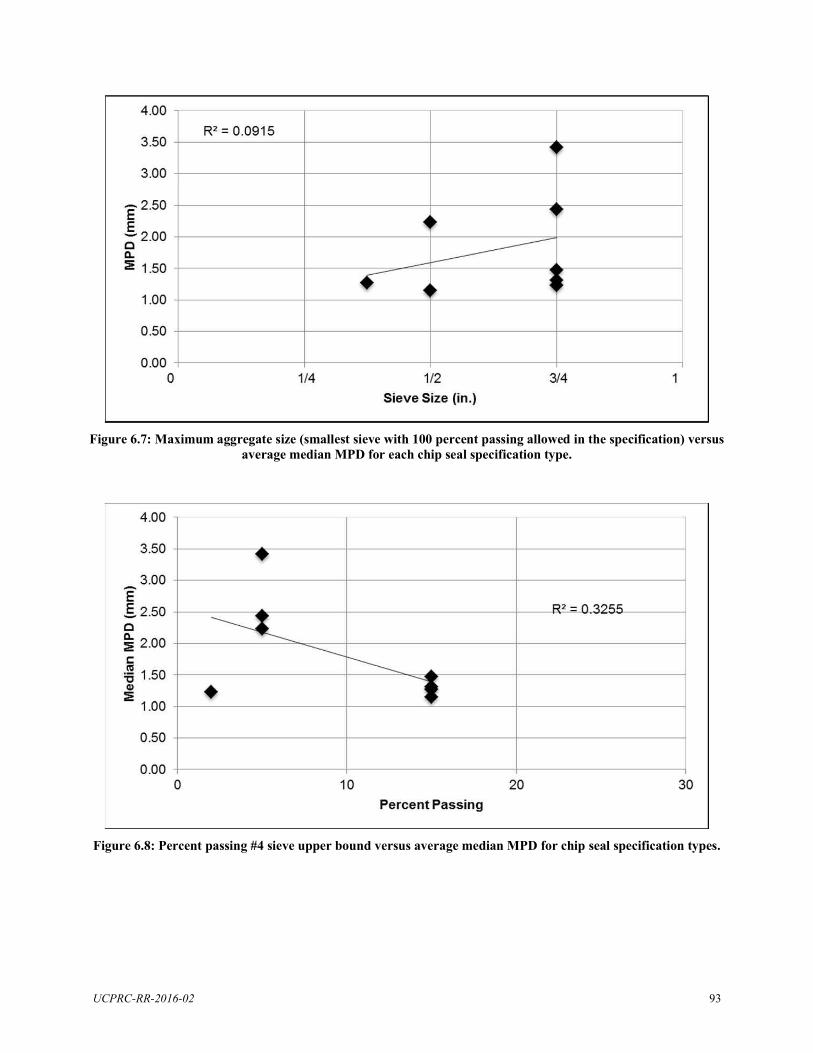
Figure 6.7: Maximum aggregate size (smallest sieve with 100 percent passing allowed in the specification) versus average median MPD for each chip seal specification type.
Figure 6.8: Percent passing #4 sieve upper bound versus average median MPD for chip seal specification types.
UCPRC-RR-2016-02 93
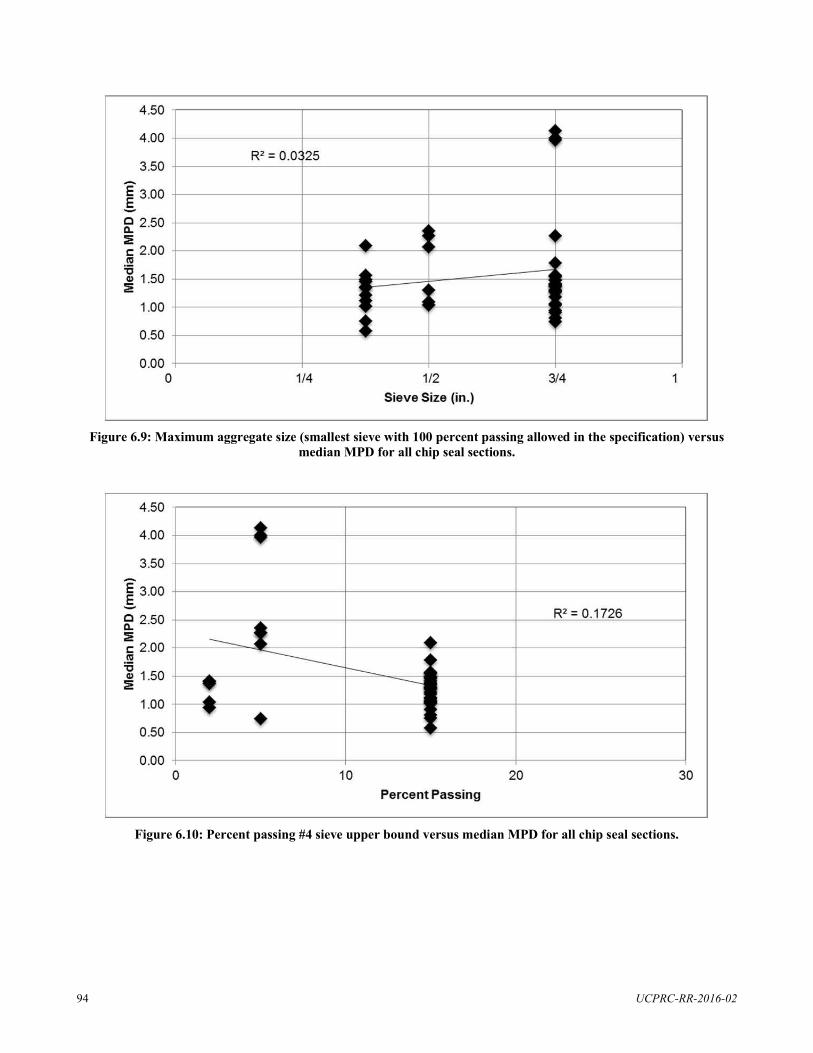
Figure 6.9: Maximum aggregate size (smallest sieve with 100 percent passing allowed in the specification) versus median MPD for all chip seal sections.
Figure 6.10: Percent passing #4 sieve upper bound versus median MPD for all chip seal sections.
UCPRC-RR-2016-02 94
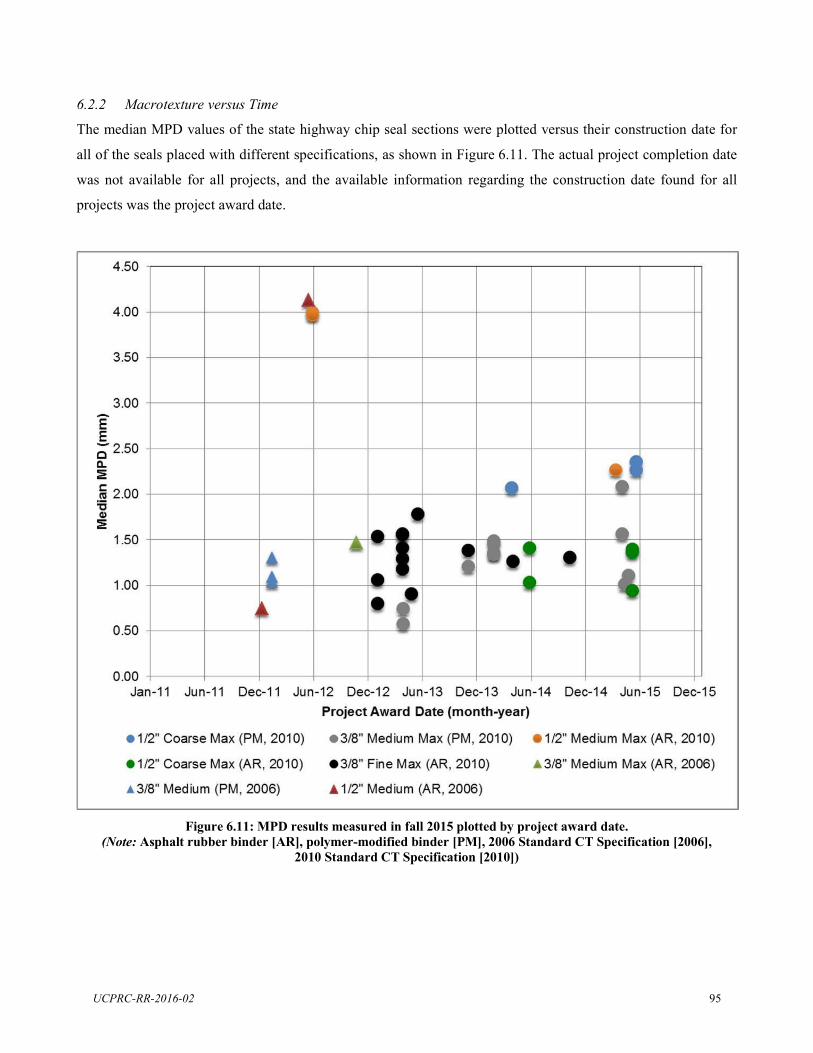
6.2.2 Macrotexture versus Time
The median MPD values of the state highway chip seal sections were plotted versus their construction date for
all of the seals placed with different specifications, as shown in Figure 6.11. The actual project completion date
was not available for all projects, and the available information regarding the construction date found for all
projects was the project award date.
Figure 6.11: MPD results measured in fall 2015 plotted by project award date. (Note: Asphalt rubber binder [AR], polymer-modified binder [PM], 2006 Standard CT Specification [2006],
2010 Standard CT Specification [2010])
UCPRC-RR-2016-02 95
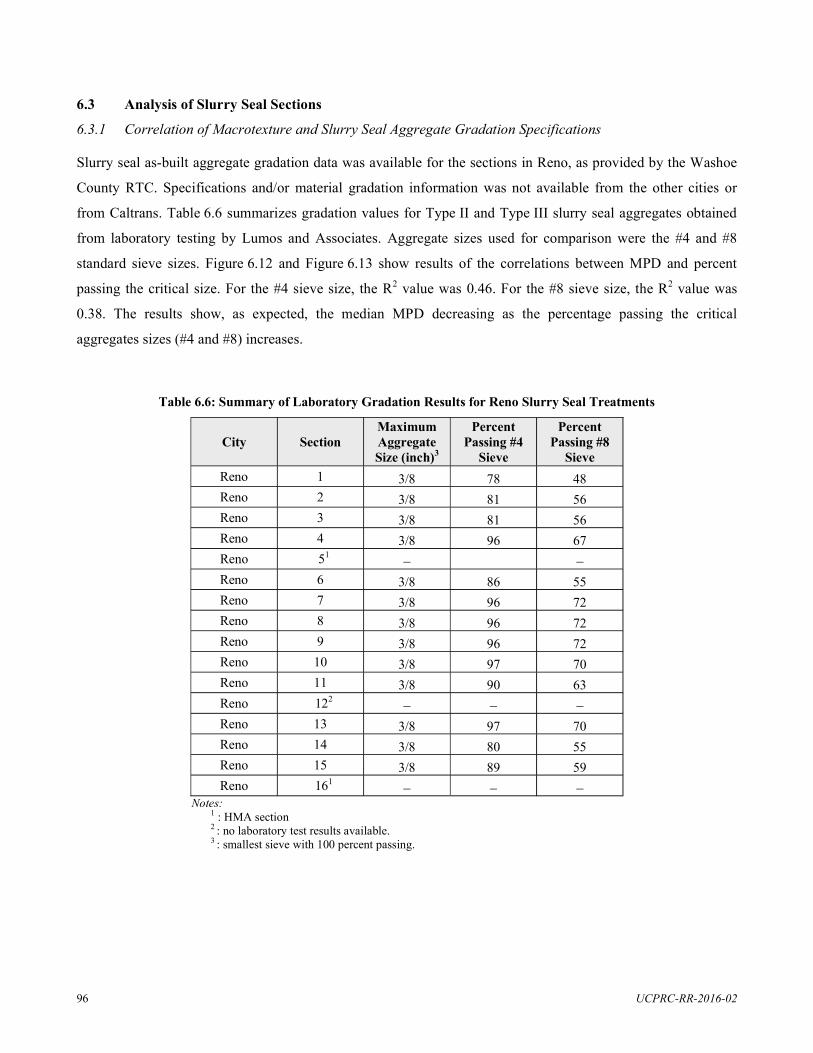
Maximum Percent Percent City Section Aggregate Passing #4 Passing #8
Size (inch)3 Sieve Sieve Reno 1 3/8 78 48Reno 2 3/8 81 56Reno 3 3/8 81 56Reno 4 3/8 96 67Reno 51
Reno 6 3/8 86 55Reno 7 3/8 96 72Reno 8 3/8 96 72Reno 9 3/8 96 72Reno 10 3/8 97 70Reno 11 3/8 90 63Reno 122
Reno 13 3/8 97 70Reno 14 3/8 80 55Reno 15 3/8 89 59Reno 161
6.3 Analysis of Slurry Seal Sections
6.3.1 Correlation of Macrotexture and Slurry Seal Aggregate Gradation Specifications
Slurry seal as-built aggregate gradation data was available for the sections in Reno, as provided by the Washoe
County RTC. Specifications and/or material gradation information was not available from the other cities or
from Caltrans. Table 6.6 summarizes gradation values for Type II and Type III slurry seal aggregates obtained
from laboratory testing by Lumos and Associates. Aggregate sizes used for comparison were the #4 and #8
standard sieve sizes. Figure 6.12 and Figure 6.13 show results of the correlations between MPD and percent
passing the critical size. For the #4 sieve size, the R2 value was 0.46. For the #8 sieve size, the R2 value was
0.38. The results show, as expected, the median MPD decreasing as the percentage passing the critical
aggregates sizes (#4 and #8) increases.
Table 6.6: Summary of Laboratory Gradation Results for Reno Slurry Seal Treatments
Notes: 1 : HMA section 2 : no laboratory test results available. 3 : smallest sieve with 100 percent passing.
UCPRC-RR-2016-02 96
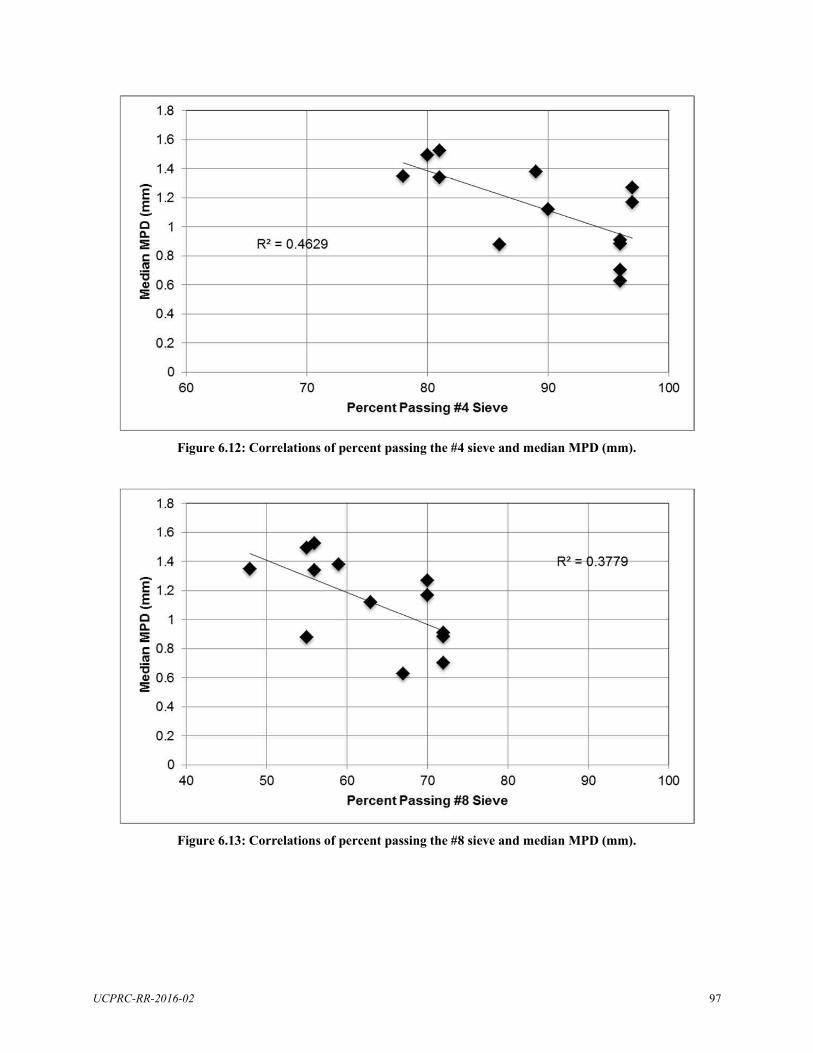
Figure 6.12: Correlations of percent passing the #4 sieve and median MPD (mm).
Figure 6.13: Correlations of percent passing the #8 sieve and median MPD (mm).
UCPRC-RR-2016-02 97

(This page left blank)
UCPRC-RR-2016-02 98
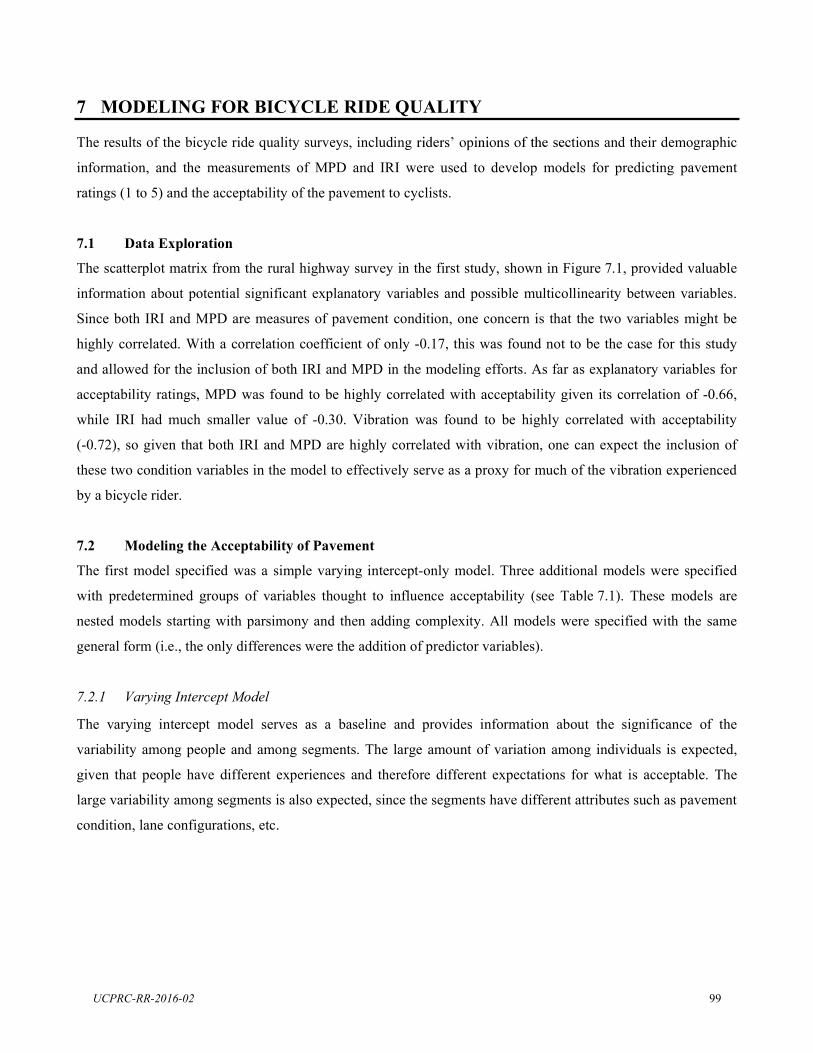
7 MODELING FOR BICYCLE RIDE QUALITY
The results of the bicycle ride quality surveys, including tions and their demographic
information, and the measurements of MPD and IRI were used to develop models for predicting pavement
ratings (1 to 5) and the acceptability of the pavement to cyclists.
7.1 Data Exploration
The scatterplot matrix from the rural highway survey in the first study, shown in Figure 7.1, provided valuable
information about potential significant explanatory variables and possible multicollinearity between variables.
Since both IRI and MPD are measures of pavement condition, one concern is that the two variables might be
highly correlated. With a correlation coefficient of only -0.17, this was found not to be the case for this study
and allowed for the inclusion of both IRI and MPD in the modeling efforts. As far as explanatory variables for
acceptability ratings, MPD was found to be highly correlated with acceptability given its correlation of -0.66,
while IRI had much smaller value of -0.30. Vibration was found to be highly correlated with acceptability
(-0.72), so given that both IRI and MPD are highly correlated with vibration, one can expect the inclusion of
these two condition variables in the model to effectively serve as a proxy for much of the vibration experienced
by a bicycle rider.
7.2 Modeling the Acceptability of Pavement
The first model specified was a simple varying intercept-only model. Three additional models were specified
with predetermined groups of variables thought to influence acceptability (see Table 7.1). These models are
nested models starting with parsimony and then adding complexity. All models were specified with the same
general form (i.e., the only differences were the addition of predictor variables).
7.2.1 Varying Intercept Model
The varying intercept model serves as a baseline and provides information about the significance of the
variability among people and among segments. The large amount of variation among individuals is expected,
given that people have different experiences and therefore different expectations for what is acceptable. The
large variability among segments is also expected, since the segments have different attributes such as pavement
condition, lane configurations, etc.
UCPRC-RR-2016-02 99
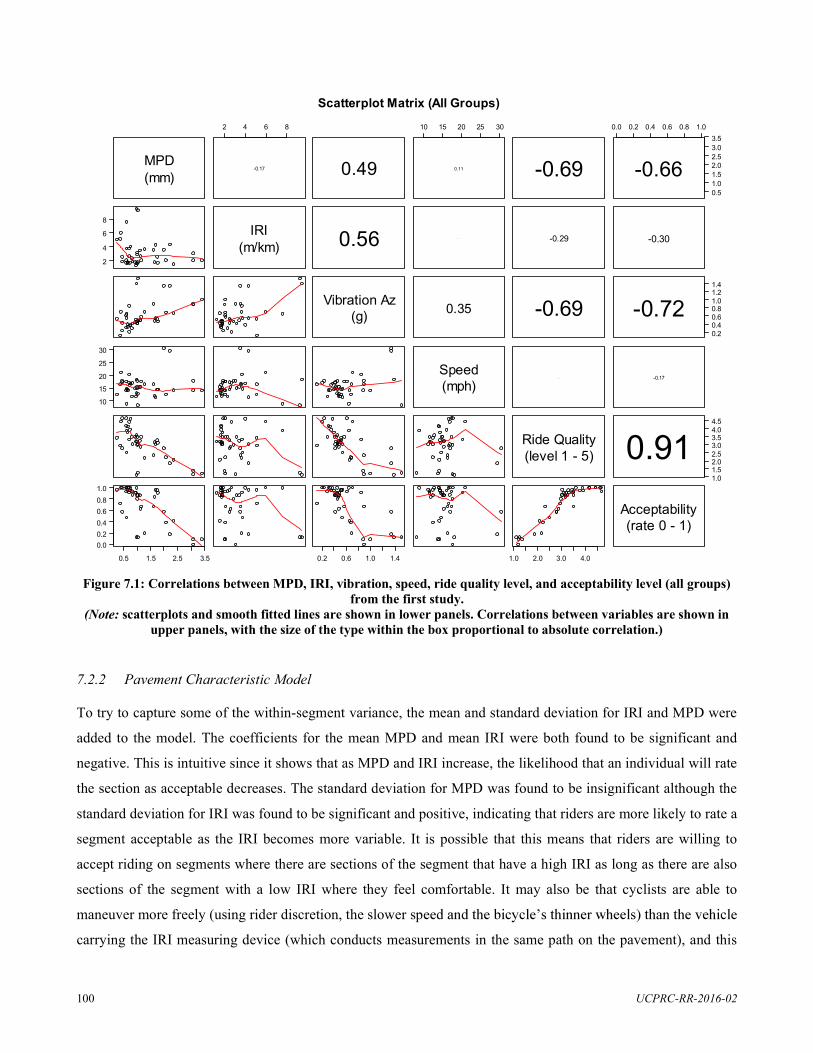
2 4 6 8 10 15 20 25 30 0.0 0.2 0.4 0.6 0.8 1.0 3.5 3.0 2.5 2.0 1.5 1.0 0.5
8
6
4
2
MPD (mm)
-0.17 0.49 0.11 -0.69 -0.66
IRI (m/km) 0.56 0 . 0 1 -0.29 -0.30
Vibration Az (g) 0.35 -0.69 -0.72
Speed (mph)
- 0 . 0 2 -0.17
Ride Quality (level 1 - 5) 0.91
Acceptability (rate 0 - 1)
1.4 1.2 1.0 0.8 0.6 0.4 0.2
30
25
20
15
10
4.5 4.0 3.5 3.0 2.5 2.0 1.5 1.0
1.0 0.8 0.6 0.4 0.2 0.0
0.5 1.5 2.5 3.5 0.2 0.6 1.0 1.4 1.0 2.0 3.0 4.0
Scatterplot Matrix (All Groups)
Figure 7.1: Correlations between MPD, IRI, vibration, speed, ride quality level, and acceptability level (all groups) from the first study.
(Note: scatterplots and smooth fitted lines are shown in lower panels. Correlations between variables are shown in upper panels, with the size of the type within the box proportional to absolute correlation.)
7.2.2 Pavement Characteristic Model
To try to capture some of the within-segment variance, the mean and standard deviation for IRI and MPD were
added to the model. The coefficients for the mean MPD and mean IRI were both found to be significant and
negative. This is intuitive since it shows that as MPD and IRI increase, the likelihood that an individual will rate
the section as acceptable decreases. The standard deviation for MPD was found to be insignificant although the
standard deviation for IRI was found to be significant and positive, indicating that riders are more likely to rate a
segment acceptable as the IRI becomes more variable. It is possible that this means that riders are willing to
accept riding on segments where there are sections of the segment that have a high IRI as long as there are also
sections of the segment with a low IRI where they feel comfortable. It may also be that cyclists are able to
maneuver more freely (using rider discretion, the slower sp
carrying the IRI measuring device (which conducts measurements in the same path on the pavement), and this
UCPRC-RR-2016-02 100
allows them to avoid the sections of the segment that have high IRI. The bicycles have smaller tires and a rider
can adjust their lane position if they see small bumps or holes ahead of time. The WAIC improves moving from
the intercept-only model to consideration of pavement characteristics, suggesting that the new model is better
for prediction.
7.2.3 Bicycle/Personal Characteristics Model
To attempt to capture some of the variance among people, information about the riders and their bicycles were
included. The effects of gender, bicycling frequency, age, education, and tire pressure were investigated. None
of these variables were found to be significant with 90 percent confidence, however, gender was found to be
significant with a confidence of about 80 percent. Previous studies have found that female riders tend to be more
concerned with traffic interactions and with having adequate bicycle infrastructure such as separated bike lanes,
so it is likely that they may also be more sensitive to pavement condition. Bicycling frequency is over-
represented in the sample, given that 70 percent of the riders in the survey said that they bicycled at least every
other day. This means that although age and tire pressure were found to be insignificant in this study, this may
not hold true for the larger population, which includes people who do not bicycle as often. Bicycle type and
frame material were also considered but found to be insignificant. It should be noted that the sample size is
different for models that include personal characteristics since those 66 out of 2,886 survey respondents who
chose not to answer this section of the survey were removed from the sample before fitting the model.
7.2.4 Full Model
The full model combines the pavement characteristics model and the personal characteristics model. As
expected, the WAIC for the full model is the lowest out of all the models, indicating that it is the model that fits
the data the best. It can be seen that the mean intercept and the varying intercepts among the individuals and
segments are still significant, showing that there is still explanatory information that was not captured in the
survey and modeling process. This information could incl
features of the road that are not captured by MPD and IRI, such as drains or many other factors.
By simulating riders and pavement conditions and holding all other aspects constant, the full model can be used
to predict the percentage of the population that would rate a given segment as acceptable. Two example
simulations are shown in Figure 7.2 and Figure 7.3. The first figure is for a simulated rider independent of
gender and other personal characteristics that influence opinion, and the second figure is a simulation for the
type of user most likely to rate a section as unacceptable, which is a female rider who bikes often and has at
least a BA degree. When using a plot to try to guide decision making for treatment choice, it is important to first
consider what the population of interest is.
UCPRC-RR-2016-02 101
These plots show that it is the combination of MPD and IRI which determines acceptability. For example, it is
predicted that when IRI is less than 129 inches/mile (2 m/km), 90 percent of the simulated riders would still find
the segment acceptable up to an MPD of 1.7 mm. However, if IRI reaches 258 inches/mile (4 m/km), then the
MPD at which 90 percent of the simulated riders would feel it is acceptable is 1.4 mm. For high levels of IRI,
such as 380 inches/mile (6 m/km), in order to satisfy 90 percent of the simulated riders, MPD would need to be
less than 1 mm. For frequent-biking, educated, female riders, the thresholds for acceptability are somewhat
lower. For example, to have 90 percent of the simulated riders from this population deem a segment acceptable
when the IRI is 258 inches/mile (4 m/km), MPD would need to be 1.3 mm, which is 0.1 mm lower than for the
combined male and female population.
It should be mentioned that since pavement condition is not the only factor that influences segment
acceptability, it is possible that there are certain segments which will never be acceptable to bicyclists because
of a perceived lack of safety due to interactions with vehicles. It is also important to mention that even if a
segment is found acceptable by 95 percent of its riders, if the riding population is large enough, there will still be
people who will find the segment unacceptable, for example 25 out of every 500 riders who use a section each
month.
UCPRC-RR-2016-02 102
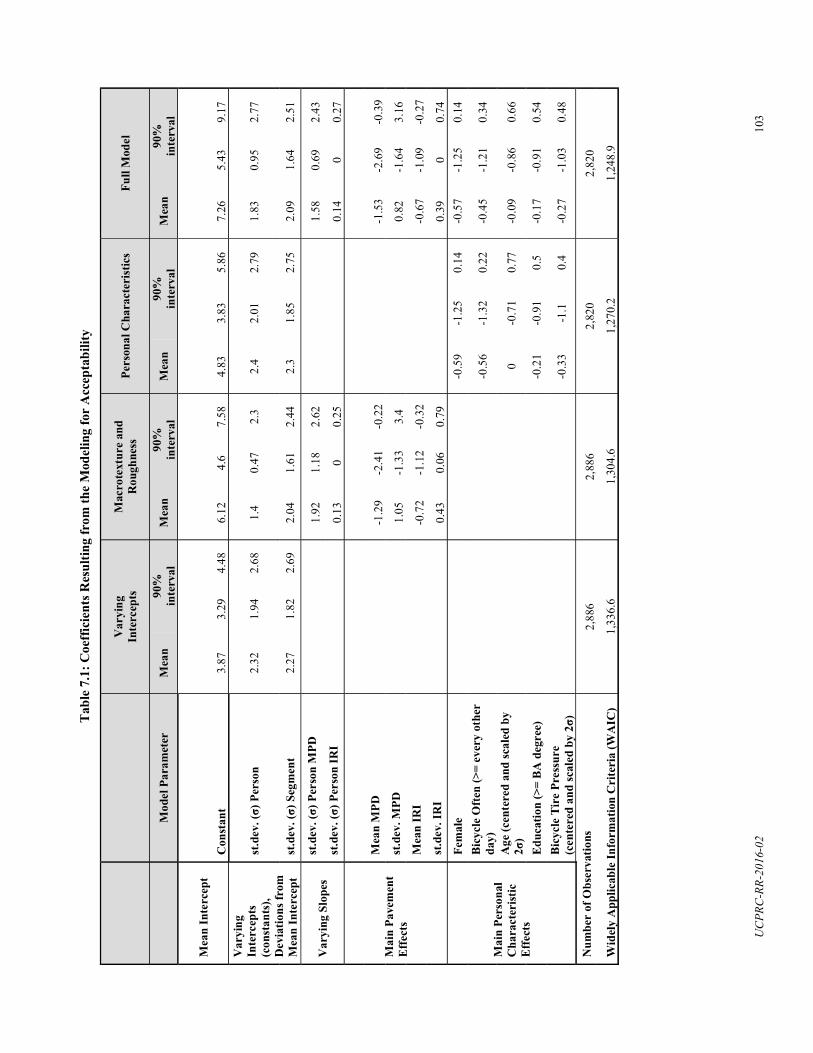
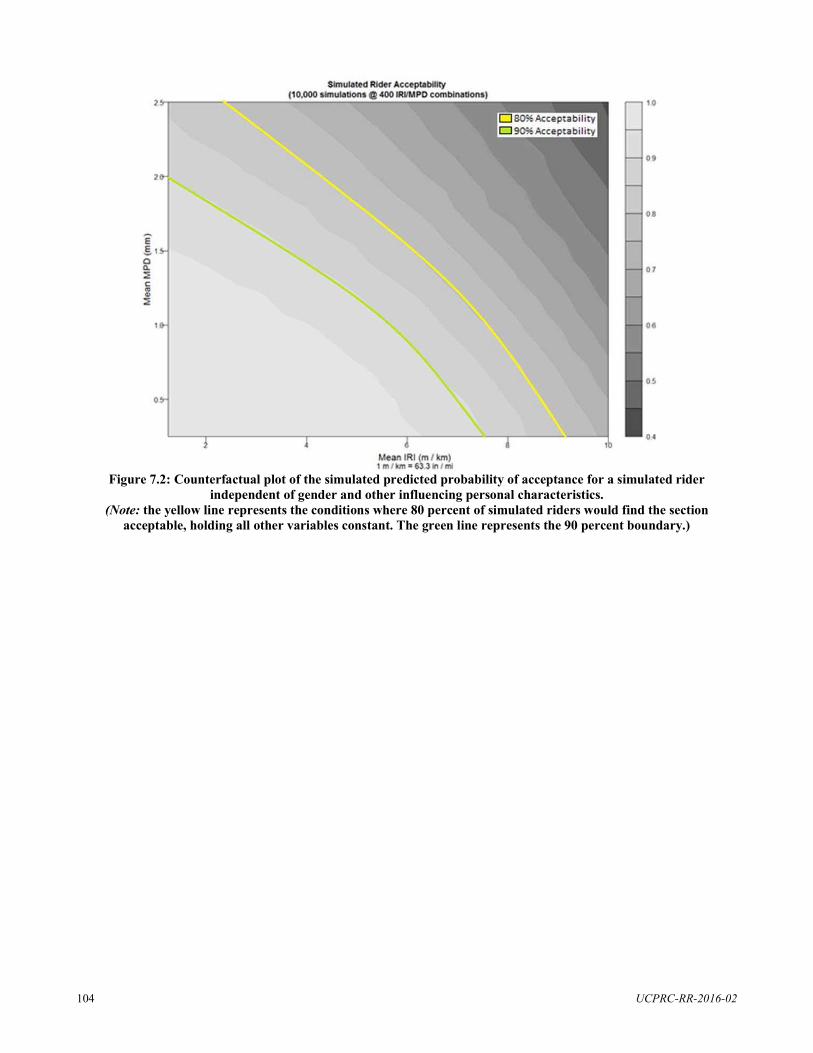
Figure 7.2: Counterfactual plot of the simulated predicted probability of acceptance for a simulated rider independent of gender and other influencing personal characteristics.
(Note: the yellow line represents the conditions where 80 percent of simulated riders would find the section acceptable, holding all other variables constant. The green line represents the 90 percent boundary.)
UCPRC-RR-2016-02 104
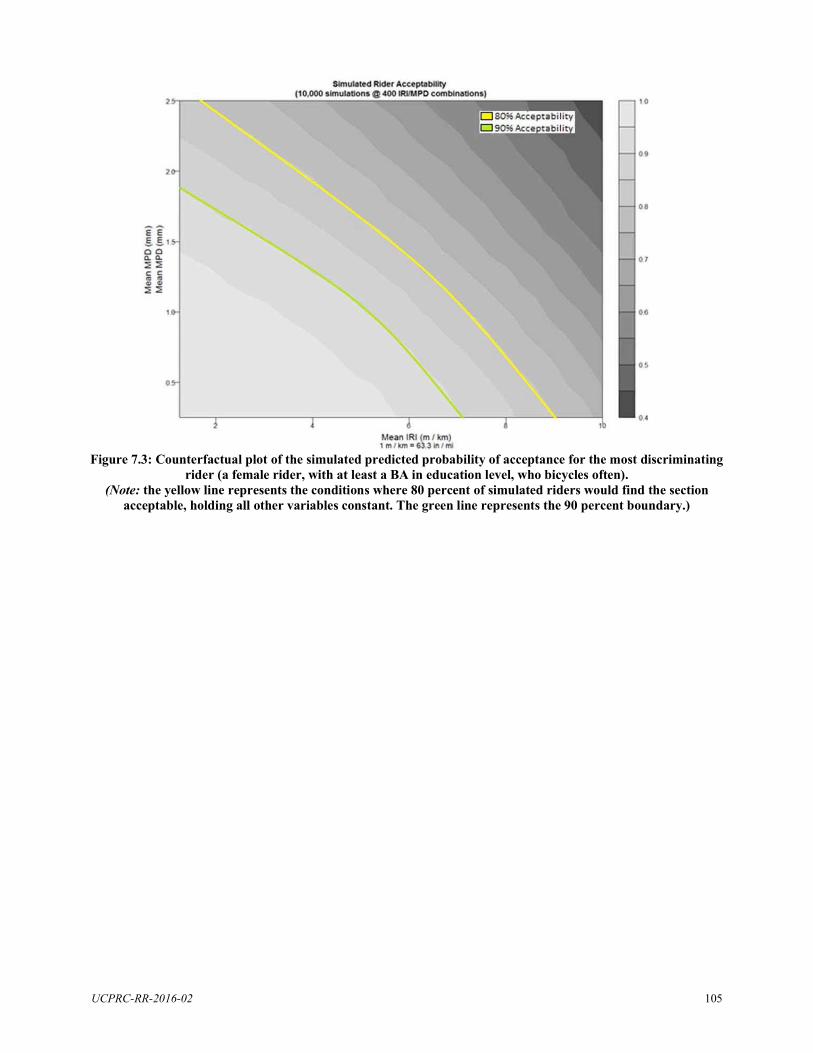
Figure 7.3: Counterfactual plot of the simulated predicted probability of acceptance for the most discriminating rider (a female rider, with at least a BA in education level, who bicycles often).
(Note: the yellow line represents the conditions where 80 percent of simulated riders would find the section acceptable, holding all other variables constant. The green line represents the 90 percent boundary.)
UCPRC-RR-2016-02 105

(This page left blank)
UCPRC-RR-2016-02 106
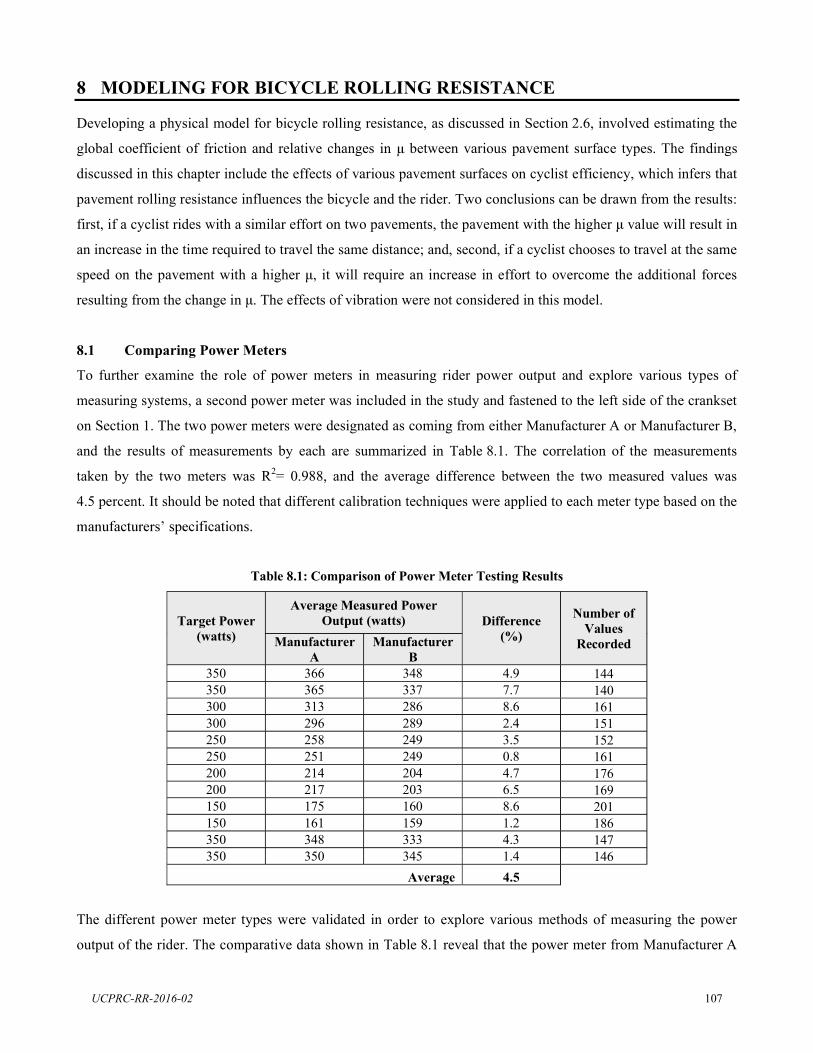
8 MODELING FOR BICYCLE ROLLING RESISTANCE
Developing a physical model for bicycle rolling resistance, as discussed in Section 2.6, involved estimating the
global coefficient of friction and relative changes in between various pavement surface types. The findings
discussed in this chapter include the effects of various pavement surfaces on cyclist efficiency, which infers that
pavement rolling resistance influences the bicycle and the rider. Two conclusions can be drawn from the results:
first, if a cyclist rides with a similar effort on two pavements, the pavement with the higher value will result in
an increase in the time required to travel the same distance; and, second, if a cyclist chooses to travel at the same
speed on the pavement with a higher , it will require an increase in effort to overcome the additional forces
resulting from the change in . The effects of vibration were not considered in this model.
8.1 Comparing Power Meters
To further examine the role of power meters in measuring rider power output and explore various types of
measuring systems, a second power meter was included in the study and fastened to the left side of the crankset
on Section 1. The two power meters were designated as coming from either Manufacturer A or Manufacturer B,
and the results of measurements by each are summarized in Table 8.1. The correlation of the measurements
taken by the two meters was R2= 0.988, and the average difference between the two measured values was
4.5 percent. It should be noted that different calibration techniques were applied to each meter type based on the
Table 8.1: Comparison of Power Meter Testing Results
Target Power (watts)
Average Measured Power Output (watts) Difference
(%)
Number of Values
Recorded Manufacturer A
Manufacturer B
350 366 348 4.9 144 350 365 337 7.7 140 300 313 286 8.6 161 300 296 289 2.4 151 250 258 249 3.5 152 250 251 249 0.8 161 200 214 204 4.7 176 200 217 203 6.5 169 150 175 160 8.6 201 150 161 159 1.2 186 350 348 333 4.3 147 350 350 345 1.4 146
Average 4.5
The different power meter types were validated in order to explore various methods of measuring the power
output of the rider. The comparative data shown in Table 8.1 reveal that the power meter from Manufacturer A
UCPRC-RR-2016-02 107
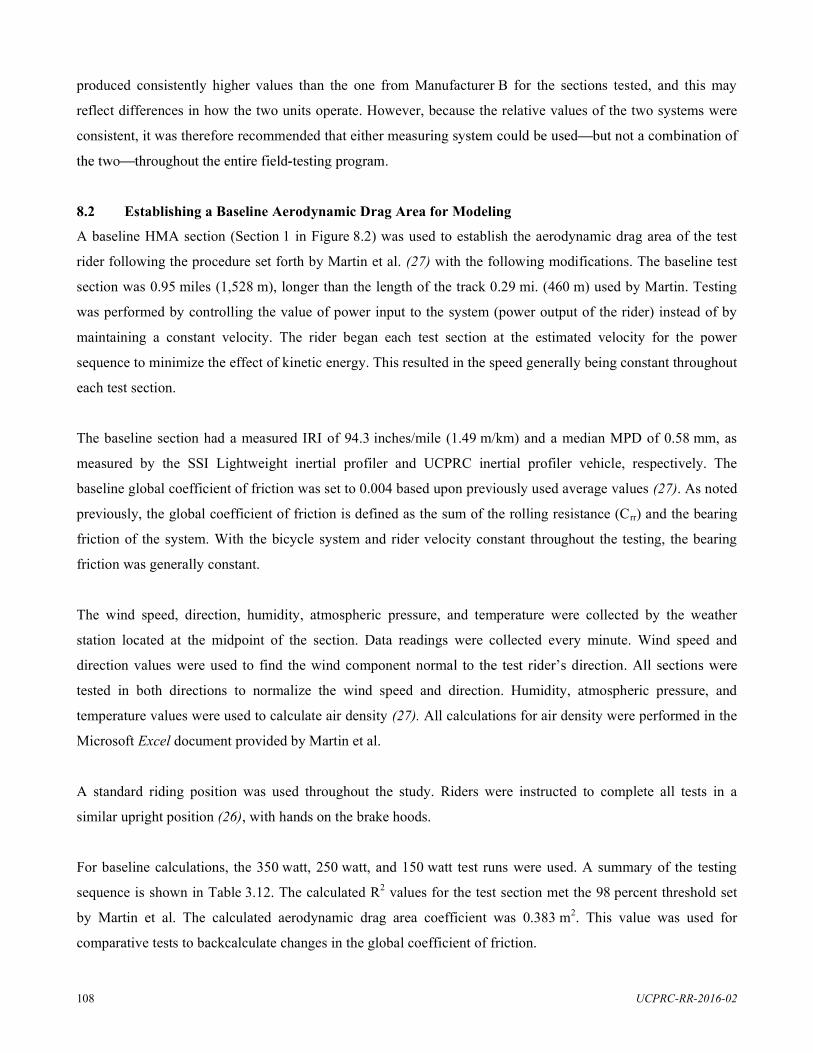
produced consistently higher values than the one from Manufacturer B for the sections tested, and this may
reflect differences in how the two units operate. However, because the relative values of the two systems were
consistent, it was therefore recommended that either meas
8.2 Establishing a Baseline Aerodynamic Drag Area for Modeling
A baseline HMA section (Section 1 in Figure 8.2) was used to establish the aerodynamic drag area of the test
rider following the procedure set forth by Martin et al. (27) with the following modifications. The baseline test
section was 0.95 miles (1,528 m), longer than the length of the track 0.29 mi. (460 m) used by Martin. Testing
was performed by controlling the value of power input to the system (power output of the rider) instead of by
maintaining a constant velocity. The rider began each test section at the estimated velocity for the power
sequence to minimize the effect of kinetic energy. This resulted in the speed generally being constant throughout
each test section.
The baseline section had a measured IRI of 94.3 inches/mile (1.49 m/km) and a median MPD of 0.58 mm, as
measured by the SSI Lightweight inertial profiler and UCPRC inertial profiler vehicle, respectively. The
baseline global coefficient of friction was set to 0.004 based upon previously used average values (27). As noted
previously, the global coefficient of friction is defined as the sum of the rolling resistance (Crr) and the bearing
friction of the system. With the bicycle system and rider velocity constant throughout the testing, the bearing
friction was generally constant.
The wind speed, direction, humidity, atmospheric pressure, and temperature were collected by the weather
station located at the midpoint of the section. Data readings were collected every minute. Wind speed and
direction values were used to find the wind component norma
tested in both directions to normalize the wind speed and direction. Humidity, atmospheric pressure, and
temperature values were used to calculate air density (27). All calculations for air density were performed in the
Microsoft Excel document provided by Martin et al.
A standard riding position was used throughout the study. Riders were instructed to complete all tests in a
similar upright position (26), with hands on the brake hoods.
For baseline calculations, the 350 watt, 250 watt, and 150 watt test runs were used. A summary of the testing
sequence is shown in Table 3.12. The calculated R2 values for the test section met the 98 percent threshold set
by Martin et al. The calculated aerodynamic drag area coefficient was 0.383 m2. This value was used for
comparative tests to backcalculate changes in the global coefficient of friction.
UCPRC-RR-2016-02 108
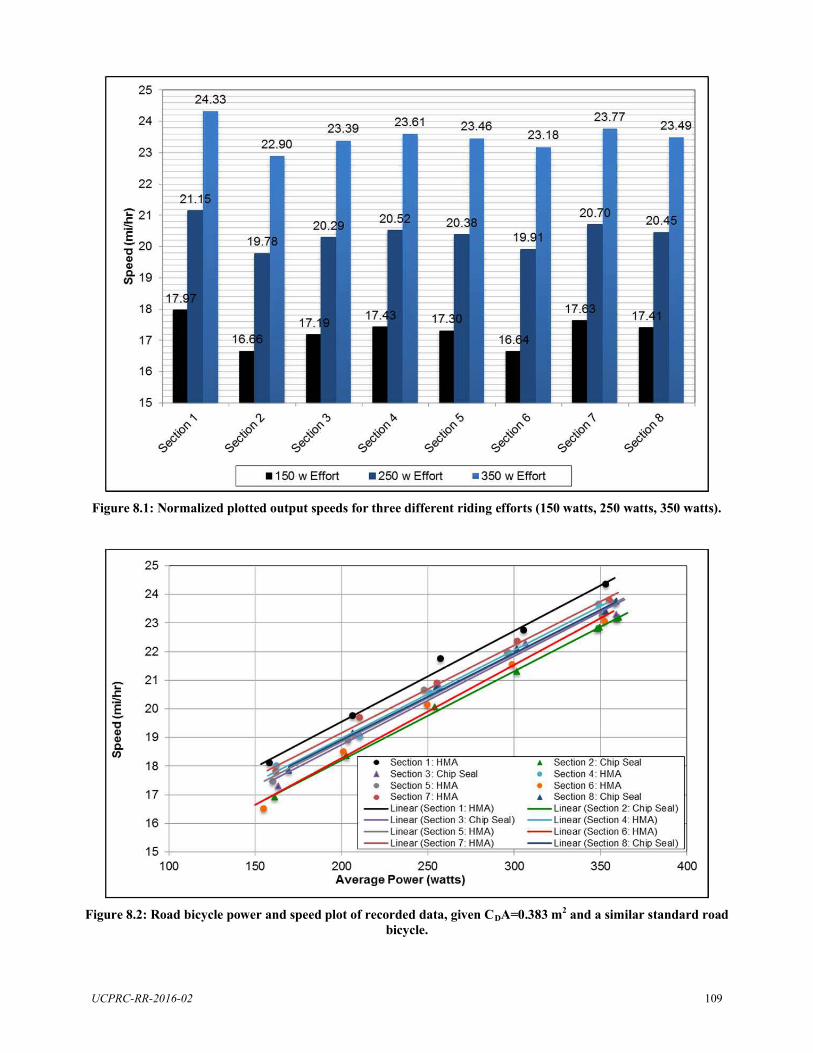
Figure 8.1: Normalized plotted output speeds for three different riding efforts (150 watts, 250 watts, 350 watts).
Figure 8.2: Road bicycle power and speed plot of recorded data, given CDA=0.383 m2 and a similar standard road bicycle.
UCPRC-RR-2016-02 109
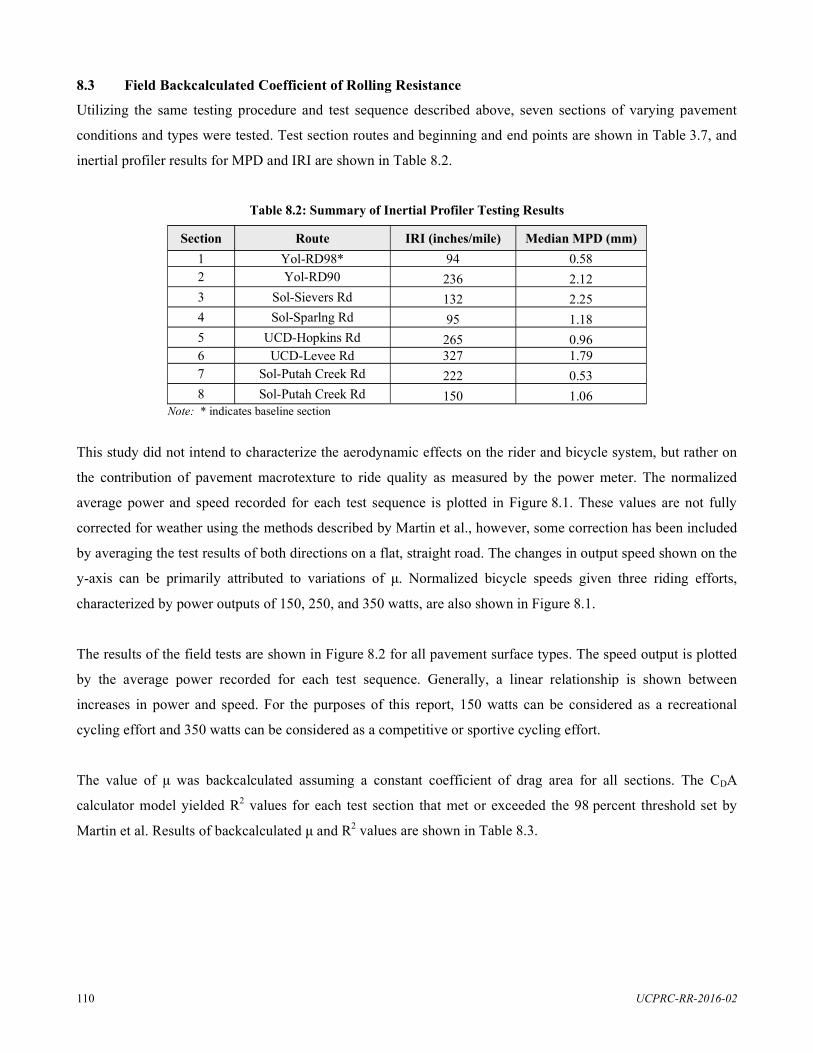
8.3 Field Backcalculated Coefficient of Rolling Resistance
Utilizing the same testing procedure and test sequence described above, seven sections of varying pavement
conditions and types were tested. Test section routes and beginning and end points are shown in Table 3.7, and
inertial profiler results for MPD and IRI are shown in Table 8.2.
Table 8.2: Summary of Inertial Profiler Testing Results
Section Route IRI (inches/mile) Median MPD (mm) 1 Yol-RD98* 94 0.58 2 Yol-RD90 236 2.12 3 Sol-Sievers Rd 132 2.25 4 Sol-Sparlng Rd 95 1.18 5 UCD-Hopkins Rd 265 0.96 6 UCD-Levee Rd 327 1.79 7 Sol-Putah Creek Rd 222 0.53 8 Sol-Putah Creek Rd 150 1.06
Note: * indicates baseline section
This study did not intend to characterize the aerodynamic effects on the rider and bicycle system, but rather on
the contribution of pavement macrotexture to ride quality as measured by the power meter. The normalized
average power and speed recorded for each test sequence is plotted in Figure 8.1. These values are not fully
corrected for weather using the methods described by Martin et al., however, some correction has been included
by averaging the test results of both directions on a flat, straight road. The changes in output speed shown on the
y-axis can be primarily attributed to variations of . Normalized bicycle speeds given three riding efforts,
characterized by power outputs of 150, 250, and 350 watts, are also shown in Figure 8.1.
The results of the field tests are shown in Figure 8.2 for all pavement surface types. The speed output is plotted
by the average power recorded for each test sequence. Generally, a linear relationship is shown between
increases in power and speed. For the purposes of this report, 150 watts can be considered as a recreational
cycling effort and 350 watts can be considered as a competitive or sportive cycling effort.
The value of was backcalculated assuming a constant coefficient of drag area for all sections. The CDA
calculator model yielded R2 values for each test section that met or exceeded the 98 percent threshold set by
Martin et al. Results of backcalculated and R2 values are shown in Table 8.3.
UCPRC-RR-2016-02 110
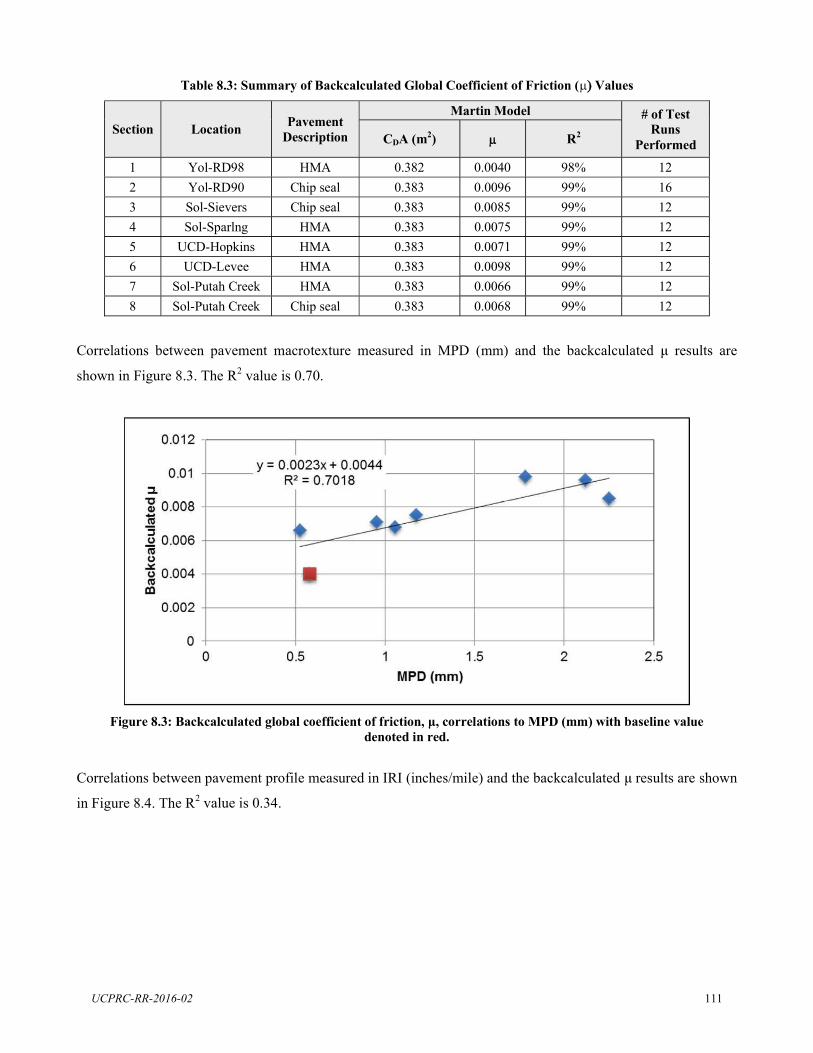
Table 8.3: Summary of Backcalculated Global Coefficient of Friction ( Values
Section Location Pavement Description
Martin Model # of Test Runs
Performed CDA (m2) R2
1 Yol-RD98 HMA 0.382 0.0040 98% 12 2 Yol-RD90 Chip seal 0.383 0.0096 99% 16 3 Sol-Sievers Chip seal 0.383 0.0085 99% 12 4 Sol-Sparlng HMA 0.383 0.0075 99% 12 5 UCD-Hopkins HMA 0.383 0.0071 99% 12 6 UCD-Levee HMA 0.383 0.0098 99% 12 7 Sol-Putah Creek HMA 0.383 0.0066 99% 12 8 Sol-Putah Creek Chip seal 0.383 0.0068 99% 12
Correlations between pavement macrotexture measured in MPD (mm) and the backcalculated results are
shown in Figure 8.3. The R2 value is 0.70.
Figure 8.3: Backcalculated global coefficient of friction, , correlations to MPD (mm) with baseline value denoted in red.
Correlations between pavement profile measured in IRI (inches/mile) and the backcalculated results are shown
in Figure 8.4. The R2 value is 0.34.
UCPRC-RR-2016-02 111
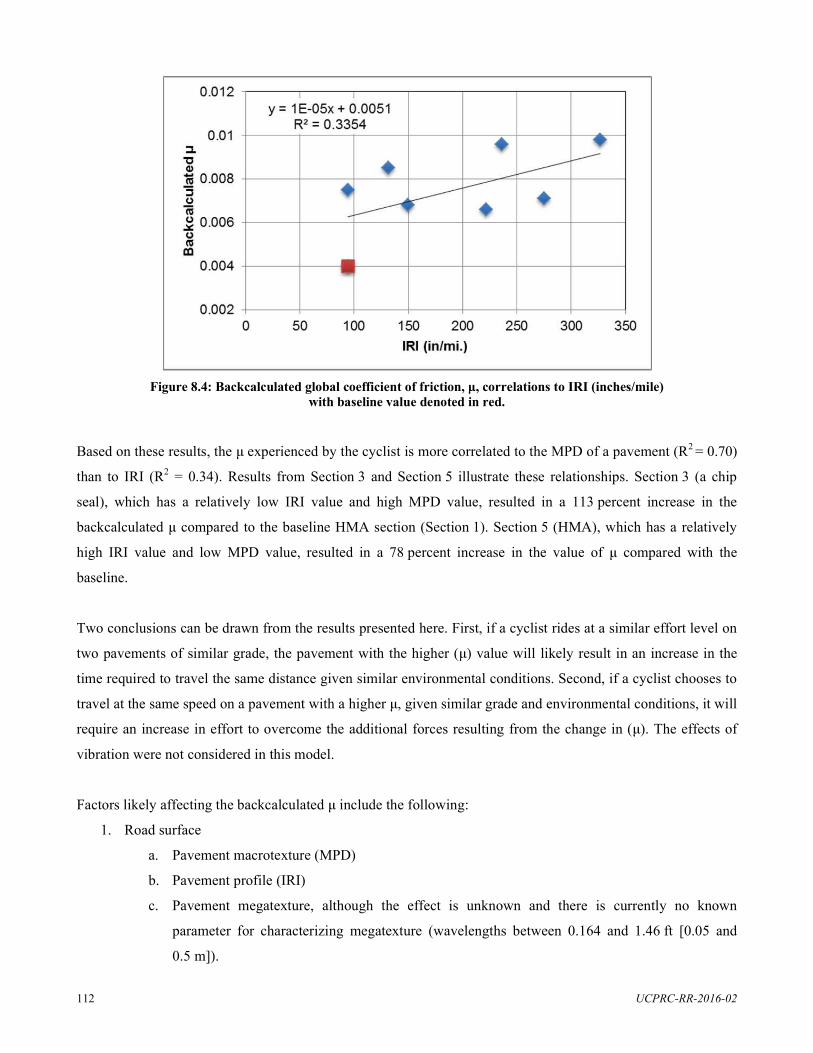
Figure 8.4: Backcalculated global coefficient of friction, , correlations to IRI (inches/mile) with baseline value denoted in red.
Based on these results, the experienced by the cyclist is more correlated to the MPD of a pavement (R2 = 0.70)
than to IRI (R2 = 0.34). Results from Section 3 and Section 5 illustrate these relationships. Section 3 (a chip
seal), which has a relatively low IRI value and high MPD value, resulted in a 113 percent increase in the
backcalculated compared to the baseline HMA section (Section 1). Section 5 (HMA), which has a relatively
high IRI value and low MPD value, resulted in a 78 percent increase in the value of compared with the
baseline.
Two conclusions can be drawn from the results presented here. First, if a cyclist rides at a similar effort level on
two pavements of similar grade, the pavement with the higher ( ) value will likely result in an increase in the
time required to travel the same distance given similar environmental conditions. Second, if a cyclist chooses to
vibration were not considered in this model.
Factors likely affecting the backcalculated include the following:
1. Road surface
a. Pavement macrotexture (MPD)
b. Pavement profile (IRI)
c. Pavement megatexture, although the effect is unknown and there is currently no known
parameter for characterizing megatexture (wavelengths between 0.164 and 1.46 ft [0.05 and
0.5 m]).
travel at the same speed on a pavement with a higher , given similar grade and environmental conditions, it will
require an increase in effort to overcome the additional forces resulting from the change in ( ). The effects of
UCPRC-RR-2016-02 112

2. Tire pressure and construction
3. Changes in combined cyclist and bicycle mass
4.
Since the second, third, and fourth items were held constant or were controlled, it can be assumed that changes
in were attributable to road surface characteristics, including the unmeasured effects of megatexture.
While the model allows backcalculation of -values, there are many external variables that must be considered,
including:
Accurately accounting for wind, primarily wind gusts
Vehicles that pass a rider during a test, producing wind conditions similar to gusts
Changes in rider position during the test primarily associated with fatigue
The ability of a rider to complete each run at a steady speed to avoid changes in kinetic energy
Power meter measurement errors
Tests that were performed when wind speeds were high or conditions were gusty were discarded because of the
potential variance they might cause in the test results.
UCPRC-RR-2016-02 113
8.4 Effects on Rider Fatigue
As a rider experiences variations in , the effects on his or her fatigue can be characterized by the changes in the
output speed for similar power efforts. Between the baseline HMA section, with its MPD of 0.58 mm and IRI of
94 inches/mile (1.48 m/km), and the chip seal on Section 2, with its MPD of 2.12 mm and IRI of
236 inches/mile (3.72 m/km), the following changes were measured:
At 350 watts, a 1.43 mph decrease in speed
At 250 watts, a 1.37 mph decrease in speed
At 150 watts, a 1.31 mph decrease in speed
Generally, given the same level of effort, a bicyclist would expect to travel at a similar speed on a variety of
pavement types. And, as this report shows, there is a
state and local networks. However, between various pavement conditions, there are measurable changes in
that will likely result in a reduction of speed with a similar power output. To account for these changes in and
adapt their power output level, a bicyclist has two options: to pedal with greater power output effort to overcome
the additional forces or to lower their speed and maintain the same pedaling power output effort. As expected,
an increased effort by the rider to overcome the additi
be noted that similar values were measured on sections of HMA and on chip seals, showing that is likely
dependent on the surface characteristics in terms of macrotexture and roughness and not on the generic surface
types.
perceptions of pavement
ride quality and acceptability, not only through increased vibration, which produces discomfort, but also through
increases in the pedaling power effort required of riders.
UCPRC-RR-2016-02 114
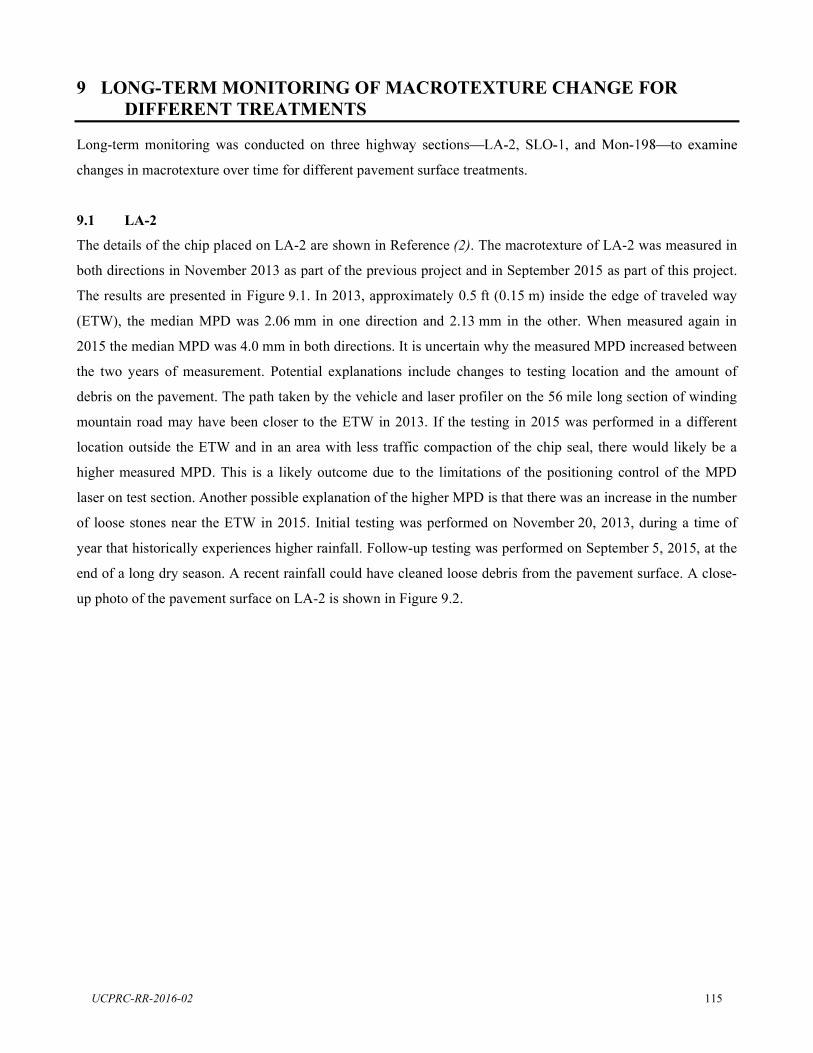
9 LONG-TERM MONITORING OF MACROTEXTURE CHANGE FOR DIFFERENT TREATMENTS
Long-term monitoring was conducted on three high
changes in macrotexture over time for different pavement surface treatments.
9.1 LA-2
The details of the chip placed on LA-2 are shown in Reference (2). The macrotexture of LA-2 was measured in
both directions in November 2013 as part of the previous project and in September 2015 as part of this project.
The results are presented in Figure 9.1. In 2013, approximately 0.5 ft (0.15 m) inside the edge of traveled way
(ETW), the median MPD was 2.06 mm in one direction and 2.13 mm in the other. When measured again in
2015 the median MPD was 4.0 mm in both directions. It is uncertain why the measured MPD increased between
the two years of measurement. Potential explanations include changes to testing location and the amount of
debris on the pavement. The path taken by the vehicle and laser profiler on the 56 mile long section of winding
mountain road may have been closer to the ETW in 2013. If the testing in 2015 was performed in a different
location outside the ETW and in an area with less traffic compaction of the chip seal, there would likely be a
higher measured MPD. This is a likely outcome due to the limitations of the positioning control of the MPD
laser on test section. Another possible explanation of the higher MPD is that there was an increase in the number
of loose stones near the ETW in 2015. Initial testing was performed on November 20, 2013, during a time of
year that historically experiences higher rainfall. Follow-up testing was performed on September 5, 2015, at the
end of a long dry season. A recent rainfall could have cleaned loose debris from the pavement surface. A close-
up photo of the pavement surface on LA-2 is shown in Figure 9.2.
UCPRC-RR-2016-02 115
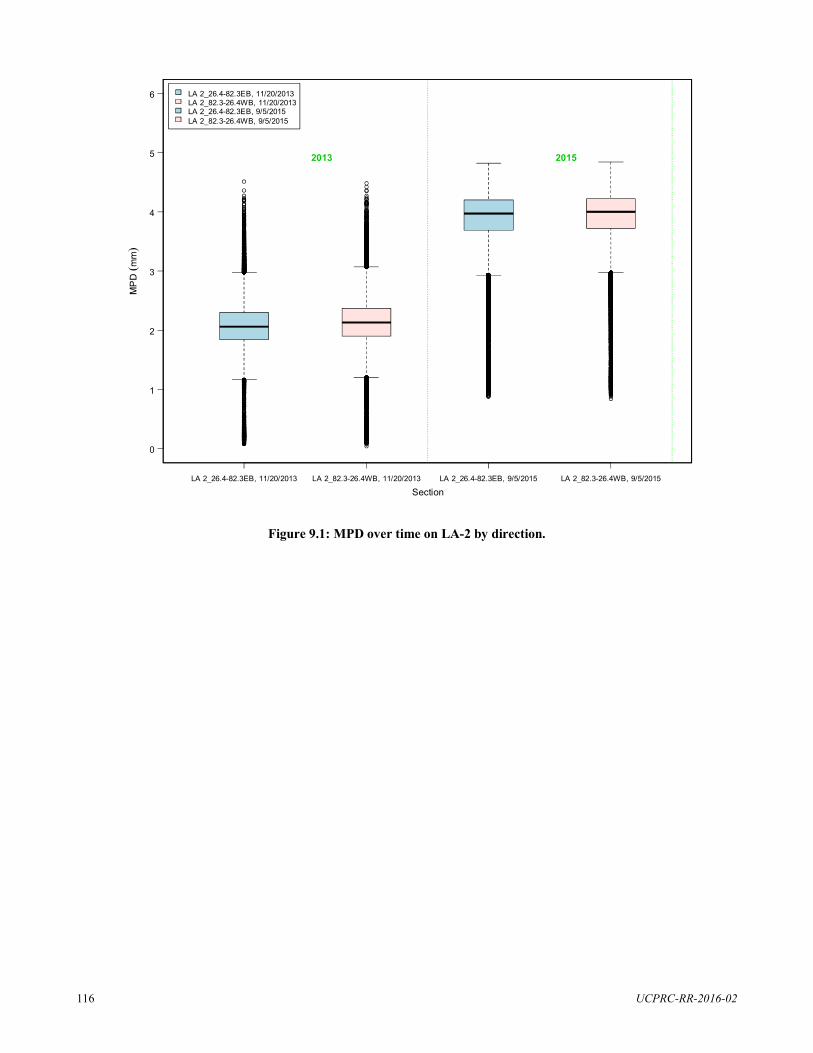
LA 2_26.4-82.3EB, 11/20/2013 LA 2_82.3-26.4WB, 11/20/2013 LA 2_26.4-82.3EB, 9/5/2015 LA 2_82.3-26.4WB, 9/5/2015
6
5 2013 2015
4
3
2
1
0
LA 2_26.4-82.3EB, 11/20/2013 LA 2_82.3-26.4WB, 11/20/2013 LA 2_26.4-82.3EB, 9/5/2015 LA 2_82.3-26.4WB, 9/5/2015
Section
Figure 9.1: MPD over time on LA-2 by direction.
UCPRC-RR-2016-02 116
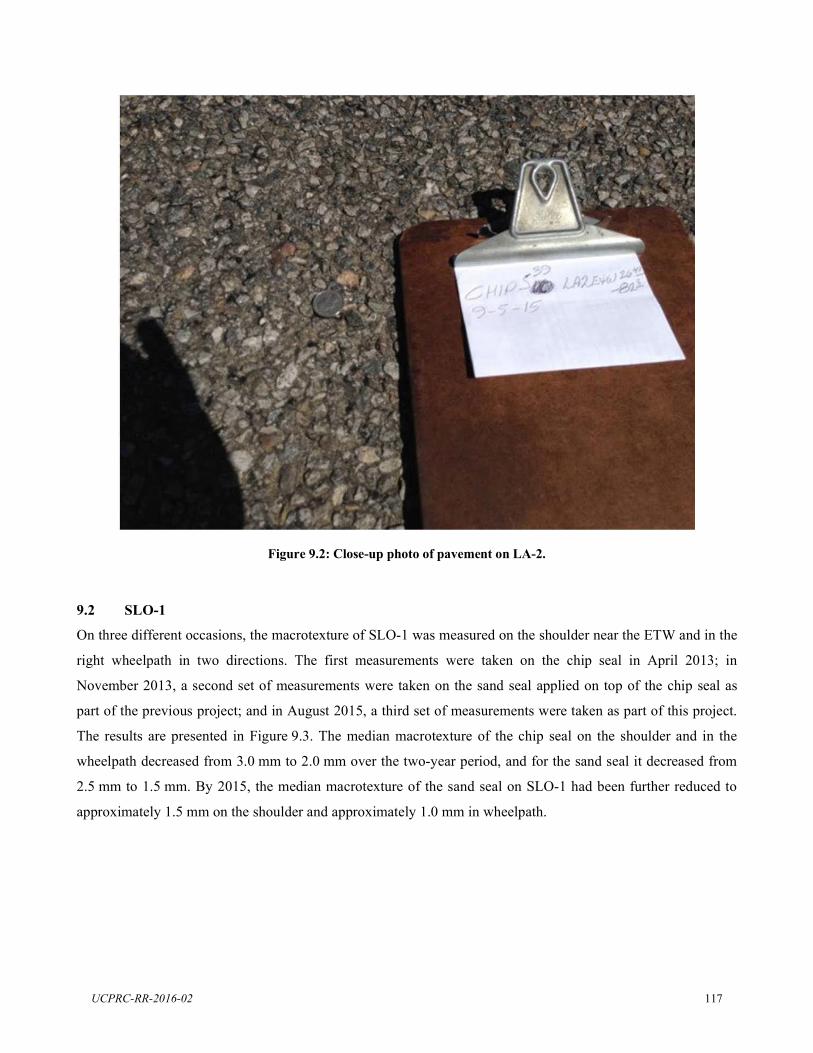
Figure 9.2: Close-up photo of pavement on LA-2.
9.2 SLO-1
On three different occasions, the macrotexture of SLO-1 was measured on the shoulder near the ETW and in the
right wheelpath in two directions. The first measurements were taken on the chip seal in April 2013; in
November 2013, a second set of measurements were taken on the sand seal applied on top of the chip seal as
part of the previous project; and in August 2015, a third set of measurements were taken as part of this project.
The results are presented in Figure 9.3. The median macrotexture of the chip seal on the shoulder and in the
wheelpath decreased from 3.0 mm to 2.0 mm over the two-year period, and for the sand seal it decreased from
2.5 mm to 1.5 mm. By 2015, the median macrotexture of the sand seal on SLO-1 had been further reduced to
approximately 1.5 mm on the shoulder and approximately 1.0 mm in wheelpath.
UCPRC-RR-2016-02 117
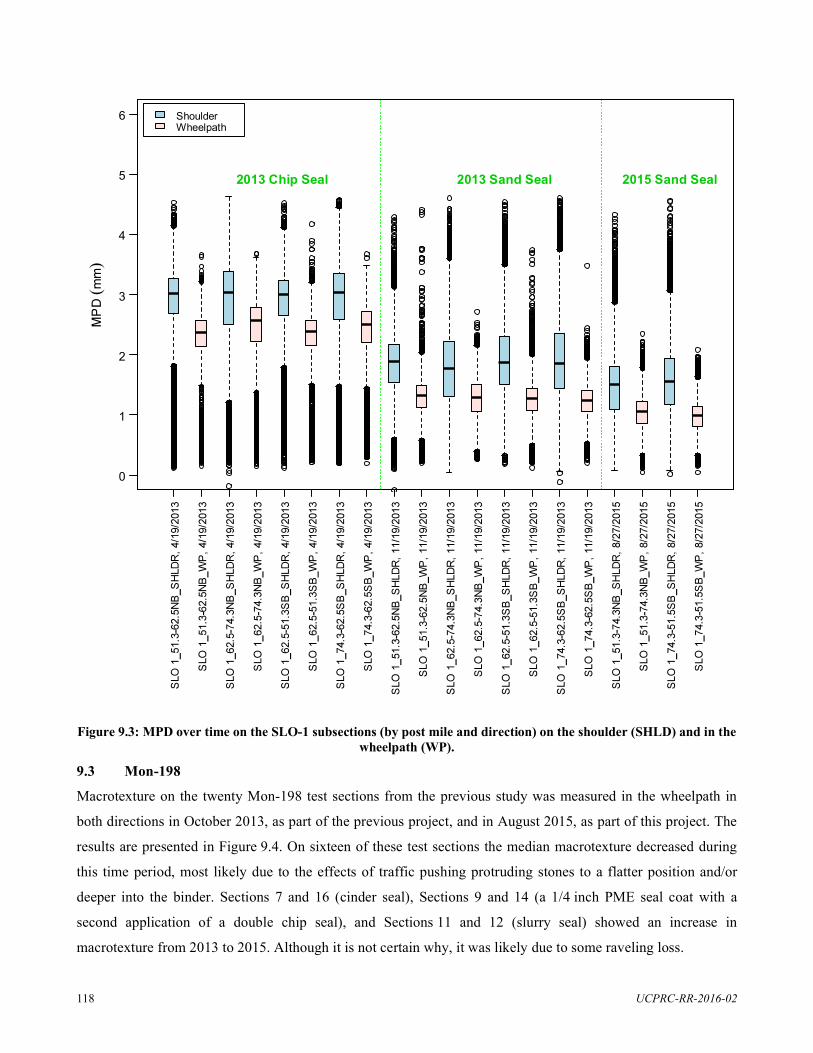
6 Shoulder Wheelpath
5 2013 Chip Seal 2013 Sand Seal 2015 Sand Seal
4
3
2
1
0
Figure 9.3: MPD over time on the SLO-1 subsections (by post mile and direction) on the shoulder (SHLD) and in the wheelpath (WP).
9.3 Mon-198
Macrotexture on the twenty Mon-198 test sections from the previous study was measured in the wheelpath in
both directions in October 2013, as part of the previous project, and in August 2015, as part of this project. The
results are presented in Figure 9.4. On sixteen of these test sections the median macrotexture decreased during
this time period, most likely due to the effects of traffic pushing protruding stones to a flatter position and/or
deeper into the binder. Sections 7 and 16 (cinder seal), Sections 9 and 14 (a 1/4 inch PME seal coat with a
second application of a double chip seal), and Sections 11 and 12 (slurry seal) showed an increase in
macrotexture from 2013 to 2015. Although it is not certain why, it was likely due to some raveling loss.
UCPRC-RR-2016-02 118
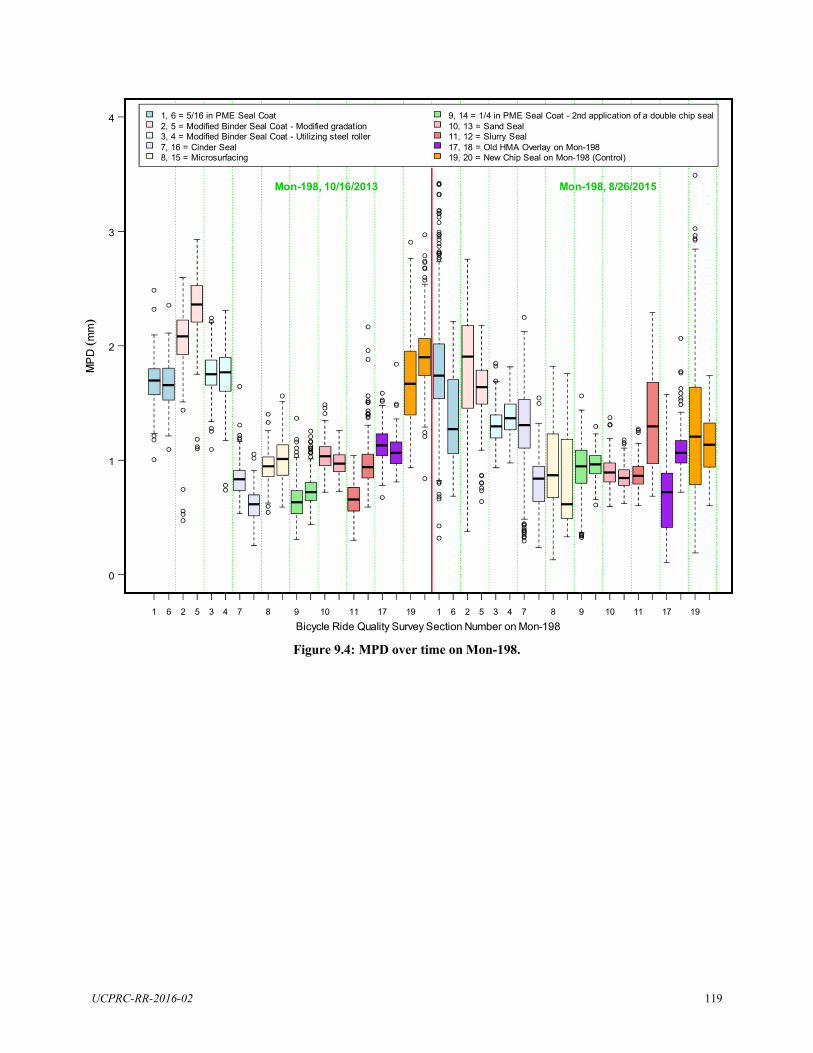
2
1
4 1, 6 = 5/16 in PME Seal Coat 2, 5 = Modified Binder Seal Coat - Modified gradation 3, 4 = Modified Binder Seal Coat - Utilizing steel roller 7, 16 = Cinder Seal 8, 15 = Microsurfacing
9, 14 = 1/4 in PME Seal Coat - 2nd application of a double chip seal 10, 13 = Sand Seal 11, 12 = Slurry Seal 17, 18 = Old HMA Overlay on Mon-198 19, 20 = New Chip Seal on Mon-198 (Control)
Mon-198, 10/16/2013 Mon-198, 8/26/2015
3
0
1 6 2 5 3 4 7 8 9 10 11 17 19 1 6 2 5 3 4 7 8 9 10 11 17 19
Bicycle Ride Quality Survey Section Number on Mon-198
Figure 9.4: MPD over time on Mon-198.
UCPRC-RR-2016-02 119
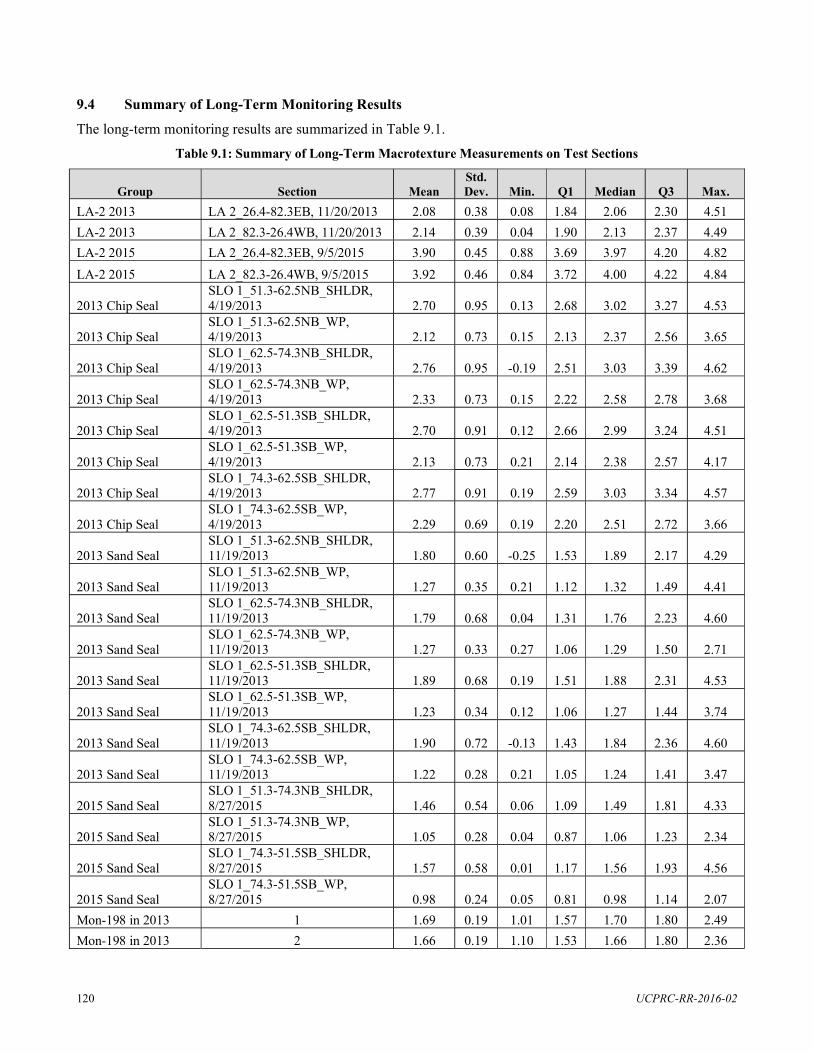
9.4 Summary of Long-Term Monitoring Results
The long-term monitoring results are summarized in Table 9.1.
Table 9.1: Summary of Long-Term Macrotexture Measurements on Test Sections
Group Section Mean Std. Dev. Min. Q1 Median Q3 Max.
LA-2 2013 LA 2_26.4-82.3EB, 11/20/2013 2.08 0.38 0.08 1.84 2.06 2.30 4.51 LA-2 2013 LA 2_82.3-26.4WB, 11/20/2013 2.14 0.39 0.04 1.90 2.13 2.37 4.49 LA-2 2015 LA 2_26.4-82.3EB, 9/5/2015 3.90 0.45 0.88 3.69 3.97 4.20 4.82 LA-2 2015 LA 2_82.3-26.4WB, 9/5/2015 3.92 0.46 0.84 3.72 4.00 4.22 4.84
2013 Chip Seal SLO 1_51.3-62.5NB_SHLDR, 4/19/2013 2.70 0.95 0.13 2.68 3.02 3.27 4.53
2013 Chip Seal SLO 1_51.3-62.5NB_WP, 4/19/2013 2.12 0.73 0.15 2.13 2.37 2.56 3.65
2013 Chip Seal SLO 1_62.5-74.3NB_SHLDR, 4/19/2013 2.76 0.95 -0.19 2.51 3.03 3.39 4.62
2013 Chip Seal SLO 1_62.5-74.3NB_WP, 4/19/2013 2.33 0.73 0.15 2.22 2.58 2.78 3.68
2013 Chip Seal SLO 1_62.5-51.3SB_SHLDR, 4/19/2013 2.70 0.91 0.12 2.66 2.99 3.24 4.51
2013 Chip Seal SLO 1_62.5-51.3SB_WP, 4/19/2013 2.13 0.73 0.21 2.14 2.38 2.57 4.17
2013 Chip Seal SLO 1_74.3-62.5SB_SHLDR, 4/19/2013 2.77 0.91 0.19 2.59 3.03 3.34 4.57
2013 Chip Seal SLO 1_74.3-62.5SB_WP, 4/19/2013 2.29 0.69 0.19 2.20 2.51 2.72 3.66
2013 Sand Seal SLO 1_51.3-62.5NB_SHLDR, 11/19/2013 1.80 0.60 -0.25 1.53 1.89 2.17 4.29
2013 Sand Seal SLO 1_51.3-62.5NB_WP, 11/19/2013 1.27 0.35 0.21 1.12 1.32 1.49 4.41
2013 Sand Seal SLO 1_62.5-74.3NB_SHLDR, 11/19/2013 1.79 0.68 0.04 1.31 1.76 2.23 4.60
2013 Sand Seal SLO 1_62.5-74.3NB_WP, 11/19/2013 1.27 0.33 0.27 1.06 1.29 1.50 2.71
2013 Sand Seal SLO 1_62.5-51.3SB_SHLDR, 11/19/2013 1.89 0.68 0.19 1.51 1.88 2.31 4.53
2013 Sand Seal SLO 1_62.5-51.3SB_WP, 11/19/2013 1.23 0.34 0.12 1.06 1.27 1.44 3.74
2013 Sand Seal SLO 1_74.3-62.5SB_SHLDR, 11/19/2013 1.90 0.72 -0.13 1.43 1.84 2.36 4.60
2013 Sand Seal SLO 1_74.3-62.5SB_WP, 11/19/2013 1.22 0.28 0.21 1.05 1.24 1.41 3.47
2015 Sand Seal SLO 1_51.3-74.3NB_SHLDR, 8/27/2015 1.46 0.54 0.06 1.09 1.49 1.81 4.33
2015 Sand Seal SLO 1_51.3-74.3NB_WP, 8/27/2015 1.05 0.28 0.04 0.87 1.06 1.23 2.34
2015 Sand Seal SLO 1_74.3-51.5SB_SHLDR, 8/27/2015 1.57 0.58 0.01 1.17 1.56 1.93 4.56
2015 Sand Seal SLO 1_74.3-51.5SB_WP, 8/27/2015 0.98 0.24 0.05 0.81 0.98 1.14 2.07
Mon-198 in 2013 1 1.69 0.19 1.01 1.57 1.70 1.80 2.49 Mon-198 in 2013 2 1.66 0.19 1.10 1.53 1.66 1.80 2.36
UCPRC-RR-2016-02 120
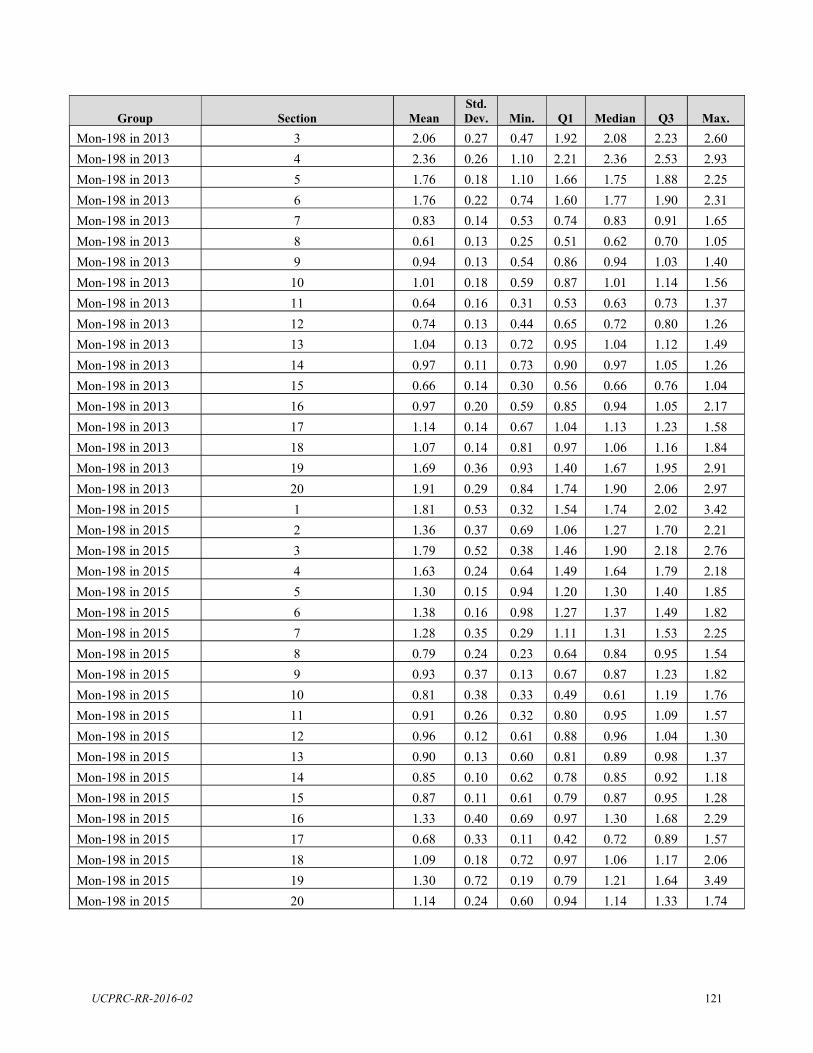
Group Section Mean Std. Dev. Min.
0.47 Q1
1.92 Median Q3 Max.
2.08 2.23 2.60 Mon-198 in 2013 3 2.06 0.27 Mon-198 in 2013 4 2.36 0.26 1.10 2.21 2.36 2.53 2.93 Mon-198 in 2013 5 1.76 0.18 1.10 1.66 1.75 1.88 2.25 Mon-198 in 2013 6 1.76 0.22 0.74 1.60 1.77 1.90 2.31 Mon-198 in 2013 7 0.83 0.14 0.53 0.74 0.83 0.91 1.65 Mon-198 in 2013 8 0.61 0.13 0.25 0.51 0.62 0.70 1.05 Mon-198 in 2013 9 0.94 0.13 0.54 0.86 0.94 1.03 1.40 Mon-198 in 2013 10 1.01 0.18 0.59 0.87 1.01 1.14 1.56 Mon-198 in 2013 11 0.64 0.16 0.31 0.53 0.63 0.73 1.37 Mon-198 in 2013 12 0.74 0.13 0.44 0.65 0.72 0.80 1.26 Mon-198 in 2013 13 1.04 0.13 0.72 0.95 1.04 1.12 1.49 Mon-198 in 2013 14 0.97 0.11 0.73 0.90 0.97 1.05 1.26 Mon-198 in 2013 15 0.66 0.14 0.30 0.56 0.66 0.76 1.04 Mon-198 in 2013 16 0.97 0.20 0.59 0.85 0.94 1.05 2.17 Mon-198 in 2013 17 1.14 0.14 0.67 1.04 1.13 1.23 1.58 Mon-198 in 2013 18 1.07 0.14 0.81 0.97 1.06 1.16 1.84 Mon-198 in 2013 19 1.69 0.36 0.93 1.40 1.67 1.95 2.91 Mon-198 in 2013 20 1.91 0.29 0.84 1.74 1.90 2.06 2.97 Mon-198 in 2015 1 1.81 0.53 0.32 1.54 1.74 2.02 3.42 Mon-198 in 2015 2 1.36 0.37 0.69 1.06 1.27 1.70 2.21 Mon-198 in 2015 3 1.79 0.52 0.38 1.46 1.90 2.18 2.76 Mon-198 in 2015 4 1.63 0.24 0.64 1.49 1.64 1.79 2.18 Mon-198 in 2015 5 1.30 0.15 0.94 1.20 1.30 1.40 1.85 Mon-198 in 2015 6 1.38 0.16 0.98 1.27 1.37 1.49 1.82 Mon-198 in 2015 7 1.28 0.35 0.29 1.11 1.31 1.53 2.25 Mon-198 in 2015 8 0.79 0.24 0.23 0.64 0.84 0.95 1.54 Mon-198 in 2015 9 0.93 0.37 0.13 0.67 0.87 1.23 1.82 Mon-198 in 2015 10 0.81 0.38 0.33 0.49 0.61 1.19 1.76 Mon-198 in 2015 11 0.91 0.26 0.32 0.80 0.95 1.09 1.57 Mon-198 in 2015 12 0.96 0.12 0.61 0.88 0.96 1.04 1.30 Mon-198 in 2015 13 0.90 0.13 0.60 0.81 0.89 0.98 1.37 Mon-198 in 2015 14 0.85 0.10 0.62 0.78 0.85 0.92 1.18 Mon-198 in 2015 15 0.87 0.11 0.61 0.79 0.87 0.95 1.28 Mon-198 in 2015 16 1.33 0.40 0.69 0.97 1.30 1.68 2.29 Mon-198 in 2015 17 0.68 0.33 0.11 0.42 0.72 0.89 1.57 Mon-198 in 2015 18 1.09 0.18 0.72 0.97 1.06 1.17 2.06 Mon-198 in 2015 19 1.30 0.72 0.19 0.79 1.21 1.64 3.49 Mon-198 in 2015 20 1.14 0.24 0.60 0.94 1.14 1.33 1.74
UCPRC-RR-2016-02 121

(This page left blank)
UCPRC-RR-2016-02 122
10 RECOMMENDED GUIDELINES FOR SELECTING PRESERVATION TREATMENT SPECIFICATIONS FOR BICYCLE RIDE QUALITY
The test methods and results presented in the preceding chapters were used to develop recommended guidelines
for specifications for current surface treatments that can be applied on routes that bicyclists use.
10.1 Approach Used to Develop Recommended Guidelines
A number of factors affect whether a bicycle rider cons
among riders and among sections, the model presented in
Chapter 7 focused on determining the likelihood that a given rider under certain conditions would find a
model revealed that both MPD and IRI play a role in
and that each added unit of IRI or MPD lessened the
rating. The model also showed that the increases in
MPD and IRI are cumulative, meaning that there may be a level of MPD so high that no acceptable level of IRI
can be found, and vice versa.
The models also revealed that there are particular personal characteristics that influence whether a rider is less
also be affected by their riding experience and by their gender. To develop guidance for selection of surface
treatments, simulations were performed using the model and using 10,000 riders with characteristics randomly
selected from the ranges in the surveys and 400 randomly selected combinations of MPD and IRI. The
simulations were performed using two groups of riders, one group (Group 1) which was sampled across all
ranges of personal characteristics and one group representing riders with the personal characteristics associated
with the most discriminating opinions about section acceptability (Group 2). Ranges of acceptable MPD are
given in the recommended guidelines, spanning the results of the simulations for Group 1 and Group 2.
Controlling the level of IRI on chip seals, surface seals, and microsurfacing treatments as part of construction
acity, but an agency can chose a particular specification
for MPD, as different surface treatments have been shown to yield different MPD ranges. Therefore, the results
of the simulations were used to recommend a level of MPD that would result in an acceptable value of IRI for a
segment. To make the recommended guidelines workable, the desired IRI values were broken into three
categories: <190 inches/mile, 190 to 380 inches/mile, and >380 inches/mile [<3 m/km, 3 to 6 m/km, and
>6 m/km]).
UCPRC-RR-2016-02 123
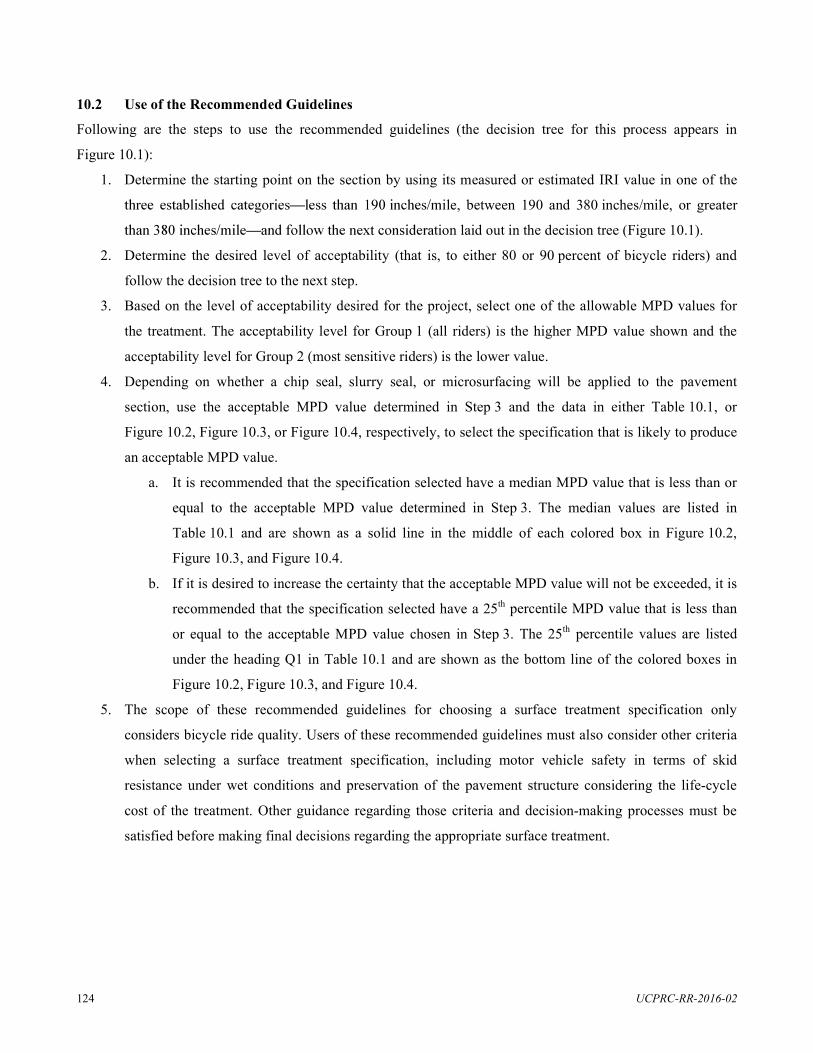
10.2 Use of the Recommended Guidelines
Following are the steps to use the recommended guidelines (the decision tree for this process appears in
Figure 10.1):
1. Determine the starting point on the section by using its measured or estimated IRI value in one of the
ile, between 190 and 380 inches/mile, or greater
tion laid out in the decision tree (Figure 10.1).
2. Determine the desired level of acceptability (that is, to either 80 or 90 percent of bicycle riders) and
follow the decision tree to the next step.
3. Based on the level of acceptability desired for the project, select one of the allowable MPD values for
the treatment. The acceptability level for Group 1 (all riders) is the higher MPD value shown and the
acceptability level for Group 2 (most sensitive riders) is the lower value.
4. Depending on whether a chip seal, slurry seal, or microsurfacing will be applied to the pavement
section, use the acceptable MPD value determined in Step 3 and the data in either Table 10.1, or
Figure 10.2, Figure 10.3, or Figure 10.4, respectively, to select the specification that is likely to produce
an acceptable MPD value.
a. It is recommended that the specification selected have a median MPD value that is less than or
equal to the acceptable MPD value determined in Step 3. The median values are listed in
Table 10.1 and are shown as a solid line in the middle of each colored box in Figure 10.2,
Figure 10.3, and Figure 10.4.
b. If it is desired to increase the certainty that the acceptable MPD value will not be exceeded, it is
recommended that the specification selected have a 25th percentile MPD value that is less than
or equal to the acceptable MPD value chosen in Step 3. The 25th percentile values are listed
under the heading Q1 in Table 10.1 and are shown as the bottom line of the colored boxes in
Figure 10.2, Figure 10.3, and Figure 10.4.
5. The scope of these recommended guidelines for choosing a surface treatment specification only
considers bicycle ride quality. Users of these recommended guidelines must also consider other criteria
when selecting a surface treatment specification, including motor vehicle safety in terms of skid
resistance under wet conditions and preservation of the pavement structure considering the life-cycle
cost of the treatment. Other guidance regarding those criteria and decision-making processes must be
satisfied before making final decisions regarding the appropriate surface treatment.
UCPRC-RR-2016-02 124
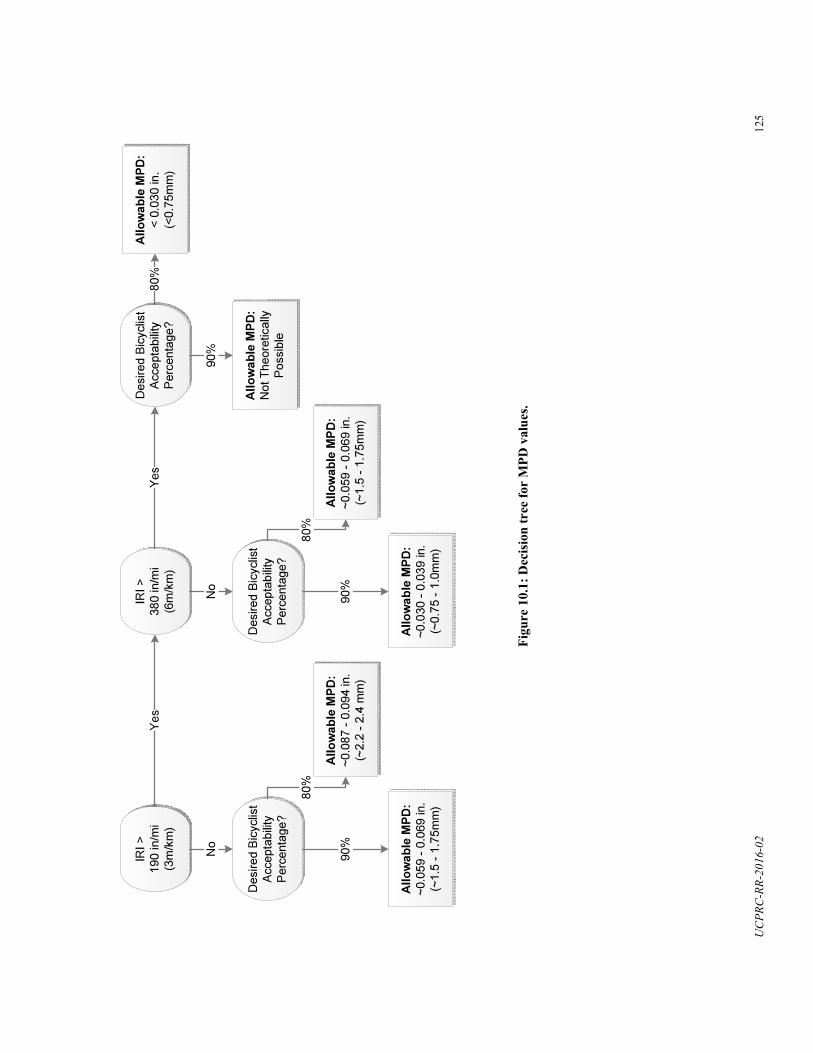
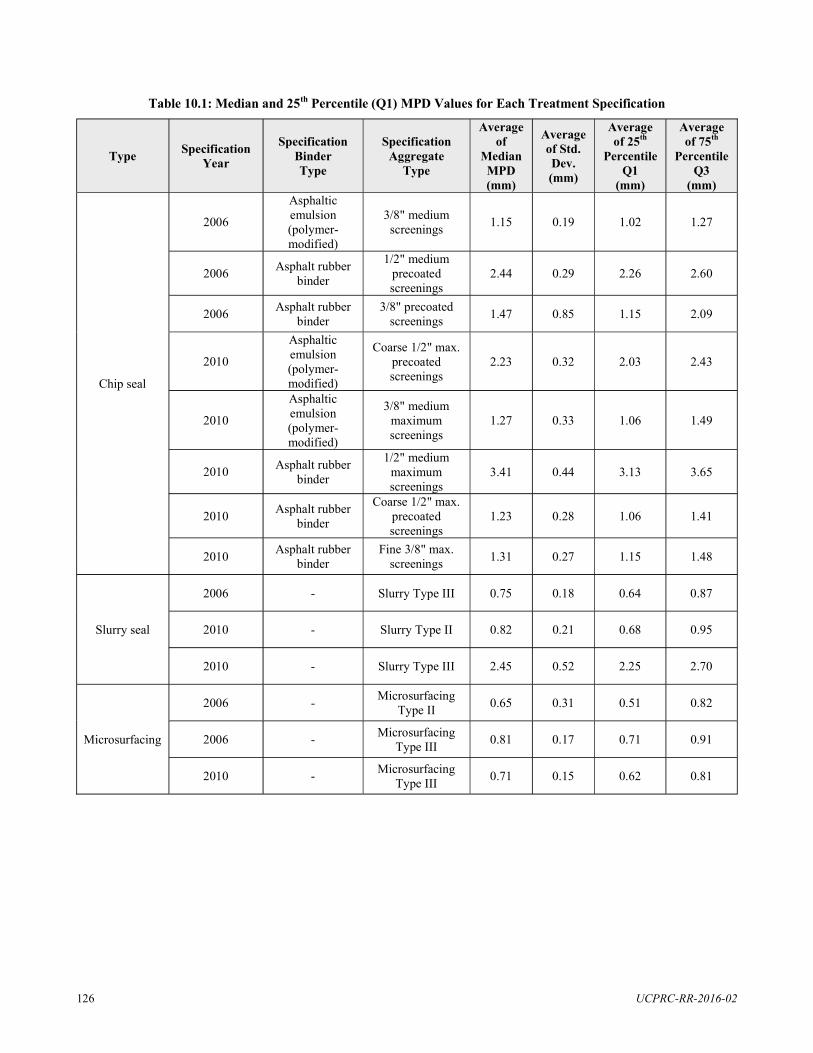
Table 10.1: Median and 25th Percentile (Q1) MPD Values for Each Treatment Specification
Type Specification Year
Specification Binder Type
Specification Aggregate
Type
Average of
Median MPD (mm)
Average of Std. Dev. (mm)
Average of 25th
Percentile Q1
(mm)
Average of 75th
Percentile Q3
(mm)
Chip seal
2006
Asphaltic emulsion (polymer-modified)
3/8" medium screenings 1.15 0.19 1.02 1.27
2006 Asphalt rubber binder
1/2" medium precoated screenings
2.44 0.29 2.26 2.60
2006 Asphalt rubber binder
3/8" precoated screenings 1.47 0.85 1.15 2.09
2010
Asphaltic emulsion (polymer-modified)
Coarse 1/2" max. precoated screenings
2.23 0.32 2.03 2.43
2010
Asphaltic emulsion (polymer-modified)
3/8" medium maximum screenings
1.27 0.33 1.06 1.49
2010 Asphalt rubber binder
1/2" medium maximum screenings
3.41 0.44 3.13 3.65
2010 Asphalt rubber binder
Coarse 1/2" max. precoated screenings
1.23 0.28 1.06 1.41
2010 Asphalt rubber binder
Fine 3/8" max. screenings 1.31 0.27 1.15 1.48
Slurry seal
2006 - Slurry Type III 0.75 0.18 0.64 0.87
2010 - Slurry Type II 0.82 0.21 0.68 0.95
2010 - Slurry Type III 2.45 0.52 2.25 2.70
Microsurfacing
2006 - Microsurfacing Type II 0.65 0.31 0.51 0.82
2006 - Microsurfacing Type III 0.81 0.17 0.71 0.91
2010 - Microsurfacing Type III 0.71 0.15 0.62 0.81
UCPRC-RR-2016-02 126
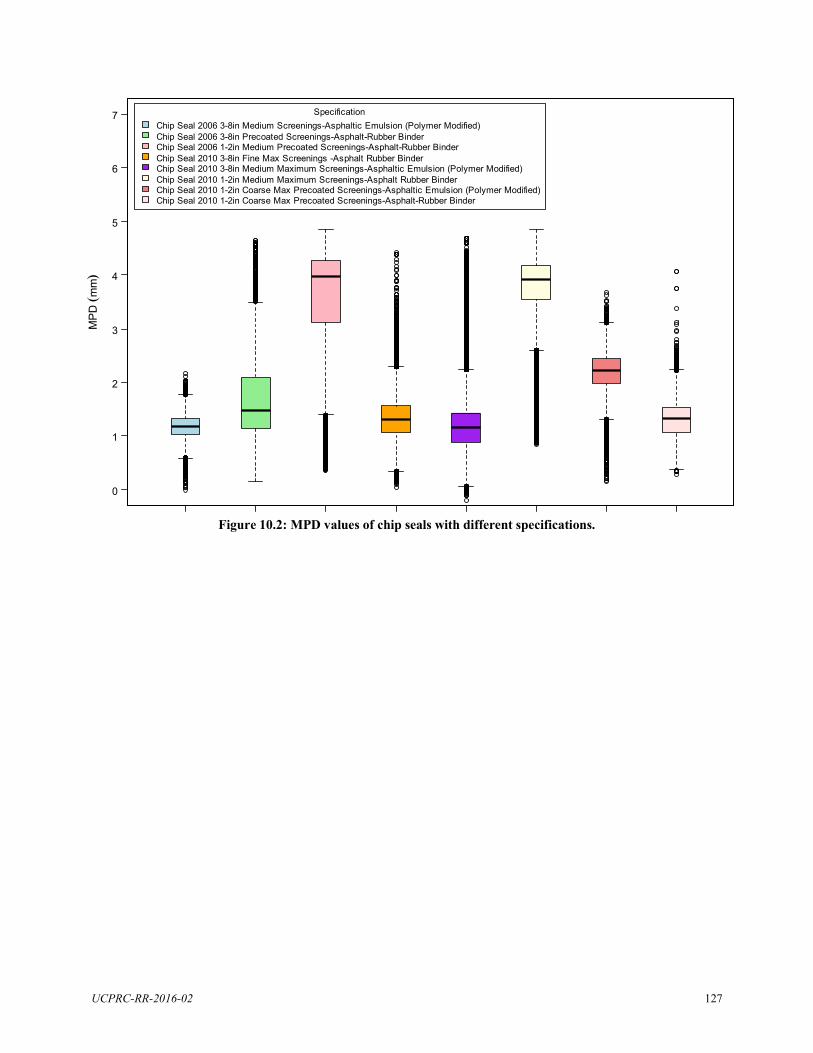
Specification 7 Chip Seal 2006 3-8in Medium Screenings-Asphaltic Emulsion (Polymer Modified) Chip Seal 2006 3-8in Precoated Screenings-Asphalt-Rubber Binder Chip Seal 2006 1-2in Medium Precoated Screenings-Asphalt-Rubber Binder Chip Seal 2010 3-8in Fine Max Screenings -Asphalt Rubber Binder
6 Chip Seal 2010 3-8in Medium Maximum Screenings-Asphaltic Emulsion (Polymer Modified) Chip Seal 2010 1-2in Medium Maximum Screenings-Asphalt Rubber Binder Chip Seal 2010 1-2in Coarse Max Precoated Screenings-Asphaltic Emulsion (Polymer Modified) Chip Seal 2010 1-2in Coarse Max Precoated Screenings-Asphalt-Rubber Binder
5
4
3
2
1
0
Figure 10.2: MPD values of chip seals with different specifications.
UCPRC-RR-2016-02 127
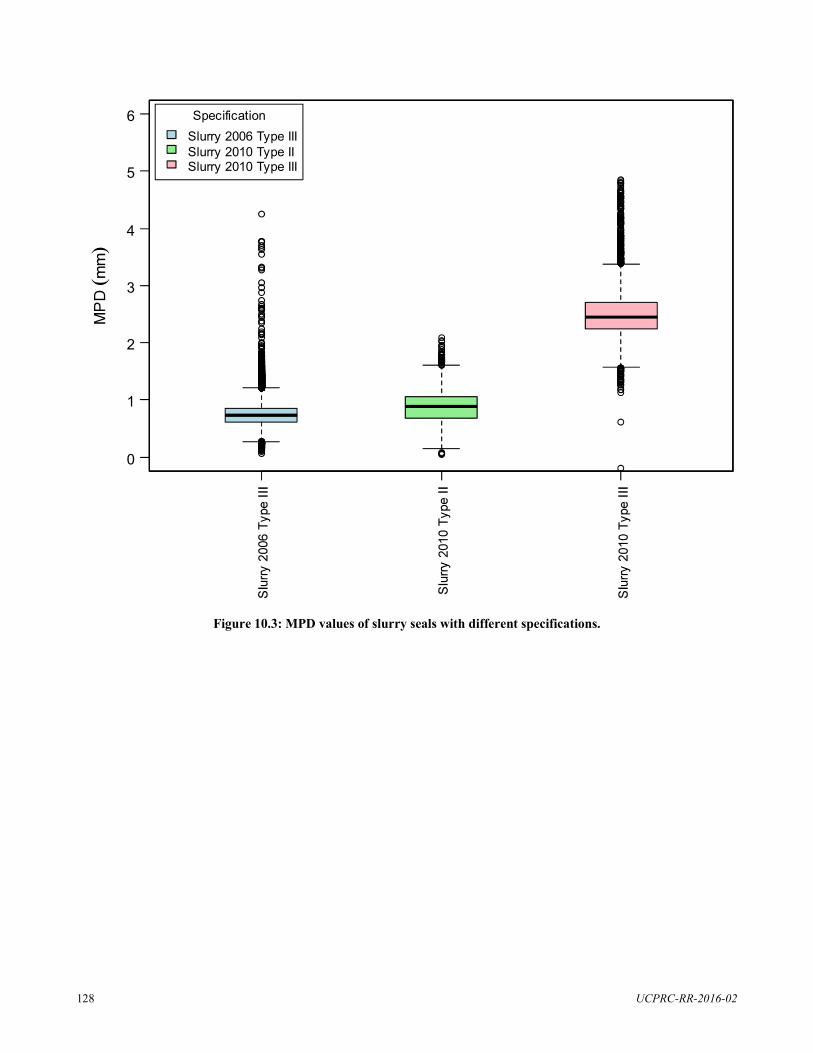
Specification Slurry 2006 Type III Slurry 2010 Type II Slurry 2010 Type III
6
5
4
3
2
1
0
Figure 10.3: MPD values of slurry seals with different specifications.
UCPRC-RR-2016-02 128
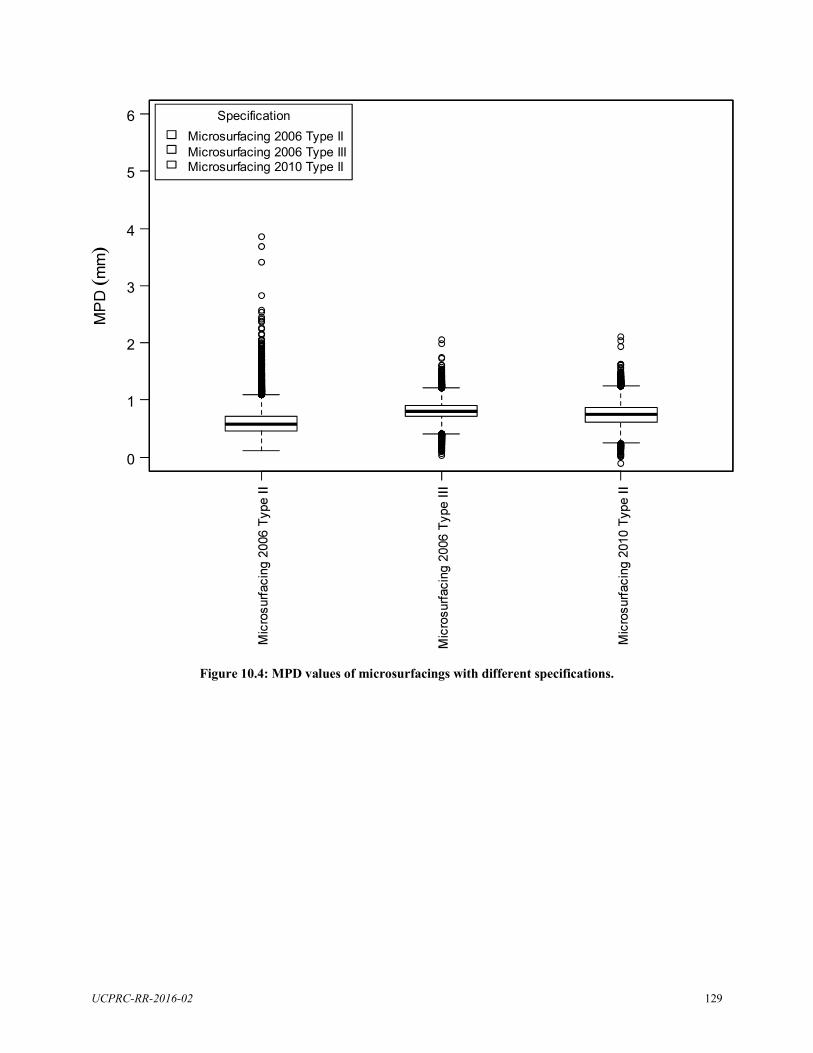
0
1
2
3
4
5
6 Specification Microsurfacing 2006 Type II Microsurfacing 2006 Type III Microsurfacing 2010 Type II
Figure 10.4: MPD values of microsurfacings with different specifications.
UCPRC-RR-2016-02 129

(This page left blank)
UCPRC-RR-2016-02 130
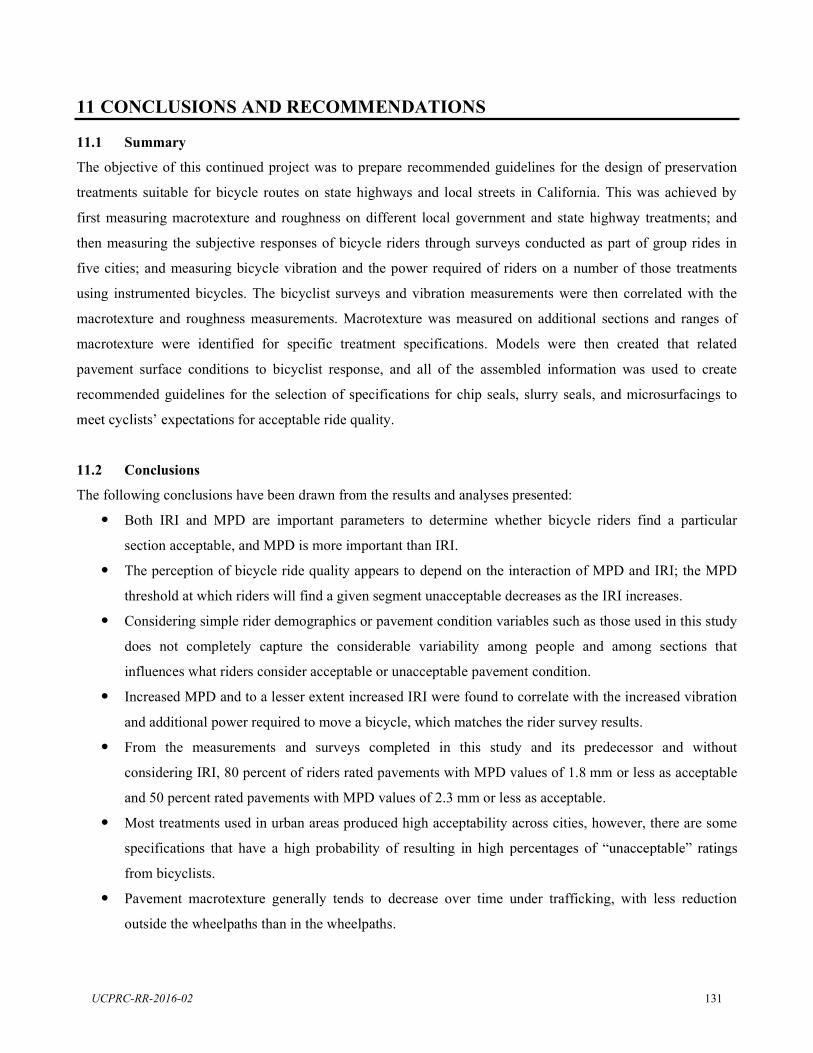
11 CONCLUSIONS AND RECOMMENDATIONS
11.1 Summary
The objective of this continued project was to prepare recommended guidelines for the design of preservation
treatments suitable for bicycle routes on state highways and local streets in California. This was achieved by
first measuring macrotexture and roughness on different local government and state highway treatments; and
then measuring the subjective responses of bicycle riders through surveys conducted as part of group rides in
five cities; and measuring bicycle vibration and the power required of riders on a number of those treatments
using instrumented bicycles. The bicyclist surveys and vibration measurements were then correlated with the
macrotexture and roughness measurements. Macrotexture was measured on additional sections and ranges of
macrotexture were identified for specific treatment specifications. Models were then created that related
pavement surface conditions to bicyclist response, and all of the assembled information was used to create
recommended guidelines for the selection of specifications for chip seals, slurry seals, and microsurfacings to
for acceptable ride quality.
11.2 Conclusions
The following conclusions have been drawn from the results and analyses presented:
Both IRI and MPD are important parameters to determine whether bicycle riders find a particular
section acceptable, and MPD is more important than IRI.
The perception of bicycle ride quality appears to depend on the interaction of MPD and IRI; the MPD
threshold at which riders will find a given segment unacceptable decreases as the IRI increases.
Considering simple rider demographics or pavement condition variables such as those used in this study
does not completely capture the considerable variability among people and among sections that
influences what riders consider acceptable or unacceptable pavement condition.
Increased MPD and to a lesser extent increased IRI were found to correlate with the increased vibration
and additional power required to move a bicycle, which matches the rider survey results.
From the measurements and surveys completed in this study and its predecessor and without
considering IRI, 80 percent of riders rated pavements with MPD values of 1.8 mm or less as acceptable
and 50 percent rated pavements with MPD values of 2.3 mm or less as acceptable.
Most treatments used in urban areas produced high acceptability across cities, however, there are some
specifications that have a high probability of resu
from bicyclists.
Pavement macrotexture generally tends to decrease over time under trafficking, with less reduction
outside the wheelpaths than in the wheelpaths.
UCPRC-RR-2016-02 131
The research was successful in identifying ranges of MPD for current Caltrans specifications for chip
seals, slurry seals and microsurfacings, however, it was not possible to find useful correlations between
MPD and individual sieve sizes within the gradations.
From laboratory gradation data on aggregate screenings used on slurry seal sections in Reno, Nevada,
correlations were found between the median MPD of a pavement surface and the percent passing the
#4 (4.75 mm) and #8 (2.36 mm) screen sizes in the constructed gradation.
The research was successful in developing recommended guidelines that allow pavement treatment
designers and pavement managers to select treatment specifications for bicycle routes that will result in
clists. The scope of the recommended guidelines
presented in this report for choosing a surface treatment specification only considers bicycle ride
quality. The recommended guidelines also state that other criteria must be considered when selecting a
surface treatment specification, including motor vehicle safety in terms of skid resistance under wet
conditions, for which minimum MPD requirements should be considered, and the life-cycle cost of the
treatment.
11.3 Recommendations
Based on the results of this study, the following recommendations are made regarding pavement surfaces that
will be used by bicyclists:
Begin use of the recommended guidelines included in this report as part of the surface treatment
selection process along with existing guidance that considers criteria other than bicycle ride quality,
such as motorist safety and treatment life-cycle cost, and improve them as experience is gained. The
recommendations are for the selection of existing surface treatment specifications based on different
levels of bicycle ride quality satisfaction.
In the recommended guidelines, consider using the 90 percent acceptable MPD level on routes with
higher bicycle use as opposed to the 80 percent acceptable MPD level that is also included. Further
confidence that the treatment will have an acceptable MPD level can be obtained by selecting treatments
based on the 25th percentile MPD of the gradation in the specification instead of the median MPD.
As new treatment specifications are developed, collect MPD data on them so that they can be included
in updated versions of the recommended guidelines.
If greater precision in developing specifications is desired than is currently possible, consider additional
research to develop methods of estimating MPD from gradations and aggregate shape (such as flakiness
index).
UCPRC-RR-2016-02 132
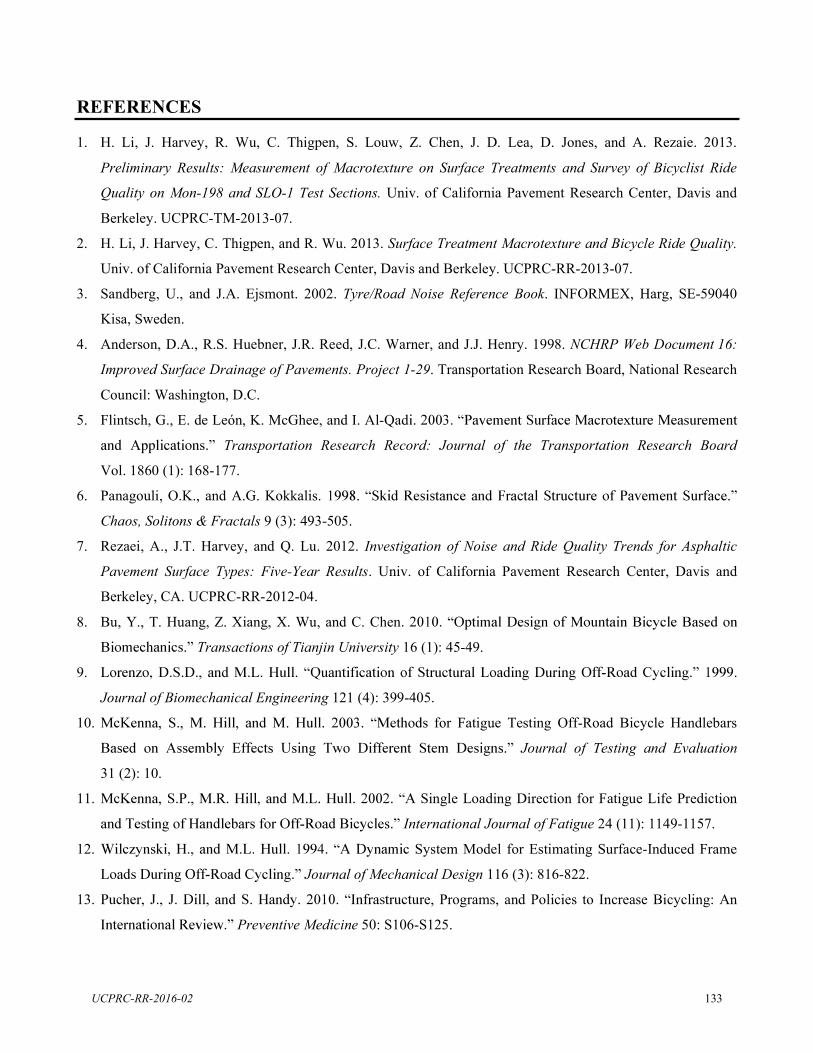
REFERENCES
1. H. Li, J. Harvey, R. Wu, C. Thigpen, S. Louw, Z. Chen, J. D. Lea, D. Jones, and A. Rezaie. 2013.
Preliminary Results: Measurement of Macrotexture on Surface Treatments and Survey of Bicyclist Ride
Quality on Mon-198 and SLO-1 Test Sections. Univ. of California Pavement Research Center, Davis and
Berkeley. UCPRC-TM-2013-07.
2. H. Li, J. Harvey, C. Thigpen, and R. Wu. 2013. Surface Treatment Macrotexture and Bicycle Ride Quality.
Univ. of California Pavement Research Center, Davis and Berkeley. UCPRC-RR-2013-07.
3. Sandberg, U., and J.A. Ejsmont. 2002. Tyre/Road Noise Reference Book. INFORMEX, Harg, SE-59040
Kisa, Sweden.
4. Anderson, D.A., R.S. Huebner, J.R. Reed, J.C. Warner, and J.J. Henry. 1998. NCHRP Web Document 16:
Improved Surface Drainage of Pavements. Project 1-29. Transportation Research Board, National Research
Council: Washington, D.C.
5. Flintsch, G., E. de León, K. McGhee, and I. Al-Qad
Transportation Research Record: Journal of the Transportation Research Board
Vol. 1860 (1): 168-177.
6. Panagouli, O.K., and A.G. Kokkalis.
Chaos, Solitons & Fractals 9 (3): 493-505.
7. Rezaei, A., J.T. Harvey, and Q. Lu. 2012. Investigation of Noise and Ride Quality Trends for Asphaltic
Pavement Surface Types: Five-Year Results. Univ. of California Pavement Research Center, Davis and
Berkeley, CA. UCPRC-RR-2012-04.
8. Bu, Y., T. Huang, Z. Xiang, X. Wu, and C. Chen
Transactions of Tianjin University 16 (1): 45-49.
9.
Journal of Biomechanical Engineering 121 (4): 399-405.
10. for Fatigue Testing Off-Road Bicycle Handlebars
Journal of Testing and Evaluation
31 (2): 10.
11. Single Loading Direction for Fatigue Life Prediction
International Journal of Fatigue 24 (11): 1149-1157.
12. System Model for Estimating Surface-Induced Frame
Journal of Mechanical Design 116 (3): 816-822.
13.
Preventive Medicine 50: S106-S125.
e, Programs, and Policies to Increase Bicycling: An
UCPRC-RR-2016-02 133
14. Nonschool Purposes: Getting to Soccer Games in Davis,
Transportation Research Record 2074: 40-45.
15.
Transportation Research Part D-
Transport and Environment 15 (2): 73-81.
16. Henault, J., and J. Bliven. Characterizing the Macrotexture of Asphalt Pavement Designs in Connecticut.
2011. Report No. CT-2243-2-10-3, Connecticut Department of Transportation.
17. Winters, M., G. Davidson, D. Kao, and K. Teshke
Transportation 38 (1): 153-168.
18. Landis, B.W., V.R. Vattikuti, and M.T. Brannick. 19
Transportation Research Record: Journal of the Transportation Research Board
1578: 119-126. . trrjournalonline.trb.org/doi/pdf/10.3141/1578-15 (Accessed July 25, 2014).
19.
Transport Reviews 30 (1):59-96.
20. e, Programs, and Policies to Increase Bicycling: An
Preventive Medicine 50: S106-S125.
21.
Accident Analysis & Prevention
22. Martin, J.C., D.L. Milliken, J.E. Cobb, K.L. McFa
Journal of Applied Biomechanics 14: 276-291.
23. Medical and Scientific Aspects of
Cycling, edited by E.D. Burke and M.M. Newsom, 235-251. Champaign, IL.: Human Kinetics.
24. Dahn, K., L. Mai, J. Poland, and C. Jenkins. 1991.
Cycling Science 1: 28-32.
25. Martin, J.C., A.S. Gardner, M. Barras, and D.T.
derived Parameters and Medicine & Science in Sports & Exercise 38: 592-597.
26. Grappe, F., R. Candau, A. Belli, and J. D. Rouillon.
Special Reference to Ergonomics 40 (12): 1299-1311.
27. Martin, J.C., A.S. Gardner, M. Barras, and D.T.
Sportscience 10: 68-69.
28. Fox, R. W., and A.T. McDonald. 1973. Introduction to Fluid Mechanics (2nd ed.). New York: Wiley.
29. Clinics in Sports Medicine 13 (1): 15-38.
30. cling Performance: How Should We Spend Our Time
Sports Medicine 31: 559-569.
UCPRC-RR-2016-02 134
31. Journal of Clinical
Anesthesia 4: 4-10.
32. Gardner, A.S., S. Stephens, D.T. Martin, E. Lawton,
Medicine & Science in Sports & Exercise. 36: 1252-
1258.
33. Vijayakumar D.A., O. Prakash, R.K. Sharma. 2012.
ted at AdMet 2012, the 2nd National Conference on
Advances in Metrology. Metrology Society of India. Pune, India.
34. Picard A., R.S. Davis, M. Glaser, K. Fujii. 2008.
Metrologia 45: 149-155.
35. Brower M. 2003. Wind Resource Maps of Northern New England. TrueWind Solutions, LLC.
36. Goldstein, H. 1999. Multilevel Statistical Models. Institute of Education, London.
37. McElreath, R. 2015. Statistical Rethinking. Chapman & Hall/CRC.
38. Stan Development Team. Stan: A C++ Library for Probability and Sampling, Version 2.5.
http://mc-stan.org/. (Accessed Jan. 5, 2016)
UCPRC-RR-2016-02 135

APPENDIX A: EXAMPLE SURVEY FORM (RENO)
Caltrans/UCPRC Bicyclist Comfort Survey Pre-ride Survey: General Information (Please fill out and return it BEFORE riding)
Date: 09/26/2015 (mm/dd/yyyy) Participant # City: Reno, NV
1. What is your gender? ______________
2. What year were you born? ____________ (yyyy)
3. How often do you ride your bicycle? Every day About once a week Once a month or less
About every other day About twice a month
4. How often do you engage in any physical activity of at least 20 minutes? Every day About once a week Once a month or less
About every other day About twice a month
5. For what purposes do you ride your bicycle (check ALL that apply)? Recreation or fitness Getting to and from work or school
Visiting friends Shopping or running errands
Competitive sporting events Other: ____________________________
6. How many times did you ride your bicycle last week? ______________ times
7. How many times did you ride your bicycle last month? ______________ times
8. How many times do you ride your bicycle on average every month? ______________ times
Please allow UCPRC staff to complete this section
9. Bicycle Type: Road Touring Mountain Recumbent
Hybrid Cruiser Folding Other: _________________
UCPRC-RR-2016-02 136

A. Frame: Aluminum Carbon Don't know
Titanium Steel Other: _______________
B. Fork:
C. Wheels:
Aluminum
Titanium
Aluminum
Steel
Carbon Don't know
Steel Other: _______________
Carbon
Other: _______________
10. What materials are the bicycle frame, fork, and wheels made of and what is the tire pressure?
D. Tire pressure: Front __________ (psi) Rear __________ (psi) (measure via
pump/gauge)
E. Tire width: ___________ (mm of inch) (measure via calipers or visual inspection)
UCPRC-RR-2016-02 137

1 2 3 4 5
1 2 3 4 5
1 2 3 4 5
1 2 3 4 5
1 2 3 4 5
Caltrans/UCPRC Bicyclist Comfort Survey In-ride Survey: (Please fill out at the end of EACH section)
Section#: 1 Street: Sinclair St. to Holocomb Ave. on Mill St.
1. How do you rate the surface of the road? Acceptable Unacceptable
2. Compared to all of the roads on which you bicycle, please indicate your level of comfort (1-5): Uncomfortable Comfortable
Section#: 2 Street: E Liberty St St. to Burns St. on Holocomb Ave
1. How do you rate the surface of the road? Acceptable Unacceptable
2. Compared to all of the roads on which you bicycle, please indicate your level of comfort (1-5): Uncomfortable Comfortable
Section#: 3 Street: Burns St. to Vassar St. on Holocomb Ave.
1. How do you rate the surface of the road? Acceptable Unacceptable
2. Compared to all of the roads on which you bicycle, please indicate your level of comfort (1-5): Uncomfortable Comfortable
Section#: 4 Street: Mt Rose St. to W Plumb Ln. on Lakeside Dr.
1. How do you rate the surface of the road? Acceptable Unacceptable
2. Compared to all of the roads on which you bicycle, please indicate your level of comfort (1-5): Uncomfortable Comfortable
Section#: 5 Street: W Plumb Ln. to Brinky Ave. on Lakeside Dr.
1. How do you rate the surface of the road? Acceptable Unacceptable
2. Compared to all of the roads on which you bicycle, please indicate your level of comfort (1-5): Uncomfortable Comfortable
UCPRC-RR-2016-02 138

1 2 3 4 5
1 2 3 4 5
1 2 3 4 5
1 2 3 4 5
1 2 3 4 5
Caltrans/UCPRC Bicyclist Comfort Survey In-ride Survey: (Please fill out at the end of EACH section)
Section#: 6 Street: Berrum Ln. to Urban Rd. on Plumas St.
1. How do you rate the surface of the road? Acceptable Unacceptable
2. Compared to all of the roads on which you bicycle, please indicate your level of comfort (1-5): Uncomfortable Comfortable
Section#: 7 Street: Urban Rd. to Mt Rose St. on S Arlington Ave.
1. How do you rate the surface of the road? Acceptable Unacceptable
2. Compared to all of the roads on which you bicycle, please indicate your level of comfort (1-5): Uncomfortable Comfortable
Section#: 8 Street: Mt Rose St. to California Ave. on S Arlington Ave.
1. How do you rate the surface of the road? Acceptable Unacceptable
2. Compared to all of the roads on which you bicycle, please indicate your level of comfort (1-5): Uncomfortable Comfortable
Section#: 9 Street: S Arlington Ave. to Memory Ln on California Ave.
1. How do you rate the surface of the road? Acceptable Unacceptable
2. Compared to all of the roads on which you bicycle, please indicate your level of comfort (1-5): Uncomfortable Comfortable
Section#: 10 Street: Hunter Lake Dr. to S McCarran Blvd on Mayberry Dr.
1. How do you rate the surface of the road? Acceptable Unacceptable
2. Compared to all of the roads on which you bicycle, please indicate your level of comfort (1-5): Uncomfortable Comfortable
UCPRC-RR-2016-02 139

1 2 3 4 5
1 2 3 4 5
1 2 3 4 5
1 2 3 4 5
1 2 3 4 5
Caltrans/UCPRC Bicyclist Comfort Survey In-ride Survey: (Please fill out at the end of EACH section)
Section#: 11 Street: S McCarran Blvd. to Idlewild Dr. on Mayberry Dr.
3. How do you rate the surface of the road? Acceptable Unacceptable
4. Compared to all of the roads on which you bicycle, please indicate your level of comfort (1-5): Uncomfortable Comfortable
Section#: 12 Street: Idlewild Dr. to Livermore Dr. on Mayberry Dr.
3. How do you rate the surface of the road? Acceptable Unacceptable
4. Compared to all of the roads on which you bicycle, please indicate your level of comfort (1-5): Uncomfortable Comfortable
Section#: 13 Street: Livermore Dr. to Aspen Glen Dr.. on Mayberry Dr.
3. How do you rate the surface of the road? Acceptable Unacceptable
4. Compared to all of the roads on which you bicycle, please indicate your level of comfort (1-5): Uncomfortable Comfortable
Section#: 14 before S McCarran Blvd. on W 4th St.
3. How do you rate t he surface of the road? Acceptable Unacceptable
4. Compared to all of the roads on which you bicycle, please indicate your level of comfort (1-5): Uncomfortable Comfortable
Section#: 15 Street: S McCarran Blvd. to Stoker Ave on W 4th St.
3. How do you rate the surface of the road? Acceptable Unacceptable
4. Compared to all of the roads on which you bicycle, please indicate your level of comfort (1-5): Uncomfortable Comfortable
UCPRC-RR-2016-02 140

Caltrans/UCPRC Bicyclist Comfort Survey In-ride Survey: (Please fill out at the end of EACH section)
Section#: 16 Street: Vine St. to Ralson St. on W 1st St.
1. How do you rate the surface of the road? Acceptable Unacceptable
2. Compared to all of the roads on which you bicycle, please indicate your level of comfort (1-5): Uncomfortable Comfortable
1 2 3 4 5
UCPRC-RR-2016-02 141

Caltrans/UCPRC Bicyclist Comfort Survey Post-ride Survey (please fill out and return it at the end of all sections)
Date: 09/26/2015 (mm/dd/yyyy) Participant # City: Reno, NV
1. Identify your favorite section of road from all the sections you just bicycled on. ________________ (section #)
2. What is the biggest reason that section was your favorite (select one)? Scenery/greenery Topography (e.g. hilly, flat) Bicycle facilities (e.g. a bicycle lane or path) Pavement ride quality (e.g. bumpy, smooth) Traffic conditions/safety Wind Safety from crime Who you ride with Other: ______________________
3. Identify your least favorite section of road from all the sections you just bicycled on. ___________ (section #)
4. What is the biggest reason that section was your least favorite (select one)? Scenery/greenery Topography (e.g. hilly, flat) Bicycle facilities (e.g. a bicycle lane or path) Pavement ride quality (e.g. bumpy, smooth) Traffic conditions/safety Wind Safety from crime Who you ride with Other: ______________________
5. Are you of Hispanic/Latino origin? No, not of Hispanic, Latino Yes, Mexican, Mexican American, or Chicano Yes, Puerto Rican Yes, Cuban Yes, another Hispanic, Latino, or Spanish origin (please write in): ___________
UCPRC-RR-2016-02 142

6. What is your race? White Black or African American Asian (If yes, write in name of country/ethnicity): ___________ Pacific Islander (If yes, write in name of country/ethnicity): ___________ American Indian or Alaska Native (If yes, write in name of principal tribal identity): ____________ Other race: ______________
7. What is your educational background? (Check the highest level attained) Some grade school or high school 4-year college/technical school degree
High school diploma Some graduate school
Some college or technical school Completed graduate degree(s)
8. What is your current employment status? Full-time Non-employed student Unemployed Retired
Part-time Self-employed Homemaker
9. Your approximate annual household income before taxes: Less than $15,000 $35,000 to $54,999 $75,000 to $94,999
$15,000 to $34,999 $55,000 to $74,999 $95,000 or more
10. Overall: Based on your experience, what factors influence your enjoyment of a ride the most? Circle one on scale of 1 to 5, from 1 being the ‘least influential’ to 5 being the 'most influential',
Least Neutral Most
1 2 3 4 5
1 2 3 4 5
1 2 3 4 5
1 2 3 4 5
1 2 3 4 5
1 2 3 4 5
1 2 3 4 5
1 2 3 4 5
1 2 3 4 5
Scenery/Greenery
Topography (e.g. hilly, flat)
Bicycle facilities (e.g. a bicycle lane or path)
Pavement ride quality (e.g. bumpy, smooth)
Traffic conditions/safety
Wind
Safety from crime
Who you ride with
Other: _______________________________
UCPRC-RR-2016-02 143

APPENDIX B: MACROTEXTURE MEASURED USING IP ON SURVEY SECTIONS
UCPRC-RR-2016-02 144
Distance (ft) 0 200 400 600 800 1000 1200
6
5 Davis Bike Section-1_1
0.2
4 0.15 3
0.1 2
0.05 1
0 0
0 100 200 300 Distance (m) Distance (ft)
0 200 400 600
6
5 Davis Bike Section-2_1
0.2
4 0.15 3
0.1 2
0.05 1
0 0
0 50 100 150 200 Distance (m) Distance (ft)
0 200 400 600
6
5 Davis Bike Section-3_1
0.2
4 0.15 3
0.1 2
0.05 1
0 0
0 50 100 150 200 Distance (m) Distance (ft)
0 200 400 600 800 1000 1200 1400 1600 1800
6
5 Davis Bike Section-4_1
0.2
4 0.15 3
0.1 2
0.05 1
0 0
0 100 200 300 400 500 600 Distance (m)
Figure B.1: Macrotexture measured using IP on Davis survey Sections 1 to 4.
UCPRC-RR-2016-02 145
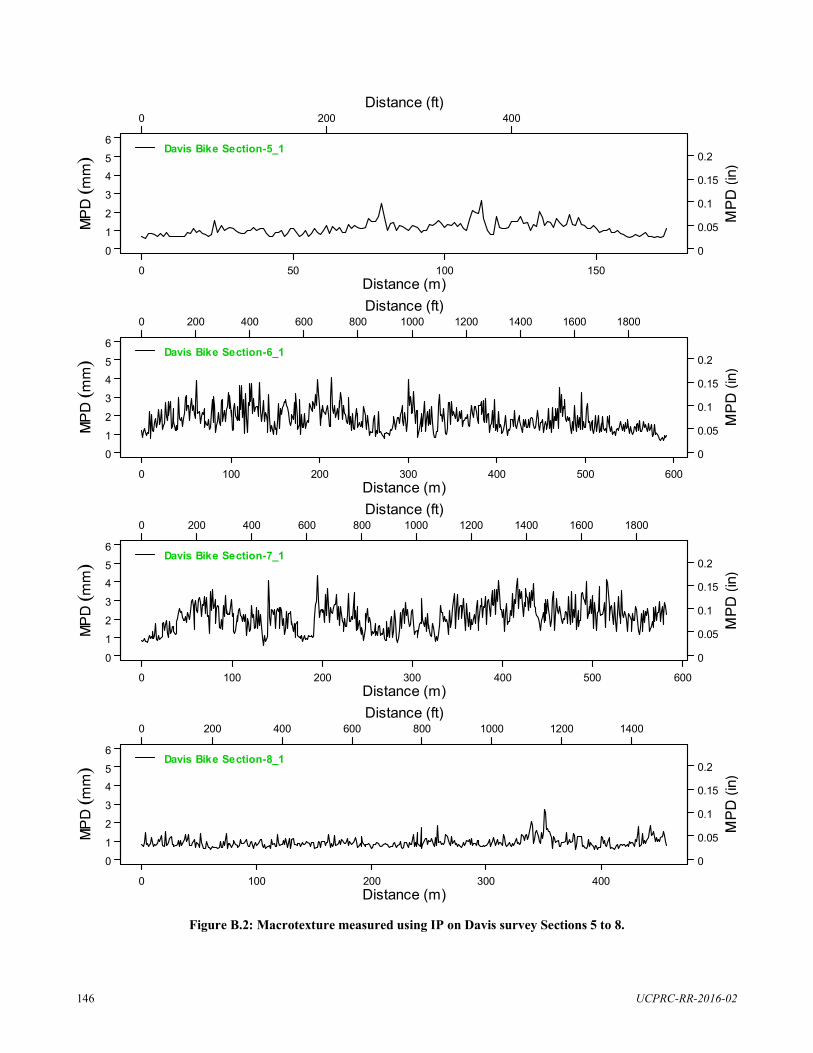
Distance (ft) 0 200 400
6
5 Davis Bike Section-5_1
0.2
4 0.15 3
0.1 2
0.05 1
0 0
0 50 100 150 Distance (m) Distance (ft)
0 200 400 600 800 1000 1200 1400 1600 1800
6
5 Davis Bike Section-6_1
0.2
4 0.15 3
0.1 2
0.05 1 0 0
0 100 200 300 400 500 600 Distance (m) Distance (ft)
0 200 400 600 800 1000 1200 1400 1600 1800
6
5 Davis Bike Section-7_1
0.2
4 0.15 3
0.1 2
0.05 1
0 0
0 100 200 300 400 500 600 Distance (m) Distance (ft)
0 200 400 600 800 1000 1200 1400
6
5 Davis Bike Section-8_1
0.2
4 0.15 3
0.1 2
0.05 1 0 0
0 100 200 300 400 Distance (m)
Figure B.2: Macrotexture measured using IP on Davis survey Sections 5 to 8.
UCPRC-RR-2016-02 146
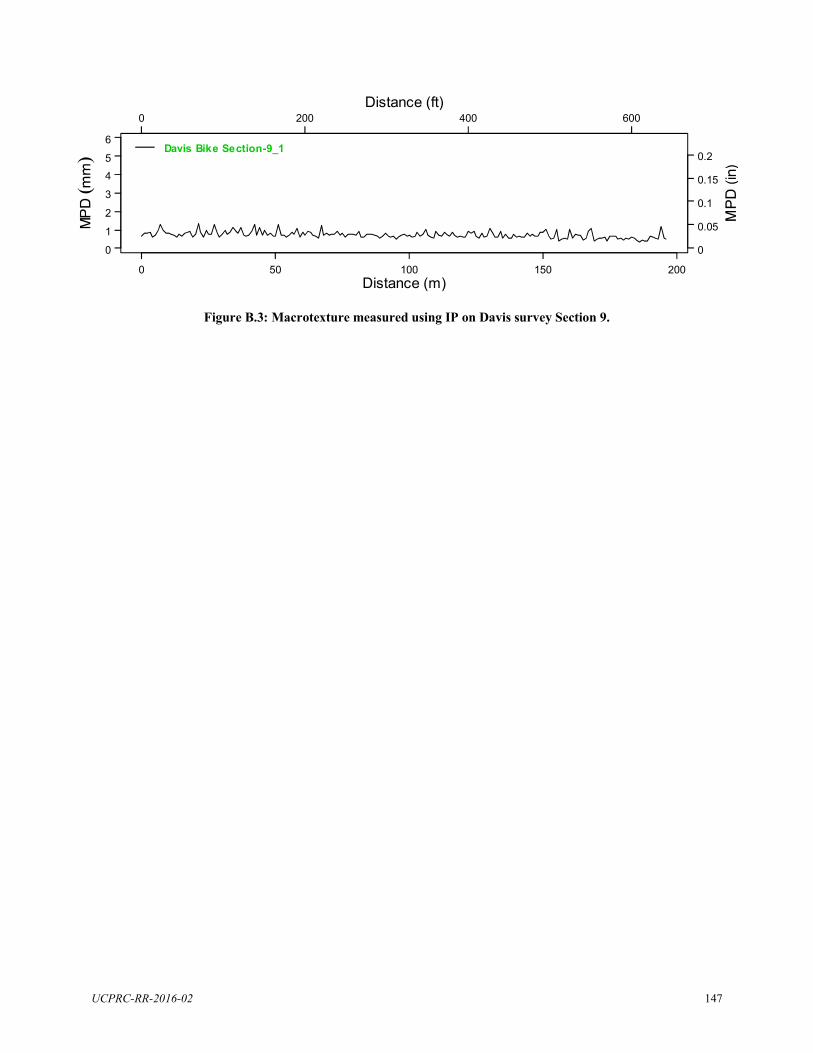
Distance (ft) 0 200 400 600
6
5 4
3
2
1
0
Davis Bike Section-9_1 0.2
0.15
0.1
0.05
0
0 50 100 150 200 Distance (m)
Figure B.3: Macrotexture measured using IP on Davis survey Section 9.
UCPRC-RR-2016-02 147
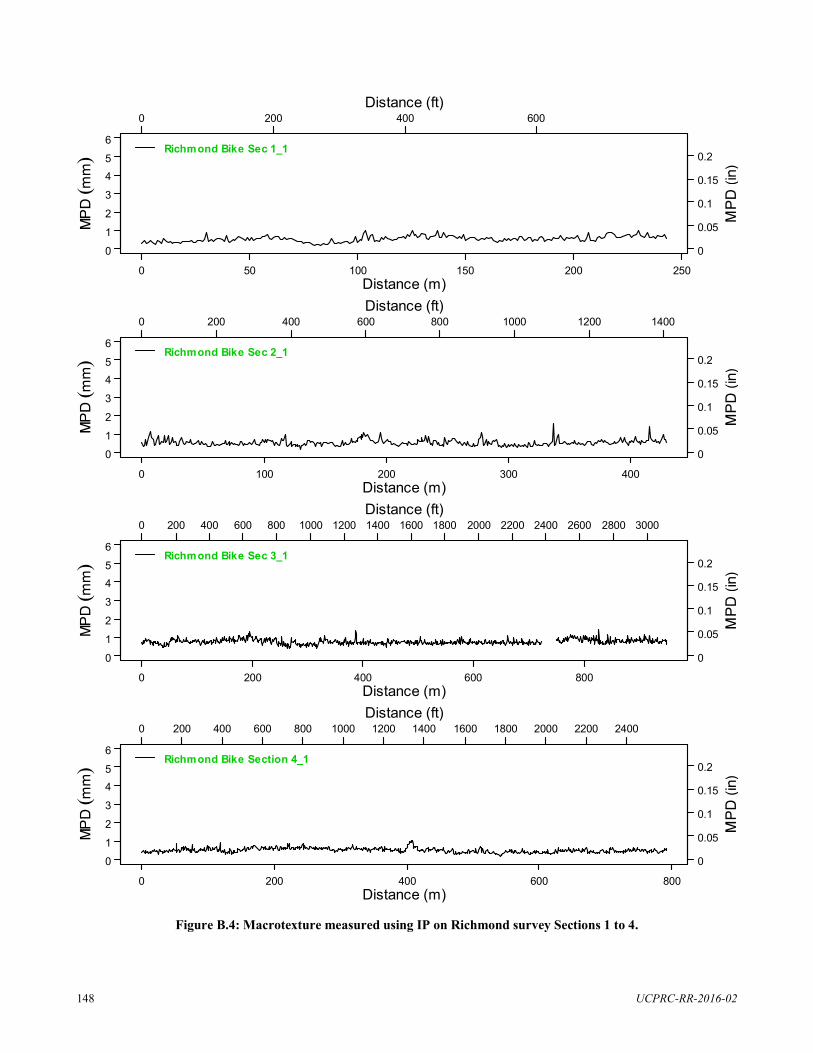
0 200 Distance (ft)
400 600
0
0 200
50
400
100 150 Distance (m) Distance (ft)
600 800 1000
200
1200
0.2
0.15
0.1
0.05
0
250
1400
6
5 4
3
2
1
0
6
5 4
3
2
1 0
6
5 4
3
2
1
0
6
5 4
3
2
1 0
Richmond Bike Sec 1_1
0.2
0.15
0.1
0.05
0
0
0 200 400
100
600 800 1000
200 Distance (m) Distance (ft)
1200 1400 1600 1800 2000
300
2200 2400 2600
400
2800 3000
Richmond Bike Sec 2_1
0.2
0.15
0.1
0.05
0
0
0 200 400
200
600 800
400 Distance (m) Distance (ft)
1000 1200 1400
600
1600 1800 2000
800
2200 2400
Richmond Bike Sec 3_1
0.2
0.15
0.1
0.05
0
0 200 400 600 800
Richm ond Bike Section 4_1
Distance (m)
Figure B.4: Macrotexture measured using IP on Richmond survey Sections 1 to 4.
UCPRC-RR-2016-02 148
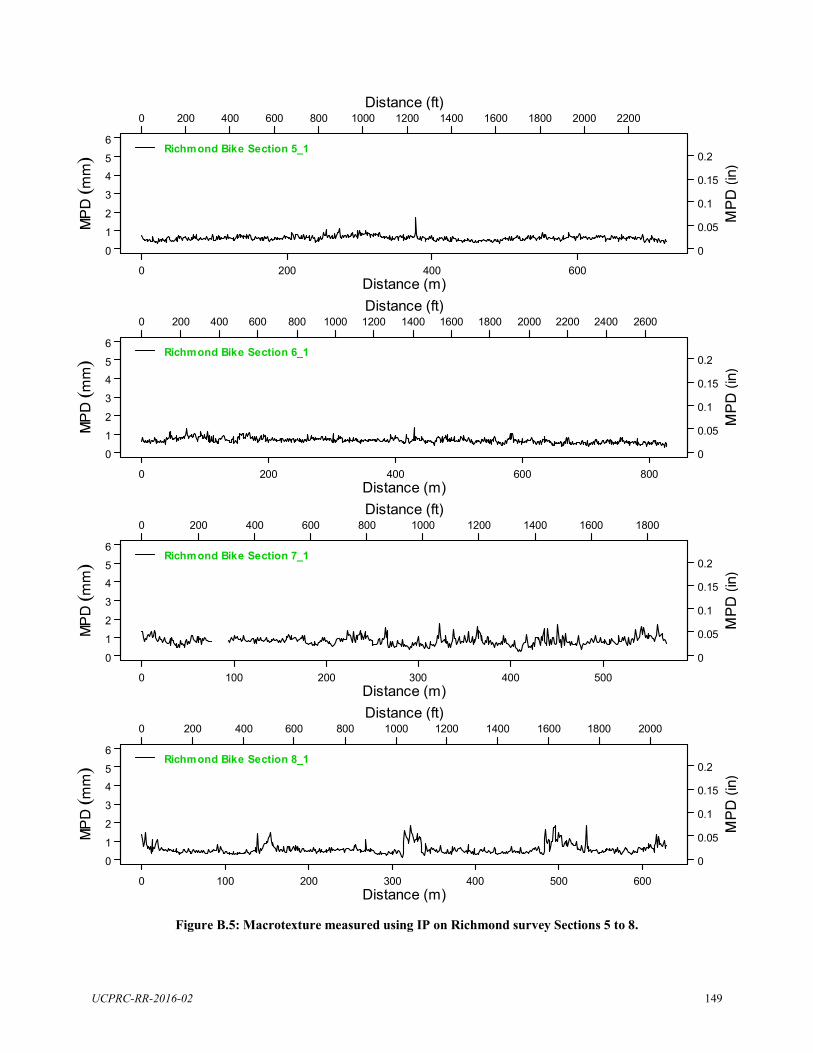
Distance (ft) 0 200 400 600 800 1000 1200 1400 1600 1800 2000 2200
6
5 Richm ond Bike Section 5_1
0.2
4 0.15 3
0.1 2
0.05 1
0 0
0 200 400 600 Distance (m) Distance (ft)
0 200 400 600 800 1000 1200 1400 1600 1800 2000 2200 2400 2600
6
5 Richm ond Bike Section 6_1
0.2
4 0.15 3
0.1 2
0.05 1 0 0
0 200 400 600 800 Distance (m) Distance (ft)
0 200 400 600 800 1000 1200 1400 1600 1800
6
5 Richm ond Bike Section 7_1
0.2
4 0.15 3
0.1 2
0.05 1
0 0
0 100 200 300 400 500 Distance (m) Distance (ft)
0 200 400 600 800 1000 1200 1400 1600 1800 2000
6
5 Richm ond Bike Section 8_1
0.2
4 0.15 3
0.1 2
0.05 1 0 0
0 100 200 300 400 500 600 Distance (m)
Figure B.5: Macrotexture measured using IP on Richmond survey Sections 5 to 8.
UCPRC-RR-2016-02 149
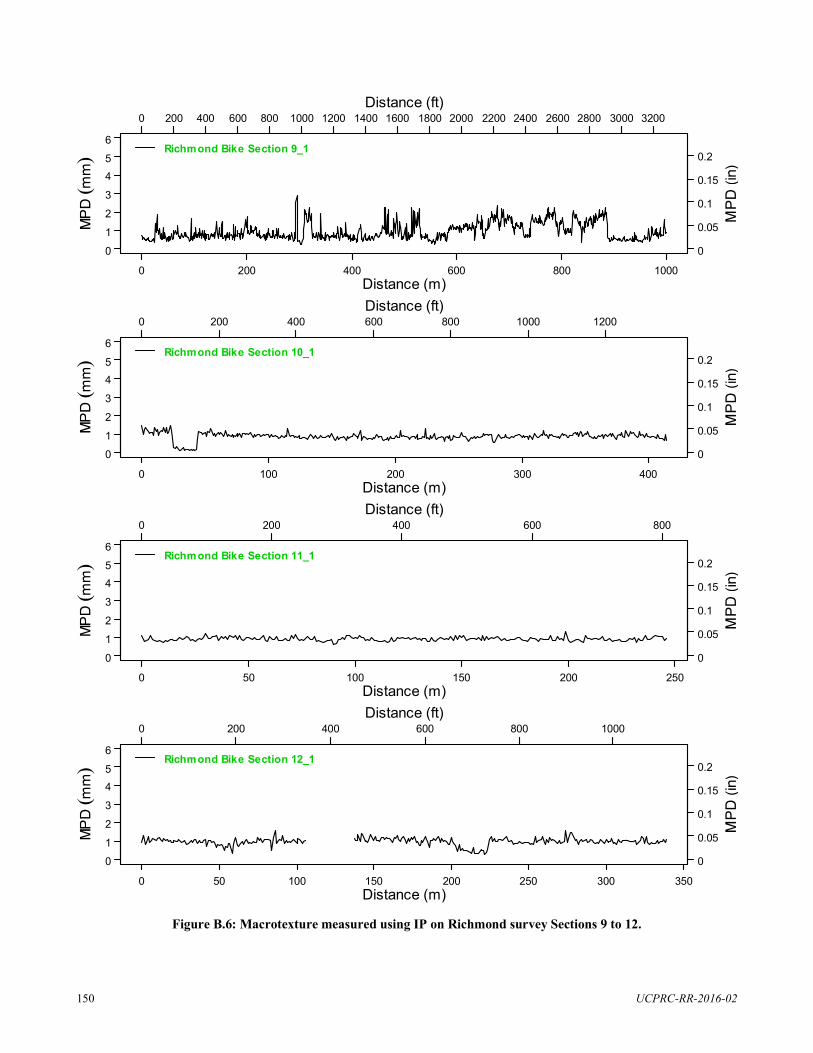
Distance (ft) 0 200 400 600 800 1000 1200 1400 1600 1800 2000 2200 2400 2600 2800 3000 3200
6
5 Richm ond Bike Section 9_1
0.2
4 0.15 3
0.1 2
0.05 1
0 0
0 200 400 600 800 1000 Distance (m) Distance (ft)
0 200 400 600 800 1000 1200
6
5 Richm ond Bike Section 10_1
0.2
4 0.15 3
0.1 2
0.05 1 0 0
0 100 200 300 400 Distance (m) Distance (ft)
0 200 400 600 800
6
5 Richm ond Bike Section 11_1
0.2
4 0.15 3
0.1 2
0.05 1
0 0
0 50 100 150 200 250 Distance (m) Distance (ft)
0 200 400 600 800 1000
6
5 Richm ond Bike Section 12_1
0.2
4 0.15 3
0.1 2
0.05 1 0 0
0 50 100 150 200 250 300 350 Distance (m)
Figure B.6: Macrotexture measured using IP on Richmond survey Sections 9 to 12.
UCPRC-RR-2016-02 150
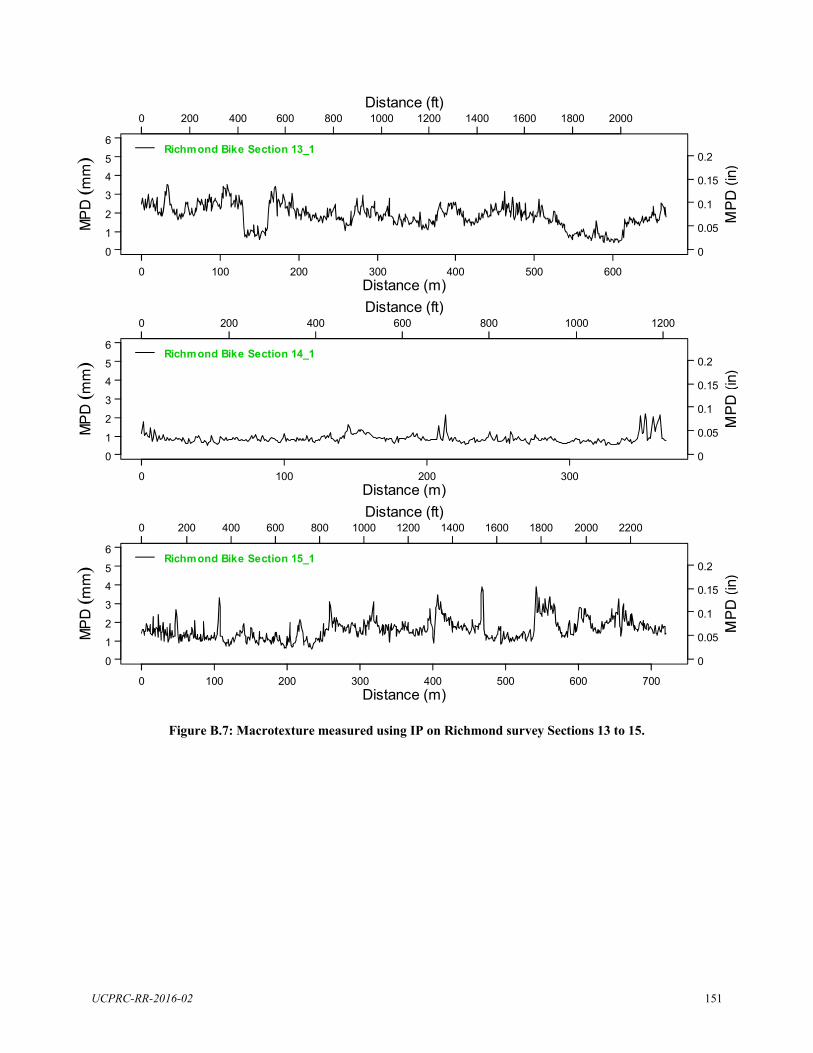
Distance (ft) 0 200 400 600 800 1000 1200 1400 1600 1800 2000
6
5 0.2
4
Richm ond Bike Section 13_1
0.15 3
0.1 2
0.05 1
0 0
0 100 200 300 400 500 600 Distance (m) Distance (ft)
0 200 400 600 800 1000 1200
6
5 0.2
4
Richm ond Bike Section 14_1
0.15 3
0.1 2
0.05 1
0 0
0 100 200 300 Distance (m) Distance (ft)
0 200 400 600 800 1000 1200 1400 1600 1800 2000 2200
6
5 0.2
4
Richm ond Bike Section 15_1
0.15 3
0.1 2
0.05 1
0 0
0 100 200 300 400 500 600 700 Distance (m)
Figure B.7: Macrotexture measured using IP on Richmond survey Sections 13 to 15.
UCPRC-RR-2016-02 151
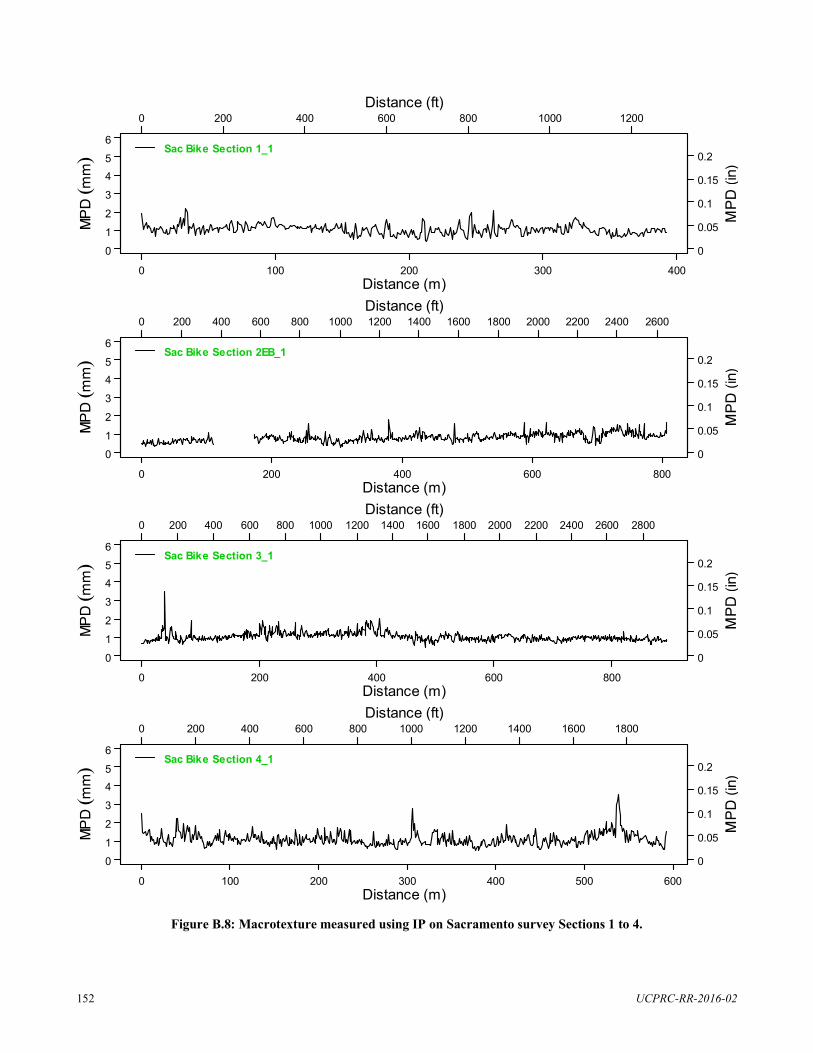
Distance (ft) 0 200 400 600 800 1000 1200
6
5 Sac Bike Section 1_1
0.2
4 0.15 3
0.1 2
0.05 1
0 0
0 100 200 300 400 Distance (m) Distance (ft)
0 200 400 600 800 1000 1200 1400 1600 1800 2000 2200 2400 2600
6
5 Sac Bike Section 2EB_1
0.2
4 0.15 3
0.1 2
0.05 1 0 0
0 200 400 600 800 Distance (m) Distance (ft)
0 200 400 600 800 1000 1200 1400 1600 1800 2000 2200 2400 2600 2800
6
5 Sac Bike Section 3_1
0.2
4 0.15 3
0.1 2
0.05 1
0 0
0 200 400 600 800 Distance (m) Distance (ft)
0 200 400 600 800 1000 1200 1400 1600 1800
6
5 Sac Bike Section 4_1
0.2
4 0.15 3
0.1 2
0.05 1 0 0
0 100 200 300 400 500 600 Distance (m)
Figure B.8: Macrotexture measured using IP on Sacramento survey Sections 1 to 4.
UCPRC-RR-2016-02 152
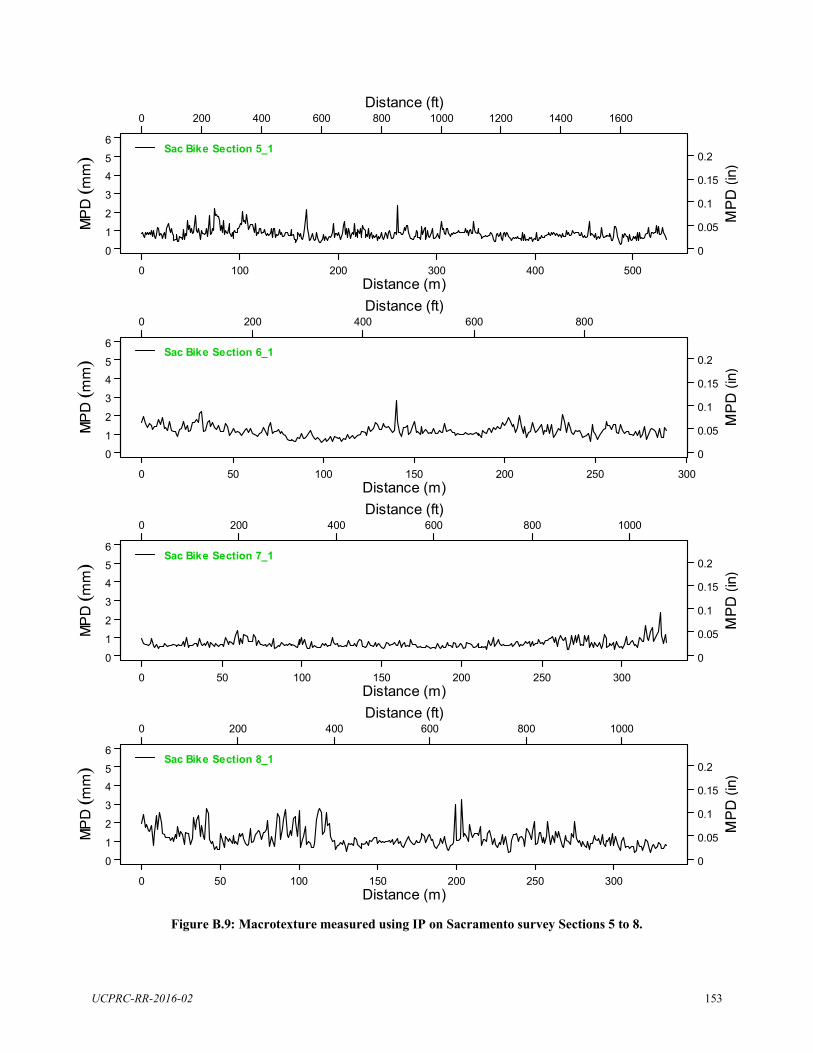
Distance (ft) 0 200 400 600 800 1000 1200 1400 1600
6
5 Sac Bike Section 5_1
0.2
4 0.15 3
0.1 2
0.05 1
0 0
0 100 200 300 400 500 Distance (m) Distance (ft)
0 200 400 600 800
6
5 Sac Bike Section 6_1
0.2
4 0.15 3
0.1 2
0.05 1 0 0
0 50 100 150 200 250 300 Distance (m) Distance (ft)
0 200 400 600 800 1000
6
5 Sac Bike Section 7_1
0.2
4 0.15 3
0.1 2
0.05 1
0 0
0 50 100 150 200 250 300 Distance (m) Distance (ft)
0 200 400 600 800 1000
6
5 Sac Bike Section 8_1
0.2
4 0.15 3
0.1 2
0.05 1 0 0
0 50 100 150 200 250 300 Distance (m)
Figure B.9: Macrotexture measured using IP on Sacramento survey Sections 5 to 8.
UCPRC-RR-2016-02 153
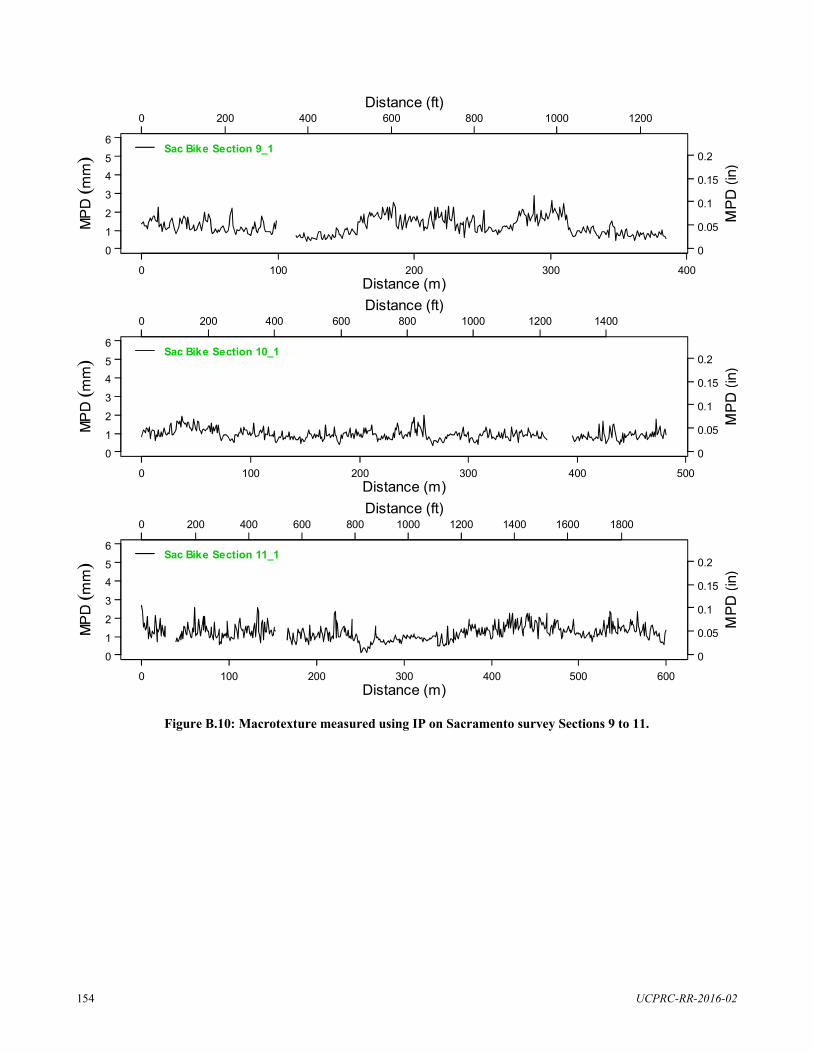
Distance (ft) 0 200 400 600 800 1000 1200
6
5 0.2
4
Sac Bike Section 9_1
0.15 3
0.1 2
0.05 1
0 0
0 100 200 300 400 Distance (m) Distance (ft)
0 200 400 600 800 1000 1200 1400
6
5 Sac Bike Section 10_1
0.2
4 0.15 3
0.1 2
0.05 1 0 0
0 100 200 300 400 500 Distance (m) Distance (ft)
0 200 400 600 800 1000 1200 1400 1600 1800
6
5 Sac Bike Section 11_1
0.2
4 0.15 3
0.1 2
0.05 1 0 0
0 100 200 300 400 500 600 Distance (m)
Figure B.10: Macrotexture measured using IP on Sacramento survey Sections 9 to 11.
UCPRC-RR-2016-02 154
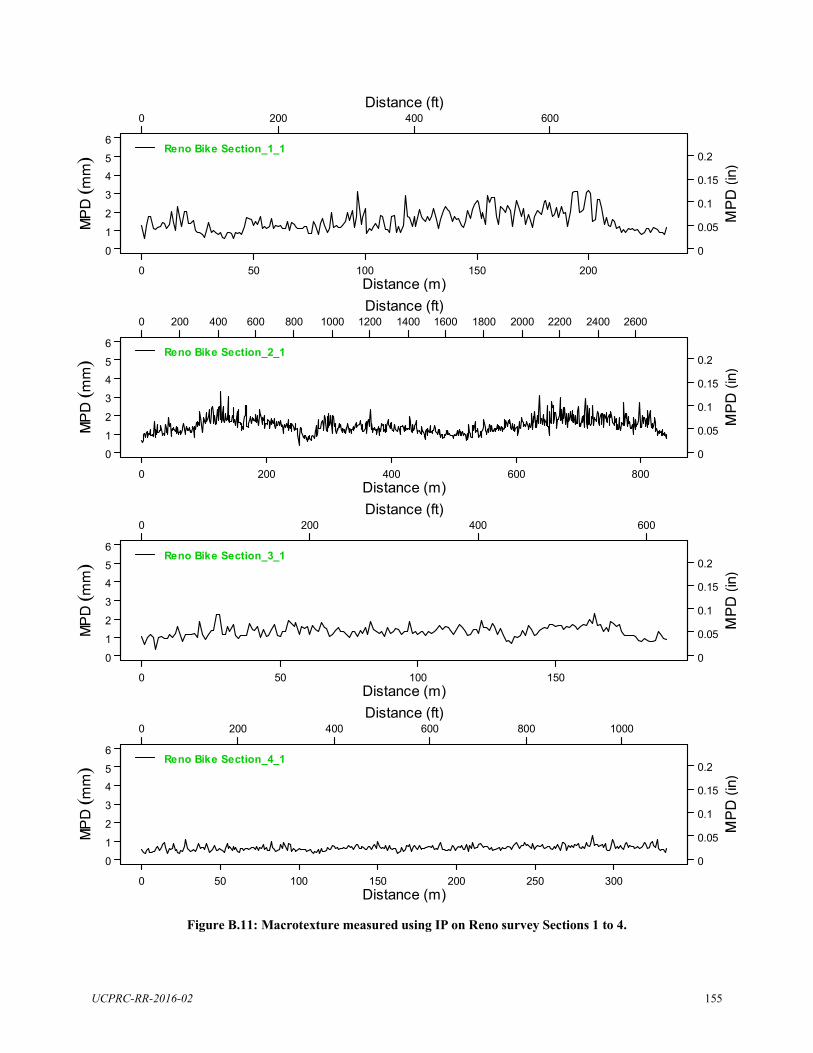
Distance (ft) 0 200 400 600
6
5 Reno Bike Section_1_1
0.2
4 0.15 3
0.1 2
0.05 1
0 0
0 50 100 150 200Distance (m) Distance (ft)
0 200 400 600 800 1000 1200 1400 1600 1800 2000 2200 2400 2600
6
5 Reno Bike Section_2_1
0.2
4 0.15 3
0.1 2
0.05 1 0 0
0 200 400 600 800 Distance (m) Distance (ft)
0 200 400 600
6
5 Reno Bike Section_3_1
0.2
4 0.15 3
0.1 2
0.05 1
0 0
0 50 100 150Distance (m) Distance (ft)
0 200 400 600 800 1000
6
5 Reno Bike Section_4_1
0.2
4 0.15 3
0.1 2
0.05 1 0 0
0 50 100 150 200 250 300 Distance (m)
Figure B.11: Macrotexture measured using IP on Reno survey Sections 1 to 4.
UCPRC-RR-2016-02 155
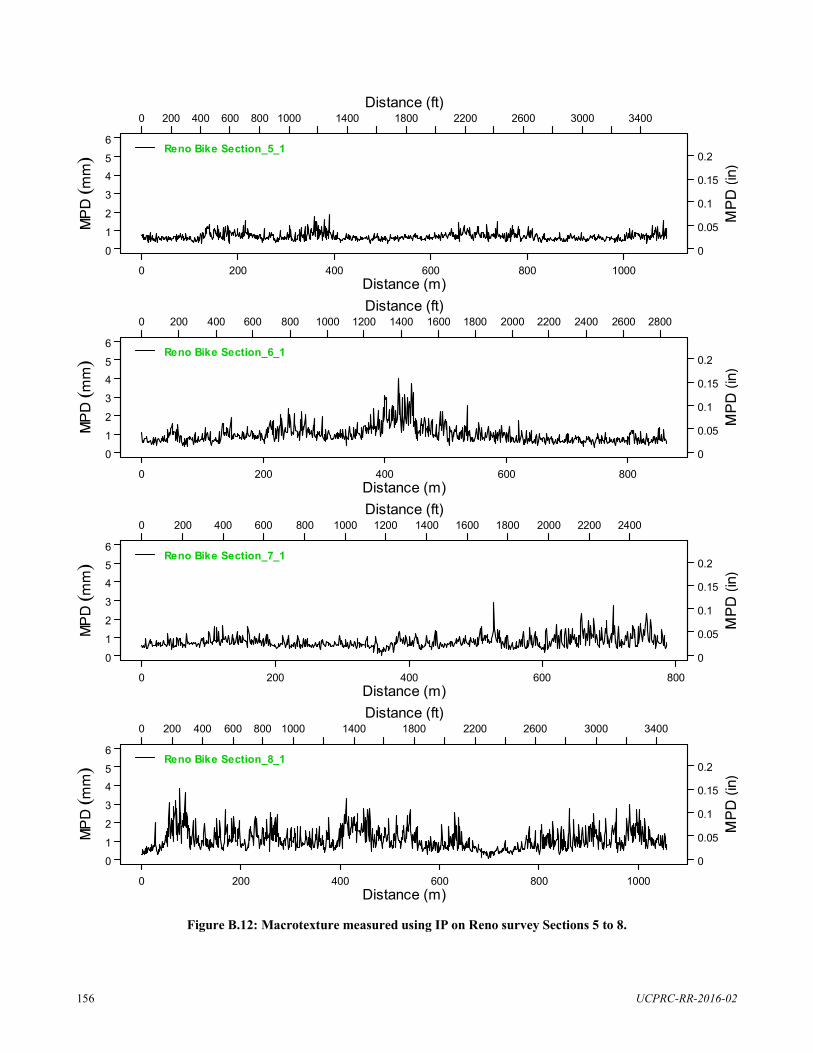
Distance (ft) 0 200 400 600 800 1000 1400 1800 2200 2600 3000 3400
6
5 Reno Bike Section_5_1
0.2
4 0.15 3
0.1 2
0.05 1
0 0
0 200 400 600 800 1000 Distance (m) Distance (ft)
0 200 400 600 800 1000 1200 1400 1600 1800 2000 2200 2400 2600 2800
6
5 Reno Bike Section_6_1
0.2
4 0.15 3
0.1 2
0.05 1 0 0
0 200 400 600 800 Distance (m) Distance (ft)
0 200 400 600 800 1000 1200 1400 1600 1800 2000 2200 2400
6
5 Reno Bike Section_7_1
0.2
4 0.15 3
0.1 2
0.05 1
0 0
0 200 400 600 800 Distance (m) Distance (ft)
0 200 400 600 800 1000 1400 1800 2200 2600 3000 3400
6
5 Reno Bike Section_8_1
0.2
4 0.15 3
0.1 2
0.05 1 0 0
0 200 400 600 800 1000 Distance (m)
Figure B.12: Macrotexture measured using IP on Reno survey Sections 5 to 8.
UCPRC-RR-2016-02 156
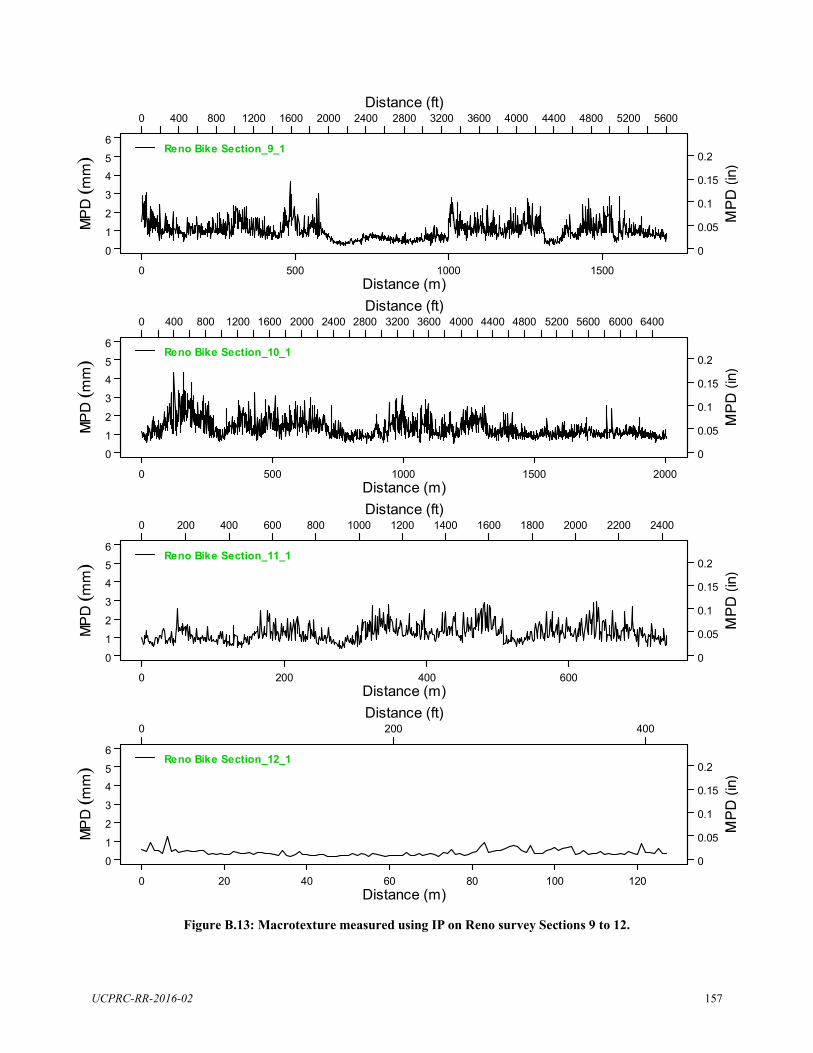
Distance (ft) 0 400 800 1200 1600 2000 2400 2800 3200 3600 4000 4400 4800 5200 5600
6
5 Reno Bike Section_9_1
0.2
4 0.15 3
0.1 2
0.05 1
0 0
0 500 1000 1500 Distance (m) Distance (ft)
0 400 800 1200 1600 2000 2400 2800 3200 3600 4000 4400 4800 5200 5600 6000 6400
6
5 Reno Bike Section_10_1
0.2
4 0.15 3
0.1 2
0.05 1 0 0
0 500 1000 1500 2000 Distance (m) Distance (ft)
0 200 400 600 800 1000 1200 1400 1600 1800 2000 2200 2400
6
5 Reno Bike Section_11_1
0.2
4 0.15 3
0.1 2
0.05 1
0 0
0 200 400 600 Distance (m) Distance (ft)
0 200
6
5 Reno Bike Section_12_1
0.2
4 0.15 3
0.1 2
0.05 1 0 0
0 20 40 60 80 100 120Distance (m)
400
Figure B.13: Macrotexture measured using IP on Reno survey Sections 9 to 12.
UCPRC-RR-2016-02 157
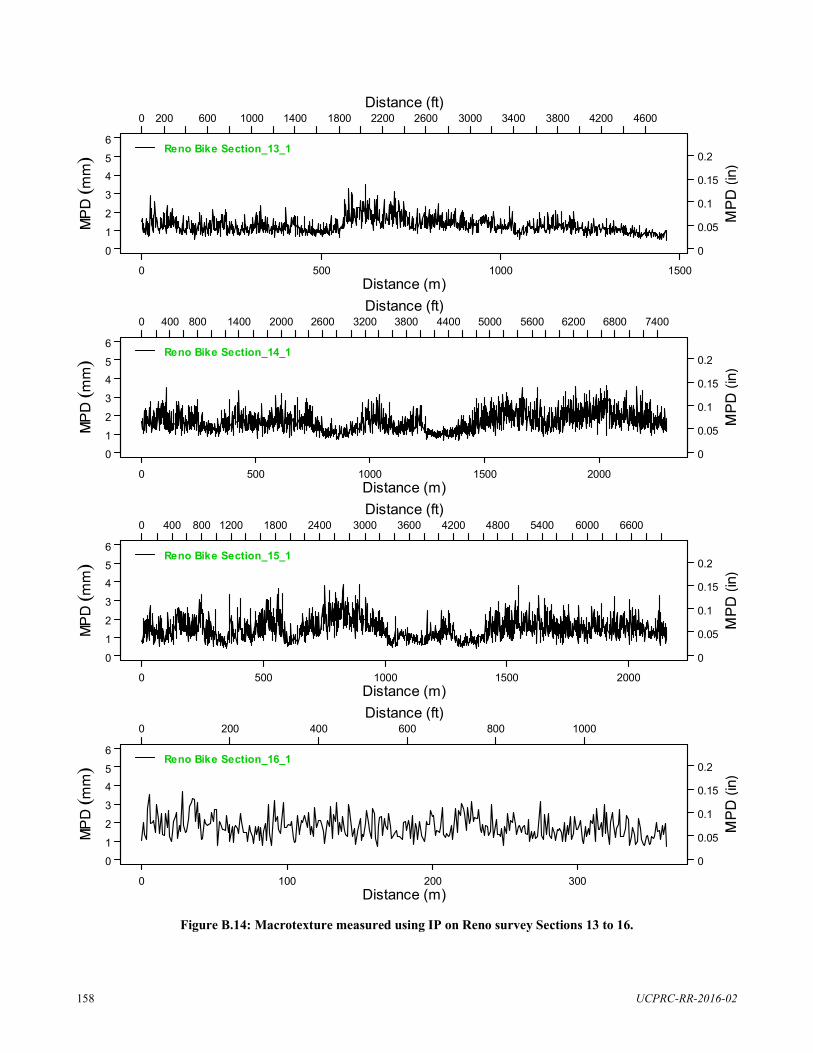
Distance (ft) 0 200 600 1000 1400 1800 2200 2600 3000 3400 3800 4200 4600
6
5 4
3
2
1
0
6
5 4
3
2
1 0
6
5 4
3
2
1
0
6
5 4
3
2
1 0
Reno Bike Section_13_1
0 500 1000 Distance (m) Distance (ft)
0 400 800 1400 2000 2600 3200 3800 4400 5000 5600 6200 6800
Reno Bike Section_14_1
0 500 1000 1500 2000 Distance (m) Distance (ft)
0 400 800 1200 1800 2400 3000 3600 4200 4800 5400 6000 6600
Reno Bike Section_15_1
0 500 1000 1500 2000 Distance (m) Distance (ft)
0 200 400 600 800 1000
Reno Bike Section_16_1
0 100 200 300 Distance (m)
0.2
0.15
0.1
0.05
0
1500
7400
0.2
0.15
0.1
0.05
0
0.2
0.15
0.1
0.05
0
0.2
0.15
0.1
0.05
0
Figure B.14: Macrotexture measured using IP on Reno survey Sections 13 to 16.
UCPRC-RR-2016-02 158
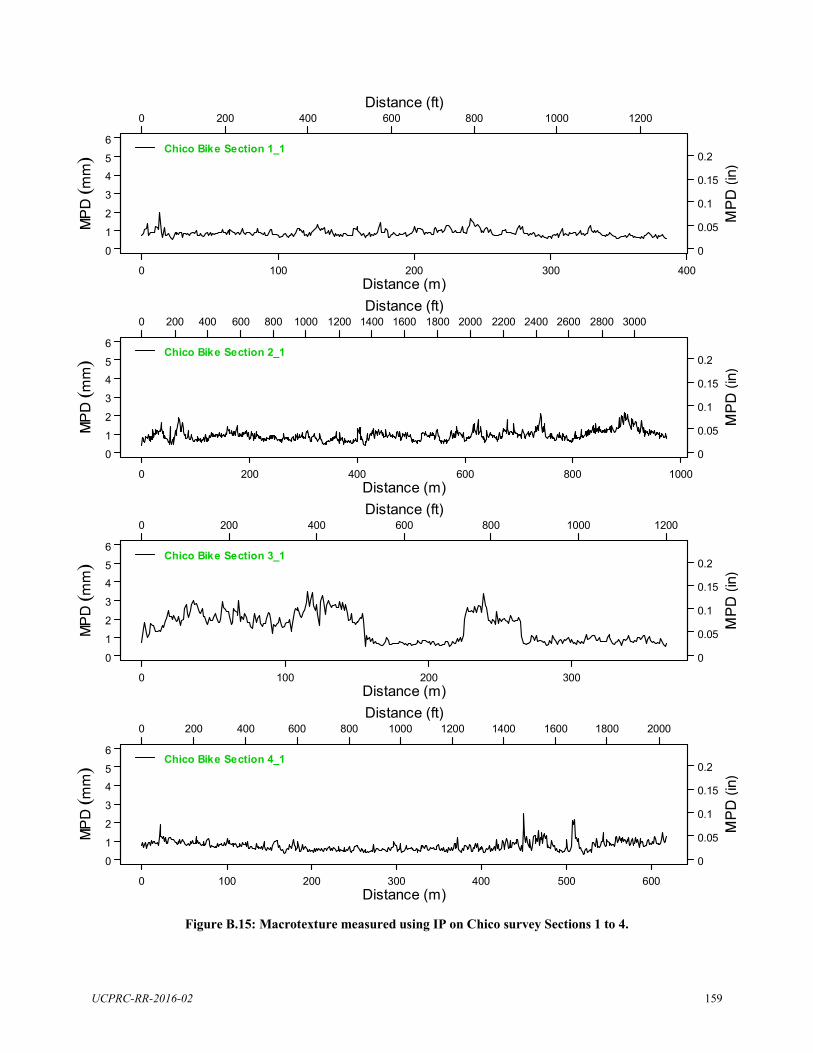
Distance (ft) 0 200 400 600 800 1000 1200
6
5 Chico Bike Section 1_1
0.2
4 0.15 3
0.1 2
0.05 1
0 0
0 100 200 300 400 Distance (m) Distance (ft)
0 200 400 600 800 1000 1200 1400 1600 1800 2000 2200 2400 2600 2800 3000
6
5 Chico Bike Section 2_1
0.2
4 0.15 3
0.1 2
0.05 1 0 0
0 200 400 600 800 1000 Distance (m) Distance (ft)
0 200 400 600 800 1000 1200
6
5 Chico Bike Section 3_1
0.2
4 0.15 3
0.1 2
0.05 1
0 0
0 100 200 300 Distance (m) Distance (ft)
0 200 400 600 800 1000 1200 1400 1600 1800 2000
6
5 Chico Bike Section 4_1
0.2
4 0.15 3
0.1 2
0.05 1 0 0
0 100 200 300 400 500 600 Distance (m)
Figure B.15: Macrotexture measured using IP on Chico survey Sections 1 to 4.
UCPRC-RR-2016-02 159
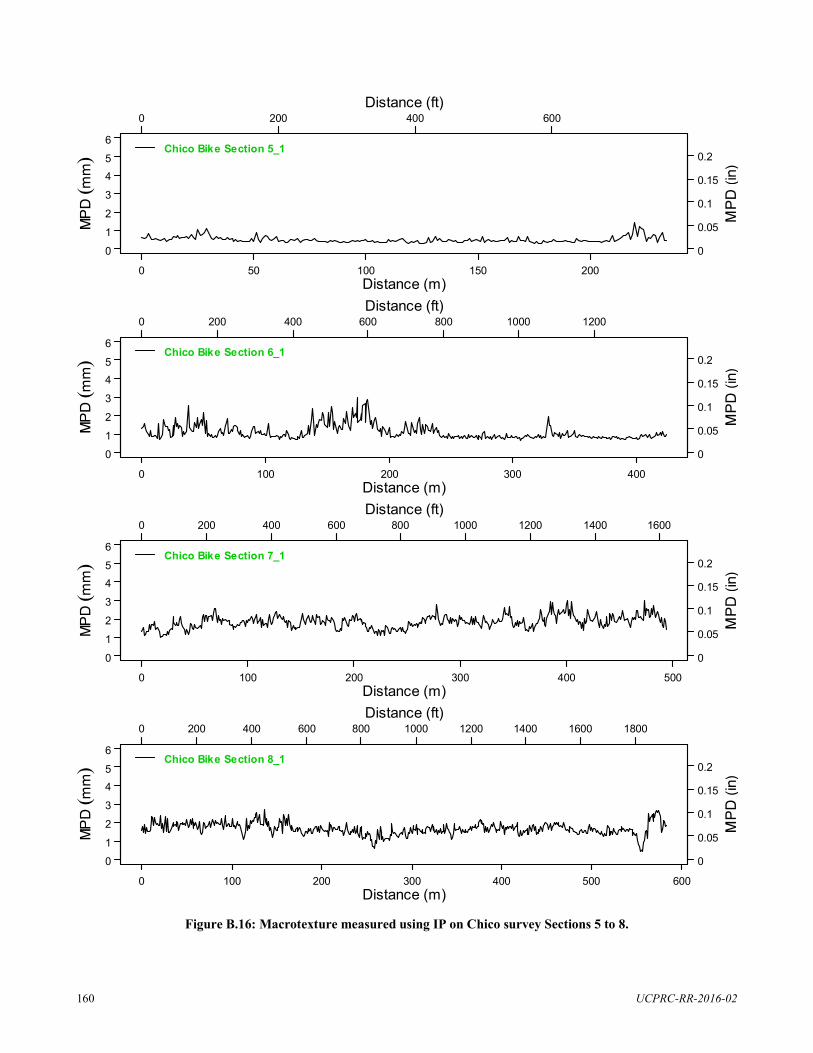
Distance (ft) 0 200 400 600
6
5 Chico Bike Section 5_1
0.2
4 0.15 3
0.1 2
0.05 1
0 0
0 50 100 150 200 Distance (m) Distance (ft)
0 200 400 600 800 1000 1200
6
5 Chico Bike Section 6_1
0.2
4 0.15 3
0.1 2
0.05 1 0 0
0 100 200 300 400 Distance (m) Distance (ft)
0 200 400 600 800 1000 1200 1400 1600
6
5 Chico Bike Section 7_1
0.2
4 0.15 3
0.1 2
0.05 1
0 0
0 100 200 300 400 500 Distance (m) Distance (ft)
0 200 400 600 800 1000 1200 1400 1600 1800
6
5 Chico Bike Section 8_1
0.2
4 0.15 3
0.1 2
0.05 1 0 0
0 100 200 300 400 500 600 Distance (m)
Figure B.16: Macrotexture measured using IP on Chico survey Sections 5 to 8.
UCPRC-RR-2016-02 160
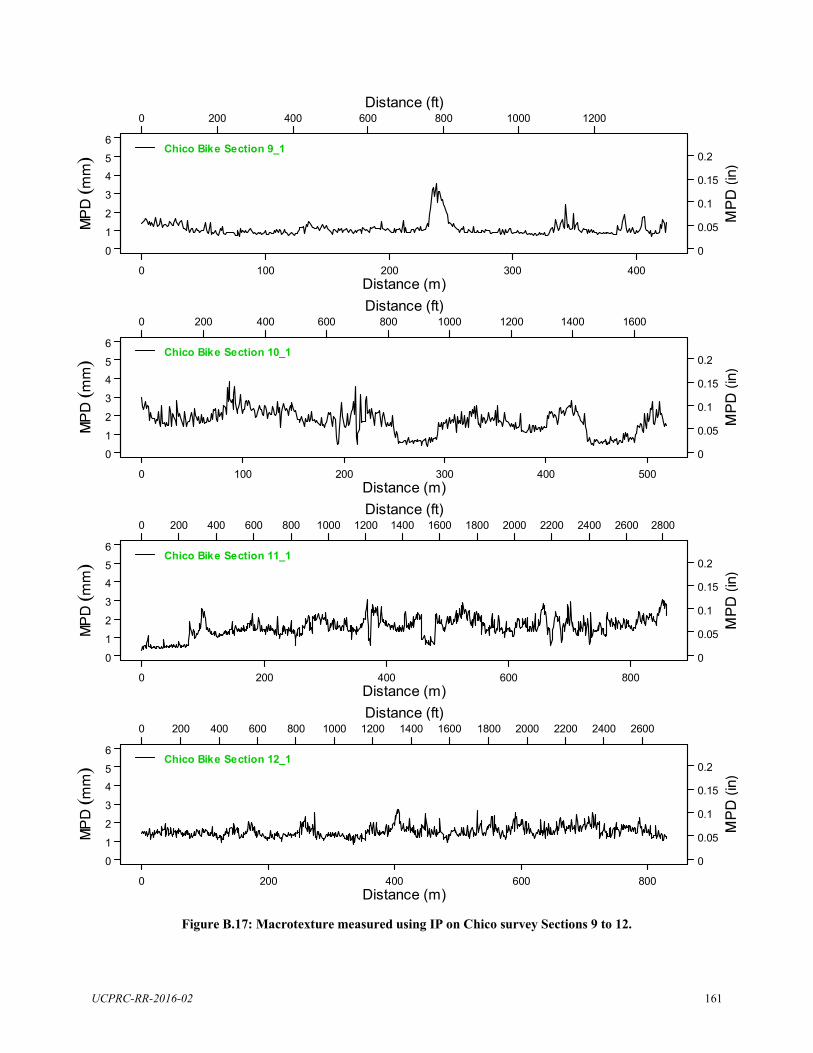
Distance (ft) 0 200 400 600 800 1000 1200
6
5 Chico Bike Section 9_1
0.2
4 0.15 3
0.1 2
0.05 1
0 0
0 100 200 300 400 Distance (m) Distance (ft)
0 200 400 600 800 1000 1200 1400 1600
6
5 Chico Bike Section 10_1
0.2
4 0.15 3
0.1 2
0.05 1 0 0
0 100 200 300 400 500 Distance (m) Distance (ft)
0 200 400 600 800 1000 1200 1400 1600 1800 2000 2200 2400 2600 2800
6
5 Chico Bike Section 11_1
0.2
4 0.15 3
0.1 2
0.05 1
0 0
0 200 400 600 800 Distance (m) Distance (ft)
0 200 400 600 800 1000 1200 1400 1600 1800 2000 2200 2400 2600
6
5 Chico Bike Section 12_1
0.2
4 0.15 3
0.1 2
0.05 1 0 0
0 200 400 600 800 Distance (m)
Figure B.17: Macrotexture measured using IP on Chico survey Sections 9 to 12.
UCPRC-RR-2016-02 161
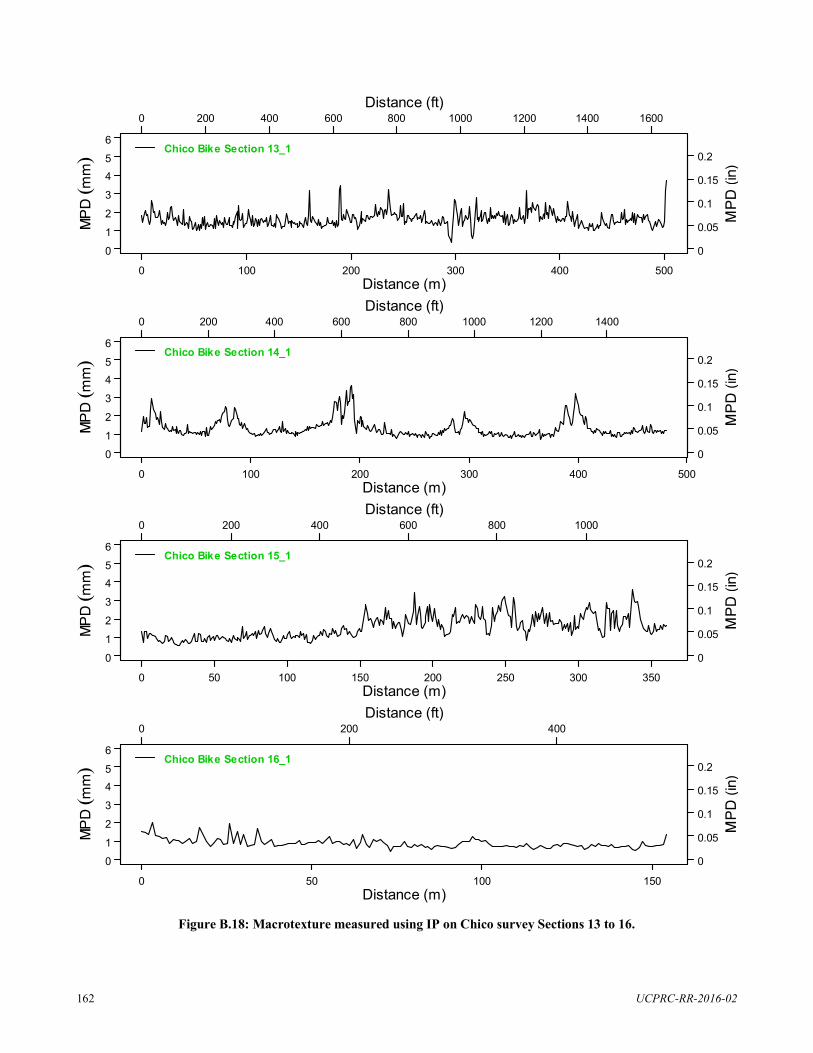
Distance (ft) 0 200 400 600 800 1000 1200 1400 1600
6
5 Chico Bike Section 13_1
0.2
4 0.15 3
0.1 2
0.05 1
0 0
0 100 200 300 400 500 Distance (m) Distance (ft)
0 200 400 600 800 1000 1200 1400
6
5 Chico Bike Section 14_1
0.2
4 0.15 3
0.1 2
0.05 1 0 0
0 100 200 300 400 500 Distance (m) Distance (ft)
0 200 400 600 800 1000
6
5 Chico Bike Section 15_1
0.2
4 0.15 3
0.1 2
0.05 1
0 0
0 50 100 150 200 250 300 350 Distance (m) Distance (ft)
0 200 400
6
5 Chico Bike Section 16_1
0.2
4 0.15 3
0.1 2
0.05 1 0 0
0 50 100Distance (m)
150
Figure B.18: Macrotexture measured using IP on Chico survey Sections 13 to 16.
UCPRC-RR-2016-02 162
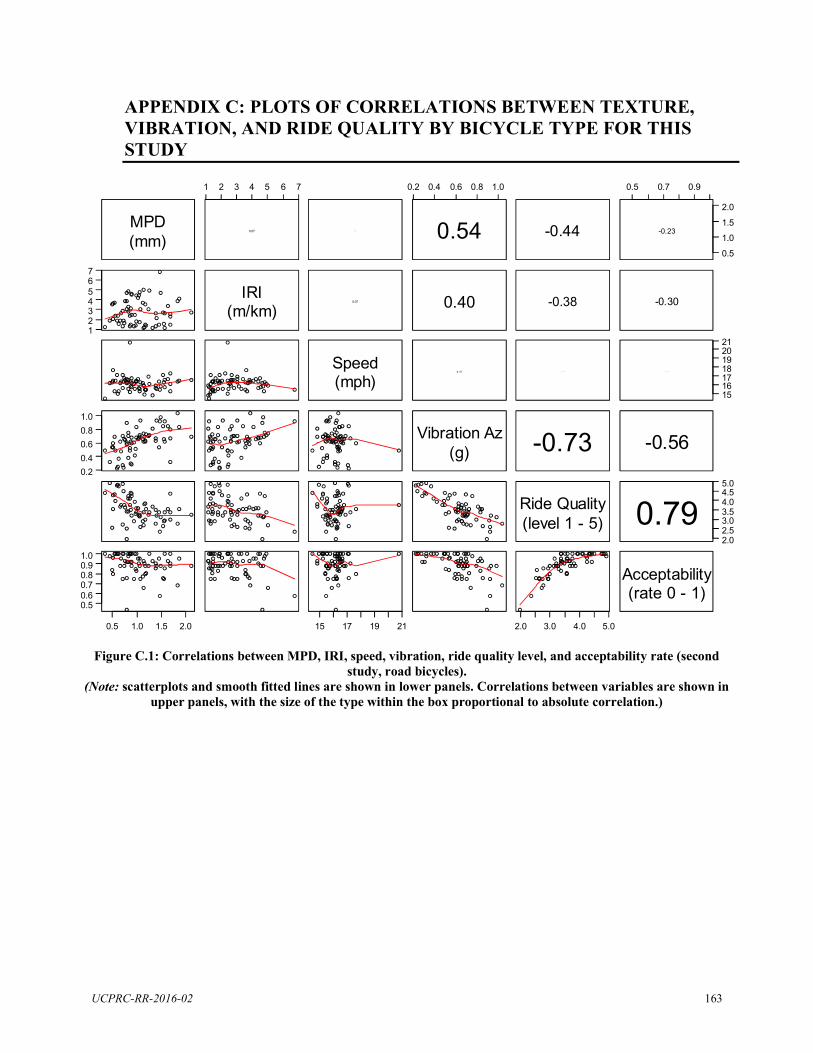
1 2 3 4 5 6 7 0.2 0.4 0.6 0.8 1.0 0.5 0.7 0.9
2.0
MPD (mm)
0.07 - 0 . 0 1 0.54 -0.44 -0.23 1.5
1.0
0.5
7 6 5 4 3 2
IRI (m/km)
0.07 0.40 -0.38 -0.30
1 21 20
Speed (mph)
-0 . 07 - 0 . 0 2 0 . 0 3
19 18 17 16 15
1.0 0.8 0.6 0.4
Vibration Az (g) -0.73 -0.56
0.2 5.0 4.5
Ride Quality (level 1 - 5) 0.79 4.0
3.5 3.0 2.5 2.0
1.0 0.9 0.8 0.7 0.6 0.5
Acceptability (rate 0 - 1)
0.5 1.0 1.5 2.0 15 17 19 21 2.0 3.0 4.0 5.0
APPENDIX C: PLOTS OF CORRELATIONS BETWEEN TEXTURE, VIBRATION, AND RIDE QUALITY BY BICYCLE TYPE FOR THIS STUDY
Figure C.1: Correlations between MPD, IRI, speed, vibration, ride quality level, and acceptability rate (second study, road bicycles).
(Note: scatterplots and smooth fitted lines are shown in lower panels. Correlations between variables are shown in upper panels, with the size of the type within the box proportional to absolute correlation.)
UCPRC-RR-2016-02 163
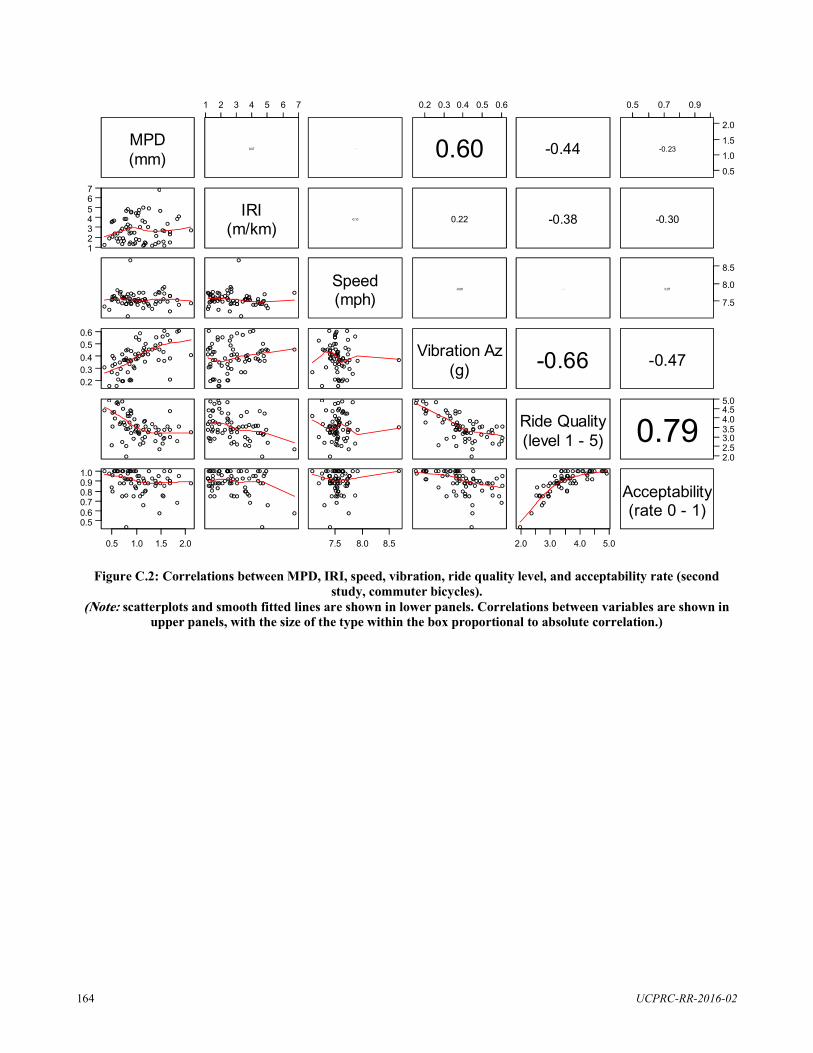
1 2 3 4 5 6 7 0.2 0.3 0.4 0.5 0.6 0.5 0.7 0.9
2.0
MPD 1.5 - 0 . 0 2 -0.23 0.60 -0.44 1.0 (mm)
0.07
0.5
7 6 5 4 3 2
IRI (m/km)
-0.10 0.22 -0.38 -0.30
1
8.5
Speed (mph)
-0.08 - 0 . 0 2 0.07 8.0
7.5
0.6 0.5 0.4 0.3 0.2
Vibration Az (g) -0.66 -0.47
5.0 4.5
Ride Quality (level 1 - 5) 0.79 4.0
3.5 3.0 2.5 2.0
1.0 0.9 0.8 0.7 0.6 0.5
Acceptability (rate 0 - 1)
0.5 1.0 1.5 2.0 7.5 8.0 8.5 2.0 3.0 4.0 5.0
Figure C.2: Correlations between MPD, IRI, speed, vibration, ride quality level, and acceptability rate (second study, commuter bicycles).
scatterplots and smooth fitted lines are shown in lower panels. Correlations between variables are shown in upper panels, with the size of the type within the box proportional to absolute correlation.)
UCPRC-RR-2016-02 164
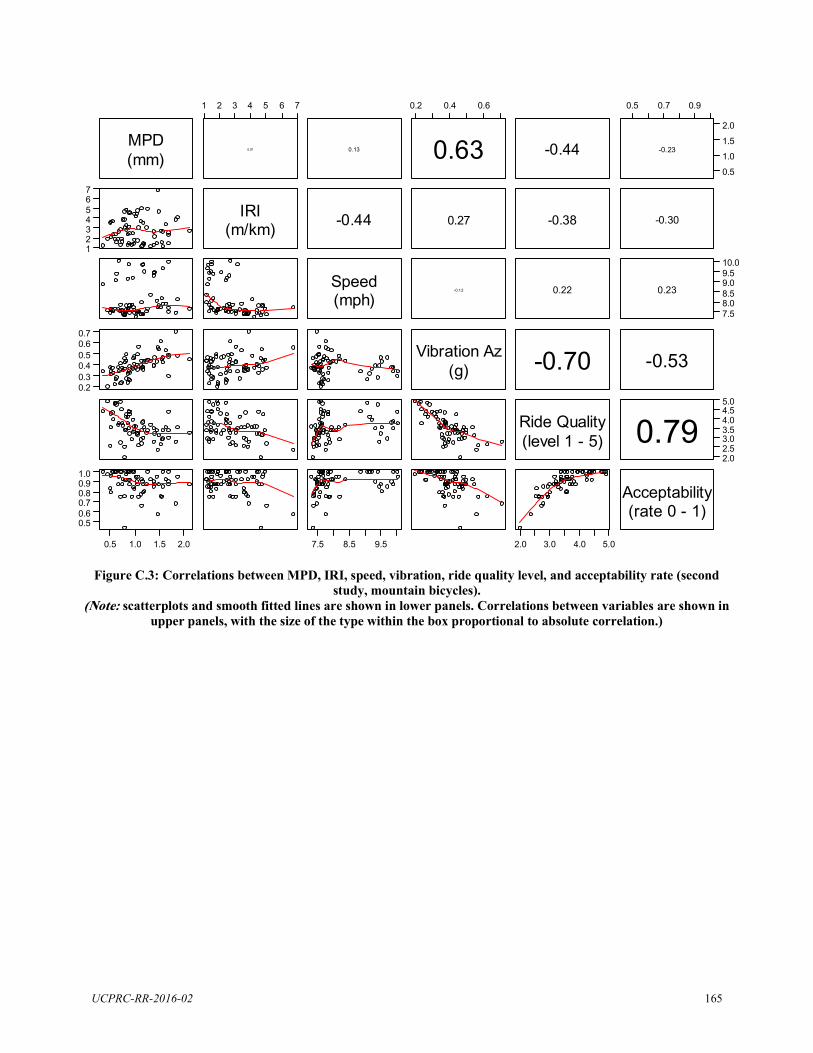
1 2 3 4 5 6 7 0.2 0.4 0.6 0.5 0.7 0.9
2.0
1.5 0.07 0.13 -0.23
MPD 0.63 -0.44 1.0 (mm) 0.5
7 6 5 4 3 2
IRI (m/km) -0.44 0.27 -0.38 -0.30
1 10.0
Speed (mph)
-0.12 0.22 0.23
9.5 9.0 8.5 8.0 7.5
0.7 0.6 0.5 0.4 0.3
Vibration Az (g) -0.70 -0.53
0.2 5.0 4.5
Ride Quality (level 1 - 5) 0.79 4.0
3.5 3.0 2.5 2.0
1.0 0.9 0.8 0.7 0.6 0.5
Acceptability (rate 0 - 1)
0.5 1.0 1.5 2.0 7.5 8.5 9.5 2.0 3.0 4.0 5.0
Figure C.3: Correlations between MPD, IRI, speed, vibration, ride quality level, and acceptability rate (second study, mountain bicycles).
scatterplots and smooth fitted lines are shown in lower panels. Correlations between variables are shown in upper panels, with the size of the type within the box proportional to absolute correlation.)
UCPRC-RR-2016-02 165
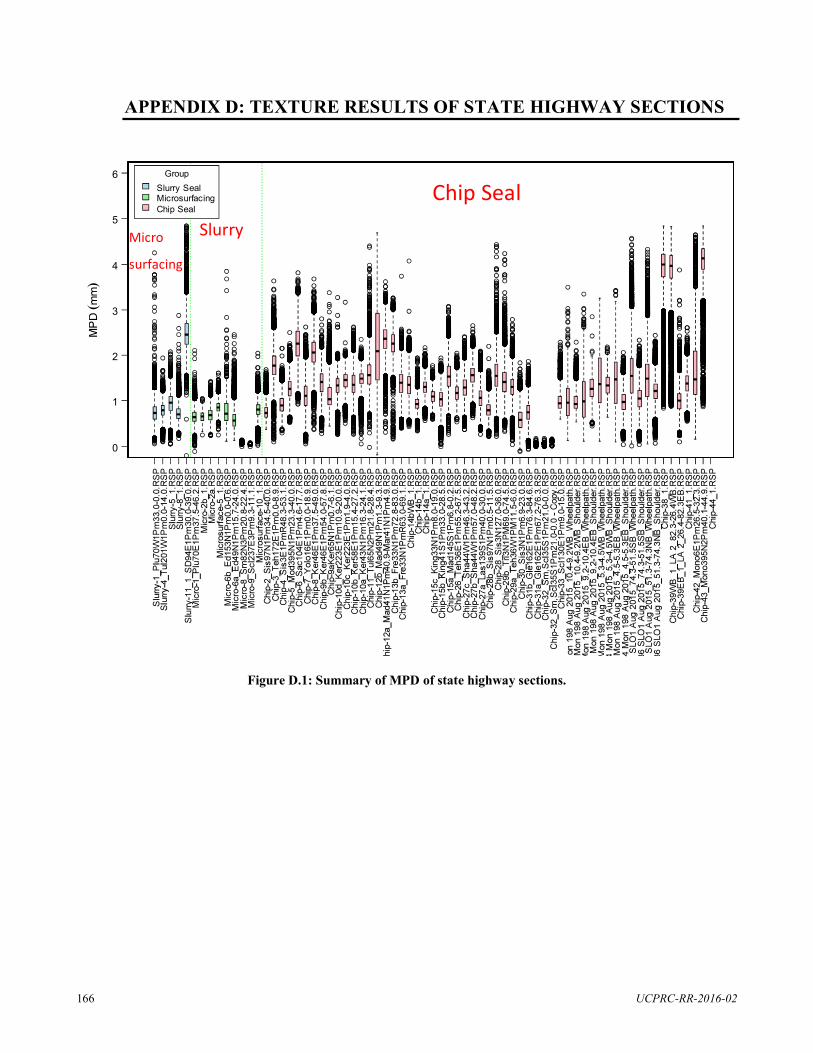
6 Group Slurry Seal Microsurfacing Chip Seal Chip Seal
5 Slurry Micro
4 surfacing
3
2
1
0
APPENDIX D: TEXTURE RESULTS OF STATE HIGHWAY SECTIONS
Figure D.1: Summary of MPD of state highway sections.
UCPRC-RR-2016-02 166
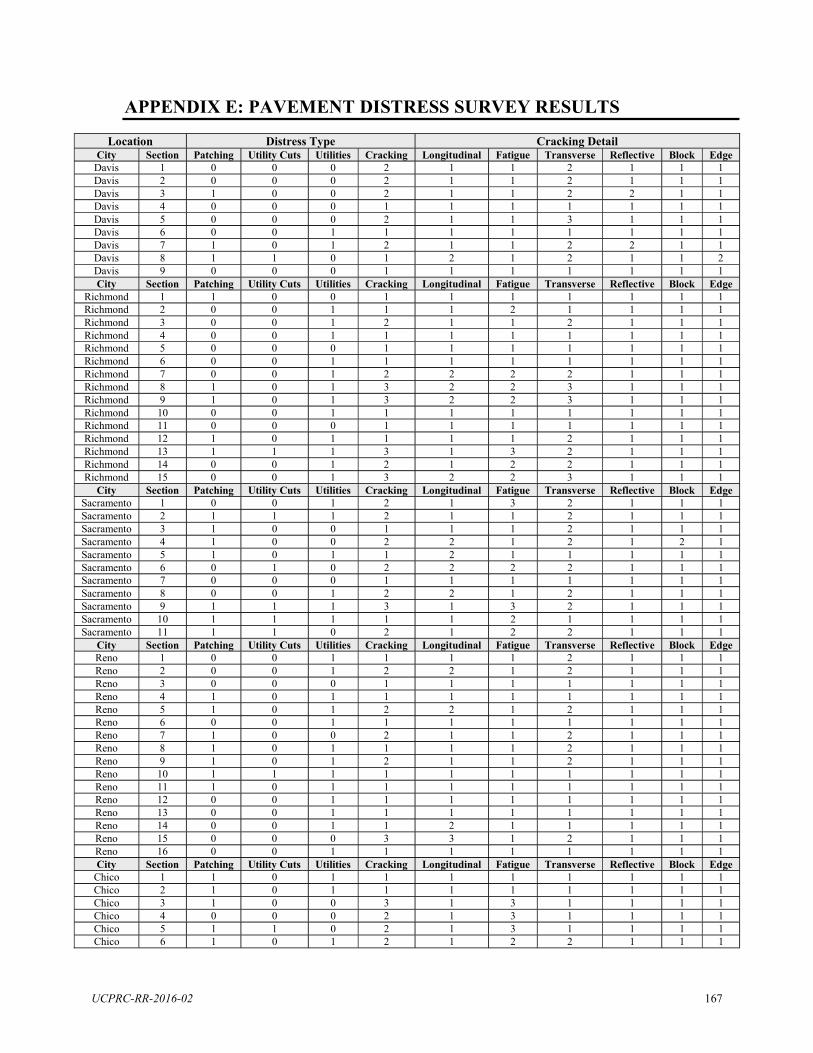
APPENDIX E: PAVEMENT DISTRESS SURVEY RESULTS
Location Distress Type Cracking Detail City Section Patching Utility Cuts Utilities Cracking Longitudinal Fatigue Transverse Reflective Block Edge
Davis 1 0 0 0 2 1 1 2 1 1 1 Davis 2 0 0 0 2 1 1 2 1 1 1 Davis 3 1 0 0 2 1 1 2 2 1 1 Davis 4 0 0 0 1 1 1 1 1 1 1 Davis 5 0 0 0 2 1 1 3 1 1 1 Davis 6 0 0 1 1 1 1 1 1 1 1 Davis 7 1 0 1 2 1 1 2 2 1 1 Davis 8 1 1 0 1 2 1 2 1 1 2 Davis 9 0 0 0 1 1 1 1 1 1 1 City Section Patching Utility Cuts Utilities Cracking Longitudinal Fatigue Transverse Reflective Block Edge
Richmond 1 1 0 0 1 1 1 1 1 1 1 Richmond 2 0 0 1 1 1 2 1 1 1 1 Richmond 3 0 0 1 2 1 1 2 1 1 1 Richmond 4 0 0 1 1 1 1 1 1 1 1 Richmond 5 0 0 0 1 1 1 1 1 1 1 Richmond 6 0 0 1 1 1 1 1 1 1 1 Richmond 7 0 0 1 2 2 2 2 1 1 1 Richmond 8 1 0 1 3 2 2 3 1 1 1 Richmond 9 1 0 1 3 2 2 3 1 1 1 Richmond 10 0 0 1 1 1 1 1 1 1 1 Richmond 11 0 0 0 1 1 1 1 1 1 1 Richmond 12 1 0 1 1 1 1 2 1 1 1 Richmond 13 1 1 1 3 1 3 2 1 1 1 Richmond 14 0 0 1 2 1 2 2 1 1 1 Richmond 15 0 0 1 3 2 2 3 1 1 1
City Section Patching Utility Cuts Utilities Cracking Longitudinal Fatigue Transverse Reflective Block Edge Sacramento 1 0 0 1 2 1 3 2 1 1 1 Sacramento 2 1 1 1 2 1 1 2 1 1 1 Sacramento 3 1 0 0 1 1 1 2 1 1 1 Sacramento 4 1 0 0 2 2 1 2 1 2 1 Sacramento 5 1 0 1 1 2 1 1 1 1 1 Sacramento 6 0 1 0 2 2 2 2 1 1 1 Sacramento 7 0 0 0 1 1 1 1 1 1 1 Sacramento 8 0 0 1 2 2 1 2 1 1 1 Sacramento 9 1 1 1 3 1 3 2 1 1 1 Sacramento 10 1 1 1 1 1 2 1 1 1 1 Sacramento 11 1 1 0 2 1 2 2 1 1 1
City Section Patching Utility Cuts Utilities Cracking Longitudinal Fatigue Transverse Reflective Block Edge Reno 1 0 0 1 1 1 1 2 1 1 1 Reno 2 0 0 1 2 2 1 2 1 1 1 Reno 3 0 0 0 1 1 1 1 1 1 1 Reno 4 1 0 1 1 1 1 1 1 1 1 Reno 5 1 0 1 2 2 1 2 1 1 1 Reno 6 0 0 1 1 1 1 1 1 1 1 Reno 7 1 0 0 2 1 1 2 1 1 1 Reno 8 1 0 1 1 1 1 2 1 1 1 Reno 9 1 0 1 2 1 1 2 1 1 1 Reno 10 1 1 1 1 1 1 1 1 1 1 Reno 11 1 0 1 1 1 1 1 1 1 1 Reno 12 0 0 1 1 1 1 1 1 1 1 Reno 13 0 0 1 1 1 1 1 1 1 1 Reno 14 0 0 1 1 2 1 1 1 1 1 Reno 15 0 0 0 3 3 1 2 1 1 1 Reno 16 0 0 1 1 1 1 1 1 1 1 City Section Patching Utility Cuts Utilities Cracking Longitudinal Fatigue Transverse Reflective Block Edge
Chico 1 1 0 1 1 1 1 1 1 1 1 Chico 2 1 0 1 1 1 1 1 1 1 1 Chico 3 1 0 0 3 1 3 1 1 1 1 Chico 4 0 0 0 2 1 3 1 1 1 1 Chico 5 1 1 0 2 1 3 1 1 1 1 Chico 6 1 0 1 2 1 2 2 1 1 1
UCPRC-RR-2016-02 167

7 8 9 10 11 12 13 14 15 16
Location Distress Type Cracking Detail City Section Patching Utility Cuts Utilities Cracking Longitudinal Fatigue Transverse Reflective Block Edge
Chico 0 0 0 1 1 1 1 1 1 1 Chico 0 0 0 1 1 1 1 1 1 1 Chico 1 0 0 2 1 1 2 1 1 1 Chico 0 1 1 1 1 1 2 1 1 1 Chico 1 0 0 1 1 1 2 1 1 1 Chico 0 0 1 1 1 1 1 1 1 1 Chico 0 0 1 1 1 1 2 1 1 1 Chico 1 0 0 1 1 1 2 1 1 1 Chico 1 0 1 2 1 2 2 1 1 1 Chico 1 0 1 2 1 2 2 1 1 1
UCPRC-RR-2016-02 168
Related Documents


