Accuracy evaluation of pin exposure calculations in current LWR core design codes Vuyani Xulubana a , Chanatip Tippayakul a , Kostadin Ivanov a, * , Samuel H. Levine a , Moussa Mahgerefteh b a Mechanical and Nuclear Engineering Department, Penn State University, 230 Reber Building, University Park, State College, PA 16802, United States b Exelon Nuclear Company, 200 Exelon Way, Kennet Square, PA 19348, United States Received 9 August 2006; received in revised form 10 July 2007; accepted 10 July 2007 Available online 4 September 2007 Abstract The deregulated utility environment and better utilization of fuel assemblies in nuclear power plants has allowed designers to burn fuel assemblies to maximum allowable exposures. Any uncertainties, associated with the technical approach and numerical methods used to perform pin exposure calculations may cause either peak power exposure to exceed the Nuclear Regulatory Commission (NRC) expo- sure limit or lead to excessive conservatism and thus inefficient fuel utilization. In this work, a Monte Carlo based coupled depletion code (MCNP5/ORIGEN-S) is utilized to provide reference solutions in order to assess the accuracy of pin power and pin exposure reconstruc- tion methods in the current commercial and licensed three-dimensional (3D) nodal Light Water Reactor (LWR) core design codes. The developed at the Pennsylvania State University (PSU) MCNP5/ORIGEN-S coupled depletion code system was validated using measured data from the PSU TRIGA research reactor critical experiments. A number of test cases (modeling benchmarks) representative of LWRs were developed starting from the least complex model towards more complicated and more realistic models. The accuracy evaluation of the pin reconstruction methods was performed by using the CASMO-4 and SIMULATE-3 codes as the representative of current commercial LWR core design systems. Two-dimensional (2D) transport calculations with the TRITON module from the SCALE5 package were employed to produce the spectrum averaged cross-section libraries as a function of burnup for ORIGEN-S calculations. The burnup dependent cross-section libraries are specifically generated for each lattice configuration type. For the MCNP5 calculations continuous cross-section libraries for different isotopes at hot operating temperatures are generated and subsequently utilized. Realistic lattice configurations of the GE13 BWR fuel assemblies (unrodded and rodded) depleted under operating conditions were studied in this research because of their heterogeneous nature. The 2D model test cases are constructed prior to 3D model test cases to investigate in a consistent manner the approximations involved in pin reconstruction methods of the current commercial LWR core design codes. Discrepancies more than 11% were observed between the pin-wise power and exposure data calculated by the two different methods. The statistical uncertainties in the Monte Carlo calculations were analyzed and addressed. The statistical uncertainties in the MCNP5 results remain essentially less than 2% throughout the depletion history and there was no noticeable propagation with burnup. Ó 2007 Published by Elsevier Ltd. 1. Introduction The deregulated utility environment and better utiliza- tion of fuel assemblies in nuclear power plants has allowed designers to burn fuel assemblies to maximum allowable exposures. Any uncertainties, associated with the technical approach and numerical methods used to perform pin exposure calculations may cause either peak power expo- sure to exceed the Nuclear Regulatory Commission (NRC) exposure limit or lead to excessive conservatism and thus inefficient fuel utilization. The current NRC- 0306-4549/$ - see front matter Ó 2007 Published by Elsevier Ltd. doi:10.1016/j.anucene.2007.07.005 * Corresponding author. Tel.: +1 814 865 0040; fax: +1 814 865 8499. E-mail address: [email protected] (K. Ivanov). www.elsevier.com/locate/anucene Available online at www.sciencedirect.com Annals of Nuclear Energy 35 (2008) 414–424 annals of NUCLEAR ENERGY

Welcome message from author
This document is posted to help you gain knowledge. Please leave a comment to let me know what you think about it! Share it to your friends and learn new things together.
Transcript
Available online at www.sciencedirect.com
www.elsevier.com/locate/anucene
Annals of Nuclear Energy 35 (2008) 414–424
annals of
NUCLEAR ENERGY
Accuracy evaluation of pin exposure calculationsin current LWR core design codes
Vuyani Xulubana a, Chanatip Tippayakul a, Kostadin Ivanov a,*,Samuel H. Levine a, Moussa Mahgerefteh b
a Mechanical and Nuclear Engineering Department, Penn State University, 230 Reber Building, University Park,
State College, PA 16802, United Statesb Exelon Nuclear Company, 200 Exelon Way, Kennet Square, PA 19348, United States
Received 9 August 2006; received in revised form 10 July 2007; accepted 10 July 2007Available online 4 September 2007
Abstract
The deregulated utility environment and better utilization of fuel assemblies in nuclear power plants has allowed designers to burnfuel assemblies to maximum allowable exposures. Any uncertainties, associated with the technical approach and numerical methods usedto perform pin exposure calculations may cause either peak power exposure to exceed the Nuclear Regulatory Commission (NRC) expo-sure limit or lead to excessive conservatism and thus inefficient fuel utilization. In this work, a Monte Carlo based coupled depletion code(MCNP5/ORIGEN-S) is utilized to provide reference solutions in order to assess the accuracy of pin power and pin exposure reconstruc-tion methods in the current commercial and licensed three-dimensional (3D) nodal Light Water Reactor (LWR) core design codes. Thedeveloped at the Pennsylvania State University (PSU) MCNP5/ORIGEN-S coupled depletion code system was validated using measureddata from the PSU TRIGA research reactor critical experiments.
A number of test cases (modeling benchmarks) representative of LWRs were developed starting from the least complex modeltowards more complicated and more realistic models. The accuracy evaluation of the pin reconstruction methods was performed byusing the CASMO-4 and SIMULATE-3 codes as the representative of current commercial LWR core design systems. Two-dimensional(2D) transport calculations with the TRITON module from the SCALE5 package were employed to produce the spectrum averagedcross-section libraries as a function of burnup for ORIGEN-S calculations. The burnup dependent cross-section libraries are specificallygenerated for each lattice configuration type. For the MCNP5 calculations continuous cross-section libraries for different isotopes at hotoperating temperatures are generated and subsequently utilized.
Realistic lattice configurations of the GE13 BWR fuel assemblies (unrodded and rodded) depleted under operating conditions werestudied in this research because of their heterogeneous nature. The 2D model test cases are constructed prior to 3D model test cases toinvestigate in a consistent manner the approximations involved in pin reconstruction methods of the current commercial LWR coredesign codes. Discrepancies more than 11% were observed between the pin-wise power and exposure data calculated by the two differentmethods. The statistical uncertainties in the Monte Carlo calculations were analyzed and addressed. The statistical uncertainties in theMCNP5 results remain essentially less than 2% throughout the depletion history and there was no noticeable propagation with burnup.� 2007 Published by Elsevier Ltd.
1. Introduction
The deregulated utility environment and better utiliza-tion of fuel assemblies in nuclear power plants has allowed
0306-4549/$ - see front matter � 2007 Published by Elsevier Ltd.
doi:10.1016/j.anucene.2007.07.005
* Corresponding author. Tel.: +1 814 865 0040; fax: +1 814 865 8499.E-mail address: [email protected] (K. Ivanov).
designers to burn fuel assemblies to maximum allowableexposures. Any uncertainties, associated with the technicalapproach and numerical methods used to perform pinexposure calculations may cause either peak power expo-sure to exceed the Nuclear Regulatory Commission(NRC) exposure limit or lead to excessive conservatismand thus inefficient fuel utilization. The current NRC-
V. Xulubana et al. / Annals of Nuclear Energy 35 (2008) 414–424 415
approved maximum peak rod exposure is 62,000 MWD/MTU (the industry-planned extension for light water reac-tors (LWRs) for peak rod exposure is 75,000 MWD/MTU)while the maximum allowed peak pellet exposure is70,000 MWD/MTU. The important parameters, whichare calculated and compared against the limits, vary fromPressurized Water Reactors (PWRs) to Boiling WaterReactors (BWRs) and from US to Europe. For example,for PWRs usually the pin-averaged exposures are trackedas a function of depletion history. Those are importantfor both to check out the peak pin exposure against theexposure limit and for PWR fuel performance calculations.For BWRs in US the pin-segment exposures as a functionof depletion history are tracked for BWR fuel performancecalculations while in Europe the peak pellet exposures arechecked out against the limits. It is important in the dereg-ulated utility environment to operate reactors at their high-est possible power and to burn fuel assemblies to theirmaximum allowable exposure, thus it is important to eval-uate the accuracy of pin reconstruction methods used in thecommercial licensed nodal core design codes for LWRs.
In this work, a Monte Carlo based coupled depletioncode (MCNP5/ORIGEN-S) is utilized to provide referencesolutions in order to assess the accuracy of pin power andpin exposure reconstruction methods in the current com-mercial and licensed three-dimensional (3D) nodal LWRcore design codes. In order to operate a nuclear powerplant safely and effectively, it is essential to retain the peakpin powers and the peak pin exposures within the safetylimit required by the NRC. The determination of the pinpower distribution and pin exposure distribution of anuclear reactor is undoubtedly one of the important issuesin nuclear engineering. However, due to the complexity ofthe nuclear reactor and the problem size, the reactor corecalculation using pin-wise mesh size to obtain direct pinpowers and pin exposures is not computationally efficientat this time. In addition even if such direct pin-by-pin 3Dcalculations are feasible data reduction methods must beused since huge data base will be created if all the quantitiesof interest including pin segment exposures are saved. Anumber of methodologies have been developed andemployed in the current commercial LWR core designcodes to mitigate such calculation difficulties. While mostof the licensed LWR core design codes follow the samegeneral procedure to calculate pin-wise power distributionsand subsequently pin exposures they utilize differentapproaches and techniques to treat the approximationsinvolved in each step of the procedure. In this researchSIMULATE-3 and its pin-power and pin-exposure tech-niques are used as a representative of the current LWRdesign codes.
Consequently, a Monte Carlo based coupled depletioncalculation code system was developed at the PennsylvaniaState University (PSU) and used to quantify the uncertain-ties associated with pin reconstruction models in the cur-rent commercial LWR codes for analyzing GE13 BWRassemblies (single and 2 · 2 color set) under operating con-
ditions to provide core-like environments. The computersystem involves the coupling of the Monte Carlo neutronand photon transport code, MCNP5 (RSIC, 2003) with aversatile code for calculating the buildup and decay of nuc-lides in nuclear materials, ORIGEN-S (Hermann andWestfall, 2000). However, the ORIGEN-S calculation isbased on one-group cross-sections, which are dependanton the applied neutron spectrum. The normal general spec-trum applied in ORIGEN-S needs to be modified toaccount for the different neutron spectra occurring alongthe axial dimension of a BWR fuel assembly in an operat-ing power reactor. This is due not only to the large changesin the heterogeneity of the fuel assembly but also due to thelarge changes in the axial void distribution. Consequently,the TRITON module of the SCALE5 package (Dehart,2004) is utilized to generate the burnup dependent cross-section libraries for each lattice configuration type. Forthe MCNP5 calculations continuous cross-section librariesfor different isotopes at hot operating temperatures aregenerated and subsequently utilized.
Critical experiments were performed with the Penn StateTRIGA research reactor and the obtained measured datawas compared with the same calculated results from thedeveloped MCNP5/ORIGEN-S system. The critical con-figurations contained some depleted TRIGA fuel elements.The comparison was excellent.
The CASMO-4 (Edenius and Forsen, 1989) and SIMU-LATE-3 (Smith and Cronin, 1992) codes were used as therepresentative of the current commercial LWR core designcodes. A number of test cases (modeling benchmarks) rep-resentative of BWRs were developed starting from the leastcomplex model towards more complicated and more realis-tic models. Realistic lattice configurations of the GE13BWR fuel assemblies (unrodded and rodded) depletedunder operating conditions were studied in this researchbecause of their heterogeneous nature. The 2D model testcases are constructed prior to 3D model test cases to inves-tigate in a consistent manner the approximations involvedin pin reconstruction methods of the current commercialLWR core design codes. The predictions of the peak pinpowers and exposures obtained by the two code systemswere compared and analyzed.
2. MCNP5/ORIGEN-S interface code
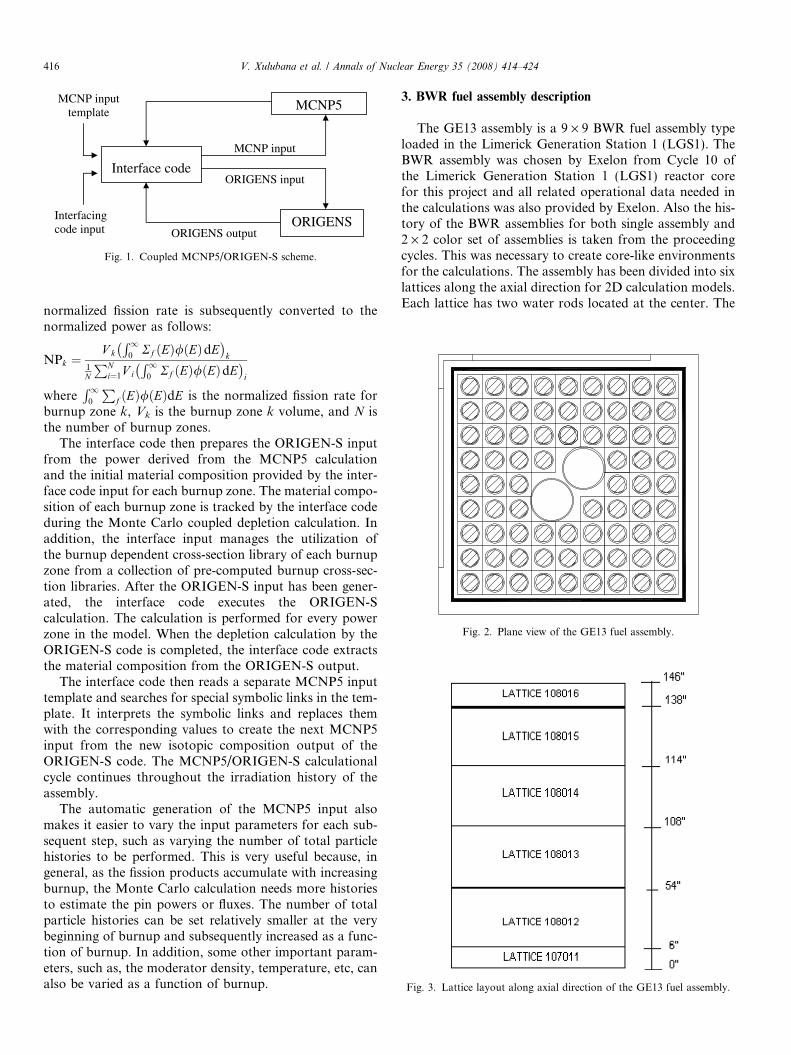
The coupling between the MCNP5 and ORIGEN-Srequires a great deal of data exchange. An interface codethat performs the coupling between these codes has beendeveloped to automatically perform the Monte Carlo cou-pled depletion calculation (see Fig. 1).
An initial MCNP5 input and a composition file areneeded to initialize the calculations at the onset. The inputfile also contains ORIGEN-S related input. The interfacecode then executes the MCNP5 calculation. When the cal-culation by MCNP5 code is completed, the interface codeextracts the normalized fission rate for each burnup zonefrom the tally file (one of the MCNP5 output files). The
MCNP5
Interfacing code input
MCNP input
ORIGENS input
ORIGENS ORIGENS output
Interface code
MCNP input template
Fig. 1. Coupled MCNP5/ORIGEN-S scheme.
Fig. 2. Plane view of the GE13 fuel assembly.
Fig. 3. Lattice layout along axial direction of the GE13 fuel assembly.
416 V. Xulubana et al. / Annals of Nuclear Energy 35 (2008) 414–424
normalized fission rate is subsequently converted to thenormalized power as follows:
NPk ¼V k
R10
Rf ðEÞ/ðEÞdE� �
k1N
PNi¼1V i
R10
Rf ðEÞ/ðEÞdE� �
i
whereR1
0
Pf ðEÞ/ðEÞdE is the normalized fission rate for
burnup zone k, Vk is the burnup zone k volume, and N isthe number of burnup zones.
The interface code then prepares the ORIGEN-S inputfrom the power derived from the MCNP5 calculationand the initial material composition provided by the inter-face code input for each burnup zone. The material compo-sition of each burnup zone is tracked by the interface codeduring the Monte Carlo coupled depletion calculation. Inaddition, the interface input manages the utilization ofthe burnup dependent cross-section library of each burnupzone from a collection of pre-computed burnup cross-sec-tion libraries. After the ORIGEN-S input has been gener-ated, the interface code executes the ORIGEN-Scalculation. The calculation is performed for every powerzone in the model. When the depletion calculation by theORIGEN-S code is completed, the interface code extractsthe material composition from the ORIGEN-S output.
The interface code then reads a separate MCNP5 inputtemplate and searches for special symbolic links in the tem-plate. It interprets the symbolic links and replaces themwith the corresponding values to create the next MCNP5input from the new isotopic composition output of theORIGEN-S code. The MCNP5/ORIGEN-S calculationalcycle continues throughout the irradiation history of theassembly.
The automatic generation of the MCNP5 input alsomakes it easier to vary the input parameters for each sub-sequent step, such as varying the number of total particlehistories to be performed. This is very useful because, ingeneral, as the fission products accumulate with increasingburnup, the Monte Carlo calculation needs more historiesto estimate the pin powers or fluxes. The number of totalparticle histories can be set relatively smaller at the verybeginning of burnup and subsequently increased as a func-tion of burnup. In addition, some other important param-eters, such as, the moderator density, temperature, etc, canalso be varied as a function of burnup.
3. BWR fuel assembly description
The GE13 assembly is a 9 · 9 BWR fuel assembly typeloaded in the Limerick Generation Station 1 (LGS1). TheBWR assembly was chosen by Exelon from Cycle 10 ofthe Limerick Generation Station 1 (LGS1) reactor corefor this project and all related operational data needed inthe calculations was also provided by Exelon. Also the his-tory of the BWR assemblies for both single assembly and2 · 2 color set of assemblies is taken from the proceedingcycles. This was necessary to create core-like environmentsfor the calculations. The assembly has been divided into sixlattices along the axial direction for 2D calculation models.Each lattice has two water rods located at the center. The

Fig. 4. Lattice model of the lattices of GE13 fuel assembly.
V. Xulubana et al. / Annals of Nuclear Energy 35 (2008) 414–424 417
assembly geometry is shown in Fig. 2 and its lattice layoutalong axial direction is shown in Fig. 3.
The heterogeneity inside the GE13 fuel assembly on thepin level due to burnable absorbers, enrichment profiling,void distribution, and different burn up patterns makes ita somewhat extreme model for the test case. The axial divi-sion of the assembly is based on the material properties ineach lattice, and differences in the water densities of the lat-tices are also modeled in the MCNP5 input.
4. Temperature dependent cross-section generation
The continuous energy treatment and the capability tomodel explicitly complex geometries in three-dimensionsmake the Monte Carlo calculation a powerful method fornuclear calculations. This is particularly true for suchhighly heterogeneous geometries as the GE13 fuel assemblyconsidered in this work.
In this work, the NJOY99.81 code was utilized to con-struct the continuous energy cross-sections from theENDF/B-VI data libraries. The temperature of interest isspecified in the cross-section generation process to accu-rately represent the neutron interactions and spectra atthe given temperature. Also, the Doppler-broadening isaccounted for at the specified temperature by one of themodules in the NJOY code.
Thus, utilizing the various modules of NJOY99.81, con-tinuous energy cross-section libraries at high temperature(775 K) were prepared for various isotopes. A total of 52fission products and actinides were considered and theseinclude uranium isotopes, plutonium, gadolinium (presentin some of the lattices) and some other important nuclides.
5. Burnup dependent cross-section library generation
In order to deplete each burnup zone correctly, the one-group averaged burnup cross-section library must be sup-plied to the ORIGEN-S code. The TRITON module ofthe SCALE5 package, is utilized for the generation of bur-nup depended cross-section libraries. The TRITON(Transport Rigor Implemented with Time-dependentOperation for Neutronic depletion) control module per-forms a two-dimensional analysis to generate the burnupcross-section library. The TRITON control module hasbeen designed around the two-dimensional (2D) arbitrarygeometry discrete ordinates transport code NEWT, whichis a multi-group discrete ordinates radiation transportcode. It has flexible meshing capabilities that allow two-dimensional (2D) neutron transport calculations usingcomplex geometric models.
The burnup cross-section methodology applied by TRI-TON starts with the input describing a fuel assembly as it isinitially loaded into a particular reactor. The material com-positions, temperatures, geometries and time-dependentspecific power of the fuel assembly are also required inthe input. For each burnup step, the TRITON controlmodule performs 2D neutron transport analysis via the
NEWT module. The NEWT module is used to create aone-group weighted library based on the calculated andvolume-averaged fluxes for each material mixture. Thenanother module of the SCALE package, COUPLE moduleis used to update the ORIGEN-S cross-section library withcross-section data read from the weighted library. Thus,the one-group cross-section data calculated by the NEWTfor each axial region is supplied to ORIGEN-S for deple-tion calculation. The TRITON control module uses a pre-dictor–corrector approach to update both fluxes and cross-sections as a function of burnup. The lattice model gener-ated by the TRITON control module is shown in Fig. 4.
The model utilizes the 44 group cross-section libraryfrom the SCALE5 package. Each fuel rod in the model isused as a burnup zone and the burnup cross-section libraryof each fuel rod is produced separately. The burnup cross-section library that tracks the neutron spectrum for eachburnup zone is more accurate than the zone-averagedcross-section library. However, the burnup cross-sectionlibrary for each burnup zone requires more memory spaceand it is more difficult to be used in the ORIGEN-S code.Thus it is necessary to use the interface code to handle thisfunction.
6. Benchmarking of coupled MCNP5/ORIGEN-S code
Since the Monte Carlo coupled depletion methodologyis used as the reference in this research, it is essential toquantify the accuracy of the method itself. Some bench-mark studies were performed to validate the Monte Carlomethod against the measurement at the PSU TRIGAresearch reactor (PSBR).
The TRIGSIM code was developed at PSU for fuelmanagement calculations of the TRIGA reactor and isbased on MCNP coupling to the ORIGEN code. Thus,in this work, the calculation performance of the TRIGSIMcode was validated against measurements performed at the
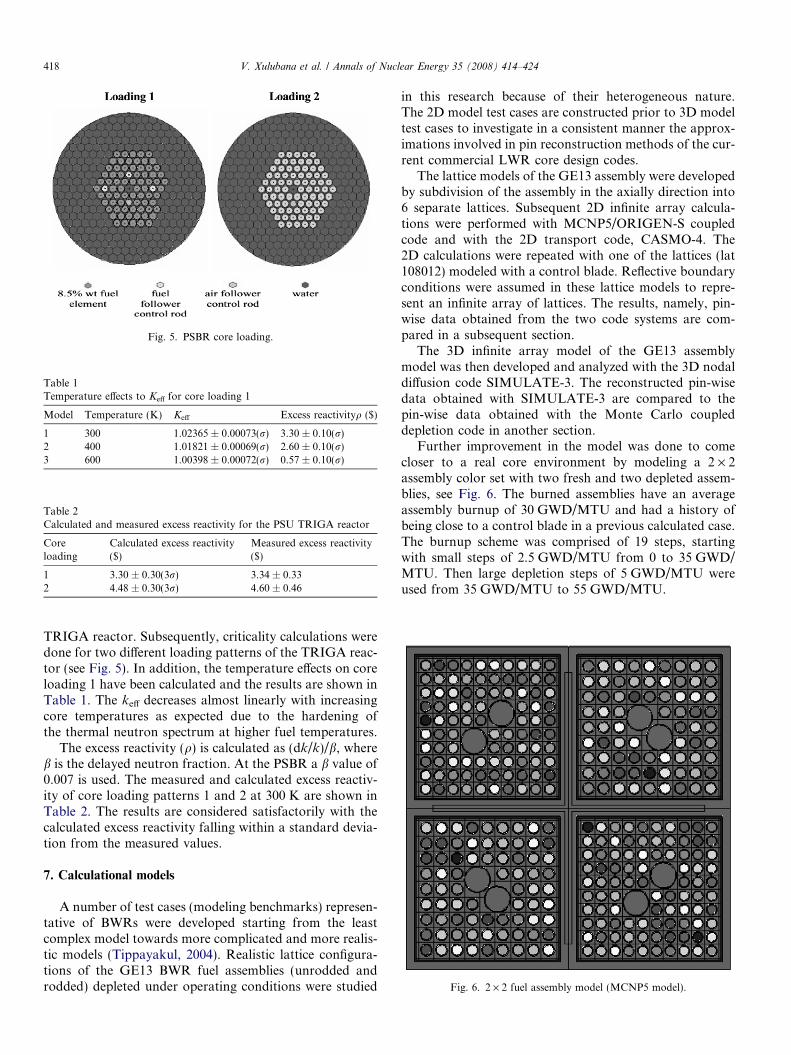
Fig. 5. PSBR core loading.
Table 1Temperature effects to Keff for core loading 1
Model Temperature (K) Keff Excess reactivityq ($)
1 300 1.02365 ± 0.00073(r) 3.30 ± 0.10(r)2 400 1.01821 ± 0.00069(r) 2.60 ± 0.10(r)3 600 1.00398 ± 0.00072(r) 0.57 ± 0.10(r)
Table 2Calculated and measured excess reactivity for the PSU TRIGA reactor
Coreloading
Calculated excess reactivity($)
Measured excess reactivity($)
1 3.30 ± 0.30(3r) 3.34 ± 0.332 4.48 ± 0.30(3r) 4.60 ± 0.46
Fig. 6. 2 · 2 fuel assembly model (MCNP5 model).
418 V. Xulubana et al. / Annals of Nuclear Energy 35 (2008) 414–424
TRIGA reactor. Subsequently, criticality calculations weredone for two different loading patterns of the TRIGA reac-tor (see Fig. 5). In addition, the temperature effects on coreloading 1 have been calculated and the results are shown inTable 1. The keff decreases almost linearly with increasingcore temperatures as expected due to the hardening ofthe thermal neutron spectrum at higher fuel temperatures.
The excess reactivity (q) is calculated as (dk/k)/b, whereb is the delayed neutron fraction. At the PSBR a b value of0.007 is used. The measured and calculated excess reactiv-ity of core loading patterns 1 and 2 at 300 K are shown inTable 2. The results are considered satisfactorily with thecalculated excess reactivity falling within a standard devia-tion from the measured values.
7. Calculational models
A number of test cases (modeling benchmarks) represen-tative of BWRs were developed starting from the leastcomplex model towards more complicated and more realis-tic models (Tippayakul, 2004). Realistic lattice configura-tions of the GE13 BWR fuel assemblies (unrodded androdded) depleted under operating conditions were studied
in this research because of their heterogeneous nature.The 2D model test cases are constructed prior to 3D modeltest cases to investigate in a consistent manner the approx-imations involved in pin reconstruction methods of the cur-rent commercial LWR core design codes.
The lattice models of the GE13 assembly were developedby subdivision of the assembly in the axially direction into6 separate lattices. Subsequent 2D infinite array calcula-tions were performed with MCNP5/ORIGEN-S coupledcode and with the 2D transport code, CASMO-4. The2D calculations were repeated with one of the lattices (lat108012) modeled with a control blade. Reflective boundaryconditions were assumed in these lattice models to repre-sent an infinite array of lattices. The results, namely, pin-wise data obtained from the two code systems are com-pared in a subsequent section.
The 3D infinite array model of the GE13 assemblymodel was then developed and analyzed with the 3D nodaldiffusion code SIMULATE-3. The reconstructed pin-wisedata obtained with SIMULATE-3 are compared to thepin-wise data obtained with the Monte Carlo coupleddepletion code in another section.
Further improvement in the model was done to comecloser to a real core environment by modeling a 2 · 2assembly color set with two fresh and two depleted assem-blies, see Fig. 6. The burned assemblies have an averageassembly burnup of 30 GWD/MTU and had a history ofbeing close to a control blade in a previous calculated case.The burnup scheme was comprised of 19 steps, startingwith small steps of 2.5 GWD/MTU from 0 to 35 GWD/MTU. Then large depletion steps of 5 GWD/MTU wereused from 35 GWD/MTU to 55 GWD/MTU.
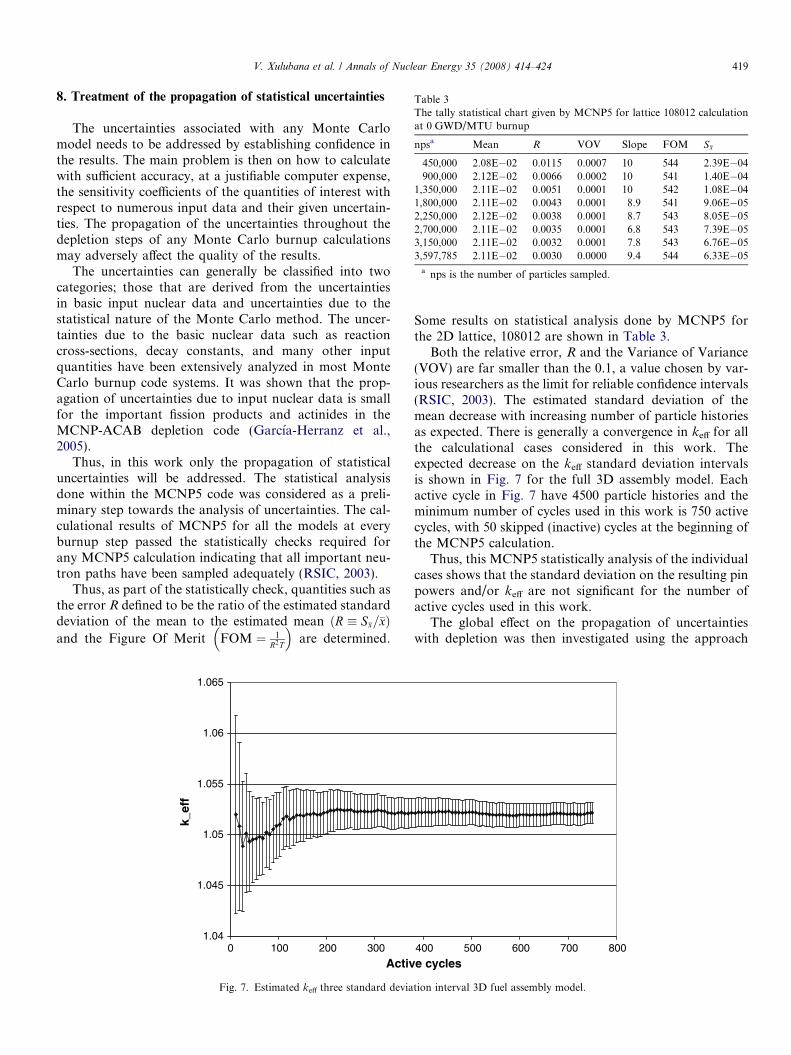
Table 3The tally statistical chart given by MCNP5 for lattice 108012 calculationat 0 GWD/MTU burnup
npsa Mean R VOV Slope FOM S�x
450,000 2.08E�02 0.0115 0.0007 10 544 2.39E�04900,000 2.12E�02 0.0066 0.0002 10 541 1.40E�04
1,350,000 2.11E�02 0.0051 0.0001 10 542 1.08E�041,800,000 2.11E�02 0.0043 0.0001 8.9 541 9.06E�052,250,000 2.12E�02 0.0038 0.0001 8.7 543 8.05E�052,700,000 2.11E�02 0.0035 0.0001 6.8 543 7.39E�053,150,000 2.11E�02 0.0032 0.0001 7.8 543 6.76E�053,597,785 2.11E�02 0.0030 0.0000 9.4 544 6.33E�05
a nps is the number of particles sampled.
V. Xulubana et al. / Annals of Nuclear Energy 35 (2008) 414–424 419
8. Treatment of the propagation of statistical uncertainties
The uncertainties associated with any Monte Carlomodel needs to be addressed by establishing confidence inthe results. The main problem is then on how to calculatewith sufficient accuracy, at a justifiable computer expense,the sensitivity coefficients of the quantities of interest withrespect to numerous input data and their given uncertain-ties. The propagation of the uncertainties throughout thedepletion steps of any Monte Carlo burnup calculationsmay adversely affect the quality of the results.
The uncertainties can generally be classified into twocategories; those that are derived from the uncertaintiesin basic input nuclear data and uncertainties due to thestatistical nature of the Monte Carlo method. The uncer-tainties due to the basic nuclear data such as reactioncross-sections, decay constants, and many other inputquantities have been extensively analyzed in most MonteCarlo burnup code systems. It was shown that the prop-agation of uncertainties due to input nuclear data is smallfor the important fission products and actinides in theMCNP-ACAB depletion code (Garcıa-Herranz et al.,2005).
Thus, in this work only the propagation of statisticaluncertainties will be addressed. The statistical analysisdone within the MCNP5 code was considered as a preli-minary step towards the analysis of uncertainties. The cal-culational results of MCNP5 for all the models at everyburnup step passed the statistically checks required forany MCNP5 calculation indicating that all important neu-tron paths have been sampled adequately (RSIC, 2003).
Thus, as part of the statistically check, quantities such asthe error R defined to be the ratio of the estimated standarddeviation of the mean to the estimated mean ðR � S�x=�xÞand the Figure Of Merit FOM ¼ 1
R2T
� �are determined.
1.04
1.045
1.05
1.055
1.06
1.065
0 100 200 300
Activ
k_ef
f
Fig. 7. Estimated keff three standard devia
Some results on statistical analysis done by MCNP5 forthe 2D lattice, 108012 are shown in Table 3.
Both the relative error, R and the Variance of Variance(VOV) are far smaller than the 0.1, a value chosen by var-ious researchers as the limit for reliable confidence intervals(RSIC, 2003). The estimated standard deviation of themean decrease with increasing number of particle historiesas expected. There is generally a convergence in keff for allthe calculational cases considered in this work. Theexpected decrease on the keff standard deviation intervalsis shown in Fig. 7 for the full 3D assembly model. Eachactive cycle in Fig. 7 have 4500 particle histories and theminimum number of cycles used in this work is 750 activecycles, with 50 skipped (inactive) cycles at the beginning ofthe MCNP5 calculation.
Thus, this MCNP5 statistically analysis of the individualcases shows that the standard deviation on the resulting pinpowers and/or keff are not significant for the number ofactive cycles used in this work.
The global effect on the propagation of uncertaintieswith depletion was then investigated using the approach
400 500 600 700 800
e cycles
tion interval 3D fuel assembly model.
Monte Carlo Determining
maximum and minimum pin
powers
Monte Carlo Determining
maximum and minimum pin
powers
DEPLETION 1
+3α
-3σ
+3σ
DEPLETION 2
MCNP MCNP
-3α
+3σ
-3σ
DEPLETION 1
DEPLETION 2
MCNP MCNP
MCNP
Depletion 1 = Burnup with maximum pin power
Depletion 2 = Burnup with minimum pin power
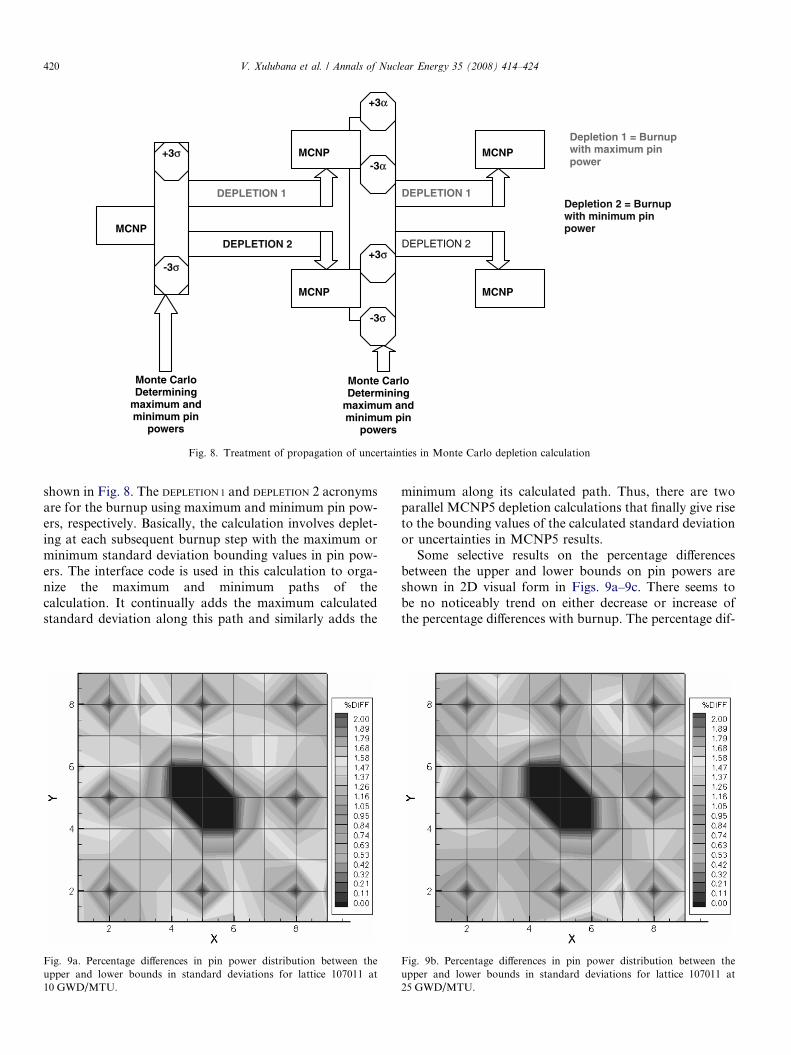
Fig. 8. Treatment of propagation of uncertainties in Monte Carlo depletion calculation
420 V. Xulubana et al. / Annals of Nuclear Energy 35 (2008) 414–424
shown in Fig. 8. The DEPLETION 1 and DEPLETION 2 acronymsare for the burnup using maximum and minimum pin pow-ers, respectively. Basically, the calculation involves deplet-ing at each subsequent burnup step with the maximum orminimum standard deviation bounding values in pin pow-ers. The interface code is used in this calculation to orga-nize the maximum and minimum paths of thecalculation. It continually adds the maximum calculatedstandard deviation along this path and similarly adds the
Fig. 9a. Percentage differences in pin power distribution between theupper and lower bounds in standard deviations for lattice 107011 at10 GWD/MTU.
minimum along its calculated path. Thus, there are twoparallel MCNP5 depletion calculations that finally give riseto the bounding values of the calculated standard deviationor uncertainties in MCNP5 results.
Some selective results on the percentage differencesbetween the upper and lower bounds on pin powers areshown in 2D visual form in Figs. 9a–9c. There seems tobe no noticeably trend on either decrease or increase ofthe percentage differences with burnup. The percentage dif-
Fig. 9b. Percentage differences in pin power distribution between theupper and lower bounds in standard deviations for lattice 107011 at25 GWD/MTU.
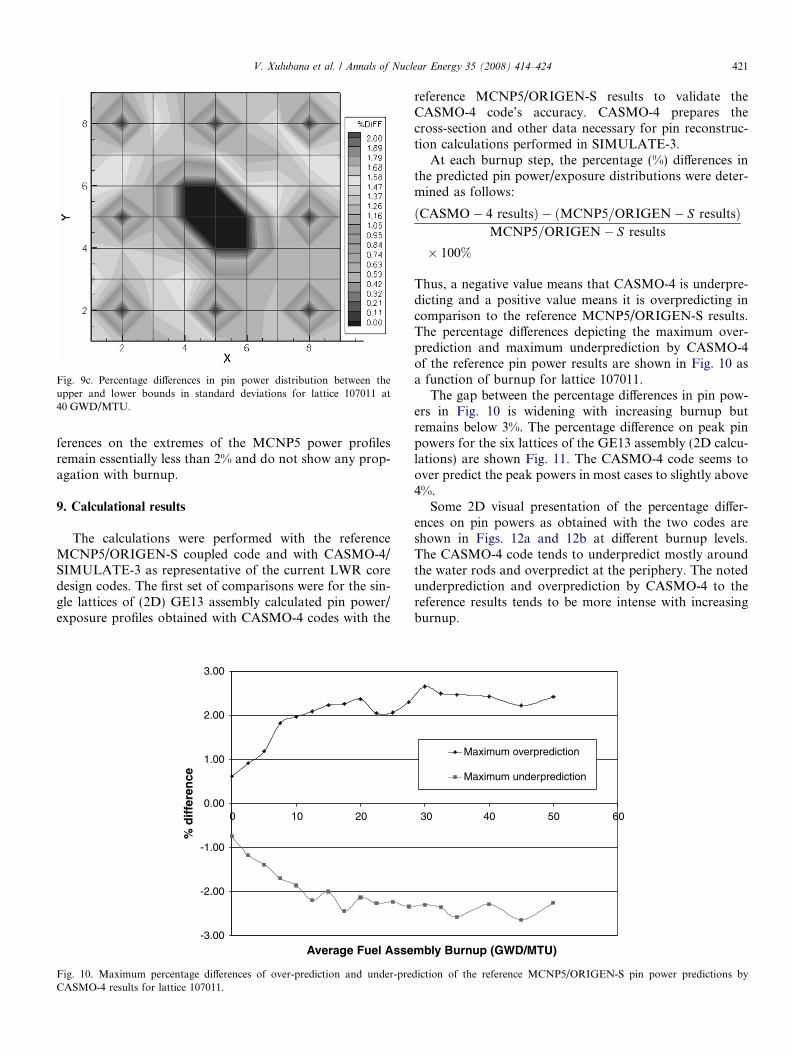
Fig. 9c. Percentage differences in pin power distribution between theupper and lower bounds in standard deviations for lattice 107011 at40 GWD/MTU.
V. Xulubana et al. / Annals of Nuclear Energy 35 (2008) 414–424 421
ferences on the extremes of the MCNP5 power profilesremain essentially less than 2% and do not show any prop-agation with burnup.
9. Calculational results
The calculations were performed with the referenceMCNP5/ORIGEN-S coupled code and with CASMO-4/SIMULATE-3 as representative of the current LWR coredesign codes. The first set of comparisons were for the sin-gle lattices of (2D) GE13 assembly calculated pin power/exposure profiles obtained with CASMO-4 codes with the
-3.00
-2.00
-1.00
0.00
1.00
2.00
3.00
0 10 20
Average Fuel Asse
% d
iffe
ren
ce
Fig. 10. Maximum percentage differences of over-prediction and under-preCASMO-4 results for lattice 107011.
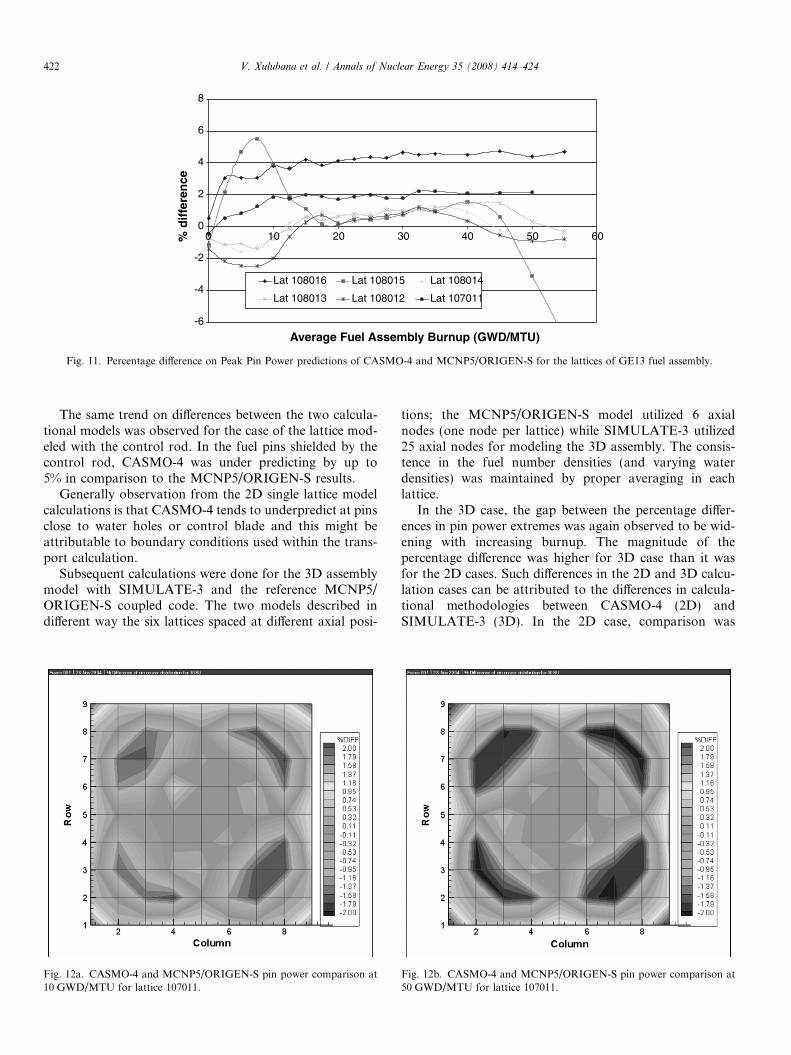
reference MCNP5/ORIGEN-S results to validate theCASMO-4 code’s accuracy. CASMO-4 prepares thecross-section and other data necessary for pin reconstruc-tion calculations performed in SIMULATE-3.
At each burnup step, the percentage (%) differences inthe predicted pin power/exposure distributions were deter-mined as follows:
ðCASMO� 4 resultsÞ � ðMCNP5=ORIGEN� S resultsÞMCNP5=ORIGEN� S results
� 100%
Thus, a negative value means that CASMO-4 is underpre-dicting and a positive value means it is overpredicting incomparison to the reference MCNP5/ORIGEN-S results.The percentage differences depicting the maximum over-prediction and maximum underprediction by CASMO-4of the reference pin power results are shown in Fig. 10 asa function of burnup for lattice 107011.
The gap between the percentage differences in pin pow-ers in Fig. 10 is widening with increasing burnup butremains below 3%. The percentage difference on peak pinpowers for the six lattices of the GE13 assembly (2D calcu-lations) are shown Fig. 11. The CASMO-4 code seems toover predict the peak powers in most cases to slightly above4%.
Some 2D visual presentation of the percentage differ-ences on pin powers as obtained with the two codes areshown in Figs. 12a and 12b at different burnup levels.The CASMO-4 code tends to underpredict mostly aroundthe water rods and overpredict at the periphery. The notedunderprediction and overprediction by CASMO-4 to thereference results tends to be more intense with increasingburnup.
30 40 50 60
mbly Burnup (GWD/MTU)
Maximum overprediction
Maximum underprediction
diction of the reference MCNP5/ORIGEN-S pin power predictions by
-6
-4
-2
0
2
4
6
8
0 10 20 30 40 50 60
Average Fuel Assembly Burnup (GWD/MTU)
% d
iffe
ren
ce
Lat 108016 Lat 108015 Lat 108014
Lat 108013 Lat 108012 Lat 107011
Fig. 11. Percentage difference on Peak Pin Power predictions of CASMO-4 and MCNP5/ORIGEN-S for the lattices of GE13 fuel assembly.
422 V. Xulubana et al. / Annals of Nuclear Energy 35 (2008) 414–424
The same trend on differences between the two calcula-tional models was observed for the case of the lattice mod-eled with the control rod. In the fuel pins shielded by thecontrol rod, CASMO-4 was under predicting by up to5% in comparison to the MCNP5/ORIGEN-S results.
Generally observation from the 2D single lattice modelcalculations is that CASMO-4 tends to underpredict at pinsclose to water holes or control blade and this might beattributable to boundary conditions used within the trans-port calculation.
Subsequent calculations were done for the 3D assemblymodel with SIMULATE-3 and the reference MCNP5/ORIGEN-S coupled code. The two models described indifferent way the six lattices spaced at different axial posi-
Fig. 12a. CASMO-4 and MCNP5/ORIGEN-S pin power comparison at10 GWD/MTU for lattice 107011.
tions; the MCNP5/ORIGEN-S model utilized 6 axialnodes (one node per lattice) while SIMULATE-3 utilized25 axial nodes for modeling the 3D assembly. The consis-tence in the fuel number densities (and varying waterdensities) was maintained by proper averaging in eachlattice.
In the 3D case, the gap between the percentage differ-ences in pin power extremes was again observed to be wid-ening with increasing burnup. The magnitude of thepercentage difference was higher for 3D case than it wasfor the 2D cases. Such differences in the 2D and 3D calcu-lation cases can be attributed to the differences in calcula-tional methodologies between CASMO-4 (2D) andSIMULATE-3 (3D). In the 2D case, comparison was
Fig. 12b. CASMO-4 and MCNP5/ORIGEN-S pin power comparison at50 GWD/MTU for lattice 107011.
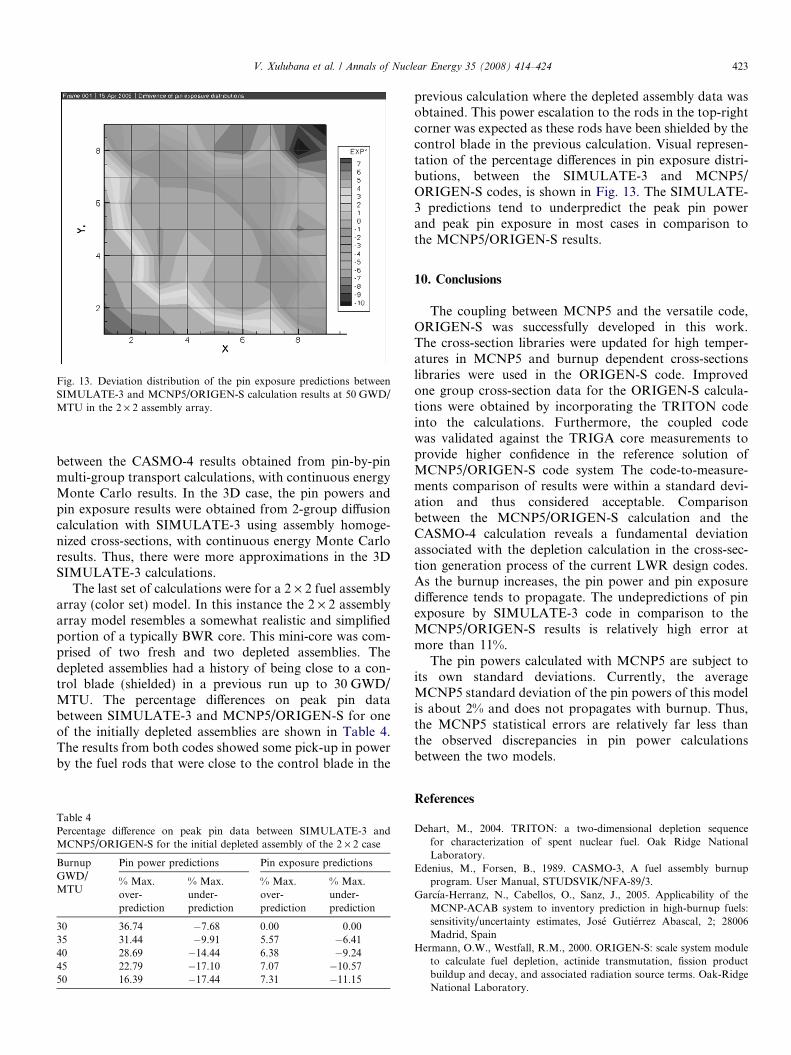
Fig. 13. Deviation distribution of the pin exposure predictions betweenSIMULATE-3 and MCNP5/ORIGEN-S calculation results at 50 GWD/MTU in the 2 · 2 assembly array.
V. Xulubana et al. / Annals of Nuclear Energy 35 (2008) 414–424 423
between the CASMO-4 results obtained from pin-by-pinmulti-group transport calculations, with continuous energyMonte Carlo results. In the 3D case, the pin powers andpin exposure results were obtained from 2-group diffusioncalculation with SIMULATE-3 using assembly homoge-nized cross-sections, with continuous energy Monte Carloresults. Thus, there were more approximations in the 3DSIMULATE-3 calculations.
The last set of calculations were for a 2 · 2 fuel assemblyarray (color set) model. In this instance the 2 · 2 assemblyarray model resembles a somewhat realistic and simplifiedportion of a typically BWR core. This mini-core was com-prised of two fresh and two depleted assemblies. Thedepleted assemblies had a history of being close to a con-trol blade (shielded) in a previous run up to 30 GWD/MTU. The percentage differences on peak pin databetween SIMULATE-3 and MCNP5/ORIGEN-S for oneof the initially depleted assemblies are shown in Table 4.The results from both codes showed some pick-up in powerby the fuel rods that were close to the control blade in the
Table 4Percentage difference on peak pin data between SIMULATE-3 andMCNP5/ORIGEN-S for the initial depleted assembly of the 2 · 2 case
BurnupGWD/MTU
Pin power predictions Pin exposure predictions
% Max.over-prediction
% Max.under-prediction
% Max.over-prediction
% Max.under-prediction
30 36.74 �7.68 0.00 0.0035 31.44 �9.91 5.57 �6.4140 28.69 �14.44 6.38 �9.2445 22.79 �17.10 7.07 �10.5750 16.39 �17.44 7.31 �11.15
previous calculation where the depleted assembly data wasobtained. This power escalation to the rods in the top-rightcorner was expected as these rods have been shielded by thecontrol blade in the previous calculation. Visual represen-tation of the percentage differences in pin exposure distri-butions, between the SIMULATE-3 and MCNP5/ORIGEN-S codes, is shown in Fig. 13. The SIMULATE-3 predictions tend to underpredict the peak pin powerand peak pin exposure in most cases in comparison tothe MCNP5/ORIGEN-S results.
10. Conclusions
The coupling between MCNP5 and the versatile code,ORIGEN-S was successfully developed in this work.The cross-section libraries were updated for high temper-atures in MCNP5 and burnup dependent cross-sectionslibraries were used in the ORIGEN-S code. Improvedone group cross-section data for the ORIGEN-S calcula-tions were obtained by incorporating the TRITON codeinto the calculations. Furthermore, the coupled codewas validated against the TRIGA core measurements toprovide higher confidence in the reference solution ofMCNP5/ORIGEN-S code system The code-to-measure-ments comparison of results were within a standard devi-ation and thus considered acceptable. Comparisonbetween the MCNP5/ORIGEN-S calculation and theCASMO-4 calculation reveals a fundamental deviationassociated with the depletion calculation in the cross-sec-tion generation process of the current LWR design codes.As the burnup increases, the pin power and pin exposuredifference tends to propagate. The undepredictions of pinexposure by SIMULATE-3 code in comparison to theMCNP5/ORIGEN-S results is relatively high error atmore than 11%.
The pin powers calculated with MCNP5 are subject toits own standard deviations. Currently, the averageMCNP5 standard deviation of the pin powers of this modelis about 2% and does not propagates with burnup. Thus,the MCNP5 statistical errors are relatively far less thanthe observed discrepancies in pin power calculationsbetween the two models.
References
Dehart, M., 2004. TRITON: a two-dimensional depletion sequencefor characterization of spent nuclear fuel. Oak Ridge NationalLaboratory.
Edenius, M., Forsen, B., 1989. CASMO-3, A fuel assembly burnupprogram. User Manual, STUDSVIK/NFA-89/3.
Garcıa-Herranz, N., Cabellos, O., Sanz, J., 2005. Applicability of theMCNP-ACAB system to inventory prediction in high-burnup fuels:sensitivity/uncertainty estimates, Jose Gutierrez Abascal, 2; 28006Madrid, Spain
Hermann, O.W., Westfall, R.M., 2000. ORIGEN-S: scale system moduleto calculate fuel depletion, actinide transmutation, fission productbuildup and decay, and associated radiation source terms. Oak-RidgeNational Laboratory.

424 V. Xulubana et al. / Annals of Nuclear Energy 35 (2008) 414–424
MacFarlane, R.E., NJOY 99.81 Code system for producing point-wiseand multi-group neutron and photon cross-sections from ENDF/Bdata, Los Alamos, NM.
RSIC Computer Code Collection, April 2003, MCNP5 Monte Carlo N-particle transport code system, Oak Ridge National Laboratory.
Smith, K., Cronin, J., 1992. SIMULATE-3Methodology, STUDSVIK/SOA-92/02.
Tippayakul, C., Levine, S., Ivanov, K., Wolfgang, R.J., Mahgerefteh, M.,2004. Accuracy evaluation of pin exposure calculations in currentLWR core design codes (Phase 1). TANSAO, vol. 91, pp. 716–718.
Related Documents