TRITA-LWR Degree Project 12:34 ISSN 1651-064X LWR-EX-12-34 STUDY OF NITROGEN REMOVAL RATE AND TROUBLESHOOTING OF PILOT PLANT ITEST Venkata Krishna Reddy Yatham Jun 2012

Lwr ex 12 34
Apr 07, 2016
http://www.sjostadsverket.se/download/18.50367b6c13a6fda0152153a/1351707088523/LWR_EX_12_34.pdf
Welcome message from author
This document is posted to help you gain knowledge. Please leave a comment to let me know what you think about it! Share it to your friends and learn new things together.
Transcript
TRITA-LWR Degree Project 12:34 ISSN 1651-064X LWR-EX-12-34
STUDY OF NITROGEN REMOVAL RATE AND
TROUBLESHOOTING OF PILOT PLANT ITEST
Venkata Krishna Reddy Yatham
Jun 2012
Venkata Krishna Reddy Yatham TRITA-LWR Degree Project 12:34
ii
© Venkata Krishna Reddy Yatham 2012 Degree Project for the master degree program Water System Technology Department of Land and Water Resources Engineering Royal Institute of Technology (KTH) SE-100 44 STOCKHOLM, Sweden Reference to this publication should be written as: Yatham, V K R (2012) “Study of Nitrogen Removal Rate and Trouble shooting of Pilot plant (ITEST)” TRITA LWR Degree Project
Study of Nitrogen Removal Rate and Trouble shooting of Pilot plant (ITEST)
iii
SAMMANFATTNING Denna avhandling handlar om att förbättra effektiviteten för avlägsning av kväve och andra organiska näringsämnen vid rening med aktivt slamprocessen genom att introduktion av ny innovativ teknik. Arbetet handlar om att studera förändringarna i kväverening vid pilotskaleförsök med försöksenheten ITEST. Rapporten beskriver även olika källor som bidrar till övergödningen av hav och vatten som orsakas av en ökning av näringsämnesnivåer i olika vattenområden. Ineffektiv rening av avloppsvatten bidrar till övergödningen. I Östersjöområdet är temperaturen noll (0) eller mindre än noll grader Celsius under vintersäsongen. Detta resulterar i lägre temperaturer på inkommande vatten till reningsverken. Arbetet fokuserar på förbättring och optimering av kvävereningen genom att hålla konstant temperatur hela året. Temperaturen är en viktig parameter för reningsprocesser för avloppsvatten. Bakteriologisk nitrifikation och denitrifikation är en effektiv process för att avlägsna kväve från avloppsvatten. Av olika forskningsarbeten och artiklar, framkommer att 23 +/- 2 °C är den optimala temperaturen för nitrifikations- och denitrifikationsprocesser. Arbetet är i huvudsak inriktat på att bibehålla en optimal konstant temperatur under hela året genom att tillhandahålla en yttre värmekällan. Med hjälp av värmeväxlare hålls temperaturen inom ett konstant intervall. I denna studie användes två linjer med aktiv slamprocessen där en är försökslinje med konstant temperatur och den andra är referenslinje. Då det främsta syftet vid försöken är att hålla temperaturen på inkommande avloppsvatten konstant, används värmeväxlare för inkommande avlopp i pilotanläggningens testlinje för att hålla en temperatur på 19 till 20 °C i inkommande avlopp till försökslinjen. I referenslinjen var temperaturen densamma som inkommande kommunalt avloppsvatten. Övriga parametrar som pH var densamma i bägge linjerna. Effektiviteten för kvävereningen jämfördes mellan de två linjerna under en testperiod på mer än 8 månader. Även andra biologiska aktiviteter i behandlingsprocessen jämfördes mellan de två linjerna.

Venkata Krishna Reddy Yatham TRITA-LWR Degree Project 12:34
iv
Study of Nitrogen Removal Rate and Trouble shooting of Pilot plant (ITEST)
v
ACKNOWLEDGEMENT First of all, I would like to thank my supervisor Erik K Levlin, who gave me the opportunity to take part in a very interesting research project. I really appreciate his suggestions, support and encouragement all the time to do the research oriented investigation during the project. His wisdom and strong faith about new technologies in sewage treatment always inspires me to rethink what already exists and explore unknown things. I specially want to thank department head professor Elzbieta Plaza, who gave me the chance to do my thesis work in the field of water, sewage and waste technology. And also Per Olof Persson who supported me by providing the microscope to the IVL. I also want to express my gratitude to Christian Baresel, Lars Bengtsson and Mila Harding in Hammarby Sjöstad research station. They spent so much of time to help me and to make me familiarize with the pilot plant equipment and for their extreme patience in solving the technical problems and theoretical doubts. I am grateful to JingJing yang, Andriy Malovanyy, and Klara who gave the suggestions while doing the analysis in the IVL. I am so happy while working in the IVL with Kunyu Wang for his sharing of theoretical and practical knowledge. Finally, to my parents for their immense love and support towards me, without my parents I will not be here.

Venkata Krishna Reddy Yatham TRITA-LWR Degree Project 12:34
vi
Study of Nitrogen Removal Rate and Trouble shooting of Pilot plant (ITEST)
vii
TABLE OF CONTENT Sammanfattning .....................................................................................................................iii Acknowledgement ................................................................................................................... v Table of Content .................................................................................................................... vii Abstract .................................................................................................................................... 1 Introduction ............................................................................................................................. 1
Adverse impact of nitrogen on the environment ............................................................. 2 Standard requirements for nitrogen removal from WWT ............................................... 2 Occurrence of nitrogen in the environment ..................................................................... 2 Nitrogen cycle .................................................................................................................... 3
Nitrogen fixation .......................................................................................................................... 3 Ammonification ........................................................................................................................... 3 Synthesis ...................................................................................................................................... 3 Nitrification .................................................................................................................................. 4 Denitrification .............................................................................................................................. 4
Eutrophication ................................................................................................................... 4 Effects of eutrophication to aquatic environment ........................................................... 6 Effects of the eutrophication to environment .................................................................. 6 Different sources causing eutrophication ........................................................................ 6
Agriculture ................................................................................................................................... 7 Municipal waste water .................................................................................................................. 8 Industrial land-based sources ........................................................................................................ 8 Transport ..................................................................................................................................... 9
Pilot plant of ITEST ............................................................................................................... 9 Description of the Pilot plant ............................................................................................ 9 Operation of Pilot plant ................................................................................................... 10
Primary sedimentation .................................................................................................................10 An-aerobic treatment (Denitrification) .........................................................................................11 Aerobic treatment (Nitrification) .................................................................................................11 Secondary sedimentation .............................................................................................................12
Operational parameters ................................................................................................... 12 Temperature ................................................................................................................................12 pH ..............................................................................................................................................12
Methods and materials ......................................................................................................... 13 Laboratory equipment ..................................................................................................... 13 Calculation analysis of Nitrogen Nitrate (NO3--N), Ammonium Nitrate (NH4+-N) and Total nitrogen (TN) using cuvette test ................................................................... 13
Procedure ....................................................................................................................................14 Spectrophotometer ........................................................................................................... 14 Incubator .......................................................................................................................... 15 Suspended Solids ............................................................................................................. 16 Electronic measurement for weighing ........................................................................... 16 Total nitrogen ................................................................................................................... 18 Sludge Volume ................................................................................................................. 19 Sludge volume index ........................................................................................................ 19
Venkata Krishna Reddy Yatham TRITA-LWR Degree Project 12:34
viii
Results .................................................................................................................................... 20 Nitrate (No3 - N) ............................................................................................................. 20 Ammonium (NH4 - N).................................................................................................... 21 Suspended Solids (SS) ...................................................................................................... 22 Sludge volume (SV) .......................................................................................................... 23 Temperature ..................................................................................................................... 24 Total nitrogen (Total N) .................................................................................................. 25
Discussions ............................................................................................................................ 25 Troubleshooting of Pilot Plant ........................................................................................ 26
Escaping of biological sludge .......................................................................................................26 Improper readings of oxygen meters ...........................................................................................26 Sludge floating .............................................................................................................................26 Detecting of the electrochemical reactions of different materials while passing the wastewater through heating system ................................................................................................................26
Analysis of the nutrient removal ..................................................................................... 26 Nitrate .........................................................................................................................................27 Ammonium .................................................................................................................................27 Suspended solids .........................................................................................................................27 Sludge volume .............................................................................................................................27 Total nitrogen .............................................................................................................................27 Temperature ................................................................................................................................27 pH ..............................................................................................................................................28
Conclusions ........................................................................................................................... 28 References .............................................................................................................................. 29 appendix ................................................................................................................................. II
A. Nitrogen-Nitrate readings measured values during the project ......................... II B. Ammonium readings for (incoming, reference and temperature lines) measured/calculated values during the project............................................................ III C. Sludge volume readings for (reference and temperature lines) measured/calculated values during the project............................................................ IV D. Temperature readings for (reference and temperature lines) measured/calculated values during the project.............................................................. V E. Suspended solids readings for (reference and temperature lines) measured/calculated values during the project............................................................ VI F. Sludge volume index readings for (reference and temperance lines) measured/calculated values during the project........................................................... VII G. Total nitrogen readings for (incoming, reference and temperature lines) measured/calculated values during the project......................................................... VIII

Study of Nitrogen Removal Rate and Trouble shooting of Pilot plant (ITEST)
1
ABSTRACT This paper is about improving the efficiency of nitrogen and other organic nutrient removal from activated sewage treatment by adopting an innovative technology. The work is to study the changes in nitrogen removal in pilot-scale experiments with the ITEST unit. The report also describes the various sources contributing to the eutrophication of the sea and water, caused by an increase in nutrient levels in different water bodies. Ineffective treatment of sewage contributes to the eutrophication. In the Baltic regions the temperature will be zero (0) or less than zero degree-centigrade during winter season. It results in decreased or fall in temperatures of incoming water to wastewater treatment plants. The temperature is an important parameter for sewage/wastewater treatment processes. Bacteriological nitrification and denitrification is an effective process for removing nitrogen from wastewater. From various research works and articles, it can be found that 23 + / - 2 °C, is the optimum temperature for nitrification and denitrification processes. So, the main aim is to study the effect of maintaining the incoming wastewater temperature by use of heat exchangers on incoming water to an activated sludge process line in pilot plant scale. In the pilot plant there were two testing lines; one line with heating system and the second line without heating system. A temperature of 19 to 20 °C was maintained in the influent to testing line. The nitrogen removal rates were compared between the two lines during the test period of approximately more than 8 months. Other biological activities in the treatment process were also compared between the two lines.
Key words: Nitrification, Denitrification, Eutrophication, Activated sludge processes, Temperature, pH, Cuvette and Spectrophotometer
INTRODUCTION Being in the 21st century, the important challenges faced by mankind is to save fresh water resources from contamination. In order to acquire adequate potable water for the rapidly growing population, and to support the adequate quantity and quality of the water for different other purposes like agricultural production, industrial development and other related sectors, it is essential to improve treatment of waste water. To fulfil these, the major challenge is to minimize the eutrophication in different water bodies. Nitrogen and phosphorus are the major nutrients to cause eutrophication of natural water bodies, to overcome this problem the removal of nutrients from the wastewater during the wastewater treatment processes has more importance, this not only leads to eutrophication but also high concentration of nitrogen will affect the public health and also navigates various ecologically adverse impacts. Biological waste water treatment has positive and friendly environmental results in nutrients removal (removal of nitrogen and phosphorus etc.). Compared to other treatment methods, Biological wastewater treatment processes is mainly for nutrients removal. When efficient biological processes take place, then we can expect the maximum removal of nutrients and it will be possible. For that, the temperature is one of the main influencing factors on biological treatment processes. In general 99% of Sewage is characterized by its volume, physical condition, chemical contamination and biological content. Activated sludge is a process for treating sewage and industrial waste water using air and a biological flock composed of bacteria and protozoans.
Venkata Krishna Reddy Yatham TRITA-LWR Degree Project 12:34
2
Adverse impact of nitrogen on the environment Nitrogen is an elemental and compound nutrient; this substance of nutrient allows negative effects on water sources, environmental and human systems. • Health effects from drinking groundwater contaminated with nitrates • Surface water pollution with nitrogen. • Environmental affects by increasing nitrogen oxides quantity in air.
Standard requirements for nitrogen removal from WWT Council Directive 91/271/EEC concerning urban waste water treatment was adopted on 21 may 1991. It is to protect the water environment form the adverse effects of discharge of urban wastewater and from certain industrial discharges. After 1991 again on 27 of February 1998 the commission issued directive 98/15/EC amending directive 91/271/EEC. It clarifies the requirements of the directive in relation to discharges from urban wastewater treatment plants to sensitive areas which are subjected to eutrophication.
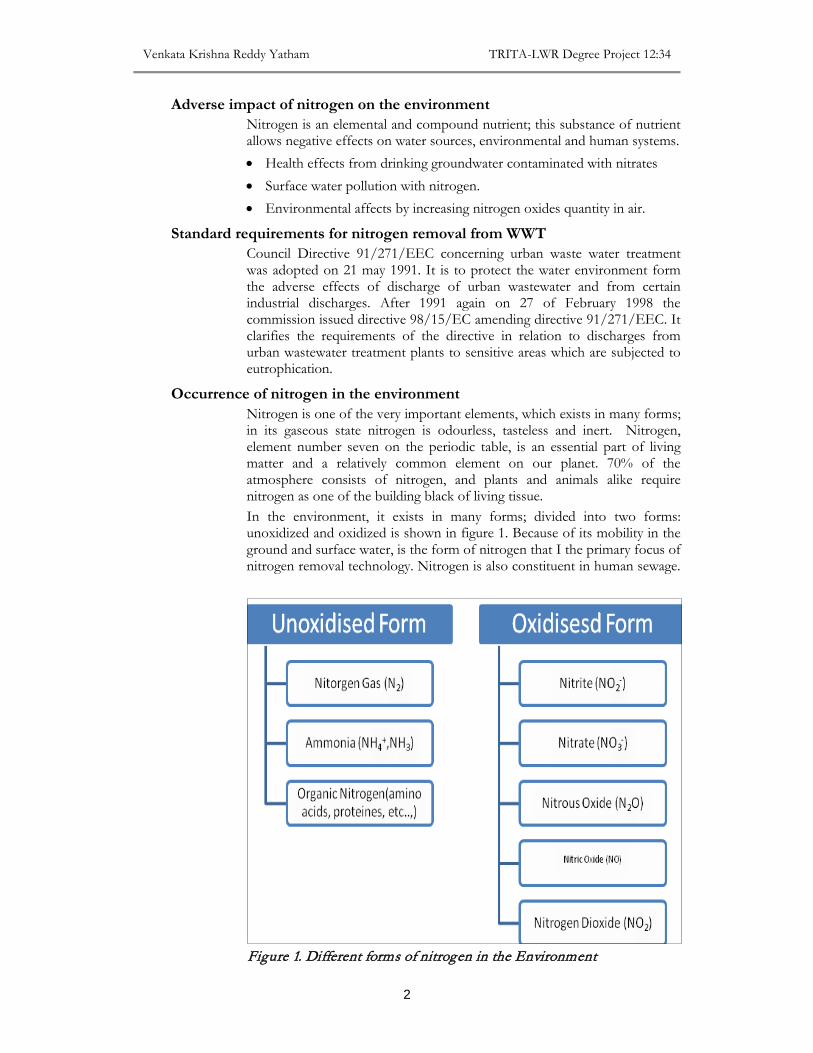
Occurrence of nitrogen in the environment Nitrogen is one of the very important elements, which exists in many forms; in its gaseous state nitrogen is odourless, tasteless and inert. Nitrogen, element number seven on the periodic table, is an essential part of living matter and a relatively common element on our planet. 70% of the atmosphere consists of nitrogen, and plants and animals alike require nitrogen as one of the building black of living tissue. In the environment, it exists in many forms; divided into two forms: unoxidized and oxidized is shown in figure 1. Because of its mobility in the ground and surface water, is the form of nitrogen that I the primary focus of nitrogen removal technology. Nitrogen is also constituent in human sewage.
Figure 1. Different forms of nitrogen in the Environment
Study of Nitrogen Removal Rate and Trouble shooting of Pilot plant (ITEST)
3
The principle forms of nitrogen with regards to on site wastewater treatment and soil-groundwater interactions are organic nitrogen, before it is used by the plants, takes part of many processes and it is component of many biomolecules such as amino acid, nucleotide and nucleic acids.
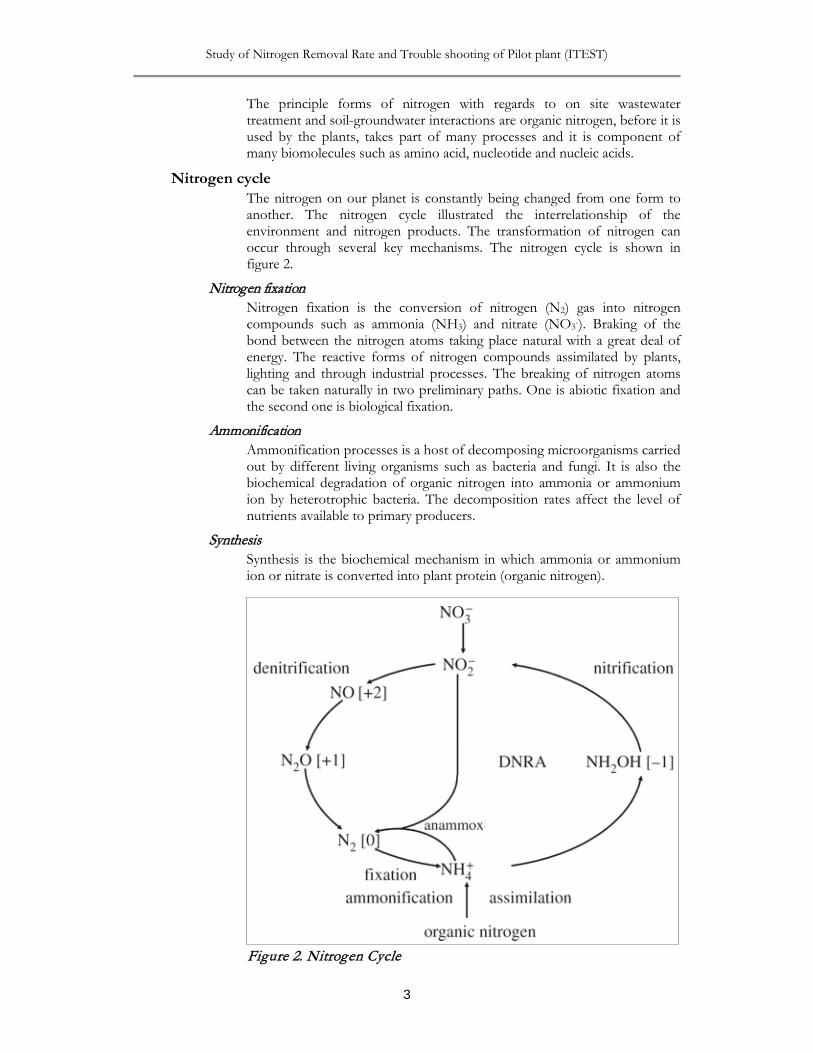
Nitrogen cycle The nitrogen on our planet is constantly being changed from one form to another. The nitrogen cycle illustrated the interrelationship of the environment and nitrogen products. The transformation of nitrogen can occur through several key mechanisms. The nitrogen cycle is shown in figure 2.
Nitrogen fixation Nitrogen fixation is the conversion of nitrogen (N2) gas into nitrogen compounds such as ammonia (NH3) and nitrate (NO3-). Braking of the bond between the nitrogen atoms taking place natural with a great deal of energy. The reactive forms of nitrogen compounds assimilated by plants, lighting and through industrial processes. The breaking of nitrogen atoms can be taken naturally in two preliminary paths. One is abiotic fixation and the second one is biological fixation.
Ammonification Ammonification processes is a host of decomposing microorganisms carried out by different living organisms such as bacteria and fungi. It is also the biochemical degradation of organic nitrogen into ammonia or ammonium ion by heterotrophic bacteria. The decomposition rates affect the level of nutrients available to primary producers.
Synthesis Synthesis is the biochemical mechanism in which ammonia or ammonium ion or nitrate is converted into plant protein (organic nitrogen).
Figure 2. Nitrogen Cycle
Venkata Krishna Reddy Yatham TRITA-LWR Degree Project 12:34
4
Nitrification Nitrification is the processes by which ammonia is oxidized into nitrite ions and then nitrate ions, which is the form most usually by plants. The two groups of microorganism are involved in this process are Nitrosomas and Nitrobacter. It is explained in detail in pilot plant part operations.
Denitrification The biological reduction of nitrates (NO3) are reduced to nitrogen gas (N2) under the absence of oxygen is called denitrification. This process occurs by facultative anaerobes in anaerobic environment conditions. Farmers with waterlogged fields and soils that have high clay content are especially vulnerable to nitrogen losses due to denitrification. It is also explained in detail in pilot plant part.
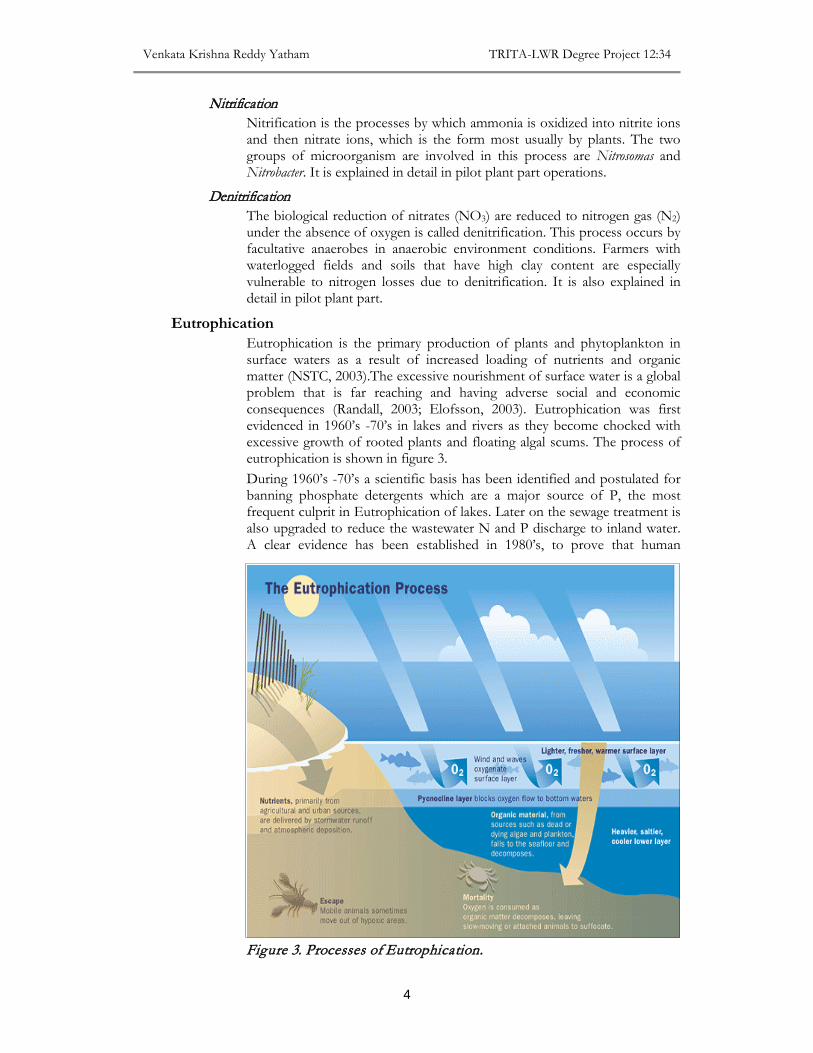
Eutrophication Eutrophication is the primary production of plants and phytoplankton in surface waters as a result of increased loading of nutrients and organic matter (NSTC, 2003).The excessive nourishment of surface water is a global problem that is far reaching and having adverse social and economic consequences (Randall, 2003; Elofsson, 2003). Eutrophication was first evidenced in 1960’s -70’s in lakes and rivers as they become chocked with excessive growth of rooted plants and floating algal scums. The process of eutrophication is shown in figure 3. During 1960’s -70’s a scientific basis has been identified and postulated for banning phosphate detergents which are a major source of P, the most frequent culprit in Eutrophication of lakes. Later on the sewage treatment is also upgraded to reduce the wastewater N and P discharge to inland water. A clear evidence has been established in 1980’s, to prove that human
Figure 3. Processes of Eutrophication.
Study of Nitrogen Removal Rate and Trouble shooting of Pilot plant (ITEST)
5
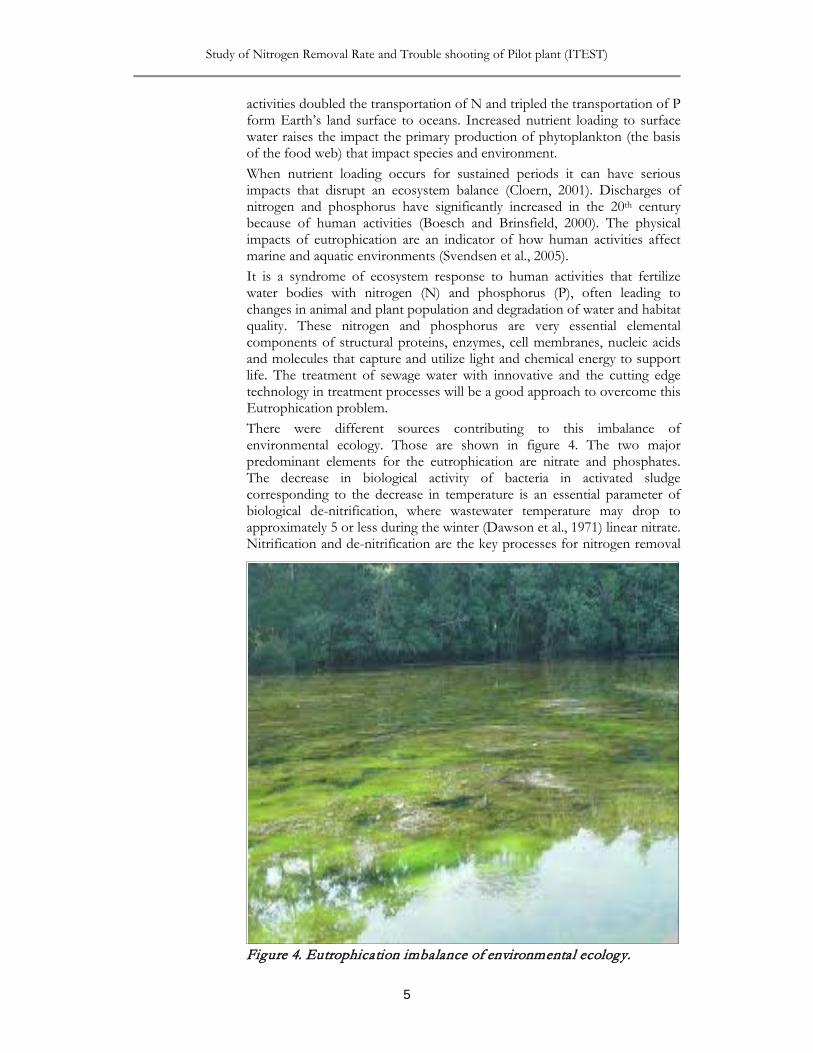
activities doubled the transportation of N and tripled the transportation of P form Earth’s land surface to oceans. Increased nutrient loading to surface water raises the impact the primary production of phytoplankton (the basis of the food web) that impact species and environment. When nutrient loading occurs for sustained periods it can have serious impacts that disrupt an ecosystem balance (Cloern, 2001). Discharges of nitrogen and phosphorus have significantly increased in the 20th century because of human activities (Boesch and Brinsfield, 2000). The physical impacts of eutrophication are an indicator of how human activities affect marine and aquatic environments (Svendsen et al., 2005). It is a syndrome of ecosystem response to human activities that fertilize water bodies with nitrogen (N) and phosphorus (P), often leading to changes in animal and plant population and degradation of water and habitat quality. These nitrogen and phosphorus are very essential elemental components of structural proteins, enzymes, cell membranes, nucleic acids and molecules that capture and utilize light and chemical energy to support life. The treatment of sewage water with innovative and the cutting edge technology in treatment processes will be a good approach to overcome this Eutrophication problem. There were different sources contributing to this imbalance of environmental ecology. Those are shown in figure 4. The two major predominant elements for the eutrophication are nitrate and phosphates. The decrease in biological activity of bacteria in activated sludge corresponding to the decrease in temperature is an essential parameter of biological de-nitrification, where wastewater temperature may drop to approximately 5 or less during the winter (Dawson et al., 1971) linear nitrate. Nitrification and de-nitrification are the key processes for nitrogen removal
Figure 4. Eutrophication imbalance of environmental ecology.
Venkata Krishna Reddy Yatham TRITA-LWR Degree Project 12:34
6
in activated biological wastewater treatment. Nitrification is carried out in two steps: ammonia to nitrate conversion carried by Nitrosomonas followed by further conversation of nitrite to nitrate by Nitrobacter (Antonious et al., 1989). There are mainly two important factors, which affects the growth rate of organisms. These are the temperature and pH values. Previous studies indicate that a rise in temperature of 10 ⁰C gave about a three-fold rise in growth rate (Painter et al., 1981). Usually growth of Nitrosomonas limits the nitrification rate. The effective maximum specific growth rate was found to be a monotonically increasing function of temperature in the range of 15 ⁰C to 25 ⁰C and the effective nitrification rate was observed at a pH range of 7.0 to 8.2 (Antonious et al., 1989). If the temperature lowers than 16 ⁰C, it results in the removal of ammonium and it can become unacceptable in most of the practical conditions/situations. Nitrification is more sensitive to temperature than de-nitrification (Obaja et al., 2001). The eutrophication is defined in many ways one of that is “the processes by which a body of water acquires a high concentration of nutrients, especially phosphate and nitrates". Eutrophication is a natural, slow-aging process for water body, but human activity greatly speeds up the process (Art, 1993).
Effects of eutrophication to aquatic environment There are many adverse effects due to the eutrophication; those are mentioned in the following description. • An increase in primary production • Algal blooms • Increase in turbidity • Oxygen depletion
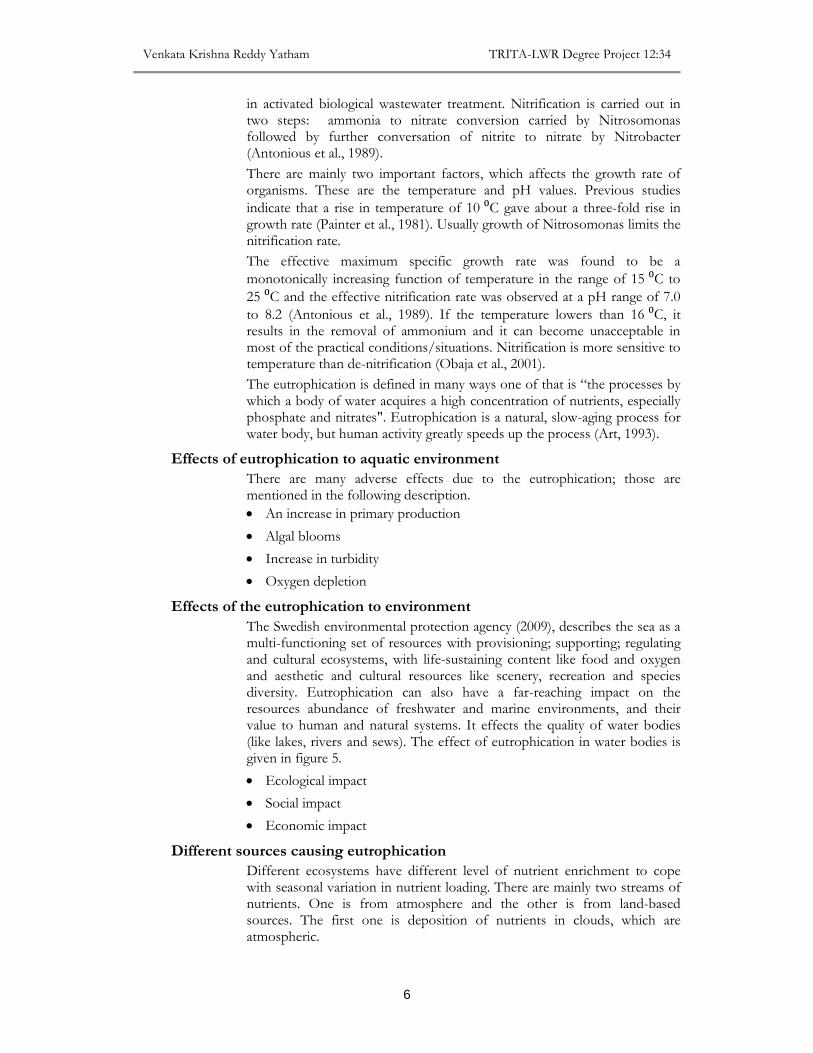
Effects of the eutrophication to environment The Swedish environmental protection agency (2009), describes the sea as a multi-functioning set of resources with provisioning; supporting; regulating and cultural ecosystems, with life-sustaining content like food and oxygen and aesthetic and cultural resources like scenery, recreation and species diversity. Eutrophication can also have a far-reaching impact on the resources abundance of freshwater and marine environments, and their value to human and natural systems. It effects the quality of water bodies (like lakes, rivers and sews). The effect of eutrophication in water bodies is given in figure 5. • Ecological impact • Social impact • Economic impact
Different sources causing eutrophication Different ecosystems have different level of nutrient enrichment to cope with seasonal variation in nutrient loading. There are mainly two streams of nutrients. One is from atmosphere and the other is from land-based sources. The first one is deposition of nutrients in clouds, which are atmospheric.
Study of Nitrogen Removal Rate and Trouble shooting of Pilot plant (ITEST)
7
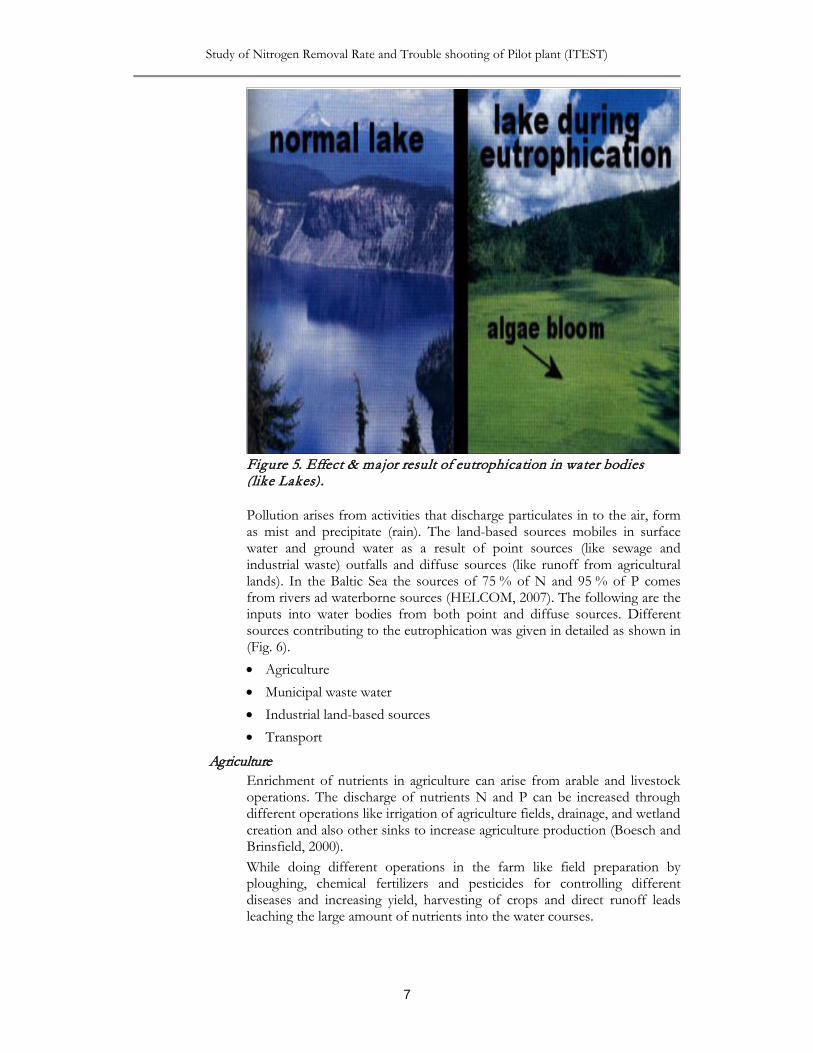
Pollution arises from activities that discharge particulates in to the air, form as mist and precipitate (rain). The land-based sources mobiles in surface water and ground water as a result of point sources (like sewage and industrial waste) outfalls and diffuse sources (like runoff from agricultural lands). In the Baltic Sea the sources of 75 % of N and 95 % of P comes from rivers ad waterborne sources (HELCOM, 2007). The following are the inputs into water bodies from both point and diffuse sources. Different sources contributing to the eutrophication was given in detailed as shown in (Fig. 6). • Agriculture • Municipal waste water • Industrial land-based sources • Transport
Agriculture Enrichment of nutrients in agriculture can arise from arable and livestock operations. The discharge of nutrients N and P can be increased through different operations like irrigation of agriculture fields, drainage, and wetland creation and also other sinks to increase agriculture production (Boesch and Brinsfield, 2000). While doing different operations in the farm like field preparation by ploughing, chemical fertilizers and pesticides for controlling different diseases and increasing yield, harvesting of crops and direct runoff leads leaching the large amount of nutrients into the water courses.
Figure 5. Effect & major result of eutrophication in water bodies (like Lakes).
Venkata Krishna Reddy Yatham TRITA-LWR Degree Project 12:34
8
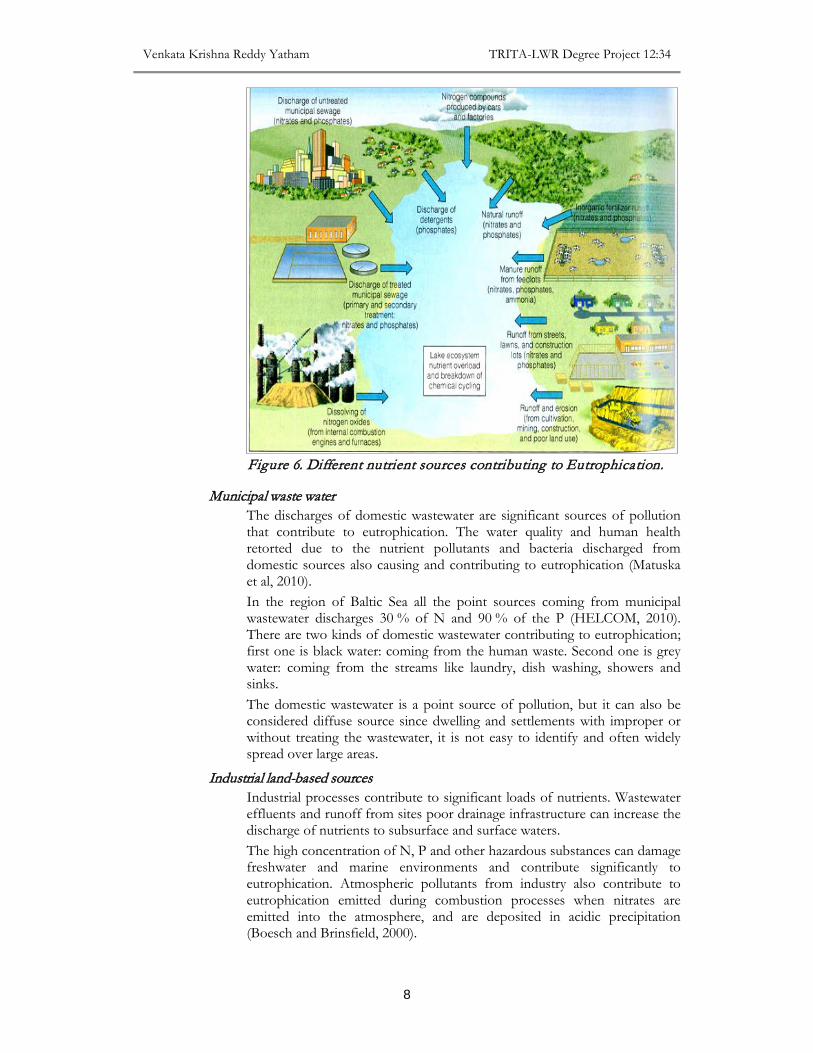
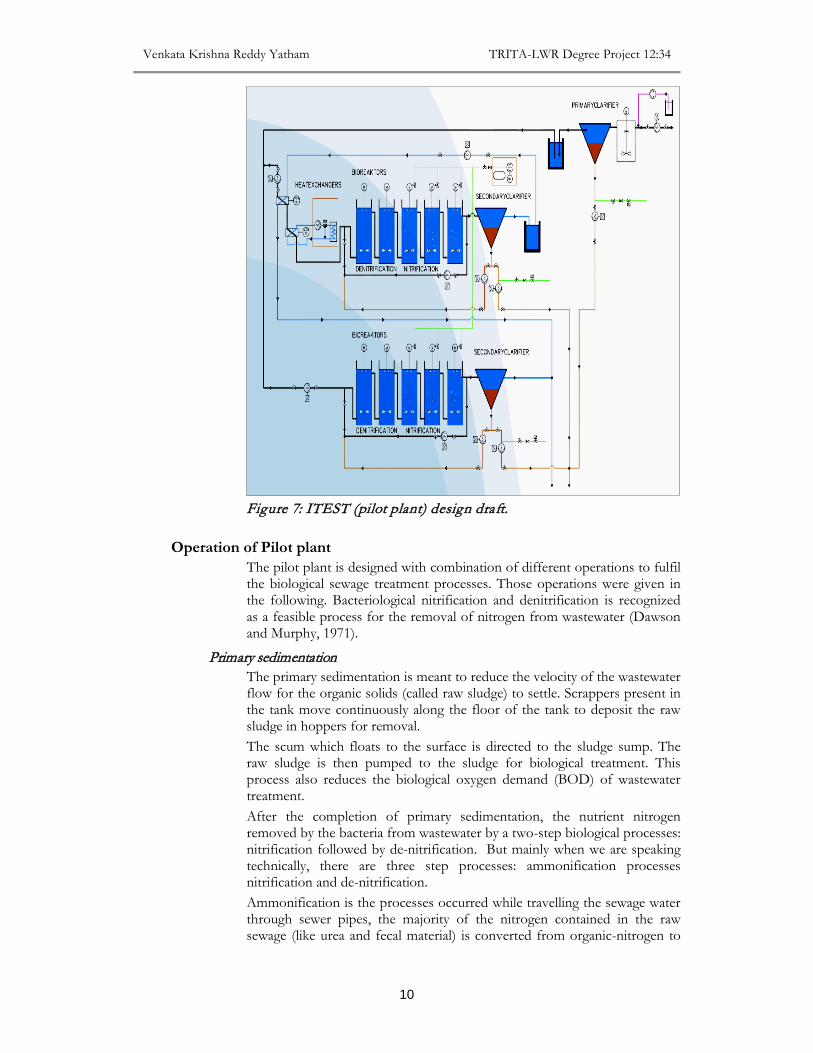
Municipal waste water The discharges of domestic wastewater are significant sources of pollution that contribute to eutrophication. The water quality and human health retorted due to the nutrient pollutants and bacteria discharged from domestic sources also causing and contributing to eutrophication (Matuska et al, 2010). In the region of Baltic Sea all the point sources coming from municipal wastewater discharges 30 % of N and 90 % of the P (HELCOM, 2010). There are two kinds of domestic wastewater contributing to eutrophication; first one is black water: coming from the human waste. Second one is grey water: coming from the streams like laundry, dish washing, showers and sinks. The domestic wastewater is a point source of pollution, but it can also be considered diffuse source since dwelling and settlements with improper or without treating the wastewater, it is not easy to identify and often widely spread over large areas.
Industrial land-based sources Industrial processes contribute to significant loads of nutrients. Wastewater effluents and runoff from sites poor drainage infrastructure can increase the discharge of nutrients to subsurface and surface waters. The high concentration of N, P and other hazardous substances can damage freshwater and marine environments and contribute significantly to eutrophication. Atmospheric pollutants from industry also contribute to eutrophication emitted during combustion processes when nitrates are emitted into the atmosphere, and are deposited in acidic precipitation (Boesch and Brinsfield, 2000).
Figure 6. Different nutrient sources contributing to Eutrophication.
Study of Nitrogen Removal Rate and Trouble shooting of Pilot plant (ITEST)
9
Transport Transport emissions contribute to the deposition of nutrients in the marine environment. Whilst there have been improvements to reduce road vehicle pollution, the other modes of transportation have been less well regulated. Shipping is estimated to contribute more pollution than the land-based sources by 2020 (EC, 2005). Low graded fuel use and large number of shipping operations make its pollution significant in already high emission. The importance of shipping for transporting goods and for world trade, the impact of its pollution can significantly increase in its contribution to the eutrophication The waste water produces during the shipping also contributes to the eutrophication, with both black and grey water discharged. The need for efficient reduction of N and P content in ship wastewater has been recognized and standards set from 2010 by the International Maritime Organization (IMO).
PILOT PLANT OF ITEST The biological nitrification and denitrification is recognized as a feasible treatment for the nutrient nitrogen removal form wastewater. The pilot plant studied results using the activated biological sludge on complex municipal wastewater have been reported from United States (Mulbarger, 1970) and (Smith et al., 1970). There are many investigations which have examined the factors influencing the nitrification sequence. Denitrification and nitrification are the key processes in activated sludge processes to remove the different forms of nutrient nitrogen from the wastewater. Nitrification is carried out in two steps. These are conversation of ammonium to nitrite by Nitrosomonas then followed by further conversation of the nitrite to nitrate by Nitrobacter. Both groups of bacteria comes under autotrophic, the source of Co2 useful as the carbon source for the biosynthesis and oxidation of nitrogen compound as the energy source. The nitrification rate is usually limited by the growth rate of Nitrosomonas.
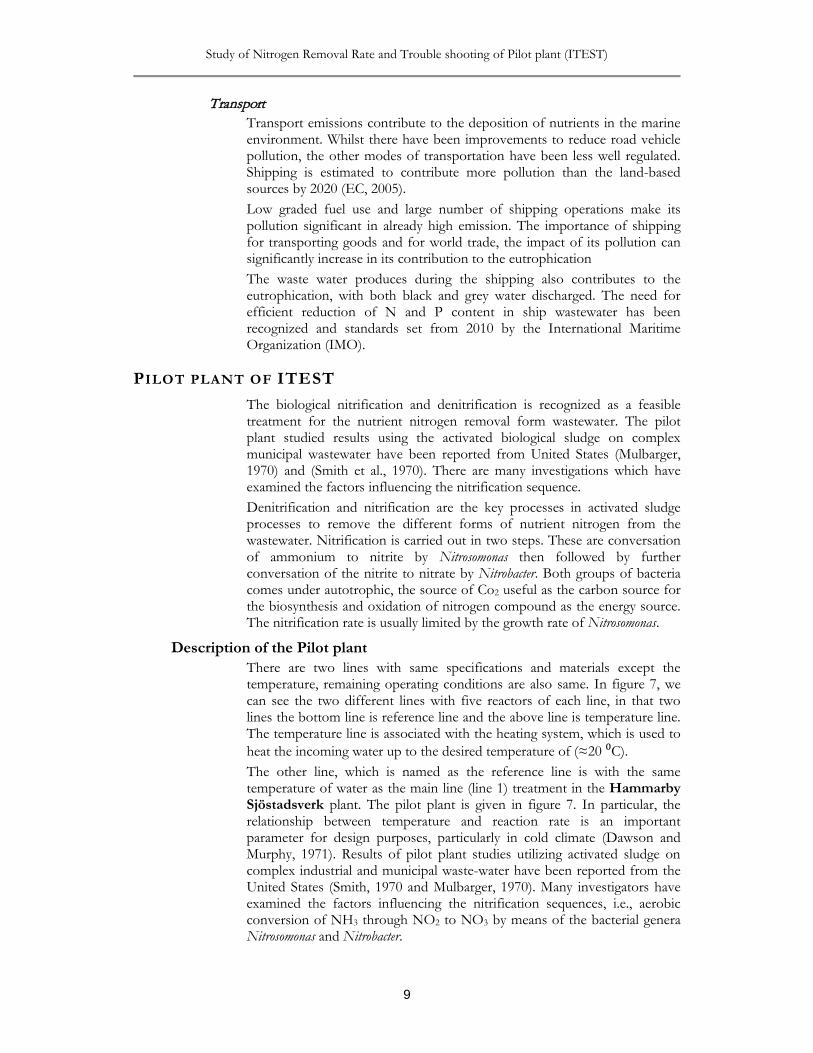
Description of the Pilot plant There are two lines with same specifications and materials except the temperature, remaining operating conditions are also same. In figure 7, we can see the two different lines with five reactors of each line, in that two lines the bottom line is reference line and the above line is temperature line. The temperature line is associated with the heating system, which is used to heat the incoming water up to the desired temperature of (≈20 ⁰C). The other line, which is named as the reference line is with the same temperature of water as the main line (line 1) treatment in the Hammarby Sjöstadsverk plant. The pilot plant is given in figure 7. In particular, the relationship between temperature and reaction rate is an important parameter for design purposes, particularly in cold climate (Dawson and Murphy, 1971). Results of pilot plant studies utilizing activated sludge on complex industrial and municipal waste-water have been reported from the United States (Smith, 1970 and Mulbarger, 1970). Many investigators have examined the factors influencing the nitrification sequences, i.e., aerobic conversion of NH3 through NO2 to NO3 by means of the bacterial genera Nitrosomonas and Nitrobacter.
Venkata Krishna Reddy Yatham TRITA-LWR Degree Project 12:34
10
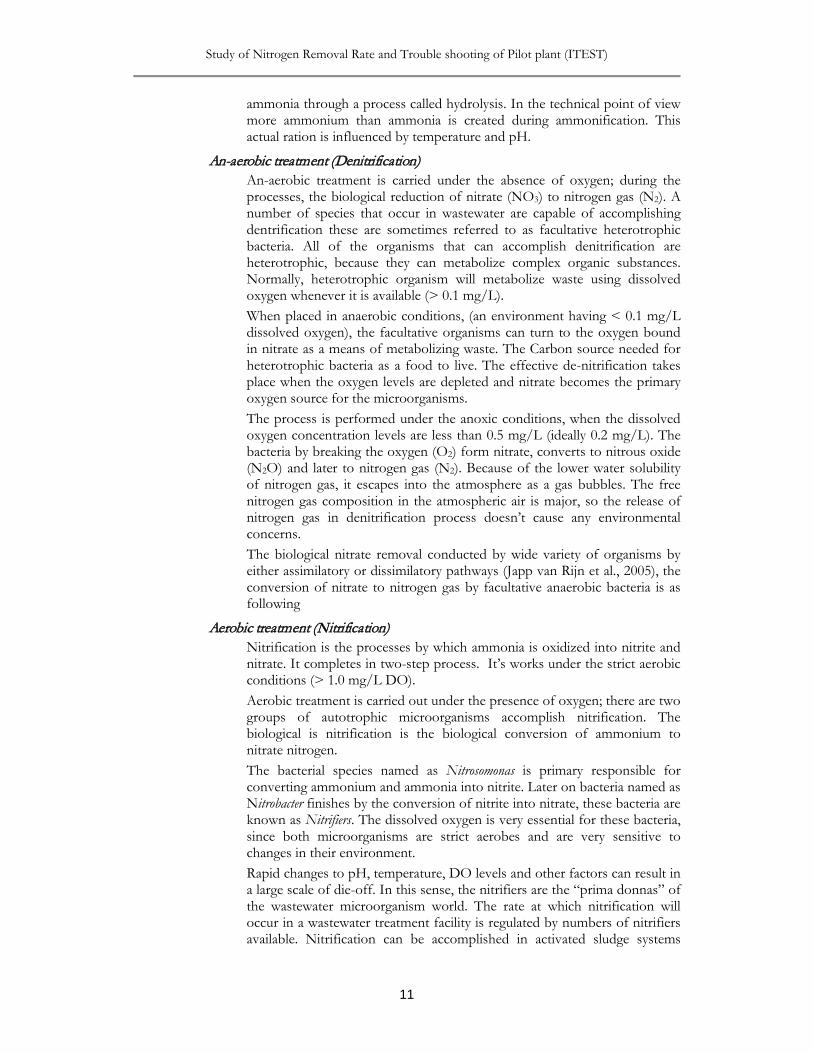
Operation of Pilot plant The pilot plant is designed with combination of different operations to fulfil the biological sewage treatment processes. Those operations were given in the following. Bacteriological nitrification and denitrification is recognized as a feasible process for the removal of nitrogen from wastewater (Dawson and Murphy, 1971).
Primary sedimentation The primary sedimentation is meant to reduce the velocity of the wastewater flow for the organic solids (called raw sludge) to settle. Scrappers present in the tank move continuously along the floor of the tank to deposit the raw sludge in hoppers for removal. The scum which floats to the surface is directed to the sludge sump. The raw sludge is then pumped to the sludge for biological treatment. This process also reduces the biological oxygen demand (BOD) of wastewater treatment. After the completion of primary sedimentation, the nutrient nitrogen removed by the bacteria from wastewater by a two-step biological processes: nitrification followed by de-nitrification. But mainly when we are speaking technically, there are three step processes: ammonification processes nitrification and de-nitrification. Ammonification is the processes occurred while travelling the sewage water through sewer pipes, the majority of the nitrogen contained in the raw sewage (like urea and fecal material) is converted from organic-nitrogen to
Figure 7: ITEST (pilot plant) design draft.
Study of Nitrogen Removal Rate and Trouble shooting of Pilot plant (ITEST)
11
ammonia through a process called hydrolysis. In the technical point of view more ammonium than ammonia is created during ammonification. This actual ration is influenced by temperature and pH.
An-aerobic treatment (Denitrification) An-aerobic treatment is carried under the absence of oxygen; during the processes, the biological reduction of nitrate (NO3) to nitrogen gas (N2). A number of species that occur in wastewater are capable of accomplishing dentrification these are sometimes referred to as facultative heterotrophic bacteria. All of the organisms that can accomplish denitrification are heterotrophic, because they can metabolize complex organic substances. Normally, heterotrophic organism will metabolize waste using dissolved oxygen whenever it is available (> 0.1 mg/L). When placed in anaerobic conditions, (an environment having < 0.1 mg/L dissolved oxygen), the facultative organisms can turn to the oxygen bound in nitrate as a means of metabolizing waste. The Carbon source needed for heterotrophic bacteria as a food to live. The effective de-nitrification takes place when the oxygen levels are depleted and nitrate becomes the primary oxygen source for the microorganisms. The process is performed under the anoxic conditions, when the dissolved oxygen concentration levels are less than 0.5 mg/L (ideally 0.2 mg/L). The bacteria by breaking the oxygen (O2) form nitrate, converts to nitrous oxide (N2O) and later to nitrogen gas (N2). Because of the lower water solubility of nitrogen gas, it escapes into the atmosphere as a gas bubbles. The free nitrogen gas composition in the atmospheric air is major, so the release of nitrogen gas in denitrification process doesn’t cause any environmental concerns. The biological nitrate removal conducted by wide variety of organisms by either assimilatory or dissimilatory pathways (Japp van Rijn et al., 2005), the conversion of nitrate to nitrogen gas by facultative anaerobic bacteria is as following
Aerobic treatment (Nitrification) Nitrification is the processes by which ammonia is oxidized into nitrite and nitrate. It completes in two-step process. It’s works under the strict aerobic conditions (> 1.0 mg/L DO). Aerobic treatment is carried out under the presence of oxygen; there are two groups of autotrophic microorganisms accomplish nitrification. The biological is nitrification is the biological conversion of ammonium to nitrate nitrogen. The bacterial species named as Nitrosomonas is primary responsible for converting ammonium and ammonia into nitrite. Later on bacteria named as Nitrobacter finishes by the conversion of nitrite into nitrate, these bacteria are known as Nitrifiers. The dissolved oxygen is very essential for these bacteria, since both microorganisms are strict aerobes and are very sensitive to changes in their environment. Rapid changes to pH, temperature, DO levels and other factors can result in a large scale of die-off. In this sense, the nitrifiers are the “prima donnas” of the wastewater microorganism world. The rate at which nitrification will occur in a wastewater treatment facility is regulated by numbers of nitrifiers available. Nitrification can be accomplished in activated sludge systems
Venkata Krishna Reddy Yatham TRITA-LWR Degree Project 12:34
12
treatment facilities, provided conditions are right. Because it is a strictly aerobic process, sufficient levels of dissolved oxygen must be provided. Typically a DO level of at least 1 mg/L -2 mg/L must be maintained to realize affects the nitrification rate. More DO will results in higher levels of nitrification up to a maximum of about 4.0 mg/L of DO. The nitrifiers can carry out efficient nitrification within an efficient pH range. Outside of this range, the rate of nitrification slows to generally unacceptable levels. Alkalinity is consumed during nitrification as a part of the biological reaction. For each gram of ammonia nitrified into nitrate, 7.2 grams of alkalinity was destroyed. Because of the destruction of alkalinity through realizing of hydrogen ions, the sustainable nitrification causes a drop in pH.
Secondary sedimentation It is a physical process and is an essential part of treatment process. The purpose of secondary sedimentation tank is that it allows the secondary sludge to settle, which is the organic matter washed from trickling filter. Again the sludge is used to pump back into the inlet end of the primary sedimentation tank and settle with the raw sludge. At this point the biological oxygen demand may be reduced to about 80 % and most of the suspended solids are removed. It is not very essential to emphasize on removing the sludge than the primary sedimentation, but this is also important to remove the sludge frequently and at regular cleaning intervals.
Operational parameters During the wastewater treatment process several factors influences the efficiency of the process and make big difference in obtaining optimal results. The operational parameters of ITEST also influence sludge processes in pilot plant (e.g. at which range the processes will occur efficiently) are given below in details. There are other parameters also, which can influence the processes, but we considered mainly the temperature and pH are essential.
Temperature The temperature is an important factor which affects the nutrient removal during the activated sludge treatment. The temperature during the activated biological treatment also influences the bacterial growth rate (as studied by the previous works of DSIR, 1964 and Knowles et al., 1965). The temperature less than 16 ⁰C offers ammonium removal yields that can become unacceptable in most practical situations. Denitrification is not so affected by temperature (Obaja et al., 2003). The effective temperature range for the activated biological treatment for the stable nitrogen removal rate was 23 ± 2 ⁰C (J. Yang et al., 2011). The temperatures in both lines were noted down whenever the sapling analysis was taken, with the help of digital measurements shown in the online control system of ITEST.
pH The pH is also known as hydrogen ion concentration. The pH is an important factor which indirectly influences the nutrient removal by direct affect on the growth rate of nitrifying bacteria by previous works (DSIR,
Study of Nitrogen Removal Rate and Trouble shooting of Pilot plant (ITEST)
13
1964) and (Knowles et al., 1965). The optimal nitrification rate is achieved at a pH in the range of 7.0-8.2 and further more increasing function is depends on the temperature range. The pH for the both lines were also note down whenever the sampling analysis was taken, the readings were also taken with the help of digital measurements shown in the online control system of ITEST. With the help of taken readings of temperature and pH, the performance of activated sludge treatment processes was studied.
METHODS AND MATERIALS During the activated sludge treatment the nitrogen was converted form one form to another. Various methods pertaining to their respective processes during the treatment process have been carried out. Some readings were also noted down (mentioned in bullets) to analyse the processes. These include: • Nitrogen-nitrate (N-NO3-) • Ammonium-nitrate (N-NH4+) • Suspended solids (SS) • Sludge volume (SV) • Sludge volume index (SVI) • Temperature • pH
Laboratory equipment The laboratory equipment which was used throughout the experiments is given in details with the concerned figure according to the procedure of analysis. • Electronic balance • Spectrometer • Cuvettes • Incubator • Mechanical pipette • Filter paper
Calculation analysis of Nitrogen Nitrate (NO3--N), Ammonium Nitrate
(NH4+-N) and Total nitrogen (TN) using cuvette test
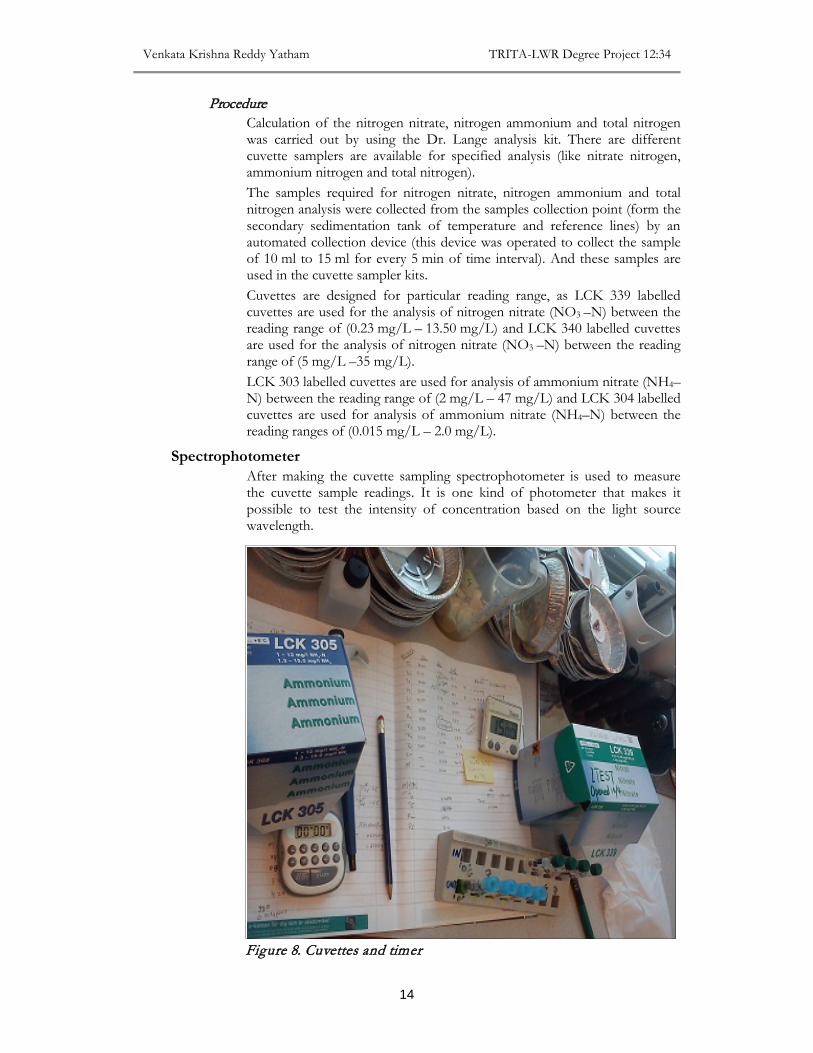
The content of nitrate (NO3-) is calculated for the incoming, outgoing of reference and outgoing of temperature line is calculated. For this the water samples are collected from the sedimentation tank of (reference and temperature) lines by using the mechanical collection device. The mechanical collection device collects equal amount of water sample (like 5 ml, 10 ml etc.) for constant time (1 min, 2 min, etc.). The samplers are started and collected for about 24 hours and after that from that sample we can take the enough amount of sample for the quit test of the samplers. The cuvettes are prepared solutions. So, by adding the collected water samples form the treated lines to these cuvettes and following the procedure given in the kits. The picture of the cuvettes is shown in (Fig 8).
Venkata Krishna Reddy Yatham TRITA-LWR Degree Project 12:34
14
Procedure Calculation of the nitrogen nitrate, nitrogen ammonium and total nitrogen was carried out by using the Dr. Lange analysis kit. There are different cuvette samplers are available for specified analysis (like nitrate nitrogen, ammonium nitrogen and total nitrogen). The samples required for nitrogen nitrate, nitrogen ammonium and total nitrogen analysis were collected from the samples collection point (form the secondary sedimentation tank of temperature and reference lines) by an automated collection device (this device was operated to collect the sample of 10 ml to 15 ml for every 5 min of time interval). And these samples are used in the cuvette sampler kits. Cuvettes are designed for particular reading range, as LCK 339 labelled cuvettes are used for the analysis of nitrogen nitrate (NO3 –N) between the reading range of (0.23 mg/L – 13.50 mg/L) and LCK 340 labelled cuvettes are used for the analysis of nitrogen nitrate (NO3 –N) between the reading range of (5 mg/L –35 mg/L). LCK 303 labelled cuvettes are used for analysis of ammonium nitrate (NH4–N) between the reading range of (2 mg/L – 47 mg/L) and LCK 304 labelled cuvettes are used for analysis of ammonium nitrate (NH4–N) between the reading ranges of (0.015 mg/L – 2.0 mg/L).
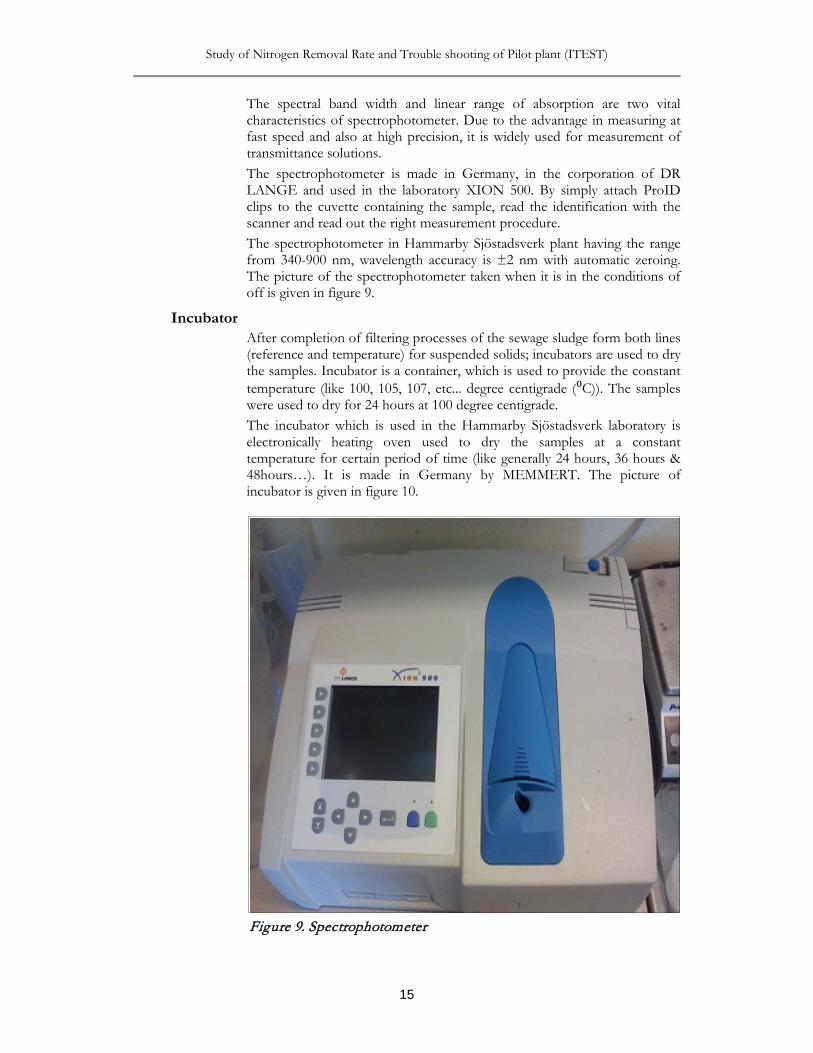
Spectrophotometer After making the cuvette sampling spectrophotometer is used to measure the cuvette sample readings. It is one kind of photometer that makes it possible to test the intensity of concentration based on the light source wavelength.
Figure 8. Cuvettes and timer
Study of Nitrogen Removal Rate and Trouble shooting of Pilot plant (ITEST)
15
The spectral band width and linear range of absorption are two vital characteristics of spectrophotometer. Due to the advantage in measuring at fast speed and also at high precision, it is widely used for measurement of transmittance solutions. The spectrophotometer is made in Germany, in the corporation of DR LANGE and used in the laboratory XION 500. By simply attach ProID clips to the cuvette containing the sample, read the identification with the scanner and read out the right measurement procedure. The spectrophotometer in Hammarby Sjöstadsverk plant having the range from 340-900 nm, wavelength accuracy is ±2 nm with automatic zeroing. The picture of the spectrophotometer taken when it is in the conditions of off is given in figure 9.
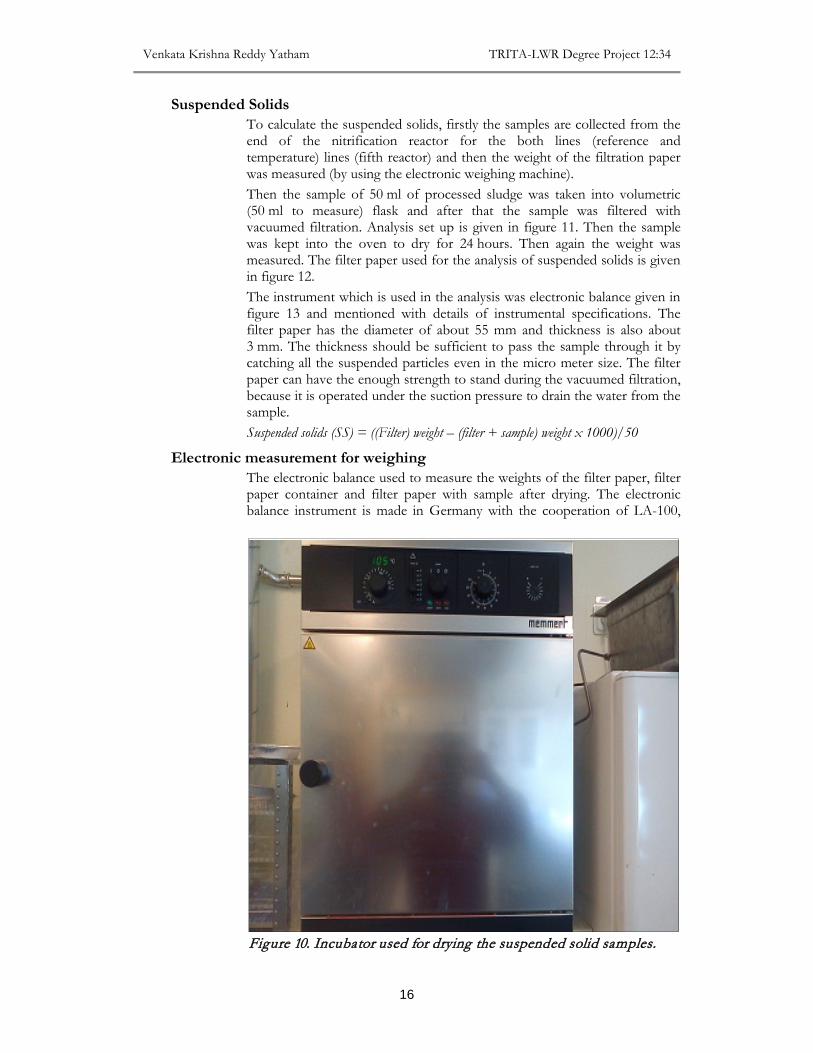
Incubator After completion of filtering processes of the sewage sludge form both lines (reference and temperature) for suspended solids; incubators are used to dry the samples. Incubator is a container, which is used to provide the constant temperature (like 100, 105, 107, etc... degree centigrade (⁰C)). The samples were used to dry for 24 hours at 100 degree centigrade. The incubator which is used in the Hammarby Sjöstadsverk laboratory is electronically heating oven used to dry the samples at a constant temperature for certain period of time (like generally 24 hours, 36 hours & 48hours…). It is made in Germany by MEMMERT. The picture of incubator is given in figure 10.
Figure 9. Spectrophotometer
Venkata Krishna Reddy Yatham TRITA-LWR Degree Project 12:34
16
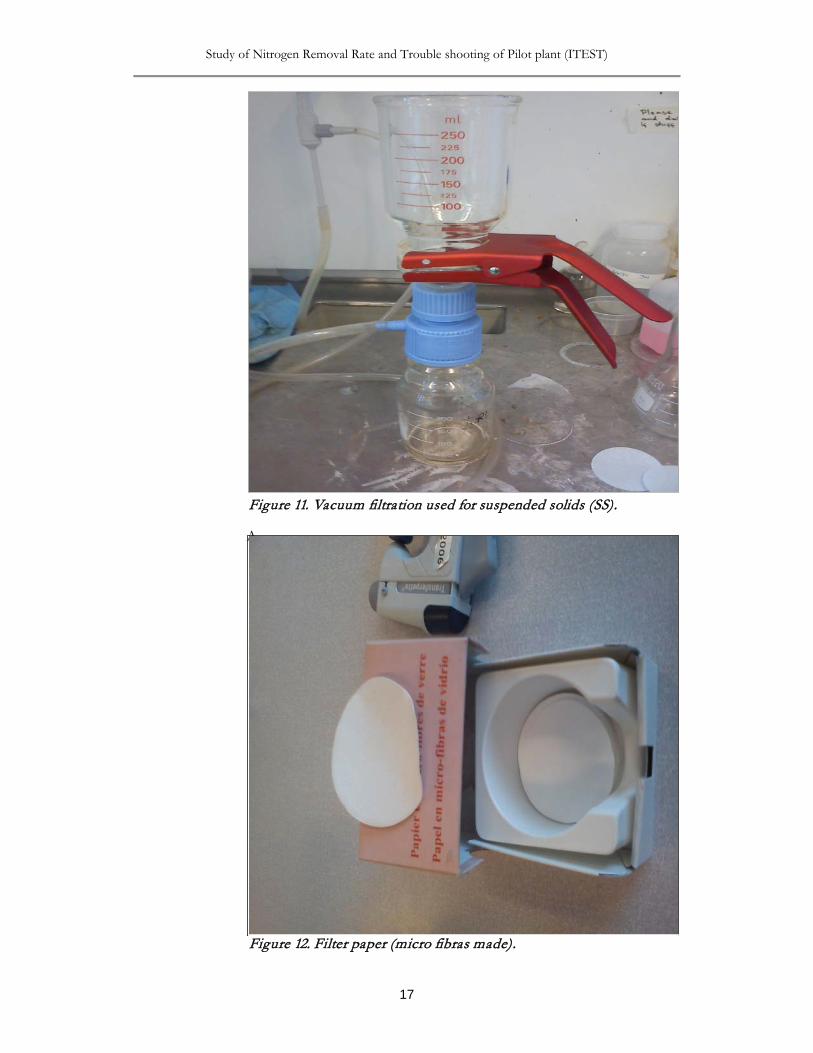
Suspended Solids To calculate the suspended solids, firstly the samples are collected from the end of the nitrification reactor for the both lines (reference and temperature) lines (fifth reactor) and then the weight of the filtration paper was measured (by using the electronic weighing machine). Then the sample of 50 ml of processed sludge was taken into volumetric (50 ml to measure) flask and after that the sample was filtered with vacuumed filtration. Analysis set up is given in figure 11. Then the sample was kept into the oven to dry for 24 hours. Then again the weight was measured. The filter paper used for the analysis of suspended solids is given in figure 12. The instrument which is used in the analysis was electronic balance given in figure 13 and mentioned with details of instrumental specifications. The filter paper has the diameter of about 55 mm and thickness is also about 3 mm. The thickness should be sufficient to pass the sample through it by catching all the suspended particles even in the micro meter size. The filter paper can have the enough strength to stand during the vacuumed filtration, because it is operated under the suction pressure to drain the water from the sample. Suspended solids (SS) = ((Filter) weight – (filter + sample) weight x 1000)/50
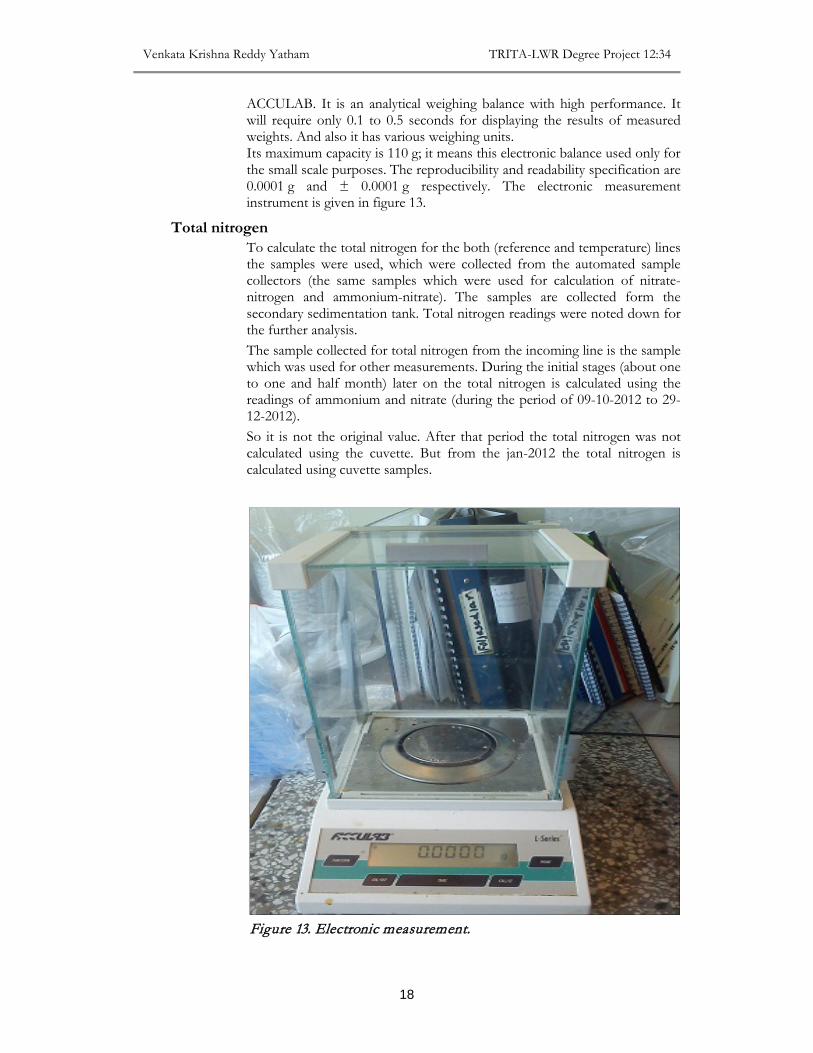
Electronic measurement for weighing The electronic balance used to measure the weights of the filter paper, filter paper container and filter paper with sample after drying. The electronic balance instrument is made in Germany with the cooperation of LA-100,
Figure 10. Incubator used for drying the suspended solid samples.
Study of Nitrogen Removal Rate and Trouble shooting of Pilot plant (ITEST)
17
A
Figure 11. Vacuum filtration used for suspended solids (SS).
Figure 12. Filter paper (micro fibras made).
Venkata Krishna Reddy Yatham TRITA-LWR Degree Project 12:34
18
ACCULAB. It is an analytical weighing balance with high performance. It will require only 0.1 to 0.5 seconds for displaying the results of measured weights. And also it has various weighing units. Its maximum capacity is 110 g; it means this electronic balance used only for the small scale purposes. The reproducibility and readability specification are 0.0001 g and ± 0.0001 g respectively. The electronic measurement instrument is given in figure 13.
Total nitrogen To calculate the total nitrogen for the both (reference and temperature) lines the samples were used, which were collected from the automated sample collectors (the same samples which were used for calculation of nitrate-nitrogen and ammonium-nitrate). The samples are collected form the secondary sedimentation tank. Total nitrogen readings were noted down for the further analysis. The sample collected for total nitrogen from the incoming line is the sample which was used for other measurements. During the initial stages (about one to one and half month) later on the total nitrogen is calculated using the readings of ammonium and nitrate (during the period of 09-10-2012 to 29-12-2012). So it is not the original value. After that period the total nitrogen was not calculated using the cuvette. But from the jan-2012 the total nitrogen is calculated using cuvette samples.
Figure 13. Electronic measurement.
Study of Nitrogen Removal Rate and Trouble shooting of Pilot plant (ITEST)
19
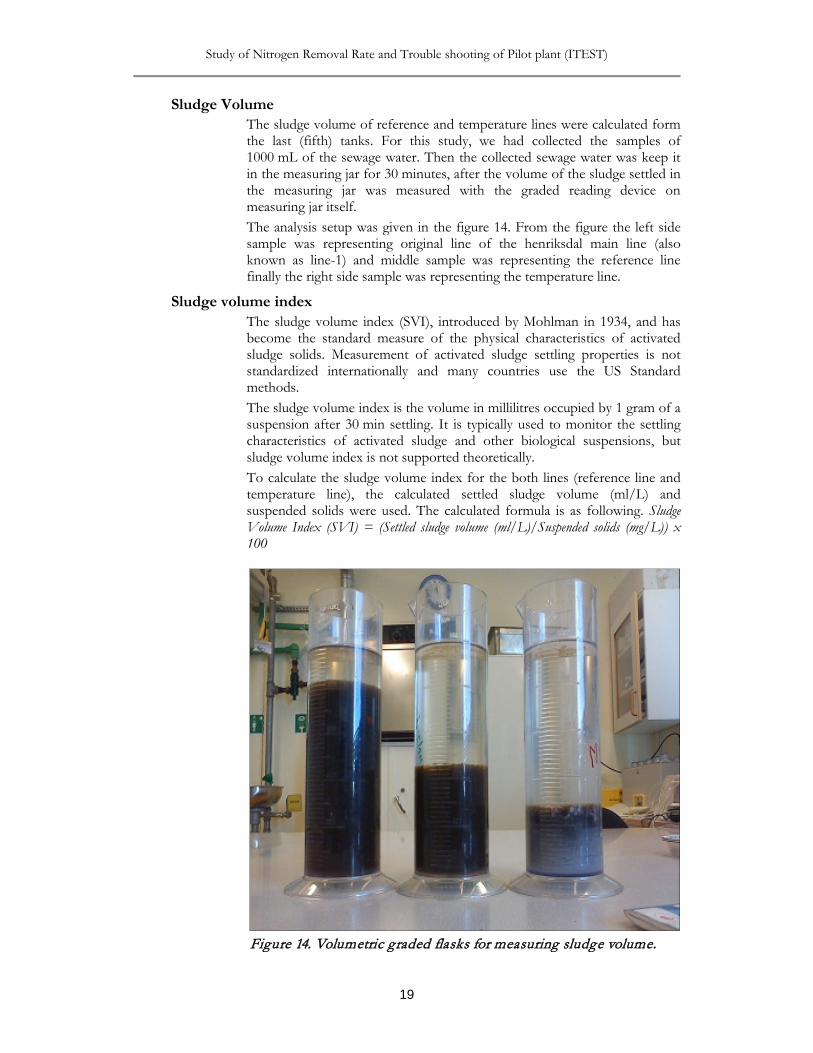
Sludge Volume The sludge volume of reference and temperature lines were calculated form the last (fifth) tanks. For this study, we had collected the samples of 1000 mL of the sewage water. Then the collected sewage water was keep it in the measuring jar for 30 minutes, after the volume of the sludge settled in the measuring jar was measured with the graded reading device on measuring jar itself. The analysis setup was given in the figure 14. From the figure the left side sample was representing original line of the henriksdal main line (also known as line-1) and middle sample was representing the reference line finally the right side sample was representing the temperature line.
Sludge volume index The sludge volume index (SVI), introduced by Mohlman in 1934, and has become the standard measure of the physical characteristics of activated sludge solids. Measurement of activated sludge settling properties is not standardized internationally and many countries use the US Standard methods. The sludge volume index is the volume in millilitres occupied by 1 gram of a suspension after 30 min settling. It is typically used to monitor the settling characteristics of activated sludge and other biological suspensions, but sludge volume index is not supported theoretically. To calculate the sludge volume index for the both lines (reference line and temperature line), the calculated settled sludge volume (ml/L) and suspended solids were used. The calculated formula is as following. Sludge Volume Index (SVI) = (Settled sludge volume (ml/L)/Suspended solids (mg/L)) x 100
Figure 14. Volumetric graded flasks for measuring sludge volume.
Venkata Krishna Reddy Yatham TRITA-LWR Degree Project 12:34
20
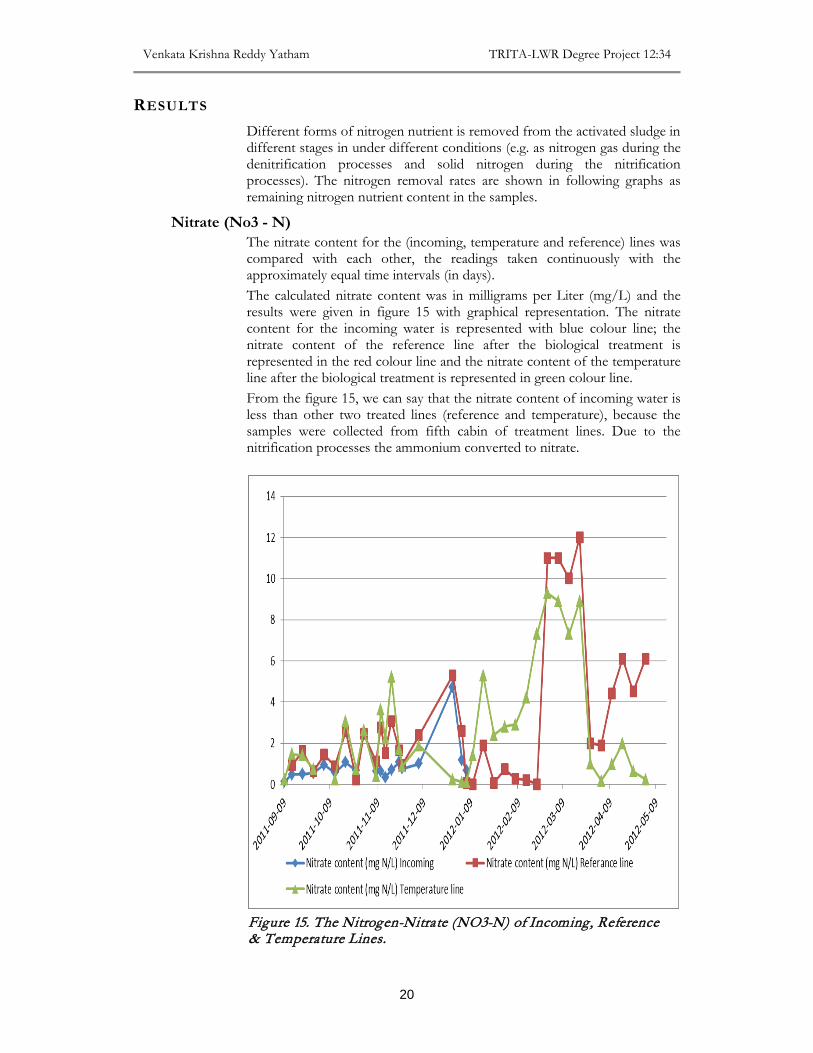
RESULTS Different forms of nitrogen nutrient is removed from the activated sludge in different stages in under different conditions (e.g. as nitrogen gas during the denitrification processes and solid nitrogen during the nitrification processes). The nitrogen removal rates are shown in following graphs as remaining nitrogen nutrient content in the samples.
Nitrate (No3 - N) The nitrate content for the (incoming, temperature and reference) lines was compared with each other, the readings taken continuously with the approximately equal time intervals (in days). The calculated nitrate content was in milligrams per Liter (mg/L) and the results were given in figure 15 with graphical representation. The nitrate content for the incoming water is represented with blue colour line; the nitrate content of the reference line after the biological treatment is represented in the red colour line and the nitrate content of the temperature line after the biological treatment is represented in green colour line. From the figure 15, we can say that the nitrate content of incoming water is less than other two treated lines (reference and temperature), because the samples were collected from fifth cabin of treatment lines. Due to the nitrification processes the ammonium converted to nitrate.
Figure 15. The Nitrogen-Nitrate (NO3-N) of Incoming, Reference & Temperature Lines.
Study of Nitrogen Removal Rate and Trouble shooting of Pilot plant (ITEST)
21
So the incoming water nitrate content is less than the other two (temperature and reference) lines readings. Even the temperature line nitrate content is more than reference line nitrate content. In figure 15 on the y-axis the values of nitrate-nitrogen was represented in (mg N/L) and on the x-axis the time intervals of the analysis carried out was given in date.
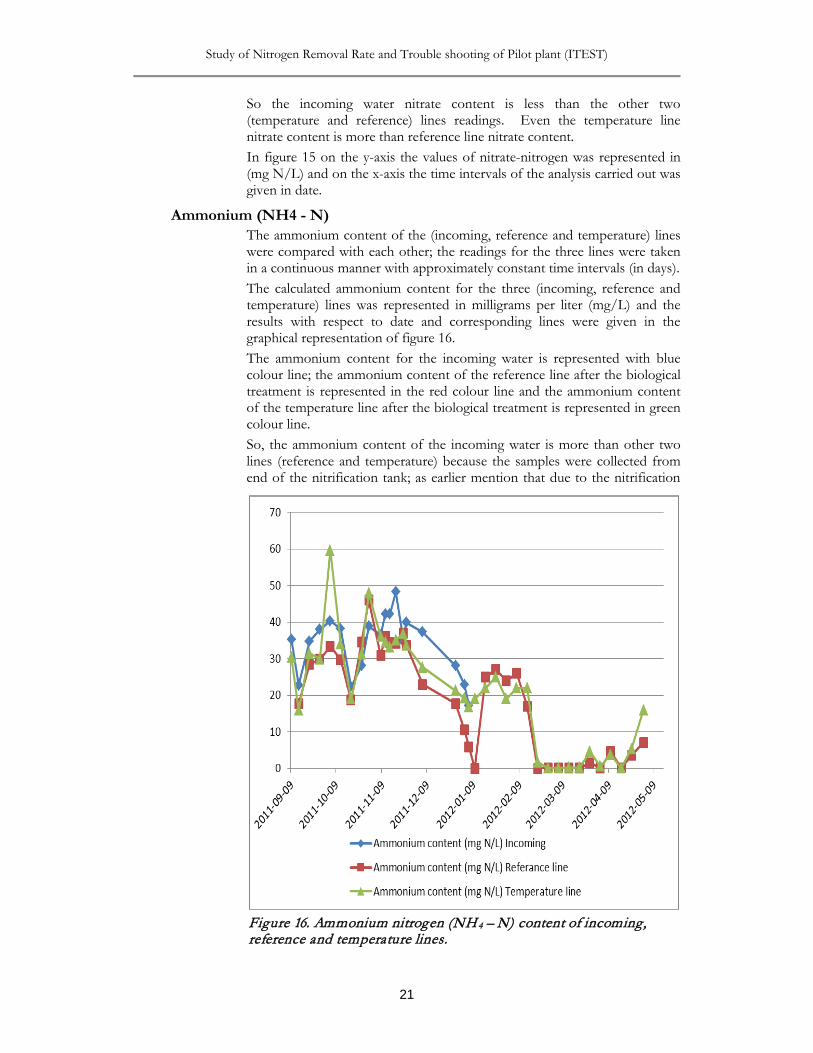
Ammonium (NH4 - N) The ammonium content of the (incoming, reference and temperature) lines were compared with each other; the readings for the three lines were taken in a continuous manner with approximately constant time intervals (in days). The calculated ammonium content for the three (incoming, reference and temperature) lines was represented in milligrams per liter (mg/L) and the results with respect to date and corresponding lines were given in the graphical representation of figure 16. The ammonium content for the incoming water is represented with blue colour line; the ammonium content of the reference line after the biological treatment is represented in the red colour line and the ammonium content of the temperature line after the biological treatment is represented in green colour line. So, the ammonium content of the incoming water is more than other two lines (reference and temperature) because the samples were collected from end of the nitrification tank; as earlier mention that due to the nitrification
Figure 16. Ammonium nitrogen (NH 4 – N) content of incoming, reference and temperature lines.
Venkata Krishna Reddy Yatham TRITA-LWR Degree Project 12:34
22
processes ammonium converted to nitrate. Even the ammonium content of temperature line was obtained less than the reference line. In figure 16 on the y-axis the values of ammonium-nitrogen was represented in (mg N/L) and on the x-axis the time intervals of the analysis carried out was given in date.
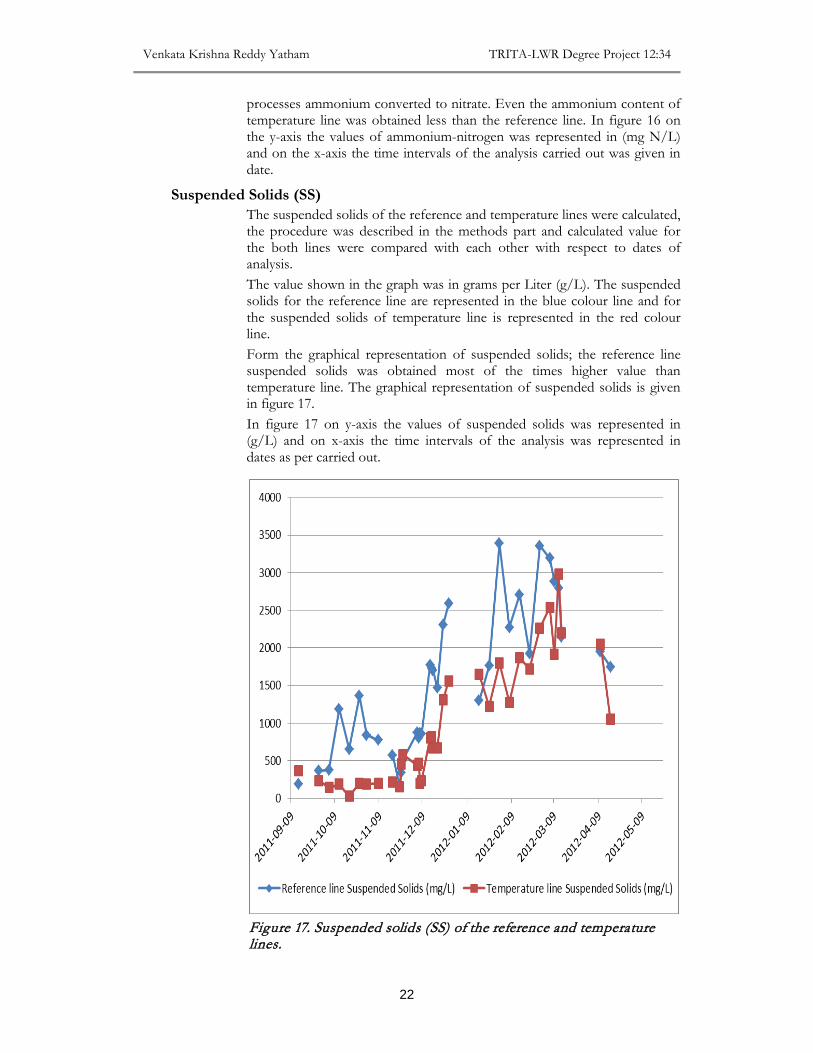
Suspended Solids (SS) The suspended solids of the reference and temperature lines were calculated, the procedure was described in the methods part and calculated value for the both lines were compared with each other with respect to dates of analysis. The value shown in the graph was in grams per Liter (g/L). The suspended solids for the reference line are represented in the blue colour line and for the suspended solids of temperature line is represented in the red colour line. Form the graphical representation of suspended solids; the reference line suspended solids was obtained most of the times higher value than temperature line. The graphical representation of suspended solids is given in figure 17. In figure 17 on y-axis the values of suspended solids was represented in (g/L) and on x-axis the time intervals of the analysis was represented in dates as per carried out.
Figure 17. Suspended solids (SS) of the reference and temperature lines.
Study of Nitrogen Removal Rate and Trouble shooting of Pilot plant (ITEST)
23
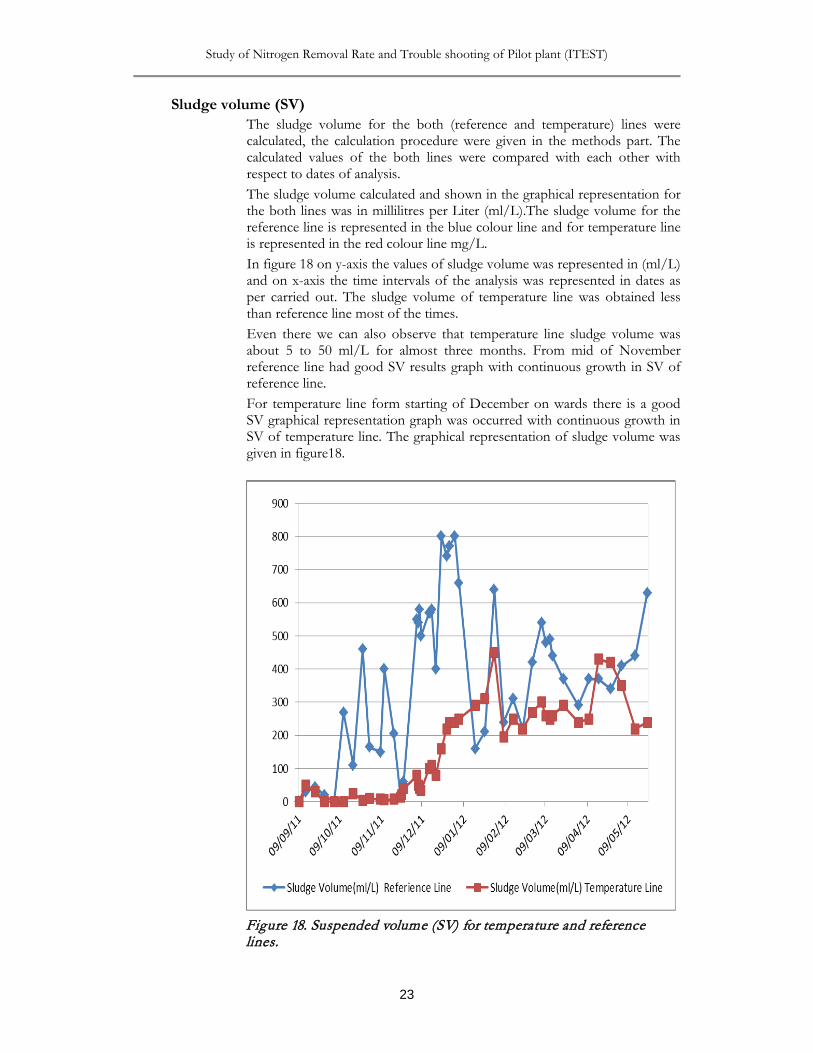
Sludge volume (SV) The sludge volume for the both (reference and temperature) lines were calculated, the calculation procedure were given in the methods part. The calculated values of the both lines were compared with each other with respect to dates of analysis. The sludge volume calculated and shown in the graphical representation for the both lines was in millilitres per Liter (ml/L).The sludge volume for the reference line is represented in the blue colour line and for temperature line is represented in the red colour line mg/L. In figure 18 on y-axis the values of sludge volume was represented in (ml/L) and on x-axis the time intervals of the analysis was represented in dates as per carried out. The sludge volume of temperature line was obtained less than reference line most of the times. Even there we can also observe that temperature line sludge volume was about 5 to 50 ml/L for almost three months. From mid of November reference line had good SV results graph with continuous growth in SV of reference line. For temperature line form starting of December on wards there is a good SV graphical representation graph was occurred with continuous growth in SV of temperature line. The graphical representation of sludge volume was given in figure18.
Figure 18. Suspended volume (SV) for temperature and reference lines.
Venkata Krishna Reddy Yatham TRITA-LWR Degree Project 12:34
24
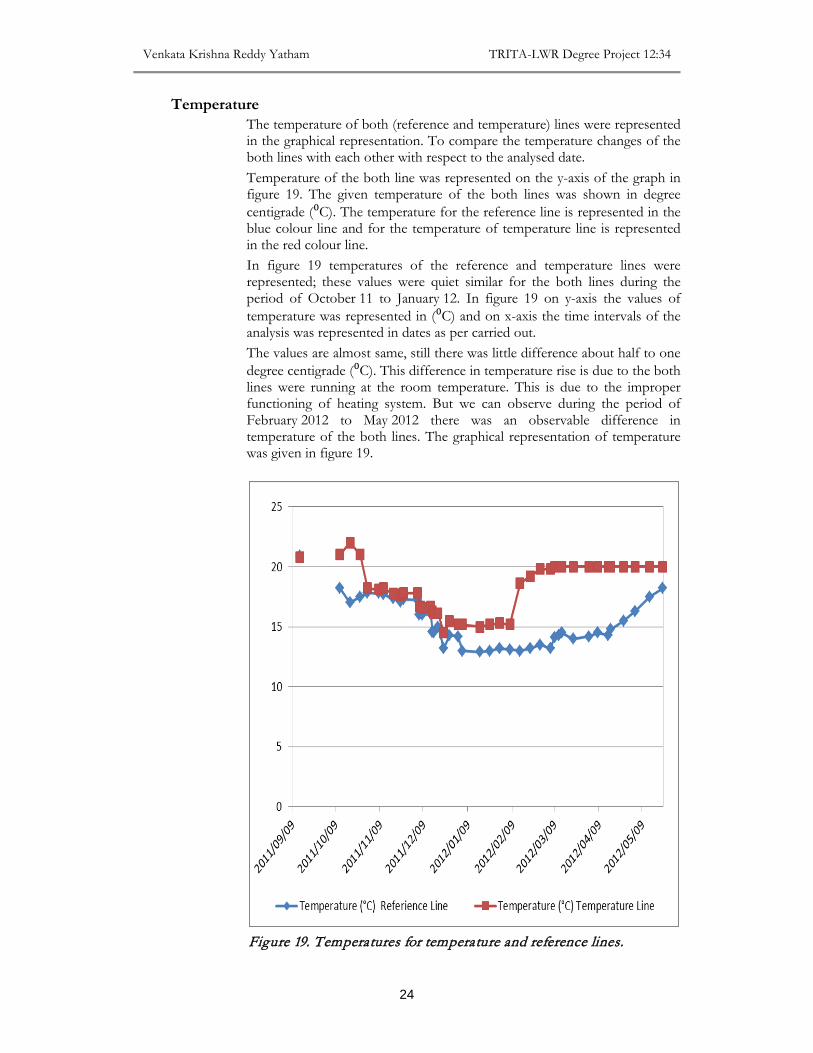
Temperature The temperature of both (reference and temperature) lines were represented in the graphical representation. To compare the temperature changes of the both lines with each other with respect to the analysed date. Temperature of the both line was represented on the y-axis of the graph in figure 19. The given temperature of the both lines was shown in degree centigrade (⁰C). The temperature for the reference line is represented in the blue colour line and for the temperature of temperature line is represented in the red colour line. In figure 19 temperatures of the reference and temperature lines were represented; these values were quiet similar for the both lines during the period of October 11 to January 12. In figure 19 on y-axis the values of temperature was represented in (⁰C) and on x-axis the time intervals of the analysis was represented in dates as per carried out. The values are almost same, still there was little difference about half to one degree centigrade (⁰C). This difference in temperature rise is due to the both lines were running at the room temperature. This is due to the improper functioning of heating system. But we can observe during the period of February 2012 to May 2012 there was an observable difference in temperature of the both lines. The graphical representation of temperature was given in figure 19.
Figure 19. Temperatures for temperature and reference lines.
Study of Nitrogen Removal Rate and Trouble shooting of Pilot plant (ITEST)
25
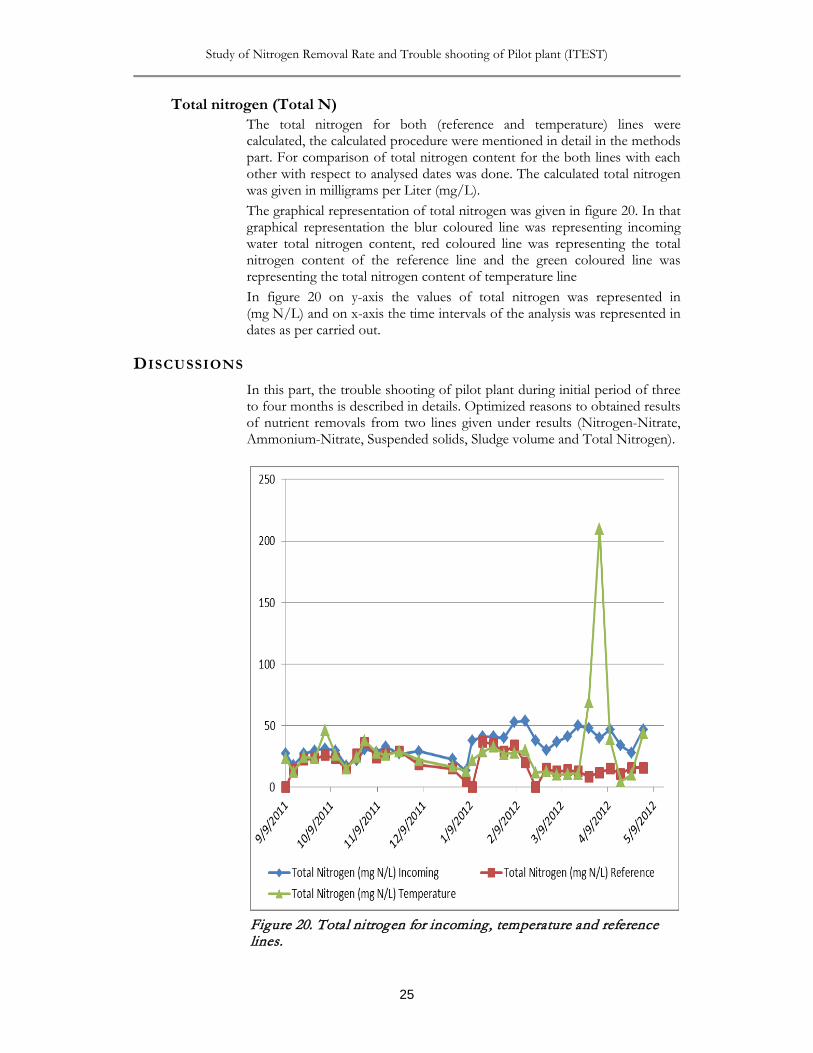
Total nitrogen (Total N) The total nitrogen for both (reference and temperature) lines were calculated, the calculated procedure were mentioned in detail in the methods part. For comparison of total nitrogen content for the both lines with each other with respect to analysed dates was done. The calculated total nitrogen was given in milligrams per Liter (mg/L). The graphical representation of total nitrogen was given in figure 20. In that graphical representation the blur coloured line was representing incoming water total nitrogen content, red coloured line was representing the total nitrogen content of the reference line and the green coloured line was representing the total nitrogen content of temperature line In figure 20 on y-axis the values of total nitrogen was represented in (mg N/L) and on x-axis the time intervals of the analysis was represented in dates as per carried out.
DISCUSSIONS In this part, the trouble shooting of pilot plant during initial period of three to four months is described in details. Optimized reasons to obtained results of nutrient removals from two lines given under results (Nitrogen-Nitrate, Ammonium-Nitrate, Suspended solids, Sludge volume and Total Nitrogen).
Figure 20. Total nitrogen for incoming, temperature and reference lines.
Venkata Krishna Reddy Yatham TRITA-LWR Degree Project 12:34
26
Troubleshooting of Pilot Plant The problems faced during initial stages of pilot plant operation were given as point wise as following bellow. And how those troubles were overcome also mentioned.
Escaping of biological sludge During the starting stages of the pilot plant the biological sludge is used to escape from the nitrification and denitrification cabins in period about one to two weeks. Then we used to add the biological sludge again into the pilot plant. We can observe this effect in the results part especially in the graphical representation of sludge volume. After having few discussions on this problem, we figured out one of the main reasons for this trouble could be the flow rate of the waste water circulation which is not suitable for the given design of the pilot plant. Another problem was the conical depth of the secondary sedimentation tank which is not enough. We tried to find out a good solution for this conical depth of the secondary sedimentation tank. But we couldn’t get it.
Improper readings of oxygen meters After overcoming the escaping of biological sludge problem, the other problem we observed was that there is improper measurement of oxygen reading meters. The reading which is showing on the digital display of the control panel of ITEST is not matching with the reading showing by the manual calibrated reading. Then we consulted the technical instillation department to fix that problem, they replaced the oxygen meters with new ones, Still the problem was not rectified they were made some technical changes again to fix the problem.
Sludge floating The sludge is floating about 10 to 15 cm in thickness at the top of the reactor. This was happen because of the excesses denitrification. During the denitrification processes nitrate is converted into nitrogen gas. So, if the treating wastewater is staying for the long time in denitrification tank, while escaping nitrogen gas it will also lift up the sewage sludge.
Detecting of the electrochemical reactions of different materials while passing the wastewater through heating system
When observed one more problem in the incoming water for the temperature line. The problem is in the quality of incoming water of temperature line was not same as wastewater at outlet of the primary sedimentation to wastewater at the outlet of heat exchanger, the water is too dark in colour and high in concentration. For that we suspected that there were different metals of combination while passing the wastewater from primary sedimentation to heat exchanger, due to presence of these metals there is a chance of electrochemical reaction in the wastewater. So we replaced with same metals in the line.
Analysis of the nutrient removal The results for the nutrient removals were shown in the results part, optimized reasons for those analysed results were mentioned here. Those are following as
Study of Nitrogen Removal Rate and Trouble shooting of Pilot plant (ITEST)
27
Nitrate The content of the nitrate in the incoming water is compared with the nitrate content of the both lines after the completion of biological treatment. There was differences in these contents are represented in the graph-1. And as mentioned in the results part nitrate content of incoming water is less than other two treated lines. During the nitrification processes the ammonium is converted to nitrate. So the processes are going well in the treated lines. There is a removal rate of the nitrogen.
Ammonium The ammonium content of incoming, temperature and reference lines was represented in figure 16. From there we can say that the ammonium concentration of the temperature line is less than the reference line is less than incoming line. During the nitrification processes ammonium is converted into nitrate. So the processes are going well in the both lines. Still the ammonium removal levels were slightly higher in the temperature line than the reference line. So, there is an effect of temperature in nutrient nitrogen removal during the activated biological sewage treatment.
Suspended solids The suspended solids of the temperature line is almost throughout the graphical representation had lesser value than the reference line. We can also observe that there was suspended solids value closer to zero (this was happen because of the escaping of sludge) especially in the temperature line for more than two months. It was happen during the initial periods of the pilot plant running. There was suddenly increased sludge volume after immediately attaining zero. That was happened due to the successive addition of the sludge, after escaping.
Sludge volume In the sludge volume also similar kind of trends were represented in graph-4. Because sludge volume and suspended solids are related to each other. If there is good sludge growth then there will be good amount sludge volume and a suspended solid occurs.
Total nitrogen Form the total nitrogen graph during the period of initial two to three months total nitrogen of the incoming water was lesser than temperature and reference lines. This was because of the total nitrogen values were calculated from ammonium and nitrate values. But total nitrogen is the amount of ammonium, nitrate, nitrite and nitride. But the value of the nitride will be less and it is negligible.
Temperature Form the temperature graphical representation; the temperatures of the both lines were almost close for long time of about two and half to three months as shown in figure 5 and results also, because the heating system was not functioning properly. But, after that the temperature of the temperature line is almost as desired as 20 ⁰C degree centigrade.
Venkata Krishna Reddy Yatham TRITA-LWR Degree Project 12:34
28
pH The pH or alkalinity is also an important parameter to take place the efficient biological treatment of wastewater. As mentioned earlier the suitable pH range is between 6.5 –7.5. The pH for the both lines was almost between the desired ranges.
CONCLUSIONS The temperature dependence of nitrification and denitrification process was observed in the results parts are discussed in the discussions part. There is an improvement in nitrogen removal with respect to the increase in the operational temperature; the other parameters are at the constant throughout the processes. Still the aim of the project is not achieved completely. • During the period of September-2011 to January-2012, the results were
poor due to the pilot plant was not working fully. There were some obstacles/troubles, which were discussed in the troubles shooting part. After rectifying those problems the plant getting better processes.
• That improved process had the influence in the results as well, which can be observable in the results part during the period of February-2012 to May-2012.
• The nitrate-nitrogen content in the treated temperature line had the values of 0.2 and 0.3 mg N/L respectively during the dates 03-04-2012 and 02-05-2012.
• The nitrate-nitrogen content in the treated reference line had the values of 2.0 and 6.0 mg N/L respectively during the dates 03-04-2012 and 02-05-2012.
• The temperatures of the temperature and reference lines were 14⁰C and 16⁰C during the dates 03-04-2012 and 02-05-2012 respectively. And the temperature line is at 20⁰C.
• There is temperature influence in nitrogen removal during activated biological treatment, form the graphical representation of nitrogen-nitrate and ammonium-nitrate results it is clearly identified.
• In the removal of ammonium-nitrogen and total nitrogen removals also strongly showing the influence of temperature.
• Because of the both the lines were constructed inside of the Hammarby Sjöstadsverket plant. Due to this, while the water is passing form the incoming line to inlet of the ITEST pilot plant.
Study of Nitrogen Removal Rate and Trouble shooting of Pilot plant (ITEST)
29
REFERENCES Antonious, P., Hamilton, J., Koopman, B., Jain, R.., Holloway, B.,
Lyberatos, G. & Svoronos. S.A., 1990. Effect of temperature and pH on the effective maximum specific growth rate of nitrifying bacteria. Water Research pergamon press. 24: 97-101.
Donald, F.B., & Russell, B.B. 2000 Coastal eutrophication and agriculture: contributions and solutions. Biological resource management: connecting science and policy. Organization for economic cooperation and development, Paris.
James, E, C. 2001 Our evolving conceptual model of the coastal eutrophication problem. Marine ecology progress series. 210: 223-253.
Dawson, R.N. & Murphy, K. L. 1972 The Temperature dependency of Biological denitrification. Water Research. 6: 71-83.
Katarina, E. 2003 Cost effective reductions of stochastic agricultural loads to the Baltic Sea. Ecological economics. 47: 13-31.
Gasparikova, E., Kapusta, S., Bodik, I., Derco, J. & K Kartochvil. 2005 Evaluation of anaerobic-aerobic wastewater treatment plant operations. Polish journal of environmental studies. 14: 29-34.
HELCOM 2007 Towards a Baltic sea unaffected by eutrophication. HELCOM ministerial meeting; Helsinki commission. Krakow, Poland.
Jingjing, Yang. 2009. Optimization of canon processes and startup processes. Trita-LWR degree project. 1651-064X, LWR-EX-09-33.
Jiachun, Yang., Zang, Li., Daisuke, Hira., Yasuhiro, Fukuzaki. & Kenji, Furukawa. 2011. High-rate nitrogen removal by the Anammox processes at ambient temperature. Journal Bioresource Technology. 102: 672-676.
Mulbarger, M. C. 1970. Modifications of the activated sludge processes for nitrification and denitrification. Presented at 43rd Annual conference of Water Pollution Control Federation, Boston, Massachusetts.
Matuska, M., Fatulova, E., Bodi, I. & Zvara, R. 2010. Study of alternative solutions for wastewater treatment richnava local municipality. Bratislava: Global Water Partnership.
obaja, D., Mace, S., Costa, J., Sans, C. & Mata-Alvarez, J. 2003 Nitrification, denitrification and biological phosphorus removal in piggery wastewater using a sequence batch reactor. Journal Bioresource Technology. 87: 103-111.
Painter, H.A. & Lovesses, J.E. 1981. Effect of temperature and pH value on the growth rate constant of nitrifying bacteria in the activated sludge processes. Water Research pergamon press. 17: 237-248.
Randall, C.W. 2003. Potential and Societl and economic impact of wastewater nutrient removal and recycling. Water Science and Technology. 48: 11-17.
Smith, J.M., Masse, A.N., Feije, W.A. & Kamphate, L.J. 1970 Nitrogen removal from municipal wastewater by columnar denitrification. Presented at A.C.S. Meeting, Chicago.
Svendsen, L. M., Bijl, L., Van der, Boutrup, S. & Norup, B. 2005. NOVANA. National monitoring and assessment programme for the
Venkata Krishna Reddy Yatham TRITA-LWR Degree Project 12:34
30
aquatic and terrestrial environments. Programme description-part 2. National environmental institute, Denmark. NERI technical report 537.
Timothy, M., Lapara, Cindy, H., Nakatsu, Lisa, M. & Pantea, James, E. 2001. Aerobic Biological treatment of a pharmaceutical wastewater: Effect of temperature on COD removal and Bacterial community Development. Water Research. 35: 4417-4425.
Tiziano, Matteo, Maria, Piccardo. 2006. Modeling nitrogen leaching from forest ecosystem: case study using data from SW Sweden. Trita-LWR master thesis project. 1651-064X, LWR-EX-06-07.
Weronika, Wojcik. 2011. Evaluation of microbiological activity during the deammonification process for nitrogen removal. Trita-LWR master thesis project. 1651-064X, LWR-EX-11-26.
Other References Wikipedia, 2012 http://en.wikipedia.org/wiki/Eutrophication Wikipedia, 2012 http://en.wikipedia.org/wiki/Nitrification Wikipedia, 2012 http://en.wikipedia.org/wiki/Denitrification Wikipedia, 2012 http://en.wikipedia.org/wiki/Activated_sludge Wikipedia, 2012 http://en.wikipedia.org/wiki/Total_suspended_solids Activated sludge, 2012 http://water.worldbank.org/shw-resource-guide Sludge volume, 2012 http://www.aquanova.cz/sludge_volume_index.htm

I
Venkata Krishna Reddy Yatham TRITA-LWR Degree Project 12:34
II
appendix
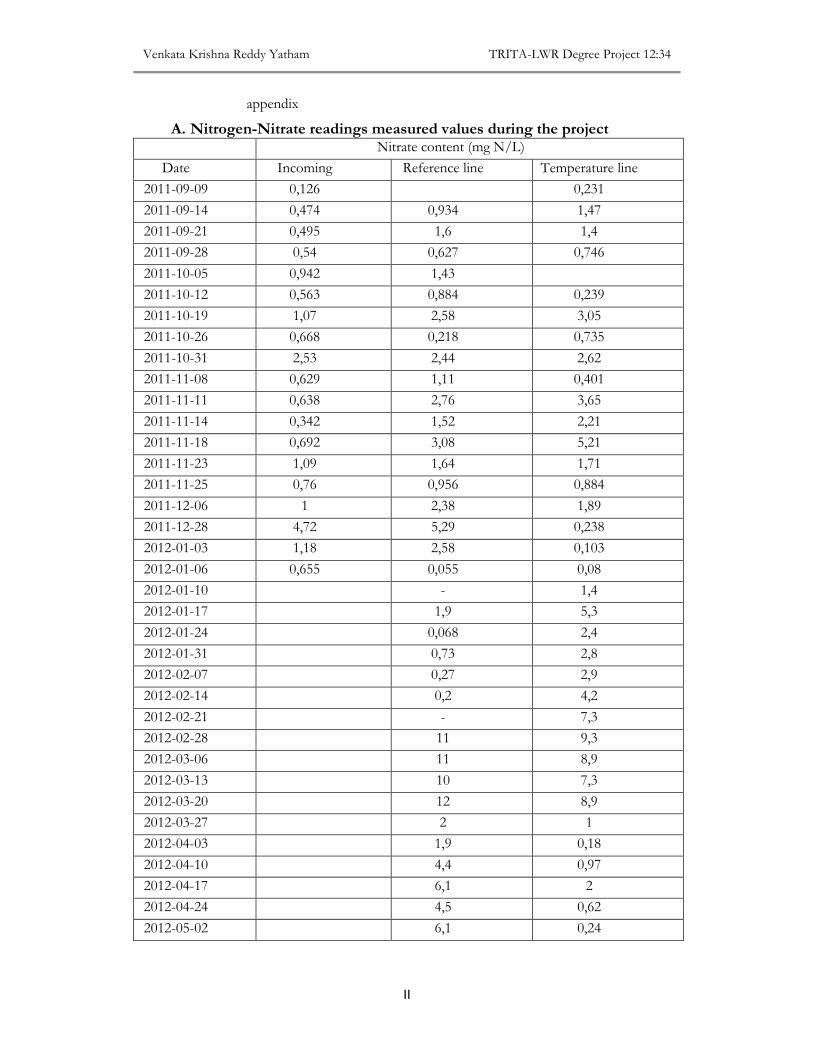
A. Nitrogen-Nitrate readings measured values during the project Nitrate content (mg N/L)
Date Incoming Reference line Temperature line 2011-09-09 0,126 0,231 2011-09-14 0,474 0,934 1,47 2011-09-21 0,495 1,6 1,4 2011-09-28 0,54 0,627 0,746 2011-10-05 0,942 1,43 2011-10-12 0,563 0,884 0,239 2011-10-19 1,07 2,58 3,05 2011-10-26 0,668 0,218 0,735 2011-10-31 2,53 2,44 2,62 2011-11-08 0,629 1,11 0,401 2011-11-11 0,638 2,76 3,65 2011-11-14 0,342 1,52 2,21 2011-11-18 0,692 3,08 5,21 2011-11-23 1,09 1,64 1,71 2011-11-25 0,76 0,956 0,884 2011-12-06 1 2,38 1,89 2011-12-28 4,72 5,29 0,238 2012-01-03 1,18 2,58 0,103 2012-01-06 0,655 0,055 0,08 2012-01-10 - 1,4 2012-01-17 1,9 5,3 2012-01-24 0,068 2,4 2012-01-31 0,73 2,8 2012-02-07 0,27 2,9 2012-02-14 0,2 4,2 2012-02-21 - 7,3 2012-02-28 11 9,3 2012-03-06 11 8,9 2012-03-13 10 7,3 2012-03-20 12 8,9 2012-03-27 2 1 2012-04-03 1,9 0,18 2012-04-10 4,4 0,97 2012-04-17 6,1 2 2012-04-24 4,5 0,62 2012-05-02 6,1 0,24
Study of Nitrogen Removal Rate and Trouble shooting of Pilot plant (ITEST)
III
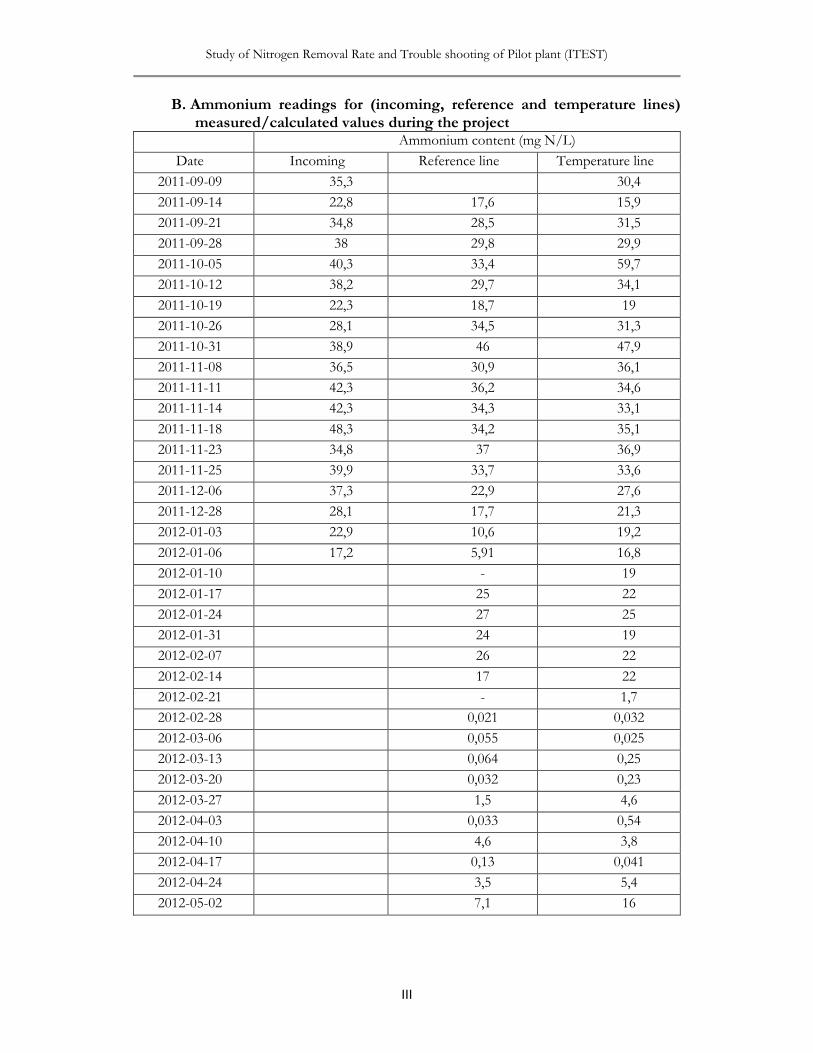
B. Ammonium readings for (incoming, reference and temperature lines) measured/calculated values during the project
Ammonium content (mg N/L) Date Incoming Reference line Temperature line
2011-09-09 35,3 30,4 2011-09-14 22,8 17,6 15,9 2011-09-21 34,8 28,5 31,5 2011-09-28 38 29,8 29,9 2011-10-05 40,3 33,4 59,7 2011-10-12 38,2 29,7 34,1 2011-10-19 22,3 18,7 19 2011-10-26 28,1 34,5 31,3 2011-10-31 38,9 46 47,9 2011-11-08 36,5 30,9 36,1 2011-11-11 42,3 36,2 34,6 2011-11-14 42,3 34,3 33,1 2011-11-18 48,3 34,2 35,1 2011-11-23 34,8 37 36,9 2011-11-25 39,9 33,7 33,6 2011-12-06 37,3 22,9 27,6 2011-12-28 28,1 17,7 21,3 2012-01-03 22,9 10,6 19,2 2012-01-06 17,2 5,91 16,8 2012-01-10 - 19 2012-01-17 25 22 2012-01-24 27 25 2012-01-31 24 19 2012-02-07 26 22 2012-02-14 17 22 2012-02-21 - 1,7 2012-02-28 0,021 0,032 2012-03-06 0,055 0,025 2012-03-13 0,064 0,25 2012-03-20 0,032 0,23 2012-03-27 1,5 4,6 2012-04-03 0,033 0,54 2012-04-10 4,6 3,8 2012-04-17 0,13 0,041 2012-04-24 3,5 5,4 2012-05-02 7,1 16
Venkata Krishna Reddy Yatham TRITA-LWR Degree Project 12:34
IV
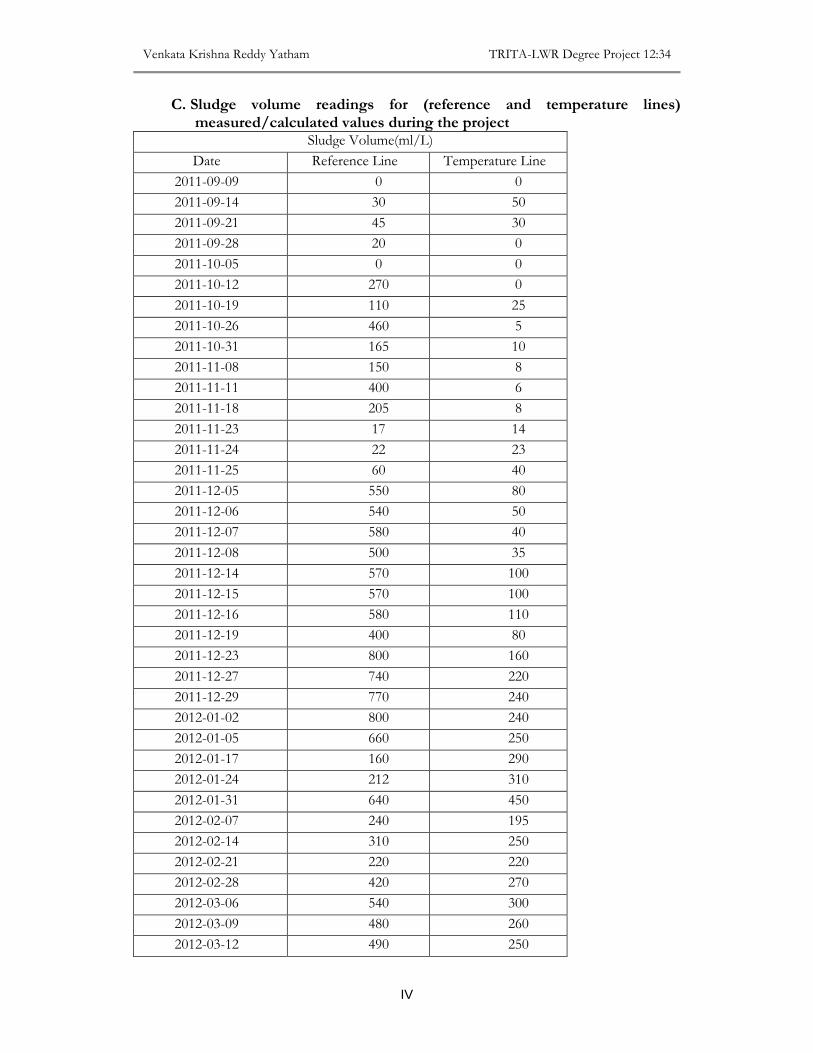
C. Sludge volume readings for (reference and temperature lines) measured/calculated values during the project
Sludge Volume(ml/L) Date Reference Line Temperature Line
2011-09-09 0 0 2011-09-14 30 50 2011-09-21 45 30 2011-09-28 20 0 2011-10-05 0 0 2011-10-12 270 0 2011-10-19 110 25 2011-10-26 460 5 2011-10-31 165 10 2011-11-08 150 8 2011-11-11 400 6 2011-11-18 205 8 2011-11-23 17 14 2011-11-24 22 23 2011-11-25 60 40 2011-12-05 550 80 2011-12-06 540 50 2011-12-07 580 40 2011-12-08 500 35 2011-12-14 570 100 2011-12-15 570 100 2011-12-16 580 110 2011-12-19 400 80 2011-12-23 800 160 2011-12-27 740 220 2011-12-29 770 240 2012-01-02 800 240 2012-01-05 660 250 2012-01-17 160 290 2012-01-24 212 310 2012-01-31 640 450 2012-02-07 240 195 2012-02-14 310 250 2012-02-21 220 220 2012-02-28 420 270 2012-03-06 540 300 2012-03-09 480 260 2012-03-12 490 250
Study of Nitrogen Removal Rate and Trouble shooting of Pilot plant (ITEST)
V
2012-03-14 440 260 2012-03-22 370 290 2012-04-02 290 240 2012-04-10 370 250 2012-04-17 370 430 2012-04-26 340 420 2012-05-04 410 350 2012-05-14 440 220 2012-05-23 630 240
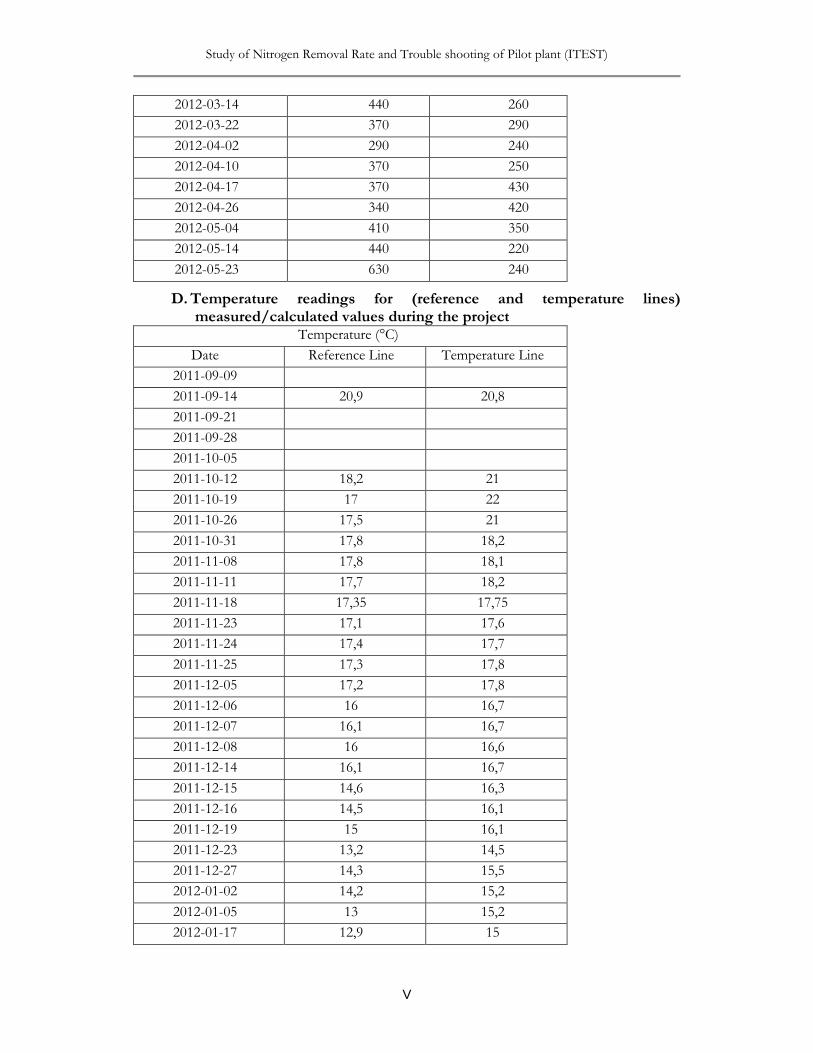
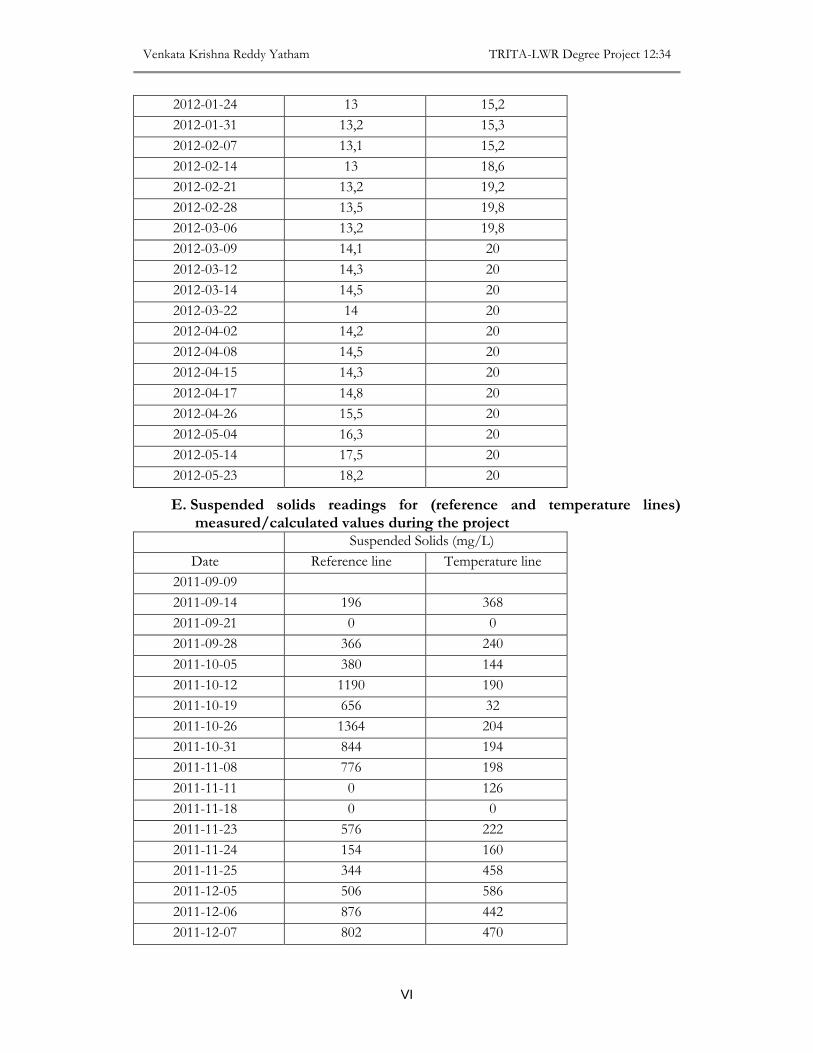
D. Temperature readings for (reference and temperature lines) measured/calculated values during the project
Temperature (°C) Date Reference Line Temperature Line
2011-09-09 2011-09-14 20,9 20,8 2011-09-21 2011-09-28 2011-10-05 2011-10-12 18,2 21 2011-10-19 17 22 2011-10-26 17,5 21 2011-10-31 17,8 18,2 2011-11-08 17,8 18,1 2011-11-11 17,7 18,2 2011-11-18 17,35 17,75 2011-11-23 17,1 17,6 2011-11-24 17,4 17,7 2011-11-25 17,3 17,8 2011-12-05 17,2 17,8 2011-12-06 16 16,7 2011-12-07 16,1 16,7 2011-12-08 16 16,6 2011-12-14 16,1 16,7 2011-12-15 14,6 16,3 2011-12-16 14,5 16,1 2011-12-19 15 16,1 2011-12-23 13,2 14,5 2011-12-27 14,3 15,5 2012-01-02 14,2 15,2 2012-01-05 13 15,2 2012-01-17 12,9 15
Venkata Krishna Reddy Yatham TRITA-LWR Degree Project 12:34
VI
2012-01-24 13 15,2 2012-01-31 13,2 15,3 2012-02-07 13,1 15,2 2012-02-14 13 18,6 2012-02-21 13,2 19,2 2012-02-28 13,5 19,8 2012-03-06 13,2 19,8 2012-03-09 14,1 20 2012-03-12 14,3 20 2012-03-14 14,5 20 2012-03-22 14 20 2012-04-02 14,2 20 2012-04-08 14,5 20 2012-04-15 14,3 20 2012-04-17 14,8 20 2012-04-26 15,5 20 2012-05-04 16,3 20 2012-05-14 17,5 20 2012-05-23 18,2 20
E. Suspended solids readings for (reference and temperature lines) measured/calculated values during the project
Suspended Solids (mg/L) Date Reference line Temperature line
2011-09-09 2011-09-14 196 368 2011-09-21 0 0 2011-09-28 366 240 2011-10-05 380 144 2011-10-12 1190 190 2011-10-19 656 32 2011-10-26 1364 204 2011-10-31 844 194 2011-11-08 776 198 2011-11-11 0 126 2011-11-18 0 0 2011-11-23 576 222 2011-11-24 154 160 2011-11-25 344 458 2011-12-05 506 586 2011-12-06 876 442 2011-12-07 802 470
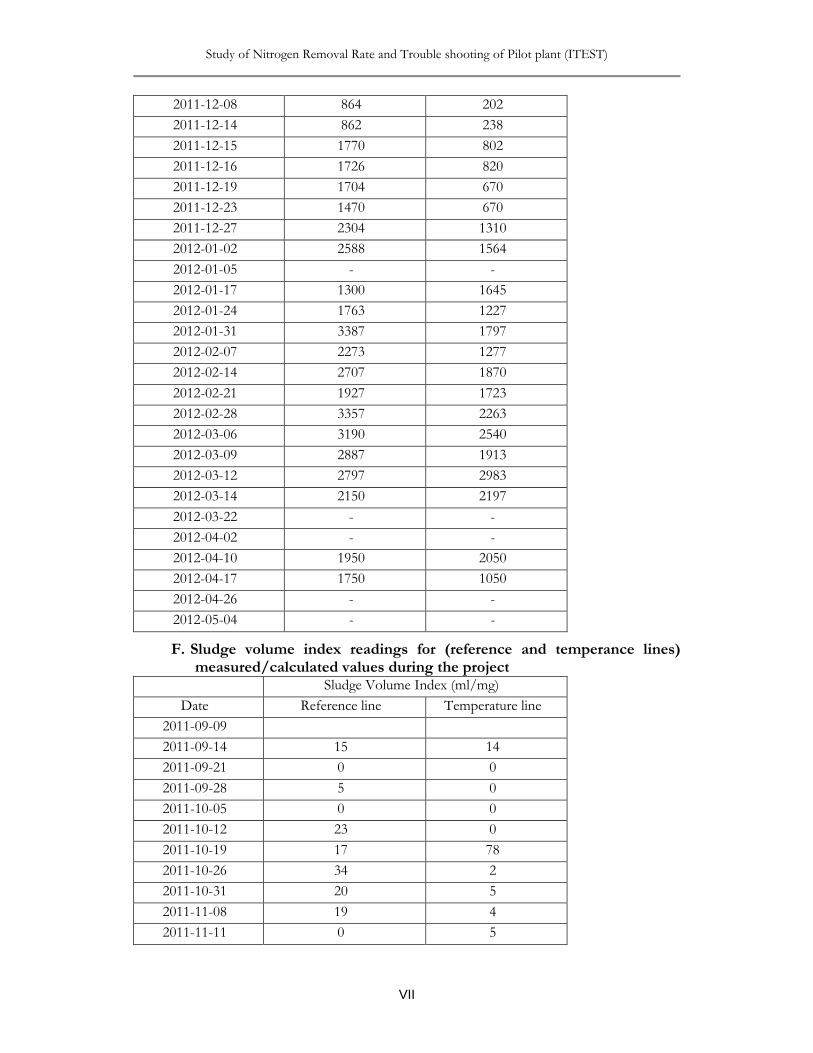
Study of Nitrogen Removal Rate and Trouble shooting of Pilot plant (ITEST)
VII
2011-12-08 864 202 2011-12-14 862 238 2011-12-15 1770 802 2011-12-16 1726 820 2011-12-19 1704 670 2011-12-23 1470 670 2011-12-27 2304 1310 2012-01-02 2588 1564 2012-01-05 - - 2012-01-17 1300 1645 2012-01-24 1763 1227 2012-01-31 3387 1797 2012-02-07 2273 1277 2012-02-14 2707 1870 2012-02-21 1927 1723 2012-02-28 3357 2263 2012-03-06 3190 2540 2012-03-09 2887 1913 2012-03-12 2797 2983 2012-03-14 2150 2197 2012-03-22 - - 2012-04-02 - - 2012-04-10 1950 2050 2012-04-17 1750 1050 2012-04-26 - - 2012-05-04 - -
F. Sludge volume index readings for (reference and temperance lines) measured/calculated values during the project Sludge Volume Index (ml/mg)
Date Reference line Temperature line 2011-09-09 2011-09-14 15 14 2011-09-21 0 0 2011-09-28 5 0 2011-10-05 0 0 2011-10-12 23 0 2011-10-19 17 78 2011-10-26 34 2 2011-10-31 20 5 2011-11-08 19 4 2011-11-11 0 5
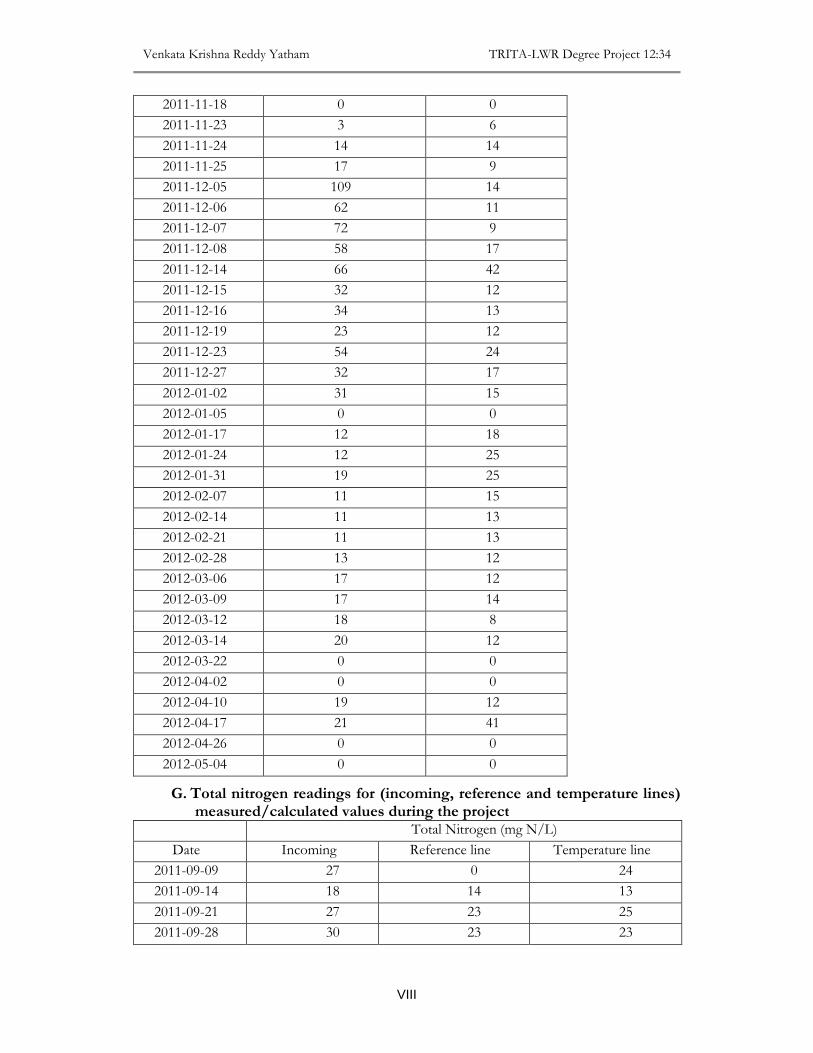
Venkata Krishna Reddy Yatham TRITA-LWR Degree Project 12:34
VIII
2011-11-18 0 0 2011-11-23 3 6 2011-11-24 14 14 2011-11-25 17 9 2011-12-05 109 14 2011-12-06 62 11 2011-12-07 72 9 2011-12-08 58 17 2011-12-14 66 42 2011-12-15 32 12 2011-12-16 34 13 2011-12-19 23 12 2011-12-23 54 24 2011-12-27 32 17 2012-01-02 31 15 2012-01-05 0 0 2012-01-17 12 18 2012-01-24 12 25 2012-01-31 19 25 2012-02-07 11 15 2012-02-14 11 13 2012-02-21 11 13 2012-02-28 13 12 2012-03-06 17 12 2012-03-09 17 14 2012-03-12 18 8 2012-03-14 20 12 2012-03-22 0 0 2012-04-02 0 0 2012-04-10 19 12 2012-04-17 21 41 2012-04-26 0 0 2012-05-04 0 0
G. Total nitrogen readings for (incoming, reference and temperature lines) measured/calculated values during the project
Total Nitrogen (mg N/L) Date Incoming Reference line Temperature line
2011-09-09 27 0 24 2011-09-14 18 14 13 2011-09-21 27 23 25 2011-09-28 30 23 23
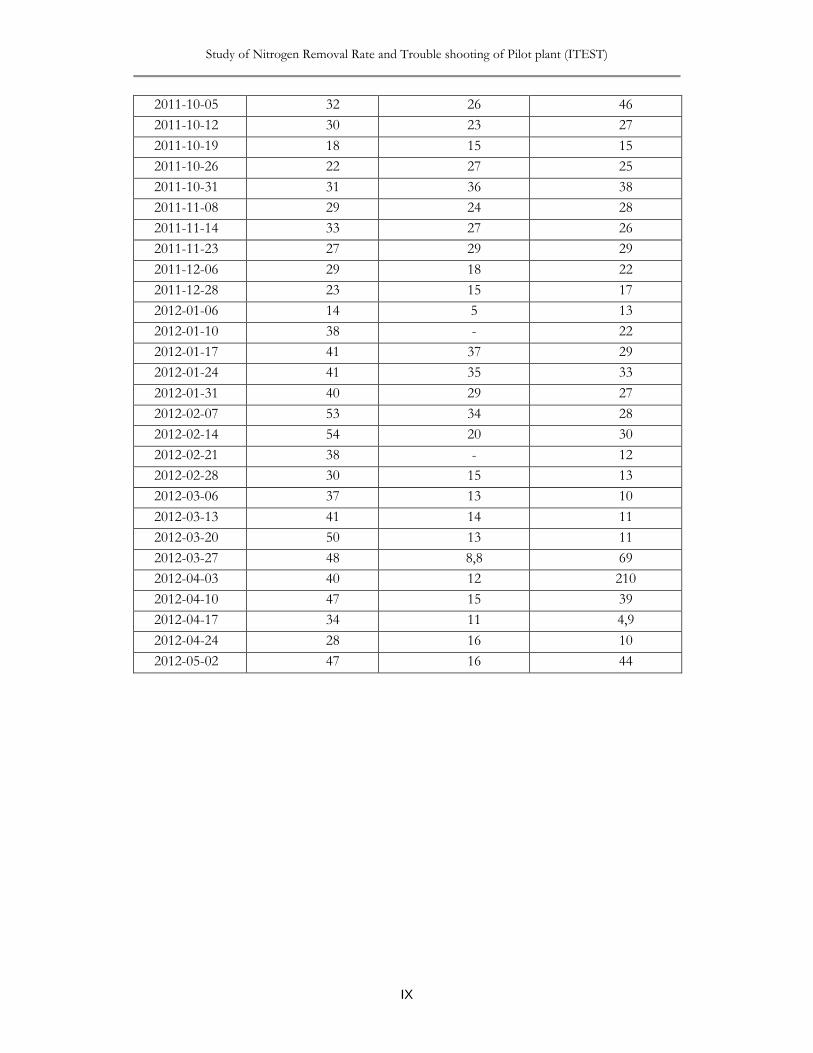
Study of Nitrogen Removal Rate and Trouble shooting of Pilot plant (ITEST)
IX
2011-10-05 32 26 46 2011-10-12 30 23 27 2011-10-19 18 15 15 2011-10-26 22 27 25 2011-10-31 31 36 38 2011-11-08 29 24 28 2011-11-14 33 27 26 2011-11-23 27 29 29 2011-12-06 29 18 22 2011-12-28 23 15 17 2012-01-06 14 5 13 2012-01-10 38 - 22 2012-01-17 41 37 29 2012-01-24 41 35 33 2012-01-31 40 29 27 2012-02-07 53 34 28 2012-02-14 54 20 30 2012-02-21 38 - 12 2012-02-28 30 15 13 2012-03-06 37 13 10 2012-03-13 41 14 11 2012-03-20 50 13 11 2012-03-27 48 8,8 69 2012-04-03 40 12 210 2012-04-10 47 15 39 2012-04-17 34 11 4,9 2012-04-24 28 16 10 2012-05-02 47 16 44
Related Documents