A Test Engineer’s Evaluation of Graphical Programming By Steve Mackin, Endgate Corporation Steve Mackin is currently a senior project engineer with Endgate Corporation in Sunnyvale, California. Steve was with Allied Signal Aerospace (formerly Garrett) for 13 years as an aerodynamic engineer responsible for the aerodynamic design and test of fans and compressors for propulsive jet engines. He holds a B.S. in Mechanical Engineering from Iowa State. Steve is a member of the HP VEE electronic users group and can be reached at [email protected]. Visit the Endgate Corporation home page at http://www.endgate.com.

Welcome message from author
This document is posted to help you gain knowledge. Please leave a comment to let me know what you think about it! Share it to your friends and learn new things together.
Transcript
A Test Engineer’s Evaluationof Graphical Programming
By Steve Mackin, Endgate Corporation
Steve Mackin is currently a senior project engineer with EndgateCorporation in Sunnyvale, California. Steve was with AlliedSignal Aerospace (formerly Garrett) for 13 years as anaerodynamic engineer responsible for the aerodynamic design andtest of fans and compressors for propulsive jet engines. He holdsa B.S. in Mechanical Engineering from Iowa State.
Steve is a member of the HP VEE electronic users group and can bereached at [email protected]. Visit the Endgate Corporation home page at http://www.endgate.com.
A Test Engineer’s Evaluation of Graphical ProgrammingBy Steve Mackin, Endgate Corporation
Page 2
Introduction
The development of graphical programming hasdramatically changed the way that test andmeasurement software is written today.Graphical programming has made it possible tocreate reliable software faster than ever beforeand two major suppliers have emerged asleaders in graphical programming software.This article will seek to compare traditionalprogramming to graphical, explore basicprogramming elements of HP VEE and NationalInstruments LabVIEW, explain their differencesand, through an example program, demonstratetheir differences. This article will compare basicprogramming elements only, not advancedlibraries or instrument control drivers.
Traditional Programming vs. GraphicalProgramming
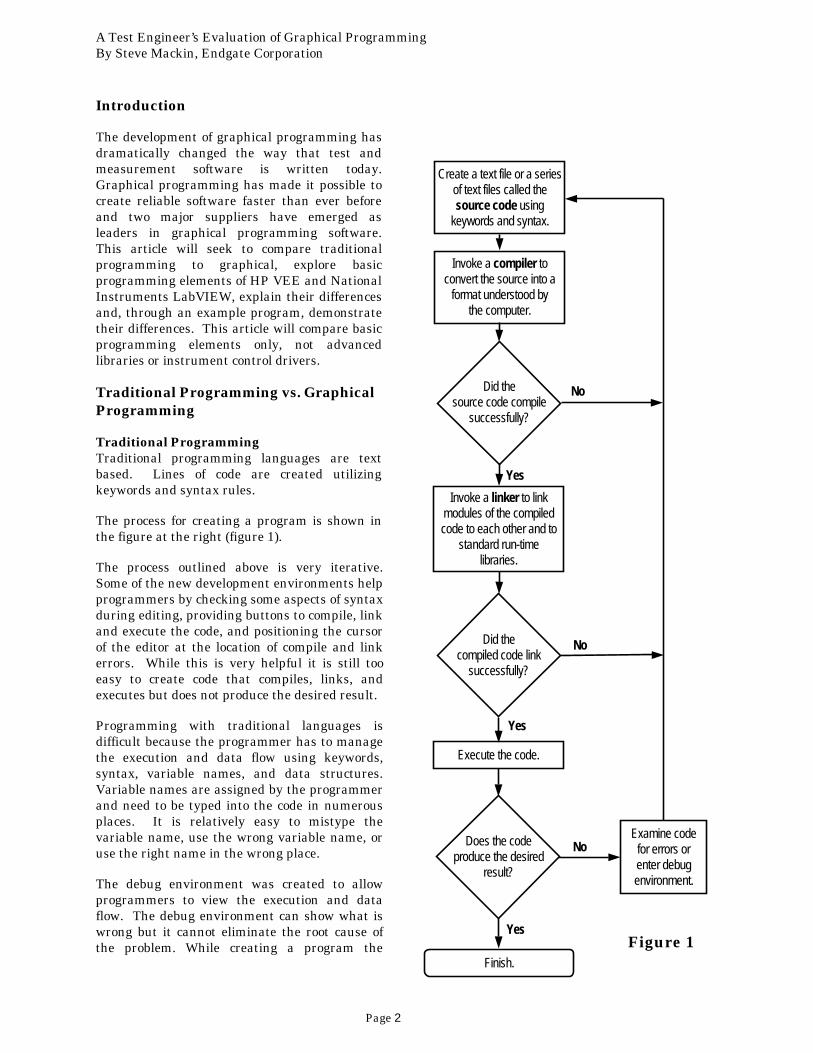
Traditional ProgrammingTraditional programming languages are textbased. Lines of code are created utilizingkeywords and syntax rules.
The process for creating a program is shown inthe figure at the right (figure 1).
The process outlined above is very iterative.Some of the new development environments helpprogrammers by checking some aspects of syntaxduring editing, providing buttons to compile, linkand execute the code, and positioning the cursorof the editor at the location of compile and linkerrors. While this is very helpful it is still tooeasy to create code that compiles, links, andexecutes but does not produce the desired result.
Programming with traditional languages isdifficult because the programmer has to managethe execution and data flow using keywords,syntax, variable names, and data structures.Variable names are assigned by the programmerand need to be typed into the code in numerousplaces. It is relatively easy to mistype thevariable name, use the wrong variable name, oruse the right name in the wrong place.
The debug environment was created to allowprogrammers to view the execution and dataflow. The debug environment can show what iswrong but it cannot eliminate the root cause ofthe problem. While creating a program the
Create a text file or a seriesof text files called thesource code using
keywords and syntax.
Finish.
Examine codefor errors orenter debugenvironment.
Does the codeproduce the desired
result?
Did thecompiled code link
successfully?
Did thesource code compile
successfully?
Invoke a compiler toconvert the source into a
format understood bythe computer.
Invoke a linker to linkmodules of the compiledcode to each other and to
standard run-timelibraries.
Execute the code.
Yes
No
No
No
Yes
Yes
Figure 1
A Test Engineer’s Evaluation of Graphical ProgrammingBy Steve Mackin, Endgate Corporation
Page 3
programmer encrypts the execution and dataflow. To derive the execution flow by just lookingat source code can be very difficult even for theauthor. That is why it is called code!
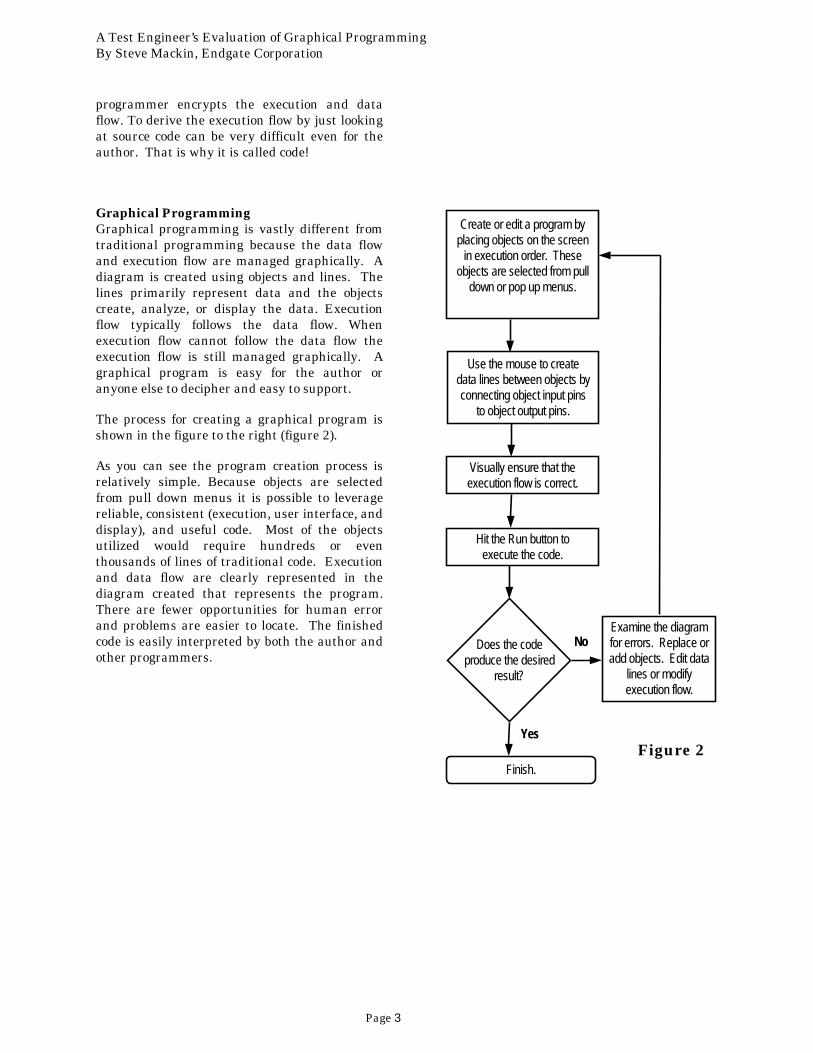
Graphical ProgrammingGraphical programming is vastly different fromtraditional programming because the data flowand execution flow are managed graphically. Adiagram is created using objects and lines. Thelines primarily represent data and the objectscreate, analyze, or display the data. Executionflow typically follows the data flow. Whenexecution flow cannot follow the data flow theexecution flow is still managed graphically. Agraphical program is easy for the author oranyone else to decipher and easy to support.
The process for creating a graphical program isshown in the figure to the right (figure 2).
As you can see the program creation process isrelatively simple. Because objects are selectedfrom pull down menus it is possible to leveragereliable, consistent (execution, user interface, anddisplay), and useful code. Most of the objectsutilized would require hundreds or eventhousands of lines of traditional code. Executionand data flow are clearly represented in thediagram created that represents the program.There are fewer opportunities for human errorand problems are easier to locate. The finishedcode is easily interpreted by both the author andother programmers.
Create or edit a program byplacing objects on the screen
in execution order. Theseobjects are selected from pull
down or pop up menus.
Finish.
Examine the diagramfor errors. Replace oradd objects. Edit data
lines or modifyexecution flow.
Does the codeproduce the desired
result?
Use the mouse to createdata lines between objects byconnecting object input pins
to object output pins.
No
YesFigure 2
Visually ensure that theexecution flow is correct.
Hit the Run button toexecute the code.
A Test Engineer’s Evaluation of Graphical ProgrammingBy Steve Mackin, Endgate Corporation
Page 4
LabVIEW vs. HP VEE
LabVIEW from National Instruments and VEE;from Hewlett Packard are the two majorgraphical programming languages in use today.While they perform similar functions they usesignificantly different methods. Both havesignificant strong points as well as drawbacks.
Basic ComponentsPrimitive objects are objects, which create,analyze, or display data. These objects areselected from pull down or pop up menus. Theycan be assembled and linked with lines creatinggraphical programs, which can be made intofunctions. Functions in LabVIEW are called VI’s(vee-eyes not sixes) and functions in HP VEE arecalled User Functions. A pin is a point on anobject which indicates that a connection may bemade at that location. Most objects contain atleast one pin and there are significant differencesin the way pins are handled in LabVIEW and HPVEE. Lines represent data and can either beinputs to the object or outputs from the object.Lines can also be used to sequence the executionof objects in both LabVIEW and HP VEE. Thecolor and style of lines indicate the type of datarepresented by the lines. LabVIEW and HP VEEhave many data types and styles in common buteach also employs unique data types and styles.The utilization of data types and styles ingraphical programming is a very complex subjectand beyond the scope of this article but somebasic differences will be described.
Object Comparison1. LabVIEW objects are very graphicalcompared to HP VEE objects. They use shapes,colors, and text to convey lots of information. AllLabVIEW objects have labels and theprogrammer can type in a meaningful label. HPVEE objects are always rectangular and theyalso have labels which the programmer can useto describe what the object does. A HP VEEprogrammer can color objects and utilize bitmapsif he or she wants to alter the appearance ofobjects.
2. All HP VEE objects can be resized with noimpact on the execution and data flow. MostLabVIEW objects cannot be resized and the onesthat can be resized can only be resized bycreating more pins, which changes the program.All LabVIEW VI’s are the same size so there is alimit to the number of pins, which will fit on anobject. This may seem like a purely cosmeticconcern but re-sizing objects can really enhancethe readability of a graphical program (See theexample program comparison at the end of thisarticle).
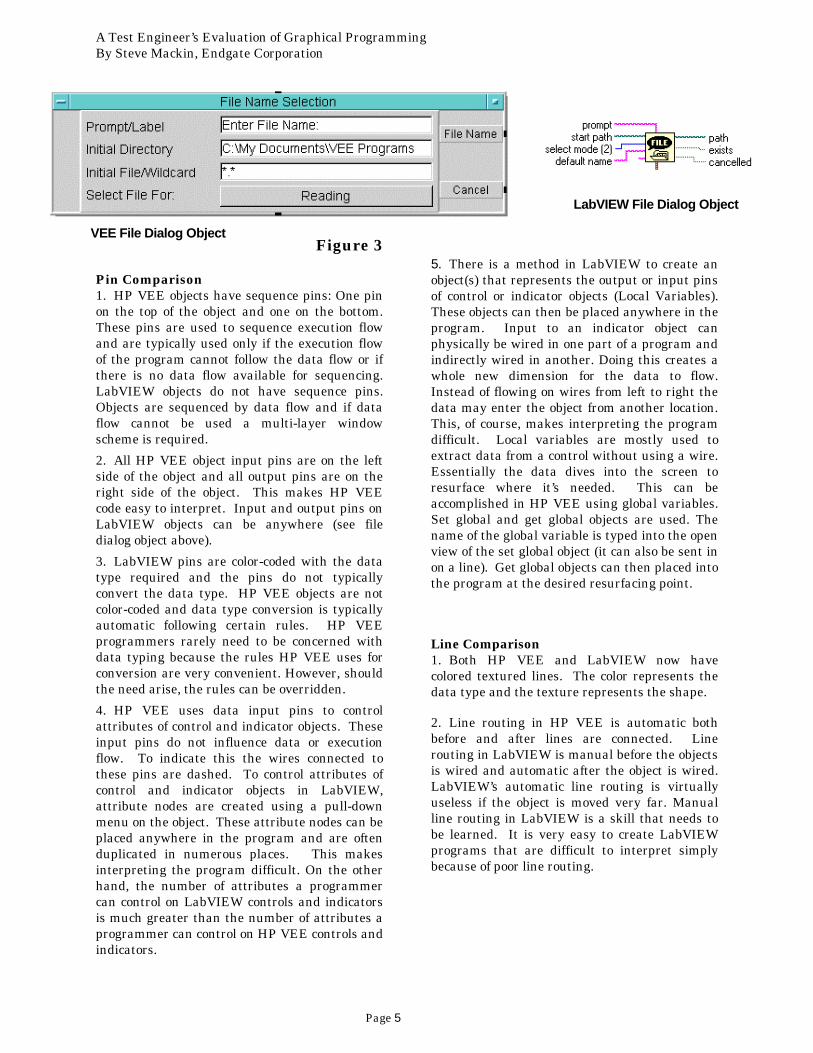
3. HP VEE objects have two views (open andclosed). Most HP VEE objects will allow theprogrammer to type data into the object tocontrol the action of that object. Most LabVIEWobjects require that data be wired into the objectfrom other objects. The example belowillustrates how information can be typed into theopen view of a HP VEE object and the sameinformation must be wired into a LabVIEWobject.
A Test Engineer’s Evaluation of Graphical ProgrammingBy Steve Mackin, Endgate Corporation
Page 5
Pin Comparison1. HP VEE objects have sequence pins: One pinon the top of the object and one on the bottom.These pins are used to sequence execution flowand are typically used only if the execution flowof the program cannot follow the data flow or ifthere is no data flow available for sequencing.LabVIEW objects do not have sequence pins.Objects are sequenced by data flow and if dataflow cannot be used a multi-layer windowscheme is required.
2. All HP VEE object input pins are on the leftside of the object and all output pins are on theright side of the object. This makes HP VEEcode easy to interpret. Input and output pins onLabVIEW objects can be anywhere (see filedialog object above).
3. LabVIEW pins are color-coded with the datatype required and the pins do not typicallyconvert the data type. HP VEE objects are notcolor-coded and data type conversion is typicallyautomatic following certain rules. HP VEEprogrammers rarely need to be concerned withdata typing because the rules HP VEE uses forconversion are very convenient. However, shouldthe need arise, the rules can be overridden.
4. HP VEE uses data input pins to controlattributes of control and indicator objects. Theseinput pins do not influence data or executionflow. To indicate this the wires connected tothese pins are dashed. To control attributes ofcontrol and indicator objects in LabVIEW,attribute nodes are created using a pull-downmenu on the object. These attribute nodes can beplaced anywhere in the program and are oftenduplicated in numerous places. This makesinterpreting the program difficult. On the otherhand, the number of attributes a programmercan control on LabVIEW controls and indicatorsis much greater than the number of attributes aprogrammer can control on HP VEE controls andindicators.
5. There is a method in LabVIEW to create anobject(s) that represents the output or input pinsof control or indicator objects (Local Variables).These objects can then be placed anywhere in theprogram. Input to an indicator object canphysically be wired in one part of a program andindirectly wired in another. Doing this creates awhole new dimension for the data to flow.Instead of flowing on wires from left to right thedata may enter the object from another location.This, of course, makes interpreting the programdifficult. Local variables are mostly used toextract data from a control without using a wire.Essentially the data dives into the screen toresurface where it’s needed. This can beaccomplished in HP VEE using global variables.Set global and get global objects are used. Thename of the global variable is typed into the openview of the set global object (it can also be sent inon a line). Get global objects can then placed intothe program at the desired resurfacing point.
Line Comparison1. Both HP VEE and LabVIEW now havecolored textured lines. The color represents thedata type and the texture represents the shape.
2. Line routing in HP VEE is automatic bothbefore and after lines are connected. Linerouting in LabVIEW is manual before the objectsis wired and automatic after the object is wired.LabVIEW’s automatic line routing is virtuallyuseless if the object is moved very far. Manualline routing in LabVIEW is a skill that needs tobe learned. It is very easy to create LabVIEWprograms that are difficult to interpret simplybecause of poor line routing.
Figure 3VEE File Dialog Object
LabVIEW File Dialog Object
A Test Engineer’s Evaluation of Graphical ProgrammingBy Steve Mackin, Endgate Corporation
Page 6
Data Types and Shapes Comparison
1. LabVIEW data types and shapes are verysimilar to traditional programming languagedata types and shapes. HP VEE data types andshapes are more specific to the test andmeasurement field. For instance HP VEE has aWaveform data type which is a 1-D real arraywith time domain mapping information.Whether the unique data types in HP VEE areuseful depends upon what type of datamanipulation the program requires. If timedomain type data is dominant HP VEE woulddefinitely be easier to work with.2. Data type conversion is one area where HPVEE really out-performs LabVIEW. Oftenprogrammers need to add strings and numberstogether. In HP VEE strings and numbers aresimply wired to an (a+b) formula object and theresult is a string. The default number to stringconversion is typically sufficient. To do the sametask in LabVIEW a concatenate string objectmust be used and the number must be convertedto a string first using a conversion object. Whilethis seems like a minor nuisance it illustrates afundamental difference between LabVIEW andHP VEE. LabVIEW programmers need to worrya lot more than HP VEE programmers aboutdata type. This is especially true when creatingVIs. In LabVIEW you nearly always end upspecifying a data type for all the input pins evenif the data type is of no significance. HP VEEprogrammers rarely force a data type on inputpins.
3. Both LabVIEW and HP VEE have a veryuseful composite data type, which is created bycombining other data types. A Cluster inLabVIEW is identical to a Record in HP VEE.LabVIEW and HP VEE both have tools forcreating and obtaining information fromClusters/Records.
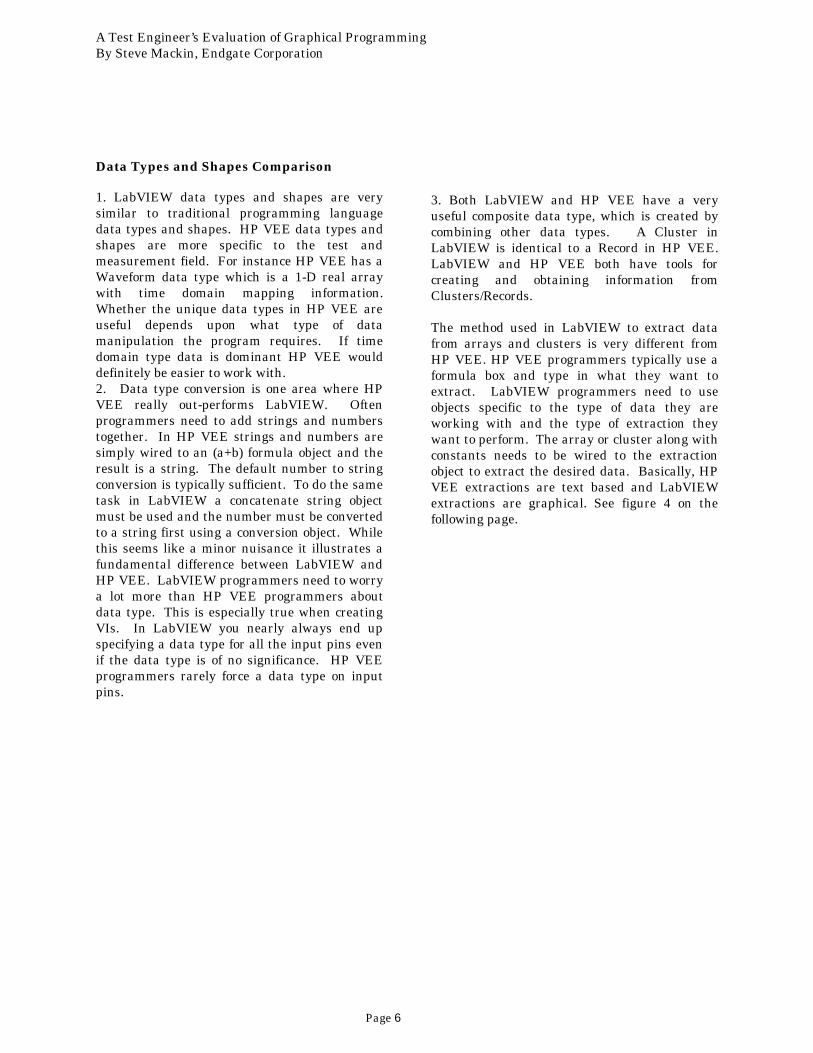
The method used in LabVIEW to extract datafrom arrays and clusters is very different fromHP VEE. HP VEE programmers typically use aformula box and type in what they want toextract. LabVIEW programmers need to useobjects specific to the type of data they areworking with and the type of extraction theywant to perform. The array or cluster along withconstants needs to be wired to the extractionobject to extract the desired data. Basically, HPVEE extractions are text based and LabVIEWextractions are graphical. See figure 4 on thefollowing page.
A Test Engineer’s Evaluation of Graphical ProgrammingBy Steve Mackin, Endgate Corporation
Page 7
VEE Model
LabVIEW Model
Figure 4
12 Objects and 13 Wires
6 Objects and 5 Wires
A Test Engineer’s Evaluation of Graphical ProgrammingBy Steve Mackin, Endgate Corporation
Page 8
In addition to these major differences betweenthe two programs quite a number of more subtledifferences should be noted.
Program Flow (Loops, Case Structures)The techniques used to implement Loops andCase Structures in LabVIEW and HP VEE arevery different and best described graphically.
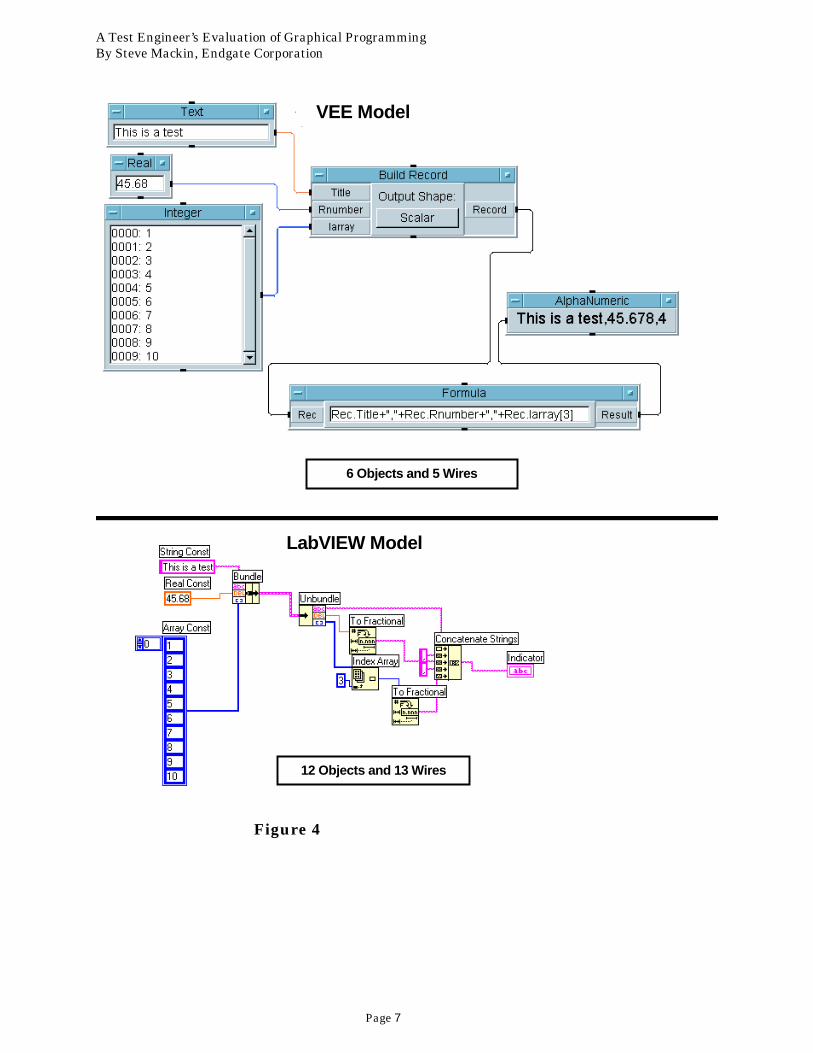
Looping StructuresIn LabVIEW, surrounding objects to be iteratedon with a loop structure box creates loops. Inputand output pins on the box can be set to indexincoming data or collect outgoing data into anarray. Shift registers may also be added to theloop to pass information from one iteration to thenext. HP VEE loops are defined using loopobjects and sequence pins. A collector object isused to collect outgoing data into an array.Looping structures in HP VEE are harder toidentify than looping structures in LabVIEW.See figure 5.
VEE Model
LabVIEW Model
Figure 5
A Test Engineer’s Evaluation of Graphical ProgrammingBy Steve Mackin, Endgate Corporation
Page 9
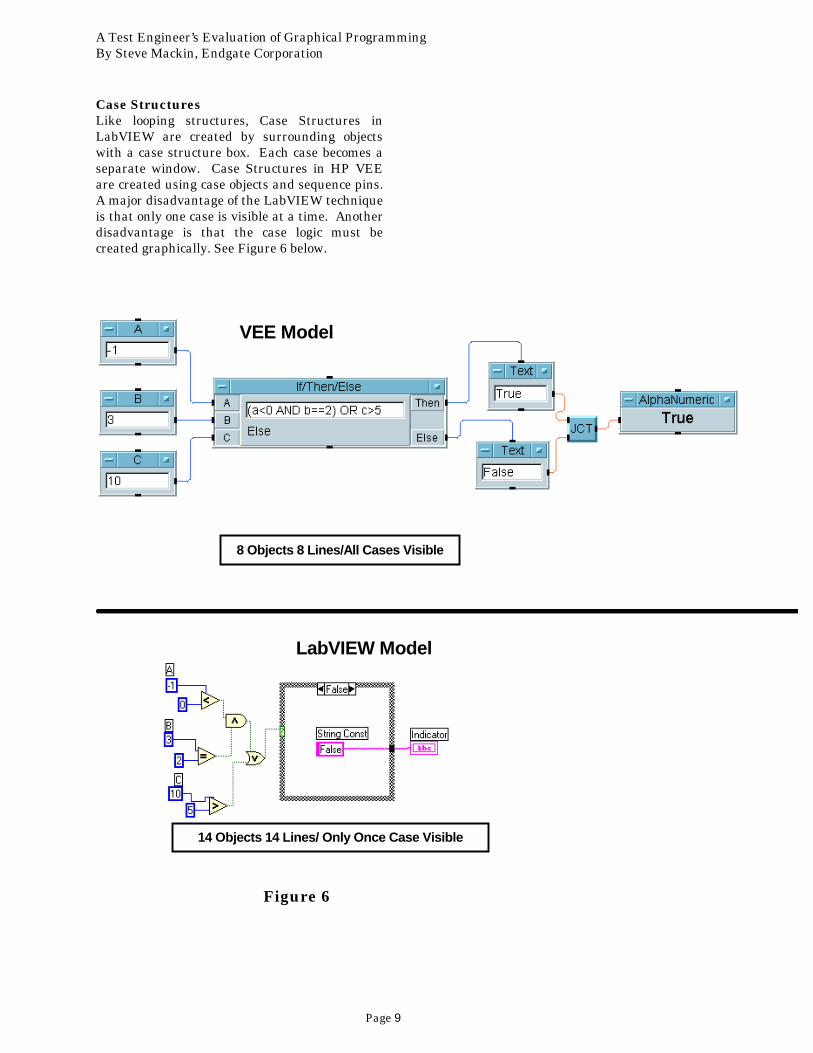
Case StructuresLike looping structures, Case Structures inLabVIEW are created by surrounding objectswith a case structure box. Each case becomes aseparate window. Case Structures in HP VEEare created using case objects and sequence pins.A major disadvantage of the LabVIEW techniqueis that only one case is visible at a time. Anotherdisadvantage is that the case logic must becreated graphically. See Figure 6 below.
VEE Model
LabVIEW Model
Figure 6
14 Objects 14 Lines/ Only Once Case Visible
8 Objects 8 Lines/All Cases Visible
A Test Engineer’s Evaluation of Graphical ProgrammingBy Steve Mackin, Endgate Corporation
Page 10
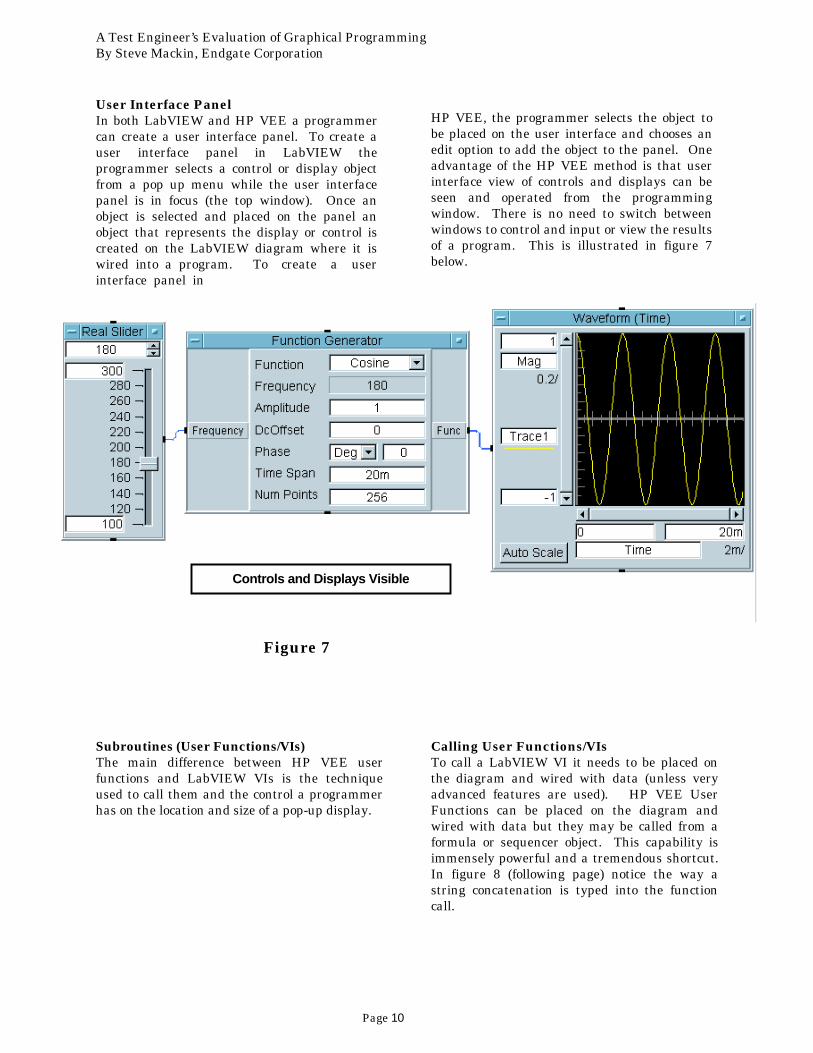
User Interface PanelIn both LabVIEW and HP VEE a programmercan create a user interface panel. To create auser interface panel in LabVIEW theprogrammer selects a control or display objectfrom a pop up menu while the user interfacepanel is in focus (the top window). Once anobject is selected and placed on the panel anobject that represents the display or control iscreated on the LabVIEW diagram where it iswired into a program. To create a userinterface panel in
HP VEE, the programmer selects the object tobe placed on the user interface and chooses anedit option to add the object to the panel. Oneadvantage of the HP VEE method is that userinterface view of controls and displays can beseen and operated from the programmingwindow. There is no need to switch betweenwindows to control and input or view the resultsof a program. This is illustrated in figure 7below.
Subroutines (User Functions/VIs)The main difference between HP VEE userfunctions and LabVIEW VIs is the techniqueused to call them and the control a programmerhas on the location and size of a pop-up display.
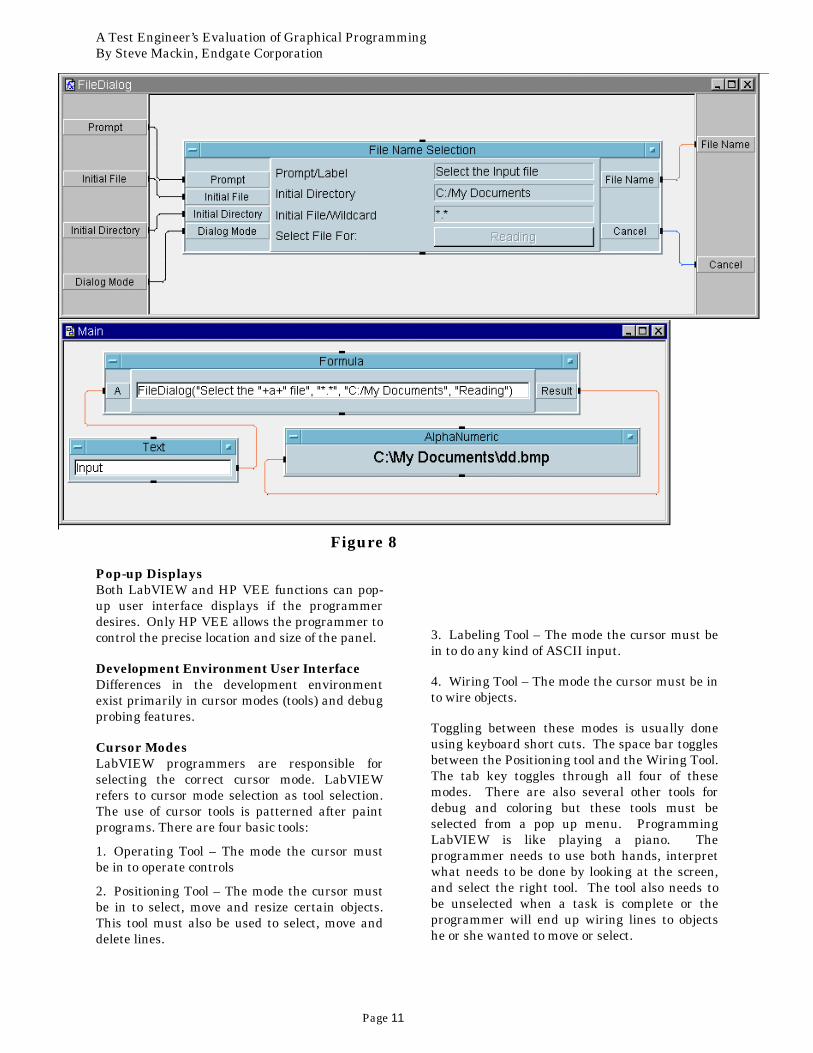
Calling User Functions/VIsTo call a LabVIEW VI it needs to be placed onthe diagram and wired with data (unless veryadvanced features are used). HP VEE UserFunctions can be placed on the diagram andwired with data but they may be called from aformula or sequencer object. This capability isimmensely powerful and a tremendous shortcut.In figure 8 (following page) notice the way astring concatenation is typed into the functioncall.
Figure 7
Controls and Displays Visible
A Test Engineer’s Evaluation of Graphical ProgrammingBy Steve Mackin, Endgate Corporation
Page 11
Pop-up DisplaysBoth LabVIEW and HP VEE functions can pop-up user interface displays if the programmerdesires. Only HP VEE allows the programmer tocontrol the precise location and size of the panel.
Development Environment User InterfaceDifferences in the development environmentexist primarily in cursor modes (tools) and debugprobing features.
Cursor ModesLabVIEW programmers are responsible forselecting the correct cursor mode. LabVIEWrefers to cursor mode selection as tool selection.The use of cursor tools is patterned after paintprograms. There are four basic tools:
1. Operating Tool – The mode the cursor mustbe in to operate controls
2. Positioning Tool – The mode the cursor mustbe in to select, move and resize certain objects.This tool must also be used to select, move anddelete lines.
3. Labeling Tool – The mode the cursor must bein to do any kind of ASCII input.
4. Wiring Tool – The mode the cursor must be into wire objects.
Toggling between these modes is usually doneusing keyboard short cuts. The space bar togglesbetween the Positioning tool and the Wiring Tool.The tab key toggles through all four of thesemodes. There are also several other tools fordebug and coloring but these tools must beselected from a pop up menu. ProgrammingLabVIEW is like playing a piano. Theprogrammer needs to use both hands, interpretwhat needs to be done by looking at the screen,and select the right tool. The tool also needs tobe unselected when a task is complete or theprogrammer will end up wiring lines to objectshe or she wanted to move or select.
Figure 8
A Test Engineer’s Evaluation of Graphical ProgrammingBy Steve Mackin, Endgate Corporation
Page 12
HP VEE’s cursor mode is automatically selectedby HP VEE depending on where the cursor islocated. This is a great feature. For example ifthe cursor is:
1. close to pins it becomes a wiring tool.
2. over an object it becomes a positioning tool.
3. over ASCII data it becomes a labeling tool.
4. on a line it becomes a probe
5. over nothing it becomes a scrolling tool.
This makes writing programs in HP VEE mucheasier than LabVIEW. The programmer doesnot have to think about acquiring tools, usingthem, and then switching to other tools. It is likeworking on a car with a magic hand that changesinto a wrench or screwdriver depending onwhether it is close to a nut or a screw.
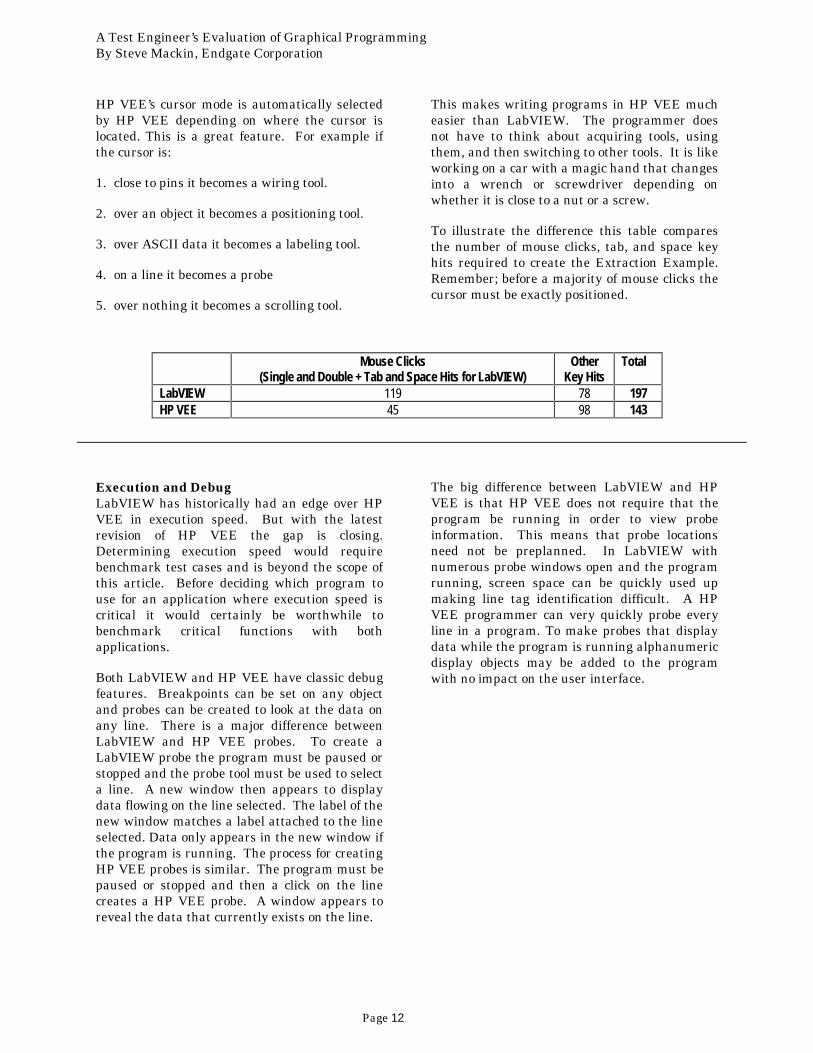
To illustrate the difference this table comparesthe number of mouse clicks, tab, and space keyhits required to create the Extraction Example.Remember; before a majority of mouse clicks thecursor must be exactly positioned.
Mouse Clicks(Single and Double + Tab and Space Hits for LabVIEW)
OtherKey Hits
Total
LabVIEW 119 78 197HP VEE 45 98 143
Execution and DebugLabVIEW has historically had an edge over HPVEE in execution speed. But with the latestrevision of HP VEE the gap is closing.Determining execution speed would requirebenchmark test cases and is beyond the scope ofthis article. Before deciding which program touse for an application where execution speed iscritical it would certainly be worthwhile tobenchmark critical functions with bothapplications.
Both LabVIEW and HP VEE have classic debugfeatures. Breakpoints can be set on any objectand probes can be created to look at the data onany line. There is a major difference betweenLabVIEW and HP VEE probes. To create aLabVIEW probe the program must be paused orstopped and the probe tool must be used to selecta line. A new window then appears to displaydata flowing on the line selected. The label of thenew window matches a label attached to the lineselected. Data only appears in the new window ifthe program is running. The process for creatingHP VEE probes is similar. The program must bepaused or stopped and then a click on the linecreates a HP VEE probe. A window appears toreveal the data that currently exists on the line.
The big difference between LabVIEW and HPVEE is that HP VEE does not require that theprogram be running in order to view probeinformation. This means that probe locationsneed not be preplanned. In LabVIEW withnumerous probe windows open and the programrunning, screen space can be quickly used upmaking line tag identification difficult. A HPVEE programmer can very quickly probe everyline in a program. To make probes that displaydata while the program is running alphanumericdisplay objects may be added to the programwith no impact on the user interface.
A Test Engineer’s Evaluation of Graphical ProgrammingBy Steve Mackin, Endgate Corporation
Page 13
Example Program Comparison
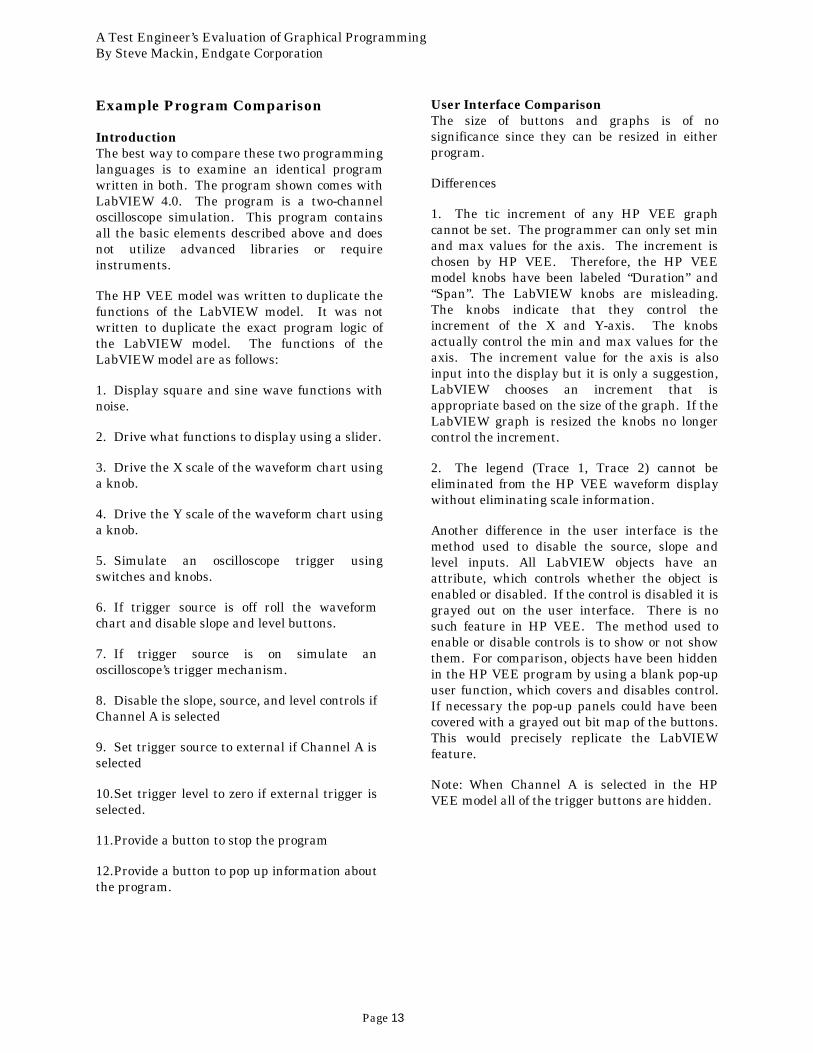
IntroductionThe best way to compare these two programminglanguages is to examine an identical programwritten in both. The program shown comes withLabVIEW 4.0. The program is a two-channeloscilloscope simulation. This program containsall the basic elements described above and doesnot utilize advanced libraries or requireinstruments.
The HP VEE model was written to duplicate thefunctions of the LabVIEW model. It was notwritten to duplicate the exact program logic ofthe LabVIEW model. The functions of theLabVIEW model are as follows:
1. Display square and sine wave functions withnoise.
2. Drive what functions to display using a slider.
3. Drive the X scale of the waveform chart usinga knob.
4. Drive the Y scale of the waveform chart usinga knob.
5. Simulate an oscilloscope trigger usingswitches and knobs.
6. If trigger source is off roll the waveformchart and disable slope and level buttons.
7. If trigger source is on simulate anoscilloscope’s trigger mechanism.
8. Disable the slope, source, and level controls ifChannel A is selected
9. Set trigger source to external if Channel A isselected
10. Set trigger level to zero if external trigger isselected.
11. Provide a button to stop the program
12. Provide a button to pop up information aboutthe program.
User Interface ComparisonThe size of buttons and graphs is of nosignificance since they can be resized in eitherprogram.
Differences
1. The tic increment of any HP VEE graphcannot be set. The programmer can only set minand max values for the axis. The increment ischosen by HP VEE. Therefore, the HP VEEmodel knobs have been labeled “Duration” and“Span”. The LabVIEW knobs are misleading.The knobs indicate that they control theincrement of the X and Y-axis. The knobsactually control the min and max values for theaxis. The increment value for the axis is alsoinput into the display but it is only a suggestion,LabVIEW chooses an increment that isappropriate based on the size of the graph. If theLabVIEW graph is resized the knobs no longercontrol the increment.
2. The legend (Trace 1, Trace 2) cannot beeliminated from the HP VEE waveform displaywithout eliminating scale information.
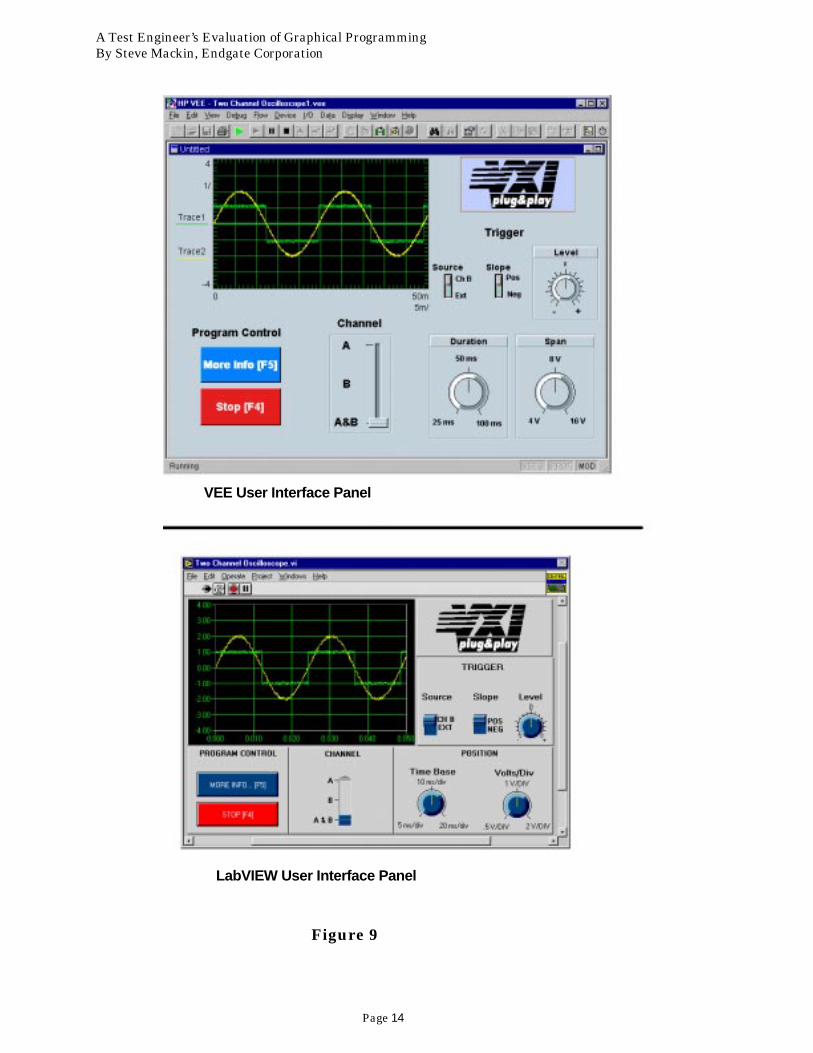
Another difference in the user interface is themethod used to disable the source, slope andlevel inputs. All LabVIEW objects have anattribute, which controls whether the object isenabled or disabled. If the control is disabled it isgrayed out on the user interface. There is nosuch feature in HP VEE. The method used toenable or disable controls is to show or not showthem. For comparison, objects have been hiddenin the HP VEE program by using a blank pop-upuser function, which covers and disables control.If necessary the pop-up panels could have beencovered with a grayed out bit map of the buttons.This would precisely replicate the LabVIEWfeature.
Note: When Channel A is selected in the HPVEE model all of the trigger buttons are hidden.
A Test Engineer’s Evaluation of Graphical ProgrammingBy Steve Mackin, Endgate Corporation
Page 14
Figure 9
VEE User Interface Panel
LabVIEW User Interface Panel
A Test Engineer’s Evaluation of Graphical ProgrammingBy Steve Mackin, Endgate Corporation
Page 15
Figure 10LabVIEW User Interface with Source=Ext
VEE Model User Interface with Source=Ext
A Test Engineer’s Evaluation of Graphical ProgrammingBy Steve Mackin, Endgate Corporation
Page 16
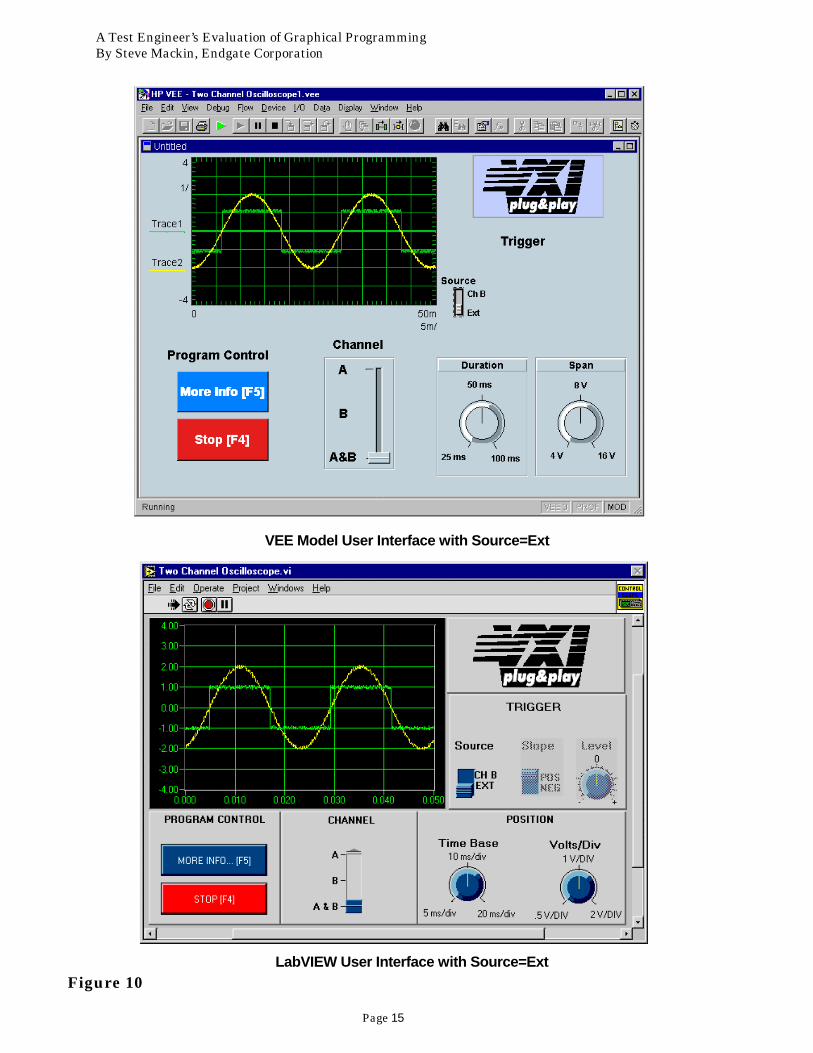
Program Comparison: LabVIEW Model
Explanation of LabVIEW Main Program(figure 11)The sequence frame (Labeled “A”) containsattribute nodes for the trigger controls. Thepurpose of this sequence frame is to enable theswitches if they were left disabled by the useraborting the program. The While Loop (Labeled“B”) contains most of the program logic andcontrols. The Volt/Div control (Labeled “C”) iswired to a case structure, which containsconstants that are built into a cluster and thenwired into the Y Range attribute of the waveformdisplay (Labeled “D”). The Time Base control(Labeled “E”) is wired to a case structure thatcontrols the X Range attribute of the waveformdisplay. This case structure also sets upfrequency and time domain information for thecase structure above. The rest of the controls(Select Channel, Level, and Slope) are wired intothe case structure labeled “F”. This casestructure is controlled by the Select Channel
control and passes data into a VI (see figure 12)that generates the waveform data with triggersimulation. The waveform data is then combinedwith time domain information by a build clusterobject and routed to the waveform display. Thecase structure labeled “M” is used to disable theSlope and Level controls if the logic that is wiredinto it is false. The sequence frames labeled “G”and “H” are sequenced by a dummy data line.They enable the source, slope, and level controlsand reset the stop switch once the While Loop isterminated by the stop button labeled “I”. TheWhile Loop labeled “K” runs in parallel withWhile Loop “B”. This While Loop continuouslychecks to see if the More Information buttonlabeled “L” is pressed. If the More Informationbutton is pressed then the case structure insideloop “B” pops up a panel showing information.While Loop “K” is controlled by the same stopbutton (Labeled “I”) as While Loop “B”. Using aLocal Variable labeled “stop” does this.
Figure 11
A Test Engineer’s Evaluation of Graphical ProgrammingBy Steve Mackin, Endgate Corporation
Page 17
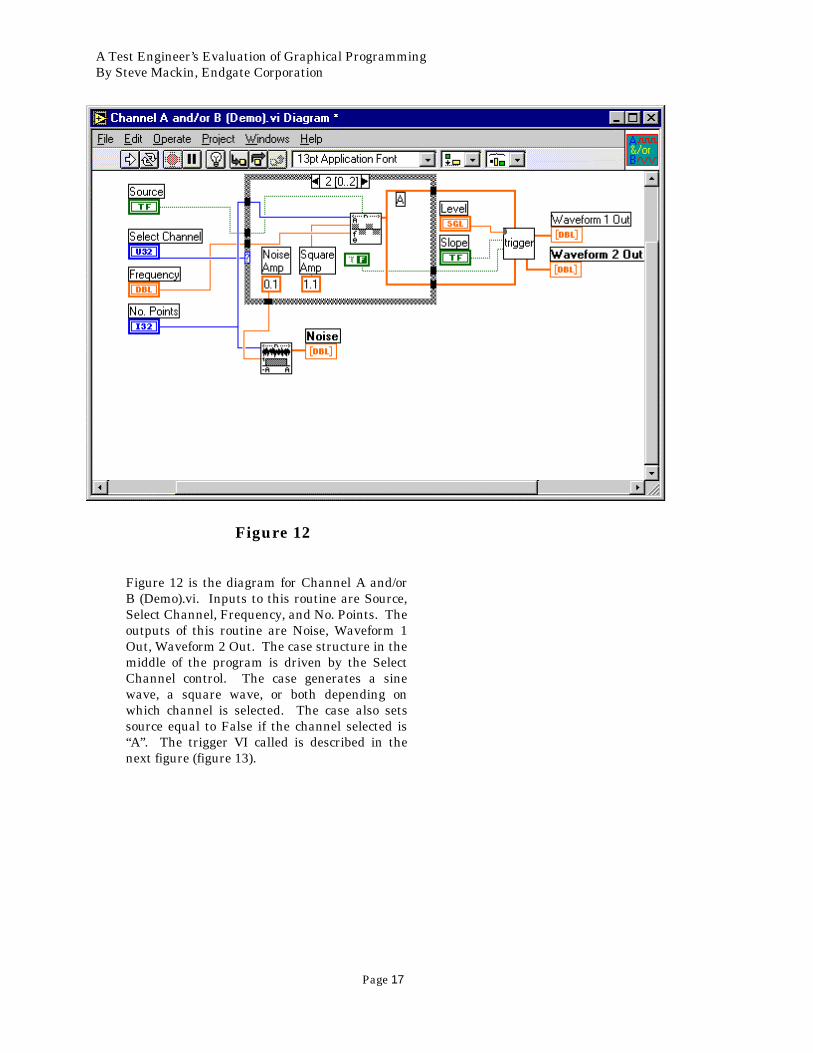
Figure 12 is the diagram for Channel A and/orB (Demo).vi. Inputs to this routine are Source,Select Channel, Frequency, and No. Points. Theoutputs of this routine are Noise, Waveform 1Out, Waveform 2 Out. The case structure in themiddle of the program is driven by the SelectChannel control. The case generates a sinewave, a square wave, or both depending onwhich channel is selected. The case also setssource equal to False if the channel selected is“A”. The trigger VI called is described in thenext figure (figure 13).
Figure 12
A Test Engineer’s Evaluation of Graphical ProgrammingBy Steve Mackin, Endgate Corporation
Page 18
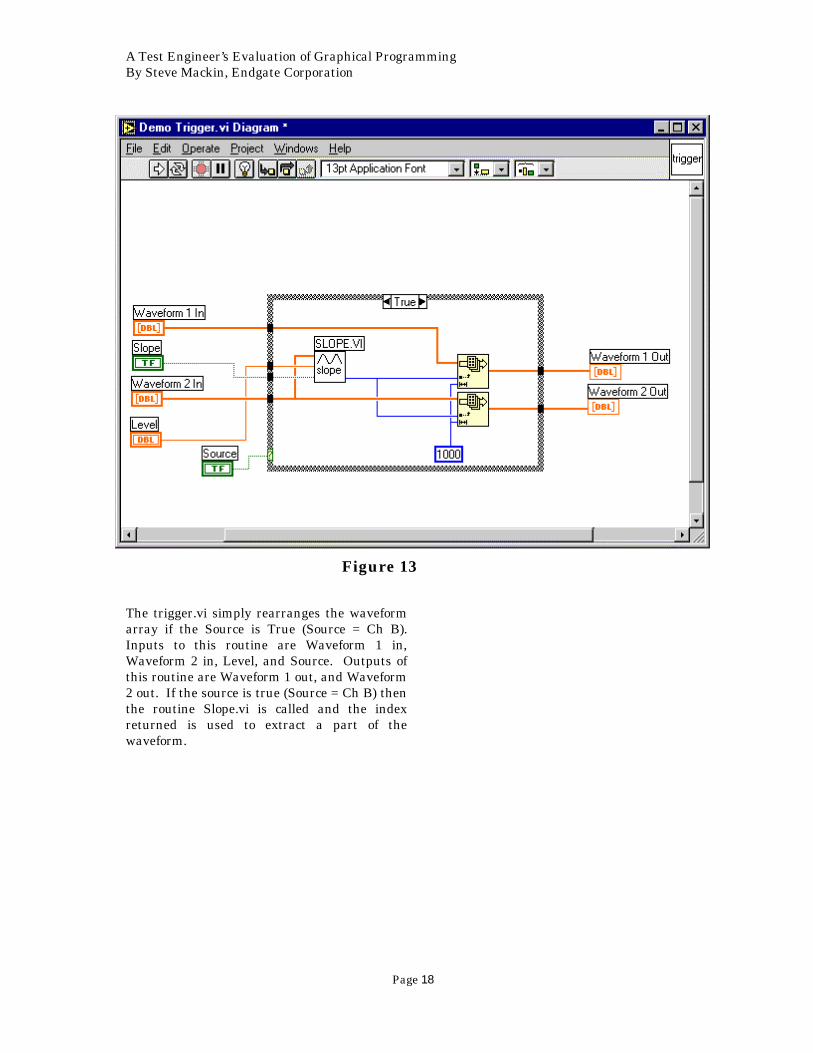
The trigger.vi simply rearranges the waveformarray if the Source is True (Source = Ch B).Inputs to this routine are Waveform 1 in,Waveform 2 in, Level, and Source. Outputs ofthis routine are Waveform 1 out, and Waveform2 out. If the source is true (Source = Ch B) thenthe routine Slope.vi is called and the indexreturned is used to extract a part of thewaveform.
Figure 13
A Test Engineer’s Evaluation of Graphical ProgrammingBy Steve Mackin, Endgate Corporation
Page 19
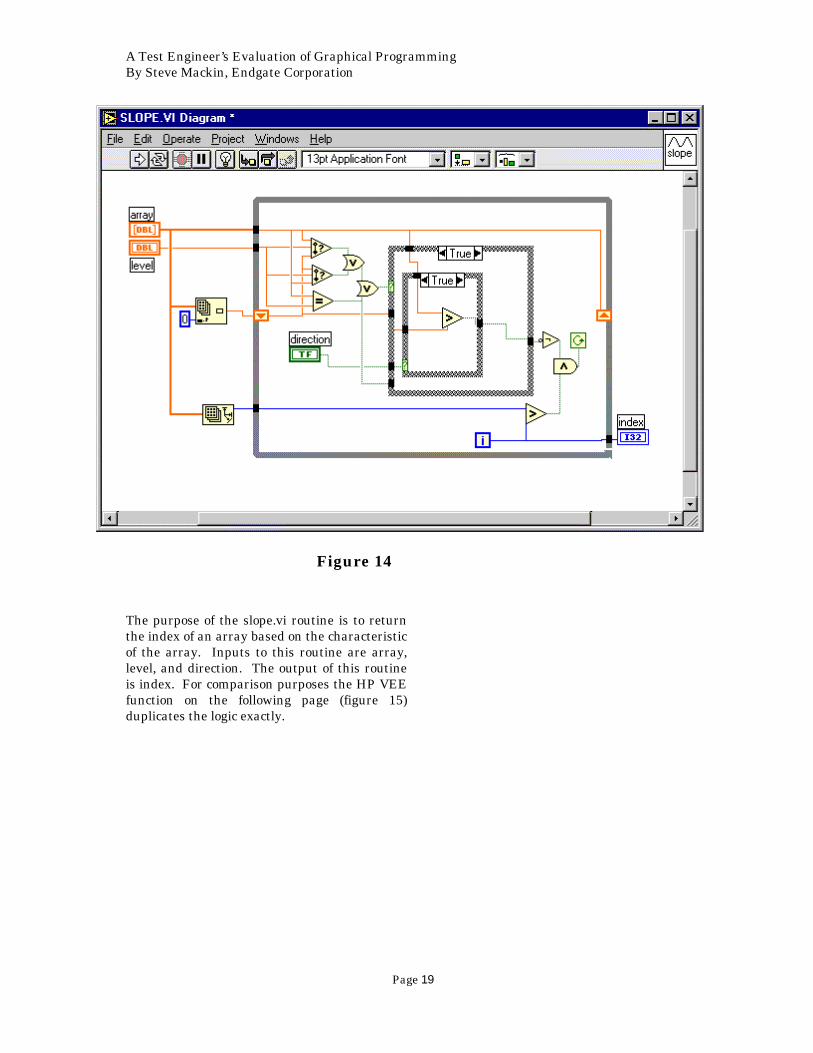
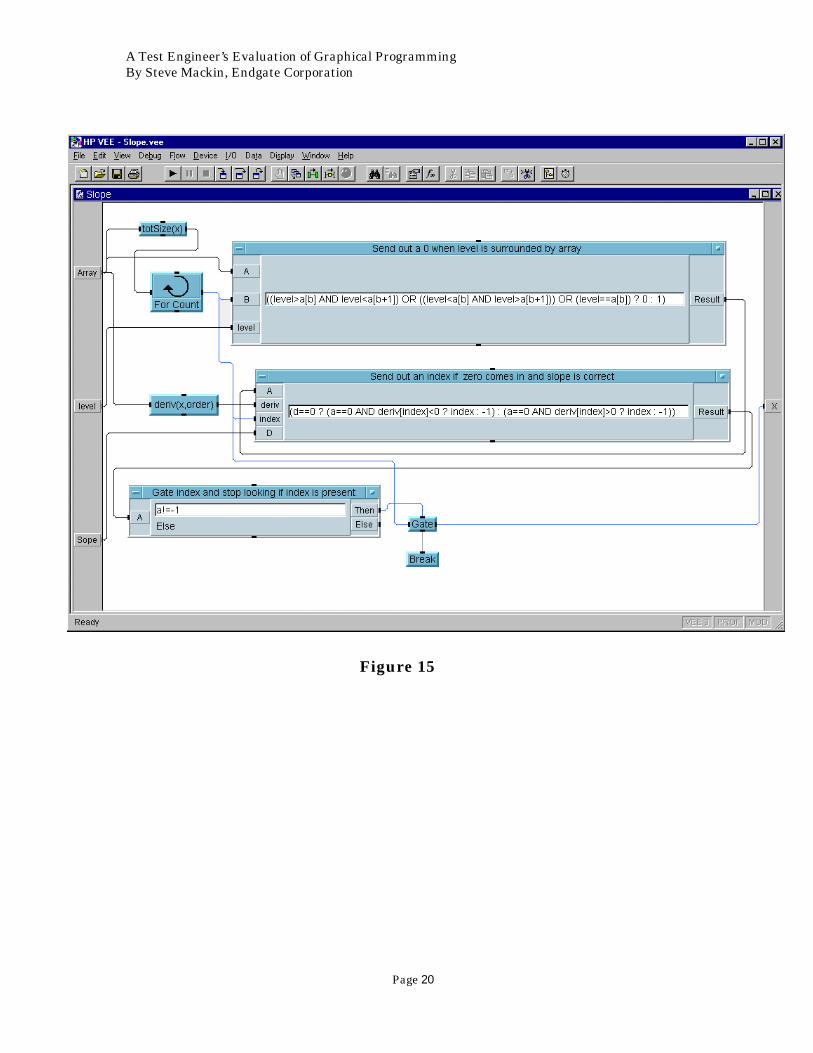
The purpose of the slope.vi routine is to returnthe index of an array based on the characteristicof the array. Inputs to this routine are array,level, and direction. The output of this routineis index. For comparison purposes the HP VEEfunction on the following page (figure 15)duplicates the logic exactly.
Figure 14
A Test Engineer’s Evaluation of Graphical ProgrammingBy Steve Mackin, Endgate Corporation
Page 20
Figure 15
A Test Engineer’s Evaluation of Graphical ProgrammingBy Steve Mackin, Endgate Corporation
Page 20
Figure 16
A Test Engineer’s Evaluation of Graphical ProgrammingBy Steve Mackin, Endgate Corporation
Page 23
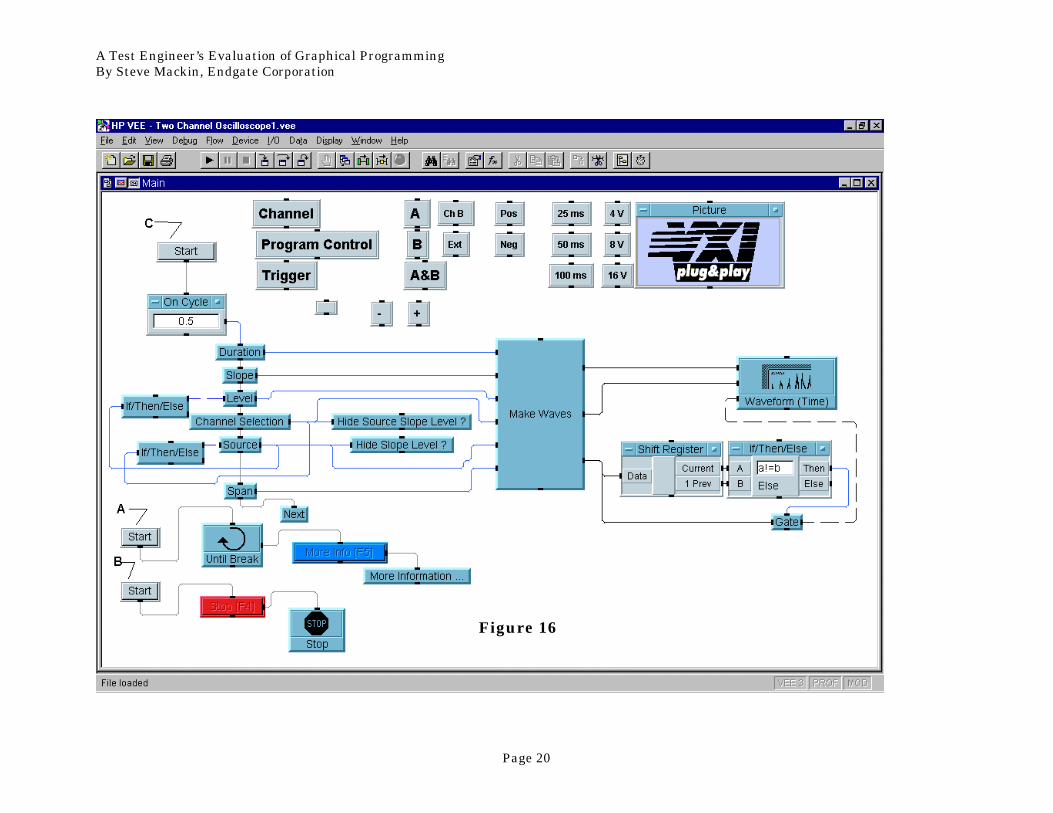
Program Comparison: HP VEE ModelExplanation of HP VEE Main ProgramThe HP VEE model consists of three threads andseveral labels used to create the user interface.The threads can be described as threeindependent programs that are all started whenthe run button is hit. A thread can also be runindependently by hitting its Start button. Thethread containing the More Information (labeled“A”) button functions exactly like While Loop “K”in the LabVIEW model. The only function of thethread labeled “B” is to stop the program whenthe stop button is hit. The remaining thread(labeled “C”) reads the controls, generates data,hides controls (if required), and displays the datausing a waveform display. This thread containsan On Cycle object so the thread is executed every0.5 sec. This was done to replicate the 500-millisecond wait in the LabVIEW model. The twoIf Then/Else objects (labeled “D” and “E”) are used
to reset the Level and Source controls dependingon Source and Channel selection.
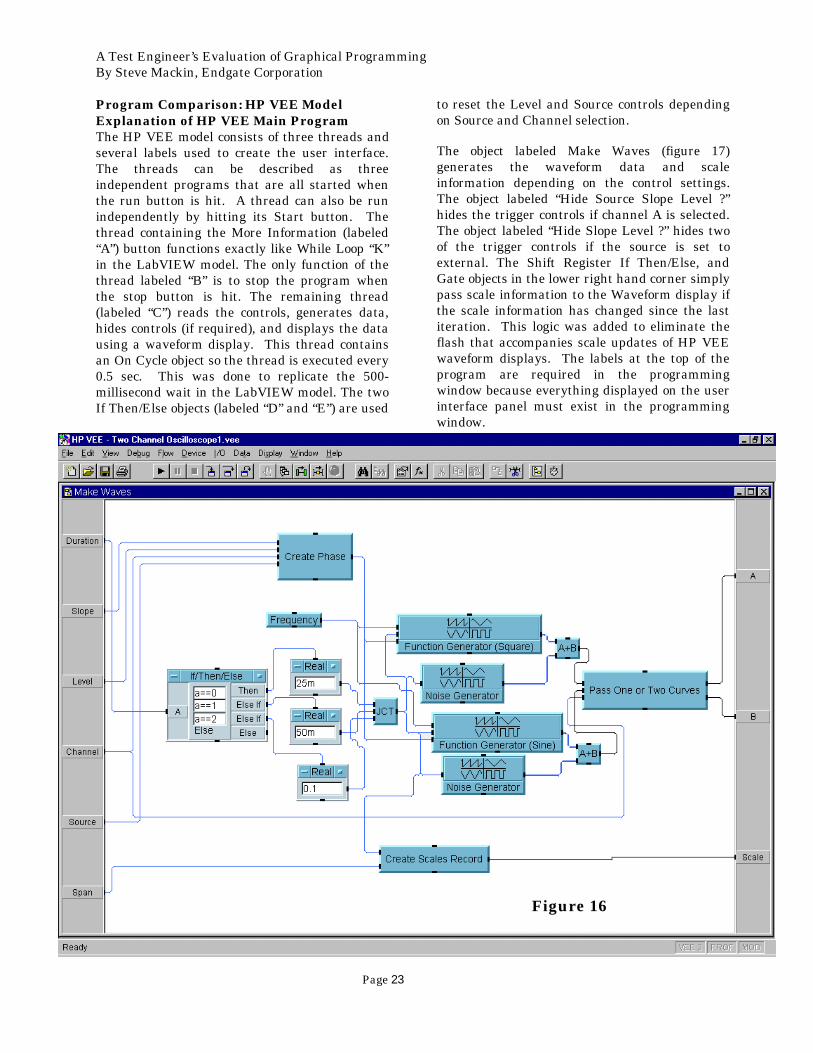
The object labeled Make Waves (figure 17)generates the waveform data and scaleinformation depending on the control settings.The object labeled “Hide Source Slope Level ?”hides the trigger controls if channel A is selected.The object labeled “Hide Slope Level ?” hides twoof the trigger controls if the source is set toexternal. The Shift Register If Then/Else, andGate objects in the lower right hand corner simplypass scale information to the Waveform display ifthe scale information has changed since the lastiteration. This logic was added to eliminate theflash that accompanies scale updates of HP VEEwaveform displays. The labels at the top of theprogram are required in the programmingwindow because everything displayed on the userinterface panel must exist in the programmingwindow.
Figure 16
A Test Engineer’s Evaluation of Graphical ProgrammingBy Steve Mackin, Endgate Corporation
Page 24
The Make Waves object (figure 17 on previouspage) is a user function that accepts inputs fromthe controls and generates waveforms. HP VEEfunction generators are used to create thewaveform data. The three inputs on the functiongenerators are frequency, phase, and time span.The time span is based on the duration selected.The frequency is constant and the phase is varied
by the Create Phase object to simulate a scopetrigger mechanism. The object labeled CreateScales Record accepts Duration and Span as inputand returns a HP VEE scale record. The objectlabeled Pass One or Two Curves accepts the twowaveforms and the Channel Selected and returnsone or two waveforms.
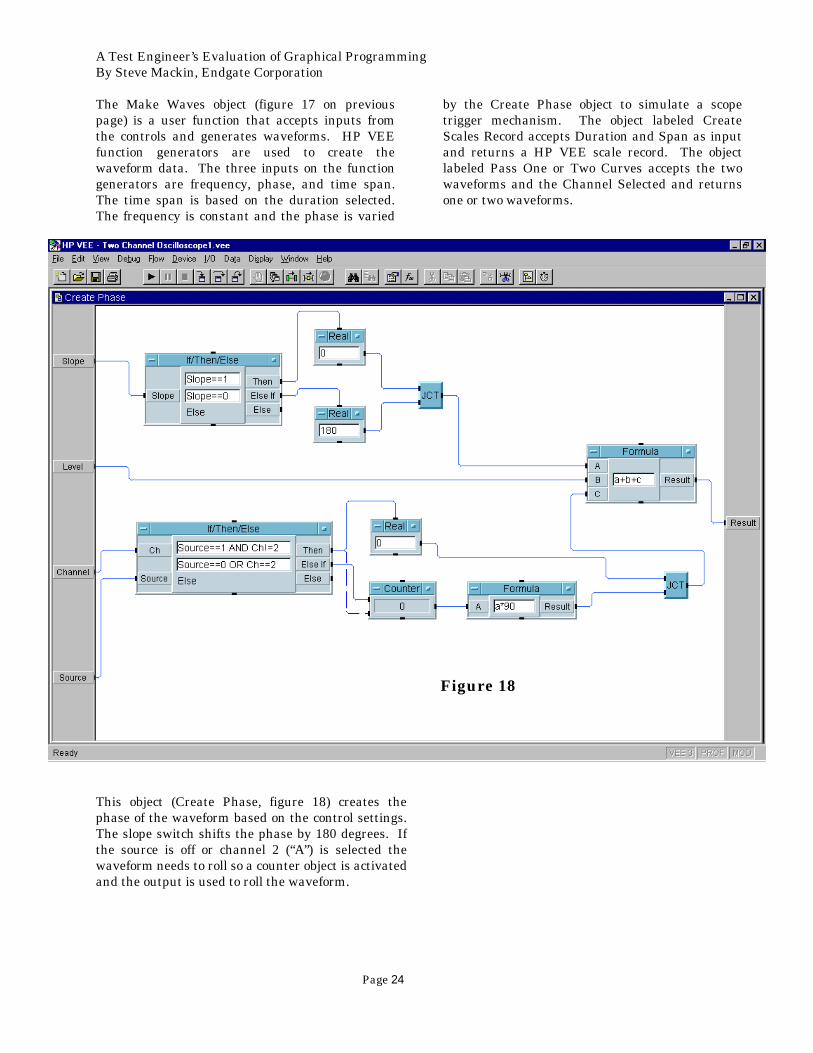
This object (Create Phase, figure 18) creates thephase of the waveform based on the control settings.The slope switch shifts the phase by 180 degrees. Ifthe source is off or channel 2 (“A”) is selected thewaveform needs to roll so a counter object is activatedand the output is used to roll the waveform.
Figure 18
A Test Engineer’s Evaluation of Graphical ProgrammingBy Steve Mackin, Endgate Corporation
Page 25
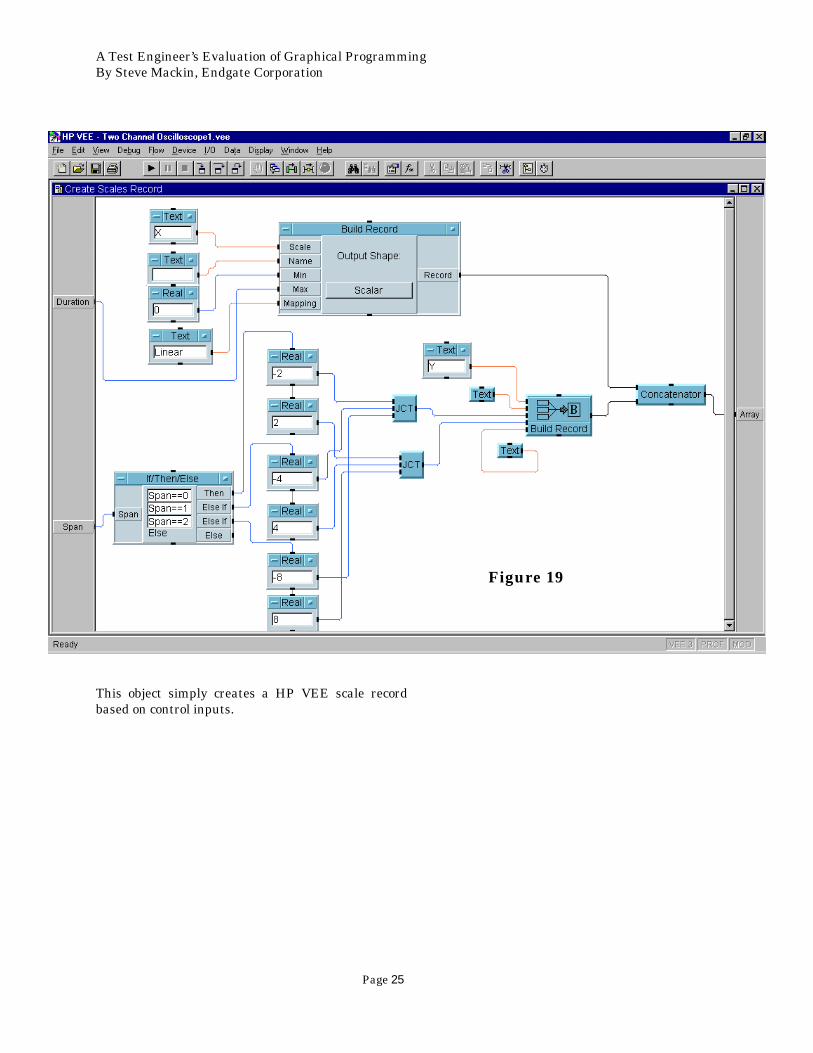
This object simply creates a HP VEE scale recordbased on control inputs.
Figure 19
A Test Engineer’s Evaluation of Graphical ProgrammingBy Steve Mackin, Endgate Corporation
Page 26
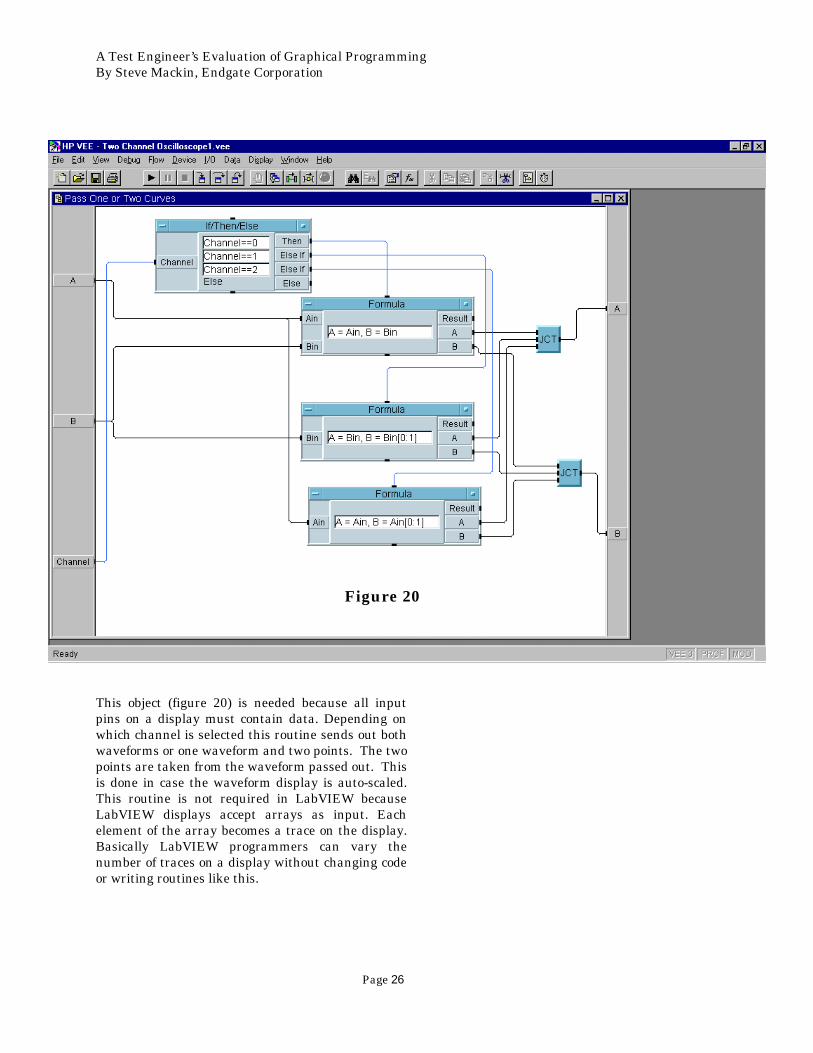
This object (figure 20) is needed because all inputpins on a display must contain data. Depending onwhich channel is selected this routine sends out bothwaveforms or one waveform and two points. The twopoints are taken from the waveform passed out. Thisis done in case the waveform display is auto-scaled.This routine is not required in LabVIEW becauseLabVIEW displays accept arrays as input. Eachelement of the array becomes a trace on the display.Basically LabVIEW programmers can vary thenumber of traces on a display without changing codeor writing routines like this.
Figure 20
A Test Engineer’s Evaluation of Graphical ProgrammingBy Steve Mackin, Endgate Corporation
Page 27
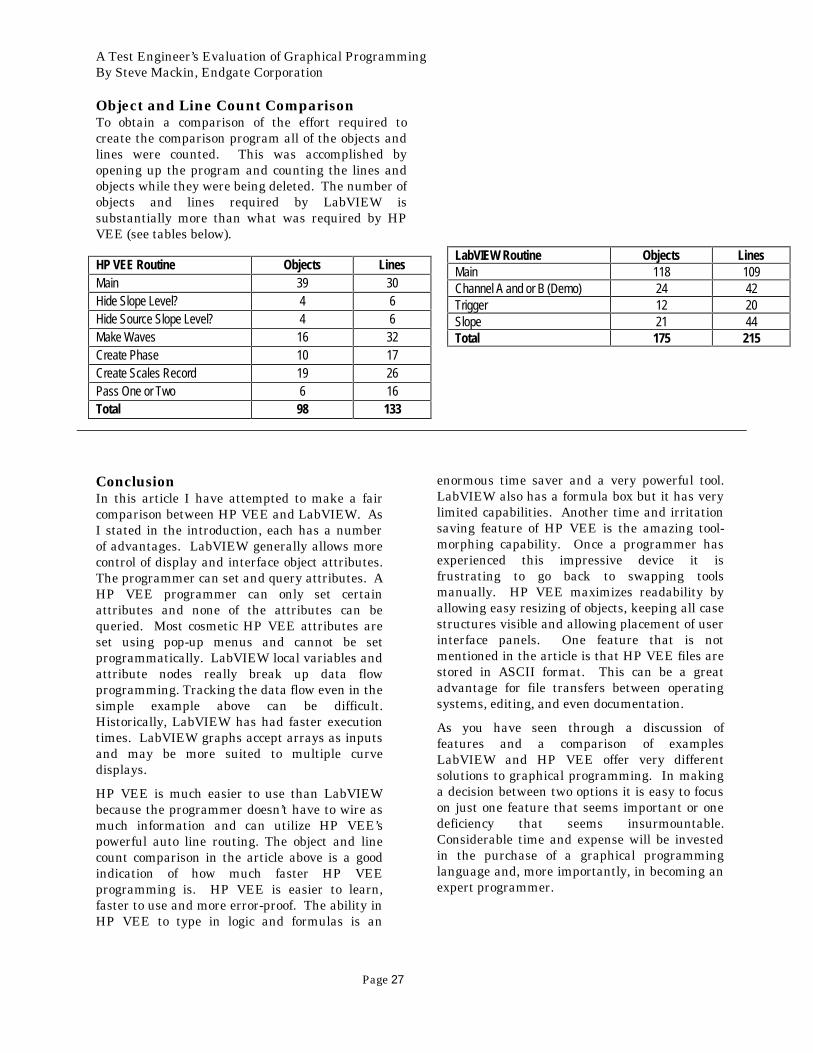
Object and Line Count ComparisonTo obtain a comparison of the effort required tocreate the comparison program all of the objects andlines were counted. This was accomplished byopening up the program and counting the lines andobjects while they were being deleted. The number ofobjects and lines required by LabVIEW issubstantially more than what was required by HPVEE (see tables below).
HP VEE Routine Objects LinesMain 39 30Hide Slope Level? 4 6Hide Source Slope Level? 4 6Make Waves 16 32Create Phase 10 17Create Scales Record 19 26Pass One or Two 6 16Total 98 133
LabVIEW Routine Objects LinesMain 118 109Channel A and or B (Demo) 24 42Trigger 12 20Slope 21 44Total 175 215
ConclusionIn this article I have attempted to make a faircomparison between HP VEE and LabVIEW. AsI stated in the introduction, each has a numberof advantages. LabVIEW generally allows morecontrol of display and interface object attributes.The programmer can set and query attributes. AHP VEE programmer can only set certainattributes and none of the attributes can bequeried. Most cosmetic HP VEE attributes areset using pop-up menus and cannot be setprogrammatically. LabVIEW local variables andattribute nodes really break up data flowprogramming. Tracking the data flow even in thesimple example above can be difficult.Historically, LabVIEW has had faster executiontimes. LabVIEW graphs accept arrays as inputsand may be more suited to multiple curvedisplays.
HP VEE is much easier to use than LabVIEWbecause the programmer doesn’t have to wire asmuch information and can utilize HP VEE’spowerful auto line routing. The object and linecount comparison in the article above is a goodindication of how much faster HP VEEprogramming is. HP VEE is easier to learn,faster to use and more error-proof. The ability inHP VEE to type in logic and formulas is an
enormous time saver and a very powerful tool.LabVIEW also has a formula box but it has verylimited capabilities. Another time and irritationsaving feature of HP VEE is the amazing tool-morphing capability. Once a programmer hasexperienced this impressive device it isfrustrating to go back to swapping toolsmanually. HP VEE maximizes readability byallowing easy resizing of objects, keeping all casestructures visible and allowing placement of userinterface panels. One feature that is notmentioned in the article is that HP VEE files arestored in ASCII format. This can be a greatadvantage for file transfers between operatingsystems, editing, and even documentation.
As you have seen through a discussion offeatures and a comparison of examplesLabVIEW and HP VEE offer very differentsolutions to graphical programming. In makinga decision between two options it is easy to focuson just one feature that seems important or onedeficiency that seems insurmountable.Considerable time and expense will be investedin the purchase of a graphical programminglanguage and, more importantly, in becoming anexpert programmer.
A Test Engineer’s Evaluation of Graphical ProgrammingBy Steve Mackin, Endgate Corporation
Page 28
In considering the overall performance, ease ofuse and capabilities of both programs I mustrecommend HP VEE over LabVIEW. For thepurposes of this article HP VEE version 4.0 andLabVIEW version 4.1 were compared. As newversions are released we can expectimprovements in both products but I feel that theunderlying premise of HP VEE will continue tobe simple straightforward programming and theexpert HP VEE programmer will gain evengreater abilities to produce powerful softwarewith amazing speed.
Happy programming!
Related Documents