International Journal of Computer Applications (0975 – 8887) Volume 176 – No.4, October 2017 12 Graphical User Interface Approach for Quality Evaluation of Indian Rice Niky K. Jain Research Scholar RKU, Rajkot Department of M Sc. (IT) ISTAR, V.V.Nagar Samrat O. Khanna Dean School of Engineering and Applied Science Rai University Chetna K. Shah Department of Electronics and Communication GCET ABSTRACT Modernization with automization incorporated makes a system more powerful. In the present world quality inspection of food products is a very important factor for evaluating the grade of food. In agricultural field, image processing is also used to evaluate the quality of rice. Major problem of rice industry for quality assessment is manual assessment done by human inspector. In this paper a method is presented to evaluate the quality of rice. Proposed method is an application of computer vision technique. Computer Vision provides an alternative for non-destructive and cost effective technique for Grading and Classification of rice using framework and neural network techniques. Some Geometrics features are useful for quality evaluation. In this paper proposed method is used to increase the accuracy of the rice quality detection by using such features with GUI (Graphical User Interface) and feed forward neural network. Artificial neural network detects the quality of rice by using features provided at the time of training and also the extracted features of rice and provides the result by comparing these features. It grades and classifies rice images based on obtained features. Keywords Feature extraction, GUI (Graphical user interface), Image processing, Quality analysis. 1. INTRODUCTION Agriculture field has played an important role in economic development of India. Digital Development in agriculture sector is growing exponentially as compared to development in other sector. So, there is need to develop some new technique for agricultural sector. There are various rice varieties are available in India like Basmati, Ponia, Masoori, Parimal, Jirasar, Kamod etc. Still in India, the traditional inspection of rice is performed by human experts. It is not only time consuming but a laborious technique too. As it is perceived to be a possible solution to prevent human errors in the quality evaluation process. Machine vision system which is a promising technology in the quality control can replace the human operator[1]. After hours of working the operator may lose concentration which in turn will affect the evaluation process. Hence a Machine vision system is proved to be more efficient at the level of precision and rapidity. But, the natural diversity in appearance of various rice varieties makes classification by Machine vision a complex work to achieve. Many researches were carried out to classify grains. Characterization models were based on morphological features, colour features or textural features[2]. Other researchers([20-21]) have tried to combine these features for the sake of improving the efficiency of classification. Recently, wavelet technique was integrated in grains characterization([22-23)]. Grading of rice is necessary in evaluating agricultural produce, meeting quality standards and increasing market value. The features that can be extracted from an image of any rice are its Major Axis, Minor Axis, Eccentricity, Area, Convex Area, Perimeter and Extent[17]. These features help the user to classify the rice. In this Paper, an automatic framework is used to analyse the rice quality which is based on Major Axis, Minor Axis, Eccentricity, Area, Convex Area, Perimeter and Extent. Rice should be tested via non- destructive techniques because these are delicate materials. If the classification and grading is done through manual methods, the procedure will be too moderate and at times it will be mistake inclined. Human choose the rice on the premise of bare eye perception[7]. On the off chance that these quality measures are mapped into computerized framework by utilizing appropriate programming dialect then the work will be speedier and blunder free. Lately, PC machine vision and picture preparing methods have been discovered progressively helpful in the agrarian business, particularly for applications in quality review and shape arranging. The exploration work abridged in this paper concentrates on the issue confronted by Indian Rice industry and its financially savvy arrangement. In this paper we have talked about different rice assortment (Oryza Sativa L) seeds containing various size of rice seeds available. In this paper at first user select the type of rice variety like Basmati, Ponia, Masoori, Parimal, Jirasar, Kamod etc. and systems automatically evaluate the sample using its geometrical properties. Second elaborates the quality factor. Proposed methodology being used is enumerated using physical properties exploited from the image of the rice sample. The last three sections exemplify the result and discussion part based section 3 along with the data mining technique so used in our research work. With the help of this paper we propose a Framework for classification of rice. 2. PROBLEM DEFINITION Automisation using a graphical user friendly system is introduced through this research paper. As previously the age old technique of quality evaluation was through mere naked eye inspection of few experts. It was not only biased but also inaccurate way. As the various rice varieties like Basmati, Ponia, Masoori, Parimal, Jirasar, available in this region comprise of different geometrical properties. They are unique in themselves in such a way that they make a wide difference with each other too. The before said thing is justified as shown in the first image of this paper. The different variety of rice in aforesaid sample degrade the quality of rice. In the below figure blue encircle one is a regular seed while the red encircled one is a small seed and green one is long seed.

Welcome message from author
This document is posted to help you gain knowledge. Please leave a comment to let me know what you think about it! Share it to your friends and learn new things together.
Transcript

International Journal of Computer Applications (0975 – 8887)
Volume 176 – No.4, October 2017
12
Graphical User Interface Approach for Quality
Evaluation of Indian Rice
Niky K. Jain Research Scholar RKU, Rajkot
Department of M Sc. (IT) ISTAR, V.V.Nagar
Samrat O. Khanna Dean School of Engineering
and Applied Science Rai University
Chetna K. Shah Department of Electronics and
Communication GCET
ABSTRACT
Modernization with automization incorporated makes a
system more powerful. In the present world quality inspection
of food products is a very important factor for evaluating the
grade of food. In agricultural field, image processing is also
used to evaluate the quality of rice. Major problem of rice
industry for quality assessment is manual assessment done by
human inspector. In this paper a method is presented to
evaluate the quality of rice. Proposed method is an application
of computer vision technique. Computer Vision provides an
alternative for non-destructive and cost effective technique for
Grading and Classification of rice using framework and neural
network techniques. Some Geometrics features are useful for
quality evaluation. In this paper proposed method is used to
increase the accuracy of the rice quality detection by using
such features with GUI (Graphical User Interface) and feed
forward neural network. Artificial neural network detects the
quality of rice by using features provided at the time of
training and also the extracted features of rice and provides
the result by comparing these features. It grades and classifies
rice images based on obtained features.
Keywords
Feature extraction, GUI (Graphical user interface), Image
processing, Quality analysis.
1. INTRODUCTION Agriculture field has played an important role in economic
development of India. Digital Development in agriculture
sector is growing exponentially as compared to development
in other sector. So, there is need to develop some new
technique for agricultural sector. There are various rice
varieties are available in India like Basmati, Ponia, Masoori,
Parimal, Jirasar, Kamod etc. Still in India, the traditional
inspection of rice is performed by human experts. It is not
only time consuming but a laborious technique too. As it is
perceived to be a possible solution to prevent human errors in
the quality evaluation process. Machine vision system which
is a promising technology in the quality control can replace
the human operator[1]. After hours of working the operator
may lose concentration which in turn will affect the
evaluation process. Hence a Machine vision system is proved
to be more efficient at the level of precision and rapidity. But,
the natural diversity in appearance of various rice varieties
makes classification by Machine vision a complex work to
achieve. Many researches were carried out to classify grains.
Characterization models were based on morphological
features, colour features or textural features[2]. Other
researchers([20-21]) have tried to combine these features for
the sake of improving the efficiency of classification.
Recently, wavelet technique was integrated in grains
characterization([22-23)].
Grading of rice is necessary in evaluating agricultural
produce, meeting quality standards and increasing market
value. The features that can be extracted from an image of any
rice are its Major Axis, Minor Axis, Eccentricity, Area,
Convex Area, Perimeter and Extent[17]. These features help
the user to classify the rice. In this Paper, an automatic
framework is used to analyse the rice quality which is based
on Major Axis, Minor Axis, Eccentricity, Area, Convex Area,
Perimeter and Extent. Rice should be tested via non-
destructive techniques because these are delicate materials. If
the classification and grading is done through manual
methods, the procedure will be too moderate and at times it
will be mistake inclined. Human choose the rice on the
premise of bare eye perception[7]. On the off chance that
these quality measures are mapped into computerized
framework by utilizing appropriate programming dialect then
the work will be speedier and blunder free. Lately, PC
machine vision and picture preparing methods have been
discovered progressively helpful in the agrarian business,
particularly for applications in quality review and shape
arranging. The exploration work abridged in this paper
concentrates on the issue confronted by Indian Rice industry
and its financially savvy arrangement. In this paper we have
talked about different rice assortment (Oryza Sativa L) seeds
containing various size of rice seeds available.
In this paper at first user select the type of rice variety like
Basmati, Ponia, Masoori, Parimal, Jirasar, Kamod etc. and
systems automatically evaluate the sample using its
geometrical properties. Second elaborates the quality factor.
Proposed methodology being used is enumerated using
physical properties exploited from the image of the rice
sample. The last three sections exemplify the result and
discussion part based section 3 along with the data mining
technique so used in our research work. With the help of this
paper we propose a Framework for classification of rice.
2. PROBLEM DEFINITION Automisation using a graphical user friendly system is
introduced through this research paper. As previously the age
old technique of quality evaluation was through mere naked
eye inspection of few experts. It was not only biased but also
inaccurate way. As the various rice varieties like Basmati,
Ponia, Masoori, Parimal, Jirasar, available in this region
comprise of different geometrical properties. They are unique
in themselves in such a way that they make a wide difference
with each other too. The before said thing is justified as
shown in the first image of this paper. The different variety of
rice in aforesaid sample degrade the quality of rice. In the
below figure blue encircle one is a regular seed while the red
encircled one is a small seed and green one is long seed.

International Journal of Computer Applications (0975 – 8887)
Volume 176 – No.4, October 2017
13
Fig. 1 Rice (Jirasar and Masoori) seeds with and without
foreign elements
3. SUGGESTED APPROACH This section elaborates the process of evaluation in a non-
chemical environment. The proposed automated system is
designed to overcome the problems of manual techniques.
The system consists of several steps like feature extraction,
sorting and grading. It is designed to combine seven processes
as shown below in a flow table. We extract features for
training the data and further we used this data for grading
purpose. Proposed technique characterizes and perceives rice
images based on obtained features values by using two-layer
feed-forward network, with sigmoid covered up and yield
neurons[15]. The image processing toolbox supports feed
forward networks. The flow chart of sorting and grading
process is given in the following Table 1.
Table 1 Suggested Approach
Sr. No. Steps
1 Sample of rice seeds
2 Image Acquisition
3 Convert over the RGB picture to dim picture.
4 Apply the edge recognition operation.
4 Feature Extraction
5 Sorting
(i) (ii) (iii)
Fig. 2 Sample comprising of various size of rice seeds
(i) (ii) (iii)
Fig. 3 resultant rice seeds based on suggested approach
Actual type of rice seed appeared in figure 2(i), long sized
appeared in figure 2(ii) and small sized appeared in figure
2(iii). Applying edge recognition operation on 2(i)-2(iii) rice
seed and after we get pictures of figures 3(i), (ii) and (iii)
individually. There are seven steps for the rice quality
detection in proposed methodology. These steps are as
following:
Step 1: To capture the image of given rice sample
Step 2: Load the image in GUI of Matlab
Step 3: After preliminary processing on the loaded image.
Extract the geometrical features of rice sample for
evaluation purpose.
Step 4: Once the features are extracted then the soft
computing technique of training the data set starts
using feed forward neural network.
Step 5: Select the loaded rice sample for testing.
Step 6: Perform testing by using artificial neural network.
Step 7: Artificial neural network based output is achieved.
It is a deciding parameter for classification of rice
sample. As it explains in detail that the seeds so
analyzed contained how much part of foreign
elements and long seeds as well and the same is
displayed in the count module of display section.
The first step is to acquire the image of rice. Image of the rice
samples are captured by using a digital camera having 12
mega pixels quality with 8X optical zoom with black
background mounted on the top of the box. The captured
image is further stored in computer/laptop. The saved image is
then loaded into the Matlab. Next comes the preprocessing of
the loaded image in which image enhancement, noise removal
are some of the key features of the process. In third step after
edge detection the geometrical features of the rice samples are
extracted. Geometrical features with the help of
morphological operations are extracted. In fourth step neural
network is used for training the data, after that in step fifth
rice sample is selected for testing from database. In step sixth
testing is performed by using ANN training module. Finally,
in step seventh ANN based results are obtained.
4. RESULTS ANALYSIS Table 2 represents parametric values of each rice seed. The
values in the table displays the, Area (a), Major axis length
(b), Minor axis length (c), Eccentricity (d), Convex area (e),
Perimeter (f) and Extent (g). Similarly, other samples are
found where each sample contains approximately 50 seeds are
shown in table 3, 4 and 5. Table 2 represents analysis of
Jirasar seeds, table 3 represents Masoori rice seeds and table 4
represents Parimal rice seed varieties respectively.
Table 2 Analysis for 15 seeds Available in One Sample
S.No a b c d e f g
1 155 36.45 17.17 0.88 333 74.08 0.25
2 152 36.47 14.76 0.91 299 71.84 0.27
3 149 35.09 13.89 0.91 277 70.28 0.38
4 180 40.03 14.83 0.92 340 80.04 0.42
5 150 32.41 14.62 0.89 274 67.45 0.41
6 177 38.83 17.55 0.89 370 78.04 0.41
7 178 35.76 16.31 0.88 333 74.04 0.44
8 165 38.31 15.68 0.91 337 77.35 0.31
9 173 38.98 16.75 0.90 361 78.91 0.26
10 167 39.10 15.76 0.91 343 78.18 0.29
Table 3 Analysis for 15 seeds Available in other Sample
S.No a b c d e f g
1 180 35.55 18.65 0.85 364 75.59 0.31
2 179 37.32 18.76 0.86 381 77.69 0.37
3 182 35.18 18.66 0.84 372 76.18 0.33
4 169 38.09 17.61 0.88 361 76.66 0.27
5 176 38.43 19.34 0.86 384 78.08 0.27
6 182 39.42 20.08 0.86 419 82.42 0.27
7 164 36.05 19.25 0.84 364 75.35 0.30
8 162 37.34 18.72 0.86 367 76.18 0.29
9 166 36.75 18.714 0.86 368 76.42 0.29
10 162 34.76 15.78 0.89 308 70.38 0.46

International Journal of Computer Applications (0975 – 8887)
Volume 176 – No.4, October 2017
14
Table 4 Analysis for 15 seeds available in third Sample
S.No a b c d e f g 1 192 42.34 19.41 0.88 444 86.52 0.32
2 191 41.75 19.06 0.88 431 84.28 0.36
3 166 34.18 19.84 0.81 368 75.1 0.32
4 196 40.81 20.38 0.86 453 85.94 0.32
5 204 46.08 16.00 0.93 428 92.52 0.34
6 208 45.49 18.14 0.91 455 91.11 0.34
7 198 42.98 19.98 0.88 457 88.42 0.27
8 188 40.32 17.89 0.89 395 81.49 0.27
9 171 36.36 19.92 0.83 382 75.59 0.29
10 170 37.21 18.59 0.86 373 76.62 0.37
For classification of the three categories we compute
thresholds values using the histogram. Table 5,6 and 7
mentions all the seven parameters and their computed
threshold using histogram for area, major axis length, minor
axis length, eccentricity, convex area, perimeter and extent of
Jirasar, Masoori and Parimal rice seeds.
Table 5 Computed Threshold Values (Jirasar Rice)
Features Small seed Normal seed Long seed
a 110-140 140-180 180-200
b 25-31 31-39 39-45
c 10-14 14-17 17-25
d 0.65-0.84 0.84-0.93 0.93-1.00
e 200-270 270-390 390-410
f 50-66 66-82 82-90
g 0.2-0.25 0.25-0.45 0.45-0.50
Table 6 Computed Threshold Values (Masoori Rice)
Features Small seed Normal seed Long seed
a 125-150 150-210 210-235
b 25-32 33-42 42-47
c 14-17 17-21 21-24
d 0.65-0.77 0.77-0.88 0.88-0.92
e 280-320 320-420 420-460
f 50-68 68-82 82-90
g 0.2-0.26 0.26-0.4 0.4-0.50
Table 7 Computed Threshold Values (Parimal Rice)
Features Small seed Normal seed Long seed
a 120-155 155-205 205-250
b 25-32 32-45 45-51
c 12-15 15-20 20-25
d 0.75– 0.84 0.84-0.92 0.92-1
e 300-350 350-510 510-550
f 65-75 75-95 95-105
g 0.2-0.24 0.24-0.38 0.38-0.4
Based on the above values of classification using histogram
we achieved three categories of rice seeds in any given
sample. It comprises of small, normal and large. So the
quality of rice seeds get affected if concentration of any one
either large seeds or small seeds are more in any random
sample so taken. Hence to quantify the quality of any random
rice sample the features so extracted are classified as
discussed in next section.
5. CLASSIFICATION
5.1 Graphical User Interface With MA TLAB we can make our own particular Graphical
User Interface, or GUI, which comprises of a Figure window
containing menus, catches, content, representation, and so on.
That a client can control intelligently with the mouse and
console. There are two fundamental strides in making a GUI:
One is planning its design, and the other is composing call
back works that play out the craved operations when the client
chooses distinctive elements.
A graphical user interface (GUI) is a human-computer
interface (i.e., a path for people to interact with computers)
that utilizes windows, icons and menus and which can be
controlled by a mouse (and regularly to a constrained degree
by a console too). A GUI uses a blend of advances and
gadgets to give a stage that the client can interface with, for
the assignments of get-together and creating data. The most
well-known mix of such components in GUIs is the WIMP
("window, icon, menu, and directing gadget") worldview,
particularly in computers. Planning the visual synthesis and
transient conduct of GUI is a vital part of programming
applications. It will probably improve the productivity and
usability for the fundamental legitimate configuration of a put
away program, an outline discipline known as ease of use.
Strategies for client focused outline are utilized to guarantee
that the visual dialect presented in the outline is all around
custom fitted to the undertakings.
5.2 GUI Frame Work:
Flow of GUI Frame Work:
Step 1: Click Pop-up menu and select type of rice.
Step 2: Select Image from child window.
Step 3: Click Upload File Push button.
Step 4: Click Edge Detection Push button.
Step 5: Automatic feature Extraction from different push
button.
Step 6: Classification of Feature Extraction Value.
Step 7: Results.
As discussed in the flow of the framework first is to open the
respective GUI as shown in figure 4.
Fig. 4 GUI Framework
From the drop down menu one need to select the path of the
folder where the images have been stored. Later that particular
folder would be opened and one can select the given sample
of seed image as shown in figure 5.

International Journal of Computer Applications (0975 – 8887)
Volume 176 – No.4, October 2017
15
Fig. 5 Selection of a rice variety from the given folder
The image would then be uploaded on the given framework
for further processing of information as shown in figure 6.
Fig. 6 Uploading of a Rice sample
The image is preprocessed and edges of the image are
detected as shown in figure 7.
Fig. 7 Edge detected Rice sample
The edge detected rice sample is further processed and using
morphological and geometrical operators the histogram of
each sample is generated as shown in figure 8 to figure 16.
Each below shown figure represents the histogram of Area,
Major Axis Length, Minor Axis Length, Eccentricity, convex
Area, Extent and Perimeter respectively. Based on these
histograms the features of rice seeds are extracted and
calculated further.
Fig. 8 Histogram of Area of given Rice sample
Fig. 9 Histogram of Major Axis Length of given Rice
sample
Fig. 10 Histogram of Minor Axis Length of given Rice
sample
International Journal of Computer Applications (0975 – 8887)
Volume 176 – No.4, October 2017
16
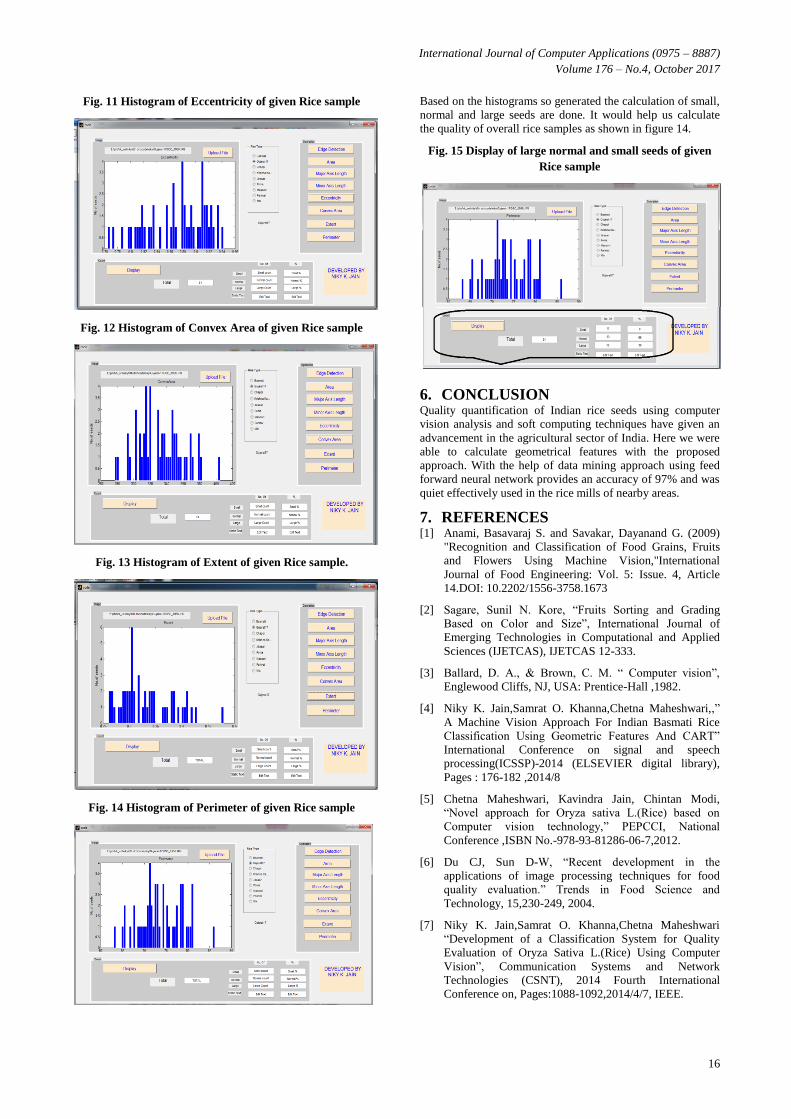
Fig. 11 Histogram of Eccentricity of given Rice sample
Fig. 12 Histogram of Convex Area of given Rice sample
Fig. 13 Histogram of Extent of given Rice sample.
Fig. 14 Histogram of Perimeter of given Rice sample
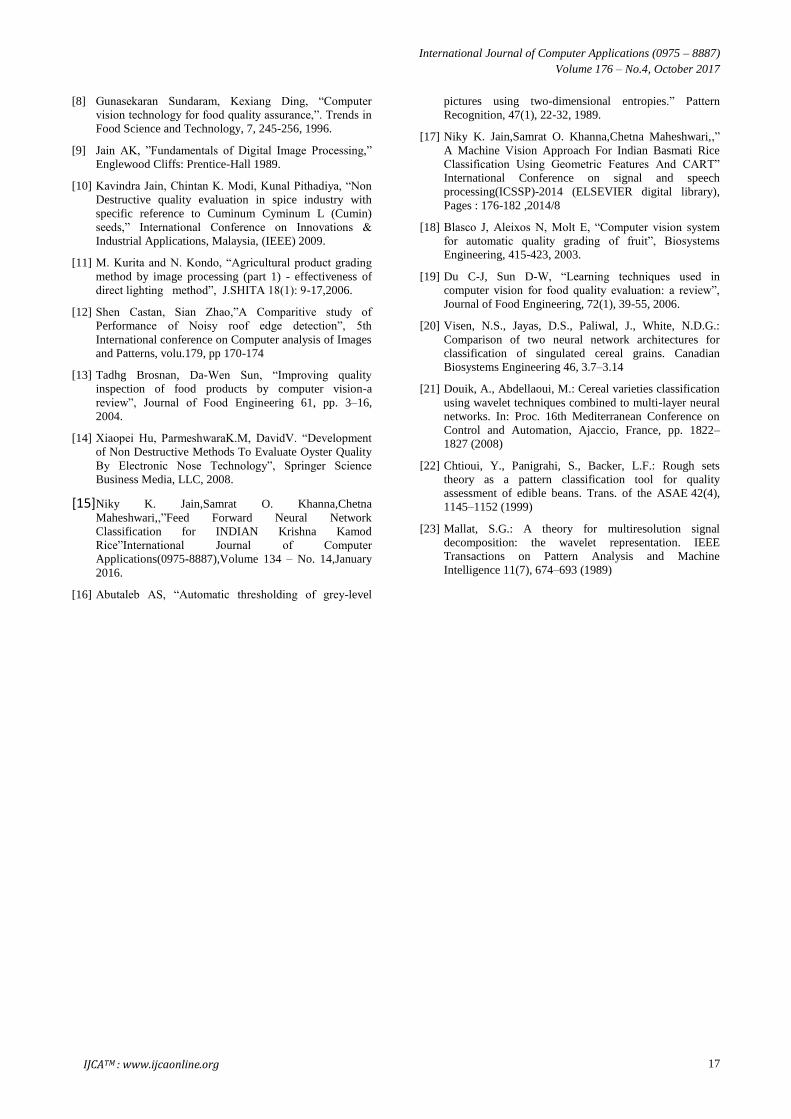
Based on the histograms so generated the calculation of small,
normal and large seeds are done. It would help us calculate
the quality of overall rice samples as shown in figure 14.
Fig. 15 Display of large normal and small seeds of given
Rice sample
6. CONCLUSION Quality quantification of Indian rice seeds using computer
vision analysis and soft computing techniques have given an
advancement in the agricultural sector of India. Here we were
able to calculate geometrical features with the proposed
approach. With the help of data mining approach using feed
forward neural network provides an accuracy of 97% and was
quiet effectively used in the rice mills of nearby areas.
7. REFERENCES [1] Anami, Basavaraj S. and Savakar, Dayanand G. (2009)
"Recognition and Classification of Food Grains, Fruits
and Flowers Using Machine Vision,"International
Journal of Food Engineering: Vol. 5: Issue. 4, Article
14.DOI: 10.2202/1556-3758.1673
[2] Sagare, Sunil N. Kore, “Fruits Sorting and Grading
Based on Color and Size”, International Journal of
Emerging Technologies in Computational and Applied
Sciences (IJETCAS), IJETCAS 12-333.
[3] Ballard, D. A., & Brown, C. M. “ Computer vision”,
Englewood Cliffs, NJ, USA: Prentice-Hall ,1982.
[4] Niky K. Jain,Samrat O. Khanna,Chetna Maheshwari,,” A Machine Vision Approach For Indian Basmati Rice
Classification Using Geometric Features And CART”
International Conference on signal and speech
processing(ICSSP)-2014 (ELSEVIER digital library),
Pages : 176-182 ,2014/8
[5] Chetna Maheshwari, Kavindra Jain, Chintan Modi,
“Novel approach for Oryza sativa L.(Rice) based on
Computer vision technology,” PEPCCI, National
Conference ,ISBN No.-978-93-81286-06-7,2012.
[6] Du CJ, Sun D-W, “Recent development in the
applications of image processing techniques for food
quality evaluation.” Trends in Food Science and
Technology, 15,230-249, 2004.
[7] Niky K. Jain,Samrat O. Khanna,Chetna Maheshwari
“Development of a Classification System for Quality
Evaluation of Oryza Sativa L.(Rice) Using Computer
Vision”, Communication Systems and Network
Technologies (CSNT), 2014 Fourth International
Conference on, Pages:1088-1092,2014/4/7, IEEE.
International Journal of Computer Applications (0975 – 8887)
Volume 176 – No.4, October 2017
17
[8] Gunasekaran Sundaram, Kexiang Ding, “Computer
vision technology for food quality assurance,”. Trends in
Food Science and Technology, 7, 245-256, 1996.
[9] Jain AK, ”Fundamentals of Digital Image Processing,”
Englewood Cliffs: Prentice-Hall 1989.
[10] Kavindra Jain, Chintan K. Modi, Kunal Pithadiya, “Non
Destructive quality evaluation in spice industry with
specific reference to Cuminum Cyminum L (Cumin)
seeds,” International Conference on Innovations &
Industrial Applications, Malaysia, (IEEE) 2009.
[11] M. Kurita and N. Kondo, “Agricultural product grading
method by image processing (part 1) - effectiveness of
direct lighting method”, J.SHITA 18(1): 9-17,2006.
[12] Shen Castan, Sian Zhao,”A Comparitive study of
Performance of Noisy roof edge detection”, 5th
International conference on Computer analysis of Images
and Patterns, volu.179, pp 170-174
[13] Tadhg Brosnan, Da-Wen Sun, “Improving quality
inspection of food products by computer vision-a
review”, Journal of Food Engineering 61, pp. 3–16,
2004.
[14] Xiaopei Hu, ParmeshwaraK.M, DavidV. “Development
of Non Destructive Methods To Evaluate Oyster Quality
By Electronic Nose Technology”, Springer Science
Business Media, LLC, 2008.
[15] Niky K. Jain,Samrat O. Khanna,Chetna
Maheshwari,,”Feed Forward Neural Network
Classification for INDIAN Krishna Kamod
Rice”International Journal of Computer
Applications(0975-8887),Volume 134 – No. 14,January
2016.
[16] Abutaleb AS, “Automatic thresholding of grey-level
pictures using two-dimensional entropies.” Pattern
Recognition, 47(1), 22-32, 1989.
[17] Niky K. Jain,Samrat O. Khanna,Chetna Maheshwari,,” A Machine Vision Approach For Indian Basmati Rice
Classification Using Geometric Features And CART”
International Conference on signal and speech
processing(ICSSP)-2014 (ELSEVIER digital library),
Pages : 176-182 ,2014/8
[18] Blasco J, Aleixos N, Molt E, “Computer vision system
for automatic quality grading of fruit”, Biosystems
Engineering, 415-423, 2003.
[19] Du C-J, Sun D-W, “Learning techniques used in
computer vision for food quality evaluation: a review”,
Journal of Food Engineering, 72(1), 39-55, 2006.
[20] Visen, N.S., Jayas, D.S., Paliwal, J., White, N.D.G.:
Comparison of two neural network architectures for
classification of singulated cereal grains. Canadian
Biosystems Engineering 46, 3.7–3.14
[21] Douik, A., Abdellaoui, M.: Cereal varieties classification
using wavelet techniques combined to multi-layer neural
networks. In: Proc. 16th Mediterranean Conference on
Control and Automation, Ajaccio, France, pp. 1822–
1827 (2008)
[22] Chtioui, Y., Panigrahi, S., Backer, L.F.: Rough sets
theory as a pattern classification tool for quality
assessment of edible beans. Trans. of the ASAE 42(4),
1145–1152 (1999)
[23] Mallat, S.G.: A theory for multiresolution signal
decomposition: the wavelet representation. IEEE
Transactions on Pattern Analysis and Machine
Intelligence 11(7), 674–693 (1989)
IJCATM : www.ijcaonline.org
Related Documents