An Empirical Evaluation of Graphical Interfaces to Support Flight Planning Philip J. Smith Cognitive Systems Engineering Laboratory Department of Industrial and Systems Engineering The Ohio State University 210 Baker Systems, 1971 Neil Avenue Columbus OH 43210 Elaine McCoy Department of Aviation Aviation Institute University of Nebraska at Omaha Chuck Layton Galaxy Scientific Corporation Atlanta GA Tom Bihari Adaptive Machine technologies, Inc. Columbus OH i 63/04 0100334 I https://ntrs.nasa.gov/search.jsp?R=19960012485 2018-06-23T15:30:55+00:00Z

Welcome message from author
This document is posted to help you gain knowledge. Please leave a comment to let me know what you think about it! Share it to your friends and learn new things together.
Transcript
An Empirical Evaluation of Graphical Interfaces to Support Flight Planning
Philip J. Smith Cognitive Systems Engineering Laboratory
Department of Industrial and Systems Engineering The Ohio State University
210 Baker Systems, 1971 Neil Avenue Columbus OH 43210
Elaine McCoy Department of Aviation
Aviation Institute University of Nebraska at Omaha
Chuck Layton Galaxy Scientific Corporation
Atlanta GA
Tom Bihari Adaptive Machine technologies, Inc.
Columbus OH
i 63/04 0100334 I
https://ntrs.nasa.gov/search.jsp?R=19960012485 2018-06-23T15:30:55+00:00Z

Whether optimization techniques or expert systems technologies are used,
the underlying inference processes and the model or knowledge base for a
computerized problem-solving system are likely to be incomplete for any given
complex, real-world task. To deal with the resultant brittleness, it has been
suggested that "cooperative" rather than "automated' problem-solving systems be
designed. Such cooperative systems are proposed to explicitly enhance the
collaboration of people and the computer system when working in partnership to
solve problems.
This study evaluates the impact of alternative design concepts on the
performance of airline pilots interacting with such a cooperative system designed
to support enroute flight planning. Thirty pilots were studied using three
different versions of the system. The results clearly demonstrate that different
system design concepts can strongly influence the cognitive processes of users.
Indeed, one of the designs studied caused four times as many pilots to accept a
poor flight amendment. Based on think-aloud protocols, cognitive models are
proposed to account for how features of the computer system interacted with
specific types of scenarios to influence exploration and decision-making by the
pilots. The results are then used to develop recommendations for guiding the '
design of cooperative systems.
4

In this study, three alternative designs for a cooperative problem-solving system
(Robertson, Zachery and Black, 1990) were empirically evaluated. All three
designs provided support for the task of enroute planning for commercial aviation
flights. They differed in terms of the timing and degree of assistance provided by
the computer.
The goals of the study were three-fold:
1. To gain a better understanding of how people perform adaptive
planning tasks;
To increase our understanding of how alternative system
designs influence the cognitive processes of users during such
planning tasks;
To develop recommendations to guide in the design of advanced
tools to support pilots and dispatchers in their flight planning
activities.
2.
3.
Enroute flight planning involves the modification of the flight plan of an airborne
aircraft in response to problems with weather, air traffic, medical emergencies,
mechanical failures, etc. The flight crew, air traffic controllers and airline
company dispatchers all play important roles in this planning process.
Figure 1 shows the relationships between the various components of the
planning environment, with the flight plan as the central unifying element of the
components. The flight plan stipulates what altitude and heading the plane will
fly during various phases of the flight and what routes the plane will take. The
5

route in turn determines he weather that will be encountered along the way.
Similarly, the weather &ects the spedd, safety, and efficiency of the plane, as well
as passenger comfort. The capabilities of the plane partially determine what
weather must be avoided and what routes may be flown. There are several more
relationships that could be pointed out, but they are not central to our discussion.
................................. Insert Figure 1 about here
The planner, then, is concerned with getting from a given origin to a given
destination in a timely fashion and with a minimum of fuel consumed, while
maintaining flight safety and passenger comfort. The planner must consider
what routes to take (these routes consist of waypoints, or navigational points, and
jet routes, the so-called 'highways in the sky' that connect the waypoints), what
altitudes to fly, what weather to avoid (including winds, thunderstorms, freezing
rain, and turbulence), and hdshe must consider the ever changing capabilities of
the plane (for example, the weight of the plane decreases as more he1 is
consumed; the lighter the plane, the higher it can fly).
The initial flight plan is rarely followed exactly, due to unforeseen events
occurring while enroute. Indeed, minor changes in flight plans are frequently
made and major changes are fairly common.
These amendments to the original plan are due to the dynamic,
unpredictable nature of the "world" in which the plans are carried out. Weather
patterns do not always develop as predicted, resulting in unexpected areas of
turbulence, less favorable tail winds or storms that must be avoided. Air traffic
congestion may delay take-off or restrict the plane to lower than planned altitudes.
6

Airport or runway closures can cause major disruptions, not just for one aircraft,
but for everyone planning on landing at that airport. Mechanical failures,
medical emergencies or other critical problems may force the plane to divert to a
nearby airport.
-
Enroute flight planning can be represented as search through a hierarchy
of problem spaces (Laird, Newell, and Rosenbloom, 1987). When a problem -
arises, as described above, the flight crew must - come up with a revised flight
plan. To select this revised plan, a variety of alternative solution paths may be
considered.
A state description for one possible problem space representation consists
Of:
1. The plane’s current location (a point along its route and an altitude),
airspeed, and attitude (direction of travel);
The flight’s currently approved plan;
Static and dynamic characteristics of the plane, such as its weight,
its maximum altitude capabilities, its he1 consumption
characteristics, etc. Characteristics that are normally considered
static may in some cases change because of a problem such as engine
failure;
Actual and forecast weather along the plane’s current route and any
possible alternate routes. The state description needs to include
measures of uncertainty about weather forecasts, as well as the best
2.
3.
4.
“guess” of what the weather will be;
Information on passenger connections and flight crew availabilities;
Static and dynamic characteristics of airports that could be used for
5.
6.
landing (runway lengths, visibility, air traffic congestion, etc.);
7
7. Similar information for any other planes whose paths could interact
with possible alternative paths for the plane of concern.
(This is a simplified summary of a state description.)
Major operators include:
1. changing altitude; Y. 9 changing airspeed;
3. changing the route;
4. changing the destination (a special, but important, case of changing
the route).
Each of these operators can be applied to either the plane of concern, or to another
plane with which its plan interacts. Furthermore, the first three operators can be
applied to different segments of the flight. For example, the plane may fly at
33,000 feet from Milwaukee to Chicago, but at 25,000 feet from Chicago to St. Louis.
There are also a number of constraints. Planes must maintain a certain
separation distance between both each other and thunderstorm cells (according to
the Federal Air Regulations). Planes oRen fly along the jet routes and are also
constrained to fly at certain altitudesl. Over the continental US., for instance,
33,000 feet is an “eastbound only” altitude. There are also physical limitations,
The plane can’t fly if it is out of fie1 and it can’t land at an airport with runways
that are too short.
Some of these constraints are actually “soft”, in that they may be violated in
some circumstances. E, for instance, there is no eastbound traffic, Am Traffic
Control (ATC) may allow a plane to fly west at an “eastbound only” altitude.
Similarly, ATC may approve a vector that deviates from the jet routes in order to
avoid a storm or save fuel.
8

Description of the state spaces, operators, and constraints is difficult
because there are so many possibilities to consider. Definition of the evaluation
function for selecting among operators is even more challenging, however. It is
clear that multiple competing and complementary goals are considered
(Wilensky, 1983) in evaluating preferences among alternative operators (or
operator sequences). Safety, ke l consumption, time, and passenger comfort are
all important considerations. It is not as clear, though, exactly how human
planners currently deal with tradeoffs among these goals.
In short, the full problem space for enroute flight planning is very large
and complex. Multiple goals must be considered in a highly stochastic
environment where multiple plans must be coordinated.
There are several areas of research which have a bearing on the current effort.
Among these are computational approaches to planning, models of human
planning, human-human cooperative problem solving, group problem solving,
and human-machine cooperative problem solving (including decision support
systems). Some of the pertinent literature for each of these areas is discussed
below.
In the following, the terms ‘plan’ and ‘subplan’ are used interchangeably;
technically, a subplan is subordinate to a plan, but because the scale is relative, it
is often easier to simply use the term ‘plan’. It should be understood that all plan
units can be viewed as subordinate to a larger plan.
9

1vl[odels of Planning
of human behavior is often judged by whether or not that behavior fits in a logical
plan. Furthermore, planning has been of interest to artificial i (AI) researchers because of the challenges it presents
association with problem solving in general.
cause of its close
But how can planning be modeled by computational methods and what do
these models have in common with human planning? Below we discuss some of
the efforts to address these questions.
First, models developed by Miller, Galanter and Pribnun (19601, Sacerdoti
(19741, Hayes-Roth and Hayes-Roth (19791, Suchman (19871, and Wilensky (1983)
are discussed. Two simple operational definitions taken from Cohen and
Feigenbaum (1982) will help in this discussion. A plan is "a representation of a
course of action" and planning is "deciding on a cowse of action before acting" (p.
515).
Miller, Galanter, and Pribram. In 1960, Miller, Galanter, and Pribram began
to lay a foundation for understanding human planning activities. The authors
viewed humans as idormation processors, and their definition of a plan was
"any hierarchical process in the organism which can control the order in which a
ne of activities to a
lo

representation for plan knowledge and as a controller of behavior. The 'Test'
phase checks for congruity between the desired state and the current state, while
the 'Operate' phase constitutes the execution of an action to achieve the desired
state. The action is repeated until the desired state is achieved.
According to Miller, et al., the power of such a representation lies in the ability
to put other TOTE units in the operate phase of higher order units, thus nesting
the TOTE units. Their representation for driving a nail is shown in Figure 2.
Insert Figure 2 about here
11

Model, As psychologists, Miller et al. were con
modeling human performance.
type of model with models developed by AI researchers, such as
ABSTRIPS (Sacerdoti, 19'74) is a hierarchical planner that generates a hierarchy
of representations for a plan. The highest representation in the hierarchy is an
abstraction (simplification) of the plan, axid the lowest representation is a detailed
list of actions required to solve the problem. Goals, objects, and/or operators may
be abstracted. The purpose of such abstractions is to discriminate between items
that are crucial to the success of a plan and those items that are details (i.e., tasks
that are likely to be taken care of in a number of ways). ABSTRIPS first works at
achieving the critical plan elements and then successively incorporates further
levels of detail.
ABSTRIPS' planning begins with a complete plan at the highest abstraction,
which is then progressively refined until a detailed successful plan'is achieved. If
a plan fails at one level of abstraction, the planner backs up to higher levels of
abstraction until it reaches a choice point and then it takes a different path. Each
level of abstraction contains all of the objects and operators given in the initial
state (or ground space).
A pred a l 0
program by the programmerhowledge engineer, along with initial criticality
(importance) values. ABS'I!RPS then adjusts these values. The adjustment
procedure is: All preconditions whose truth value cannot be changed by any
operator in the domain are assigned a maximum criticality value. For each of the
remaining preconditions, if a short plan can be found to achieve it (assuming all

previous processed preconditions are true), it is assumed to be a detail and is
assigned a criticality equal to its rank in the partial order. If such a plan can not
be found, the precondition is given a criticality greater than the highest value in
the partial order.
ABSTRZPS - An Example. The ABSTRIPS planner comes from the domain of
'robot navigation', in which one is concerned with moving a robot between
adjacent rooms and using the robot to move boxes. Although the following
example plan, adapted from Cohen and Feigenbaum (1982), is not of robot
navigation, it will help illustrate the ABSTRIPS model:
"Consider now the problem of getting a cup of coffee. You go to the kitchen
and if coffee is made, YOU pour some. If not, you make some or go out to buy
some. If you decide to make some, but there are no coffee beans or ground
coffee, you go to the store to get some. If you have no money, you go to the
bank first." (p. 523).
The relevant objects to be planned about are presented in Table 1.
................................ Insert Table 1 about here
Some of #e operators (methods of action) and their preconditions and
postconditions are presented in Table 2.

Finally, the initial state is not having brewed coffee, and the goal state is a cup of
brewed coffee.
In this example, one might suppose that the most important precondition is
that a place exists, since operators that depend on that place can only be used if it
exists. Furthermore, one might suppose that having something is the next most
important precondition, and finally, that being somewhere is the least important, .
since it is most easily changed. The initial partial ordering supplied to
ABSTRIPS is shown in Table 3.
................................ Insert Table 3 about here
Following this reasoning, bank exists, coffee- bean store exists, brewed-coffee
store exists, and kitchen exists are all assigned a maximum criticality (3 for now)
because their truth cannot be changed by any operator (note that grinder store
exists has not been processed). Have beans, have boiling water, and have money
all can be achieved by
therefore, they are assigned a cri
hort plan, gwen that the previous preconditions are true;
e somewhere preconditions
14
are assigned a value of 1 (equal to their rank in the initial partial order). These
values are summarized in Table 4.
..................................... Insert Table 4 about here
After assigning all criticality values, ABSTRIPS begins to plan at the highest
level of abstraction (criticality 5). It assumes that all preconditions with lesser
criticality are true. Thus, for the goal of having brewed coffee, ABSTRIPS finds
two possible plans to achieve it: make coffee and buy coffee. ABSTRIPS initially
tries to make coffee. Once it has achieved a complete plan at this level, it moves
down one level of abstraction and formulates a plan including all higher levels of
abstraction, and so on until the goal is achieved or a dead-end is reached. In this
case, since the grinder store does not exist, ABSTRIPS backtracks through
abstraction levels to the last choice point and pursues the plan of buying brewed
coffee and succeeds.
ABSTRIPS - Contributions. The use of hierarchical abstraction spaces can
facilitate finding dead-ends early, so that the amount of backtracking may be
reduced compared to non-hierarchical planners (which treat all subgoals as
having equal import). "his fact is important because the less backtracking the
planner has to do, the faster a satisfactory plan can be found. If the solution space
is very large, such efficiency may be important.
Thus, the introduction of the concept of an abstraction hierarchy was one of the
most significant developments of early computational planning work. Indeed,
nearly all planners developed since ABSTRIPS have incorporated abstraction
hierarchies because of their power in reducing search.

Furthermore, ABSTRIPS was designed to accomplish multiple, non-
interacting goals, while a number ofprevious planners could not handle more
than one goal at a time. By pursuing multiple goals, ABSTRIPS takes a step
toward being more 'human-like' than previous planners.
Finally, the ABSTRIPS approach is relatively domain independent, so one
could use it as a general purpose planning system in a variety of domains
(provided one wanted to spend the time to represent the domain appropriately).
ABSTRIPS - Limitations. ABSTRIPS could have trouble with conjunctive
goals that interact. --Although it is possible to represent the domain such that
ABSTRIPS implicitly considers such interactions by setting up one goal as a
precondition for another, such ordering may not be possible with all domains. In
such cases, the planner would have to be able to abandon or relax some of the
goalskonstraints.
- -
Additionally, it is unlikely that people plan in the strictly top-down manner
used by ABSTRIPS. Exclusive top-down planning can be inefficient in many
situations (e.g., in errand running tasks). Such 'non-human' behavior may
affect the acceptability of the plans produced by such planning systems or the
acceptability of interactions with such systems (e.g., explanations produced to
just* the recommended plan).
Unlike top-down planners, people fiequently recognize opportunities to achieve
multiple goals when planning for a single goal. Thus, people are to some extent
'opportunistic', which leads to the planning model developed by Hayes-Roth and
Ha ye s-Ro th.
Hayes-Roth and Hayee-Roth- An opportunistcMode1. Hayes-Roth and
Hayes-Roth (1979) studied human planning in a paper-and-pencil simulation of
daily activities (running errands) and used the data obtained to develop a
planning system that was very different fiom planners that had previously been
16

developed. In a nutshell, the theory is that humans plan at multiple levels of
abstraction simultaneously, and that some planning is in fact bottom up. If the
opportunity presents itself to achieve a goal while working toward another goal,
that opportunity will be seized (hence the term 'opportunistic planning'). In another typical behavior, 'island driving', the problem solver finds a correct
solution to a subplan (island) and then extends problem solving to other subplans.
The system developed by the Hayes-Roths achieved an opportunistic style of
planning by using a blackboard architecture with multiple representations of
planning knowledge and multiple levels of abstraction within those
representations. This architecture has its roots in the Hearsay-I1 speech
understanding system (Erman, Hayes-Roth, Lesser, and Reddy, 1980). Planning
therefore had bottom-up and topdown components, with specialists that
recognized both opportunities to achieve task-specific subgoals and opportunities
to achieve meta-planning goals (such as conserving resources).
Specifically, the authors assumed that many cognitive 'specialists' (a.k.a.
'demons') act independently in making decisions that are incorporated into a
plan. Specialists record their decisions on a common blackboard so that these
decisions are made available for other specialists to use. The blackboard consists
of five 'planes' which represent different conceptual categories of planning
1. the 'plan' plane consists of actions that the planner intends to take;
2. the 'plan-abstractions' plane contains desired attributes of plan
decisions;
3. the 'knowledge-base' plane consists of information about relationships
in the world;
4. the 'executive' plane contains decisions about the allocation of planning
resources; and,
17

5. the 'meta-plan' plane consists of decisions about the planning process in
use (i.e., the type of problem under consideration, the methods being
used, evaluation criteria, etc.).
These planes are hrther divided into levels of abstraction peculiar to each plane.
According to Hayes-Roth and Hayes-Roth, these abstraction levels provide a
taxonomy of the decisions made and they restrict the number of prior decisions
that must be considered by individual specialists.
The cyclical planning process is controlled by the executive plane, which
decides which one of the triggered specialists to fire during each cycle. The
process repeats until a complete plan is developed, until a plan satisfies
'important evaluation criteria', or until failure.
Contributions. The more significant contribution of this work was the
introduction of the idea of planning at multiple levels ofabstraction
simultaneously. This allows a planner to capitalize on relationships in the
environment when they are noticed. In other words, some components of human
planning are no doubt bottom-up; presumably, this yields more efficient planning
in some cases.
Another benefit of the Hayes-Roth and Hayes-Roth model is that it uses
multiple descriptions of the planning process. Thus, the planner can reason
about aspects of the environment or the planning process which aren't directly
associated with the plan itself. For example, the planner may notice that there
are multiple errands in the southeast corner of the city, or that pursuing a
particular aspect of the plan will require too many cognitive resources.
Limitations. From the standpoint of the present work, there are two
drawbacks to this model. First, the planning task was very simple: There were
no significant constraints on errands. The only factor that typically constrains
errand planning, time, was removed from the experiment.

Second, all planning work was undertaken in advance of acting (in fact, the
subjects never were required to enact their plans), whereas humans tend to
develop loose plan structures and rely on specific environmental feedback during
plan execution to guide them in the details. As previously discussed, the act of
carrying out one's plans frequently leads to replanning. The 'think then act'
problem is endemic to all computational planners, and more will be said about it
later. It bears mentioning here because of the claims made by the Hayes-Roths
and because it is precisely the issue brought up by Suchman (discussed below).
Suchman - The Situated &tion ModeL Like the Hayes-Roths, Suchman (1987)
has also been involved in analyzing everyday actions. From Suchman's point of
view, most activities revolve around direct interaction with the environment and
relatively little behavior is extensively planned. Suchman forcefully argues her
views in the following paragraphs from the preface of her book
"...however planned, purposeful actions are inevitably situated
actions .... actions taken in the context of particular, concrete
circumstances ...[ T'Jhe circumstances of our actions are never filly
anticipated and are continuously changing around us. As a consequence
our actions, while systematic, are never planned in the strong sense that
cognitive science would have it. Rather, plans are best viewed as a weak
rt?source for what is primarily ad hoc activity. It is only when we are
pressed to account for the rationality of our actions ... that we invoke the
guidance of a plan. Stated in advance, plans are necessarily vague, insofar
as they must accommodate the unforeseeable contingencies of particular
situations. Reconstructed in retrospect, plans systematically filter out
precisely the particularity of detail that characterizes situated actions, in

favor of those aspects of the actions that can be seen to accord with the
plan." (pp. viii-ix).
Contributions and Limitations. Suchman's point that most plans serve
primarily as a frame . It is certainly true of a
lot of behavior, such as in the human-machine interaction studies which slie
carried out, and there is a tendency for people to ascribe to notio
order to rationalize behavior. But it i s precisely this framework
consideration. Furthermore, there are domains and activities that require
considerable detailed planning before actions can be initiated. Succesafid
businessmen and businesswomen certainly do not decide to introduce a new
product on a whim. Rather, they carry out market surveys, determine the cost of
production, analyze the actions of their competitors, and determine- what effects
the sale of the new product will have on profit margins, long term equity,
goodwill, etc. I
Enroute flight planning makes use of both plans and situated action. Flight
planning is a complex activity characterized by multiple interacting goals and
constraints. Furthermore, because airplanes travel at a relatively high rate of
speed (thus there is sometimes rather little time available for planning), pilots,
dispatchers, and ATC must have some relatively detailed contingency plans
developed prior to actually using them. Indeed, pilots are required to have such
contingency plans prior to taking off. However, such planning is a somewhat
separate activity from the moment by moment actions required to keep the wings
on course. In this view, Suchman's conceptions can be
seen to fit nicely within the purview of the Executor in Wilensky's (1983) model:
The E n the s of a plan in carrying it out.
Wilensky. In 1983, Wilensky described a more comprehensive approach to
computational planning. He proposed that an efficient planner would have plan
frameworks stored in memory that could be retrieved according to the goal which
they achieved. The planner would be able to reason about the future and how the
hture would be aSected as a result of planned actions. The planner would also be
able to develop new goals based on the situations in which it found itself.
Furthermore, the planner would be able to detect interactions between
subgoals and to plan according to those interactions by relaxing or abandoning
some of its subgoals or by trying to achieve multiple subgoals at the same time.
The planner should also be able to take into account the goals and actions of other
agents. Some of the details of a plan would not be able to be decided upon until
plan execution. Finally, the planner should be able to reason about the plans
themselves, thus performing meta-planning. Meta-planning would be concerned
with conserving resources, achieving as many goals as possible at the same time,
maximizing the value of the goals achieved, and avoiding impossible goals.
The components of Wilensky's planning system are described as follows:
"1. Goal Detector--This mechanism is responsible for determining that the
planner has a go al... [Tlhe Goal Detector notices situations ... that have
arisen that are relevant to the planner ...
2. Plan Proposer--This component's task is to find stored plans relevant to
current goals ... The Plan Proposer is also responsible for expanding
plans into component plans. ..for further planning or execution.. .
3. Projector--The purpose of this component is to test plans by building
hypothetical world models ...m his ability is used to debug current plans
by simulating a fbture that m a y contain undesirable elements, thus
enabling the goal detector to form new goals ...
2l

4. Ex --...[TI he Executor tries to
actio ns... This may require expandi
they can be directly executed and detecting interactio
at this level." (p. 22).
These components interact as shown in Figure 3.
................................ Insert Figure 3 about here
Contributions. Wilensky is to be commended for his efforts to model many of
the components which make up human planning activities. Particularly notable
are his efforts to include multiple agents, stored plans, the effects of the plannerk
actions on the world, subgoal interactions, and the uncertainties involved in plan
execution. His model goes beyond studying one major aspect of planning in
isolation of others.
Limitations. As a conceptual model, it is hard to find fault with Wilensky's
framework. On the other hand it is likely that such a comprehensive approach to
planning would be difficult for anyone to implement for significant real-world (as
opposed to toy) planning tasks.
Operations Research Models, In contrast to these symbolic reasoning
models, the field of operations research has developed quantitative tools to help
with planning ac6vities. These may involve the use of linear programming
techniques or decision analytic approaches (Holman, 1989). They require
detailed mathematical descriptions of the decision problem, and in one sense or
another seek optimal plans or solutions, thus contrasting with AI approaches
which generally are sati
rather than optimal solutions.
utational methods that produce "goodf
Models of Planning - Conclusion. Research such as that described above
has had a major impact on our understanding of planning. It has served to
provide a conceptual framework for understanding the task of planning, as well
as to outline different strategies for accomplishing such tasks, including
strategies applied by human planners. As wil l be described later, these insights
were of great value in guiding our system development efforts.
CoopesatVePr0kSohTingSyste;tns
Cooperative problem solving is really an extension of past efforts at joint
human-machine problem solving, but with a shift in emphasis away from
machine-dominated approaches. This shift in emphasis has been fairly recent,
so relatively few studies have been conducted on cooperative problem solving
systems. However, there have been some conclusions drawn from this and
related work which indicate what types of system characteristics may be
beneficial to cooperative problem solving. .
Decision Support Systems. Decision support systems OSS) are an
outgrowth of management information systems (MIS) in the decision science and
business communities. Whereas MISS are typically automated methods for
monitoring and summarizing financial data without interpretation, DSSs use
these data along with a model of aspects of a given enterprise and of the external
environment to provide managers with feedback to hypothetical situations. For
example, a company may use a decision support system to help determine the
pricing for a new product in a competitive environment. DSSs are typically used
for strategic planning (long range planning--over two years) and management
controlkactical planning (moderate term planning--approximately six months to
two years) in business environments.
There is a wide range of software programs that have been labeled decision
support systems. For example, Thierauf (1988) lists report generators, electronic
spreadsheets, financial planning languages, and statistical an
tems. A DSS develop
connected to a maidrame and use a shell, called a
designed for producing decision support systems, or hdshe may work at a
personal computer using Lotus 1-2-3. Similarly, the developer may be a
managedend-user of the DSS, or hdshe may be a DSS builderhowledge
engineer called in to assist in the project.
The general design principles for such systems tend to be rather vague.
Authors tend to use blanket statements such as “use up-to-date information”, “the
system should respond in a timely manner”, and “present information in a
concise and appropriate manner” (which often means graphically) (cf. Bidgoli,
1989; Holsapple and Winston, 1987; Davis, 1988; Thierauf, 1988).
As an example, Hall (1988) developed a decision support system and studied
its effect on strategic planning. The author found that those subjects who used
the system developed much better strategic plans than those who did not
(according to independent judges), and that managerial experience did not play a
role. Hall did not study how behavior changed as a result of using the decision
support system.
H m - M a c h i n e Cooperative Problem Solving Studies There are several
studies which are particularly relevant to cooperative problem solving. Coombs
md Alty (19841, although they didn’t study human-computer cooperative problem
solving, identif!ied possibly desirable aspects of the approach; Shute and Smith (in
press) similarly studied humanFhuman cooperative problem solving, but had
results which M e r &om those of Coombs and Alty; Mitchell and Saisi (1987)
stu COO e system for satellite idormation display and control;
Suchman (1987, already discussed in the context of computational approaches to
planning) studied interactions with an ‘expert’ copier; Roth, Bennett, and Woods
(1987) studied technicians using an expert system for fault diagnosis and repair;
and Lehner and Zirk (1987) studied h e effects of mental models of a computer's
processing on performance. The first two studies were conducted on systems
which were cooperative by design, while the Suchman and Roth, Bennett, and
Woods studies were conducted on systems that were authoritarian by design, but
became cooperative (actually, uncooperative) in practice.
Coombs and AZty. As mentioned, Coombs and Alty didn't study cases of - human-machine cooperative problem solving; rather, they studied human-
human interactions and discovered aspects of such interactions which may be of
use in building a cooperative human-machine system. The authors suggested
that human experts rarely are asked to give solutions to hard problems (which
runs counter to the idea behind expert systems); instead, they are asked to provide'
assistance in promoting the understanding of a problem area. The following
activities were said to aid in promoting understanding
"a. providing relevant contextual information;
b. focusing attention on important topics in the subject area;
c. helping to predict outcomes of given processing circumstances." (p. 22).
In studying advisory interactions at a university computing center, the
authors made two observations. First, interactions in which the advisor
controlled the conversation were judged unsatisfactory, due in part to a lack of
feedback and a lack of description of how information was being used in the
reasoning process (or, indeed, what that process was). Second, advisory
encounters that were judged as satisfactory were characterized by:
1. both parties sharing the advisor and client roles;
2. the parties keeping assumptions, information, and strategies explicit;
and,
3. both parties gaining insights into problems and solution methods.

Shute and Smith. In contrast to Coombs and Alty, Shute and Smith (in
press) studied human-h
information seekers in the domain of information retrieval. In this case, the
expert search intermediary guided the interactions with the information seeker
in order to be#er define the information seeker’s interests. In particular, the
intermediaries, who were experts in the subject matter of interest to the
information seekers, devoted much of their time to teaching the information
seekers about the subject area. They did so by suggesting related topics that might
be of interest. Although the information seekers had control in the sense that they
provided feedback to the intermediaries about the relevance of suggested topic
refinements, the intermediaries largely controlled the conversations. Contrary to
s between search intermedi
-
Coombs and Alty’s conclusion, the information seekers were quite satisfied with
such interactions.
Furthermore, the expert intermediaries automatically handled lower level
details such as selecting appropriate commands (e.g.,. display all 1-3 or search
water pollutiodCV) or choosing appropriate logical operators (e.g.,. AND,
WITH), offen with little or no explanation to the information seeker. When
explanation was provided, it was generally given in the form of tutoring (in case
the information seeker had to do such a search on hidher own someday).
Such results suggest that acceptable roles and interaction styles are
dependent on the nature of the task and the types of assistance available from the
expert consultant.
Mitchell and Saisi. Mitchell and Saisi (1987) compared two different
satellite display and control system designs. The first design was one actually
and was c ed by a data availability approach to
design (data avaihbility designs display raw data organized by data
type). The second design centered on the activities of the operator. This system
utilized analogical representations and i
collections of data (these collections were
sensitive to the state of the system). They found that operators
systems performed much better overall on the second (activity-oriented) system
than on the original system.
Suchman. Suchman (1987) studied interactions with a copier that gave
‘expert’ guidance for its use. Suchman observed that significant communication
diaculties arose for novices. In general, she found communication failures due
to ambiguous instructions, rigid procedures (unanticipated variability), a lack of
direct access by the person to the machine’s ‘reasoning‘ processes, and a similar
lack of access by the computer to the misunderstandings held by the person using
the copier.
Roth, Bennett, and Woods. Roth, Bennett, and Woods (1987) found similar
communication difficulties in a study of technicians wing an expert system to
trouble-shoot a malfunctioning device. These authors found that the technician’s
level of expertise and degree of active participation in problem solving greatly
affected overall performance and success.
Lehner and Zirk. Lehner and Zirk (1987) studied the extent to which a
person’s mental model of an expert system’s decision processes affected the joint
performance of the person and expert system. Lehner and Zirk studied subjects
in a simulated stock purchasing task. The authors found that if the subjects had
a good model of the expert system’s problem-solving approach, combined
performance was better if. the subject and computer used different problem-
solving methods than if they used the same approach.
h is related to human-computer
‘groupware’, wherein a
computer system s an intermediary b een people working together on

problems. Electronic mail is sometimes called gro
support the activities of
software which is
Ciborra, and Proffitt (1990) developed a system to assist commercial airline pilots
in the process of bidding for flights (pilots bid on which flights they wish to fly;
flights go to the highest bidder).
Cooperative Systems - Discussion. As summarized earlier, studies of
planning have served to identify considerations that should be addressed in
developing computerized aids for planning. Studies of human-human and
human-computer cooperative problem solving have identified additional
questions , including:
1. Who should control the interactions and directions for exploration?
2. What expertise can the “client” bring to the problem solving process?
3. Is it possible to provide the computer with idormationhowledge which
may be beyond a given person’s expertise?
4. Is there an opportunity to teach the human agent usefbl strategies?
5. What happens when the human agent has information which is not
available to the computer?
6. What are the goals of the human user and how can the interface be
organized around these?
7. Is the system robust/flexibl
8. Is thesystem
9. Is it possible to provide the operator with an appropriate model of the
different problem solving styles?
computer’s problem solving processes?
ns to be done to ans r these questions (and to
e applicable).

EIlrouteFligihtmanning~
tional re1
profile planning (OPTIM), a stand-alone enroute
proposed cooperative system approach to enroute flight planning (Personalized -
Flight Replanner). These are discussed below.
OPTIM. Most flight planning systems to date have used optimization
techniques to develop their plans and they have be
planning, as opposed to enroute planning. In fact there are many commercial
systems that will allow a person to see weather information and develop flight
plans; these systems will propose flight plans based on the performance
characteristics of a given aircraft. Although these systems incorporate data on
prevailing winds in such computations, they do not generally consider other
weather concerns.)
ncerned with preflight
OPTIM (Sorensen, Waters, & Patmore, 1983) was developed to generate
near optimal vertical flight profile for a given aircraft over a given horizontal -
route (consisting of waypoints and jet routes) and with given winds and
temperatures at the waypoints along the route. Specifically, OPTIM minimizes
the output value of an algebraic function consisting of factors which specify the
cost of fbel, the cost of time, the aircraft9s fbel flow rate, the aircraft's ground
speed, the aircraft's airspeed, the aircraft's thrust and drag coefficients, and the
aircraft's weight; the ground speed is determi
wind velocity. OPTIM was not conc
s velocity and the
d come up with
the necessary horizontal flight plan for input.
Diverter. Diverter (Rudolph, Homoki, & Sexton, 1990) represents an
atte ystem to devel ans for diversion
to a new destination d to deviating enroute maintaining
the same destination airport). Diverter uses production rules, Air Traffic Control
2 9 '

reports, aircraft system status, and a datab
about plans to alternative destinations. The production rules contain information
on aircraft performance characteristics, Federal Air Regulations, and
navigational and weather avoidance heuristics. For each diversion option,
Diverter evaluates the runways, airfields, and routes independently based on a
variety of factors (e.g., safety, weather, fuel consumption, etc.) and then combines
these evaluations for a total diversion ‘score’. The diversions are then rank
ordered according their scores and the top option is selected by the computer and
recommended to the pilot. The major drawbacks to Diverter are that:
of airfields and routes to reason
1. Control is limited to assigning weights for the various attributes used
in search;
Important criteria (such as passenger connections) are totally
ignored by the system; and,
It provides no means for using it as a tool in which the human adds
in considerations of additional criteria.
2.
3.
Personalized Flight Replanner. Cohen, Leddo, and Tolcott (1989),
investigated a cooperative approach to enroute flight planning. They proposed a
system in which, for each situation encountered, the pilot would be responsible for
determining what parameters would affect enroute flight planning decisions and
for determining the relative importance of those factors. The proposed system
consisted of five modules:
1. a plan (bird‘s eye) view of the route, weather, air traffic, and airports;
(profile) view of weather and traflic;
an ‘uncertainties’ module, which would be used to evaluate 3.
acy of routes (e.g.,report X indicates
destination prior to arrival, report Y
indicates that it will);

4. an ‘evaluation’ module for
likelihood of achieving go
turbulence, but route B will
5. a ‘goals’ module, where
various flight parameters (e.g., fuel remaining should be greater
than 6000 lbs. at the destination).
All of these modules would be cross-referenced and the pilot could request
assistance from the computer for evaluating any of the modules or filling in flight
parameters. While these are interesting ideas, this flight replanning system
exists only as a paper mockup.
-&-- ‘on
Above, three literatures were briefly reviewed. As discussed, publications
on models of planning (by humans and by computers) provide important insights
into the nature of planning as a task and into strategies for accomplishing such
tasks. The literature on cooperative systems raises interesting questions that
need to be considered when developing an interactive planning system. Finally,
the literature on flight planning systems identifies some of the important factors
to deal with in designing a system specifically for that task.
Below, we describe the design of a system based on the considerations
suggested by these literatures. Then we present the results of an empirical study
of three variations on this system design.
d to test sever
ign was devel
extensive cognitive task analysis (Smith, McCoy, Layton,

four flight plans in c
weather information and to obtain feedback in terms of flight parameters such as
fuel, time, and distance. The weather information consists of both graphic
depictions and verbal descriptions and can be displayed at several altitudes. The
displays show the entire flight path, thus emphasizing global solutions to
problems. In addition, the person can manipulate the display time to see the
relationship between the weather information and the plane's position. The
system computes the optimal vertical profile to minimize fuel consumption,
amval times at waypoints, and fbel remaining at those waypoints, based on
winds components. It also determines these flight parameters given a user-
selected vertical profile.
The basic system runs on a Macintosh I E with two color monitors. The features and functions on each monitor are discussed in turn.
LeftMonitOr
The displays and controls on the left monitor are shown in Figures 4 and 5.
(In all of the f'yrures which depict system displays, some of the information loses
saliency as printed here in black and white instead of color.)
Insert figures 4 and 5 about here
The primary feature on the left monitor is a map display. This display
continental United States, the aircraft position, and planned routes.
be overlaid on map. This information
includes:
32
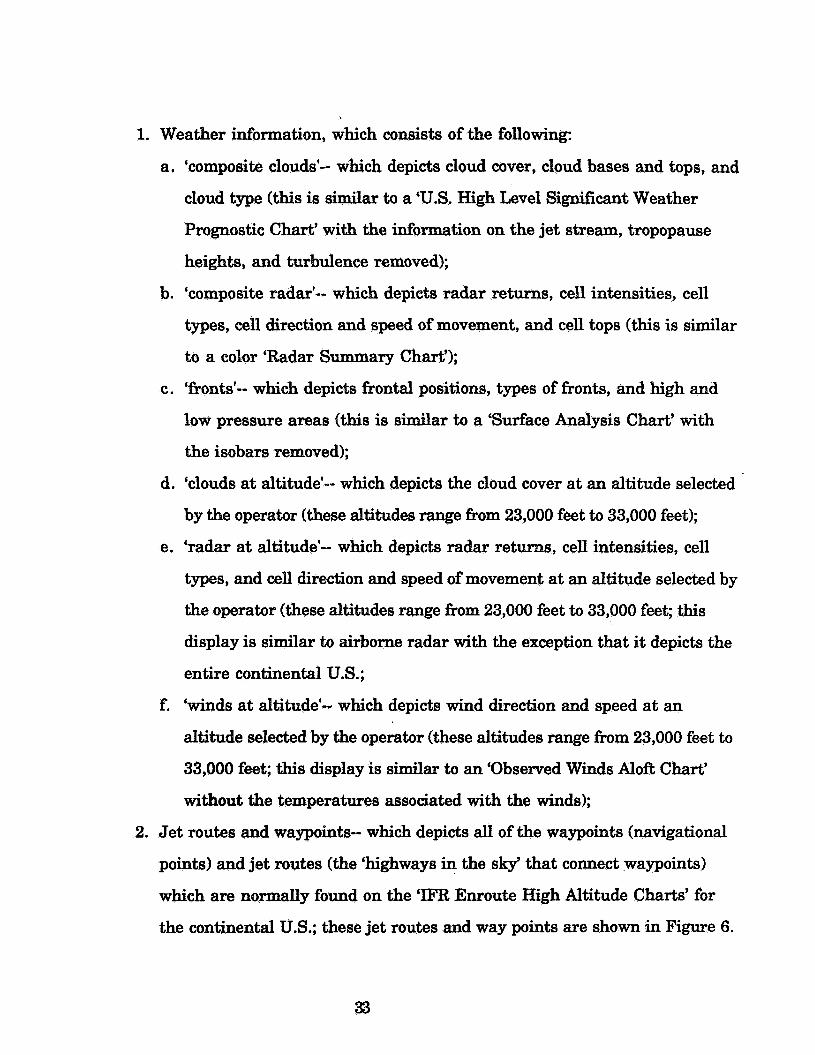
1. Weather idormation, which consists of the following:
a. ‘composite clouds’-- which depicts cloud cover, cloud bases and tops, and
cloud type (this is similar to a ‘US. High Level Significant Weather
Prognostic Chart’ with the idormation on the jet stream, tropopause
heights, and turbulence removed);
b. ‘composite radar’-- which depicts radar returns, cell intensities, cell
types, cell direction and speed of movement, and cell tops (this is similar
to a color ‘Radar Summary Chart’);
c. ‘fronts’-- which depicts frontal positions, types of fronts, and high and
low pressure areas (this is similar to a ‘Surface Analysis Chart’ with
the isobars removed);
d. ‘clouds at altitude’-- which depicts the cloud cover at an altitude selected
by the operator (these altitudes range from 23,000 feet to 33,000 feet);
e. ‘radar at altitude‘-- which depicts radar returns, cell intensities, cell
types, and cell direction and speed of movement at an altitude selected by
the operator (these altitudes range firom 23,000 feet to 33,000 feet; this
display is similar to airborne radar with the exception that it depicts the
entire continental U.S.;
f. ‘winds at altitude’-- which depicts wind direction and speed at an
altitude selected by the operator (these altitudes range firom 23,000 feet to
33,000 feet; this display is similar to an ‘Observed Winds Aloft Chart’
without the temperatures associated with the winds);
2. Jet routes and waypoints-- which depicts all of the waypoints (navigational
points) and jet routes (the ‘highways in the sky’ that connect waypoints)
which are normally found on the ‘IF’R Enroute High Altitude Charts’ for
the continental U.S.; these jet routes and way points are shown in Figure 6.
33

times: The ‘current
current position. One can also ‘zoom in’ on a region of the map, which replaces
that map of the continental U.S. with a magnification of an area surrounding an
operator-selected point. Similarly, the user can ‘unzoom’ back to the map of the
continental US.
................................ Insert figure 6 about here
The last general item of interest on this monitor is a ‘notification window’
which presents the person with important information regarding the various
planned routes (e.g., a warning that the plane wi l l consume all of its &el before
reaching the chosen destination).
RightlMonitor
The right monitor displays and controls are shown in Figure 7.
It displays a ‘flight log‘ of a route. This flight log is essentially a spreadsheet
which depicts each segment of the route (ie., all of the waypoints and jet routes
which make up the route), as well as information pertinent to those segments.
This information consists of the arrival time and &el remaining at each
waypoint, the ge de and speed for each segment, as well as other flight
parameters. The flight log also graphically displays the planned altitudes for the
route and the least-&el-consumption altitudes for that route. Finally, the flight
lo S on which is pertinent to the route. For example,
turbulence idormation is on by default, but the person can also select information
on the winds. The turbulence information that is presented is a one-word
34
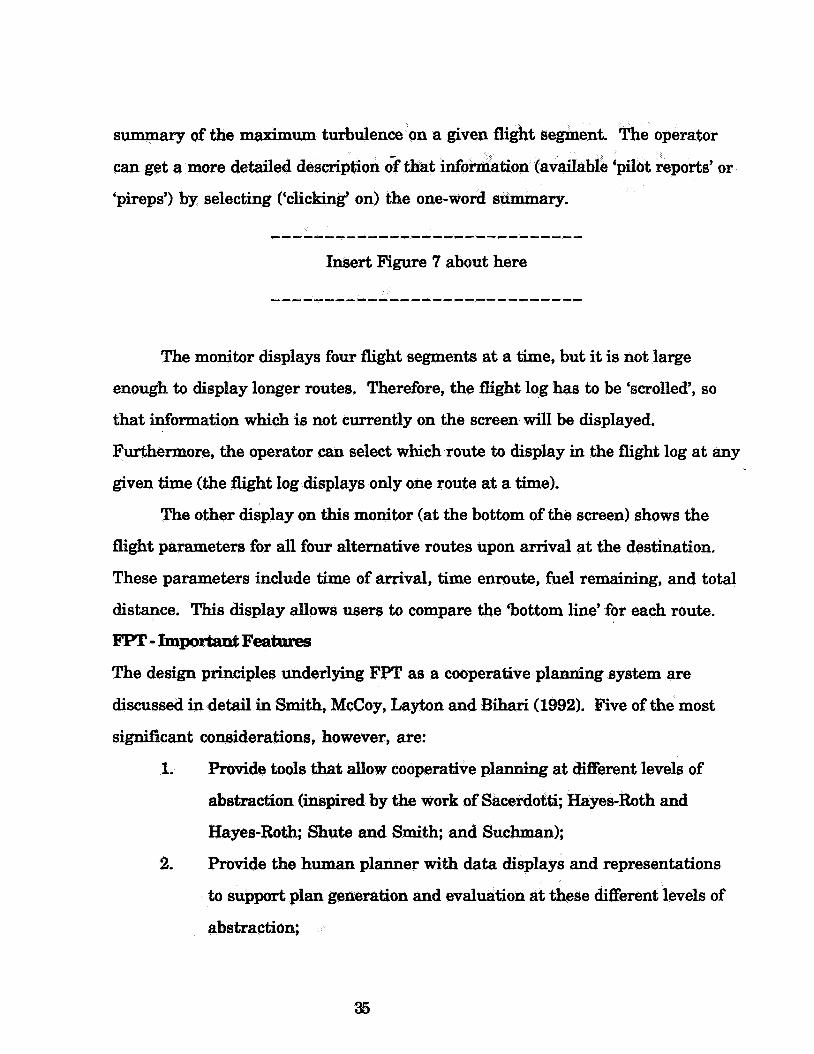
summary of the maximum turbulence on a
can get a more detailed des t i
‘pireps’) by selecting (‘clicking‘ on) the one-word
............................. Insert figure 7 about here
The monitor displays four flight segments at a h e , but it is not large
enough to display longer routes. Therefore, the flight log has to be ‘scrolled‘, so
that infomation which is not currently on the screen will be displayed.
Furthermore, the operator can select which route to display in the flight log at any
given time (the flight log displays only one route at a time).
The other display on this monitor (at the bottom of the screen) shows the
flight parameters for all four alternative routes upon arrival at the destination.
These parameters include time of arrival, time enroute, he1 remaining, and total
distance. This display allows users to compare the ‘bottom line’ for each route,
F’FT-ImpOrtantFea~
The design principles underlying FPT as a cooperative planning system are
discussed in detail in Smith, McCoy, Layton and Bihari (1992). Five of the most
significant considerations, however, are:
1. Provide tools that allow cooperative planning at different levels of
abstraction (inspired by the work of Sac
Hayes-Roth; Shute and Smith; and Suchman);
Provide the human planner with data displays and representations
support plan gener and eval els of
; Hayes-Roth and
2.
abstraction;
35

3. Provide cognitive interfaces to the avail
the person to easily communicate desi
Provide tools that help the person predict the outcomes of various
plans (Coombs and Alty, 1987);
Incorporate a graphical interface that allows the person to view and
explore alternative plans in the context of the relevant data
(i . e. ,weather displays).
port tools that allow
4.
5.
Below we describe an empirical study to assess some of these design
considerations.
, .
In the study described below, FPT was used as a testbed to study the effects of
Merent design features on cooperative problem solving performance. Briefly,
each of the thirty subjects (professional airline pilots) was asked to use one of
three alternative system designs (ten subjects per condition). Each subject was
trained on the use of that version of the system and given four cases to solve.
As mentioned above, three different enroute flight planning support
systems were designed. In actuality, these three systems represented variations
on the levels and timing of support provided by the computer. These variations on
the system design represented the independent variable studied in this
experiment. three different versions are discussed below.
The ‘Sketching only‘ System. The ‘sketching only system allowed the
human planner to sketch proposed flight paths on a map display, while the
CO r filled in lower level details (such as fuel remaining, time of arrival, and
recommended altitudes) by using an optimization program that found an altitude
profile and speeds that minimized consumption (taking into account wind
36

components). In this version, the person was responsible for proposing the
alternate paths, while the computer was responsible fo computational
feedback on those solutions. The computer did not take an active role in planning
deviations in this version.
The sketching of routes was carried out by displaying the jet routes and
waypoints and selecting ('clicking' on) each waypoint that the pilot wanted the
airplane to pass through. Such routes were constrained to paths where there was
a jet route connecting the desired waypoints; if there was no jet route connecting
two waypoints, then the pilot was not allowed to propose that route. This placed a
slight restriction on the pilots' planning abilities because they can normally
request vectoring to fly direct routes from one point to another. However, this
approached allowed them to plan general solutions with the understanding that
these solutions were not necessarily the exact routes that would actually be flown.
The aoUte Constmhts and Sketching' System. The 'route constraints and
sketching' system retained all of the capabilities of the 'sketching only' system
and it added another capability: The person could specify higher level constraints
on the type of solution he desired and then ask the computer to find the shortest
distance route which satisfied those constraints. Ifthe computer was unable to
find a route that met the constraints placed on it, it would so noti& the person.
The constraints that could be specified were the maximum allowable turbulence,
the maximum allowable precipitation, and the destination. (It is easy to see how
this interface design concept could be extended to include other constraints such
as earliest and latest desired arrival times.) This tool places a substantial burden
on the computer to work out the details of the alternative flight plan.
on a desired solution is a very different "problem
,1987) than tbe one faced by the person spa using the 'sketching only' version of the system. In the 'sketching only' version,
37

the person’s explanation is grounded in the representation of the physical space
(e.g., the waypoints and jet routes) and the relationships of the objects within that
space (e.g., aircraft position, storm position, wind velocities at various locations
and altitudes, etc.). We hypothesized that the ‘route constraints’ version would
allow the person to abstractly control the computer’s search of the physical world,
while not being required to search for paths in that space himself.
Both the person and the computer could be actively involved in the planning
process with this system. The person could specify constraints on the solution he
desired from the computer. The computer would then recommend appropriate
alternatives. Furthermore, the person had recourse, through the sketching tool,
to plan specific routes himself. Reasons for the person to carry out such detailed
planning in spite of the availability of the route constraints tool could include a
preference to do the work himself or reservations about a particular solution
suggested by the computer.
T‘he‘AutonratieRoutecoastraints,RoutecOastraint9,andSketching
System. The ‘automatic route constraints, route constraints, and sketching‘
version took the computer’s involvement one step further in that the computer
automatically suggested a deviation (based on default constraints of no
turbulence, no precipitation, and the originally planned destination) as soon as it
detected a problem with the original route. This form of tool is akin to an
autonomous support system that automatically suggests solutions to detected
problems.
This system also had the ‘route constraints’ tool of the previous system and
the ‘sketching‘ tool of the previous two systems. Thus, the person could also use
these tools to explore solutions.
Underlying all three system designs is the provision of support to ask ‘what
if questions. That is, they encourage the operator to ask ‘what if I do this?’ (e.g.,
38

‘what type of solution does the computer suggest if I use constraints of light
turbulence and moderate precipitation?’, or ‘What happens to my &el remaining
i f1 deviate north instead of south?’). We were interested in whether people used
the tools available to them, how the available tools affected the cognitive processes
of the person using the system, and how the available tools affected-the solutions
that person chose.
=hi- Thirty male commercial airline pilots volunteered to help evaluate the three
systems. These pilots came from the flying community at large. Each pilot was
paid for the three hours that it took to participate; approximately half of that time
was spent training the pilot on the system he would be using. Each pilot was
randomly assigned to one of the system design conditions, either the ‘sketching
only’ condition, the ‘route constraints and sketching‘ condition, or the ‘automatic
route constraints, route constraints, and sketching‘ condition. The pilots came
from 8 major airlines, with an average of 9,300 hours of flying experience -
experience as commercial pilots (range: 1200 - 28000 hours) and 1800 hours of
experience in military aircraft (range: 0 - 5000 hours). In the results presented
below, there were no apparent relationships between the pilots’ performances and
their levels or types of flying experience, nor with their levels of previous
computer experience.
CZWS
Following training on the use of the system, each of the subjects was
presented four enroute flight planning cases in which he was given some
preliminary Sonnation about the flight (e.g., origin, destination, time of day,
etc.) and was then told to “decide what the plane should do”. All of the subjects
went through the same four cases in the same order. Whereas the subjects in the
‘sketching only’ and ‘route constraints and sketching‘ conditions started each
39
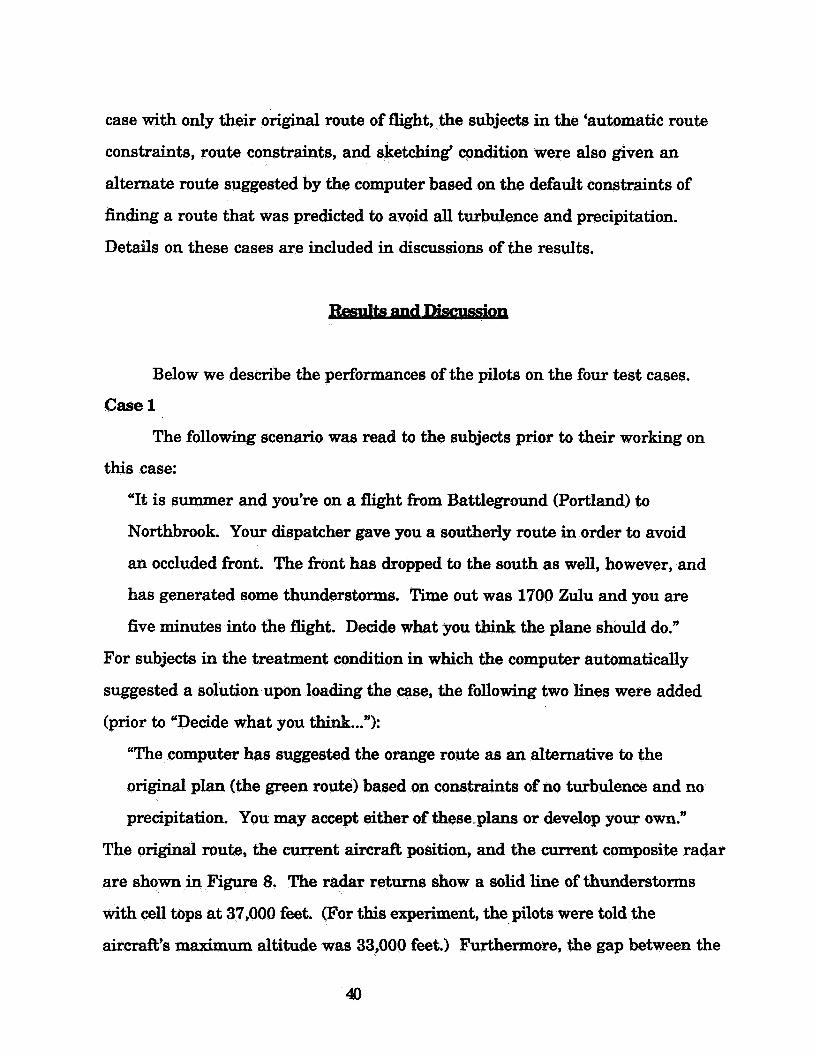
case with only their original route of flight, the subjects in the ‘automatic route
constraints, route constraints, and sketching‘ condition were also given an
alternate route suggested by the computer based on the default constraints of
finding a route that was predicted to avoid all turbulence and precipitation.
Details on these cases are included in discussions of the results.
Below we describe the performances of the pilots on the four test cases.
Case 1
The following scenario was read to the subjects prior to their working on
this case:
“It is summer and you’re on a flight from Battleground (Portland) to
Northbrook. Your dispatcher gave you a southerly route in order to avoid
an occluded front. The front has dropped to the south as well, however, and
has generated some thunderstorms. Time out was 1700 Zulu and you are
five minutes into the flight. Decide what you think the plane should do.”
For subjects in the treatment condition in which the computer automatically
suggested a solution upon loading the case, the following two lines were added
(prior to “Decide what you think...”):
“The computer has suggested the orange route as an alternative to the
original plan (the green route) based on constraints of no turbulence and no
precipitation. You may accept either of these plans or develop your own.”
The original route, the current aircraft position, and the current composite radar
are shown in Figure 8. The radar returns show a d i d line of thunderstorms
with cell tops at 37,000 feet. (For this experiment, the pilots were told the
aircraft’s maximum altitude was 33,000 feet.) Furthermore, the gap between the
40

two cells was forecast to close. Therefore, a deviation was obviously required. The
forecast storm movement was to the east, but was very
Insert Figure 8 about here
To provide a concrete sense of the performances of the subjects, the behaviors of 3
representative pilots are first summarized below. Then s u m m a r y statistics are
provided for the entire group.
Subject S1: 'Sketching Only' Version. Subject S1 looked at the composite
radar and fi-onts (current and forecast) and concluded "Going to have to go north
or south around it". This pilot then sketched a northern deviation and compared .
it with the original route, noting that the deviation saved time and he1 and
avoided the turbulence. He then sketched a southern deviation. While sketching
the deviation, he inferred that "it could move a little W h e r south [than
forecast]", so he adjusted the southern alternative for that contingency. When the
route was completed he looked at the computer's estimates for time and fuel
consumption and stated: "That onek quite a bit longer." He concluded "We
could go that way if we had to." The pilot decided, however, to take the northern
route.
Subject c3. 'Route Constraints and Sketching' Version. Subject C3 looked
at the composite radar and concluded "I can see right now that what I want to do
is come to the no rth..." ARer also looking at the clouds, he decided: "There's a
line [of thunderstorms] so I definitely don't want to get anywhere near that ..." After observing that "it looks like a shorter route here [north], anyhow" and
looking at the winds, he decided to let the computer find a deviation based on
constraints of light turbulence and light precipitation. The subject looked at the
41
resultant northern deviation suggested by the computer and stated:- "That looks
like about what I would have in minil." After checking the data displayed on the
national map to make sure that the northern deviation had "no problems with
turbulence or precipitation", he compared it with the original route and noted
that: "The total distance is actually a little less. Fuel lea is more, and we'll
actually cut time off our flight with this route." He then decided to fly the
computer recommended northern deviation.
SubjectA9: 'AutomaticRoute Constraints, Route Constraints and
Sketching Version'. The computer automatically displayed a recommendation
around the north of the storm to this pilot. He began his evaluation by comparing
the estimated time and fuel consumption for this suggested route (to the north of
the storm) with the performance parameters for the original route. He looked at
the composite radar and noted that: "[The] original route goes right through an
area of. ..heavy precipitation. A lot of echoes. Alternate route goes above [north ofl
it." Next, this pilot looked at the winds and decided: "The winds are more
favorable with the southerly [original] route, but obviously the weather's not that
great." After "looking at the comfort level of the passengers", this subject
concluded: "The alternate route certainly looks better to me and I would stick
with that." He then looked again at the destination parameters for the two routes
and summarized their differences as follows: "It's [the deviation] a little bit
quicker and we aren't going to have any turbulence. We're going to get there a
little sooner. The distance is less. The alternate route looks good to me." Finally,
he said "I'd go with the [computer's suggested] route. I really can't see any
better way I could plan it right now ''
Comparison of Sample Subjec. b. F'igure 9 shows the routes explored in
detail by these sample subjects. The subject in the 'sketching only' version of FPT (Sl) explored the far northern route and the southern route, and elected to take the
42


computer's suggested northern deviation. Only two of
'sketching only' version selected thatroute. Six of the ten subje the
'sketching only' version selected a more conservative northern deviation. (Based
on a Chi-square test, these differences are significant at ac.004.)
ten subjects in the
Differences in Exploration. As shown in Table 5, subjects using the
'sketching only' version explored multiple classes of solutions in detail more often
than did the subjects in the other two conditions. (In this case, exploring a
solution north of the storm was defined as one class of solution, while exploring a
solution south of the storm was a second.) This difTerence was significant at
ac.01.
-
Insert Table 5 about here
Table 6 shows data regarding another measure of the amount of exploration.
This table shows the number of subjects who explored multiple specific solutions
in detail (as contrasted with multiple classes of solutions as summarized in Table
5). Again, the subjects in the 'sketching only' version showed eviderice of more
exploration (a<.014).
................................ Insert Table 6 about here
Differences in Info h. The information which the subjects
on. The nkmber of
subjects in each condition who looked at current or forecast fronts, current or
44

forecast radar weather (composite or at altitude), current or
altitude, and jet routes is presented in Table 7.
cast winds at
................................. Insert Table 7 about here
As can be seen from this table, there are no clear differences between
groups in information searched, with the exception that more of the 'sketching
only' and 'route constraints and sketching' subjects looked at the jet routes than
the 'automatic route constraints, route constraints, and sketching' subjects. This latter fact suggests the possibility that half of the 'automatic route constraints'
subjects evaluated the suggested route at a fairly abstract level (this one difference
is significant at a<.013.)
Case 1 - Discussion. Prior to the experiment, we made two predictions that
are relevant to these results. Specifically, we predicted that, in general, the pilots
using the 'automatic' version might be:
1. Less likely than the 'sketching only' subjects to explore as many
alternatives in detail;
Less likely than the 'sketching only' subjects to consider the
uncertainty associated with wea casts, consequently
2.
accepting the computer's recommendation without adequate
evaluation.
The results for Case 1 are
and 6, for example, indicate
alternatives. Furthermore, the concurrent verbal reports indicate that the
sistent with these general predictions. Tables 5
the. 'sketching only' subjects explored more
'sketching only' subjects who deviated further north (see
considt ring the uncertainty associated with the forecast, ma
) were indeed
statements like:
"If the system moved W h e r north and the thunderstorms
started to pop up... Let's take a look at how much M h e r north
we could go."
One way to explain these effects is to say that the pilots in the 'automatic'
conditions were 'overreliant' or 'overtrusting' of the system. These are rather
shallow labels, however, and don't really provide much insight into the influence
of the system's design on the user's cognitive processes.
A more detailed analysis suggests that the effect of automatically
suggesting a route is on two stages (generating options and evaluating options) in
the planning process as modeled in Figure 10.
............................... Insert Figure 10 about here
The clearest example of this effect occurred at the point where the subjects
had to decide whether to stay north of the storm, from DPR to RWF, or to begin
turning south toward the destination, from DPR to FSD. (See Figure 11). It
appears that, because the system design induced the 'sketching only' subjects to
view the display shown in this figure if they wanted to complete a reasonable
northern deviation:
1. The subjects observed that the route from DPR to FSD cut close to the
forecast storm activity;
This observation influenced them to consider the possibility that the 2.
forecast might be wrong and that the storm might move further
north or east than predicted;

onsequently chose the more con
the behaviors of all but two of
constraints function conditions, who viewed the
solution at the national map level (often without even displaying the jet routes)
and simply concluded that it looked okay without closely focusing on the choices at
DPR. For example, while looking at the national map, Subject C4 stated
"See if I can get the computer to find a route. (He used the route
constraints hc t ion with the constraints of no turbulence and no
precipitation and the computer suggested a northerly route.) With a
northerly deviation, I can get by with the constraints I placed on it. Now I
want to check and make sure... (He observed the destination parameters
for estimated time and fuel consumption.) That gives me, actually, a
shorter flight plan and plenty of fuel at arrival. So I would go ahead and
select that route at that point."
Insert Figure 11 about here
Unlike the 'sketching only' subject described earlier, there is
considered the uncertainty associated with the storm or that he considered a more
conservative northerly deviation. In short, rather than "explaining" the effects of
dence that he
splay of suggestions as "overreliance," it is more informative to
47


Initial Evaluation of System Designs. In Case 1, we can't really criticize
either the computer's suggested route or either of the more conservative northerly
routes selected by the pilots in the 'sketching only' version. AU of them are quite
reasonable. We might, however, speculate that, in other circumstances, the
cognitive processes induced by the 'sketching only' version (if these cognitive
processes persist in other scenarios) could lead to more exploration and deeper
consideration of the implications of uncertainty in the forecast, leading to the
selection of a superior route. (Data relevant to this hypothesis will be presented in
Case 3.)
If this behavior persists in other scenarios, it might be construed as an
advantage in the design of the 'sketching only' system. There was also evidence of
behaviors in Case 1, however, where the 'sketching only' version put some of the
subjects at a disadvantage. In particular, two of the 'sketching only' subjects
selected a plan that deviated from the original plan at DBS, a second possible
deviation point, rather than MYL, the earliest possible deviation point. This
second deviation point is less preferable in terms of he1 consumption.
In abstract terns, then, we again see important effects inductid by the
system designs. The subjects in the 'route constraints and sketching' and the
'automatic route constraints' conditions let the computer pick a he1 efficient point
for deviation from the original plan. Because of the large solution space, however,
the 'sketcbing only' subjects were faced with a reasonably difEcult task in
iden- the best deviation point.
Caw 1 Discussion - Ouervkzu. Case 1 provides clear evidence that the
design of the system has strong effects on pilots' performances. More
importantly, it provides insights into the ways in which design features interact
with the characteristics of this task (scenario) to influence the user's cognitive
processes.

The data from Case 1 indicate that, in some ways, the use of the computer
to produce suggested plans degrades the process of evaluating plans on the part of
the pilots, while in other ways, (Le., finding fuel efficient solutions to avoid the bad
weather) it enhances performance. The following cases provide M h e r data to
assess this apparent tradeoff between these different design concepts.
C-2
Case 2 was designed so that there were two initially plausible directions for
deviating (north or south of a storm). The scenario consisted of the following:
"It's summer and you are eight minutes into a flight from Oakland to
Joliet. You got off the ground at 1600 Zulu. You notice that there is a solid
line of convective thunderstorms directly in your path. Decide what you
think the plane should do."
For subjects in the treatment condition in which the computer automatically
suggested a solution upon loading the case, the following two lines were added
(prior to "Decide what you think..."):
"The computer has suggested the orange route as an alternative to the
original plan (the green route) based on constraints of no turbulence and no
precipitation. You may accept either of these plans to develop another
alternative on your own."
F'igures 12 and 13 show the weather for this case.
............................... Insert Figures 12 and 13 about here
Subject s6: 'Sketching Only' Version. It was hypothesized, prior to the
experiment, that many of the subjects using the 'sketching only' version would

explore and select a southern deviation, since the southern thunderstorm cell
appears to be smaller than the northern cell. Because the southern cell is smaller
than the northern cell, it seemed possible that some pilots would judge the
southern deviation to require less distance be traversed. In order to completely
avoid the predicted thunderstorms and turbulence, however, the deviations to the
north and the south were nearly equidistant. Because of tail winds to the north,
and head winds to the south, a northern deviation was clearly preferable in terms
of fuel consumption and time of arrival.
After looking at the current and forecast fronts and composite radar (see
Figures 12 and 13), this subject sketched a southern deviation, compared it with
the original route, and checked it for turbulence. This route is depicted in Figures
12 and 13. Afhr determining that the route did not have any predicted turbulence,
he decided to fly it. This is the only solution he sketched.
Subject C3: 'Route Constraints and Sketching' Version. Subject C3 looked
at the current and forecast composite radar and concluded that he could deviate
either to the north or the south. He decided to let the computer find a deviation
based on constraints of light turbulence and light precipitation. The computer
suggested the northern deviation shown in Figures 12 and 13, and the subject
checked it for turbulence. After finding no turbulence along the deviation, he
checked it for clearance from the thunderstorms. The subject determined that the
distance between the route and the thunderstorms was adequate. He then decided
to fly the computer-suggested northern route, but stated that he would keep an eye
on the thunderstorms.
SubjectA9: 'Automatic RouteConstrainis, Route Constrain& and
Sketching' Version. This subject first looked at the composite radar for the
current weather map. He compared the time and he1 consumption for the two
routes (the original route and the automatically suggested northern route) and

noted their differences. Finally, he gathered some more weather information,
including winds, and decided to accept the computer-suggested northern route.
Case 2 - Summary Statistics W e nearly all of the 'route constraints' and
'automatic' subjects decided to deviate north of the original route, a significant
proportion of the 'sketching only' subjects deviated to the south, as shown in Table
8. Based on a Chi-square test, this difference was signiscant at m.044.
............................... Insert Table 8 about here
Nevertheless, as shown in Tables 9 and 10, the 'sketching only' subjects were not
the only ones to explore both northern and southern deviations in detail. As in
Case 1, however, more of the 'sketching only' subjects explored alternative routes
in detail. For Case 2, though, these differences are not statistically significant
(a <.366).
.............................. Insert Tables 9 and 10 about here
As in Case 1, the information which the subjects looked at was also
analyzed on the basis of treatment condition. The number of subjects in each
condition who looked at current or forecast fkonts, current or forecast radar
weather (composite or altitude), current or forecaet winds at altitude, and jet
routes is presented in Table 11.
............................... Insert Table 11 about here
52

Case 2 - Discussion. As stated earlier, one of our hypotheses was that,
because of the large number of possible solutions to explore, subjects in the
'sketching only' version would be less likely to find the most efficient route in
terms of fuel consumption that avoided the bad weather. This effect was clearly
shown in Case 2, where 40% of the 'sketching only' subjects selected a southern
deviation. The various southern deviations selected used about 3% more fuel and
took about 8 minutes longer.
This difficulty in identeng the most fuel efficient deviation was in part
due to a failure to access all of the data in evaluating solutions. Three of the
subjects in the 'sketching only' version failed to look at the map display for winds,
and consequently did not realize the southern deviation had significant
headwinds.
Thus, because of the large "solution space" and the large "data space," -
subjects in the 'sketching only' version had more difficulty in generating the best
route and in evaluating the less satisfactory southern route. In terms of the
amount of exploration, the trend again indicated more exploration by the
'sketching only' subjects. It is important to note, however, that:
1. Requiring the human planner to sketch his own solution does not
ensure that he will explore more alternatives in detail or look at all of
the relevant data to evaluate an alternative;
Just because the computer suggests a solution doesn't mean that the
human planner won't explore other alternatives on his own.
2.
Indeed, combined with the results from Case 1, the data strongly suggest that the
effects of the system design on exploration are very dependent on the
53
characteristics of the scenario. This result is shown even more strongly in the
next case, where the ‘sketching onlyp subjects actually explored fewer paths.
case3
Case 3 was designed to present the pilots with a diflicult planning problem
and to put thevarious system designs to a demanding test. Unlike the previous
cases, the thunderstorms in Case 3 were not localized and their tops were not all
at the same altitude. Like Case 2, there were two likely directions for deviating;
but neither was without potential problems. In particular, a deviation that
avoided storms at the beginning of the route had to pass through more severe
storms later. Finally, flight safety was a bigger concern on this case than the
previous cases.
-
Description of the Case. The following scenario was read to the subjects
prior to their working on the cage:
“It’s summer and you’re on a flight from Cheyenne to San Antonio. You
got off the ground at 1900 Zulu arid are now two minutes into the flight.
Decide what you think the plane should do.”
For subjects in the treatment condition in which the computer automatically
suggested a solution upon loading the case, the following two lines were added
(prior to “Decide what you think...”):
“The computer has suggested the orange route as an alternative to the
original plan (the green route) based on constraints of no turbulence and no
precipitation. You may accept either of these plans or develop your own.”
The original route, the current aircraft position, and the current composite
radar are shown i~ Figure 14. The current radar shows a number of
thunderstorm cells with tops ranging from 28,000 to 43,000 feet, but the aircraft’s
maximum altitude was 33,000 feet. One of the cells directly on the flight path had
54
a top of 43,000 feet. The forecast radar showed that the cells were predicted to
move north and slightly east, as well as join. The winds were light and variable.
In summary, Case 3 presented subjects with a rather complex planning
problem. The weather was dispersed over a large area and was changing
somewhat unpredictably. This scenario required that the pilots anticipate various
possible outcomes and plan accordingly.
............................ Insert Figure 14 about here
The routes suggested by the computer in the ‘route constraints and sketching‘
and ‘automatic route constraints, route constraints, and sketching’ conditions
are shown in Figure 15. There were two routes suggested by the computer,
depending upon the constraints placed on it. Constraints of no turbulence and no
precipitation caused the computer to suggest the eastern route (hereafter referred
to as the ‘eastern’ route). Constraints that allowed light turbulence and
precipitation caused the computer to suggest the western route (hereafter referred
to as the ‘western’ route). In the ‘automatic route constraints, route constraints,
and sketching‘ treatment condition, the computer automatically suggested the
eastern route to the subjects. These subjects had to modify the constraints on the
computer or sketch their own route in order to come up with a western route.
Insert Figure 15 about here
The eastern route passed between two large, severe thunderstorm cells.
Summer thunderstorms in Texas are notorious for their volatility and it was very

possible that the two cells on either side of the eastern route would grow and build
together. Furthermore, the eastern route passes extremely close to a forecast
intense cell location.
It was hypothesized, prior to the experiment, that many of the subjects
would have difficulty searching the space of possible solutions and that some of
the subjects in the 'automatic route constraints' treatment condition would select
the eastern deviation, since it was the one initially recommended by the computer,
in spite of the fact that it is a very questionable choice in both relative and absolute
terns. (This case was deliberately selected because the automatic suggestion
provided by the computer was poor - poor because the computer treated the
forecasts as reality, rather than reasoning about the uncertainty associated with
the forecasts. The weather pattern is, however, realistic. Indeed it is based on
real weather data provided by the National Center for Atmospheric Research.)
Subject SI: 'Sketching Only' Version. This subject first indicated that he
would have preferred waiting for the weather to clear. Since the plane was
already enroute, however, he considered trying to fly above the weather. He
rejected that possibility upon seeing the cell tops rising up to 43,000 feet. The
subject then spent some time assessing the weather before coming up with two
options for dealing with it. He decided to first try going all the way around the
back side of the weather (a far western deviation), but decided against that option.
Deciding to try a western deviation, Subject S1 first tried to deviate from TBE to
TCC in order to avoid the cells that lay on the jet route from PUB to TCC.
Realizing that wasn't possible, the subject tried to avoid the worst of the forecast
cells by deviating &om PUB to LVS and then back to TCC. After completing the
deviation to SAT, the subject compared it to the original route and determined that
there wasn't much fuel remaining.
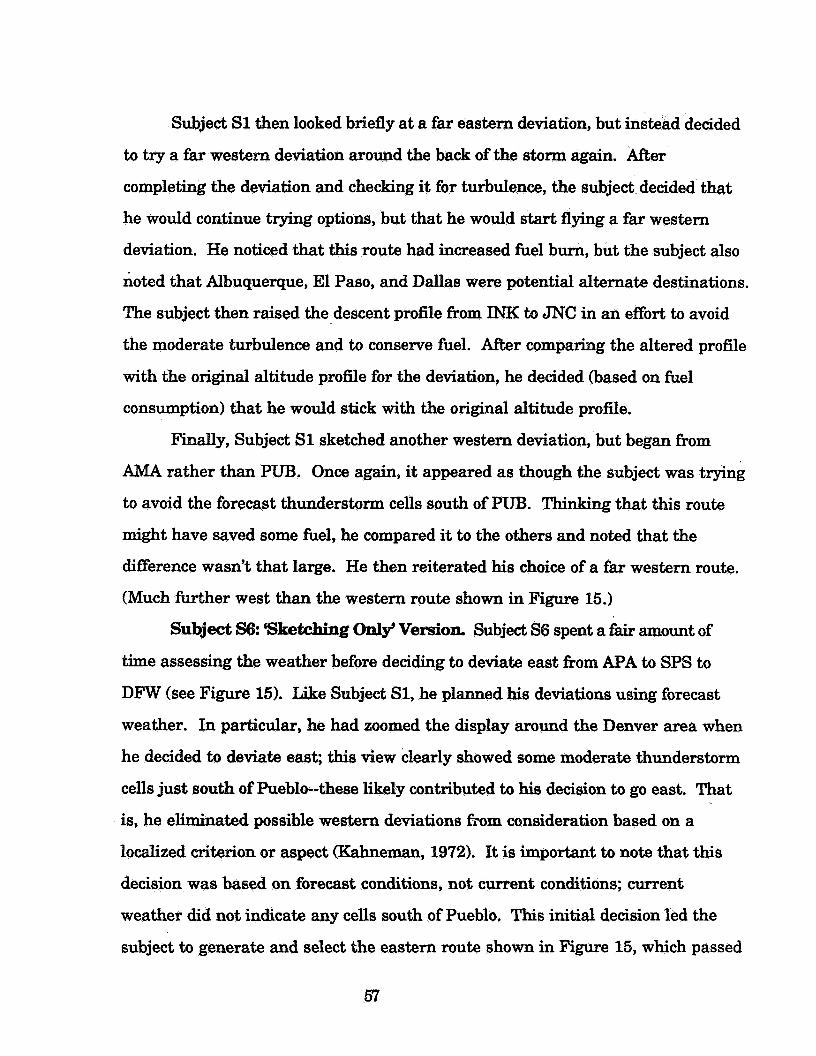
Subject S1 then looked briefly at a far eastern deviation, but instead decided
to try a far western deviation around the back of the storm again. After
completing the deviation and checking it for turbulence, the subject decided that
he would continue trying options, but that he would start flying a far western
deviation. He noticed that this route had increased fuel burn, but the subject also
noted that Albuquerque, El Paso, and Dallas were potential alternate destinations.
The subject then raised the descent profile &om INK: to JNC in an effort to avoid
the moderate turbulence and to conserve fuel. After comparing the altered profile
with the original altitude profile for the deviation, he decided (based on fuel
consumption) that he would stick with the original altitude profile.
Finally, Subject S1 sketched another western deviation, but began from
AMA rather than PUB. Once again, it appeared as though the subject was trying
to avoid the forecast thunderstorm cells south of PUB. Thinking that this route
might have saved some fuel, he compared it to the others and noted that the
difference wasn't that large. He then reiterated his choice of a far western route.
(Much further west than the western route shown in Figure 15.)
Subject s6: Sketching only' Version. Subject S6 spent a fkir amount of
time assessing the weather before deciding to deviate east fkom APA to SPS to
DFVV (see Figure 15). Like Subject S1, he planned his deviations using forecast
weather. In particular, he had zoomed the display around the Denver area when
he decided to deviate east; this view clearly showed some moderate thunderstorm
cells just south of Pueblo--these likely contributed to his decision to go east. That
is, he eliminated possible western deviations fkom consideration based on a
localized criterion or aspect (Kahneman, 1972). It is important to note that this
decision was based on forecast conditions, not current conditions; current
weather did not indicate any cells south of Pueblo. This initial decision led the
subject to generate and select the eastern route shown in Figure 15, which passed
m

between two close, severe thunderstorms near SPS. He did not go back and
reconsider his choice of deviation directions to find a more suitable option.
Rather, he announced his intention to fly the eastern deviation. In the debrief, the
subject indicated that the western deviation was clearly preferable (in spite of his
choice of the eastern deviation when actually generating his own plan). -
Subject c3: ltoute Constraints andSketching' Codtion. Subject C3 first - considered staying on the original route and picking his way between the
thunderstorm cells. The subject made a brief inspection of the weather and then
decided to see what the computer suggested. He selected constraints of light
turbulence and light precipitation and the computer suggested the western
deviation. ARer comparing the new route to the original one, the subject
determined that the route didn't add much time and noted that the original route
would have pawed right through the thunderstorms. He decided to take the
western route suggested by the computer.
Sulject CS: %uta Constraints audSketching'condition, SubjectC8 briefly
looked at weather information before using the route constraints function with no
turbulence and no precipitation. The computer suggested an eastern deviation
based on those constraints. Af'ter checking the route for turbulence and then
examining the weather some more, the subject decided to sketch a western
deviation beginning with a leg fkom PUB to TCC. The subject completed the
western deviation (shown in Figure 15) and checked it for turbulence. He then
raised the altitude of the leg from INK to JCT to avoid the moderate- turbulence
there. Next, the subject tried to find out what was causing the turbulence in the
first place. Subject C8 looked at the destination parameters and indicated that he
preferred the western route. He then examined the eastern deviation for
turbulence and returned to looking at the weather.

The subject next modified the western deviation so that it went from PUB to
LVS before returning to TCC. At thii point he spent considerable time examining
the two deviations he had sketched and the weather trends. He finally decided to
fly the western deviation that he had sketched first, with the provision that it
might have to-be modified later depending on how the weather actually developed.
Subject A& 'Automatic Route Constraints, Route Constraints, and - - Sketching' Condition. Subject A9 started out by comparing the suggested eastern
deviation with the original route (before even looking at weather information).
After noting the differences between the routes in terms of destination parameters
and turbulence, the subject began comparing the routes on the basis of weather.
He then sketched a western deviation beginning at AMA and going to ROW. He
checked the turbulence forecast for this western route and rejected it because it
passed through an area where moderate turbulence was predicted up to 29,000
feet for the last third of the flight. He subsequently decided to take the eastern
deviation recommended by the computer. In the debriefing, he indicated that he
would actually prefer the western deviation over the plan he had selected.
-
Case 3 - Summary Statistics. As with the previous two cases, the three
treatment conditions were analyzed for differences in final route choices, number
of subjects who explored multiple classes of solutions in detail, number of subjects
who explored multiple routes in detail, and information viewed.
Differences in Final Routes. Table 12 contrasts subjects in terms of
whether they selected the computer-suggested eastern route. In addition, as in
Case 2, the routes chosen by the 'sketching only' subjects were much more varied
than the ones chosen by the subjects in the other two treatment conditions.
.................................. Insert Table 12 about here
Differences in Detailed Exploration. Case 3 stands in contrast to the
previous two cases, in that the 'sketching only subjects did not explore multiple
classes of solutions in detail more often than did the subjects in the other two
groups. Instead, it was the 'automatic route constraints, route constraints, and
sketching' group who explored multiple classes of solutions in detail more often
than did the subjects in the other two groups (a<.022). The number of subjects
who explored multiple classes of solutions in detail in each system design
condition is summarized in Table 13.
Insert Table 13 about here
Differences in Information Search. As in the two previous cases, the
information which the subjects looked at was analyzed on the basis of treatment
condition. The number of subjects in each condition who looked at current or
forecast fronts, current or forecast radar weather (composite or at altitude),
current or forecast winds at altitude, and jet routes is presented in Table 14.
Insert Table 14 about here
There are no clear, statistically sisnificant differences between groups in
information searched. The trend, however, seems to be that the 'route constraints
and sketching' subjects looked at less idormation than the 'sketching only' and
'automatic route' constraints, route constraints, and sketching' subjects.

Case 3 - Discussion. Once again, the data indicate that the system design
strongly influences the exploration and plan selection processes of the subjects.
Search Dificulties. Some of the same challenges in searching the space of
possible solutions that occurred in Case 2 recurred in Case 3 for subjects in the
'sketching only' condition. For example, Subject S10 made six attempts at
sketching routes (some were completed, some were aborted) before sketching the
route that he finally chose. Similarly, Subject S7 made six attempts at sketching
routes before choosing one of them. This difficulty experienced by the 'sketching
only' subjects in generating effective plans was strikingly illustrated by one pilot
who developed and chose a deviation all the way east around the entire storm,
using up 24% more he1 than the more reasonable western deviation.
Poor Search Strategies. Subject S6, described in detail earlier, illustrated a
fascinating example of how particular strategies can lead to very poor solutions.
His strategy can be characterized as an elimination by aspects approach
(Kahneman, 19721, where the aspects are local decisions about which waypoint to
go to next.
In particular, he began by saying: Where should I go next, from PUB to
TCC or from PUB to AMA? He selected AMA because it was krther away from
the stonn west of TCC. He then considered: Should I go from AMA to SPS or to
AB1 or to TCC? (See Figure 16.) He selected SPS. Because of these localized
decisions, he neuer euen considered whether this eastern deviation was to be
preferred globally to the western route.
Similarly, several subjects in the automatic version exhibited ineffective
strategies. Specifically, they first noted the computer's automatic suggestion of
the eastern deviation (see Figure 16). They subsequently generated the western
deviation (either by sketching it or by changing the constraints and having the
computer generate it). They then viewed the display of predicted turbulence and
rejected the western deviation based on the presence of moderate turbulence at
some altitudes in the last third of the flight. They di
alternatives, so they accepted the computer's initially s
eastern route.
T w o underlying processes appear to be contributing to this poor
performance, First, these subjects are using a single aspect or criterion to reject
a plan, rather than evaluating the plan globally on an absolute basis or in
comparison to alternatives. Second, they appeared to accept the computer's initial
suggestion by default aRer they rejected the western deviation. In particular, like
the pilots in the automatic version in Case 1, they did not show evidence of
considering the uncertainty associated with the weather around the eastern
deviation.
Disorientation. A final interesting behavior was the failure of some pilots to
view the appropriate data when evaluating an alternative. These pilots were
looking at the forecast weather while making decisions about the initial segment
of the flight. They should have looked at the original weather display to guide
decisions concerning that early in the flight. (They appeared to be unaware of
which weather display - forecast as current weather - they were looking at.)
Summary. In short, a number of subjects in all three conditions exhibited
poor performance in Case 3. Although more subjects appeared to be biased
toward a poor solution when it was suggested by the computer:
1. This bias cannot be explained as simply due to "overreliance." These
subjects showed clear evidence of generating and evaluating
alternatives. Thus, much deeper explanations had to be developed to
account for their the computer's poor stion;
e d by making them sketch their
s resulted in the selection of fewer poor plans.
Q
Nevertheless, because of the use of an elimination by aspects strategy
by one subject, he generated and selected the poor eastern deviation
all by himself (without any suggestions from the computer).
case4
Case 4 presented subjects with a situation in which the shortest and most
fuel-efficient deviation, north, required the pilots to violate one of their standard
heuristics (fly upwind of thunderstorms). The storm in this case could also be
topped, although that would have put the plane in turbulence above the storm.
Furthermore, there was some risk of the storm growing quickly. As in the
previous two cases, there were two likely directions for deviating; in this case
those directions were north and south of the storm.
The following scenario was read to the subjects prior to their working on
the case:
“You are on a flight from Albuquerque to New Orleans. You got off the
ground at 1400 Zulu. You are now 19 minutes into the flight and have
noticed a thunderstorm cell outside of Dallas. Decide what you think the
plane should do.”
For subjects in the treatment condition in which the computer automatically
suggested a solution upon loading the case, the following two lines were added
(prior to “Decide what you think...”):
“The computer has suggested the orange route as an alternative to the
original plan (the green route) based on constraints of no turbulence and no
precipitation. You may accept either of these plans or develop your own.”
The original route, the current aircrafk position, and the current composite
radar are shown in Figure 17 along with the likely deviations north and south of
the storm. The forecast weather showed the storm moving slowly to the
northeast.

............................. Insert Figure 17 about here
Subject S1, Sketching only' Condition. Subject S1 began by looking at
weather information and may have been considering flying over the top of the
weather; he wondered aloud how high the cell went and noted that it went up to
28,000 feet and that the plane was planned to fly at 33,000 feet. Upon noticing
moderate turbulence, however, the subject decided to try a southern route. After
sketching a southern deviation, he checked it for turbulence and compared it to
the original route. The subject then reviewed the weather and the original route
and sketched a route to the north. M e r checking the route for turbulence, he
decided that either route would work. Since the storm was isolated, he decided to
take the route which consumed the least fiel, which was the northern route (even
though the storm was moving north, as he noted).
Subject CS, aoufe Constraints and Sketching' Condition. Subject C8
started by checking the weather and then decided to use the route constraints
function to find a new route based on constraints of no turbulence and no
precipitation. The computer suggested a northern deviation which the subject
checked for turbulence and compared with the original route. Subject C8 then
decided to sketch a southern deviation to see if it was any better or shorter. In
comparing the northern and southern routes, he noted the tradeoff between the
two: the northern route took less time, but the storm was slowly moving in that
direction. He rechecked the weather and the turbulence on the southern route
and stated that it didn't matter which one he chose. He was continuing to look at
the weather and the southern route when he noticed the possibility of flying above
64
the weather. This prompted him to relax his constraints to light turbulence and
light precipitation and try the route constraints fimction again. The computer
again suggested the northern route. The subject then went through a process of
reasoning about the uncertainty of the forecast , the position of the aircraft relative
to the weather, and the costs of avoiding all of the uncertainty. This resulted in
him choosing the southern deviation so that he would be assured of avoiding the
weather.
Sueect A7,6AuAutomaatc Route Constraints, Route Constrain& and
Sketching' Condition. Subject A7 first compared the destination parameters of
the original route and the computer-suggested northern deviation. He then
checked the deviation for turbulence and continued investigating the weather.
Subject A7 decided to try a southern deviation and compared the destination
parameters of that route to those of the other routes. After gathering more
weather information, this pilot diverted to the south.
Case 4 - Summary Statistics. Below, data for the entire 30 subjects are
presented.
Differences in Final Routes. For the most part, there were three reasonably
likely route alternatives in Case 4: North of the original route, south of the
original route, and the original route (at a higher altitude). Subjects were
grouped on the basis of choosing a route similar to the computer-suggested
northern deviation, a southern deviation, or the original route. This analysis is
Table 15. In terms of fuel consumption and time of amval, the
northern deviation is slightly better than the southern one: A southern deviation
consumes 368 lbs. more fuel (about 2% of the fuel consumed by the northern
On the other hand, isolated
called 'super cells' because of their
ects felt the tradeoff in time and
he1 was worth t h ~ d security of a rn
Insert Table 15 about here
Differences in Detailed Exploration. The number of subjects who explored
multiple classes of solutions in each system design condition is summarized in
Table 16. Case 4 is like Case 3, in that the 'sketching onlf subjects show a trend
to not explore multiple classes of solutions in detail as often as subjects in the
other two groups. This trend in this direction is only very marginally significant
(a<. 142).
Insert Table 16 about here
Differences in Information Search. As in previous cases, the information
which the subjects looked at was analyzed on the basis of treatment condition.
The number of subjects in each condition who looked at current or forecast fironts,
current or forecast radar weather (composite or at altitude), current or forecast
is
differences in the groups.
66

Case 4 - Discussion. Unlike the previous cases, the data do not provide
strong evidence that the system design strongly influenced the exploration and
plan selection processes of the subjects, although there is a trend toward the
‘automatic route constraints’ subjects choosing the computer’s suggested route
more often.
Individual Diferences. Although the data again suggest a possible (non-
significant) biasing effect due to the computer’s automatic suggestion, the
primary result of interest is the evidence that pilots differ in their evaluations of
alternatives. Some clearly preferred deviating north to save time and fuel. Others
clearly preferred the more conservative southern deviation to decrease the
likelihood of encountering the storm. (The available data are not informative
regarding the causes of such differences. They could be due to different mental
models of the weather or air traffic, differences in utility functions, etc.)
It is clear that, for the foreseeable future, it will be infeasible to fully
automate tasks like enroute flight planning given the current state of technology.
Feasible methods for adequately dealing with reasoning about such complex,
uncertain events, and for considering the tradeoffs among goals like safety, cost
and passenger comfort, simply do not exist at present.
On the other hand, current and developing technologies seem to offer
interesting opportunities for enhancing flight planning activities. Four areas
seem most promising:
1. Providing access to more complete and accurate information on
weather, air traffic and airport conditions in a timely fashion;
67

2.
3.
4.
Designing better interfaces
such data and information
that allow direct manipulation of routes to explore alternatives;
Using optimization and expert systems technologies to assist users in
generating and evaluating alternative plans and to provide
intelligent alerting functions;
Using the computer to enhance communication and cooperation
among the various people concerned with flight planning
(dispatchers, flight crews, ATC, etc).
Consequently, it is critical to address the question: How can advanced
technologies be applied to develop cooperative planning systems that effectively
support the activities of users?
In spite of the emphasis in this paper on errors induced by FPT, overall the
design features of all three versions supported very successfirl efforts. In Cases 1,
2 and 4, all of the plans selected using all 3 versions of the system were quite
acceptable, although some were less efficient in terms of fuel consumption and
flight time. The overall efficacy of the design of F'PT as a cooperative system was
further supported by the reactions of the pilots, such as:
"I think it's great. It gives you another piece of information to consider.
It's like delegating responsibility,"
"It would be great if you could sit down with your dispatcher and do this
sort of thing before a flight."
68
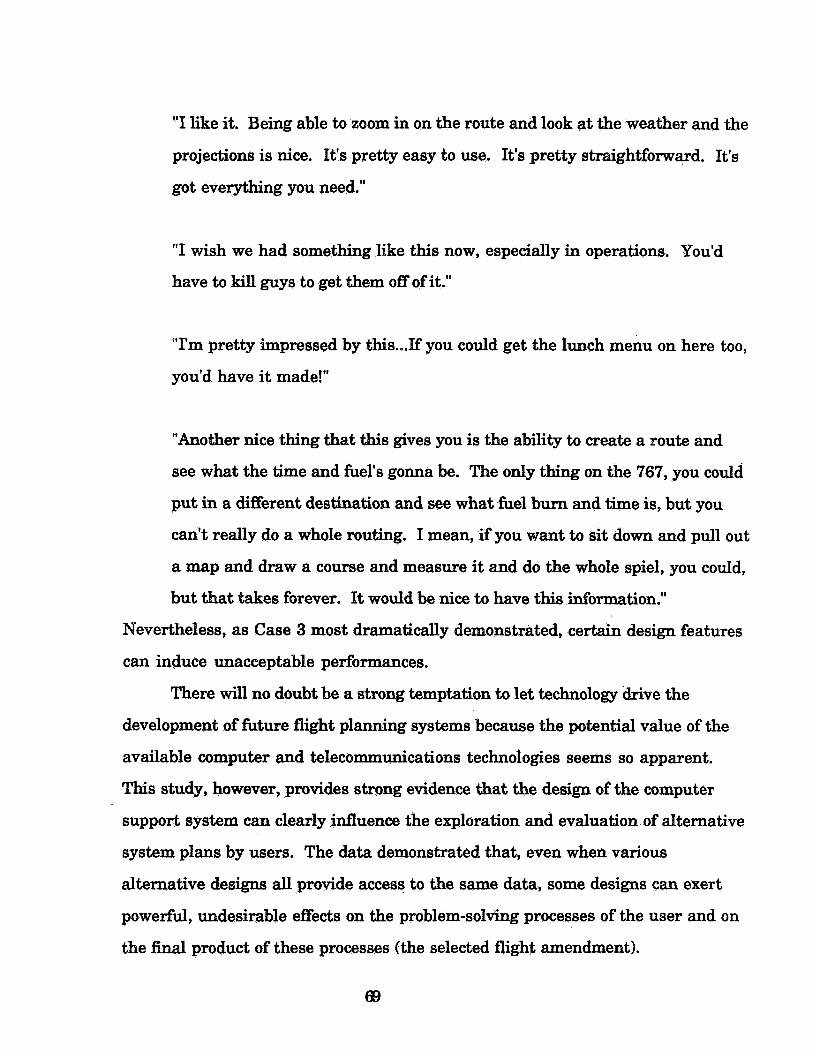
"I like it. Being able to zoom in on the route and look at the weather and the
projections is nice. It's pretty easy to use. It's pretty straightforward. It's
got everything you need.''
"I wish we had something like this now, especially in operations. You'd
have to kill guys to get them off of it."
"I'm pretty impressed by this ...If you could get the lunch menu on here too,
you'd have it made!"
"Another nice thing that this gives you is the ability to create a route and
see what the time and fuel's gonna be. The only thing on the 767, you could
put in a different destination and see what he1 burn and time is, but you
can't really do a whole routing. I mean, if you want to sit down and pull out
a map and draw a course and measure it and do the whole spiel, you could,
but that takes forever. It would be nice to have this information."
Nevertheless, as Case 3 most dramatically demonstrated, certain design features
can induce unacceptable performances.
There will no doubt be a strong temptation to let technology drive the
development of future flight planning systems because the potential value of the
available computer and telecommunications technologies seems so apparent.
This study, however, provides strong evidence that the design of the computer
support system can clearly influence the exploration and evaluation of alternative
system plans by users. The data demonstrated that, even when various
alternative designs all provide access to the same data, some designs can exert
powerfid, undesirable effects on the problem-solving processes of the user and on
the final product of these processes (the selected flight amendment).

Below we summarize the various undesirable effects observed in this study
ss recommendations for system designs and
Large 'Data Space$'
In the near hture, it will be possible to provide flight planners with access
to an incredibly rich set of data relevant to the planning process. As this study
illustrated, however, more is not necessarily better.
Even with the limited sources of data available to users of FFT, we saw
evidence of:
1. Disorientation;
2. Failure to attend to important data.
Such effects are likely to increase as we provide access to even more data displays.
Some pilots, for instance, failed to recognize that they were looking only at
the forecast weather when planning early segments of the flight (where the
current weather displays were clearly relevant). The result for one subject (in the
'sketching only' version) in Case 3 was to completely overlook the best solution,
and to accept a poor flight plan.
In addition to such "disorientation," some pilots also failed to even look at
important data such as the winds. This was a major contributing factor leading
to the selection of the less desirable southern deviation in Case 2 by several
'sketching only' subjects.
Several design principles are suggested by such data:
1. When designing the computer system, select the data to display
judiciously. Providing access to more kinds of data, even though they
may all in principle be useful, does not ensure that they will be used
effectively at the right time;
2. Develop goo sentations to make the implications of important
data and relationships salient to the user. (One interesting example
70

of a problem was discovered with
informaton: A
charts regarding the strength or directio
Consider designing integrated data displays to co
information pertinent to a co
are pertinent. FPT demonstrates the integration of weather data
with displays of alternative flight paths. Displays that integrate data
on precipitation and turbulence at different altitudes would similarly
be useful (but not trivial to design);
Provide clear feedback about the state of the display (such as whether
the displayed data represents current or forecast weather). It is not
enough to present such data on the state of the display. It must be
highly salient;
Consider incorporating intelligent alerting functions to ensure that
critical data (or the implications of these data) are not overlooked.
er of pilots did not
3.
4.
5.
Large”So1ution Space$’
Because of the large number of possible flight paths, the subjects in the
‘sketching only’ version sometimes had difficulty finding a good alternative. In
circumstances where time is critical, such difIidties could also use up valuable
time and attention.
This problem suggests the potential value of tools (based on optimization or
expert system
such tools, the subjects frequently found solutions that used up significantly more
flight time and fuel and were no better in terms of other criteria. One subject, for
instance, selected a plan in Case 3 that used up 24% more fuel.
ologies) to help search for good solutions. Indeed, without
rgument to utilizing such technologies is that they are brittle.
They may be good for routine situations that the designer has anticipated but they

also fail unacceptably in unanticipated situations. Such a line of argument
continues by suggesting that we keepthe person "in the loop" by making him do
more of the work, and by suggesting that, because he must therefore stay
involved, he wil l notice and deal with unusual situations. In short, this
argument suggests that, although people won't always find the best solution, by
keeping them involved we will avoid bad solutions. Clearly, the extreme form of
this argument is a "straw man." People make errors too. Consequently, we must
somehow weigh the tradeoffs between the potential errors made by the designer
(including those for situations that we don't know about, since otherwise the
designer could design for them!) and errors made by users, and to design
assuming both the designers and users are fallible.
- -
-
Case 3 provided a nice illustration of the fact that keeping the person "in the
loop" doesn't ensure that poor solutions wi l l be avoided One of the 'sketching
only' subjects generated and selected the poor eastern route on his own. Thus, a
principle like "avoid excessive automation in order to keep the person involved in
the task" is too simplistic. Keeping the person invohed does not ensure more
exploration, nor does it ensure solutions will be chosen that are at least
satisfactory. Instead, we must consider how specific types of designs will interact
with.users' cognitive processes in specific types of scenarios to produce
undesirable behaviors. (The discussions of results for Cases 1 and 3 provide
illustrations of such cognitive models.) In terms of this application area, what
we need is a design that lets the computer use its power to help search the
solution space, while keeping the person involved and while protecting against
errors the person may make. The first two problems might be addressed by
either:
1. Developings ticated perceptual displays that make alternatives
easier to generate and evaluate. (One possibility would be a display
72

that allowed the user to p
setting constraints (e.g., telling the eo
routes on the map that pass through more than light turbulence);
Using optimization or expert systems technologies to let the computer
generate alternatives (which is what FPT does using the route
constraints tool), but improving the design by having the computer
generate the best alternative(s) for each class of solutions, and then
letting the user evaluate these alternatives. Thus, the computer
might display the 'best" deviations both north and south of a storm
for comparison by the user.
2.
We speculate that both of these potential solutions would keep that person involved
because he would have to look at the data to make choices among alternatives.
A solution to the third problem is more complicated, though, as we need to
first predict the nature of the errors the person might make. This is discussed
further below.
As pointed out above, system users sometimes develop poor plans even
when they are kept "in the loop." (Case 3 illustrated this behavior.) On the other
hand, because of the limitations and brittleness of the technology used in FPT, the
route constraints b c t i o n also produced a poor suggestion in Case 3. ("his
resulted b r n the fact that FPT does not reason about the uncertainty associated
with forecasts.) O w study illustrated that, even though subjects in the automatic
suggestion version used the available "manual" functions to explore alternatives
to the computer's suggestion, 40% still wound up accepting this poor plan.
Two points are worth emphasizing based on this resulk
The
be quite pronounced. S
utomatic suggestions by the computer can
in Cases 1 and 3 who were presented
73
with the computer's suggestion clearly reasoned less (or not at all)
about the uncertai
accept a poor flight plan in Case 3;
These effects cannot be explained by a simple label like
"overreliance." The design of the computer influences users in a
complex, scenario-specific fashion. (The discussions of the results
for Cases 1 and 3 present cognitive models of such effects.) Thus, to
evaluate proposed support tools, scenario-sensitive cognitive models
need to be considered.
associated with the forecast, leading them to
2.
This failure by subjects to reason about uncertainty when viewing the computer's
suggestion might be alleviated by either of the two solutions outlined above. Just
as using the 'sketching only' version induced subjects to look at critical data,
causing them to ask the question "which path is better if the forecast is wrong,"
requiring subjects to choose from among several alternatives suggested by the
computer might induce them to look at the critical data and ask the same
question.
A further form of protection against such failures to consider uncertainty
would be the incorporation of an intelligent alerting Eunction that either:
1. Warned the person when a route might be "too close" to a developing
problem;
Inhibited the display of a suggested route by the computer if it
appeared to be "too close'' to a developing problem (thus making the
computer very conservative in suggesting alternatives).
or 2.
C ;e caution is in order regarding these potential solutions, however. Subjects
may fixate on the alternative solutions suggested by the computer and
consequently fail to note an even be
note that the computer has suggested a poor solutio
on that the computer missed or fail to
74

lMaladaptivestrategiw
The literature on human problem-so s numerous examples of
how, in order to reduce the complexity of a decision, people apply simplifying
heuristics (Elstein, Shulman and Sprafka, 1978). One such strategy is to
eliminate an alternative based on a single criterion, rather than evaluating the
alternative more globally ( in terms of all of the relevant criteria). In Case 3, this
type of strategy was exhibited by subjects using all three versions of the system.
The result was the selection of a poor plan by 10% of the subjects in the 'sketching
only' version, 30% of the subjects in the 'sketching and route constraints' version
and 40% of the subjects in the automatic suggestion version.
Having the computer indicate several possible solutions might help
encourage a more global evaluation. In addition, it niight be helpfid to use
animation to create displays to help the user view the data over the entire flight,
and to include redundancy in the evaluation of plans (e.g., letting the flight crew
look at displays of paths proposed by a dispatcher or vice versa).
Supporting IndividualDijTemncxs
Finally, results like those in Case 4 provide strong evidence for the need to
give the person the option to explore alternatives on their own. Because people
m e r in terms of their preferences and mental models of a situation, and because
we have no objective way to say who is "right" for each such situation, we need to
give people the tools necessary to allow them to create their own alternatives and
to play "what if' games, even if the computer provides some suggestions.
FinalNote
This study demonstrates that the design of an effective cooperative system
for a complex task like flight planning is a significant challenge. It requires
careful consideration of how system design features influence the cognitive
processes of users in specific types of scenarios. VVhile there are important
75

directions for further research, the results highlight a number of considerations
for designers of flight planning systems to support dispatchers and flight crews in
particular, and as well as for designers of cooperative problem-solving systems in
general.
Are such considerations worth the effort? The ability of a system design to
induce 40% of the pilots to select a poor flight plan suggests that there is indeed a
very real need to explore these issues further and to take them seriously when
implementing commercial systems.
76

This research has been supported by-NASA Ames Research Center and the FAA under grant NCC2-615. Special thanks is given to Sherry Chappell, Ev Palmer,
Deb Galdes, Dave Williams and Judith Orasanu for their work in support of this
effort, to Larry-Earhart and the pilots who participated in this study, to Roger
Beatty and the Airline Dispatchers Federation, and to the members of Chuck
Layton's dissertation committee, Jane Fraser and David Woods.

&e, P. E., & Chapman, D. (1989). What sire plans for? A.I. Memo #1050a.
Andriole, S. J. (1989).
Artificial Intelligence Laboratory. Massachusetts Institute of Technology.
Summit,PA: TAB. . BlueRidge
Benson, I., Ciborra, C., & Proffitt, S. (1990). Some social and economic
Baltimore: ACM. 119-129. consequences of groupware for flight crew. Brocee&es of the Conference o n
Bullen, C. V., & Bennett, J. L. (1990). Learning from user experience with groupware. Proceediw o f the Conference on C O ~ D U ~ ~ r-Sumorted - _ CooDe rative Wo rk. Baltimore: ACM. 291-302.
Carroll, J. M., & McKendree, J. (1987). Interface design issues for advice-giving expert systems. , 14-31.
Co
Decision Science Consortium, Inc.
Coombs, M., & Alty, J. (1987). Expert systems: An alternative paradigm.
Davis, R., & Hamscher, W. (1988). Model-based reasoning: Troubleshooting. In
, 21-43.
Intelligence, San Mateo: H. E. Shrobe and AAAI (eds.), Emlorin? Artificral Kaufmann.
. .
Ericsson, K. A., & Simon, H. A. (1985). J'rotoco 1 analvs is: Verbal reDorts as da ta. Cambridge: MIT Press.
Fraser, J. M., Smith, P. J., & Smith, J. W., Jr. (1990). A cata lop of errora (Tech. Rep.). Columbus, OH: The Ohio State University, Department of Industrial and Systems Engineering.
Erlbaum. Gentner, D., & Stevens, A. L. (eds.) (1983). . Hillsdale, N.J.:
Grudin, J. (1991). CSCW The convergence of two development contexts. CHI '91
Hall, N. G. (1988). planning fuzzy 1 18tq), 638-646.
. Reading, MA: Addison-Wesley. 91-97.

Hayes-Roth, B.,. & Hayes-Roth, F. (1979). A cognitive model of planning. ve Saence. 3(41,275-310.
Hoc, J. M. (1988). Cornu 'tive ~ s v c hology of d a m 'w. London: Academic Press.
Isenberg, D. J. (1986). Thinking and managing: A verbal protocol analysis of managerial problem solving. ,775- 788.
Johannsen, G., & Rouse, W. B. (1983). Studies of planning behavior of aircraft pilots in normal, abnormal, and emergency situations. E E E T ransactions on Svstems. Man. and Cvbe rnetxcs. 13(32 ,267-278.
Klein, G. A. (1991, in press). A recognition primed decision model of decision making. In 6. A. Klein, R. Calderwood, and J. Orasanu (eds.), Decision makin9 in comdex worlh.
Kolodner, J. L., & Kolodner, R. M. (1997). Using experience in clinical problem solving: Introduction and framework.
d Cvbernetics. 17(31, 420-431.
Larkin, J. H., & Simon, H. A. (1987). Why a diagram is (sometimes) worth ten ,65-99. . . thousand words. &tautwe Sa 'ence, 11,
Layton, C. F., Smith, P. J., McCoy, E., & B h r i , T. (1990). Design concepts for the development of cooperative problem-solving systems. The Ohio State University. Internal report.
Lehner, P. E., & Zirk, D. A. (1987). Cognitive factors in userlexpert-system
McCloske (eds.1,
interaction. ,97-109.
e theories of motion. In D. Gentner and A. L. Stevens . 299-324). Hillsdale, N.J.: Erlbaum.
Miller, R. A. (1991). Personal communication.
Mi , Galanter, E., & Pribram, K. H. (1960). New York Holt.
Minsky, M. (1977). Frame-system theory. In P. N. Johnson-Laird and P. C. . Cambridge:
Mitchell, C. M., & Saisi, D. L. (1987). Use of model-based qualitative icons and systems. IEEE 3-593.
Englewood Cliffs, Newell, A. & Simon, H. A. (1972). N. J.: Prentice-Hall.
79

Norman, I). A. (1983). A. L. Stevens (eds.),
Robertson, S., Zachery,W. and Black, J. (eds.) (1990) j&pn ition. ComDut inP and
Roth, E. M., Bennett, K. B., & Woods, D. D. (1987). Human interaction with an
Cooperation. Norwood, NJ:Ablex Publishing Company.
"intelligent" machine. Internat ional Jou mal of Man-Machine Stuh 'e$* 27, 479-525.
Roth, E. M., Woods, D. D., & Pople, H. E., Jr. (in press). Cognitive simulation as a tool for cognitive task analysis. Frvonom ica.
Rudolph, F. M., Homoki, D. A., & Sexton, G. A. (1990). "Diverte r" dea 'sion aiding for in-fliyht diversions (Contractor Report No. 182070). Hampton, VA: NASA.
Sacerdoti, E. D. (1974). Planning in a hierarchy of abstraction spaces. Artificial JntelliTence. 5(a, 115-135.
Schank, R., & Abelson, R. (1977). ScriDts. D lans. &. and unde rstanding. Hillsdale, N.J.: Erlbaum.
Shute, S., & Smith, P. J. (in press). Jdormat ion Processes and Management.
Simon, H. A. (1955). A behavioral model of rational choice. rterlv Jou rnal of Economics. 69,99-118.
Smith, P. J., Miller, T. E., Fraser, J., Smith, J. W., Svirbely, J. R., Rudmann, S., Strohm, P. L., & Kennedy, M. (1991). An empirical evaluation of the performance of antibody identification tasks. Transfus ion. 21(4) ,313-317.
Sorensen, J. A., Waters, M. H., & Patmore, L. C. (1983). ComDute r Dromams for (Contractor
Report No. 3688). Hampton, VA NASA.
Stefik, M. (1981). Planning with constraints: MOLGEN part 1. btificial ,111-140.
Stevens, A., Collins, A., & Goldin, S. E. (1979). Misconceptions in student's
Suchman, L. A. (1987). Plans and situated actions: The D roblem of human
understanding. , 145-156.
machine commun i a tion+. New York Cambridge.

Woods, D. D., &
North-Holland. 3-43.
81

1. boiling water;
2. kitchen;
3. coffee-ban store;
4. grinder store;
6. coffee grinder;
7. brewed-coffee store;
8. bank
9. money.
82

make coffee
be in kitchen
buy something
go somewhere
get money
boil water
be at store have money
have something
place exists be at place
be at bank have money
not at any other place
be in the kitchen have boiling water
83

Precondition Initial criticality
place exists have something be somewhere
3 2 1
84
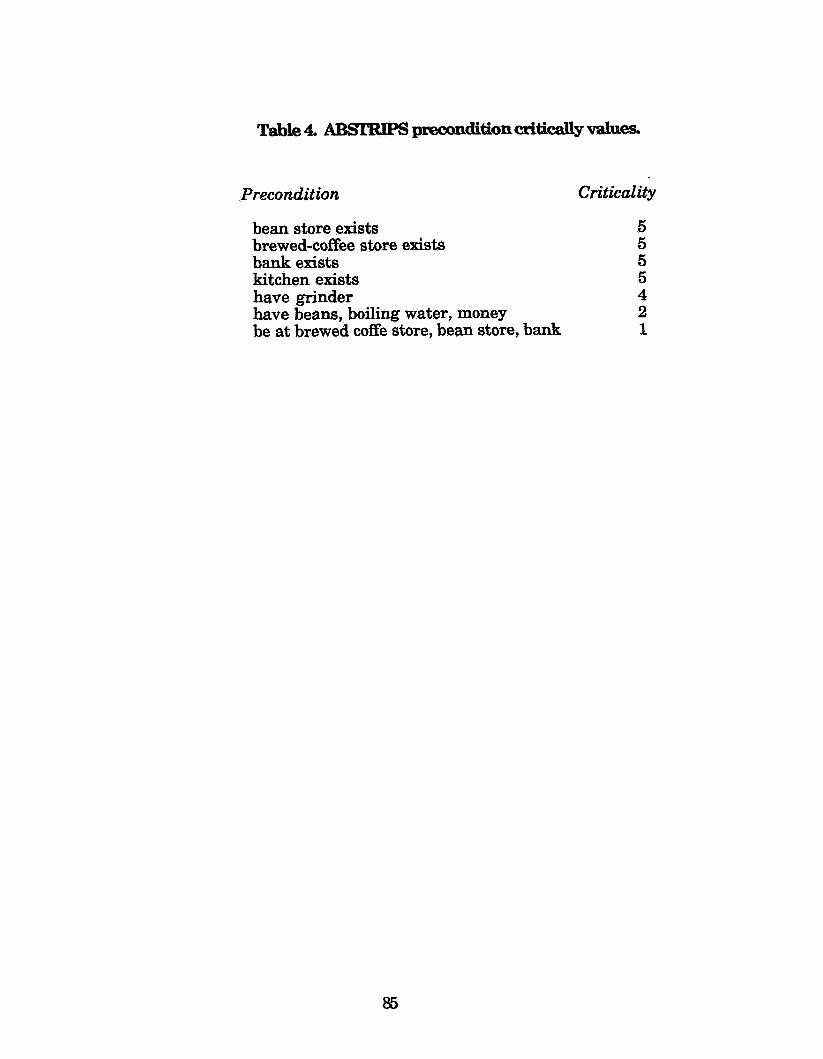
Precondition Criticality
bean store exists 5 brewed-coffee store exists 5 bank exists 5 kitchen exists 5 have grinder 4 have beans, boiling water, money 2 be at brewed coffe store, bean store, bank 1
85
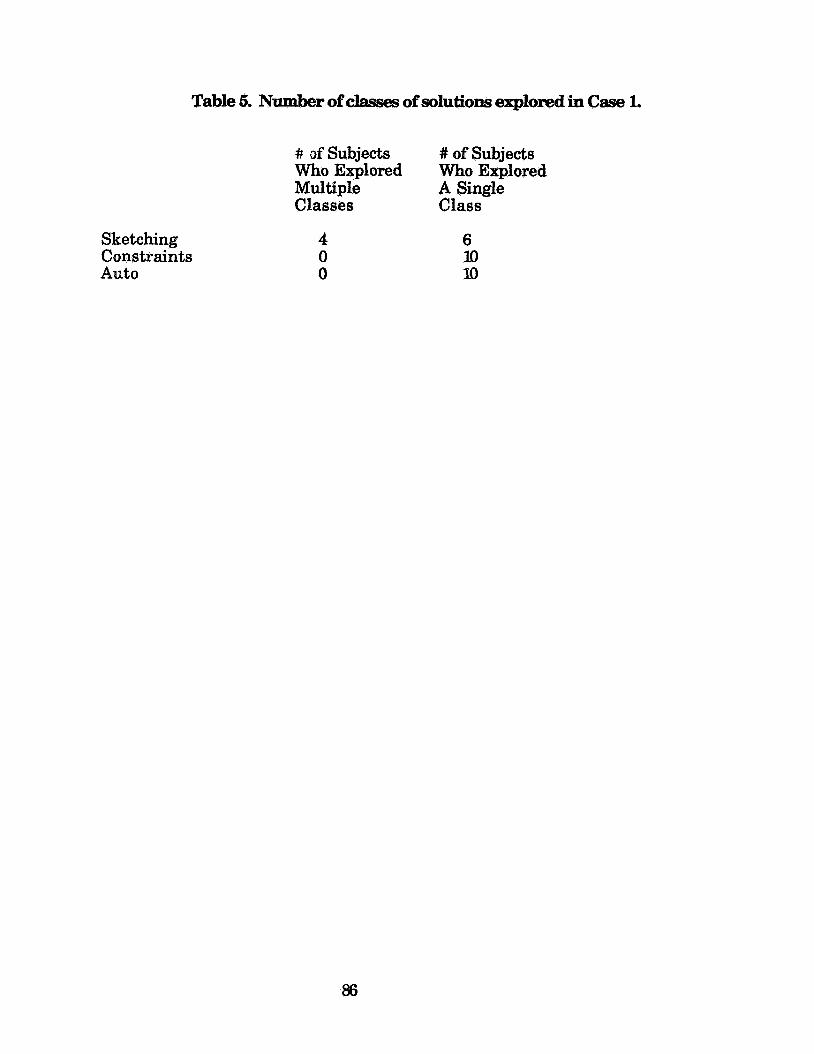
Sketching Constraints Auto
Table 5. Number of classes of solutions explored in Case 1.
tr of Subjects Who Explored Who Explored Multiple A Single Classes Class
4 6 0 10 0 10
# of Subjects
86

Sketching Constraints Auto
Table 6. N u m k of specific mutes explored in Case 1,
# of Subjects Who Explored Who Explored Multiple A Single Routes Route
6 4 1 9 1 9
# of Subjects
87

Table 7. Information search performance in Case 1.
Fronts Radar Winds Jet Routes
Sketch 9 9 7 10 Constraints a 10 5 9 Auto 9 9 6 5

Table& RoutesselectedinCase2.
North South Radar
Sketch 6 4 10 Constraints 9 1 lo Auto lo 0 lo

Table 9. Number ofclasses of solutions explored in Case 2.
# of Subjects Who Explored 'who Explored Multiple A Single Classes Class
# of Subjects
Sketching Constraints Auto
8 5 4
2 5 6
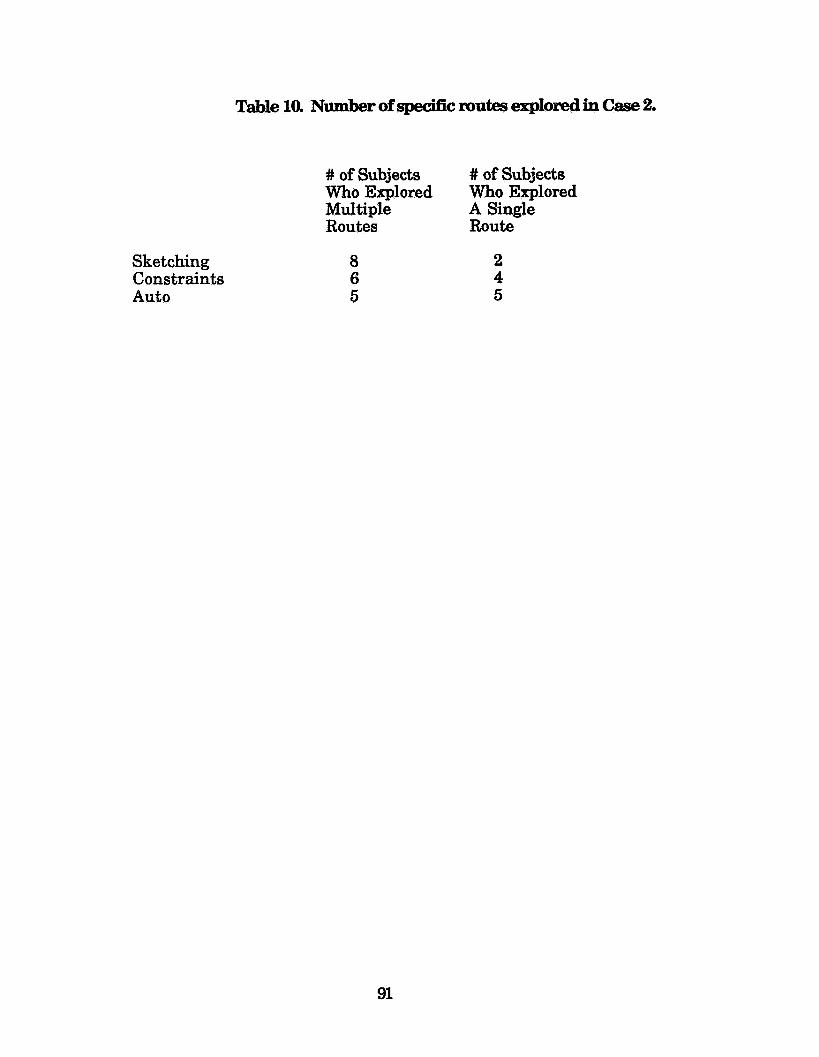
Sket cbing Constraints Auto
Table 10. Number of specific mutes explored in Case 2.
# of Subjects Who Explored Who Explored Multiple A Single Routes Route
8 2 6 4 5 5
# of Subjects
91

Table 11. Case 2 information s e d characbhtiw.
Fronts Radar Winds Jet Routes
Sketch 7 10 7 10 Constraints 7 lo 3 9 Auto 8 9 7 8
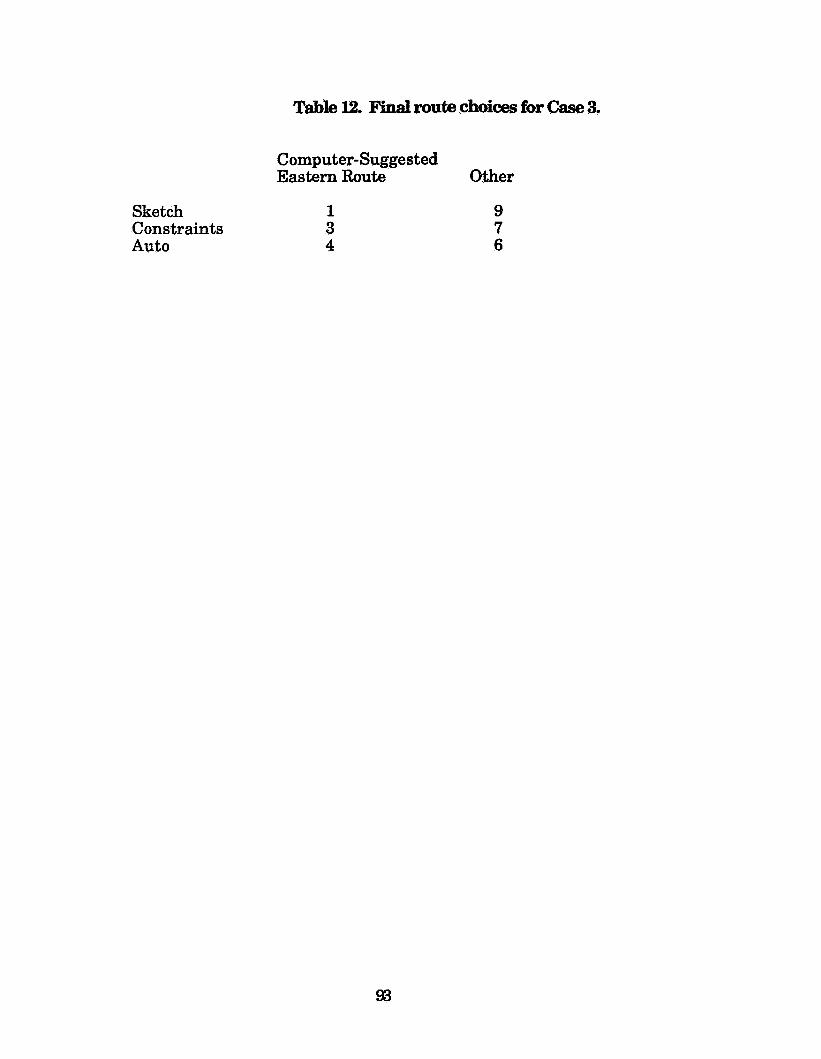
Sketch Constraints Auto
Table 12. Final mute choices for Case 3.
Computer- Sugge s t ed Eastern Route Other
1 3 4
9 7 6
93

Sketching Constraints Auto
Tatble 1% Number of solution classes explored in Case 3.
# of Subjects Who Explored Who Explored Multiple A Single Classes Class
5 5 3 7 9 1
# of Subjects
94
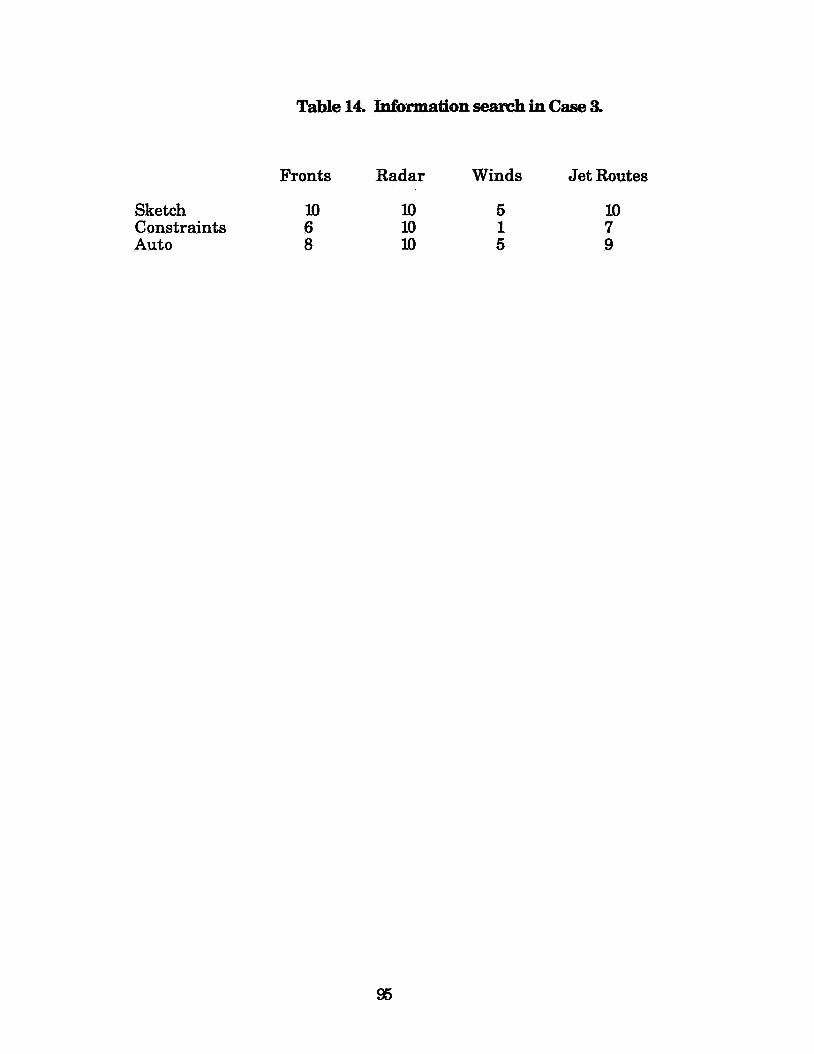
Table 14. I&ormation search in Case 3.
Fronts Radar Winds Jet Routes
Sketch lo lo 5 10 Constraints 6 lo 1 7 Auto 8 lo 5 9

Sketch Constraints Auto
Table 15. Final route choices for Case 4.
North South Original
5 4 1 5 4 1 7 2 1
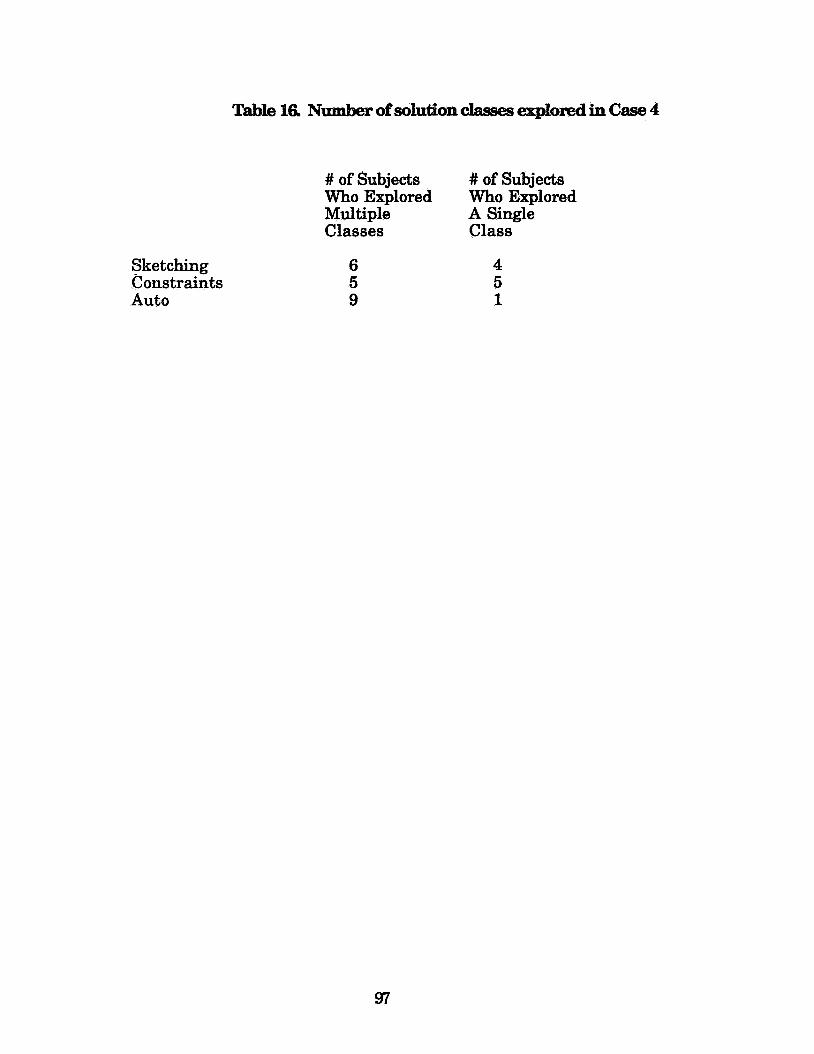
Sketching Constraints Auto
Tabk 16. Number of solution classes exploxed in Case 4
# of Subjects Who Explored Who Explored Multiple A Single Classes Class
# of Subjects
6 4 5 5 9 1
97
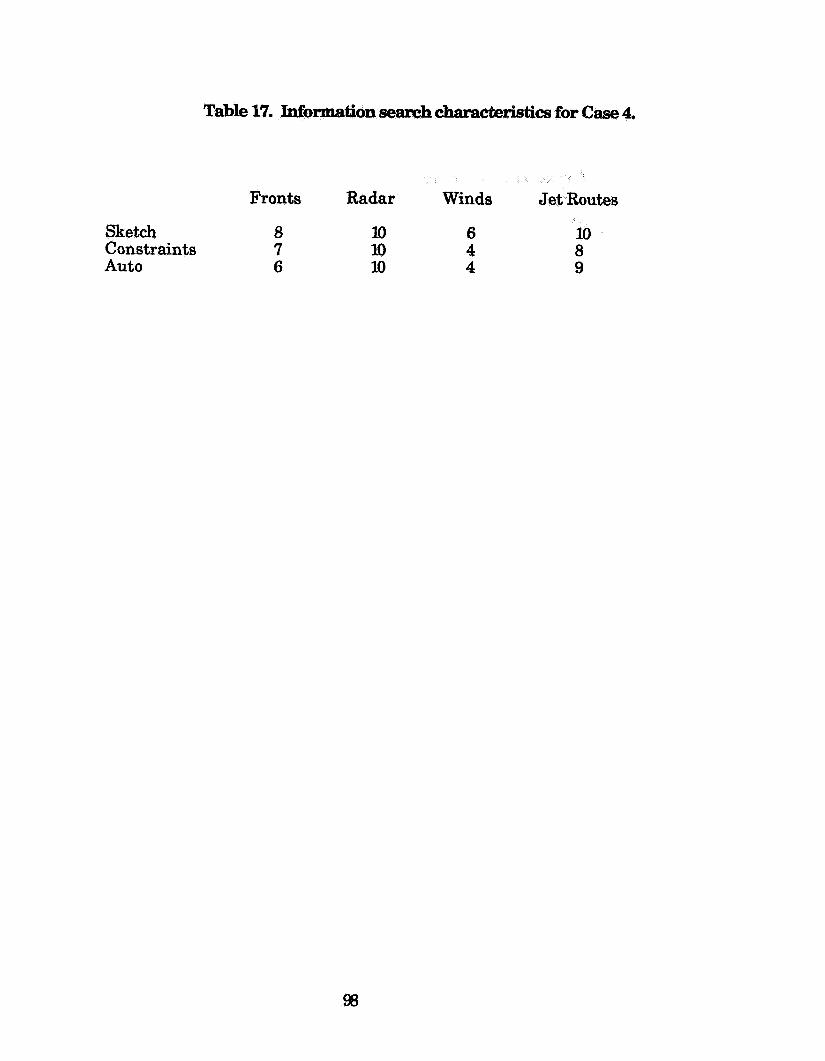
Sketch Constraints Auto
Table 17. Inforrmation search cbmaddstics for Case 4.
Fronts Radar Winds
8 10 6 10 7 lo 4 8 6 u) 4 9

List of Fieurea
Figure 1.
Figure 2.
Figure 3.
Figure 4.
Figure 5.
Figure 6.
Figure 7.
Figure 8.
Figure 9.
Figure 10.
Figure 11.
Figure 12.
Figure 13.
Figure 14.
Figure 15.
Figure 16;
Figure 17.
Partial set of factors releyant. to enroute flight planning.
A hierarchical plan for hammering nails. (after Miller, Galanter’and Pribram, 1960, p. 36).
After Wilensky, 1983, p. 23.
Left monitor with weather menu.
Left monitor with route constraints menu.
High altitude jet routes and waypoints. - Right monitor.
Situation at the start of Case 1.
Routes explored by sample subjects in Case 1.
A model of the plan adaptation cycle.
Fuel-efficient, computer suggested route vs. more conservative northern deviations.
Routes explored by sample subjects in Case 2 (plotted on a map showing the initial weather).
Routes explored by sample subjects in Case 2 (plotted on a map showing the forecast weather).
Original route and current composite radar for Case 3.
Computer suggested routes for Case 3.
Routes considered by the ‘sketching only’ subjects in Case 3.
Current composite radar for Case 4.
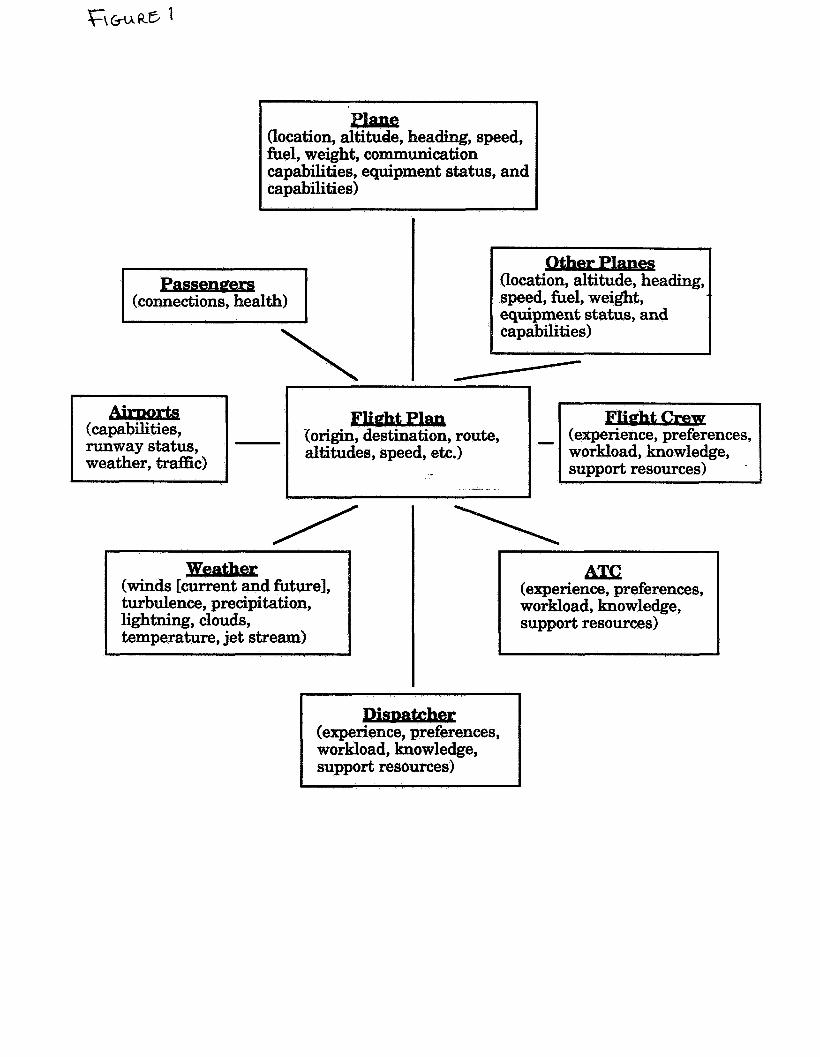
(location, altitude, heading, speed, fuel, weight, communication capabilities, equipment status, and capabilities)
\ I I
1
(location, altitude, heading, speed, fuel, weight, equipment status, and capabilities)
- runway status, weather, traffic)
{origin, destination, route, _I
altitudes, speed, etc.)
. .
/ (winds [current and future], turbulence, precipitation, lightning, clouds, temperature, jet stream)
\ GTC
(experience, preferences, workload, knowledge, support resources)
(experience, preferences, workload, knowledge, support resources)

c-a

Goal Detector:
Situation merits goal? * t
Simdatx &om current world model.
Add goal to task network.
Proposer:
- ~ C A L W O R L D MODEL
PLAN , Propose plan for goal, add to task network.
Perform specified action. Projector: -
Newt situations

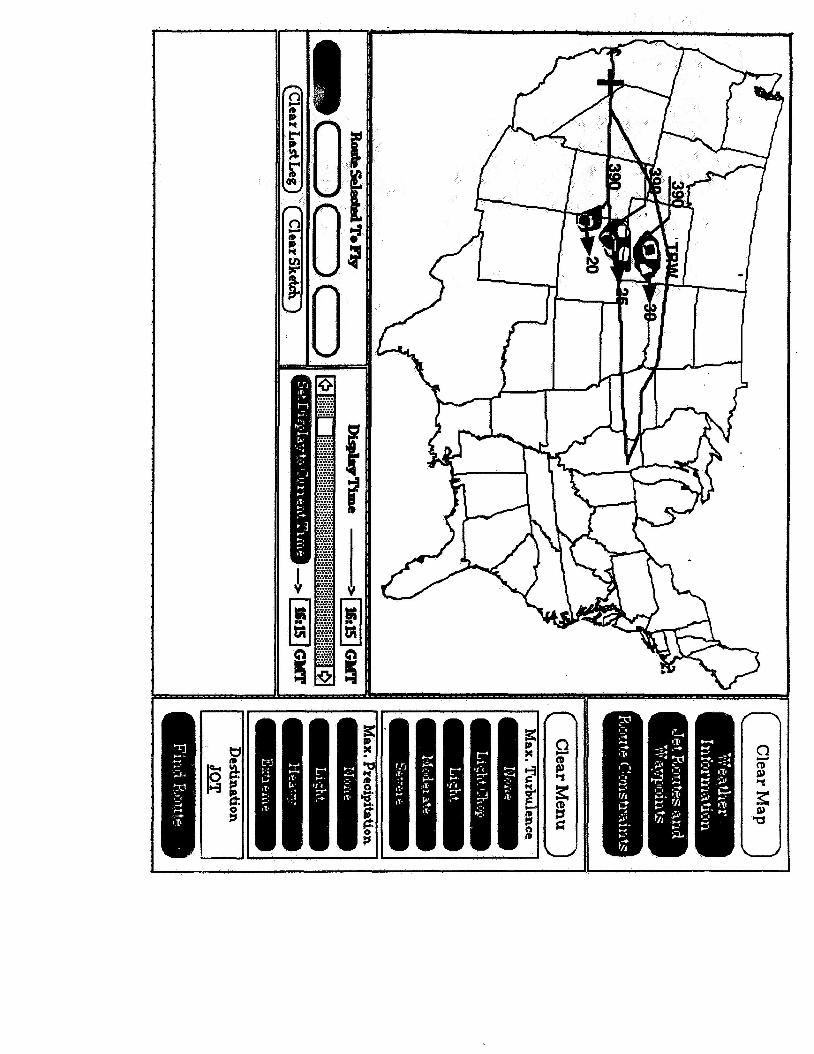


I. - 6 m ,.., ... ,.., ... ,.., ... I- ... ,..I ... I.., ... Y.,
:.t:
;%
Gii
:...: ,.I ... ,.., ... ,..I
m v.7 ,..< ... ,.., 0.. *., ... .... ... ,.., ... *..I ... ,..* ... ,.., ... ,.., ... ,..* ... I.., ... ,.., ... I.., ... ,.., ... ,.., ... ,..I ... 8.U ... ,.., ... ,.., ... ,..a ... ,..I ... ,..I ... .... ... .... ... .... ... ... ... ,... ... ... ... .., ... ,..I ... ... ... ... ... ... ... ... ... ... ... ... ... ... ... ... ... ... ... ... ... ... ... ... ... ... ... ... ..* ... ... ... ... ... ... ... ... *.. ... ... I.. ... *.. ... I.. ... ... ... ... ... ... ... .... ... .... ... .... ... ..., ... ,..( ... ,../ ... ,.., ... .... ... .... ... ,.., .I. .... ... .... ... .... ... .... ... .... ... .... ... ,.SI ... ,.., ... ,.., ... ,.., ... ,.., ... .... ... ,.., ...
:*a
?.%
A-2
:.-: :5.: Y
n ?r!
...............
k
...............

n
a 0

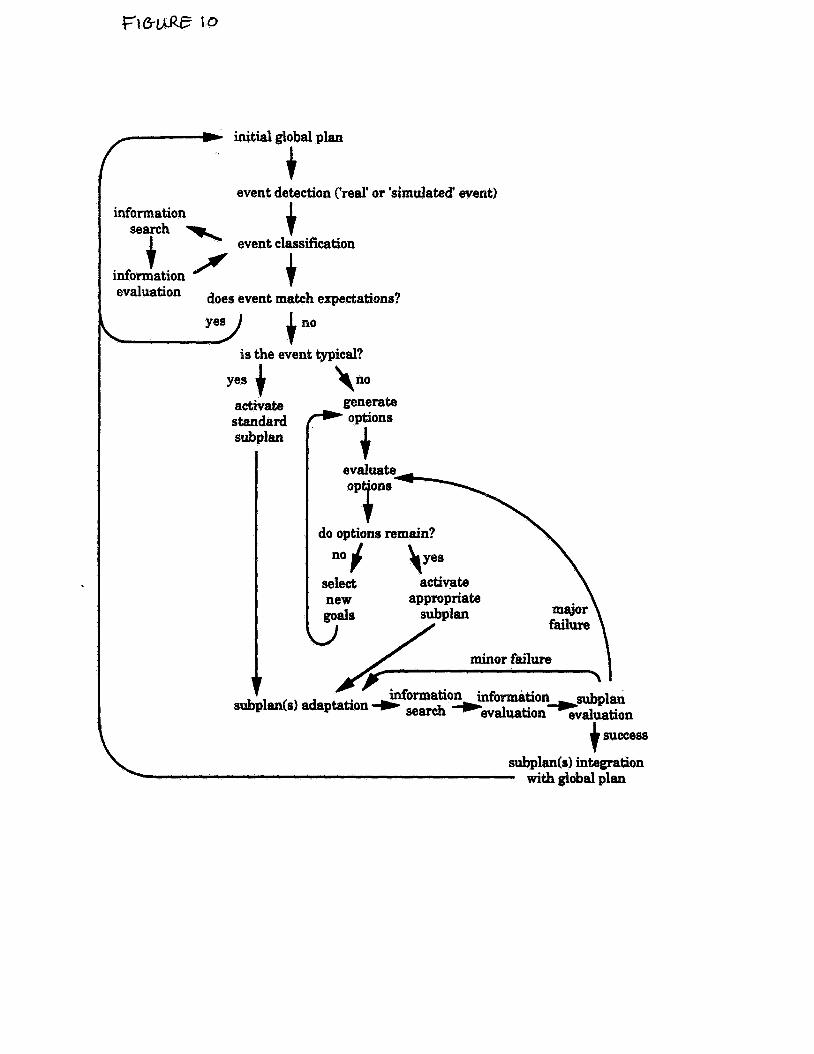
initial global plan
7 t
information + / t
event detection ('real' or 'simulated' event) + information search \
event classification
evaluation does event match expectations? ~ YY +no
is the event typical?
Yes + activate standard subplan
generate * options
evaluate
O P T \ do options remain? \
no# l y e s select activate
+ success
subplan(s) integration withglobalplan


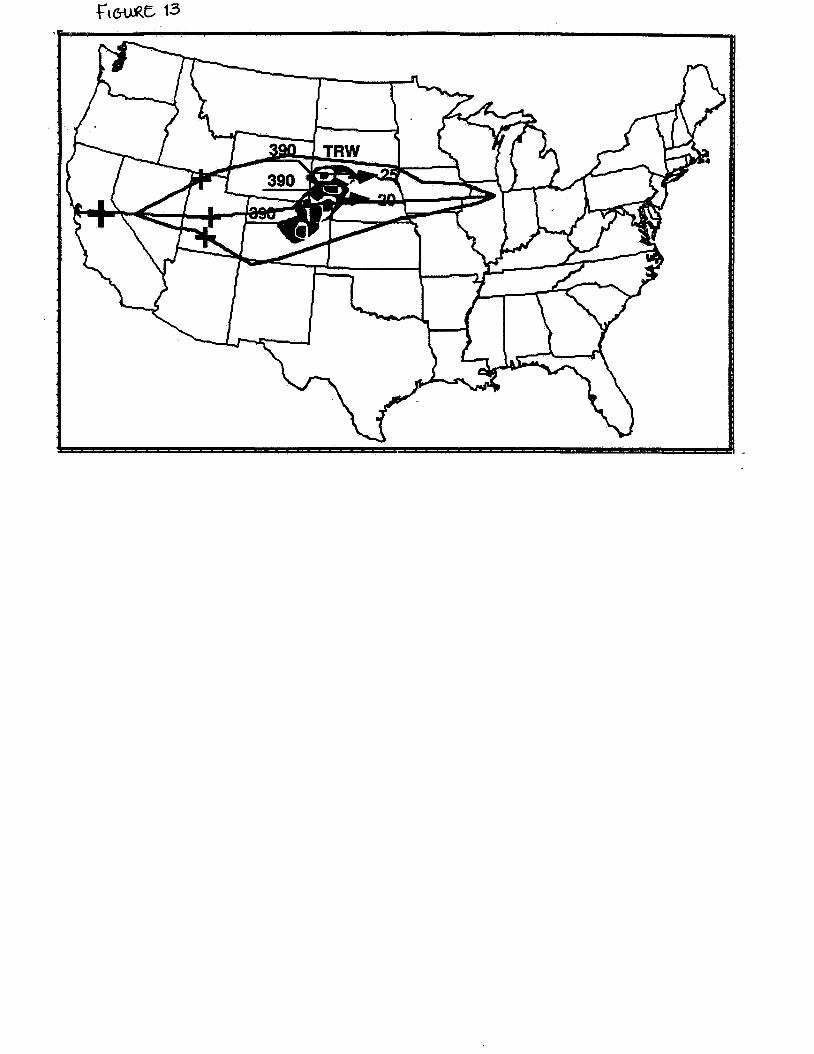
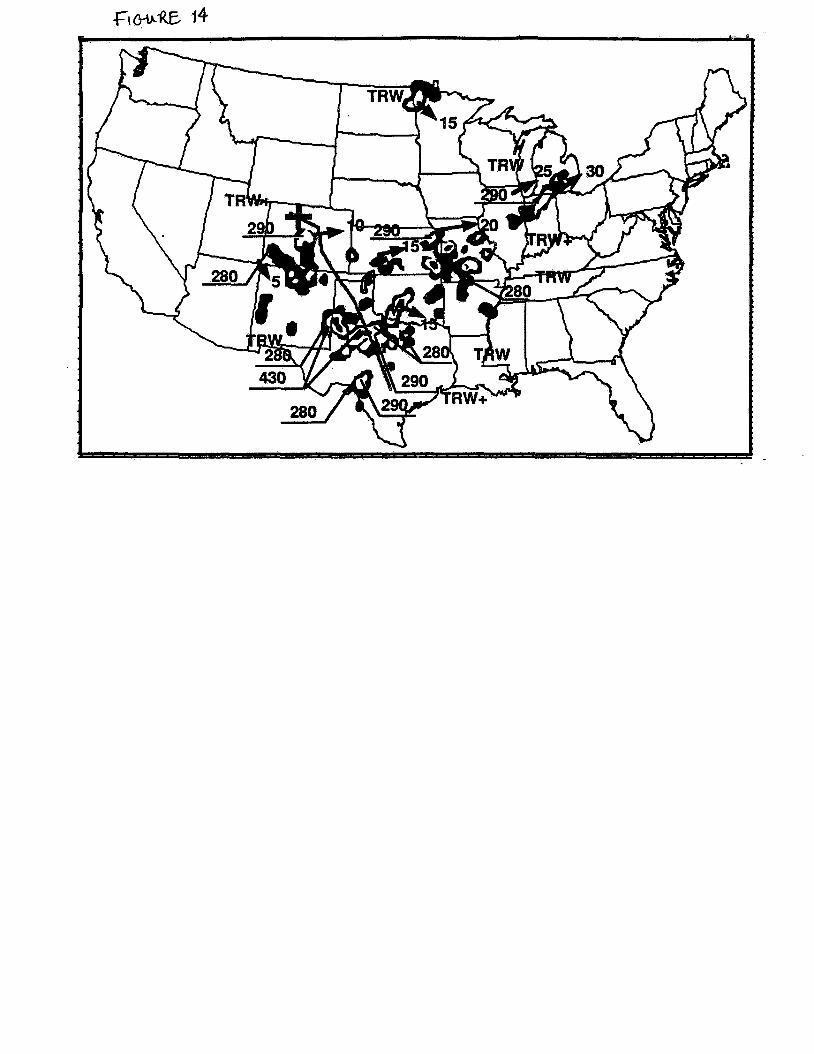
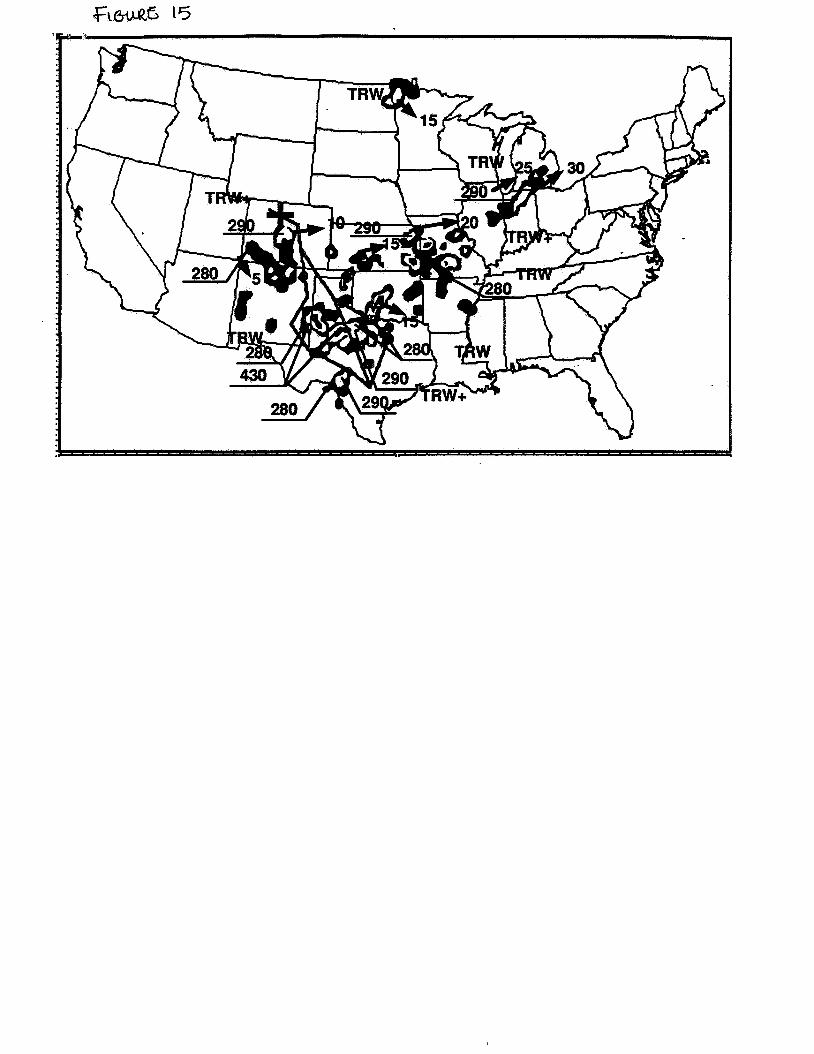

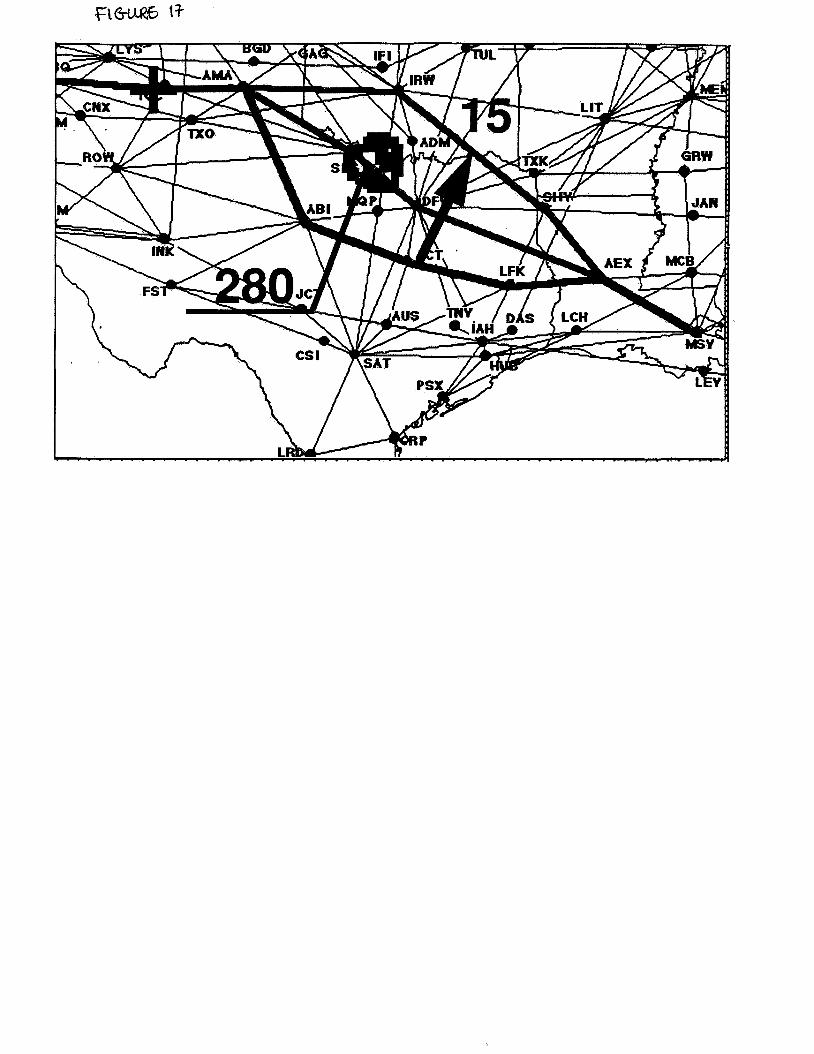
I . . . . . . . . . . . . . . . . . . . . LR .-I-. . . . . . . . . ~. . . . . . . . . . . . . . . .
Related Documents