A Land Cover Map of Eurasia’s Boreal Ecosystems S. BARTALEV, A. S. BELWARD Institute for Environment and Sustainability, EC Joint Research Centre, Italy D. ERCHOV Center of Forest Ecology and Productivity, Russia Global Land Cover 2000

A Land Cover Map of Eurasia’s Boreal Ecosystems S. BARTALEV, A. S. BELWARD Institute for Environment and Sustainability, EC Joint Research Centre, Italy.
Dec 14, 2015
Welcome message from author
This document is posted to help you gain knowledge. Please leave a comment to let me know what you think about it! Share it to your friends and learn new things together.
Transcript

A Land Cover Map of Eurasia’s Boreal Ecosystems
S. BARTALEV, A. S. BELWARDInstitute for Environment and Sustainability, EC Joint Research Centre, Italy
D. ERCHOVCenter of Forest Ecology and Productivity, Russia
Glo
bal
Lan
d C
ove
r 20
00

SPOT 4 - VEGETATION Data
Type of data product
Standard S10 products including:
Spectral channels
NDVI
Angular information
Status map
Geographic window : 420N - 750N
and 50E -1800E
Time window : 3d decade of March 1999 – 1st decade of November 1999 (23 of S10 products)
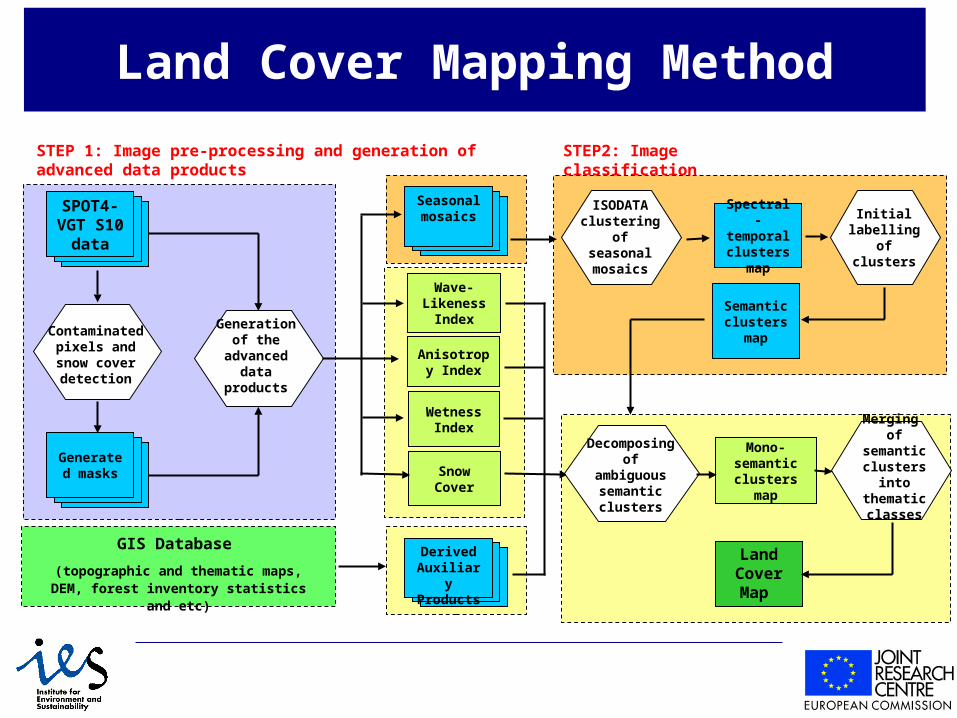
STEP 1: Image pre-processing and generation of advanced data products
STEP2: Image classification
SPOT4-VGT S10
data
Contaminated pixels and
snow cover detection
Generated masks
Generation of the advanced data products
Seasonal mosaics
Wetness Index
Anisotropy Index
Wave-Likeness
Index
Snow Cover
ISODATA clustering of
seasonal mosaics
Initial labelling of
clusters
Spectral-temporal clusters
map
Semantic clusters
map
Decomposing of ambiguous
semantic clusters
Mono-semantic
clusters map
Land Cover Map
Merging of semantic clusters into
thematic classes
Land Cover Mapping Method
GIS Database
(topographic and thematic maps, DEM, forest inventory statistics and etc)
Derived Auxiliary Products

From Hall et al., 1998: "Algorithm Theoretical Basis Document (ATBD) for the MODIS Snow-, Lake Ice- and Sea Ice-Mapping Algorithms. Version 4.0"
Normalised Difference Snow Index
RR
RRNDSI
blu
swirblu

Detection of the contaminated pixels
Step 1: Detection of the pixels utterly contaminated by snow and
clouds with pre-specified thresholds
pixel with co-ordinates at fixed decade of observation t*
L
C
S
C
C
C set of pixels with presence of snow or/and ice
set of pixels with presence of clouds
set of pixels without presence of snow/ice or clouds
),( *tP Θ Θ
CSp CCC 1
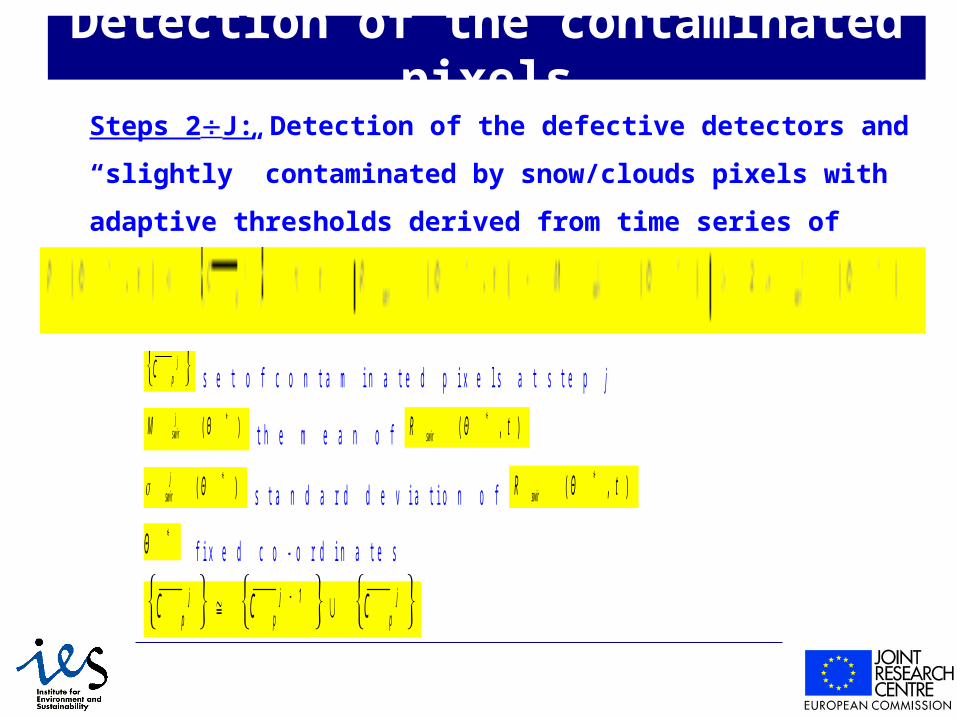
Detection of the contaminated pixels
Steps 2J: Detection of the defective detectors and “slightly”
contaminated by snow/clouds pixels with adaptive thresholds
derived from time series of data
jpC s e t o f c o n t a m i n a t e d p i x e l s a t s t e p j
)( *ΘjswirM t h e m e a n o f ),( tR swir
*Θ
)( *Θjswir s t a n d a r d d e v i a t i o n o f ),( tR swir
*Θ
*Θ f i x e d c o - o r d i n a t e s
jp
jp CCC 1j
p

Seasonal Mosaics
spring
summer
autumn

Wave-Likeness Index (WLI)
0
0.1
0.2
0.3
0.4
0.5
0.6
0.7
0.8
t1 t2 t3 t4 t5 t6 t7 t8 t9 … … … … … tn-1 tn
time of observation
ND
VI
(NDVI e, t e)
(NDVI max, t max)
(NDVI b, t b)
a
b -
1
b -
1
d
d
a
t
t t
p
NDVI
NDVINDVIWLI dctbSinaNDVI p ))(
2(
where
Cropland

Bi-spectral Gradient Wetness Index (BGWI)
SWIR
NIR
BGWI
Wetland BGWI-NDVI- BGWISummer MosaicNIR-MIR-RED
Pure Water
Analysing pixel

Surface Anisotropy Relative Linear Indexes (SARLI)
RED-NIR: Slope - Slope - Interception
NIR-MIR: Slope - Slope - Interception
SARLI is derived based on the linearised RPV Bi-directional Reflectance Distribution Function model to characterise a surface anisotropy properties


The SibTREES Land Cover Classes
Floristic differencesRemoved for GLC 2000
Global legend. New class =
Evergreen needle leaf

Available Country-wide Forest Inventory Data to compare with GLC2000 Map
Forest inventory database contains for each forest management unit the data on forest area, tree species composition, volume, area of non-forested land categories and some other information

Forest Management Units selected for comparison with GLC 2000 map
679 forest management units

GLC200 Forest Cover in comparison to Forest Inventory Data

GLC200 Forest Cover in comparison to Forest Inventory Data

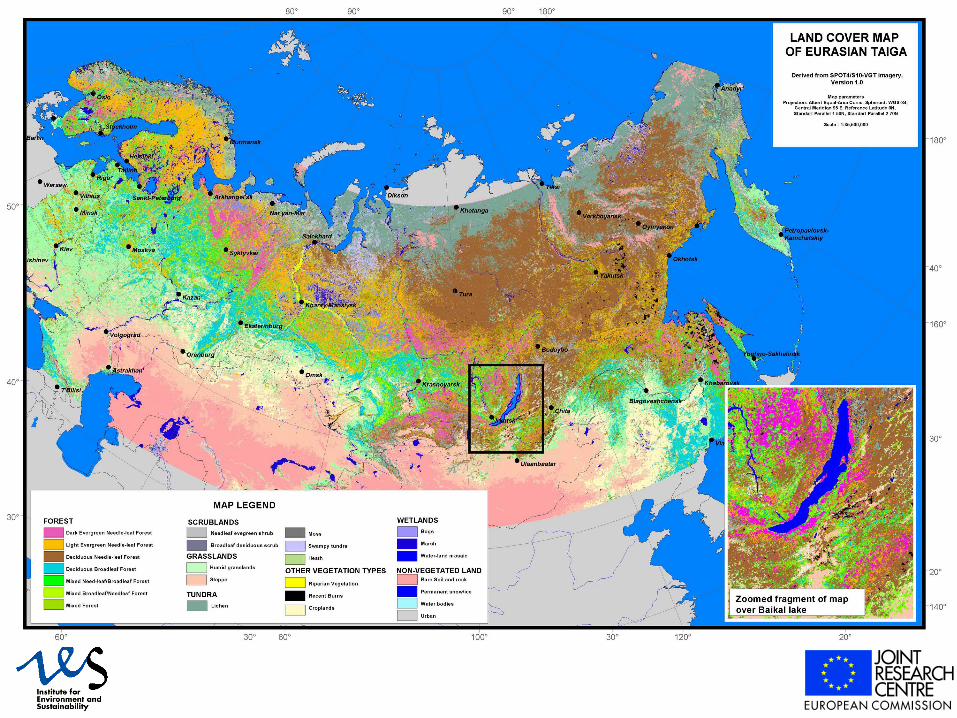
GLC 2000 Map in comparison to SPOT-HRV image
SPOT-HRV Image
Simplified Forest Map
Simplified GLC 2000
Map
SPOT-VGT Image

Ongoing development to improve the Northern Eurasia’s GLC2000 Product
splitting some of the forest classes according to trees cover density
reducing of ambiguity between “cropland” and “grassland” classes
introducing to the map legend the mosaic classes such as “cropland/natural vegetation” and “forest/other vegetation”
comparison (pre-validation checking) with available forest inventory and other available land cover data to expose main divergences
Related Documents


![1230 BELWARD Impact of the new Implementation Plan [Read-Only] BELWARD... · The Global Risks Landscape 2016 Source World Economic Forum Global Risks Report 2016 ... Conference of](https://static.cupdf.com/doc/110x72/604ac32af1ccce0f9036dd74/1230-belward-impact-of-the-new-implementation-plan-read-only-belward-the.jpg)