A general simulation model for performance prediction of plate fin-and-tube heat exchanger with complex circuit configuration W.K. Ding a , J.F. Fan a , Y.L. He a , W.Q. Tao a, * , Y.X. Zheng b , Y.F. Gao b , J. Song b a Key Laboratory of Thermo-Fluid Science and Engineering of MOE, School of Energy and Power Engineering, Xi’an Jiaotong University, Xi’an 710049, China b International Copper Association Ltd., China, Shanghai Office, Room 2814-2824, Central Plaza, 381 Huai Hai Zhong Road, Shanghai, 200020, China article info Article history: Received 4 May 2010 Received in revised form 26 January 2011 Accepted 28 January 2011 Available online 9 March 2011 Keywords: Heat exchanger Performance simulation Circuit configuration Software abstract A circuit data structure (circuit connection network) for a general description of different circuit configurations in computer programs is presented. On basis of this data structure, a general tube-by-tube simulation model and the corresponding code for prediction of plate fin-and-tube heat exchanger performance are developed. The code can be applied to any complex circuit configuration, and also has great flexibility in simulation of heat exchanger with different fin structures, tube types, and various refrigerants under both dry and wet conditions. The model and the code are verified against experi- mental results both in literature and authors’ data, and have been successfully adopted to simulate a practical heat exchanger. Design software based on the model is developed using Cþþ, which is a highly flexible and customizable simulation platform with friendly graphic user interface. Ó 2011 Elsevier Ltd. All rights reserved. 1. Introduction Plate fin-and-tube heat exchangers are employed in a wide variety of engineering applications such as air-conditioning, heat pumping, and refrigeration systems, and play a vital role in terms of manufacturing cost and energy consumption of these systems. For the most plate fin-and-tube heat exchangers used in air-condi- tioning and refrigeration systems heat transfer occurs between air and refrigerant. Studies on this type of heat exchangers have been conducted in three aspects. First aspect is the experimental and numerical investigations on the heat transfer and pressure drop characteristics of the air side, and the major concern is to obtain correlations for heat transfer coefficient and friction factor. In this regard, successful achievements have been obtained. For the tube- fin heat exchange surface patents issued from 1981 to 1991 in USA, Wang [1] has made a comprehensive review. A compilation of heat transfer and friction factor experimental correlations for plain, wavy, louvered and slit fins is given by Wang et al. in [2e5]. Numerical simulation plays an important role in the performance predictions of complicated fin structures [6e9]. Second aspect is the study of phase change heat transfer and pressure drop char- acteristics of refrigerants in tubes. In this regard correlations are mainly obtained by experimental measurements. A number of correlations have been published for the phase change heat transfer in tubes with conventional diameters (larger than 5 mm) [10e16]. For the air-refrigerant heat exchanger the results of above two aspects only provide design database. There is another important aspect which affects the performance of the heat exchanger, and hence should be seriously taken into account in the design, i.e., the circuitry of the refrigerant. In this aspect computer simulation has played a very important role in taken various complexity into consideration based on the above-mentioned achievements. These complexity factors include: fin-surface geometry, tube arrange- ment, refrigerant circuit layout, airflow non-uniformity, different working fluids and various operating conditions (hereafter for the simplicity of presentation this aspect will be simply called circuit design). A general circuit design procedure (program) of plate fin-and- tube heat exchangers should be not only accurate and efficient in performance prediction, but also high flexible and advantageous in following aspects: it can be applied to different types of heat exchanger (condenser and evaporator); it can be applied to a wide range of refrigerant sorts, fin geometry structures and tube types; it can be applied to all kinds of air-side working conditions (dry and wet surface conditions); it can be applied to different tube arrangements (in-line and staggered) and various complex circuit configurations. In the past decades many heat exchanger performance simula- tion approaches or models have been proposed and implemented [17e27]. Although in the development of these models, the * Corresponding author. Tel.: þ0086 29 82669106; fax: þ0086 29 82669106. E-mail address: [email protected] (W.Q. Tao). Contents lists available at ScienceDirect Applied Thermal Engineering journal homepage: www.elsevier.com/locate/apthermeng 1359-4311/$ e see front matter Ó 2011 Elsevier Ltd. All rights reserved. doi:10.1016/j.applthermaleng.2011.01.045 Applied Thermal Engineering 31 (2011) 3106e3116

A General Simulation Model for Performance Prediction of Plate Fin-And-tube
Dec 15, 2015
A circuit data structure (circuit connection network) for a general description of different circuit
configurations in computer programs is presented. On basis of this data structure, a general tube-by-tube
simulation model and the corresponding code for prediction of plate fin-and-tube heat exchanger
performance are developed. The code can be applied to any complex circuit configuration, and also has
great flexibility in simulation of heat exchanger with different fin structures, tube types, and various
refrigerants under both dry and wet conditions. The model and the code are verified against experimental
results both in literature and authors’ data, and have been successfully adopted to simulate
a practical heat exchanger. Design software based on the model is developed using Cþþ, which is
a highly flexible and customizable simulation platform with friendly graphic user interface.
Welcome message from author
This document is posted to help you gain knowledge. Please leave a comment to let me know what you think about it! Share it to your friends and learn new things together.
Transcript

lable at ScienceDirect
Applied Thermal Engineering 31 (2011) 3106e3116
Contents lists avai
Applied Thermal Engineering
journal homepage: www.elsevier .com/locate/apthermeng
A general simulation model for performance prediction of plate fin-and-tubeheat exchanger with complex circuit configuration
W.K. Ding a, J.F. Fan a, Y.L. He a, W.Q. Tao a,*, Y.X. Zheng b, Y.F. Gao b, J. Song b
aKey Laboratory of Thermo-Fluid Science and Engineering of MOE, School of Energy and Power Engineering, Xi’an Jiaotong University, Xi’an 710049, Chinab International Copper Association Ltd., China, Shanghai Office, Room 2814-2824, Central Plaza, 381 Huai Hai Zhong Road, Shanghai, 200020, China
a r t i c l e i n f o
Article history:Received 4 May 2010Received in revised form26 January 2011Accepted 28 January 2011Available online 9 March 2011
Keywords:Heat exchangerPerformance simulationCircuit configurationSoftware
* Corresponding author. Tel.: þ0086 29 82669106;E-mail address: [email protected] (W.Q. Tao
1359-4311/$ e see front matter � 2011 Elsevier Ltd.doi:10.1016/j.applthermaleng.2011.01.045
a b s t r a c t
A circuit data structure (circuit connection network) for a general description of different circuitconfigurations in computer programs is presented. On basis of this data structure, a general tube-by-tubesimulation model and the corresponding code for prediction of plate fin-and-tube heat exchangerperformance are developed. The code can be applied to any complex circuit configuration, and also hasgreat flexibility in simulation of heat exchanger with different fin structures, tube types, and variousrefrigerants under both dry and wet conditions. The model and the code are verified against experi-mental results both in literature and authors’ data, and have been successfully adopted to simulatea practical heat exchanger. Design software based on the model is developed using Cþþ, which isa highly flexible and customizable simulation platform with friendly graphic user interface.
� 2011 Elsevier Ltd. All rights reserved.
1. Introduction
Plate fin-and-tube heat exchangers are employed in a widevariety of engineering applications such as air-conditioning, heatpumping, and refrigeration systems, and play a vital role in terms ofmanufacturing cost and energy consumption of these systems. Forthe most plate fin-and-tube heat exchangers used in air-condi-tioning and refrigeration systems heat transfer occurs between airand refrigerant. Studies on this type of heat exchangers have beenconducted in three aspects. First aspect is the experimental andnumerical investigations on the heat transfer and pressure dropcharacteristics of the air side, and the major concern is to obtaincorrelations for heat transfer coefficient and friction factor. In thisregard, successful achievements have been obtained. For the tube-fin heat exchange surface patents issued from 1981 to 1991 in USA,Wang [1] has made a comprehensive review. A compilation of heattransfer and friction factor experimental correlations for plain,wavy, louvered and slit fins is given by Wang et al. in [2e5].Numerical simulation plays an important role in the performancepredictions of complicated fin structures [6e9]. Second aspect isthe study of phase change heat transfer and pressure drop char-acteristics of refrigerants in tubes. In this regard correlations aremainly obtained by experimental measurements. A number of
fax: þ0086 29 82669106.).
All rights reserved.
correlations have been published for the phase change heat transferin tubes with conventional diameters (larger than 5 mm) [10e16].For the air-refrigerant heat exchanger the results of above twoaspects only provide design database. There is another importantaspect which affects the performance of the heat exchanger, andhence should be seriously taken into account in the design, i.e., thecircuitry of the refrigerant. In this aspect computer simulation hasplayed a very important role in taken various complexity intoconsideration based on the above-mentioned achievements. Thesecomplexity factors include: fin-surface geometry, tube arrange-ment, refrigerant circuit layout, airflow non-uniformity, differentworking fluids and various operating conditions (hereafter for thesimplicity of presentation this aspect will be simply called circuitdesign).
A general circuit design procedure (program) of plate fin-and-tube heat exchangers should be not only accurate and efficient inperformance prediction, but also high flexible and advantageous infollowing aspects: it can be applied to different types of heatexchanger (condenser and evaporator); it can be applied to a widerange of refrigerant sorts, fin geometry structures and tube types; itcan be applied to all kinds of air-side working conditions (dry andwet surface conditions); it can be applied to different tubearrangements (in-line and staggered) and various complex circuitconfigurations.
In the past decades many heat exchanger performance simula-tion approaches or models have been proposed and implemented[17e27]. Although in the development of these models, the
W.K. Ding et al. / Applied Thermal Engineering 31 (2011) 3106e3116 3107
universality and flexibility have been more or less taken intoaccount, the adaptability to circuit configurations is still a weakerpoint to be further improved than other aspects due to the circuitvariety and complexity. Most researchers adopt the tube-by-tubecomputation idea to simulate heat exchanger performance. This isan approach to individually compute each tube section one by oneby tracking heat exchanger tube-side fluids flow. A key and difficultproblem when implementing this method is how to determinetube computing sequence and tube-sideworking fluids distributionin different circuit configurations.
Bensafi et al. [17] presented a computational model CYRANO forthe design of a heat exchanger, and this model was applicable tolimited circuit configurations with several refrigerants. Vardhanand Dhar [18] developed a numerical model which can handle thecircuit with several inlets and outlets. However, in this model thetube arrangement was assumed to be always in-line. Corberan andMelon [19] focused on the effects comparison between differentcorrelations for both heat transfer and pressure drop in simula-tions. Liang et al. [20] took the circuit with branches into consid-eration in their model, but the number of branches was limitedto two. Domanski developed a software package EVAP-COND[21,22], which was based on the computational model EVSIM [23]presented by himself, to simulate heat exchanger performance,and it was also limited to typical circuit layouts. Liu et al. [24]presented a steady state mathematic model based on the graphtheory. They defined an “adjacent matrix” to describe the wholecircuit configuration. The adjacent matrix expresses the connec-tions among tubes and greatly improves the flexibility of simula-tion method. Jiang et al. [25] introduced a very similar idea called“junction-tube connectivity matrix” into their model to representvarious circuits. Differing from the adjacent matrix, this onedescribes circuit by the connections between junctions and tubes.The software named CoilDesigner for heat exchanger simulationand design based on this method was developed. Singh [26,27]et al. made a further contribution to this method by takingaccount of the fin conduction and shapes in their model.
In all the researches mentioned above, only the works of Liuet al. [24] and Jiang et al. [25] have a better flexibility in handlingcircuit configuration. According to the descriptions of references[24,25], their methods can deal with almost any complex circuitconfiguration. However, the solving approaches of them aredifferent. In the method of Jiang et al. [25] a series of equations foreach “junction” are derived according to the circuit configuration,and all unknown variables are calculated by solving these equationssimultaneously. In the method of Liu et al. [24] the computationprocedure is directly dependent on the circuits, and each unknownvariable is always calculated out by upstream known variables. Theformer can be regarded as an “implicit” method, and the latter canbe thought as an “explicit” one. The explicit solution procedure isdirectly dependent on the circuit arrangement while the relation-ship between implicit solution process and circuit arrangement isnot so obvious. However, in the method of Liu et al., the compu-tations of heat transfer and pressure drop, which are dependent oneach other, are carried out completely independently. The tubesolving sequences for heat transfer and pressure drop are evendifferent. The simulation exactitude is then questionable, especiallyfor the identification of the phase change region and the determi-nation of heat transfer and pressure drop therein.
In this paper, firstly a general data structure of circuit configu-ration is introduced to describe any complex circuit configurationthat could be found in a heat exchanger. Compared with the matrixexpression method, the circuit express and the flow trace of thepresent method are more direct and convenient for readers tofollow. Then a general solution procedure for performance simu-lation of plate fin-and-tube heat exchangers is presented. Similar to
the approach of Liu et al., the solution procedure is also explicit. Theoriginal contribution of the present one is that, differing from theapproach of Liu, in this procedure the heat transfer and pressure dropare calculated simultaneously and corrected for each other in everystep, according to the same solving sequence for both heat transferandpressuredropwhich isdeterminedautomaticallywith thehelpofthe data structure. This guarantees the consistency between heattransfer and pressure drop calculations. Furthermore, performancesimulation software with friendly graphic interface based on thisprocedure is developed. It greatly facilitates the works of circuitdesign, data input andoutput,performancepredictionandalterationsof different fins, tubes and refrigerants. All of these features arefavorite to obtain a better circuit design which is helpful to reduceenergyconsumption, to increase theenergyefficiencyand todecreasethe cost in manufacturing plate fin-and-tube heat exchangers.
2. Model and approach
2.1. Element model and assumptions
For investigating the performance of a heat exchanger in detail,the entire heat exchanger (Fig. 1(a)) is first discretized intoa number of elements indicated by tube number TN and elementnumber EN (Fig.1(b)). Each element is composed of part of tube andits associated fins, and can be analyzed as an independent smallcross flow heat exchanger using local parameter values shown inFig. 2. Such an analysis element can be used for both condenser andevaporator, and for the evaporator it can be applied for both wetand dry conditions. In addition, either e-NTU method or LMTDmethod [28,29] can be adopted. All of these ensure the flexibility ofelement analysis.
The main assumptions made in the model are as follows:
1. The overall heat transfer process is in steady state;2. The axial heat conduction in tube wall is neglected;3. The tubes are adiabatic in the part of return bends and branch
joints (split and merger);4. The thermal resistance of tube wall is neglected;5. The frontal air flowing direction is vertical to the heat
exchanger air inlet face;
It is to be noted that the first four assumptions are very goodapproximations to the practical situation. For example we haveestimated the axial heat conduction in tubewith some practical air-conditioning heat exchanger test data and found that this amountof heat conduction is always less then 0.05% of the heat transferbetween fluid and air within the same length of tube. The lastassumption is adopted simply because that reliable correlations inheat transfer and friction factor are not available in the literatures,otherwise this assumption can be removed. Also should beemphasized here is that the heat transfer between neighboringtubes through connected fin surface is taken into consideration andthe details will be described later.
2.2. Element solution
2.2.1. Element inlet parametersIn refrigerant side, each continuous tube is consisted bya series of
computational element from the tube inlet to outlet. For eachelement the refrigerant outlet parameters serve as the inlet param-eters of the next element. And the inlet parameters of the firstelement in a tube are equal to the tube inlet values. The outletparameters of the last one are equal to the tube outlet values.
In air side the inlet and outlet connection is a bit morecomplicated than that of tube side. It should be divided into two

Fig. 1. Heat exchanger discretized model.
W.K. Ding et al. / Applied Thermal Engineering 31 (2011) 3106e31163108
cases: in-line tube arrangement and staggered arrangement, asshown in Fig. 3. For the in-line tube arrangement (Fig. 3(a)), theinlet parameters of an element are simply given by the air outletvalues of the previous element; while for the staggered tubearrangement (Fig. 3(b)) the air inlet values should take theweighted-average of the outlet values of the previous neighboringtwo elements. They are:8>>>><>>>>:
_mair;e1 ¼ �_mair;e2 þ _mair;e3
��2
Pair;e1 ¼ �Pair;e2 þ Pair;e3
��2
Hair;e1 ¼ �Hair;e2 _mair;e2 þ Hair;e3 _mair;e3
��_mair;e1
dair;e1 ¼ �dair;e2 _mair;e2 þ dair;e3 _mair;e3
��_mair;e1
(1)
2.2.2. Element heat transferAccording to the model assumptions, the total thermal resis-
tance of an element can be given as follows:
Rele ¼ 1kAtub;o
¼ 1hhoAair
þ 1hiAtub;i
(2)
where the air side heat transfer coefficient (HTC) ho is dependent onfin geometry structure and air velocity; the refrigerant side HTC hi
Fig. 2. Single computational element.
depends on tube type, flow regime and refrigerant properties; k isthe element overall heat transfer coefficient based on the temper-ature difference. The two HTCs should be calculated by usingcorresponding correlations [2,8,10,11,13,15].
The element heat exchange can be directly calculated by e-NTUmethod [25e27]:
fele ¼ e�_mcp�min
�Th;in � Tc;in
�(3)
or computed by LMTD method in an iteration way [25e27]:
fele ¼ kAtub;ojDTLMTD (4)
The air outlet parameters of element are determined by:
fele ¼ _mair�Hair;in � Hair;out
� ¼ _maircp�Tair;in � Tair;out
�(5)
And the refrigerant outlet parameter is calculated by:
fele þ fcdct ¼ _mref
�Href ;in � Href ;out
�(6)
where fcdct is the heat conductions between neighboring tubeelements through fins. It is calculated by Fourier law, for which thetemperature difference of refrigerants in two neighboring elementsis taken as the temperature difference of heat conduction due to thenegligible tube wall thermal resistance.
When air side heat transfer surface is at a temperature belowthe water vapor dew point, moisture condensation occurs. Underthis wet condition, the heat transfer is driven by enthalpy
Fig. 3. Air flows in two tube arrangements.

Fig. 4. Phase change interface determine process.
W.K. Ding et al. / Applied Thermal Engineering 31 (2011) 3106e3116 3109
difference instead of temperature difference, and the thermalresistance is given as follows [31,32]:
Rele ¼ 1kwetAtub;o
¼ bref ;whwethwet;oAair
þ bw;air
hwet;iAtub;i(7)
where kwet is the element overall heat transfer coefficient based onthe enthalpy difference, hwet,i is calculated as the same as hi of drycondition, and hwet,o is air side heat transfer coefficient under wetcondition which can be calculated by correlations proposed in[3e5].
The heat transfer can be calculated by log-mean enthalpydifference (LMED) method proposed by Threlkeld [32], which issimilar to LMTD:
fele ¼ kwetAtub;ojDHLMED (8)
The outlet parameter values of moist air can be determined byusing process/conditioning line equation [31,32] to deal with thevariations of humidity with enthalpy changes of moist air, which isa piece-wise linear approximation approach based on energyconservation and state equations. All the computation results inthis paper are carried out by using e-NTU method.
2.2.3. Element pressure dropAir side pressure drop is primarily caused by the flowing friction
and the variation of flow cross-section area, and can be expressedby following equation [29,30]:
DPair ¼G2air;c
2rair;in
"Aairrair;inAcrair;m
fair þ�1þ s2
� rair;inrair;out
� 1
!#(9)
Refrigerant side pressure drop can be divided into three parts:
DPref ¼ DPf þ DPa þ DPg (10)
where DPf, DPa, DPg, are the friction term, the acceleration term andthe gravitational term, respectively. They can be determined asfollows:
DPf ¼ 4fref
�LeleDi
� G2
2rref ;m
!(11)
DPa ¼ G2
1
rref ;out� 1rref ;in
!(12)
DPa ¼ rref ;mgLelesin q (13)
The friction factors in air side and refrigerant side, fair and fref,can be calculated by appropriate correlations [2e16].
2.2.4. Element with refrigerant phase change interfaceFor the plate fin-and-tube heat exchangers used in air-condi-
tioning and refrigeration, tube side phase change of refrigerantoccurs in the most part of the tube. In the entire tube side there arethree state regions of refrigerant: gas region, liquid region and two-phase region. In the different regions different correlations shouldbe adopted. However, when discretize tube into elements, there isno way to directly locate the phase change interface. In most cases,there are often some elements covering two different phaseregions. These elements should be identified by checking outletparameters in computation [25].
Take a condenser tube element for an instance. If the inletrefrigerant is in the gaseous state, first assume that there is no phasechange in it and compute the outlet parameters: enthalpy Hout and
pressure Pout. Then check the enthalpy Hout with saturated vaporenthalpy Hsat corresponding to the pressure Pout. If Hout>Hsat, itindicates that the outlet refrigerant is still in the gas region and nophase region changed in the element. If Hout¼Hsat, it says that theelement outlet is exactly the interface of refrigerant converting fromthe gas region into the two-phase region. IfHout<Hsat, it means thatthe outlet refrigerant has been in the two-phase region and theinterface of the two different phase regions is in this element.
For element containing two-phase regions, it should be dealt astwo consecutive sub-elements that are divided by the convertinginterface. A practical way to locate the interface is the repeated 1/2sub-division method which is described as follows.
Still taking a condenser tube element for an instance, as shownin Fig. 4, it contains a phase change interface of refrigerant from gasregion into two-phase region. If the element length equals Lele,there is 0< Linter< Lele, where Linter is the phase change interfaceposition. We take [0, Lele] as an initial sub-dividing region. The Lintercan be determined by following procedure: first assume the phasechange interface at the middle position Lmid of the sub-dividingregion. Similar to identifying the outlet state presented above, frominlet to the middle position, solve heat transfer and pressure dropequations, respectively, to obtain the enthalpy Hmid and pressurePmid. Then also check the enthalpy Hmid with saturated vaporenthalpy Hsat corresponding to the pressure Pmid. If Hmid<Hsat, itmeans that themiddle position locates in the two-phase region, andthen return to first step with a half sub-dividing region [0, Lmid]. IfHmid>Hsat, repeat steponewithahalf sub-dividingregion [Lmid, Lele].
An exact interface position can be obtained by repeating abovetwo steps until Hmid¼Hsat within an allowed tolerance. Accordingto the authors practice, however, it is not necessary. It is accurateenough to set a fixed iteration time, say three times as shown inFig. 4, and the approximate interface position is in the middle of thesub-dividing region in the last time. The error caused by thisapproximation can be estimated by Eq. (14):
dL < 0:5nþ1Lele (14)
wheren is the last iterationnumber. This inequalitycanbeobtainedasfollows. Taking an element with length of Lele for instance, after nsearching steps, we can get a reduced region of 0.5nLele covering theactual interface location. If taking the middle point of the reducedregion as the computational interface location, it is obvious that thedifferencebetweenthecomputationalandactual locations is less thenthehalf of reduced region. That is dL < 0:5� Lreduced ¼ 0:5nþ1Lele. Sofor the iteration of three times the interface position error of elementin Fig. 4 is less than 1/16 element length.
For the element covering several refrigerant phase regions, theair-side computations are also implemented in corresponding sub-dividing parts. And the air outlet parameter of the element is anaverage of each part results.
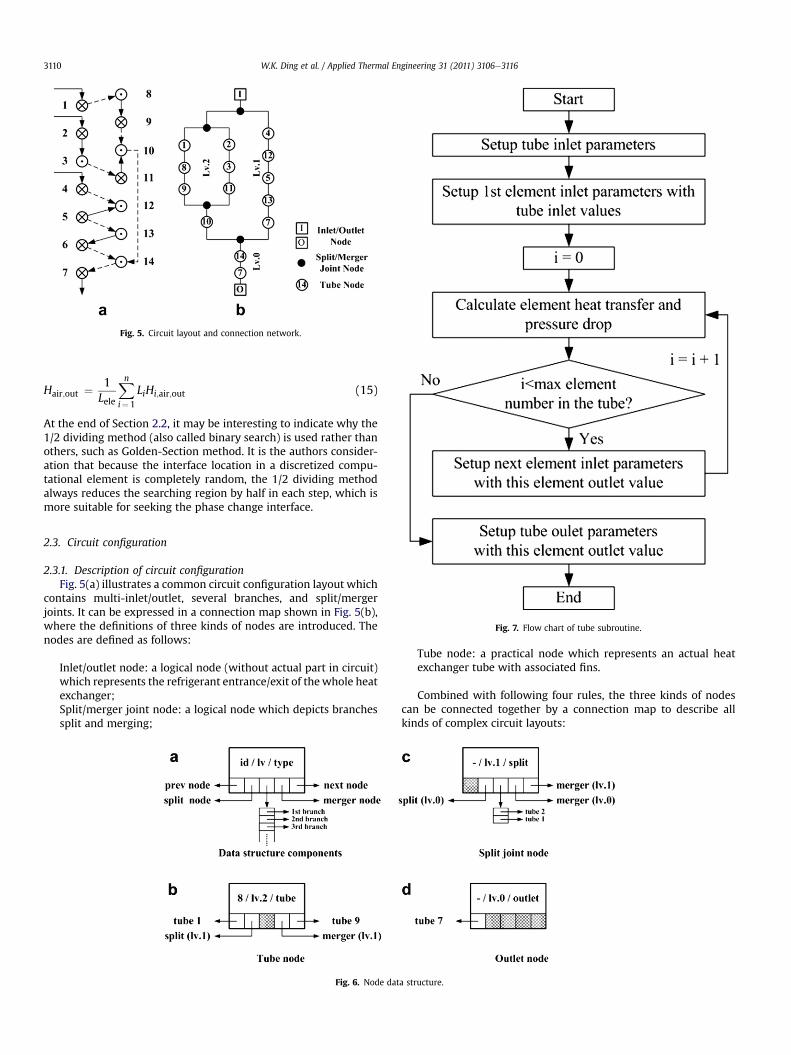
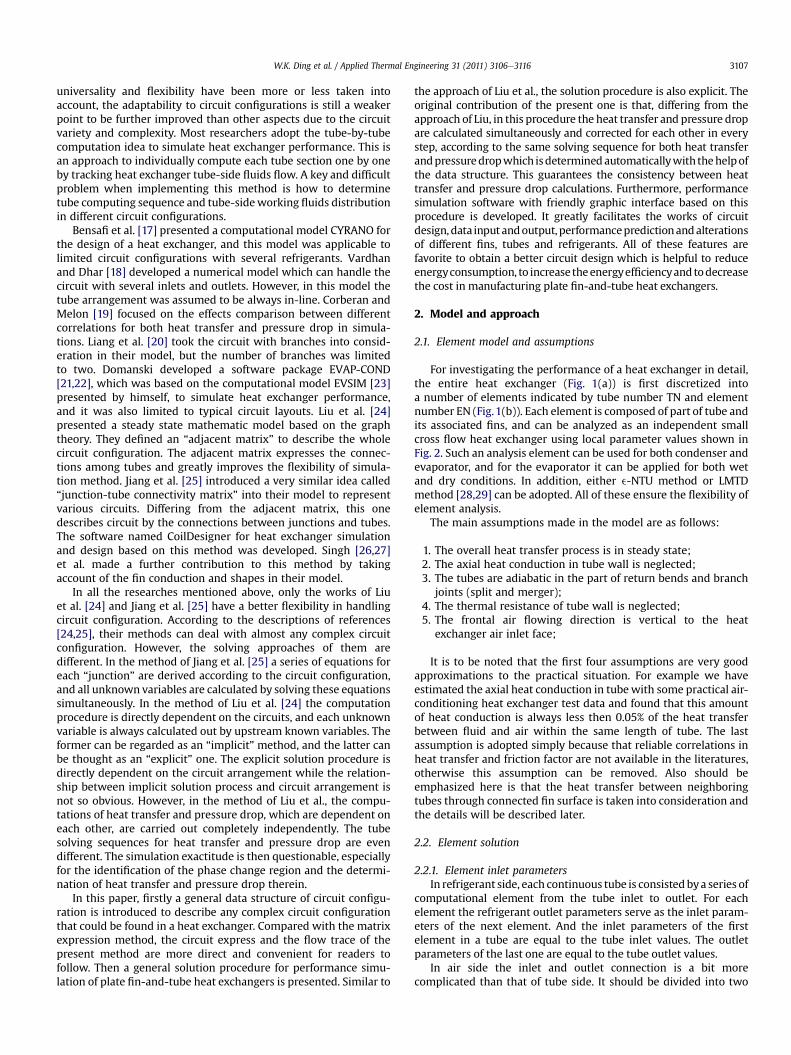
Fig. 5. Circuit layout and connection network.
W.K. Ding et al. / Applied Thermal Engineering 31 (2011) 3106e31163110
Hair;out ¼ 1Lele
Xni¼1
LiHi;air;out (15)
At the end of Section 2.2, it may be interesting to indicate why the1/2 dividing method (also called binary search) is used rather thanothers, such as Golden-Section method. It is the authors consider-ation that because the interface location in a discretized compu-tational element is completely random, the 1/2 dividing methodalways reduces the searching region by half in each step, which ismore suitable for seeking the phase change interface.
Fig. 7. Flow chart of tube subroutine.
2.3. Circuit configuration
2.3.1. Description of circuit configurationFig. 5(a) illustrates a common circuit configuration layout which
contains multi-inlet/outlet, several branches, and split/mergerjoints. It can be expressed in a connection map shown in Fig. 5(b),where the definitions of three kinds of nodes are introduced. Thenodes are defined as follows:
Inlet/outlet node: a logical node (without actual part in circuit)which represents the refrigerant entrance/exit of thewhole heatexchanger;Split/merger joint node: a logical node which depicts branchessplit and merging;
Fig. 6. Node dat
Tube node: a practical node which represents an actual heatexchanger tube with associated fins.
Combined with following four rules, the three kinds of nodescan be connected together by a connection map to describe allkinds of complex circuit layouts:
a structure.

Fig. 8. Flow chart of branch subroutine.
Fig. 10. Wall temperature prediction and comparison for refrigerant mass flux of300 kg/(m2.s).
W.K. Ding et al. / Applied Thermal Engineering 31 (2011) 3106e3116 3111
1. The connection map has only one inlet node and one outletnode. Multi-inlet can be viewed as branches split at refrigerantentrance, andmulti-outlet can be counted as branches mergingat exit.
2. The joint nodes should appear in pairs of split and merger. Asplit joint node has one previous-node and more than two
Fig. 9. Wall temperature prediction and comparison for refrigerant mass flux of100 kg/(m2.s).
next-nodes, and correspondingly a merger joint node has onenext-node and at least two previous-nodes.
3. Tube node has only one previous-node and one next-node, andis set to different levels. The tube level indicates the number oftimes that the refrigerant flow is split. The tube nodes withdifferent level cannot be directly connected together.
4. A branch flow starts from a nodewhose previous-node is a splitjoint, and ends to a node whose next-node is a merger joint(i.e., branch 4-12-5-13-7 in Fig. 5(b)). A branch can also containother branches. As shown in Fig. 5(b) branch 1-8-9, branch2-3-11 and a higher level node 10 compose another branch.
2.3.2. Data structureFor realizing the circuit description motioned above by code,
a data structure of nodes is designed by a class of Cþþ language,and the defining code is:
Fig. 11. Tested condenser circuit configuration.

Table 1Structure parameters of tested condenser.
Parameter Value Parameter Value
Tube length 385 mm Bottom wall thickness 0.34 mmTube outer diameter 5.00 mm Tooth depth of microfin 0.20 mmAir side fin pitch 1.40 mm Number of microfin 40Air side fin thickness 0.105 mm Addendum angle of microfin 40�
Vertical tube spacing 19.0 mm Helical angle of microfin 18�
Horizontal tube spacing 11.0 mm
W.K. Ding et al. / Applied Thermal Engineering 31 (2011) 3106e31163112
class CNode {
public:
int id, lv, type;
CNode* pbranch;
CNode* pnext, pprev;
CNode* psplit, pmerge;
};
In the above code, integer id and lv are node id number andlevel, respectively. Integer type indicates the node type: 0 is tubenode, �1 is (split/merger) joint node, and �2 is inlet/outlet node.Pointers pnext/pprev record the same level upstream/downstreamnode. Pointers psplit/pmerge save the split/merger joint nodeswhich are the branch start/end nodes. Pointer pbranch is a dynamicarray, and it is only available for split/merger joint node to hold allthe sub-branch start/end information. The nodes connect to eachother to realize any circuit configuration in computer in the formsimilar to linked list or multi-way tree.
Fig. 6(a) illustrates the components of a node data structure andthe three different types of node data structures shown in thecircuit of Fig. 6(b), (c), (d).
It is worth noting that the proposed circuit configurationdescription (i.e., circuit identification) and the data structure forrealizing such identification is a new approach totally differentfrom traditional graphic theory or adjacent matrix method inprevious literatures, and is more direct, convenient and flexible toconstruct any complicated circuit configuration.
2.4. Node solution
The performance simulation is always started from the inletnode, carried on tube node by tube node and ended to the outletnode.
Because all tube connection parts of a heat exchanger (i.e.,returned bends) are assumed to be adiabatic, no heat transfer iscomputed between two tube nodes connected by a bend, while thepressure drop caused by friction and local resistance still need to becalculated by appropriate correlations.
2.4.1. Tube node and merger joint nodeThe solution process of a tube node is quite straightforward. For
heat transfer either e-NTU or LMTD method can be used to obtainthe outlet temperatures (enthalpies) from the inlet parameters, and
Table 2Working conditions of tested and simulated cases.
WA-1 WA-2 WA-3 WA-4 WA-
Frontal air velocity (m/s) 2.0 2.3 2.5 2.8 3Atmospheric pressure (kPa) 102.6 102.2 102.1 101.9 102Refrigerant mass flow rate (g/s) 12.1 14.3 13.4 14.2 14Refrigerant inlet pressure (kPa) 1943 1943 1943 1943 1943
the air-side and refrigerant side pressure drop can be determinedby using appropriate correlations according to mass flow rate andfin/tube configurations.
For a merger joint node, because all the inlet (branch outlet)parameters are known, it can be computed easily by followingequations:
8>>>>>>><>>>>>>>:
_mref ;merger ¼ Pni¼1
_miref ;branch
Href ;merger ¼ Pni¼1
_miref ;branchH
iref ;branch;out=
_mref ;merger
Pref ;merger ¼ Pni¼1
Piref ;branch;out=n
(16)
The key issue is how to distribute the mass flow rate for a split jointnode.
2.4.2. Refrigerant flow distribution for a split joint nodeWhen refrigerant flows pass through a split joint node, the
branch split occurs and the following equations are used to deter-mine the distributed refrigerant mass flow rate and stateparameters:
8>>>>>>><>>>>>>>:
_mref ;split ¼ Pni¼1
_miref ;branch
Tref ;split ¼ T1ref ;branch;in ¼ / ¼ Tnref ;branch;in
Href ;split ¼ H1ref ;branch;in ¼ / ¼ Hn
ref ;branch;in
Pref ;split ¼ P1ref ;branch;in ¼ / ¼ Pnref ;branch;in
(17)
The refrigerantmass flow rate of each branch _miref ;branch depends on
the pressure balance among each branch outlet, and it can bedetermined by an iteration procedure as follows.
First set each branch with a supposed mass flow (uniformdistribution is the easiest way), and calculate every branch outletpressures.
Second find out the maximal and the minimal outlet pressuresPmaxref ;branch;out; P
minref ;branch;out, and the absolute value of the difference
between the two outlet pressures:
DPref ;branch;out ¼Pmax
ref ;branch;out � Pminref ;branch;out
(18)
Eq. (18) indicates the greatest imbalance of flow distribution amongthe branches. Obviously themass flows of the two branches need tobe adjusted firstly.
Third, reduce the mass flow of the branch with Pmaxref ;branch;out by
a small value D _mref , while increase the mass flow of the branchwith Pmin
ref ;branch;out by D _mref for the mass conservation. Then recal-culate the difference of two branch outlet pressuresDP0ref ;branch;out. IfDP0ref ;branch;out < DPref ;branch;out, it means that the flow imbalance islightened, and then return to second step to restart a new adjust-ment for all branches; otherwise it shows an over correction ofmass flow, and theD _mref should be reduced (usually a half value) fora readjustment of the two branches till get a smallerDP0ref ;branch;out.The initial reduction/change small value D _mref can be given like:
5 WA-6 WB-1 WB-2 WB-3 WB-4 WB-5 WB-6
.0 3.5 1.5 1.5 1.5 1.5 1.5 1.5
.6 101.0 103.0 102.6 102.5 102.4 100.6 100.4
.5 15.1 11.7 13.6 15.5 17.0 19.6 22.01943 2033 2127 2224 2324 2428 2534

Table 3Comparison of experimental and predicted results.
Cases Heat capacity Refr. outlet temp. Refr. outlet pres. Air outlet temp. Air pressure drop
Expe. (W) Pred. (W) Error (%) Expe. (�C) Pred. (�C) Error (%) Expe. (kPa) Pred. (kPa) Error (%) Expe. (�C) Pred. (�C) Error (%) Expe. (Pa) Pred. (Pa) Error (%)
WA-1 2229 2243 0.63 44.17 45.01 1.90 1895 1908 0.69 43.3 40.5 �6.47 40.0 42.5 6.25WA-2 2390 2567 7.41 43.89 48.77 11.12 1889 1888 �0.05 42.9 40.4 �5.83 48.7 55.2 13.35WA-3 2503 2507 0.16 43.99 44.31 0.73 1892 1899 0.37 42.6 39.7 �6.81 55.1 64.5 17.06WA-4 2643 2633 �0.38 43.79 43.69 �0.23 1884 1896 0.64 42.3 39.4 �6.86 65.1 79.7 22.43WA-5 2735 2724 �0.40 43.54 43.36 �0.41 1872 1893 1.12 41.9 39.2 �6.44 72.6 90.7 24.93WA-6 2862 2863 0.03 43.61 42.38 �2.82 1878 1889 0.59 41.4 38.8 �6.28 91.6 112.1 22.38WB-1 2112 2153 1.94 46.27 45.85 �0.91 1994 2002 0.40 45.3 42.2 �6.84 27.4 24.8 �9.49WB-2 2438 2444 0.25 47.85 48.03 0.38 2075 2085 0.48 47.0 43.2 �8.09 27.2 24.8 �8.82WB-3 2699 2722 0.85 49.72 49.44 �0.56 2157 2171 0.65 48.3 44.2 �8.49 27.4 24.8 �9.49WB-4 2937 2958 0.72 51.26 49.29 �3.84 2239 2263 1.07 49.7 45.1 �9.26 27.4 24.8 �9.49WB-5 3265 3269 0.12 53.51 53.69 0.34 2345 2344 �0.04 51.5 46.4 �9.90 27.4 24.8 �9.49WB-6 3568 3551 �0.48 55.15 55.80 1.18 2433 2429 �0.16 53.0 47.5 �10.38 27.4 24.8 �9.49
W.K. Ding et al. / Applied Thermal Engineering 31 (2011) 3106e3116 3113
D _mref ¼ 12
0@ _mPmin
ref ;branch � DPref ;branch;outPminref ;branch;in � Pmin
ref ;branch;out
þ_mPmax
ref ;branch � DPref ;branch;outPmaxref ;branch;in � Pmax
ref ;branch;out
1A (19)
Fourth, the whole iterative computation is repeated untilDPref ;branch;out is less than a prespecified small value, which meansthat the most imbalance among branches is reduced to an accept-able quantity.
In this paper, the allowable max difference among branch outletpressures is set to be 10 kPa. Since tube-side refrigerant pressureusually is at several MPa, this absolute pressure drop differenceonly leads to about 1% relative differences in pressure and theassociated mass flow rate difference should be regarded acceptablein engineering computation. Furthermore, if a higher accuracy isrequired, the reset of this allowed absolute pressure drop differencein the code is easy to be conducted.
Fig. 12. Condenser circuit configuration.
2.5. Simulation procedure of entire circuit
The main simulation procedure is programmed with twosubroutines: tube subroutine and branch subroutine. The functionsof the two subroutines are described as follows (Fig. 7):
Tube subroutine: computing performances of each element oneby one from the tube inlet element to the outlet element (Fig. 8).
Branch subroutine: conducting from the first node of a branch tothe last node, and computing the performances node by node; fortube node, the tube subroutine is called; For joint node pair (splitand merger), the branch subroutine is called for their sub-branchesand the flow distribution is computed.
It should be noticed that when one node computation isfinished, the next node to be solved can be determined automati-cally according the connections within circuit data structure. Thewhole circuit of a heat exchanger can be regarded as a specialbranch form the inlet node to the outlet node and solved by aniteration using branch subroutine.
It may be noted that above solution procedure, though havingsome common features with the one described in reference [24],solves the fluid temperature and pressure simultaneously, thusovercomes the drawback of solving them independently.
3. Computational examples
To validate the proposed model and the developed code,simulations are first conducted, for example, for which experimentresults are available from literature and our own data. Thenperformance prediction of an actual condenser circuit is conductedand simulation results are discussed.
3.1. Model validation
3.1.1. Validation with literature experiment dataWang et al. [33] carried out a series of experiments on total eight
wavy fin-and-tube condensers with different circuit layouts toinvestigate the effect of circuit on the performance. Two typical
Table 4Condenser structure and simulation conditions.
Parameter Value Parameter Value
Tube length 600 mm Refrigerant R410aTube outer diameter 7.38 mm Frontal air velocity 1.60 m/sFin pitch 0.13 mm Air inlet temperature 35.0 �CFin thickness 0.103 mm Atmospheric pressure 101.3 kPaVertical tube spacing 19.0 mm Refrigerant mass flow rate 1.33 kg/hHorizontal tube spacing 11.0 mm Refrigerant inlet temperature 45 �CFrontal face area 0.3021 m2 Refrigerant inlet pressure 2682 kPa

Fig. 13. Prediction results of condenser.
Fig. 15. Detail results of two tubes.
W.K. Ding et al. / Applied Thermal Engineering 31 (2011) 3106e31163114
circuits of them are simulated by this model. In the simulations, airside heat transfer coefficient and pressure drop are calculated usingthe correlations developed by Wang et al. [34,35], while the tubeside heat transfer coefficient and pressure drop are computed usingcorrelations in [15].
Fig. 14. Thermal resistance analysis.
Figs. 9 and 10 show the comparison of predicted values with theexperiment data of tube wall temperature at different locations forrefrigerant mass flux of 100 kg/(m2.s) and 300 kg/(m2.s), respec-tively. It can be seen that the differences between prediction andtest data are less than 2 �C, demonstrating the reliability andfeasibility of the proposed model and the code developed.
3.1.2. Validation with our own experiment dataSome experimental measurements have been also conducted
in authors’ group on an actual condenser whose circuit configu-ration is shown in Fig. 11. The heat exchanger adopts internalhelical tubes and the structure parameters are given in Table 1. Thecondenser is tested with refrigerant R22 at fixed inlet tempera-tures which are 35 �C for air and 75 �C for refrigerant, respectively.Other operating parameters of different working conditions arelisted in Table 2. The experimental and predicted results arecompared in Table 3.
3.2. Condenser circuit simulation
The circuit of a simulation example of a practical condenser isillustrated in Fig. 12, and its structure and simulation parametersare given in Table 4. It can be seen from Fig. 12 that the refrigerantflow is split at entrance into 4 branches, and then the 4 branchflows merge into one main channel running toward exit.
Fig. 13 shows the simulation results (refrigerant pressure dropand tube heat transfer capacity), where different braches aredistinguished by blue/red colors (For interpretation of the refer-ences to colour in this figure legend, the reader is referred to theweb version of this article). The performance differences between
W.K. Ding et al. / Applied Thermal Engineering 31 (2011) 3106e3116 3115
main channel and branches can be seen clearly. Because the 4branches have the same number of tubes and similar pathlayouts, it is expectable that refrigerant flowing situation in themare quite close to each other, which is confirmed by almost thesame pressure drop distribution in Fig. 13(a). In the aspect of heattransfer, reasonable results are also shown in Fig. 13(b). Forbranches 1e12 and 25e36, the first half-length branch is locatedin the frontal air face, so the heat capacities in the first half-length part are higher than that in the last half-length part. Dueto the same reason, the local heat transfer capacity variations ofbranches 13e24 and 37e48 are basically opposite to that ofbranches 1e12 and 25e36.
Fig. 14 shows the simulation result of thermal resistance of thecondenser. It is indicated that the main resistance of the overallheat transfer process is the tube-side resistance in single phaseregion and that of air side in two-phase region. It can be seen that inthe refrigerant single phase flow region the thermal resistance ofthe tube side is much larger than the air side because of the air sidemuch extended surface.
Fig. 15(a) shows the refrigerant vapor quality and temperatureprofiles in branch 1e12 and 13e24. The variation trends of vaporquality and temperature correspond well to each other in bothsingle and two-phase regions. It can also be noted in Fig. 15(b)(where the scale of the ordinate is magnified) that a slight decrease
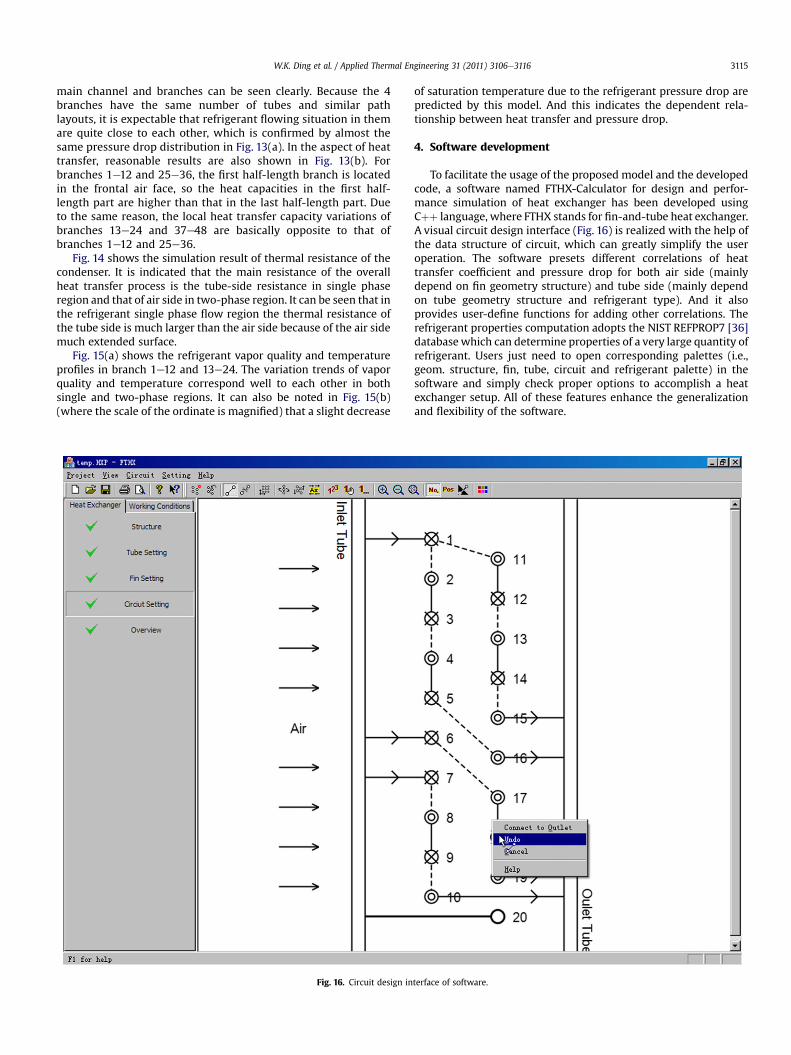
Fig. 16. Circuit design in
of saturation temperature due to the refrigerant pressure drop arepredicted by this model. And this indicates the dependent rela-tionship between heat transfer and pressure drop.
4. Software development
To facilitate the usage of the proposed model and the developedcode, a software named FTHX-Calculator for design and perfor-mance simulation of heat exchanger has been developed usingCþþ language, where FTHX stands for fin-and-tube heat exchanger.A visual circuit design interface (Fig. 16) is realized with the help ofthe data structure of circuit, which can greatly simplify the useroperation. The software presets different correlations of heattransfer coefficient and pressure drop for both air side (mainlydepend on fin geometry structure) and tube side (mainly dependon tube geometry structure and refrigerant type). And it alsoprovides user-define functions for adding other correlations. Therefrigerant properties computation adopts the NIST REFPROP7 [36]database which can determine properties of a very large quantity ofrefrigerant. Users just need to open corresponding palettes (i.e.,geom. structure, fin, tube, circuit and refrigerant palette) in thesoftware and simply check proper options to accomplish a heatexchanger setup. All of these features enhance the generalizationand flexibility of the software.
terface of software.

W.K. Ding et al. / Applied Thermal Engineering 31 (2011) 3106e31163116
5. Conclusions
A general data structure of circuit configurations is developed. Itprovides a uniformdescriptionof different circuit layouts in computerprograms. With the help of the proposed data structure, a generaltube-by-tube simulation procedure for plate fin-and-tube heatexchangerperformance ispresented. It canhandleanycomplexcircuitperformance prediction without manual programming for specificcircuit layout. The reliability of thismodel and thedevelopedprogramcode are confirmed by comparing with experiment results. The codehas also been successfully applied to the performance prediction ofa practical condenser with complex circuit, and the simulated resultsare analyzed. To facilitate the usage of the code, software namedFTHX-Calculator has been developed. It has great flexibility in simu-lationof heat exchangerwithdifferent circuit layouts, and the friendlygraphic user interface significantly facilitates operation.
Acknowledgements
The present work was supported by the Key Project of Funda-mental Research in China (G2007CB206902, G2011CB710702).
References
[1] C.C. Wang, Technology review: a survey of recent patents of fin-and-tube heatexchangers, Journal Enhanced Heat Transfer 7 (2000) 333e345.
[2] C.C. Wang, W.S. Lee, W.J. Sheu, J.S. Liaw, Empirical air-side correlations of fin-and-tube heat exchangers under dehumidifying conditions, InternationalJournal of Heat Exchangers II (2001) 151e178.
[3] C.C. Wang, Y.T. Lin, C.J. Lee, An airside correlation for plain fin-and-tube heatexchangers in wet conditions, International Journal of Heat and Mass Transfer43 (2000) 1869e1872.
[4] C.C. Wang, Y.T. Lin, C.J. Lee, Heat and momentum transfer for compactlouvered fin-and-tube heat exchangers in wet conditions, InternationalJournal of Heat and Mass Transfer 43 (2000) 3443e3452.
[5] C.C. Wang, W.H. Tao, Y.J. Du, Effect of waffle height on the air-side perfor-mance of wavy fin-and-tube heat exchangers under dehumidifying condi-tions, Heat Transfer Engineering 21 (2000) 17e26.
[6] J. Min, R.L. Webb, Numerical predictions of wavy fin coil performance, JournalEnhanced Heat Transfer 8 (2001) 159e173.
[7] W.Q. Tao, Y.P. Cheng, T.S. Lee, The influence of strip location on the pressuredrop and heat transfer performance of a slotted fin, Numerical Heat Transfer,Part A: Applications: An International Journal of Computation and Method-ology 52 (2007) 463e480.
[8] Y.B. Tao, Y.L. He, J. Huang, Z.G. Wu, W.Q. Tao, Numerical study of local heattransfer coefficient and fin efficiency of wavy fin-and-tube heat exchangers,International Journal of Thermal Sciences 46 (2007) 768e778.
[9] L. Tian, Y. He, Y. Tao,W. Tao, A comparative study on the air-side performance ofwavyfin-and-tube heat exchangerwithpuncheddeltawinglets in staggered andin-line arrangements, International Journal of Thermal Sciences 48 (2009)1765e1776.
[10] M.M. Shah, A general correlation for heat transfer during film condensationinsidepipes, International Journal ofHeat andMassTransfer22 (1979)547e556.
[11] K.E. Gungor, R.H.S.Winterton, Ageneral correlation forflowboiling in tubes andannuli, International Journal of Heat and Mass Transfer 29 (1986) 351e358.
[12] D.S. Jung, M. McLinden, R. Radermacher, D. Didion, A study of flow boilingheat transfer with refrigerant mixtures, International Journal of Heat andMass Transfer 32 (1989) 1751e1764.
[13] S.G.Kandlikar,Amodel forcorrelatingflowboilingheat transfer inaugmentedtubesand compact evaporators, ASME Journal of Heat Transfer 113 (1991) 966e972.
[14] M.K. Dobson, J.C. Chato, Condensation in smooth horizontal tubes, ASMEJournal of Heat Transfer 120 (1998) 193e213.
[15] K. Miyara, M. Nonaka, M. Taniguchi, Condensation heat transfer and flowpattern inside a herringbone-type micro-fin tube, International Journal ofRefrigeration 23 (2000) 141e152.
[16] M. Chen, P.W. Li, W.Q. Tao, An experimental investigation on flow boiling heattransfer characteristics of HFC-32/HFC-134a mixtures inside a horizontalsmooth tube, International Journal of Transport Phenomena 2 (2000) 93e101.
[17] A. Bensafi, S. Borg, D. Parent, CYRANO: a computational model for the detaileddesign of plate-fin-and-tube heat exchangers using pure and mixed refrig-erants, International Journal of Refrigeration 20 (1997) 218e228.
[18] A. Vardhan, P.L. Dhar, A new procedure for performance prediction of airconditioning coils, International Journal of Refrigeration 21 (1998) 77e83.
[19] J.M. Corberan, M.G. Melon, Modelling of plate finned tube evaporators andcondensers working with R134A, International Journal of Refrigeration21 (1998) 273e284.
[20] S.Y. Liang, T.N. Wong, G.K. Nathan, Numerical and experimental studies ofrefrigerant circuitry of evaporator coils, International Journal of Refrigeration24 (2001) 823e833.
[21] P.A. Domanski, Finned-tube evaporator model with a visual interface, in:International Congress of Refrigeration 20th. IIR/IIF, Sydney, Australia, 1999, pp.1e7.
[22] P.A. Domanski, EVAP-COND: simulation models for finned tube heatexchangers, National Institute of Standards and Technology, Gaithersburg MD,USA. http://www.nist.gov/el/building_environment/evapcond_software.cfm.
[23] P.A. Domanski, Simulation of an evaporator with non-uniform one-dimen-sional air distribution, ASHRAE Transactions 97 (1991) 793e802.
[24] J. Liu, W. Wei, G. Ding, C. Zhang, M. Fukaya, K. Wang, T. Inagaki, A generalsteady state mathematical model for fin-and-tube heat exchanger based ongraph theory, International Journal of Refrigeration 27 (2004) 965e973.
[25] H. Jiang, V. Aute, R. Radermacher, CoilDesigner: a general-purpose simulationand design tool for air-to-refrigerant heat exchangers, International Journal ofRefrigeration 29 (2006) 601e610.
[26] V. Singh, V. Aute, R. Radermacher, Numerical approach for modeling air-to-refrigerant fin-and-tube heat exchanger with tube-to-tube heat transfer,International Journal of Refrigeration 31 (2008) 1414e1425.
[27] V. Singh, V. Aute, R. Radermacher, A heat exchanger model for air-to-refrig-erant fin-and-tube heat exchanger with arbitrary fin sheet, InternationalJournal of Refrigeration 32 (2009) 1724e1735.
[28] S.M.Yang,W.Q. Tao,HeatTransfer, fourthed.HigherEducationPress,Beijing, 2006.[29] F.P. Incropera, D.P. DeWitt, Heat and Mass Transfer, fifth ed. John Wiley and
Sons, New York, 2002.[30] W.M. Kays, A.L. London, Compact Heat Exchanger, third ed.McGraw-Hill, 1984.[31] C.C.Wang,HeatExchangersDesign,seconded.WunanPublishingCo.,Taipei,2001.[32] J.L. Threlkeld, Thermal Environmental Engineering. Prentice Hall, Inc., New York,
1970.[33] C.C. Wang, J.Y. Jang, C.C. Lai, Y.J. Chang, Effect of circuit arrangement on the
performance of air-cooled condensers. (Effet de la disposition du circuit sur laperformance des condenseurs refroidis par l’air), International Journal ofRefrigeration 22 (1999) 275e282.
[34] C.C. Wang, Investigation of wavy fin-and-tube heat exchangers: a contribu-tion to databank, Experimental Heat Transfer 12 (1999) 73e89.
[35] C.C. Wang, J.Y. Jang, N.F. Chiou, Technical note: a heat transfer and frictioncorrelation for wavy fin-and-tube heat exchangers, International Journal ofHeat and Mass Transfer 42 (1999) 1919e1924.
[36] REFPROP Users' Guide, National Institute of Standards and Technology, Gai-thersburg, MD, USA. http://www.nist.gov/srd/nist23.cfm.
Nomenclature
A: heat transfer area (m2)b: ratio of enthalpy difference to temperature difference (J kg�1 K�1)cp: specific heat (J kg�1 K�1)d: humidity ratio of air (kg kg�1 dry air)f: friction factorG: mass flux(kgm�2 s�1)h: heat transfer coefficient (Wm�2 K�1)k: overall heat transfer coefficient (Wm�2 K�1)L: length (m)_m: mass flow rate (kg s�1)T: temperature (K)H: specific enthalpy (J kg�1)P: pressure (Pa)R: heat transfer resistance (W�1)
Greek symbolsh: combined fin and prime surface efficiencyq: included angle between tube axis-direction and horizontal surface (degree)r: density (kgm�3)s: ratio of minimum flow area to frontal area4: heat transfer rate (W)j: correction coefficient for LMTD or LMED
Subscripts and index setsa: accelerationair: air, air sidebranch: branchc: minimum airflow sectioncdct: heat conductionele: elementf: frictiong: gravitationi: tube insidein: inletinter: interfacemerger: merger joint nodemid: middleo: tube outsideout: outletref: refrigerantsplit: split joint nodetub: tubew: tube wallwet: wet condition
Related Documents