INTRODUCTION There is renewed interest in understanding the organization of the embryonic forebrain. Over the last century, prominent neu- roembryologists have attempted to elucidate the primary forebrain subdivisions and their morphological relationships with more caudal brain parts (reviewed in Keyser, 1972; Puelles and Rubenstein, 1993). However, discrepancies regarding several basic morphological aspects, including the organization of longitudinal domains of the forebrain, has led to divergent conclusions. Recently, the discovery that putative regulatory genes are expressed in regionally restricted patterns in the developing forebrain has provided new tools for defining, at higher reso- lution, histogenetic domains and their boundaries. The gene expression patterns provide tests of the explicit or implicit pre- dictions of the diverse morphological conceptions of forebrain organization. In this essay, we discuss the evidence: (1) that longitudinal zones traverse the forebrain and extend through the midbrain, hindbrain and into the spinal cord; (2) that the neural plate is subdivided by topologically longitudinal and transverse zones of gene expression and (3) that the early longitudinal axonal scaffold generally correlates with the cells that express a par- ticular longitudinal gene marker. HISTORICAL CONCEPTS OF THE LONGITUDINAL AXIS AND ORGANIZATION OF THE FOREBRAIN The complex and dynamic morphology of the developing forebrain has led to multiple interpretations of the longitudinal axis in the forebrain. Some authors who have focused their studies on the closed neural tube have conceived the longitudi- nal axis as a bent line centred in the ventricular lumen. This line has been held to end anteriorly at different positions: the optic recess, lamina terminalis, the neuroporic recess or within the telencephalic vesicle (for example, von Kupffer, 1906; Kuhlen- beck, 1973; Altman and Bayer, 1986, 1995). The abstract nature of this sort of axis limits its usefulness to didactic purposes and to serving as an operational reference for describing planes of section. Other concepts of the longitudinal axis can be based on a topological analysis of the neural plate following the ideas of His (1893) (Fig. 1). In this formulation, the neural plate is organized in symmetric halves relative to a median axial region referred to as the prospective floor plate of the closed neural tube. This region overlies the axial mesodermal organizers (pre- chordal plate and notochord). Within this schema, there are four principal longitudinal zones in the neural plate: the primordia of the floor, basal, alar and roof plates. Different models of the lon- gitudinal organization of the anterior CNS can be represented by different topological arrangements of these zones (Fig. 1). 3923 Review Article Development 121, 3923-3933 (1995) Printed in Great Britain © The Company of Biologists Limited 1995 DEV9406 Over the last century, several morphological models of forebrain organization have been proposed that hypoth- esize alternative topological solutions for the relationships of the histogenic primordia. Central to all of these models are their definitions of the longitudinal axis and the longi- tudinal organization of the neural plate and neural tube. To understand the longitudinal organization of the anterior brain, we have sought to identify molecular properties that are continuous along the entire longitudinal axis of the embryonic CNS. In this essay, we describe studies of the expression of several genes in the mouse between 7.5 (presomite stage) and 10.5 days post coitum (dpc) that provide evidence for the trajectory of the anterior- posterior axis and the longitudinal organization of the anterior CNS. Specifically, we report that the expression of noggin, sonic hedgehog and Nkx-2.2 define longitudinal columns of cells that are present along the entire CNS axis. Within the forebrain, the expression of these genes, as well as that of Nkx-2.1 and BF-1, are in distinct longitudinal regions in the neural plate and tube. We demonstrate that the earliest longitudinal axon pathways of the forebrain are spatially correlated with the longitudinal domain defined by Nkx- 2.2. Finally, expression of the former genes, and Otx-1 and Emx-2, suggests that the cephalic neural plate is organized into molecularly distinct domains delimited by longitudinal and transverse borders; these results provide a foundation for defining the mechanisms that pattern the neural plate. Key words: forebrain, prosencephalon, pattern formation, axis, brain development, hedgehog, homeobox genes SUMMARY Longitudinal organization of the anterior neural plate and neural tube Kenji Shimamura 1 , Dennis J. Hartigan 1 , Salvador Martinez 2 , Luis Puelles 2 and John L. R. Rubenstein 1, * 1 Nina Ireland Laboratory of Developmental Neurobiology, Programs in Developmental Biology and Neuroscience, Center for Neurobiology and Psychiatry, Department of Psychiatry and Langley Porter Psychiatric Institute, University of California, San Francisco, 401 Parnassus Avenue, San Francisco, California 94143-0984, USA 2 Department of Morphological Sciences, Faculty of Medicine, University of Murcia, 30100 Murcia, Spain *Author for correspondence

Welcome message from author
This document is posted to help you gain knowledge. Please leave a comment to let me know what you think about it! Share it to your friends and learn new things together.
Transcript
3923Review ArticleDevelopment 121, 3923-3933 (1995)Printed in Great Britain © The Company of Biologists Limited 1995DEV9406
Longitudinal organization of the anterior neural plate and neural tube
Kenji Shimamura1, Dennis J. Hartigan1, Salvador Martinez2, Luis Puelles2 and John L. R. Rubenstein1,*1Nina Ireland Laboratory of Developmental Neurobiology, Programs in Developmental Biology and Neuroscience, Center forNeurobiology and Psychiatry, Department of Psychiatry and Langley Porter Psychiatric Institute, University of California, SanFrancisco, 401 Parnassus Avenue, San Francisco, California 94143-0984, USA2Department of Morphological Sciences, Faculty of Medicine, University of Murcia, 30100 Murcia, Spain
*Author for correspondence
Over the last century, several morphological models offorebrain organization have been proposed that hypoth-esize alternative topological solutions for the relationshipsof the histogenic primordia. Central to all of these modelsare their definitions of the longitudinal axis and the longi-tudinal organization of the neural plate and neural tube.To understand the longitudinal organization of the anteriorbrain, we have sought to identify molecular properties thatare continuous along the entire longitudinal axis of theembryonic CNS. In this essay, we describe studies of theexpression of several genes in the mouse between 7.5(presomite stage) and 10.5 days post coitum (dpc) thatprovide evidence for the trajectory of the anterior-posterior axis and the longitudinal organization of theanterior CNS.
Specifically, we report that the expression of noggin,
sonic hedgehog and Nkx-2.2 define longitudinal columns ofcells that are present along the entire CNS axis. Within theforebrain, the expression of these genes, as well as that ofNkx-2.1 and BF-1, are in distinct longitudinal regions in theneural plate and tube. We demonstrate that the earliestlongitudinal axon pathways of the forebrain are spatiallycorrelated with the longitudinal domain defined by Nkx-2.2. Finally, expression of the former genes, and Otx-1 andEmx-2, suggests that the cephalic neural plate is organizedinto molecularly distinct domains delimited by longitudinaland transverse borders; these results provide a foundationfor defining the mechanisms that pattern the neural plate.
Key words: forebrain, prosencephalon, pattern formation, axis, braindevelopment, hedgehog, homeobox genes
SUMMARY
INTRODUCTION
There is renewed interest in understanding the organization ofthe embryonic forebrain. Over the last century, prominent neu-roembryologists have attempted to elucidate the primaryforebrain subdivisions and their morphological relationshipswith more caudal brain parts (reviewed in Keyser, 1972;Puelles and Rubenstein, 1993). However, discrepanciesregarding several basic morphological aspects, including theorganization of longitudinal domains of the forebrain, has ledto divergent conclusions.
Recently, the discovery that putative regulatory genes areexpressed in regionally restricted patterns in the developingforebrain has provided new tools for defining, at higher reso-lution, histogenetic domains and their boundaries. The geneexpression patterns provide tests of the explicit or implicit pre-dictions of the diverse morphological conceptions of forebrainorganization.
In this essay, we discuss the evidence: (1) that longitudinalzones traverse the forebrain and extend through the midbrain,hindbrain and into the spinal cord; (2) that the neural plate issubdivided by topologically longitudinal and transverse zonesof gene expression and (3) that the early longitudinal axonalscaffold generally correlates with the cells that express a par-ticular longitudinal gene marker.
HISTORICAL CONCEPTS OF THE LONGITUDINALAXIS AND ORGANIZATION OF THE FOREBRAIN
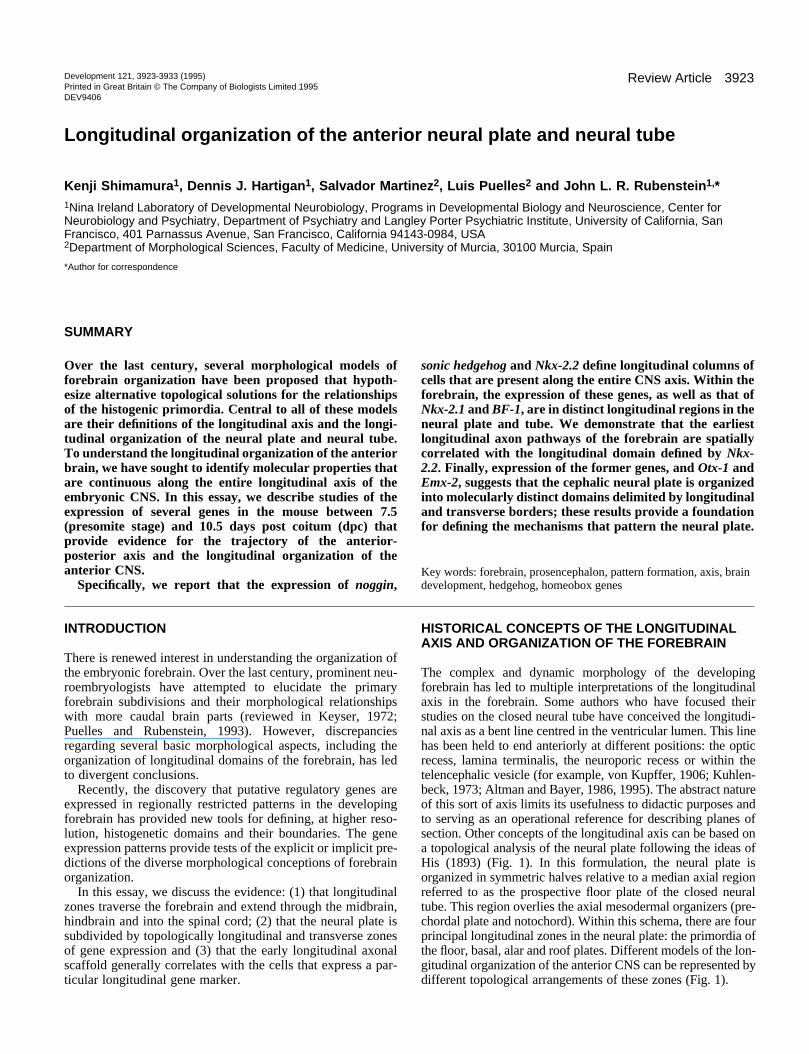
The complex and dynamic morphology of the developingforebrain has led to multiple interpretations of the longitudinalaxis in the forebrain. Some authors who have focused theirstudies on the closed neural tube have conceived the longitudi-nal axis as a bent line centred in the ventricular lumen. This linehas been held to end anteriorly at different positions: the opticrecess, lamina terminalis, the neuroporic recess or within thetelencephalic vesicle (for example, von Kupffer, 1906; Kuhlen-beck, 1973; Altman and Bayer, 1986, 1995). The abstract natureof this sort of axis limits its usefulness to didactic purposes andto serving as an operational reference for describing planes ofsection. Other concepts of the longitudinal axis can be based ona topological analysis of the neural plate following the ideas ofHis (1893) (Fig. 1). In this formulation, the neural plate isorganized in symmetric halves relative to a median axial regionreferred to as the prospective floor plate of the closed neuraltube. This region overlies the axial mesodermal organizers (pre-chordal plate and notochord). Within this schema, there are fourprincipal longitudinal zones in the neural plate: the primordia ofthe floor, basal, alar and roof plates. Different models of the lon-gitudinal organization of the anterior CNS can be represented bydifferent topological arrangements of these zones (Fig. 1).
3924 K. Shimamura and others
Fig. 1. Schemata illustrating basic morphologicallandmarks serving as longitudinal axialreferences, as observed or extrapolated upon theneural plate. The central schema (B) contains theabstract possibilities: Black line = the prospectiveneural tube floor region; intercalated blackdiamonds mark places where the actualepichordal floorplate is thought to terminate(posterior diamond: Model A; middle diamond:Model C; anterior diamond: model of His(1893)); yellow line, the prospective roof plate;red line, the prospective alar/basal limit,illustrating potential ways it ends anteriorly,relative to the floor and roof landmarks; blue, alarplate; orange, basal plate. Note that the red linediverging to the left (into the prospectivediencephalic roof) was only proposed by oneauthor (Rendahl, 1924) and the red lineconverging upon the rostral midpoint of the roofplate anlage represents a theoretical possibilitythat has not been defended by anyone. The other
two lines correspond to schemas A and C. The schema to the left (A) shows one of the main current conceptions, in which the alar/basalboundary does not converge upon the axis of symmetry and extends to the rostral border of the neural plate. Here it would intersect theprospective telencephalic area according to available fate maps. The rostral border of the neural plate would thus theoretically contain distinctportions with basal or alar properties, before passing into the roof plate anlage. The vertically striped line identifies where the anterior-most endof the brain lies in this schema. The schema to the right (C) shows another option, in which the alar/basal limit converges upon the anterior partof the symmetry axis in front of the end of the prospective floor plate and concentric to the roof anlage. The anterior-most end of the brain isrepresented by the horizontally striped line. Even within this sort of conception, variations exist due to options placing the end of the floor plateand/or the point of convergence of the alar/basal boundary at different places.
A C
B
Theoretically, the rostral end of the limit between the alarand basal plates may be conceived in different ways (Fig. 1B),although most models propose that it is either non-convergent(Fig. 1A) or convergent (Fig. 1C) upon the median axis of theneural plate. The non-convergent option extends this boundaryto the anterior border of the neural plate, and implies that basaland alar plates reach the rostral end of the neural plate (Fig.1A). Contrarily, the convergent option implies that the roof,alar and basal plates concentrically cross the midline of theanterior-most neural plate (Fig. 1C).
Each model predicts different arrangements of the longitu-dinal domains as the neural plate develops into the neural tube.One can reduce the main alternatives of the longitudinal organ-ization of the anterior CNS to the three representative options(Fig. 2). Various other elements of each schema (i.e., trans-verse boundaries or ventricular sulci) are left out here forclarity. The arrangement of the primary zones of the neuralplate in Fig. 1A would result in the forebrain organizationshown in Fig. 2A, whereas those in Fig. 1C lead to the modelsshown in Fig. 2B,C.
Model 2A extends the basal plate into the so-called basaltelencephalon. This was chosen by Keyser (1972) and otherscited by him, because of the relatively precocious differen-tiation in the ganglionic eminences in the telencephalon, inaccordance with the proposal of His that basal plate structuresdifferentiate first. Neither Altman and Bayer (1986, 1995) norSwanson (1992) has given specific reasons for their similarchoice. The floor plate is assumed to end at the isthmic fovea,following Kingsbury’s conclusions (Kingsbury, 1920).
Model 2B postulates, contrary to Model 2A, that the basalplate ends with the prerubral tegmentum (PTG). This leavesthe forebrain as an alar plate territory, devoid of floor and basalplates.
Model 2C follows closely the criterium of His (1893) on thebasal plate (Puelles et al., 1987a) and also postulates, contraryto the other models, the more rostral extension of the floorregion, consisting of epichordal and prechordal parts (Puellesand Rubenstein, 1993; Rubenstein et al., 1994).
If any one of these morphological/embryological conceptionsis correct, one expects to find cellular and/or molecular proper-ties that are totally or partially isomorphic with the proposedlongitudinal domains (in the simplest case, from the caudal endof the spinal cord to the rostralmost forebrain). Thus, we soughtto identify molecular charactersistics that are expressed in longitudinal stripes along the anterior-posterior (A-P) axis.
There are several genes that are expressed in longitudinalstripes in different dorsoventral (D-V) positions in the spinalcord that extend into the brain. These include Dbx (Lu et al.,1992), Msx-1 (Hill et al., 1989), Nkx-2.2 (Price et al., 1992),Pax-3, Pax-6, Pax-7 (Stoykova and Gruss, 1994), sonichedgehog (Shh) (Echelard et al., 1993), and Wnt-1, Wnt-3 andWnt-3a (Parr et al., 1993). However, among these, only Shhand Nkx-2.2 extend into the rostralmost areas of the prosen-cephalon. Thus, we chose to study their expression in themouse in detail.
Nkx-2.2 AND Shh ARE EXPRESSED IN PARALLELADJACENT STRIPES ALONG THE ENTIREANTERIOR-POSTERIOR AXIS OF THE CNS
Nkx-2.2 is a homeobox gene (Price et al., 1992), whoseexpression is first detectable at the 1-somite stage in a medianrostral region of the neural plate, just anterior to the underly-ing rostral tip of the notochordal plate (Fig. 3A). Shh (alsoknown as vhh-1) encodes a molecule implicated in floor plateand motor neuron induction (Echelard et al., 1993; Krauss et

3925Longitudinal organization of the brain
Keyser, 1972Swanson, 1992O'Rahilly and Müller, 1994Altman and Bayer, 1995
alar plate
basal plate
roof plate
floor plate
rchchpreoptic
recess
infundibulum
mamillary
prechordal floorand mesoderm
notochord
alar plate
basal plate
roof plate
floor plate
Kingsbury, 1920Herrick, 1933Kuhlenbeck, 1973
alar plate
basal plate
roof plate
floor plate
is
commissuralplate
laminaterminalis
C
A B
Puelles et al., 1987aBulfone et al., 1993Puelles and Rubenstein, 1993Rubenstein et al., 1994Present study
telencephalon
ptg
Fig. 2. Schemata of three main currentmodels of forebrain longitudinalorganization, represented as a medial viewof the embryonic brain. The optic stalkappears as a black oval and black linesindicate the boundary of the telencephalicvesicle and the contour of the ganglioniceminences within it. Yellow = roof plate;blue = alar plate; red = alar/basal boundary;orange = basal plate; green = floor plate;grey textures = prechordal plate mesodermand notochord. The position of thenotochord represents its approximateanterior-most location during ontogeny.Darker shades of the same colours are usedto indicate where the respective zones lieacross the midline. (A) Model defendedamong others by Keyser (1972), Swanson(1992), O’Rahilly and Müller, 1994, andAltman and Bayer (1995). (B) Modelsupported among others by Kingsbury(1920, 1930), Herrick (1933) andKuhlenbeck (1973). (C) Model postulatedby Puelles et al. (1987a), Puelles andRubenstein (1993) and Rubenstein et al.(1994), encompassed within the prosomericmodel. Note that one school holds that thefloor plate ends rostral to the hindbrain(Models A, B; Kingsbury, 1920; Vaage,1969; Kuhlenbeck, 1973), while othershave provided evidence that the floor plateextends to the floor region overlying theanterior end of the notochord (in themammillary area) (Puelles et al., 1987a;Placzek et al., 1993) or suggested that afloor plate-like region extends moreanteriorly overlying the prechordal platemesoderm (Model C). Note that, in ModelA, the optic tract enters the basal plate andcrosses into the alar plate, whereas, inModels B and C, the optic system isentirely in the alar plate. Abbreviations: ch,chiasmatic plate anlage; is, isthmus; ptg,prerubral tegmentum; rch, retrochiasmaticor anterobasal region of the basal plate.
al., 1993; Roelink et al., 1994, 1995; Martí et al., 1995), as wellas ventral forebrain markers (Ericson et al., 1995). Theprevious studies established that it is expressed in a continu-ous stripe in the neural tube, apparently close to the Nkx-2.2stripe. We have extended these studies by comparing Nkx-2.2expression with that of Shh.
Nkx-2.2 and Shh expression patterns define adjacent andnon-overlapping longitudinal neuroepithelial zones that extendalong the entire CNS and end anteriorly, where they cross themidline in the optochiasmatic region (see legend to Fig. 3 fordetails). The spatiotemporal changes in expression patterns ofboth genes are schematically summarized in Fig. 3L.
The D-V position of their expression changes at transitionsbetween major brain regions. In the spinal cord and hindbrain,Shh is expressed in the ventral midline cells (floor plate) andNkx-2.2 is expressed in the adjacent paramedian plate cells(Fig. 3K). At the isthmus (midbrain-hindbrain transition zone),expression of both genes gradually expands dorsally, so that
the Nkx-2.2 and Shh stripes occupy larger ventral portions inthe midbrain and forebrain (Fig. 3J). At the zona limitans, thefuture interthalamic boundary, both genes show a dorsalextention along the boundary that becomes increasinglyprominent from 9.5 dpc (Fig. 3G,H). Unlike in more caudalregions of the CNS, Shh expression in the secondary prosen-cephalon does not extend to the ventral midline (Fig. 3G-I)(Echelard et al., 1993; Roelink et al., 1994).
While there are complexities in these expression patterns(discontinuities, dorsal deflections and a major change in D-Vposition), the basic finding is that the expression of Nkx-2.2and Shh provide evidence for the trajectory of the longitudinalaxis of the CNS and for the continuity of certain longitudinalproperties in two large regions of the CNS (forebrain/midbrainand hindbrain/spinal cord). Similar findings have recently beenreported for these genes in zebrafish (Barth and Wilson, 1995);this study also provided evidence that Shh can regulate Nkx-2.2 expression. In a later section, we address whether the
3926 K. Shimamura and others
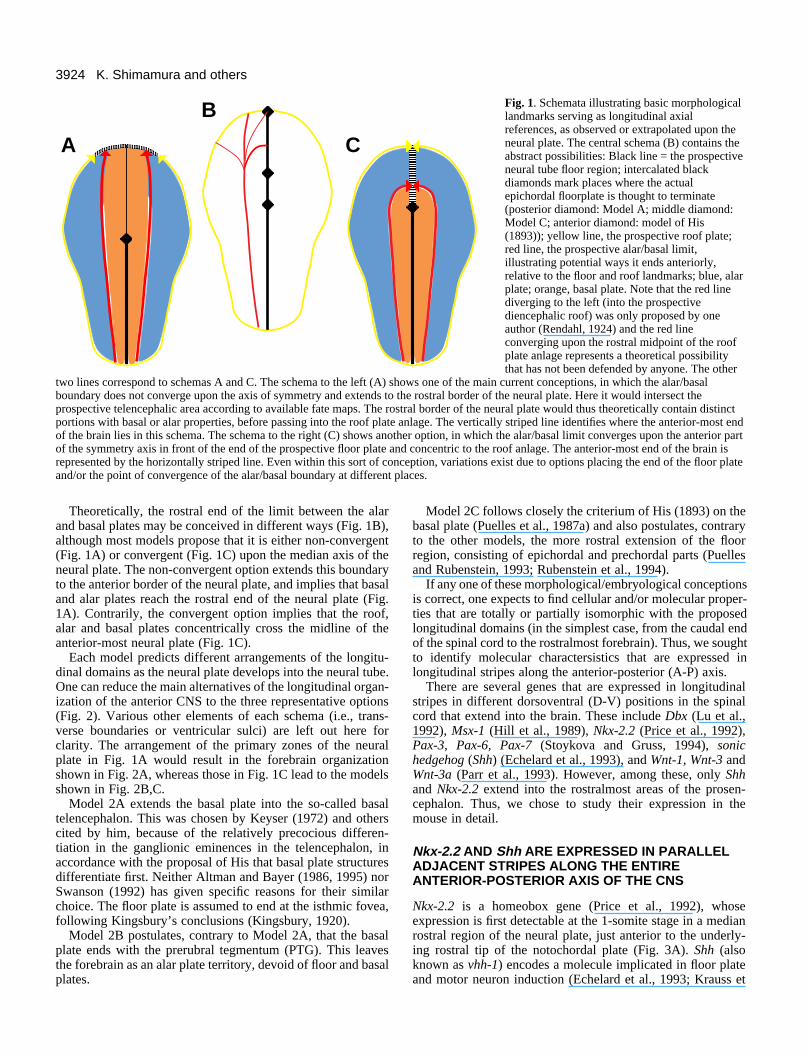
Fig. 3. Expression of Nkx-2.2 andShh define adjacent longitudinaldomains along the entire CNS. (A-C) Dorsorostral views of neuralplate stage embryos; (D-F) lateralviews of neurulation stage embryos;(G-H) mid-sagittal views of thebrain at 10.0 and 11.5 dpc,respectively. (I-K) transversesections at 11.5 dpc. (A) Nkx-2.2 at2 somites; expression begins infront of the head process (smallarrow) and extends near to theanterior edge of the neural plate(arrowhead). Anterior is towardsthe bottom of the panel. (B) Nkx-2.2at 8 somites; bilateral stripes ofexpression cross the midline(arrowhead) and posteriorly end atthe presumptive zona limitans. (C) Shh at 8 somites; transcriptsoccupy a median position of theanterior neural plate, where it formsa narrow loop in the floor of theneural groove (arrowhead). (D) Nkx-2.2 at 11 somites; separatedomains of expression are presentin the forebrain, midbrain/posteriordiencephalon, hindbrain andanterior spinal cord (arrows). (E) Shh at 12 somites; expressionextends from the anterior forebrainto a posterior limit in the anteriorhindbrain. (F-H) Simultaneousdetection of Nkx-2.2 (brown in F,purple in G,H) and Shh (purple in F,brown in G,H) at 13 somites (F),10.0 dpc (G), and 11.5 dpc (H).Both genes are expressed inadjacent domains and cross themidline just ventral to the opticstalk (large arrows in G,H). At 13somites (F), their expression in theprosencephalon is not in adjacentdomains (asterisk), whereas at laterstages they are expressed inadjacent stripes along the entire A-Pextent of the CNS (G-K). Theyhave a dorsal deflection at the zonalimitans (large arrowheads in G,H)and Nkx-2.2 has dorsal deflectionsat the interrhombomeric boundaries(small arrowheads in G). The rostrallimit of Shh expression at theventral midline is marked by anopen arrow in G. Shh expressionalso begins in a separate domain inthe medial ganglionic eminence by9. 5 dpc (small arrows in G,H).Transverse sections demonstratethat the Nkx-2.2 and Shh domainsare adjacent at the level of thepostoptic forebrain (I), caudaldiencephalon (J), and hindbrain andspinal cord (K). The planes ofsection are indicated in G, except for K, which sectioned the spinal cord transversely and the hindbrain at the level of cervical flexure.
3927Longitudinal organization of the brain
prechordalplate/foregut
notochord
anterior posterior
0-4sneuroectoderm
L dorsal (lateral)
ventral (medial)
zl is
10.0 dpc
r2/r3
forebrain midbrain hindbrain spinal cord
5-7s
12s-
8-10s
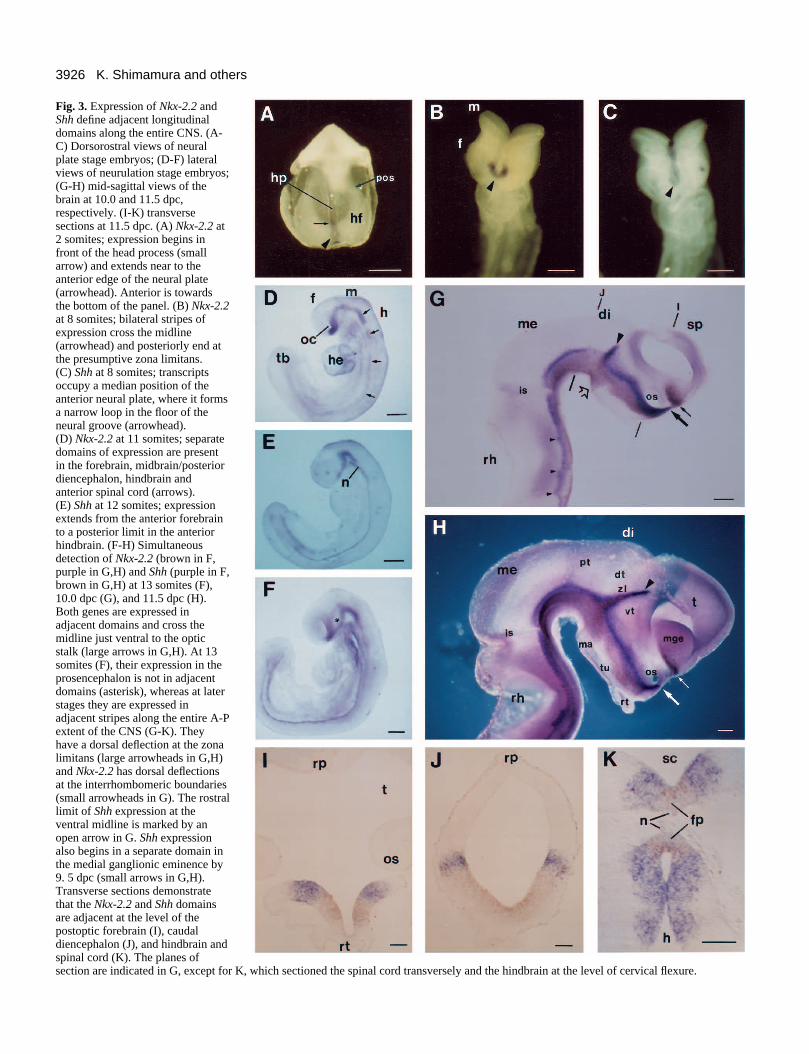
(L) Schematic representation of spatiotemporal changes in Nkx-2.2(red) and Shh (green) expression in the axial mesoderm and theneurectoderm, from early somitic stages to 10.0 dpc. Abbreviations:di, diencephalon; dt, dorsal thalamus; f, forebrain; fp, floor plate; h,hindbrain; he, heart; hf, neural plate; hp, head process; is, isthmus;m, midbrain; ma, mammillary area; me, mesencephalon; mge,medial ganglionic eminence; n, notochord; oc, optic cup; os, opticstalk; pos, postotic sulcus; pt, pretectum; r2/3, rhombomere 2/3boundary; rh, rhombencephalon; rt, Rathke’s pouch; sc, spinal cord;sp, secondary prosencephalon; t, telencephalic vesicle; tb, tailbud; tu,tuberal hypothalamus; vt, ventral thalamus; zl, zona limitans. Scalebars, 200 µm for A-H and 100 µm for I-K. Methods. 2,026 bp ofcDNA encoding murine Nkx-2.2 were isolated and sequenced.Whole-mount in situ RNA hybridization was carried out according toShimamura et al. (1994) and Jowett and Lettice (1994). Aschromogenic substrates for alkaline phosphatase, NBT/BCIP andVector alkaline phosphatase substrate kit II (Vector Laboratories)were used. Stained samples were embedded and sectioned with acryostat at 15 µm.
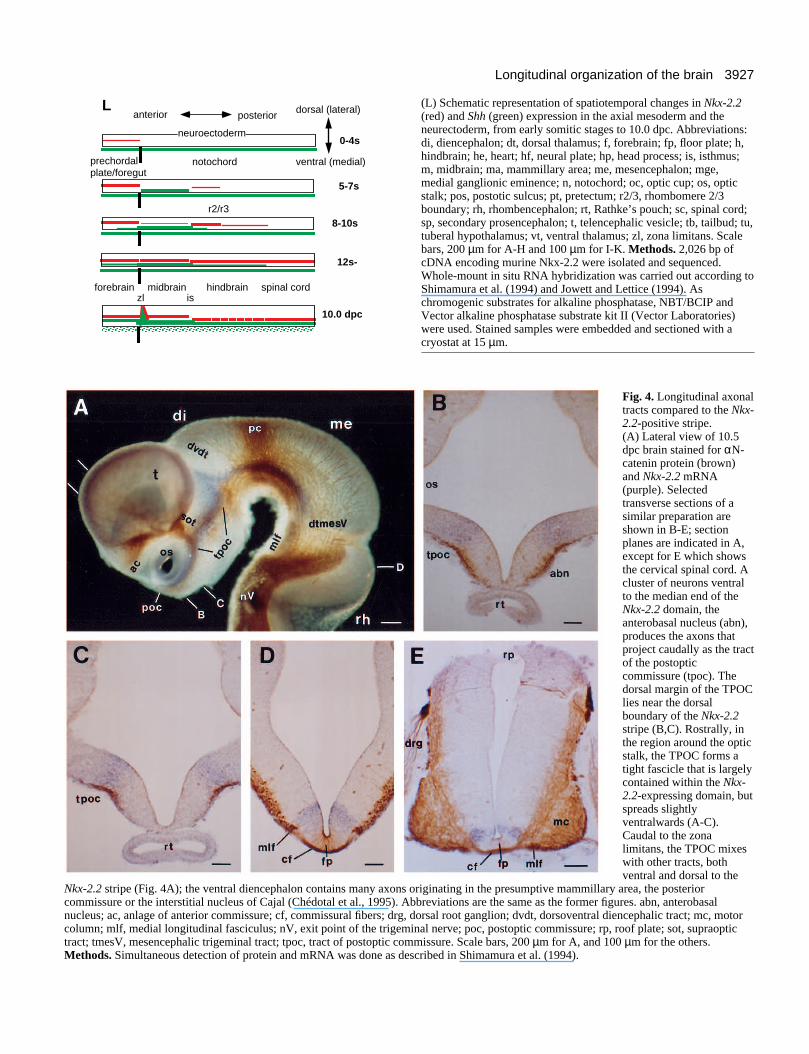
Fig. 4. Longitudinal axonaltracts compared to the Nkx-2.2-positive stripe. (A) Lateral view of 10.5dpc brain stained for αN-catenin protein (brown)and Nkx-2.2 mRNA(purple). Selectedtransverse sections of asimilar preparation areshown in B-E; sectionplanes are indicated in A,except for E which showsthe cervical spinal cord. Acluster of neurons ventralto the median end of theNkx-2.2 domain, theanterobasal nucleus (abn),produces the axons thatproject caudally as the tractof the postopticcommissure (tpoc). Thedorsal margin of the TPOClies near the dorsalboundary of the Nkx-2.2stripe (B,C). Rostrally, inthe region around the opticstalk, the TPOC forms atight fascicle that is largelycontained within the Nkx-2.2-expressing domain, butspreads slightlyventralwards (A-C).Caudal to the zonalimitans, the TPOC mixeswith other tracts, bothventral and dorsal to the
Nkx-2.2 stripe (Fig. 4A); the ventral diencephalon contains many axons originating in the presumptive mammillary area, the posteriorcommissure or the interstitial nucleus of Cajal (Chédotal et al., 1995). Abbreviations are the same as the former figures. abn, anterobasalnucleus; ac, anlage of anterior commissure; cf, commissural fibers; drg, dorsal root ganglion; dvdt, dorsoventral diencephalic tract; mc, motorcolumn; mlf, medial longitudinal fasciculus; nV, exit point of the trigeminal nerve; poc, postoptic commissure; rp, roof plate; sot, supraoptictract; tmesV, mesencephalic trigeminal tract; tpoc, tract of postoptic commissure. Scale bars, 200 µm for A, and 100 µm for the others.Methods. Simultaneous detection of protein and mRNA was done as described in Shimamura et al. (1994).
3928 K. Shimamura and others
nogginBF-1Nkx-2.2Shh
telencephalicvesicle
eye
me
Rathke's pouch
ch
lt
rp
cx
rh
lge
mge
E
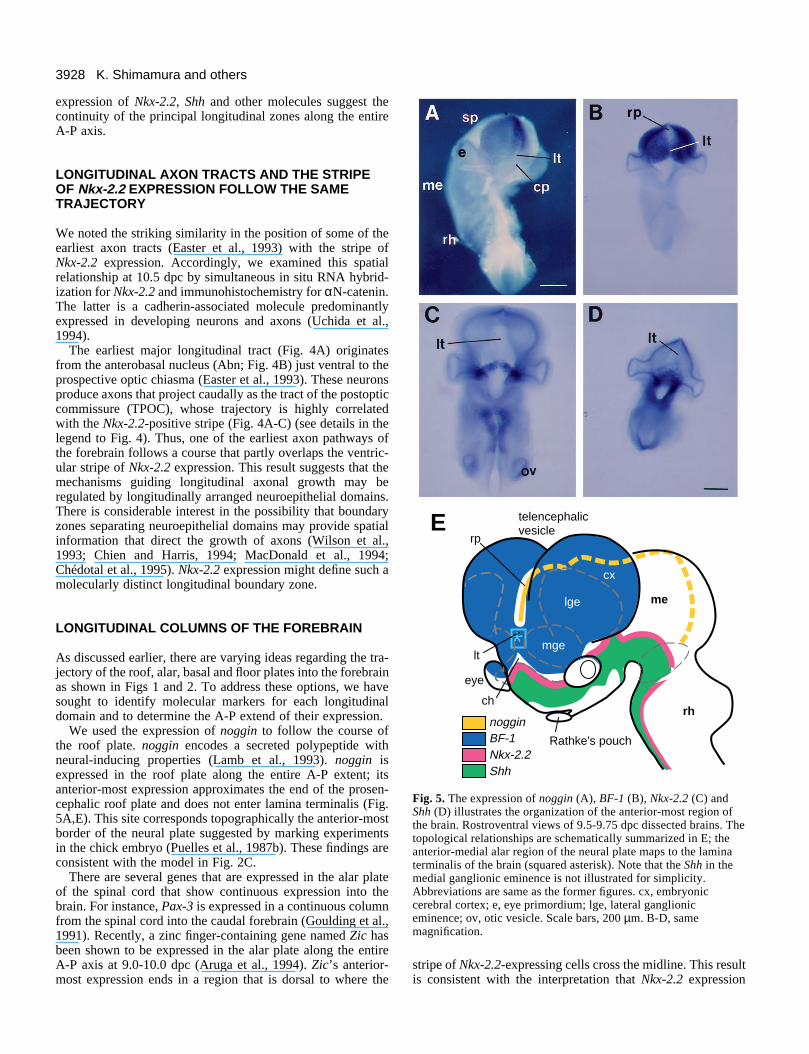
Fig. 5. The expression of noggin (A), BF-1 (B), Nkx-2.2 (C) andShh (D) illustrates the organization of the anterior-most region ofthe brain. Rostroventral views of 9.5-9.75 dpc dissected brains. Thetopological relationships are schematically summarized in E; theanterior-medial alar region of the neural plate maps to the laminaterminalis of the brain (squared asterisk). Note that the Shh in themedial ganglionic eminence is not illustrated for simplicity.Abbreviations are same as the former figures. cx, embryoniccerebral cortex; e, eye primordium; lge, lateral ganglioniceminence; ov, otic vesicle. Scale bars, 200 µm. B-D, samemagnification.
expression of Nkx-2.2, Shh and other molecules suggest thecontinuity of the principal longitudinal zones along the entireA-P axis.
LONGITUDINAL AXON TRACTS AND THE STRIPEOF Nkx-2.2 EXPRESSION FOLLOW THE SAMETRAJECTORY
We noted the striking similarity in the position of some of theearliest axon tracts (Easter et al., 1993) with the stripe of Nkx-2.2 expression. Accordingly, we examined this spatial relationship at 10.5 dpc by simultaneous in situ RNA hybrid-ization for Nkx-2.2 and immunohistochemistry for αN-catenin.The latter is a cadherin-associated molecule predominantlyexpressed in developing neurons and axons (Uchida et al.,1994).
The earliest major longitudinal tract (Fig. 4A) originatesfrom the anterobasal nucleus (Abn; Fig. 4B) just ventral to theprospective optic chiasma (Easter et al., 1993). These neuronsproduce axons that project caudally as the tract of the postopticcommissure (TPOC), whose trajectory is highly correlatedwith the Nkx-2.2-positive stripe (Fig. 4A-C) (see details in thelegend to Fig. 4). Thus, one of the earliest axon pathways ofthe forebrain follows a course that partly overlaps the ventric-ular stripe of Nkx-2.2 expression. This result suggests that themechanisms guiding longitudinal axonal growth may beregulated by longitudinally arranged neuroepithelial domains.There is considerable interest in the possibility that boundaryzones separating neuroepithelial domains may provide spatialinformation that direct the growth of axons (Wilson et al.,1993; Chien and Harris, 1994; MacDonald et al., 1994;Chédotal et al., 1995). Nkx-2.2 expression might define such amolecularly distinct longitudinal boundary zone.
LONGITUDINAL COLUMNS OF THE FOREBRAIN
As discussed earlier, there are varying ideas regarding the tra-jectory of the roof, alar, basal and floor plates into the forebrainas shown in Figs 1 and 2. To address these options, we havesought to identify molecular markers for each longitudinaldomain and to determine the A-P extend of their expression.
We used the expression of noggin to follow the course ofthe roof plate. noggin encodes a secreted polypeptide withneural-inducing properties (Lamb et al., 1993). noggin isexpressed in the roof plate along the entire A-P extent; itsanterior-most expression approximates the end of the prosen-cephalic roof plate and does not enter lamina terminalis (Fig.5A,E). This site corresponds topographically the anterior-mostborder of the neural plate suggested by marking experimentsin the chick embryo (Puelles et al., 1987b). These findings areconsistent with the model in Fig. 2C.
There are several genes that are expressed in the alar plateof the spinal cord that show continuous expression into thebrain. For instance, Pax-3 is expressed in a continuous columnfrom the spinal cord into the caudal forebrain (Goulding et al.,1991). Recently, a zinc finger-containing gene named Zic hasbeen shown to be expressed in the alar plate along the entireA-P axis at 9.0-10.0 dpc (Aruga et al., 1994). Zic’s anterior-most expression ends in a region that is dorsal to where the
stripe of Nkx-2.2-expressing cells cross the midline. This resultis consistent with the interpretation that Nkx-2.2 expression

3929Longitudinal organization of the brain
approximates with the alar/basal boundary of the forebrain, apoint that we address in greater detail below.
The patterns of gene expression also show that the basalplate exhibits both continuous and region-specific molecularproperties along the axis. In the spinal cord, distinct patternsof Lim-homeobox gene expression are correlated with the func-tional organization of the motor columns (Tsuchida et al.,1994). The expression of several of these genes, as well as Wnt-7b (Parr et al., 1993; Shimamura and Rubenstein, data notshown), extends from the basal plate of the spinal cord into thebasal plate of the hindbrain, midbrain, diencephalon and mam-millary area. Other histological markers, such as acetyl-cholinesterase and neuronal birth date measurements showcontinuity of basal plate properties (i.e. early differentiation)along the entire CNS (Puelles et al., 1987a, and referencestherein).
The transition zone between the alar and basal plates of thespinal cord is approximated by a morphological feature namedthe sulcus limitans. There is evidence that cells in this zone havedistinct molecular properties. A homeobox gene named Dbx isexpressed in a longitudinal stripe that is just ventral to the sulcuslimitans (Lu et al., 1992; Shimamura and Rubenstein, data notshown). Dbx expression in this longitudinal column ends in theisthmic region at 9.5 dpc. Nkx-2.2 expression also exhibits adiscontinuity at the isthmus. Posterior to the isthmus, Nkx-2.2is expressed in paramedian stripes that separate the floor platefrom the longitudinal columns of motor neurons (Fig. 3K);anterior to the isthmus, its expression extends to the front of thebrain in a more dorsal position (Fig. 3G-J). Because the Nkx-2.2 stripe is dorsal to the oculomotor nucleus and midbraintegmentum (Fig. 4A), it may correspond to the alar/basalboundary of the midbrain and forebrain.
The floor plate, which is the most ventral longitudinalcolumn in the spinal cord, is specified by the notochord(reviewed in Jessell and Dodd, 1992; Smith, 1993). Previousstudies showed that the floor plate ends at the caudal mam-millary area; this region is near to the anterior end of thenotochord (Puelles et al., 1987a; Hatta et al., 1991; Placzek etal., 1993). It is not established that a floor plate-like structureexists in the anterior forebrain. The prosencephalon rests onprechordal mesendodermal tissues (prechordal plate andforegut) that share some cellular and molecular properties withthe notochordal plate. For instance, cells in the prechordal platehave a distinctive morphology also found in notochordal cells(Sulik et al., 1994). In addition, both the prechordal plate andnotochord express Shh (Echelard et al., 1993), HNF-3β (Sasakiand Hogan, 1993). In fact, the prechordal mesoderm is impli-cated as a possible organizer for the overlying forebrain(Shawlot and Behringer, 1995). While many molecularmarkers of the floor plate do not extend into the secondaryprosencephalon (e.g. FP-3 (Placezk et al., 1993), zn-5 (Hattaet al., 1991)), other molecular properties of the floor plate do,such as expression of Shh (Fig. 3) and HNF-3β (Shimamuraand Rubenstein, data not shown). In addition, the phenotype ofthe zebrafish cyclops mutation, strongly suggests the continu-ity of floor plate properties into the ventral forebrain (Hatta etal., 1994). This raises the possibility that the ventral-mostregion of the prosencephalon shares some properties with theepichordal floor plate.
Based on these findings, we conclude that the prosen-cephalon has longitudinal domains with molecular properties
that can be correlated with the floor, basal, alar and roof plateof more posterior regions of the CNS. The gene expressionpatterns described here cannot be accounted for by Model Aor B in Fig. 2, but are best represented by Model C (see legendto Fig. 7 for additional discussion). In Fig. 2C, we show thetrajectory of the principal longitudinal domains, and theirspatial relationships in the front of the brain, which will bedescribed in greater detail below.
ORGANIZATION OF THE FRONT OF THEEMBRYONIC BRAIN
What happens to the primary longitudinal zones at the anteriorextreme of the CNS? Do they extend to the front of the brain?We have used the expression of several genes as markers foreach of the major longitudinal domains as they project towardsthe front of the brain. For instance, consider the results of Nkx-2.2 expression described in the previous sections. If the linedefined by Nkx-2.2 expression is parallel to the A-P axis of theCNS, then the front of the brain would be in the region of theoptic chiasm, near to where Nkx-2.2 expression begins (Fig.5A,B). To examine this idea in greater detail, we determinedthe region in the prosencephalon, where the roof, alar and basalplates converge, using the expression of noggin, BF-1 (Tao andLai, 1992) and Shh, respectively, as molecular markers forthese longitudinal zones.
The most anterior limit of noggin expression is dorsal to thelamina terminalis and the preoptic recess (Fig. 5A,E). Thetissue just ventral to the noggin-positive roof plate expressesBF-1. The BF-1-expressing domain crosses the midline of theanterior brain (lamina terminalis) and includes the dorsal halfof the chiasmatic plate. Note that the roof plate does notexpress BF-1. The stripe of Nkx-2.2 expression (Fig. 5C) isparallel to the ventral border of BF-1 expression and alsocrosses the anterior midline. The anterior expression of thebasal plate marker (Shh) crosses the midline of the anteriorneural tube just ventral to the stripe of Nkx-2.2 expression.
The topological relationship of these regional markers issummarized in Fig. 5E. Our data supports Model 2C whichhypothesizes that the front of the brain should be conceivednot as a single point, but as a median region where the roofand floor plates end and where the alar and basal plates crossthe midline of the anterior-most part of the brain. To furtheraddress this point, we have investigated the organization of theprimary longitudinal zones in the neural plate.
PATTERNS OF GENE EXPRESSION IN THE NEURALPLATE HAVE LONGITUDINAL AND TRANSVERSEBOUNDARIES
Fate maps of the axolotl, Xenopus and chicken cephalic neuralplate have been reported (Jacobson, 1959; Eagleson and Harris,1990; Couly and Le Douarin, 1988). However, the resolutionof these studies does not clearly establish how the differentprimordia relate topologically to the two axial possibilities inFig. 1A,C (i.e. do they represent longitudinal and/or transversesubdivisions within the anterior neural plate). Gene expressionstudies may prove useful in detecting transverse and longitu-dinal subdivisions of the anterior neural plate. For instance,
3930 K. Shimamura and others
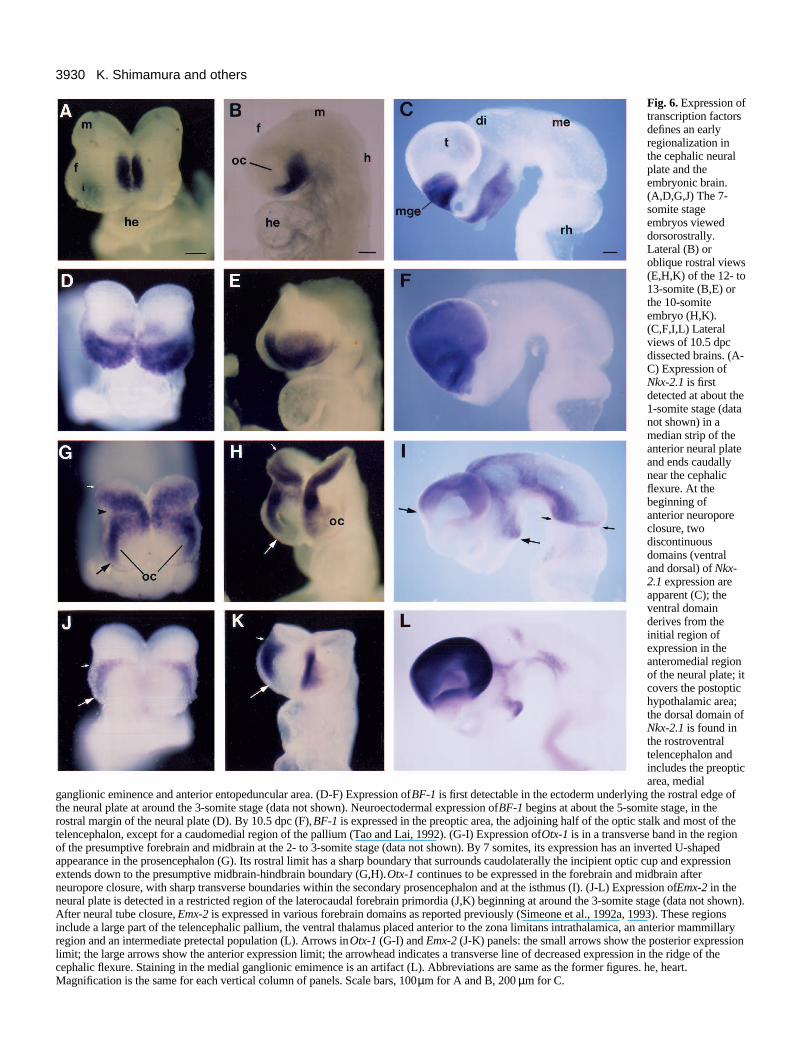
Fig. 6. Expression oftranscription factorsdefines an earlyregionalization inthe cephalic neuralplate and theembryonic brain.(A,D,G,J) The 7-somite stageembryos vieweddorsorostrally.Lateral (B) oroblique rostral views(E,H,K) of the 12- to13-somite (B,E) orthe 10-somiteembryo (H,K).(C,F,I,L) Lateralviews of 10.5 dpcdissected brains. (A-C) Expression ofNkx-2.1 is firstdetected at about the1-somite stage (datanot shown) in amedian strip of theanterior neural plateand ends caudallynear the cephalicflexure. At thebeginning ofanterior neuroporeclosure, twodiscontinuousdomains (ventraland dorsal) of Nkx-2.1 expression areapparent (C); theventral domainderives from theinitial region ofexpression in theanteromedial regionof the neural plate; itcovers the postoptichypothalamic area;the dorsal domain ofNkx-2.1 is found inthe rostroventraltelencephalon andincludes the preopticarea, medial
ganglionic eminence and anterior entopeduncular area. (D-F) Expression of BF-1 is first detectable in the ectoderm underlying the rostral edge ofthe neural plate at around the 3-somite stage (data not shown). Neuroectodermal expression of BF-1 begins at about the 5-somite stage, in therostral margin of the neural plate (D). By 10.5 dpc (F), BF-1 is expressed in the preoptic area, the adjoining half of the optic stalk and most of thetelencephalon, except for a caudomedial region of the pallium (Tao and Lai, 1992). (G-I) Expression of Otx-1 is in a transverse band in the regionof the presumptive forebrain and midbrain at the 2- to 3-somite stage (data not shown). By 7 somites, its expression has an inverted U-shapedappearance in the prosencephalon (G). Its rostral limit has a sharp boundary that surrounds caudolaterally the incipient optic cup and expressionextends down to the presumptive midbrain-hindbrain boundary (G,H). Otx-1 continues to be expressed in the forebrain and midbrain afterneuropore closure, with sharp transverse boundaries within the secondary prosencephalon and at the isthmus (I). (J-L) Expression of Emx-2 in theneural plate is detected in a restricted region of the laterocaudal forebrain primordia (J,K) beginning at around the 3-somite stage (data not shown).After neural tube closure, Emx-2 is expressed in various forebrain domains as reported previously (Simeone et al., 1992a, 1993). These regionsinclude a large part of the telencephalic pallium, the ventral thalamus placed anterior to the zona limitans intrathalamica, an anterior mammillaryregion and an intermediate pretectal population (L). Arrows in Otx-1 (G-I) and Emx-2 (J-K) panels: the small arrows show the posterior expressionlimit; the large arrows show the anterior expression limit; the arrowhead indicates a transverse line of decreased expression in the ridge of thecephalic flexure. Staining in the medial ganglionic emimence is an artifact (L). Abbreviations are same as the former figures. he, heart.Magnification is the same for each vertical column of panels. Scale bars, 100 µm for A and B, 200 µm for C.

3931Longitudinal organization of the brain
Fig. 7. Expression of BF-1,Otx-1, Emx-2, Nkx-2.2, Nkx-2.1 and Shh suggestlongitudinal and transverseorganization in the neuralplate and neural tube.Schematic drawings of geneexpression patterns in thecephalic neural plate at the 7-to 8-somite stage (A), and inthe 10.5 dpc brain (B). Thepresumptive alar/basal limit isshown in red. Note that someof the basal ganglia primordiain the telencephalon expressShh and Nkx-2.1; these genesare also expressed in the basalplate of the secondaryprosencephalon. This impliesthat some of the telencephalicbasal ganglia primordia havebasal plate properties, assuggested in Model 2A.However, expression of Shhand Nkx-2.1 in theseprimordia is a relatively lateevent, which begins after
neural tube formation and is found in tissue (BF-1 positive and lateral to Nkx-2.2) that we suggest originates from the alar region of the neuralplate, consistent with Model 2C. Abbreviations are same as the former figures. ap, alar plate; bp, basal plate; is, isthmus; pr, prosencephalon;r1-7, rhombomeres.
Xash-3 is expressed in longitudinal stripes in the Xenopusneural plate (Zimmerman et al., 1993), and Wnt-1 is expressedin a segment-like domain in the mouse midbrain primordium(Echelard et al., 1994).
To determine whether the forebrain primordium is organizedinto molecularly distinct territories, which may relate to maturestructures, we studied the expression patterns of Nkx-2.1, Nkx-2.2, Shh, Otx-1, Emx-2, noggin and BF-1 beginning at the lateprimitive streak stage up to 10.5 dpc (see legend to Fig. 6 fora more complete description).
Nkx-2.1 encodes a homeodomain-containing transcriptionfactor whose expression in the developing forebrain was firstdescribed by Lazzaro et al. (1991) and Price et al. (1992). Inthe neural plate, it is expressed in an anteromedial domainwhose expression does not extend to the anterior edge of theneural plate. Thus, its expression in the neural plate supportsthe axial conception in Fig. 1C. The other models in Figs 1 and2 do not provide a satisfactory interpretation of the Nkx-2.1pattern and its relationship to the Nkx-2.2 stripe (see Fig. 7A).
Neuroectodermal expression of BF-1 begins at about the 5-somite stage, in the rostral margin of the neural plate (Fig. 6D).The expression domains of Nkx-2.2 and BF-1 do not overlapand both cross the midline of the anterior neural plate (Fig.7A). The BF-1 expression pattern can be conceived of as analar plate marker of the prosencephalon (although not the entirealar plate) and is consistent with the Fig. 1C model.
Otx-1 and Emx-2 encode homeodomain proteins that arehomologues of the Drosophila orthodenticle (otd) and emptyspiracles (ems) genes, respectively, that are expressed inrestricted regions of the developing mid- and forebrain(Simeone et al., 1992a,b; Simeone et al., 1993). We found thatboth genes are expressed in simple patterns in the neural plate.
Otx-1 expression at 7 somites (G) has an inverted U-shapedappearance in the prosencephalic neural plate, which spansalar, basal and floor domains of the neural plate. Its rostralboundary may reflect topological orthogonality to the longitu-dinal axis. Expression of Emx-2 in the neural plate is found inlaterocaudal forebrain primordia beginning at around the 3-somite stage (Fig. 6J).
These results, summarized in Fig. 7, show that the anteriorneural plate is subdivided into molecularly distinct domainsthat express specific combinations of genes. Some of thesedomains have borders that can be interpreted as being parallel(BF-1, Nkx-2.2, Shh and Nkx-2.1) and others perpendicular(Nkx-2.1, Otx-1 and Emx-2) to the longitudinal axis.
MECHANISMS THAT REGULATE THELONGITUDINAL ORGANIZATION OF THE BRAIN
The role of the notochord in D-V patterning of the spinal cordhas now been firmly established (reviewed in Jessell and Dodd,1992; Smith, 1993). In this essay, we discussed the evidencethat the primary longitudinal subdivisions of the spinal cordextend to the front of the brain, implying that axial organizershave some common properties along the entire A-P axis. Therecent finding that Shh can induce ventral neural tube proper-ties at all axial levels is consistent with this hypothesis (Ericsonet al., 1995). Although common properties of the axial meso-dermal tissues can set up the longitudinal organization of theentire CNS, distinct properties remain at different positionsalong the A-P axis.
Two mechanisms have been postulated to regulate region-specific patterning of the longitudinal zones. One mechanism

3932 K. Shimamura and others
(vertical induction model) would be due to spatiotemporal dif-ferences in the patterning signals produced by the axialorganizer tissues: the notochord, prechordal plate and perhapsthe foregut. The other mechanism (planar induction model)would rest upon intrinsic differences in the capacity of the neu-roepithelium to respond to the patterning signals.
Evidence supporting intrinsic differences in the competenceof distinct regions of the neuroepithelium to respond to signalsfrom axial organizers comes from the study of Hynes et al.(1995), who showed that tyrosine hydroxylase can be inducedin the midbrain primordium using notochord pieces taken frommidbrain or spinal cord levels. In addition, the neuroepitheliummay lack competence to respond to signals from axial organ-izers in specific regions, as suggested by the lack of inductionof floor plate markers in the prosencephalon by the notochord(Placzeck et al., 1993).
Evidence supporting regional specification along the A-Paxis via vertical induction comes from the work of Ang andRossant (1993), who showed that the anterior notochord andnot the posterior notochord is capable of inducing theexpression of midbrain markers (En-1 and En-2) in pre- toearly streak ectoderm. In addition, Ang et al. (1994) showedevidence that anterior and posterior axial mesoderm producesignals that induce or repress Otx-2 expression, respectively.More recent studies also support this finding (Pannese et al.,1995; Blitz and Cho, 1995). In addition, mutation of Lim-1homeobox gene leads to complete absence of anterior CNSstructures without affecting caudal CNS structures, possibly bydisrupting the prechordal mesoderm (Shawlot and Behringer,1995). These studies provide evidence that the anteriormesoderm has unique properties that may lead to the inductionof those markers that only appear in the anterior CNS.
Discontinuities in the expression patterns of several genesprovide clues for the position of transitions in the inductiveproperties of axial organizers and/or the competence of theneuroepithelium to respond to these signals. For instance, atthe isthmus and the zona limitans Nkx-2.2 has a gap or a deflec-tion in its expression (Fig. 3G,H). Other genes, such as Shh(Fig. 3G,H), also show abrupt changes in their expression atthese boundary regions. Both the isthmus and zona limitanshave been implicated as functionally significant transitionzones. For instance, transplantation studies have demonstratedthat the isthmus produces morphogenetic factor(s) capable ofplanar patterning of the midbrain (Martinez et al., 1991) andthat the zona limitans serves as a boundary for this inductiveprocess.
Thus, both planar and vertical inductive processes appear tohave roles in region-specific patterning within longitudinalcolumns. Therefore, combinations of these signals can provideadditional complexity to allow for the specification of thediverse tissues of the CNS.
We thank the following people for gifts of probes: Drs R. Harland(noggin), E. Lai (BF-1), A. McMahon (sonic hedgehog), A. Simeone(Emx-2 and Otx-1) and M. Takeichi (αN-catenin). We also acknowl-edge Drs T. Doniach and C.-M. Fan for teaching us the two-color insitu hybridization method, and S. Liu for her technical support. Thiswork was supported by the research grants: to J. L. R. R. from Marchof Dimes, NARSAD, the John Merck Fund, and NIMH RO1MH49428-01, RO1 MH51561-01A1 and K02 MH01046-01, to K. S.from the Ministry of Education, Science and Culture of Japan, to S.M. from European Biotech BIO2-CT93-0012 and NATO, and to L.
P. from Spanish DGICYT PB93-1137 and European Biomed BMH-CT94-1378. K. S. is a recipient of JSPS postdoctoral fellowships forresearch abroad.
REFERENCES
Altman, J. and Bayer, S. A. (1986). The development of the rat hypothalamus.Adv. Anat. Embryol. Cell Biol. 100, 1-177.
Altman, J. and Bayer, S. A. (1995). Atlas of prenatal rat brain development.Boca Raton, Ann Arbor, London, Tokyo: CRC Press.
Ang, S.-L. and Rossant, J. (1993). Anterior mesendoderm induces mouseEngrailed genes in explant cultures. Development 118, 139-149.
Ang, S.-L., Conlon, R. A., Jin, O. and Rossant, J. (1994). Positive andnegative signals from mesoderm regulate the expression of mouse Otx2 inectoderm explants. Development 120, 2979-2989.
Aruga, J., Yokota, N., Hashimoto, M., Furuichi, T., Fukuda, M. andMikoshiba, K. (1994). A novel zinc finger protein, Zic, is involved inneurogenesis, especially in the cell lineage of cerebellar granule cells. J.Neurochem. 63, 1880-1890.
Barth, K. A. and Wilson, S. W. (1995) Expression of zebrafish nk2.2 isinfluenced by sonic hedgehog/vertebrate hedgehog-1 and demarcates a zoneof neuronal differentiation in the embryonic forebrain. Development 121,1755-1768.
Blitz, I. L. and Cho, K. W. (1995). Anterior neurectoderm is progressivelyinduced during gastrulation: the role of the Xenopus homeobox geneorthodenticle. Development 121, 993-1004.
Bulfone, A., Puelles, L., Porteus, M. H., Frohman, M. A., Martin, G. R. andRubenstein, J. L. R. (1993). Spatially restricted expression of Dlx-1, Dlx-2(Tes-1), Gbx-2, and Wnt-3 in the embryonic day 12.5 mouse forebrain definespotential transverse and longitudinal segmental boundaries. J. Neurosci. 13,3155-3172.
Chédotal, A., Pourquié, O. and Sotelo, C. (1995). Initial tract formation in thebrain of the chick embryo: selective expression of the BEN/SC1/DM-GRASP cell adhesion molecule. Eur. J. Neurosci. 7, 198-212.
Chien, C.-B. and Harris, W. A. (1994). Axonal guidance from retina to tectumin embryonic Xenopus. In Current Topics in Developmental Biology. (ed. R.A. Pedersen), pp. 135-169. San Diego, New York, Boston, London, Sydney,Tokyo, Toronto: Academic Press.
Couly, G. and Le Douarin, N. M. (1988). The fate map of the cephalic neuralprimordium at the presomitic to the 3-somite stage in the avian embryo.Development 1988 Supplement 103, 101-113.
Eagleson, G. W. and Harris, W. A. (1990). Mapping of the presumptive brain regions in the neural plate of Xenopus laevis. J. Neurobiol. 21, 427-440.
Easter, S. S. Jr., Ross, L. S. and Frankfurter, A. (1993). Initial tractformation in the mouse brain. J. Neurosci. 13, 285-299.
Echelard, Y., Epstein, D. J., St-Jacques, B., Shen, L., Mphler, J.,McMahon, J. A. and McMahon, A. P. (1993). Sonic hedgehog, a memberof a family of putative signaling molecules, is implicated in the regulation ofCNS polarity. Cell 75, 1417-1430.
Echelard, Y., Vassileva, G. and McMahon, A. P. (1994). Cis-actingregulatory sequences governing Wnt-1 expression in the developing mouseCNS. Development 120, 2213-2224.
Ericson, J., Muhr, J., Placzek, M., Lints, T. Jessell, T. M. and Edlund, T.(1995). Sonic hedgehog induces the differentiation of ventral forebrainneurons: a common signal for ventral patterning within the neural tube. Cell.81, 747-756.
Goulding, M. D., Chalepakis, G., Deutsch, U., Erselius, J. R. and Gruss, P.(1991). Pax-3, a novel murine DNA binding protein expressed during earlyneurogenesis. EMBO. J. 10, 1135-1147.
Hatta, K., Kimmel, C. B., Ho, R. K. and Walker, C. (1991). The cyclopsmutation blocks specification of the floor plate of the zebrafish centralnervous system. Nature 350, 339-341.
Hatta, K., Puschel, A. W. and Kimmel, C. B. (1994). Midline signalling in theprimordium of the zebrafish anterior central nervous system. Proc. Natl.Acad. Sci. USA 91, 2061-2065.
Herrick, C. J. (1933). Morphogenesis of the brain. J. Morphol. 54, 233-258.Hill, R. E., Jones, P. F., Rees, A. R., Sime, C. M., Justice, M. J., Copeland,
N. G., Jenkins, N. A., Graham, E. and Davidson, D. R. (1989). A newfamily of mouse homeobox-containing genes: molecular structure,chromosomal location, and developmental expression of Hox-7.1. GenesDev. 3, 26-37.
3933Longitudinal organization of the brain
His, W. (1893). Vorschlage zur Einteilung des Gehirns. Arch. Anat.Entwicklungsgesch. 17, 172-179.
Hynes, M., Poulsen, K., Tessier-Levigne, M. and Rosenthal, A. (1995).Control of neuronal diversity by the floor plate: contact-mediated inductionof midbrain dopaminergic neurons. Cell 80, 95-102.
Jacobson, C.-O. (1959). The localization of the presumptive cerebral regionsin the neural plate of the axolotl larva. J. Embryol. Exp. Morph. 7, 1-21.
Jessell, T. M. and Dodd, J. (1992). Floor plate-derived signals and the controlof neural cell pattern in vertebrates. Harvey Lecture, 89, 87-128.
Jowett, T. and Lettice, L. (1994). Whole-mount in situ hybridizations onzebrafish embryos using a mixture of digoxigenin- and fluorescein-labelledprobes. Trends Genet. 10, 73-74.
Keyser, A. (1972). The development of the diencephalon of the Chinesehamster. An investigation of the validity of the criteria of subdivision of thebrain. Acta. Anat. 83 (Suppl. 59), 1-178
Kingsbury, B. F. (1920). The extent of the floor-plate of His and itssignificance. J. Comp. Neurol. 32, 113-135.
Kingsbury, B. F. (1930). The developmental significance of the floor plate ofthe brain and spinal cord. J. Comp. Neurol. 50, 177-207.
Krauss, S., Concordet, J. and Ingham, P. W. (1993). A functionallyconserved homolog of the Drosophila segment polarity gene hh is expressedin tissues with polarizing activity in zebrafish embryos. Cell 75, 1431-1444.
Kuhlenbeck, H. (1973). The Central Nervous System of Vertebrates. Vol.3,Part II. Berlin: S. Karger A. G.
Lamb, T., Knecht, A., Smith, W., Stachel, S., Economides, A., Stahl, N.,Yancapolous, G. and Harland, R. M. (1993). Neural induction by thesecreted polypeptide noggin. Science 262, 713-718.
Lazzaro, D., Price, M., De Felice, M. and Di Lauro, R. (1991). The thyroidtranscription factor TTF-1 is expressed at the onset of thyroid and lungmorphogenesis and in restricted region in the foetal brain. Development 113,1093-1104.
Lu, S., Bogarad, L. D., Murtha, M. T. and Ruddle, F. H. (1992). Expressionpattern of a murine homeobox gene, Dbx, displays extreme spatial restrictionin embryonic forebrain and spinal cord. Proc. Natl. Acad. Sci. USA 89, 8053-8057.
Macdonald, R., Xu, Q., Barth, K. A., Mikkola, I., Holder, N., Fjose, A.,Krauss, S. and Wilson, S. W. (1994). Regulatory gene expressionboundaries demarcate sites of neuronal differentiation in the embryoniczebrafish forebrain. Neuron 13, 1039-1053.
Martinez, S., Wassef, M. and Alvarado-Mallart, R.-M. (1991). Induction ofa mesencephalic phenotype in the 2-day-old chick prosencephalon ispreceded by the early expression of the homeobox gene en. Neuron 6, 971-981.
Martí, E., Bumcrot, D. A., Takada, R. and McMahon, A. P. (1995).Requirement of 19K form of Sonic hedgehog for induction of distinct ventralcell types in CNS explants. Nature 375, 322-325.
O’Rahilly, R. and Müller, F. (1994). The Embryonic Human Brain. An atlasof Developmental Stages. New York: Wiley-Liss Inc.
Pannese, M., Polo, C., Andreazzoli, M., Vignali, R., Kablar, B., Barsacchi,G. and Boncinelli, E. (1995). The Xenopus homologue of Otx2 is a maternalhomeobox gene that demarcates and specifies anterior body regions.Development 121, 707-720.
Parr, B. A., Shea, M. J., Vassileva, G. and McMahon, A. P. (1993). MouseWnt genes exhibit discrete domains of expression in the early embryonicCNS and limb buds. Development 119, 247-261.
Placzek, M., Jessell, T. M. and Dodd, J. (1993). Induction of floor platedifferentiation by contact-dependent, homeogenetic signals. Development117, 205-218.
Price, M., Lazzaro, D., Pohl, T., Mattei, M.-G., Rüther, U., Olivo, J.-C. andDuboule, D. (1992). Regional expression of the homeobox gene Nkx-2.2 inthe developing mammalian forebrain. Neuron 8, 241-255.
Puelles, L., Amat, J. A. and Martinez-de-la-Torre, M. (1987a). Segment-related, mosaic neurogenetic pattern in the forebrain and mesencephalon ofearly chick embryos: I. Topography of AChE-positive neuroblasts up tostage HH18. J. Comp. Neurol. 266, 247-268.
Puelles, L., Domenech-Ratto, G. and Martinez-de-la-Torre, M. (1987b).Localization of the rostral end of the longitudinal brain axis: review of an oldtopic in the light of marking experiments on the closing rostral neuropore. J.Morphol. 194, 163-171.
Puelles, L. and Rubenstein, J. L. R. (1993). Expression patterns of homeoboxand other putative regulatory genes in the embryonic mouse forebrainsuggest a neuromeric organization. Trends Neurosci. 16, 472-479.
Rendahl, H. (1924). Embryologische und morphologische Studien über dasZwischenhirn beim Huhn. Acta Zool. 5, 241-344.
Roelink, H., Augsburger, A., Heemskerk, J., Korzh, V., Norlin, S., Ruiz iAltaba, A., Tanabe, Y., Placzek, M., Edlund, T., Jessell, T. M. and Dodd,J. (1994). Floor plate and motor neuron induction by vhh-1, a vertebratehomolog of hedgehog expressed by the notochord. Cell 76, 761-775.
Roelink, H., Porter, J. A., Chiang, C., Tanabe, Y., Chang, D. T., Beachy, P.A. and Jessell., T. M. (1995). Floor plate and motor neuron induction bydifferent concentrations of the amino-terminal cleavage product of Sonichedgehog autoproteolysis. Cell 81, 445-455.
Rubenstein, J. L. R., Martinez, S., Shimamura, K. and Puelles, L. (1994).The embryonic vertebrate forebrain: the Prosomeric model. Science 266,578-580.
Sasaki, H. and Hogan, B. L. M. (1993). Differential expression of multiplefork head related genes during gastrulation and axial pattern formation in themouse embryo. Development 118, 47-59.
Shawlot, W. and Behringer, R. R. (1995). Requirement for Lim1 in head-organizer function. Nature 374, 425-430.
Shimamura, K., Hirano, S., McMahon, A. P. and Takeichi, M. (1994). Wnt-1-dependent regulation of local E-cadherin and αN-catenin expression in theembryonic mouse brain. Development 120, 2225-2234.
Simeone, A., Acampora, D., Gulisano, M., Stornaiuolo, A. and Boncinelli,E. (1992a). Nested expression domains of four homeobox genes indeveloping rostral brain. Nature 358, 687-690.
Simeone, A., Gulisano, M., Acampora, D., Stornaiuolo, A., Rambaldi, M.and Boncinelli, E. (1992b). Two vertebrate homeobox genes related to theDrosophila empty spiracles gene are expressed in the embryonic cerebralcortex. EMBO J. 11, 2541-2550.
Simeone, A., Acampora, D., Mallamaci, A., Stornaiuolo, A., D’Aprice, M.R., Nigro, V. and Boncinelli, E. (1993). A vertebrate gene related toorthodenticle contains a homeodomain of the bicoid class and demarcatesanterior neuroectoderm in the gastrulating mouse embryo. EMBO J. 12,2735-2747.
Smith, J. C. (1993). Dorso-ventral patterning in the neural tube. Curr. Biol. 3,582-585.
Stoykova, A. and Gruss, P. (1994). Roles of Pax-genes in developing andadult brain as suggested by expression patterns. J. Neurosci. 14, 1395-1412.
Sulik, K., Dehart, D. B., Inagaki, T., Carson, J. L., Vrablic, T., Gesteland,K. and Schoenwolf, G. C. (1994). Morphogenesis of the murine node andnotochordal plate. Dev. Dyn. 201, 260-278.
Swanson, L. W. (1992). Brain Maps. Structure of the Rat Brain. Amsterdam:Elsevier.
Tao, W. and Lai, E. (1992). Telencephalon-restricted expression of BF-1, anew member of the HNF-3/folk head gene family in the developing rat brain.Neuron 8, 957-966.
Tsuchida, T., Ensini, M., Morton, S. B., Baldassare, M., Edlund, T., Jessell,T. M. and Pfaff, S. L. (1994). Topographic organization of embryonic motorneurons defined by expression of LIM homeobox genes. Cell 79, 957-970.
Uchida, N., Shimamura, K., Miyatani, S., Copeland, N. G., Gilbert, D. J.,Jenkins, N. A. and Takeichi, M. (1994). Mouse αN-catenin: Two isoforms,specific expression in the nervous system and chromosomal localization ofthe gene. Dev. Biol. 163, 75-85.
Vaage, S. (1969). The segmentation of the primitive neural tube in chickembryos (Gallus domesticus). Ergeb. Anat. Entwicklungsgesch. 41, 1-88.
von Kupffer, K. (1906). Die Morphogenie des Zentralnervensystems. InHandbuch der vergleichenden und experimentellen Entwicklungslehre derWirbeltiere (ed. O. Hertwig), Vol. II, Teil 3. Jena: Gustav Fisher.
Wilson, S. W., Placzek, M. and Furley, A. J. (1993). Border disputes: doboundaries play a role in growth-cone guidance? Trends Neurosci. 16, 316-323.
Zimmerman, K., Shih, J., Bars, J., Collazo, A. and Anderson, D. J. (1993).XASH-3, a novel Xenopus achaete-scute homolog, provides an early markerof planar neural induction and position along the mediolateral axis of theneural plate. Development 119, 221-232.
(Accepted 21 August 1995)
Related Documents