Perception & Psychophysics 2001, 63 (2), 337-347 Beginningwith Weber’s (1834/1996)work on the two- point threshold, a major aim of studies of tactile spatial sensitivity has been to correlate psychophysical results with underlying neural structures. Initially, these at- tempts were qualitativein nature, but recent neurophys- iological and psychophysical studies have allowed more quantitative comparisons to be made. Neurophysiologi- cal studies have clarified the nature and functioning of mechanoreceptors, particularly in glabrous skin. Several lines of evidencepointto the existenceof four types of pe- ripheral fibers that respond to mechanical stimuli (Bolanowski, Gescheider, Verrillo, & Checkosky, 1988). The fiber types are classified according to their responses to transient and sustained stimuli and to the size of their receptive fields. Two of the four types of fibers convey spatial information, slowly adapting Type I (SAI) and rapidly adapting (RA). The fiber types, presumed mech- anoreceptors (Merkel disks for SAI fibers and Meissner corpuscles for RA fibers), and central connections are referred to as the SAI and RA receptor systems. Although both neurophysiological and psychophysical evidence supports the view that the SAI and RA systems are re- sponsible for conveying spatial information, it appears that the finest spatial patterns are conveyed by the SAI system (Greenspan & Bolanowski, 1996; Johnson & Hsiao, 1992; Johnson, Hsiao, & Twombly, 1995; Phillips & John- son, 1981). These studies of the functioning of the SAI and RA systems can be combinedwith estimates of the density of innervation to provide quantitative predictions about spa- tial resolution.Investigators—Johansson and Vallbo (1979) with human subjects and Darian-Smith and Kenins (1980) with monkeys—have classified, counted, and estimated the number and type of nerve fibers innervating the glabrousskin of the finger and, with human subjects, por- tions of the hand as well. On the basis of these results, in- vestigators have estimated that the density of innervation is approximately one afferent per square millimeter for both SAI and RA systems (Johnson et al., 1995). One of the aims of the present study was to compare neurophysiological results with measures of spatial sen- sitivity. The two-point threshold has been widely used in past studies; however, several recent articles have dis- cussed the problems with the two-point threshold as a measure of spatial resolution (Craig & Johnson, 2000; Johnson, Van Boven, & Hsiao, 1994). These articles have pointed out that there are two forms of the two-point threshold, subjective and objective. The subjective form is the more commonly used form. In it, subjects are pre- sented two points of stimulation and asked to judge whether they feel two points or a single point. This method is subject to serious criterion problems and extreme within- and between-subjects unreliability. In one study the threshold for responding “two” decreased by more than a factor of five over the course of a month of testing. 337 Copyright 2001 Psychonomic Society, Inc. This research was supported by the National Institutes of Health Grant DC00095, National Institute on Deafness and Other Communi- cation Disorders. We thank Roger Rhodes for his assistance in these ex- periments. Correspondence should be addressed to J. C. Craig, Depart- ment of Psychology,1101 E. 10th St., Indiana University, Bloomington, IN 47405-7007(e-mail: [email protected]). A comparison of tactile spatial sensitivity on the palm and fingerpad JAMES C. CRAIG and KEITH B. LYLE Indiana University, Bloomington, Indiana Studies of tactile spatial pattern perception have, for the most part, been carried out using the fin- gerpad. On the basis of these studies, models have been developed linking spatial pattern identifica- tion and resolution with underlying neural structures. It has been suggested that with appropriate scal- ing, these models would apply to the processing of spatial patterns presented to other sites on the body. Spatial sensitivitywas examined on another site on the body, the palm, using two measures, letter iden- tification and grating orientation. The results from these measures were compared with results from similar studies conducted on the fingerpad and with estimates of the density of innervation of the fin- gerpad and palm. To produce levels of performance similar to those on the fingerpad required letters on the palm 50 mm in height, seven to nine times larger than those used on the fingerpad. Gratings had to be six to more than seven times larger on the palm to produce the same levels of performance achieved on the fingerpad. For the two types of receptor systems sensitive to spatial information, the ratio of density of innervation between the fingerpad and the palm is estimated to be 5.7: 1 and 8.8: 1. Performance of spatial tasks on the palm can be predicted quantitatively from fingerpad data with a moderate degree of accuracy. Qualitative comparisons between the palm and fingerpad data indicate that spatial patterns are processed similarly at the two sites.

Welcome message from author
This document is posted to help you gain knowledge. Please leave a comment to let me know what you think about it! Share it to your friends and learn new things together.
Transcript
Perception & Psychophysics2001, 63 (2), 337-347
Beginningwith Weber’s (1834/1996) work on the two-point threshold, a major aim of studies of tactile spatialsensitivity has been to correlate psychophysical resultswith underlying neural structures. Initially, these at-tempts were qualitative in nature, but recent neurophys-iological and psychophysical studies have allowed morequantitative comparisons to be made. Neurophysiologi-cal studies have clarified the nature and functioning ofmechanoreceptors, particularly in glabrous skin. Severallines of evidencepoint to the existenceof four types of pe-ripheral f ibers that respond to mechanical stimuli(Bolanowski, Gescheider, Verrillo, & Checkosky, 1988).The fiber types are classified according to their responsesto transient and sustained stimuli and to the size of theirreceptive fields. Two of the four types of fibers conveyspatial information, slowly adapting Type I (SAI) andrapidly adapting (RA). The fiber types, presumed mech-anoreceptors (Merkel disks for SAI fibers and Meissnercorpuscles for RA fibers), and central connections arereferred to as the SAI and RA receptor systems. Althoughboth neurophysiological and psychophysical evidencesupports the view that the SAI and RA systems are re-sponsible for conveying spatial information, it appearsthat the finest spatial patterns are conveyed by the SAI
system(Greenspan & Bolanowski,1996; Johnson & Hsiao,1992; Johnson,Hsiao, & Twombly, 1995;Phillips& John-son, 1981).
These studies of the functioning of the SAI and RAsystems can be combined with estimates of the density ofinnervation to provide quantitative predictions about spa-tial resolution. Investigators—Johanssonand Vallbo (1979)with human subjects and Darian-Smith and Kenins (1980)with monkeys—have classified, counted, and estimatedthe number and type of nerve f ibers innervating theglabrous skin of the finger and, with human subjects, por-tions of the hand as well. On the basis of these results, in-vestigators have estimated that the density of innervationis approximately one afferent per square millimeter forboth SAI and RA systems (Johnson et al., 1995).
One of the aims of the present study was to compareneurophysiological results with measures of spatial sen-sitivity. The two-point threshold has been widely used inpast studies; however, several recent articles have dis-cussed the problems with the two-point threshold as ameasure of spatial resolution (Craig & Johnson, 2000;Johnson, Van Boven, & Hsiao, 1994). These articles havepointed out that there are two forms of the two-pointthreshold, subjective and objective. The subjective formis the more commonly used form. In it, subjects are pre-sented two points of stimulation and asked to judgewhether they feel two points or a single point.This methodis subject to serious criterion problems and extremewithin- and between-subjects unreliability. In one studythe threshold for responding “two” decreased by morethan a factor of five over the course of a month of testing.
337 Copyright 2001 Psychonomic Society, Inc.
This research was supported by the National Institutes of HealthGrant DC00095, National Institute on Deafness and Other Communi-cation Disorders. We thank Roger Rhodes for his assistance in these ex-periments. Correspondence should be addressed to J. C. Craig, Depart-ment of Psychology,1101 E. 10th St., Indiana University,Bloomington,IN 47405-7007 (e-mail: [email protected]).
A comparison of tactile spatialsensitivity on the palm and fingerpad
JAMES C. CRAIG and KEITH B. LYLEIndiana University, Bloomington, Indiana
Studies of tactile spatial pattern perception have, for the most part, been carried out using the fin-gerpad. On the basis of these studies, models have been developed linking spatial pattern identifica-tion and resolution with underlying neural structures. It has been suggested that with appropriate scal-ing, these models would apply to the processing of spatial patterns presented to other sites on the body.Spatial sensitivitywas examined on another site on the body, the palm, using two measures, letter iden-tification and grating orientation. The results from these measures were compared with results fromsimilar studies conducted on the fingerpad and with estimates of the density of innervation of the fin-gerpad and palm. To produce levels of performance similar to those on the fingerpad required letterson the palm 50 mm in height, seven to nine times larger than those used on the fingerpad. Gratings hadto be six to more than seven times larger on the palm to produce the same levels of performanceachieved on the fingerpad. For the two types of receptor systems sensitive to spatial information, theratio of density of innervation between the fingerpad and the palm is estimated to be 5.7: 1 and 8.8: 1.Performance of spatial tasks on the palm can be predicted quantitatively from fingerpad data with amoderate degree of accuracy. Qualitative comparisons between the palm and fingerpad data indicatethat spatial patterns are processed similarly at the two sites.
338 CRAIG AND LYLE
The situation is not improved by the objective form, inwhich subjects judge whether one or two points were pre-sented to the skin. Here the threshold can be shown to bezero, implying infinite spatial resolution (Craig & John-son, 2000).
The measure of spatial resolution that we used was grat-ing orientation. In this measure, subjects are presentedwith a grating in one of two orientations on the skin. Forexample, on the fingerpad the gratings are presented ineither a proximal-distal orientation or at right angles tothat in the lateral-medial orientation.The subject indicatesthe orientation. The width of the grooves is varied to de-termine a psychometric function. To achieve 75% cor-rect levels of performance requires a groove width of ap-proximately 1 mm on the fingerpad (Johnson & Phillips,1981; Sathian, Zangaladze, Green, Vitek, & DeLong,1997). Grating orientationhas also been used to measuresensitivity on the face (Patel, Essick, & Kelly, 1997;Sathian & Zangaladze, 1996; Van Boven & Johnson,1994a, 1994b) and on several regions of the hand (Craig,1999). In general the results using this measure have shownreasonable correspondence with what is known about thedensity of innervation for the locations tested.
Quite a different task, letter identification, has alsobeen used to measure spatial sensitivityon the fingerpad.The grating orientation task relies on devising stimulithat are identical except for the orientation in which theyare presented to the skin. The letter identification taskuses a large number of stimuli that vary in both intensiveand spatial dimensions. It has been reasoned that thenumber of patterns that must be identified precludes sub-jects using intensive cues and that subjects must rely onspatial cues (Johnson & Phillips, 1981). If the set of pat-terns were limited to two or three letters, subjects mightwell use intensive cues as a basis for their decision. Sub-jects can identify about three levels of intensity with ahigh degree of accuracy (Geldard, 1960). If subjects canidentify individual letters from a set of 26 with a reason-able degree of accuracy, it is likely that they are doing iton the basis of spatial information.
Johnson and Phillips (1981) measured both letteridentification and grating orientation sensitivity on thefingerpad and compared quantitatively the two measuresto one another. Further, they predicted the psychophysi-cal results based on the estimates of the density of inner-vation.They reasoned that if both letter identification andgrating orientation tap spatial mechanisms, then sensi-tivity as determined by the two methods ought to be sim-ilar. Johnson and Phillips assumed that letters could rea-sonably be represented by a 5 3 5 neural matrix, that is,when the height of the letter was approximately equal tothe overall distance between five neural units. They alsoreasoned that gratings could be resolved when the periodof the grating (the distance equal to the groove widthplus the ridge width or, in other words, twice the groovewidth) was equal to the spacing of two neural units.
Johnson and Phillips (1981) generated psychometricfunctions for both grating orientation (percent correct as
a function of spatial period in millimeters) and for letteridentification (percent correct as a functionof letter heightin millimeters). They found agreement between their let-ter identification data and their grating orientation resultswhen the two were scaled in the ratio of 5:2. In subse-quent studies and in the present study, grating orientationresults have been expressed in terms of the width of thegroove rather than the period. Because the ridge width andgroovewidth are identical, the groove width is equal to halfthe period of the grating.Thus, the letter height needed forreasonable levels of performance should be about fivetimes the groove width that can be resolved. What consti-tutes a “reasonable” level of performance? Johnson andPhillips used performance levels halfway between chanceand perfect performance: For grating orientation this is75% correct, for letter identification 52% correct (chanceequals 3.8%). When scaled appropriately, grating orien-tation performance and letter identification are similarwhen compared at these two levels of performances. Onthe basis of these and other results, Johnson and his co-workers (Johnson & Hsiao, 1992; Johnson et al., 1995)have developeda model of spatial pattern perceptionbasedon the quality of the peripheral neural representation.
Loomis (1990) has elaborated on this model with spe-cific reference to visual pattern identification. Both John-son and Loomis agree that the initial stage in processingtactile spatial patterns involvesa low-pass filter. To com-pare visual and tactile processing, one needs to eitherequate for the size of the patterns (very small visual pat-terns and large tactile patterns, Phillips, Johnson, &Browne, 1983) or low-pass f ilter the visual patterns(Loomis, 1990). With these manipulations, performanceshould be equivalent in the two modalities. In a series ofstudies, Loomis (1981, 1982, 1990) measured tactile pat-tern identification and compared it with visual patternidentification of the same set of patterns. The visual pat-terns were low-pass filtered by blurring them. Phillipset al. achieved similar levels of tactile and visual perfor-mance by using very small visual letters. Both proceduresproduced similar results in that the correlation was highbetween letters correctly identified either visually or tac-tually.Also, the types of confusions were similar for boththe visual and tactile patterns.
Loomis (1990) goes on to characterize a second stageof processing. This stage involves a comparison of thetransformed stimulus (low-pass filtered) with templatesof the patterns in the set. Of particular importance for thepresent study is the fact that Loomis makes an explicitprediction about character recognitionat locations on thebody other than the fingerpad: “It is fair to suppose thatcharacter recognition is functionallyequivalent at differ-ent body loci when the stimuli are scaled in size at eachsite in relation to the spatial resolutionat that site” (p. 118).
Nearly all of the results in support of these models ofspatial pattern identificationhave come from studies usingthe distal fingerpad.The fingerpad has been used in mostof the studies of spatial acuity because it is one of themost sensitive areas on the body and because it is the site

TACTILE SPATIAL SENSITIVITY 339
that is most heavily involvedin hapticexploration.As noted,Loomis (1990) has suggested that tactile character recog-nition ought to be the same at other sites as that observedon the fingerpad, provided that the stimuli are adjustedin size appropriately. Also, grating orientation appears tobe an appropriate measure of spatial acuity and ought tovary in the same way as letter identification performance.
In the present study we used previous measures of spa-tial acuity obtained on the distal fingerpad and comparedthese measures with those obtained on another site. Ouraim was to measure spatial acuity using letter identifica-tion and grating orientation tasks at a site for which therewere estimates of the density of innervation. The numberof such possible sites is limited. Density of innervationestimates exist for only three sites—the fingertip, the restof the finger, and the palm. From grating orientationmea-surements made in a recent study (Craig, 1999), it ap-pears that the size of letters needed to achieve reasonablelevels of performance on the more proximal fingerpadswould be too large for the surface area of the pad. Thus,the palm was selected as the site of stimulation. Johans-son and Vallbo (1979) estimated that the ratio of the den-sity of innervation from the fingerpad to the palm for theSAI system is 8.8:1 and for the RA system is 5.7:1. Fromthese estimates, it appears that letters would have to besix to nine times larger when presented to the palm rela-tive to the fingerpad to achieve the same levels of per-formance. For gratings this would be 6–9 mm or more inwidth. From earlier studies, we estimated letters varyingin height from 5.5 to 7.2 mm should produce levels ofperformance from 54% to 60% correct on the fingerpad(Johnson & Phillips, 1981; Loomis, 1981; Phillips et al.,1983). We used letters 50 mm in height, 6.9–9 times largerthan the fingerpad letters.
The present study consisted of two sets of measure-ments, grating orientation sensitivity (Experiment 1) andletter identification (Experiment 2). Both types of mea-surements were carried out on the palm. In addition,grat-ing orientation sensitivity was also measured on the fin-gerpad. The main question was whether spatial patterninformation is processed similarly at two sites that differsubstantially in sensitivity. Specifically, these measure-ments addressed the following questions: Can grating ori-entation performance on the palm relative to the finger-pad be predicted by the changes in density of innervationbetween the two sites? Can letter identification perfor-mance comparable to that obtained on the fingerpad beobtained on the palm when letters are scaled appropri-ately in size? Does grating orientationperformance on thepalm predict letter identification performance?
EXPERIMENT 1
Grating orientation performance was measured on thepalm. Measurements were made both before and aftersubjects received training on a letter identification task(Experiment 2). For purposes of comparison, measure-ments of grating orientationperformance were also madeon the fingerpad.
MethodSubjects. The subjects were 6 Indiana University students, who
were paid for their participation. Four females and 2 males partici-pated in the experiment.
Stimuli. For the grating orientation task, domed, circular con-tactors with square-wave gratings were used. For the palm mea-surements, the contactors were machined at Indiana University foruse in the experiment. Each contactor has a series of alternating,equal-width grooves and ridges cut into it. The depth of the groovesis such that the skin does not touch the bottom of the groove. Thediameter of the contactors was 50 mm. Contactors with grooves offour different widths were used: 10, 8, 6, and 4 mm. Two sets of thefour contactors were machined; the gratings of the one set were off-set from the gratings of the other set by one-half cycle. We wantedto reduce the possibility that subjects might use a cue such as wherea particular ridge or groove contacted the palm. By varying the grat-ings by one-half cycle, the grooves and ridges contacted the skin atdifferent locations. The two sets of contactors were used on alter-nate blocks of trials and produced identical performance. For thefingerpad measurements, a commercially available set of eightdomes was used (JVP Domes, Stoelting). The grooves varied inwidth from 3.0 to 0.35 mm.
Apparatus. In the grating orientation task, the contactors werepresented to the palm by means of a weighted shaft. The contactorwas attached to one end of the shaft and weights were attached tothe opposite end. The combination of the weights, the shaft, and thecontactor produced a force of 190 g. The shaft was held in a metalarm such that the shaft could be smoothly raised and lowered. Whenthreshold was measured on the fingerpad, a force of 100 g was used.
Procedure. Subjects were tested individually. The subject wasseated with his/her right arm extended. The hand was positioned ona padded shelf with the palm facing up. The apparatus was alignedso that the stimuli contacted the skin on the center of the palm. Thecontactor was lowered onto the palm with a force of 190 g. The con-tactor remained in contact with the skin until the subject responded,generally in 1 or 2 sec. The subject was instructed not to move his /herarm or hand so that there was no lateral movement of the contactoracross the palm. Subjects kept their eyes closed during testing.
The contactor was presented with the grating in either theproximal-distal (PD) or the lateral-medial (LM) orientation. Subjectsresponded by indicating the orientation of the grating—proximal orlateral, respectively. Four blocks of trials were completed in eachtesting session. One groove width was tested during each block oftrials. The following groove widths were presented, in order, in eachsession: 10, 8, 6, and 4 mm. On approximately one-half of the trialsthe contactor was presented in the PD orientation, and on the otherhalf the LM orientation was presented. The order of presentationwas determined randomly. Subjects were tested for four sessions.Following letter identification training (Experiment 2), subjectswere again tested for four sessions on the grating orientation task.Five of the six subjects were also tested for four sessions on the fin-gerpad using the same procedure as that used on the palm.
Before each block of trials, subjects performed four practice tri-als with the contactor that was to be tested in that block of trials andwere given feedback as to the correctness of their responses. Dur-ing the experimental trials, no feedback was provided.
ResultsThe percentage correct is plotted as a function of the
log of the groove width (Figure 1). Both the initial andfinal measurements are shown. Data for all 6 subjects arepresented. Two of the 6 subjects were close to chance forboth sets of measurements. Posttraining performance issignificantly better than pretraining performance. Ananalysis of variance (ANOVA) showed a significant ef-fect of pre-/postcondition [F(1,5) = 12.32, p , .05], a

340 CRAIG AND LYLE
significant effect of groove width [F(3,15) = 8.11, p ,.01], but no significant interaction [F(3,15) = 0.07, p ..05] The 75% correct point, which is typically taken asthreshold, is 9.2 mm for the initial measurements anddrops to 7.8 mm for the final measurements. The issue ofthe possiblemechanisms that might account for the changein sensitivitybetween initial and final measurements is ex-amined in the General Discussion. Also, shown for pur-poses of comparison is the psychometric function result-ing from measurements made on the fingerpad. Thesedata were obtained from 5 of the 6 subjects tested on thepalm. The threshold for the fingerpad is 1.25 mm.
DiscussionDepending upon whether one uses the initial or final
threshold estimates from the palm, the ratio of sensitiv-ity between palm and fingerpad is either 7.4:1 or 6.2:1.As noted earlier, the estimated ratio of the density of in-nervation between fingerpad and palm for the SAI systemwas 8.8:1 and for the RA system was 5.7:1. Thus, the ra-tios of sensitivity are within the range predicted by thedensity of innervation.
A major issue is whether spatial patterns are processedsimilarly when presented to different sites on the body.Van Boven and Johnson (1994a) measured grating orien-tation on the lip, tongue, and fingerpad. The thresholds(75% correct) were 0.51 mm on the lip, 0.58 mm on thetongue, and 0.98 mm on the fingerpad, a range of sensi-tivity of about 2:1. The psychometric functions for thethree sites were parallel to one another. Van Boven andJohnson (1994a) concluded that the results indicated thatspatial information is processed similarly at the threesites and that neural mechanisms for these sites are sim-ilar. The change in sensitivity from the fingerpad to thepalm is considerably greater, with the palm six to seventimes less sensitive. Loomis and Lederman (1986) havesuggested that plotting data from different body sites asa function of the log of the spatial dimension should re-sult in parallel functions. The palm functions shown inFigure 1 do appear to parallel the fingerpad function. Todemonstrate this similarity more clearly, we replotted thefingerpad data, multiplying each data point by 7.4 tocompare with the pretesting function, and plotted this re-sult in Figure 2. The fingerpad data were replotted again
Figure 1. Percent correct orientation as a function of groove width. Results are from testing both the fingerpad andthe palm. The palm-pre function represents average performance prior to any training on the letter identificationtask. The palm-post function represents the average of performance following training.

TACTILE SPATIAL SENSITIVITY 341
after multiplying each data point by 6.2 to compare withthe posttesting function. The similarity of the fingerpadand palm functions indicates that even with fairly majorchanges in sensitivity the neural mechanisms underlyingspatial acuity on glabrous skin remain the same.
As noted, there is strong evidence that SAI fibers areresponsible for processing fine spatial information. SAIfibers can convey information about gratings down towidths of approximately1 mm, whereas RA fibers do notrespond to gratings less than 3 mm in width (Phillips &Johnson, 1981).Thus, grating orientationsensitivityon thefingerpad likely depends upon activity in the SAI sys-tem. It is less clear which receptor systems are responsi-ble for conveying spatial information on the palm. Withgrating thresholds greater than 4 mm, it is likely that spa-tial information could be carried by both receptor systems.The estimates of neural density are probably not preciseenough and the psychophysical results not unambiguousenough to state which one of the two receptor systems isconveying the spatial information. However, it does ap-pear that the two systems are not combining their outputsto achieve greater spatial sensitivity. If the output of the
SAI and RA systems were being combined to improve sen-sitivity, the effective density of innervation would nearlydouble on the palm. The grating orientation thresholdswould be considerably lower than were in fact obtained.
EXPERIMENT 2
In Experiment 2, subjects were trained to identify let-ters presented to the right palm. The major question waswhether grating orientation sensitivity, as measured in Ex-periment 1, would predict the performance levels achievedin this quite different measure of spatial sensitivity. Fol-lowing extensive training with the right palm, letter iden-tification was tested on the left palm to see the extent towhich improvements in performance were specific to thesite at which training was conducted.
MethodSubjects. The same subjects who participated in Experiment 1
served as subjects in Experiment 2.Stimuli. The letters used in this task were 50 mm in height and
varied in width from 7 mm (the letter “I”) to 63 mm (the letter “W”).
Figure 2. Percent correct orientation as a function of groove width. Each data point on the fingerpad function fromFigure 1 is replotted and multiplied by two different constant values, 7.4 and 6.2. See text for details. The palm-preand palm-post functions from Figure 1 are presented for comparison.

342 CRAIG AND LYLE
The stroke width for the letters was 7 mm. Each letter was 7 mmthick. Representations of several of the letters are shown in Figure 3.
Apparatus. A device was constructed to present letters to thepalm. The device consisted of a platform on which the subjectrested his/her palm. The palm was positioned over a square open-ing, 7 3 8 cm. Beneath the opening was a holder in which raisedplastic letters were placed. A solenoid was mounted beneath theholder. When the solenoid was activated, it raised the letter verticallythrough the opening in the platform, and the letter contacted thepalm. The letters were placed on a flat, circular plate that was ro-tated by the experimenter. After each trial the plate was positionedto bring a new letter in place over the solenoid and beneath the sub-ject’s palm.
Procedure. Letters were presented one at a time to the subject’sright palm. The letter was raised by the solenoid and brought intocontact with the subject’s palm. At the start of the experiment, eachletter was presented for 250 msec. After some initial testing, the du-ration of contact was increased to 1 sec. Other investigators have al-lowed contact times up to several seconds (Loomis, 1990; Vega-Bermudez, Johnson, & Hsiao, 1991). We increased contact time sothat our data could be more readily compared with other researchers’results.
At the start of testing, the number of trials in each session was100. As testing continued, the number of trials was increased to 120per session. All 26 letters of the alphabet were presented in randomorder with the constraint that the same letter could not be presentedin two consecutive trials. No trial-by-trial feedback was provided.The decision not to use trial-by-trial feedback was in keeping withthe procedure that Vega-Bermudez et al. (1991) used. These investi-gators did not use feedback, in part to examine asymmetries in letteridentification performance. This issue is examined in the Discussion.
Training on the letter identification task was continued until aminimum of 2,600 trials had been collected from each subject.After this minimum was obtained, the subjects were tested again onthe grating orientation task on the palm (Experiment 1). After the sec-ond set of grating orientation measurements was completed, 5 of the6 subjects were tested again on letter identif ication, this time on theleft palm. We were interested in whether there was transfer from theright (trained) palm to the left (untrained) palm. Subjects completedtwo sessions of letter identification on the left palm using the sameprocedure as had been used in testing the right palm.
ResultsThe performance on the letter identification task is
shown in Figure 4. The data are plotted by session. Thechange in duration from 250 msec in earlier trials to1,000 msec in later trials is shown by the change in sym-bols in Figure 4. The change appears to have had littleoverall effect on performance. Subjects show steady im-provement over sessions. Over the first eight sessions, theaverage improvement was 2.3% per session. This rate ofimprovement is less than the 4% per session improve-ment reported by Vega-Bermudez et al. (1991) using thefingerpad.
From these letter identification data, we wanted to getan estimate of performance that reflected spatial resolu-tion. To get that estimate, we needed to consider the issueof the change in identification performance with prac-tice. Our assumption was that the improvement in per-formance was due to perceptual learning, that subjectswere becoming better able to focus on the critical featuresthat differentiated the patterns, rather than changes in spa-tial resolution. For this reason we wanted to use asymp-totic performance levels, instead of the average levelsover the entire course of the experiment. For 3 of the 6subjects, S2, S3, and S5, performance leveled off by theend of testing. For S1 and S4, performance may or maynot be leveling off, and for S6, performance appears tobe still improving. For Ss 1–5, performance over the lasteight sessions was averaged, and these values are shownin Table 1. For S6, the last two sessions were averaged. Itis possible that with continued testing subjects might im-prove and thus our estimate of letter recognition perfor-mance may be lower than these subjects might actuallyachieve.The estimate of asymptoticperformance was 60%correct.
Five of the 6 subjects completed two blocks of trialsusing their left, untrained hand. Their performance aver-aged 46.9% correct as compared with their performanceof 19.1% on the first two blocks of trials with their righthands. The difference in performance, 27.8%, suggeststhat training at one location does lead to improved perfor-mance at other locations. The transfer is not perfect, how-ever. The 5 subjects averaged 64.2% on their final twoblocks of trials with their right hands.
DiscussionAre complex spatial patterns such as letters processed
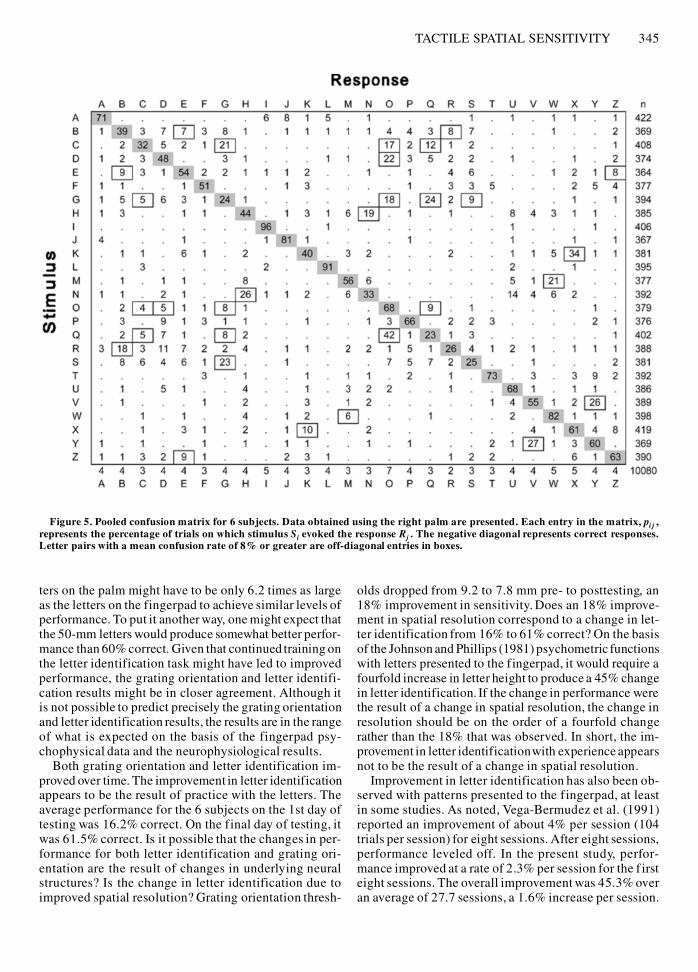
similarly by the fingerpad and palm? This question canbe approached in several ways. First, one can ask whetherspatial patterns that are easily identified when presentedto the fingerpad are also easily identified when presentedto the palm. To make this comparison we generated aconfusion matrix for the letters presented to the palm, asshown in Figure 5. This confusion matrix could then becompared with results from the fingerpad. For the fin-gerpad, there were a number of matrices that might havebeen selected for purposes of comparison. A matrix fromLoomis (1982) and a matrix from Vega-Bermudez et al.(1991) were selected to compare with the palm results.These were selected because they were based on a rela-tively large number of trials and because, in the latter case,the matrix had been more thoroughly analyzed than othermatrices. To generate a confusion matrix on the palm witha level of performance similar to those achieved on thefingerpad (Loomis, 1982; Vega-Bermudez et al., 1991),the last 14 sessions for the palm data were used. The av-erage performance on these sessions was 54.9% correct.The overall correlation between correct responses for thepalm and fingerpad letters, the negative diagonal in theconfusion matrices, was .85 with the Loomis data and .83with the Vega-Bermudez et al. data. These correlationsaresimilar—indeed somewhat higher—than the correlations
Figure 3. Representations of the letters used in the identifica-tion task.

TACTILE SPATIAL SENSITIVITY 343
obtained between several studies of letter identificationon the fingerpad. The correlations ranged from .69 to .81(Loomis, 1982). Thus, in terms of the relative difficulty inidentifying the letters, there is nothing to suggest that spa-tial information is processed any differently on the palmthan it is on the fingerpad.
Other comparisons are possible between the palm andfingerpad data. Vega-Bermudez et al. (1991) noted thatthe fingerpad confusion data were highly structured. Spe-
cifically, a large number of the errors were concentratedon a small number of pairs of letters; half of all the er-rors were concentrated in 22 out of a possible 325 letterpairs, that is, 50% of the errors from 7% of the possiblepairs. A similar result is seen with the palm data (Figure 5);53% of the errors are concentrated in just 6% of the letterpairs. Vega-Bermudez et al. also observed that the confu-sions were highly asymmetric. For example, “C” wascalled “O” more than seven times more often than “O”
Figure 4. Percent correct letter identification as a function of training sessions. The results from each of 6 subjects, S1–S6, are shown.All subjects completed a minimum of 2,600 trials. The change in symbols from unfilled circles to filled circles indicates an increase inthe duration of letter presentation from 250 to 1,000 msec.

344 CRAIG AND LYLE
was called “C.” In the Vega-Bermudez et al. study, of the22 pairs of letters that were most highly confused withone another (a mean confusion rate of 8% or greater), 15of the 22 letters, 68%, showed asymmetric confusions of2.1:1 or more. For the palm data, there were 15 pairs ofletters that averaged greater than 8% errors. The pairs areCG, CO, CQ, DO, GQ, GS, BR, GO, KX, MW, OQ, HN,VY, BE, and EZ. Of these 15, the first 11 listed showed anasymmetry of 2.1:1 or more, 73% of the 15 pairs. Also, 11of these 15 letter pairs were among the 22 letter pairs fromthe fingerpad data.
Johnson and his co-workers have suggested that theperformance on many spatial tasks is limited by the qual-ity of the peripheral neural image. Vega-Bermudez et al.(1991) explained the nature of the letter confusions for thefingerpad data in terms of these neural images. The im-ages are produced by recording activity from first-orderafferents as raised letters are scanned across the finger-pad. Visual inspection of these images shows that a lettersuch as “C” evokes an image much like the letter “O” and,as noted, subjects often respond “O” when presented “C.”Other asymmetries and confusions are explained in asimilar fashion. A comparison of the 15 letter pairs withhigh rates of confusion (Figure 5) with the spatial eventplots generated from the fingerpad (Vega-Bermudez et al.,1991, Figure 12) shows a number of pairs that might beexplainedby the nature of the peripheral image. Pairs suchas CO, CQ, GQ, HN, OQ, VY, and BR produce similarneural images, and it is understandable why they wouldbe confused with one another. On the other hand, theneural images for letter pairs such as FP and NR are simi-lar to each other but do not result in high rates of confusionon the palm. The fact that the letters are scanned across thefingerpad to generate the neural images, whereas the let-ters presented to the palm were not scanned, likely ac-counts for some of the dissimilarities between the palmpsychophysicaldata and the fingerpad neurophysiologicalresults. The scanned images tend to produce strong neuralresponses to the leading edge of the letter but weaker re-sponses to the trailing edge.
Vega-Bermudez et al. (1991) made an additional ob-servation about the asymmetries between letter pairs thatare confused with each other. They suggested that theseconfusions exist to a large extent because subjects didnot receive trial-by-trial feedback. Given an unfamiliar
task, identifying letters by means of touch, the subjectshad to rely on some visual memory of the letters. With-out feedback, subjects were unable to correct their mis-perceptions or to concentrate on those features of a letterthat might distinguish it from a similar letter. Vega-Bermudez et al. predicted that if feedback were provided,the asymmetrical confusions would be greatly reduced.As part of another study in our laboratory, subjects re-ceived trial-by-trial feedback while attempting to identifyletters presented to the palm. An analysis of the highlyconfused pairs of letters showed that, with feedback, thepercentage of asymmetric pairs dropped to 50% as com-pared with 73% without feedback. Feedback reduced thenumber of asymmetrical pairs but did not eliminate them.We should also note that, althoughwe have considered theasymmetries to be largely the result of perceptual simi-larities, there are other explanations for such asymme-tries (Appelman & Mayzner, 1982).
GENERAL DISCUSSION
How does letter identification performance on thepalm, 60% correct, compare with letter identificationper-formance on the fingerpad? Johnson and Phillips (1981)used letters ranging from 3 to 8 mm high. Their proce-dure was similar to ours in that (1) no lateral movementof the fingerpad was permitted, and (2) no trial-by-trialfeedback was provided. Using their plot of probabilitycorrect as a function of letter height (Johnson & Phillips,1981, Figure 8), we determined that a letter 5.5 mm highwould produce 60% correct letter identification on thefingerpad. A second study of letter recognitionon the fin-gerpad featured a similar procedure (Phillips et al., 1983).From their data, we estimated that letters approximately6.7 mm in height would yield 60% correct on the finger-pad. In other words, to achieve the same level of perfor-mance on the palm as the fingerpad required a patternapproximately 9.1 to 7.5 times larger (50 mm to 5.5 or 50to 6.7 mm). Another study in which the conditions werefairly similar to those of the present study was that ofLoomis (1981). Unlike in the present study, subjects wereallowed to move their fingers in a slight circular patternover the letter. With letters 7.2 mm high, subjects werecorrect on 56% of the trials. In this case the palm letterswould be 6.9 times larger than the fingerpad. In a fourthstudy, in which the letters were scanned across the finger-pad, performance was 54.3% correct with 6-mm high let-ters (Vega-Bermudez et al., 1991). The ratio here would be8.3:1 to produce a level of performance that is slightlybelow that of the present study.
The range of the ratios of letter sizes, 6.9 to 9.1 to 1,corresponds to what one would expect on the basis of thedensity of innervationestimates for the SAI system, 8.8:1,and somewhat higher than that predicted by the RA sys-tem, 5.7:1. Recall that for the grating orientation task,the thresholds on the palm were 7.4 (pretesting) or 6.2(posttesting) times the threshold on the fingerpad. Thesegrating orientation results lead one to expect that the let-
Table 1Asymptotic Letter Identification Performance
Subjects Average Performance Final 8 Sessions
S1 83S2 49S3 47S4 74S5 36S6 73*Overall average 60
*The percentage for S6 represents the subject’s performance on thefinal two sessions.
TACTILE SPATIAL SENSITIVITY 345
ters on the palm might have to be only 6.2 times as largeas the letters on the fingerpad to achieve similar levels ofperformance. To put it another way, one might expect thatthe 50-mm letters would produce somewhat better perfor-mance than 60% correct. Given that continued training onthe letter identification task might have led to improvedperformance, the grating orientation and letter identifi-cation results might be in closer agreement. Although itis not possible to predict precisely the grating orientationand letter identification results, the results are in the rangeof what is expected on the basis of the fingerpad psy-chophysical data and the neurophysiological results.
Both grating orientation and letter identification im-proved over time. The improvement in letter identificationappears to be the result of practice with the letters. Theaverage performance for the 6 subjects on the 1st day oftesting was 16.2% correct. On the final day of testing, itwas 61.5% correct. Is it possible that the changes in per-formance for both letter identification and grating ori-entation are the result of changes in underlying neuralstructures? Is the change in letter identification due toimproved spatial resolution? Grating orientation thresh-
olds dropped from 9.2 to 7.8 mm pre- to posttesting, an18% improvement in sensitivity. Does an 18% improve-ment in spatial resolution correspond to a change in let-ter identification from 16% to 61% correct? On the basisof the Johnsonand Phillips (1981) psychometric functionswith letters presented to the fingerpad, it would require afourfold increase in letter height to produce a 45% changein letter identification. If the change in performance werethe result of a change in spatial resolution, the change inresolution should be on the order of a fourfold changerather than the 18% that was observed. In short, the im-provement in letter identificationwith experience appearsnot to be the result of a change in spatial resolution.
Improvement in letter identification has also been ob-served with patterns presented to the fingerpad, at leastin some studies. As noted, Vega-Bermudez et al. (1991)reported an improvement of about 4% per session (104trials per session) for eight sessions. After eight sessions,performance leveled off. In the present study, perfor-mance improved at a rate of 2.3% per session for the f irsteight sessions. The overall improvement was 45.3% overan average of 27.7 sessions, a 1.6% increase per session.
Figure 5. Pooled confusion matrix for 6 subjects. Data obtained using the right palm are presented. Each entry in the matrix, pi j ,represents the percentage of trials on which stimulus Si evoked the response Rj . The negative diagonal represents correct responses.Letter pairs with a mean confusion rate of 8% or greater are off-diagonal entries in boxes.
346 CRAIG AND LYLE
Vega-Bermudez et al. attributed the improvement in per-formance to perceptual learning, a view shared by other in-vestigators (e.g., Sathian, 1998). The fact that the changesoccur over a relatively long training period is consistentwith perceptual learning, although it should be noted thatlong-lasting changes are also consistent with high-levelcognitive learning (Goldstone, 1998). No trial-by-trialfeedback was used, so the process of improvement pre-sumably relied on the differentiation of the structure in-herent in the letters.
One of the questions that arises in studies that haveshown changes that might be attributed to perceptuallearning is, how specific is the learning? Is it specific toa particular site? For tactile stimuli, the answer has beenmixed, with some tasks showing a high degree of speci-ficity and others less so (Sathian, 1998). In the presentstudy, the fact that performance on the left, untrainedhand was substantially better than that seen in the f irstsessions on the right hand suggests that the learning is notsite specific. The transfer from the right to the left handwas not complete, however. These findings are similarto the results from an earlier study in the laboratory, inwhich subjects were trained to identify letters presentedto the left palm and then tested on the right palm. Whetherone chooses to call the improvements in performancewith experience a form of perceptual learning or cogni-tive learning, there appears to be substantial transfer ofthis task between sites.
Also relevant to the issue of perceptual learning is thechange in sensitivity on the grating orientation task. Theimprovement from pre- to posttesting is unlikely to be theresult of experience with the grating orientation task.The pretesting threshold was determined over four ses-sions. There was no change in performance from the firstto the fourth session. The next testing session was at theend of the letter identification sessions, and on this sessionsubjects showed a substantial improvement in sensitivity.It appears that the experience with letter identificationresulted in improvement in grating orientation sensitiv-ity. Previous measurements on the fingerpad have shownno improvement with experience (Craig & Kisner, 1998;Van Boven & Johnson, 1994a). It is unlikely that trainingwith letters improves grating orientation sensitivity morethan training with grating orientation. It is more likelythat the palm is different from the fingerpad with regardto experience and grating orientation sensitivity. Grant,Thiagarajah, and Sathian (2000) have discussed the pos-sibility that visual imagery aids the grating orientationtask. The subject’s sense of a distal-proximal axis on thefingerpad may be more strongly developed than it is onthe palm. Repeated experience with letters that havestrong vertical axes such as I, T, L, and J, and so forth, mayhelp subjects develop a clearer sense of the proximal-distal and lateral-medial axes on the palm. Consistentwith this view is the finding that repeated testing of grat-ing orientation on the lip, an area that might also be ex-pected to lack highlydevelopedspatial axes, also produced
a significant improvement in performance (Van Boven& Johnson, 1994a).
REFERENCES
Appelman, I. B., & Mayzner,M. S. (1982). Application of geometricmodels to letter recognition: Distance and density. Journal of Exper-imental Psychology: General, 111, 60-100.
Bolanowski, S. J., Gescheider, G. A., Verrillo, R. T., & Check-
osky, C. M. (1988). Four channels mediate the mechanical aspects oftouch. Journal of the Acoustical Society of America, 84, 1680-1694.
Craig, J. C. (1999). Grating orientation as a measure of tactile spatialacuity. Somatosensensory & Motor Research, 16, 197-206.
Craig, J. C., & Johnson, K. O. (2000). The two-point threshold: Not ameasure of tactile spatial resolution. Current Directions in Psycho-logical Science, 9, 29-32.
Craig, J. C., & Kisner, J. M. (1998). Factors affecting tactile spatialacuity. Somatosensensory & Motor Research, 15, 29-45.
Darian-Smith, J., & Kenins, P. (1980). Innervation density ofmechanoreceptive fibres supplying the glabrous skin of the monkey’sindex finger. Journal of Physiology, 309, 147-155.
Geldard, F. A. (1960). Some neglected possibilities of communica-tion. Science, 131, 1583-1588.
Goldstone, R. L. (1998). Perceptual learning. Annual Review of Psy-chology, 49, 585-612.
Grant, A. C., Thiagarajah,M. C., & Sathian, K. (2000). Tactile per-ception in blind Braille readers: A psychophysicalstudy of acuity andhyperacuity using gratings and dot patterns. Perception & Psycho-physics, 62, 301-312.
Greenspan, J. D., & Bolanowski, S. J. (1996). The psychophysics oftactile perception and its peripheral physiologicalbasis. In L. Kruger(Ed.), Pain and touch (2nd ed., pp. 25-103). San Diego: AcademicPress.
Johansson, R. S., & Vallbo, A. B. (1979). Tactile sensibility in thehuman hand: Relative and absolutedensities of four types of mechano-receptive units in glabrous skin. Journalof Physiology, 286, 283-300.
Johnson, K. O., & Hsiao, S. S. (1992). Tactual form and texture per-ception. Annual Review of Neuroscience, 15, 227-250.
Johnson, K. O., Hsiao, S. S., & Twombly, I. A. (1995). Neural mech-anisms of tactile form recognition. In M. Gazzaniga (Ed.), The cog-nitive neurosciences (pp. 253-267). Cambridge, MA: MIT Press.
Johnson, K. O., & Phillips, J. R. (1981). Tactile spatial resolution:I. Two-point discrimination, gap detection, grating resolution, andletter recognition. Journal of Neurophysiology, 46, 1177-1191.
Johnson, K. O., Van Boven, R. W., & Hsiao, S. S. (1994). The per-ception of two points is not the spatial resolution threshold. InJ. Boivie, P. Hansson, & U. Lindblom(Eds.), Touch, temperature, andpain in health and disease: Mechanisms and assessments, progressin pain research and management (Vol. 3, pp. 389-404).Seattle, WA:IASP Press.
Loomis, J. M. (1981). Tactile pattern perception. Perception, 10, 5-27.Loomis, J. M. (1982). Analysis of tactile and visual confusion matrices.
Perception & Psychophysics, 31, 41-52.Loomis, J. M. (1990). A model of character recognition and legibility.
Journal of Experimental Psychology: Human Perception & Perfor-mance, 16, 106-120.
Loomis, J. M., & Lederman, S. J. (1986). Tactual perception. In K. R.Boff, L. Kaufman, & J. P. Thomas (Eds.), Handbook of perceptionand human performance (pp. 1-41). New York: Wiley.
Patel, J., Essick, G. K., & Kelly, D. G. (1997). Utility of square-wavegratings to assess perioral spatial acuity. Journalof Oral MaxillofacialSurgery, 55, 593-601.
Phillips, J. R., & Johnson, K. O. (1981). Tactile spatial resolution:II. Neural representation of bars, edges, and gratings in monkey pri-mary afferents. Journal of Neurophysiology, 46, 1192-1203.
Phillips, J. R., Johnson, K. O., & Browne, H. M. (1983). A compar-ison of visual and two modes of tactual letter resolution. Perception& Psychophysics, 34, 243-249.
Sathian, K. (1998). Perceptual learning. Current Science, 75, 451-457.

TACTILE SPATIAL SENSITIVITY 347
Sathian, K., & Zangaladze, A. (1996). Tactile spatial acuity at thehuman fingertip and lip: Bilateral symmetry and interdigitvariability.Neurology, 46, 1464-1466.
Sathian, K., Zangaladze, A., Green, J., Vitek, J. L., & DeLong,
M. R. (1997). Tactile spatial acuity and roughness discrimination:Impairments due to aging and Parkinson’s disease. Neurology, 49,168-177.
Van Boven, R. W., & Johnson, K. O. (1994a). The limit of tactile spa-tial resolution in humans: Grating orientation discrimination at thelip, tongue, and finger. Neurology, 44, 2361-2366.
Van Boven, R. W., & Johnson, K. O. (1994b).A psychophysicalstudyof the mechanisms of sensory recovery following nerve injury in hu-mans. Brain, 117, 149-167.
Vega-Bermudez, F., Johnson, K. O., & Hsiao, S. S. (1991). Humantactile pattern recognition: Active versus passive touch, velocity ef-fects, and patterns of confusion. Journal of Neurophysiology, 65,531-546.
Weber, E. H. (1996). De tactu. In H. E. Ross & D. J. Murray (Eds. andTrans.), E. H. Weber on the tactile senses (2nd ed., p. 49). Hove, U.K.:Erlbaum. (Original work published 1834)
(Manuscript received September 8, 1999;revision accepted for publication April 18, 2000.)
Related Documents