Somatosensory and Motor Research, March–June 2007; 24(1–2): 21–33 Tactile sensitivity of normal and autistic children BURAK GU ¨ C ¸ LU ¨ 1 , CANAN TANIDIR 2 , NAHIT MOTAVALLI MUKADDES 2 ,& FATIH U ¨ NAL 3 1 Biomedical Engineering Institute, Bog ˘azic ¸i University, Istanbul, Turkey, 2 Child and Adolescent Psychiatry Department, Autism Clinic, Istanbul Medical School, Istanbul University, Istanbul, Turkey, and 3 Child and Adolescent Psychiatry Department, Hacettepe University, Ankara, Turkey (Received 4 June 2006; revised 20 October 2006; accepted 11 December 2006) Abstract Many children with autistic spectrum disorders have unusual reactions to certain sensory stimuli. These reactions vary along a hyper- to hypo-responsivity continuum. For example, some children overreact to weak sensory input, but others do not respond negatively to even strong stimuli. It is typically assumed that this deviant responsivity is linked to sensitivity, although the particular stage of sensory processing affected is not known. Psychophysical vibrotactile thresholds of six male children (age: 8–12) who were diagnosed to have autistic spectrum disorders and six normal male children (age: 7–11) were measured by using a two-alternative forced-choice task. The tactile stimuli were sinusoidal displacements and they were applied on the terminal phalanx of the left middle finger of each subject. By using a forward-masking paradigm, 40- and 250-Hz thresholds of the Pacinian tactile channel and 40-Hz threshold of the Non-Pacinian I tactile channel were determined. There was no significant difference between the thresholds of autistic and normal children, and the autistic children had the same detection and masking mechanisms as the normal children. The sensory responsivity of each subject was tested by clinical questionnaires, which showed again no difference between the two subject groups. Furthermore, no significant correlations could be found between the questionnaire data and the psychophysical thresholds. However, there was a high correlation between the data from the tactile and emotional subsets of the questionnaires. These results support the hypothesis that the hyper- and hypo-responsivity to touch, which is sometimes observed in autistic spectrum disorders, is not a perceptual sensory problem, but may probably be emotional in origin. Keywords: Somatosensation, Pacinian channel, non-Pacinian I channel, hyper-sensitivity, hypo-sensitivity, pervasive developmental disorder Introduction Autistic disorder (AD) is among the pervasive developmental disorders (autistic spectrum disor- ders), which include Rett’s disorder, childhood disintegrative disorder, Asperger’s syndrome, and pervasive developmental disorder not otherwise specified (PDD-NOS). AD occurs in about 20 out of 10 000 children, and an autistic spectrum disorder in about 60 out of 10 000 (Fombonne 2003), but the prevalence is increasing probably due to new diagnostic criteria and heightened awareness. According to the Diagnostic and Statistical Manual of Mental Disorders (DSM-IV-TR, American Psychiatric Association), the diagnostic criteria for AD are (1) qualitative impairment in social interaction, (2) qualitative impairment in commu- nication, (3) restricted repetitive and stereotyped patterns of behavior, interests, and activities, (4) delays or abnormal functioning with onset prior to age 3 years, and (5) the disturbance is not better accounted for by Rett’s disorder or childhood disintegrative disorder. AD is a lifelong disorder Correspondence: B. Gu ¨c ¸lu ¨ , PhD, Assistant Professor, Biomedical Engineering Institute, Bogazici University, Bebek, Istanbul 34342, Turkey. Tel: +90 212 3596413. Fax: +90 212 2575030. E-mail: [email protected] ISSN 0899–0220 print/ISSN 1369–1651 online ß 2007 Informa UK Ltd. DOI: 10.1080/08990220601179418 Somatosens Mot Res Downloaded from informahealthcare.com by Hacettepe Univ. on 03/25/12 For personal use only.

Welcome message from author
This document is posted to help you gain knowledge. Please leave a comment to let me know what you think about it! Share it to your friends and learn new things together.
Transcript
Somatosensory and Motor Research, March–June 2007; 24(1–2): 21–33
Tactile sensitivity of normal and autistic children
BURAK GUCLU1, CANAN TANIDIR2, NAHIT MOTAVALLI MUKADDES2, &
FATIH UNAL3
1Biomedical Engineering Institute, Bogazici University, Istanbul, Turkey, 2Child and Adolescent Psychiatry
Department, Autism Clinic, Istanbul Medical School, Istanbul University, Istanbul, Turkey, and 3Child and Adolescent
Psychiatry Department, Hacettepe University, Ankara, Turkey
(Received 4 June 2006; revised 20 October 2006; accepted 11 December 2006)
AbstractMany children with autistic spectrum disorders have unusual reactions to certain sensory stimuli. These reactions vary alonga hyper- to hypo-responsivity continuum. For example, some children overreact to weak sensory input, but others do notrespond negatively to even strong stimuli. It is typically assumed that this deviant responsivity is linked to sensitivity,although the particular stage of sensory processing affected is not known. Psychophysical vibrotactile thresholds of six malechildren (age: 8–12) who were diagnosed to have autistic spectrum disorders and six normal male children (age: 7–11) weremeasured by using a two-alternative forced-choice task. The tactile stimuli were sinusoidal displacements and theywere applied on the terminal phalanx of the left middle finger of each subject. By using a forward-masking paradigm, 40- and250-Hz thresholds of the Pacinian tactile channel and 40-Hz threshold of the Non-Pacinian I tactile channel weredetermined. There was no significant difference between the thresholds of autistic and normal children, and the autisticchildren had the same detection and masking mechanisms as the normal children. The sensory responsivity of each subjectwas tested by clinical questionnaires, which showed again no difference between the two subject groups. Furthermore, nosignificant correlations could be found between the questionnaire data and the psychophysical thresholds. However, therewas a high correlation between the data from the tactile and emotional subsets of the questionnaires. These results supportthe hypothesis that the hyper- and hypo-responsivity to touch, which is sometimes observed in autistic spectrum disorders, isnot a perceptual sensory problem, but may probably be emotional in origin.
Keywords: Somatosensation, Pacinian channel, non-Pacinian I channel, hyper-sensitivity, hypo-sensitivity, pervasivedevelopmental disorder
Introduction
Autistic disorder (AD) is among the pervasive
developmental disorders (autistic spectrum disor-
ders), which include Rett’s disorder, childhood
disintegrative disorder, Asperger’s syndrome, and
pervasive developmental disorder not otherwise
specified (PDD-NOS). AD occurs in about 20 out
of 10 000 children, and an autistic spectrum disorder
in about 60 out of 10 000 (Fombonne 2003), but
the prevalence is increasing probably due to
new diagnostic criteria and heightened awareness.
According to the Diagnostic and Statistical Manual
of Mental Disorders (DSM-IV-TR, American
Psychiatric Association), the diagnostic criteria
for AD are (1) qualitative impairment in social
interaction, (2) qualitative impairment in commu-
nication, (3) restricted repetitive and stereotyped
patterns of behavior, interests, and activities,
(4) delays or abnormal functioning with onset prior
to age 3 years, and (5) the disturbance is not better
accounted for by Rett’s disorder or childhood
disintegrative disorder. AD is a lifelong disorder
Correspondence: B. Guclu, PhD, Assistant Professor, Biomedical Engineering Institute, Bogazici University, Bebek, Istanbul 34342, Turkey. Tel: +90 212
3596413. Fax: +90 212 2575030. E-mail: [email protected]
ISSN 0899–0220 print/ISSN 1369–1651 online � 2007 Informa UK Ltd.
DOI: 10.1080/08990220601179418
Som
atos
ens
Mot
Res
Dow
nloa
ded
from
info
rmah
ealth
care
.com
by
Hac
ette
pe U
niv.
on
03/2
5/12
For
pers
onal
use
onl
y.
and its symptoms appear mostly in the first 2 years
of life. Although people with AD have normal life
expectancy, the quality of their lives is hindered
by impaired social interaction, communication,
imagination, and limited daily activities and interests.
Many children with autistic spectrum disorders
have also strong reactions, positive or negative,
to sensations such as smell, touch, sight, or sound
(Ornitz 1983; Baranek 2002; Harrison and Hare
2004; Rogers and Ozonoff 2005). Since these
reactions are not yet included in the diagnostic
criteria, there is limited experimental data on this
subject and the basic sensory processing in autistic
children is still not clear. Specifically, some children
may have tactile defensiveness and avoid tactile
experiences, or they may react with pleasure to
rough-and-tumble games. Unusual sensory features
appear early in the development of autistic children
and in the absence of known peripheral dysfunction
(Baranek 2002). This deviant behavior, which may
vary in a hyper- and hypo-responsivity continuum,
was attributed to sensory registration and modula-
tion dysfunctions in various developmental disabil-
ities, including AD (Ayres 1979). It was shown that
autistic children who registered tactile input but
failed to modulate it responded better to therapy than
those who were hypo-responsive (Ayres and Tickle
1980). However, the tests used in such clinical
settings typically involve qualitative questions and
often do not allow for the physical measurement of
sensitivity. This makes the interpretation of the
clinical data difficult with respect to the neuropsy-
chology of touch. In this study, the main goal is to
measure the psychophysical thresholds of autistic
children in accordance with the current theories of
the tactile sense. This is not only important from a
basic scientific point of view, but may be significant
regarding the etiology of the disorder.
It may be assumed that a hypo-responsive child
does not react to a normal-level sensory input
adequately because of hypo-sensitivity. Similarly,
a hyper-responsive child may overreact to a normal-
level stimulus because of hyper-sensitivity. If the
absolute psychophysical thresholds of the autistic
children correlate with hypo- and hyper-responsivity,
this supports the hypothesis that the clinical sensory
problems of autistic children are due to perceptual
deficits in processing tactile inputs. Inversely, if there
is no correlation, sensory problems in autism may be
attributed to higher cognitive factors (e.g., emo-
tions). Tactile thresholds of autistic children can also
be compared to the thresholds of normal children to
find out if there are perceptual deficits unrelated to
clinical data. This is an important test, because even
if the clinical sensory problems are not perceptual, or
even if there are no clinical sensory problems, there
may be perceptual deficits clinically unreported.
Since it is difficult to elicit the required duration/
level of performance necessary for task completion in
the autistic population, data from only six higher-
functioning autistic children could be obtained.
Therefore, although the psychophysical results are
reliable, the neuropsychological conclusions given
in this paper are tentative, but may nevertheless
be helpful for guiding new experiments and
assessments.
According to the four-channel theory of tactile
perception (Bolanowski et al. 1988; Gescheider et al.
2001), the tactile psychophysical channels are media-
ted by four receptor systems which have specific
frequency characteristics. Humans are most sensitive
to vibrations at frequencies between 200 and 300Hz.
This is attributed to the Pacinian (P) channel which
has the lowest threshold in that frequency range.
In this study, detection by the P tactile channel was
tested at two frequencies (40 and 250Hz).
Furthermore, a masking procedure was used to
elevate the sensitivity of the P channel and to test
the detection of a 40-Hz stimulus by the
Non-Pacinian I (NP I) channel, which is mediated
by Meissner corpuscles in the skin. Therefore, the
results yield information about the basic operation
(i.e., detection and masking) of the two prominent
psychophysical channels. These experiments were
previously performed on normal adults (Guclu and
Bolanowski 2005), but not on normal or autistic
children. The experimental data may also be used in
modeling studies (see, e.g., Guclu and Bolanowski
2002, 2004). Minor parts of this paper were
presented as abstracts (Tan|d|r et al. 2005; Guclu
et al. 2006).
Materials and methods
Subjects
The experiments do not pose any harm and they
adhere to the US NIH ethical guidelines for testing
human subjects. The parents of the subjects gave
written consent and approvals were obtained from
the Ethics Committee for Human Subjects of
Bogazici University and the Istanbul Medical
School Ethics Committee of Istanbul University.
None of the subjects had any conditions that could
interfere with the psychophysical experiments, such
as being on psychotropic medication or having
serious medical or neurological diseases.
Normal group. Six normal male children (N1–6;
age range: 7–11, mean age: 9.2) were recruited
locally from a primary school. Their psychiatric
interviews did not show any psychopathology.
They did not have behavioral problems according
22 B. Guclu et al.
Som
atos
ens
Mot
Res
Dow
nloa
ded
from
info
rmah
ealth
care
.com
by
Hac
ette
pe U
niv.
on
03/2
5/12
For
pers
onal
use
onl
y.
to the Child Behavior Checklist (T-scores560; see
below).
Autistic group. Six male children (A1–6; age range:
8–12, mean age: 10.0) diagnosed with autistic
spectrum disorders were recruited from the Autism
Clinic of the Istanbul Medical School. Five of those
children had AD diagnosis, and one had PDD-NOS
diagnosis according to the DSM-IV-TR. Their
diagnostic interviews were done by two child
psychiatrists, of whom one is the founder of the
autism clinic and has 14 years of experience with this
subject group. All autistic subjects were higher
functioning (IQ470) and their additional diagnostic
data are given in Table I. There was no significant
age difference between the normal and autistic
subject groups (t-test; p¼ 0.415).
It is important to note that initially 12 higher-
functioning autistic subjects were invited to the
study. However, only six subjects, presented here,
could complete the experiments. One subject quit
because of family problems; the remaining five
subjects could not perform the psychophysical task
described below because of attention deficits.
Therefore, well-controlled psychophysical experi-
ments may be difficult to accomplish even for the
higher-functioning autistic subjects.
Clinical assessments
Routine psychiatric assessments of the children were
performed according to the DSM-IV-TR.
Specifically, language development, socialization
capability, stereotypical behaviors, and sensory
responses displayed in daily life were investigated.
Behavioral problems of normal children were
measured by the Child Behavior Checklist; and the
severity of autistic symptoms in autistic children
were measured by the Childhood Autism Rating
Scale. The sensory responsivities of normal and
autistic children were tested by two questionnaires
(the Sensory Profile and the Touch Inventory),
which are typically used in the field of occupational
therapy.
Childhood Behavior Checklist (CBCL; Achenbach
1991). This test has 118 items which describe
specific behavioral and emotional problems, plus two
open-ended items for reporting additional problems.
By using a three-point scale, normal subjects’ parents
rated their children based on their activities, social
relations, and school performance. Raw scores were
converted to normalized T-scores. T-scores above 60
represent deviant behavior. All normal subjects had
T-scores below 60.
Childhood Autism Rating Scale (CARS; Schopler et al.
1980). This is a 15-item test which combines
parent reports and direct observations by profes-
sionals. The items are relationship with people,
imitation, affect, use of body, relation to non-human
objects, adaptation to environmental change, visual
responsiveness, auditory responsiveness, near recep-
tor responsiveness, anxiety reaction, verbal commu-
nication, nonverbal communication, activity level,
intellectual functioning, and the clinician’s general
impression. The total scores range from 15 to 60.
Scores between 30 and 36 indicate mild autism, and
Table I. Clinical data of normal (N1–6) and autistic (A1–6) subjects.
Subject Age Diagnosis Comorbidity Sensory problems IQ CARS TI SP
SP
(touch)
SP
(emotional/social)
N1 11 Normal – Normal – – 54 (95%) 87 18 17
N2 8 Normal – Normal – – 59 (99%) 106 22 22
N3 7 Normal – Normal – – 44 (65%) 80 17 19
N4 8 Normal – Normal – – 30 (8%) 30 3 5
N5 10 Normal – Normal – – 44 (65%) 60 12 14
N6 11 Normal – Normal – – 42 (55%) 44 6 15
A1 8 HFA None Hypo-responsivity 90 30 36 (26%) 60 8 17
A2 12 HFA ADHD Normal 70 30 42 (55%) 68 13 12
A3 11 HFA ADHD Hyper-responsivity 108 32 58 (99%) 94 21 20
A4 8 HFA ADHD Hypo-responsivity 73 33 49 (85%) 58 10 18
A5 10 HFA ADHD Normal 72 31 53 (94%) 44 7 18
A6 11 PDD-NOS ADHD Hypo-responsivity 80 26 37 (30%) 42 5 11
The results of the psychiatric assessments are given in columns 3–5. The questionnaire data are given in columns 6–9. For the SensoryProfile questionnaire, the responses from the entire question set, the touch subset, and the emotional/social subset are given separately.HFA¼ high-functioning autism; PDD-NOS¼ pervasive developmental disorder not otherwise specified; ADHD¼ attention-deficit/hyperactivity disorder; IQ¼ Intelligence Quotient; CARS¼Childhood Autism Rating Scale; TI¼Touch Inventory for Elementary-School-Aged Children (raw scores and percentiles); SP¼Sensory Profile questionnaire (positive scores, see text). Empty fields were not measured.
Tactile sensitivity of normal and autistic children 23
Som
atos
ens
Mot
Res
Dow
nloa
ded
from
info
rmah
ealth
care
.com
by
Hac
ette
pe U
niv.
on
03/2
5/12
For
pers
onal
use
onl
y.
scores above 36 indicate severe autism. CARS scores
of autistic subjects are given in Table I.
Sensory Profile (SP; Dunn and Westman 1997). This
is a 125-item test, with questions grouped under the
following categories: Auditory (10 questions), Visual
(18 questions), Activity Level (6 questions), Taste/
Smell (10 questions), Body Position (11 questions),
Movement (22 questions), Touch (24 questions),
Emotional/Social (24 questions). The subjects’
parents responded to these questions by using a
five-point Likert scale (the child displays the
described condition 100, 75, 50, 25, or 0% of the
time). The answers were scored according to
the percentages of typical children who seldom or
never displayed the described behaviors ( p%) given
by Dunn and Westman (1997). Specifically, if the
Likert-scale response to a particular question was
greater than the percentage of typical children who
displayed the given behavior, that is, (100� p)%, the
question was scored as positive, otherwise negative.
Here, the number of positive scores is presented. A
high positive score implies more behavioral problems
related to the given subset of the questionnaire.
Touch Inventory for Elementary-School-Aged Children
(TI; Royeen and Fortune 1990). This test has
26 items exclusively for tactile defensiveness.
The questions were answered by the subjects as
‘‘no’’, ‘‘a little’’, or ‘‘a lot’’. The number of ‘‘no’’
responses was weighted by 1, the number of ‘‘a little’’
responses by 2, and the number of ‘‘a lot’’ responses
by 3. The weighted sum of responses was calculated
as the raw score, which was then converted to a
percentile (q%) according to the normative data
given by Royeen and Fortune (1990). In this paper,
both the raw scores and percentiles are presented.
(100� q)% signifies the percentage of normative
subjects who selected more items associated with
tactually defensive behaviors. A high score on this
test implies hyper-responsivity, and a low score
implies hypo-responsivity.
Apparatus
The apparatus was similar to the one used by Guclu
and Bolanowski (2005). The stimuli were generated
by a digital-to-analog converter card (DaqBoard/
2000; IOtech, Inc., Cleveland, OH, USA) in a
personal computer and amplified to drive a mechan-
ical shaker (V201; Ling Dynamic Systems Ltd,
Royston, Herts., UK). The displacements generated
by the shaker were measured by a LVDT
(HR050; Measurement Specialties, Inc., Hampton,
VA, USA). The stimuli were applied with a circular
contactor (radius: 2mm, area: 0.126 cm2) without a
surround. The subject’s left middle finger was
molded in modeling clay to prevent movement.
The fingertip was continuously monitored by a
CCD camera and the experiment was stopped if
the subject moved the stimulated finger. The
response of the subject was obtained by buttons on
a response box connected to the computer. The time
intervals (see below) were signaled to the subject
by LED lights of the response box. Additionally,
the subject knew if his/her response was correct or
incorrect by the signaling of another LED.
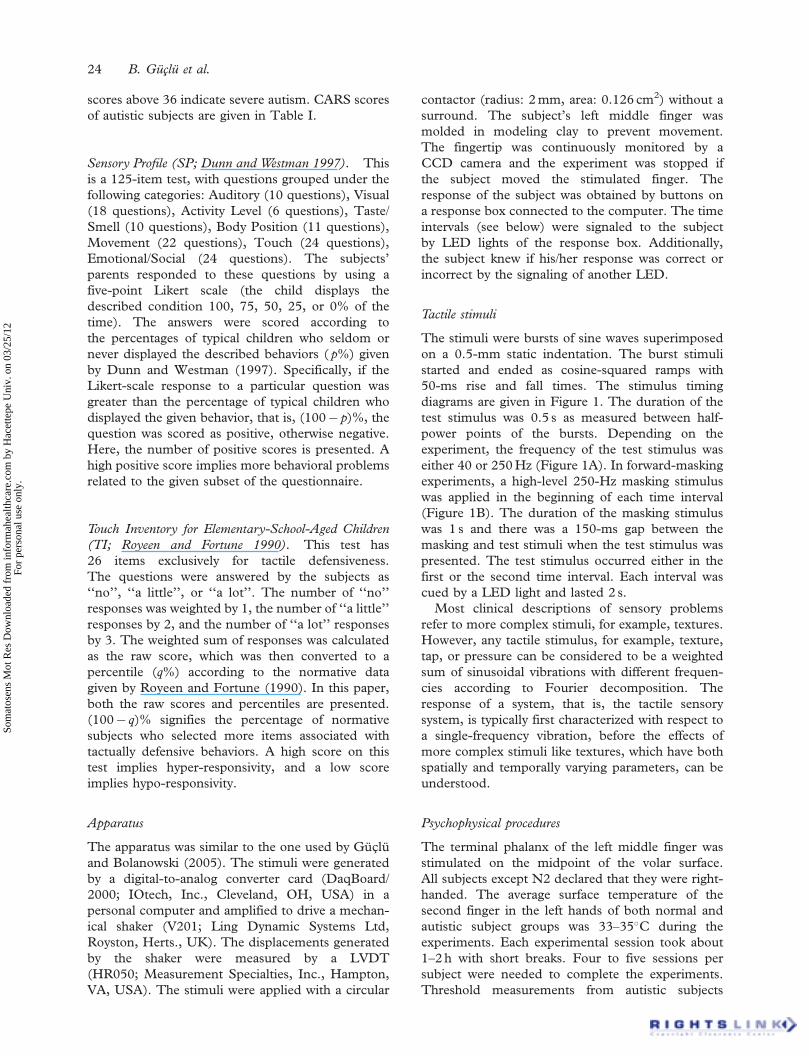
Tactile stimuli
The stimuli were bursts of sine waves superimposed
on a 0.5-mm static indentation. The burst stimuli
started and ended as cosine-squared ramps with
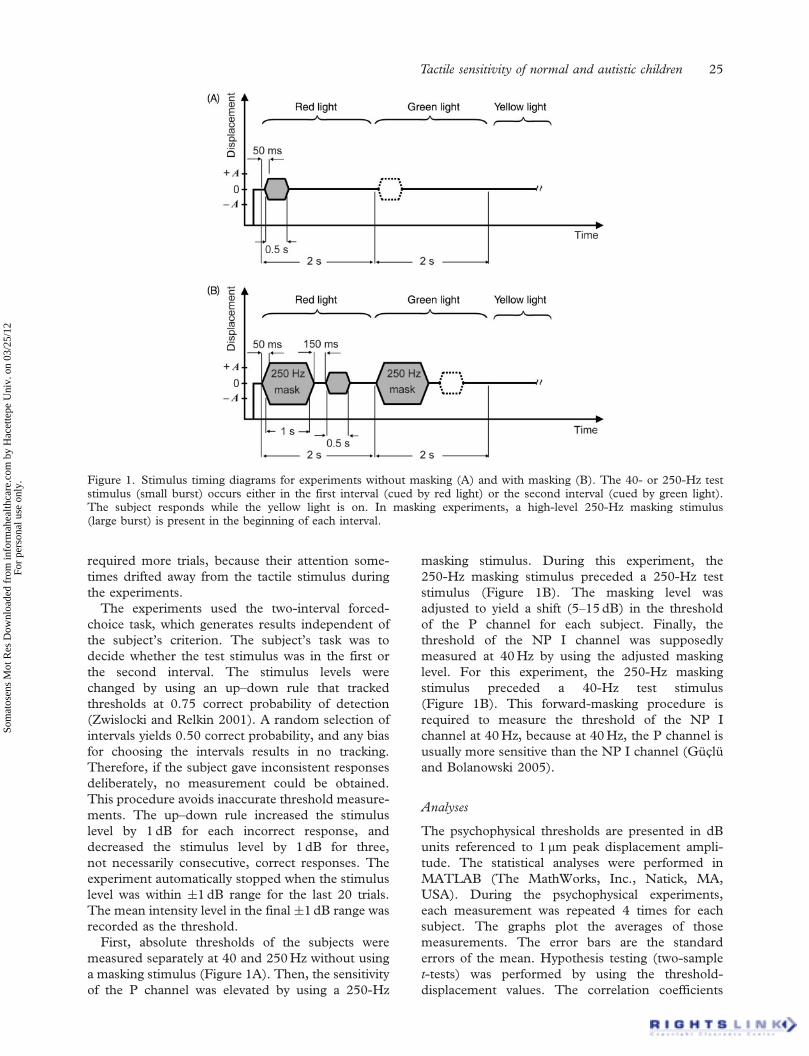
50-ms rise and fall times. The stimulus timing
diagrams are given in Figure 1. The duration of the
test stimulus was 0.5 s as measured between half-
power points of the bursts. Depending on the
experiment, the frequency of the test stimulus was
either 40 or 250Hz (Figure 1A). In forward-masking
experiments, a high-level 250-Hz masking stimulus
was applied in the beginning of each time interval
(Figure 1B). The duration of the masking stimulus
was 1 s and there was a 150-ms gap between the
masking and test stimuli when the test stimulus was
presented. The test stimulus occurred either in the
first or the second time interval. Each interval was
cued by a LED light and lasted 2 s.
Most clinical descriptions of sensory problems
refer to more complex stimuli, for example, textures.
However, any tactile stimulus, for example, texture,
tap, or pressure can be considered to be a weighted
sum of sinusoidal vibrations with different frequen-
cies according to Fourier decomposition. The
response of a system, that is, the tactile sensory
system, is typically first characterized with respect to
a single-frequency vibration, before the effects of
more complex stimuli like textures, which have both
spatially and temporally varying parameters, can be
understood.
Psychophysical procedures
The terminal phalanx of the left middle finger was
stimulated on the midpoint of the volar surface.
All subjects except N2 declared that they were right-
handed. The average surface temperature of the
second finger in the left hands of both normal and
autistic subject groups was 33–35�C during the
experiments. Each experimental session took about
1–2 h with short breaks. Four to five sessions per
subject were needed to complete the experiments.
Threshold measurements from autistic subjects
24 B. Guclu et al.
Som
atos
ens
Mot
Res
Dow
nloa
ded
from
info
rmah
ealth
care
.com
by
Hac
ette
pe U
niv.
on
03/2
5/12
For
pers
onal
use
onl
y.
required more trials, because their attention some-
times drifted away from the tactile stimulus during
the experiments.
The experiments used the two-interval forced-
choice task, which generates results independent of
the subject’s criterion. The subject’s task was to
decide whether the test stimulus was in the first or
the second interval. The stimulus levels were
changed by using an up–down rule that tracked
thresholds at 0.75 correct probability of detection
(Zwislocki and Relkin 2001). A random selection of
intervals yields 0.50 correct probability, and any bias
for choosing the intervals results in no tracking.
Therefore, if the subject gave inconsistent responses
deliberately, no measurement could be obtained.
This procedure avoids inaccurate threshold measure-
ments. The up–down rule increased the stimulus
level by 1 dB for each incorrect response, and
decreased the stimulus level by 1 dB for three,
not necessarily consecutive, correct responses. The
experiment automatically stopped when the stimulus
level was within �1dB range for the last 20 trials.
The mean intensity level in the final �1dB range was
recorded as the threshold.
First, absolute thresholds of the subjects were
measured separately at 40 and 250Hz without using
a masking stimulus (Figure 1A). Then, the sensitivity
of the P channel was elevated by using a 250-Hz
masking stimulus. During this experiment, the
250-Hz masking stimulus preceded a 250-Hz test
stimulus (Figure 1B). The masking level was
adjusted to yield a shift (5–15 dB) in the threshold
of the P channel for each subject. Finally, the
threshold of the NP I channel was supposedly
measured at 40Hz by using the adjusted masking
level. For this experiment, the 250-Hz masking
stimulus preceded a 40-Hz test stimulus
(Figure 1B). This forward-masking procedure is
required to measure the threshold of the NP I
channel at 40Hz, because at 40Hz, the P channel is
usually more sensitive than the NP I channel (Guclu
and Bolanowski 2005).
Analyses
The psychophysical thresholds are presented in dB
units referenced to 1 mm peak displacement ampli-
tude. The statistical analyses were performed in
MATLAB (The MathWorks, Inc., Natick, MA,
USA). During the psychophysical experiments,
each measurement was repeated 4 times for each
subject. The graphs plot the averages of those
measurements. The error bars are the standard
errors of the mean. Hypothesis testing (two-sample
t-tests) was performed by using the threshold-
displacement values. The correlation coefficients
Figure 1. Stimulus timing diagrams for experiments without masking (A) and with masking (B). The 40- or 250-Hz teststimulus (small burst) occurs either in the first interval (cued by red light) or the second interval (cued by green light).The subject responds while the yellow light is on. In masking experiments, a high-level 250-Hz masking stimulus(large burst) is present in the beginning of each interval.
Tactile sensitivity of normal and autistic children 25
Som
atos
ens
Mot
Res
Dow
nloa
ded
from
info
rmah
ealth
care
.com
by
Hac
ette
pe U
niv.
on
03/2
5/12
For
pers
onal
use
onl
y.
(Pearson’s) were found between the questionnaire
results and the threshold-displacement values.
Results
Questionnaire data
The results obtained from the Sensory Profile (SP)
and the Touch Inventory (TI) questionnaires are
given in Table I. Both normal and autistic subject
groups have members who scored high or low on
these tests. According to the total questions available
in a given test or the percentile result, the results
were grouped into three equal ranges. The results are
considered to be low if they are in the lowest range,
high if they are in the highest range, and normal if
they are in the middle range.
N1, N2, A3, A4, and A5 have tactually
defensive (hyper-responsive) behaviors according
to the TI (467%). On the other hand, N4, A1,
and A6 show hypo-responsivity according to the
TI (533%). The other subjects have scores
between the scores of the subjects who show
hypo- and hyper-responsivity. It is interesting to
compare the TI data of autistic children with
clinically reported somatosensory problems, which
are listed in the fourth column of Table I. The
psychiatric evaluation revealed that A1, A4, and
A6 did not react normally to pain. A3 was
reported to overreact to various sensory inputs
which include tactile, auditory, and visual stimuli.
The parents of A2 and A5 reported that their
autistic children did not display excessive
responses to somatosensory inputs. The TI data
of A1, A2, A3, and A6 are consistent with the
psychiatric evaluations. However, although A4 was
reported to be hypo-responsive, his TI score is
higher than 85% of the normal population.
Similarly, the parental report of A5 did not suggest
any excessive sensory problems, but A5 scored
very high in the TI test (i.e., tactually defensive
behavior). The normal subjects do not all have
TI scores which lie close to the average of the
normative population. N1 and N2 have very high
scores; N4 has a very low score. These results
show that the tactile defensiveness as measured by
the TI test may vary considerably across the
normal population as well as the autistic popula-
tion. However, there is no statistical difference
between the TI scores of normal and autistic
children (t-test; p¼ 0.986).
The SP test results are not very different from the
TI test results. N1, N2, and A3 have high scores
(483). If only the tactile subset of the SP test is
considered, N1, N2, N3, and A3 have high scores
(416). If only the emotional/social subset of the test
is considered, N1, N2, N3, A1, A3, A4, and A5 have
high scores (416). The results from the tactile subset
of the SP test are generally consistent with the
psychiatric evaluations. Specifically, the subject who
is hyper-sensitive according to the psychiatric evalua-
tion, A3, has the highest score (21). Again, both
normal and autistic subject groups have members
who have high, medium, or low scores; therefore,
there is a large variation among subjects. However,
there is no statistical difference between the SP
scores of normal and autistic children (t-test;
entire SP set: p¼ 0.635, touch subset: p¼ 0.555,
emotional/social subset: p¼ 0.817). It is interesting
to note that some subjects scored high on both
emotional/social and tactile subsets. This suggests
that there may be a correlation between hypo- and
hyper-responsivity and emotional reactions.
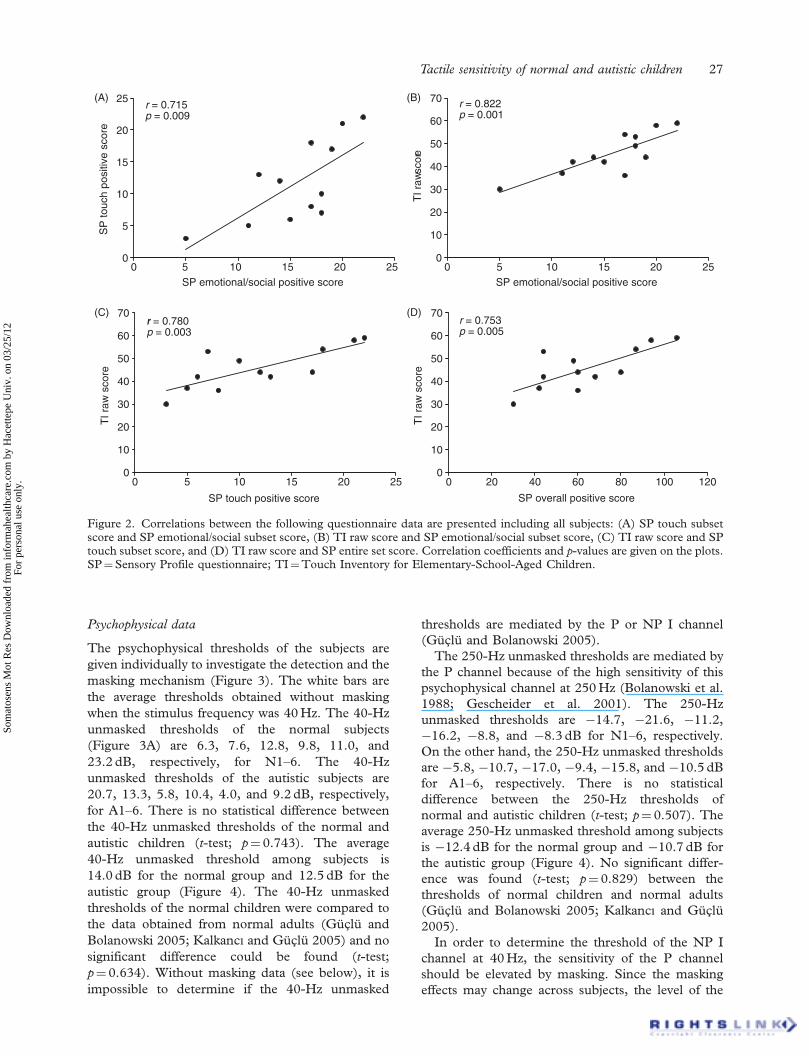
Correlation analyses were performed on data
which include all normal and autistic subjects. A
high (r¼ 0.715) and significant ( p¼ 0.009) correla-
tion was found between the results from the tactile
and emotional/social subsets of the SP test
(Figure 2A; n¼ 12). Similarly, a high (r¼ 0.822)
and significant ( p¼ 0.001) correlation was found
between the results from the TI test and the
emotional/social subset of the SP test (Figure 2B;
n¼ 12). This latter correlation is important because,
the TI test was answered by the subjects, but the SP
test was answered by the parents. As expected, there
is also a high (r¼ 0.780) and significant ( p¼ 0.003)
correlation between the results from the TI test and
the tactile subset of the SP test (Figure 2C; n¼ 12).
Finally, a high (r¼ 0.753) and significant ( p¼ 0.005)
correlation was found between the results of the TI
test and the entire SP test (Figure 2D; n¼ 12). These
correlation data show that although the questionnaire
results vary considerably among normal and autistic
subjects, there is a consistent pattern. The subjects
who have more emotional problems according to the
SP test also have more tactile problems according to
the SP test, and display more tactually defensive
behaviors according to the TI test. In addition,
the subjects who have more sensory problems in
general according to the SP test are more tactually
defensive according to the TI test, which also
correlates strongly with the results from the tactile
subset of the SP. Furthermore, the inverse state-
ments are implied because of the given correlations.
For example, the subjects who have very few
emotional problems display hypo-responsive beha-
viors. Similar correlation analyses were performed
also by using the CARS scores for the autistic
subjects. There was significant correlation only
between the results from the emotional/social
subset of the SP test and the CARS scores
(r¼ 0.818; p¼ 0.047), which verifies that emotions
and social interactions are important for determining
the severity of autism.
26 B. Guclu et al.
Som
atos
ens
Mot
Res
Dow
nloa
ded
from
info
rmah
ealth
care
.com
by
Hac
ette
pe U
niv.
on
03/2
5/12
For
pers
onal
use
onl
y.
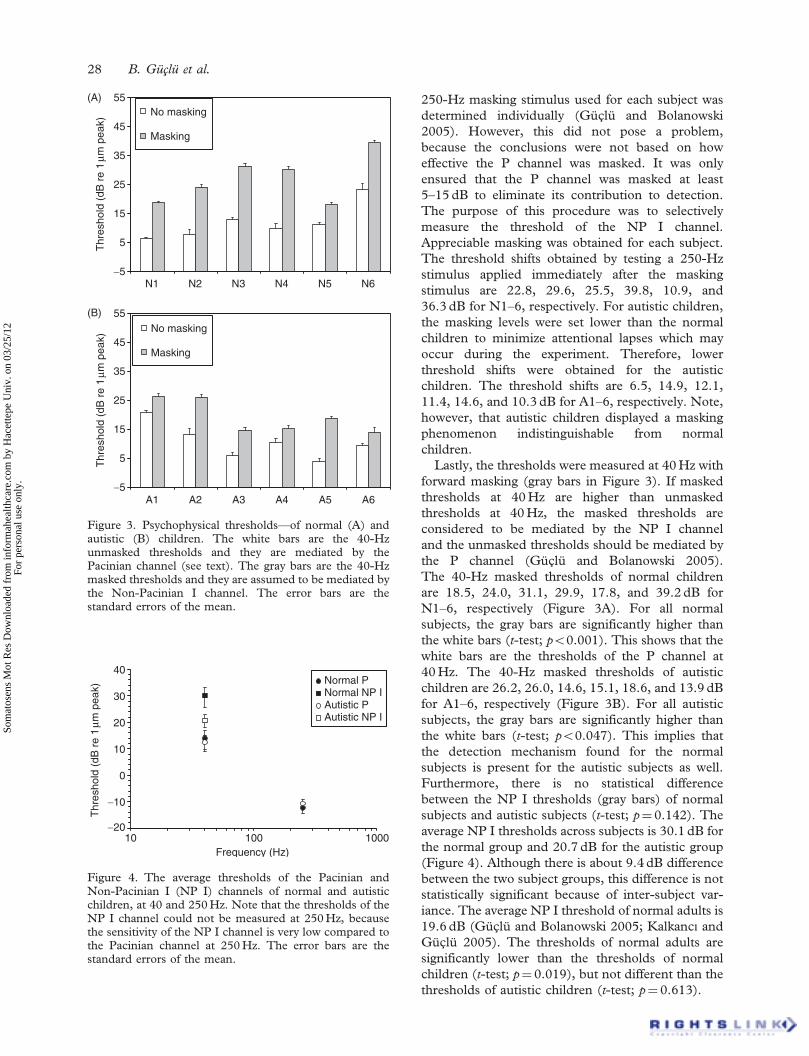
Psychophysical data
The psychophysical thresholds of the subjects are
given individually to investigate the detection and the
masking mechanism (Figure 3). The white bars are
the average thresholds obtained without masking
when the stimulus frequency was 40Hz. The 40-Hz
unmasked thresholds of the normal subjects
(Figure 3A) are 6.3, 7.6, 12.8, 9.8, 11.0, and
23.2 dB, respectively, for N1–6. The 40-Hz
unmasked thresholds of the autistic subjects are
20.7, 13.3, 5.8, 10.4, 4.0, and 9.2 dB, respectively,
for A1–6. There is no statistical difference between
the 40-Hz unmasked thresholds of the normal and
autistic children (t-test; p¼ 0.743). The average
40-Hz unmasked threshold among subjects is
14.0 dB for the normal group and 12.5 dB for the
autistic group (Figure 4). The 40-Hz unmasked
thresholds of the normal children were compared to
the data obtained from normal adults (Guclu and
Bolanowski 2005; Kalkanc| and Guclu 2005) and no
significant difference could be found (t-test;
p¼ 0.634). Without masking data (see below), it is
impossible to determine if the 40-Hz unmasked
thresholds are mediated by the P or NP I channel
(Guclu and Bolanowski 2005).
The 250-Hz unmasked thresholds are mediated by
the P channel because of the high sensitivity of this
psychophysical channel at 250Hz (Bolanowski et al.
1988; Gescheider et al. 2001). The 250-Hz
unmasked thresholds are �14.7, �21.6, �11.2,
�16.2, �8.8, and �8.3 dB for N1–6, respectively.
On the other hand, the 250-Hz unmasked thresholds
are �5.8, �10.7, �17.0, �9.4, �15.8, and �10.5 dB
for A1–6, respectively. There is no statistical
difference between the 250-Hz thresholds of
normal and autistic children (t-test; p¼ 0.507). The
average 250-Hz unmasked threshold among subjects
is �12.4 dB for the normal group and �10.7 dB for
the autistic group (Figure 4). No significant differ-
ence was found (t-test; p¼ 0.829) between the
thresholds of normal children and normal adults
(Guclu and Bolanowski 2005; Kalkanc| and Guclu
2005).
In order to determine the threshold of the NP I
channel at 40Hz, the sensitivity of the P channel
should be elevated by masking. Since the masking
effects may change across subjects, the level of the
0
5
10
15
20
25(A) (B)
0 5 10 15 20 25SP emotional/social positive score
0 5 10 15 20 25SP emotional/social positive score
SP
touc
h po
sitiv
e sc
ore
r = 0.715p = 0.009
0
10
20
30
40
50
60
70
TI r
aw sc
ore
r = 0.822p = 0.001
0
10
20
30
40
50
60
70(C)
0 5 10 15 20 25
SP touch positive score
TI r
aw s
core
0
10
20
30
40
50
60
70(D)
TI r
aw s
core
r = 0.780p = 0.003
0 20 40 60 80 100 120
SP overall positive score
r = 0.753p = 0.005
Figure 2. Correlations between the following questionnaire data are presented including all subjects: (A) SP touch subsetscore and SP emotional/social subset score, (B) TI raw score and SP emotional/social subset score, (C) TI raw score and SPtouch subset score, and (D) TI raw score and SP entire set score. Correlation coefficients and p-values are given on the plots.SP¼Sensory Profile questionnaire; TI¼Touch Inventory for Elementary-School-Aged Children.
Tactile sensitivity of normal and autistic children 27
Som
atos
ens
Mot
Res
Dow
nloa
ded
from
info
rmah
ealth
care
.com
by
Hac
ette
pe U
niv.
on
03/2
5/12
For
pers
onal
use
onl
y.
250-Hz masking stimulus used for each subject was
determined individually (Guclu and Bolanowski
2005). However, this did not pose a problem,
because the conclusions were not based on how
effective the P channel was masked. It was only
ensured that the P channel was masked at least
5–15 dB to eliminate its contribution to detection.
The purpose of this procedure was to selectively
measure the threshold of the NP I channel.
Appreciable masking was obtained for each subject.
The threshold shifts obtained by testing a 250-Hz
stimulus applied immediately after the masking
stimulus are 22.8, 29.6, 25.5, 39.8, 10.9, and
36.3 dB for N1–6, respectively. For autistic children,
the masking levels were set lower than the normal
children to minimize attentional lapses which may
occur during the experiment. Therefore, lower
threshold shifts were obtained for the autistic
children. The threshold shifts are 6.5, 14.9, 12.1,
11.4, 14.6, and 10.3 dB for A1–6, respectively. Note,
however, that autistic children displayed a masking
phenomenon indistinguishable from normal
children.
Lastly, the thresholds were measured at 40Hz with
forward masking (gray bars in Figure 3). If masked
thresholds at 40Hz are higher than unmasked
thresholds at 40Hz, the masked thresholds are
considered to be mediated by the NP I channel
and the unmasked thresholds should be mediated by
the P channel (Guclu and Bolanowski 2005).
The 40-Hz masked thresholds of normal children
are 18.5, 24.0, 31.1, 29.9, 17.8, and 39.2 dB for
N1–6, respectively (Figure 3A). For all normal
subjects, the gray bars are significantly higher than
the white bars (t-test; p50.001). This shows that the
white bars are the thresholds of the P channel at
40Hz. The 40-Hz masked thresholds of autistic
children are 26.2, 26.0, 14.6, 15.1, 18.6, and 13.9 dB
for A1–6, respectively (Figure 3B). For all autistic
subjects, the gray bars are significantly higher than
the white bars (t-test; p50.047). This implies that
the detection mechanism found for the normal
subjects is present for the autistic subjects as well.
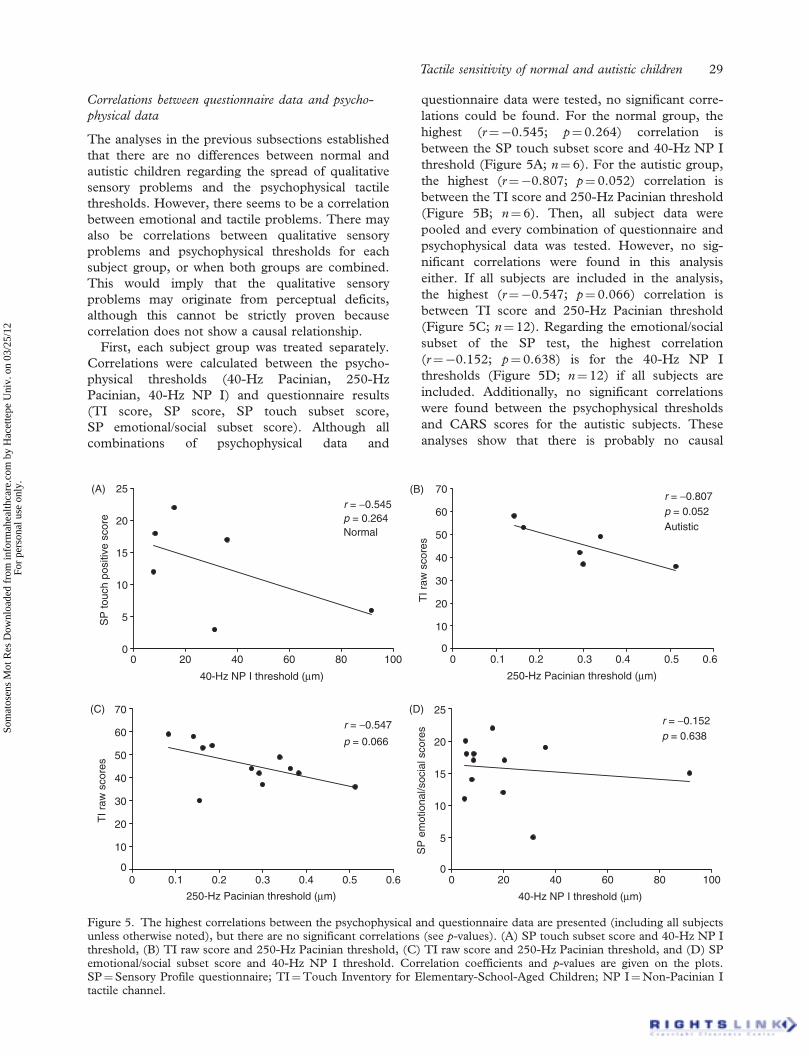
Furthermore, there is no statistical difference
between the NP I thresholds (gray bars) of normal
subjects and autistic subjects (t-test; p¼ 0.142). The
average NP I thresholds across subjects is 30.1 dB for
the normal group and 20.7 dB for the autistic group
(Figure 4). Although there is about 9.4 dB difference
between the two subject groups, this difference is not
statistically significant because of inter-subject var-
iance. The average NP I threshold of normal adults is
19.6 dB (Guclu and Bolanowski 2005; Kalkanc| andGuclu 2005). The thresholds of normal adults are
significantly lower than the thresholds of normal
children (t-test; p¼ 0.019), but not different than the
thresholds of autistic children (t-test; p¼ 0.613).
−5
5
15
25
35
45
55
−5
5
15
25
35
45
55
(A)
(B)
N1 N2 N3 N4 N5 N6
Thr
esho
ld (
dB r
e 1
µm p
eak)
No masking
Masking
A1 A2 A3 A4 A5 A6
Thr
esho
ld (
dB r
e 1
µm p
eak)
No masking
Masking
Figure 3. Psychophysical thresholds—of normal (A) andautistic (B) children. The white bars are the 40-Hzunmasked thresholds and they are mediated by thePacinian channel (see text). The gray bars are the 40-Hzmasked thresholds and they are assumed to be mediated bythe Non-Pacinian I channel. The error bars are thestandard errors of the mean.
−20
−10
0
10
20
30
40
10 100 1000Frequency (Hz)
Thr
esho
ld (
dB r
e 1
µm p
eak)
Normal P Normal NP IAutistic P Autistic NP I
Figure 4. The average thresholds of the Pacinian andNon-Pacinian I (NP I) channels of normal and autisticchildren, at 40 and 250Hz. Note that the thresholds of theNP I channel could not be measured at 250Hz, becausethe sensitivity of the NP I channel is very low compared tothe Pacinian channel at 250Hz. The error bars are thestandard errors of the mean.
28 B. Guclu et al.
Som
atos
ens
Mot
Res
Dow
nloa
ded
from
info
rmah
ealth
care
.com
by
Hac
ette
pe U
niv.
on
03/2
5/12
For
pers
onal
use
onl
y.
Correlations between questionnaire data and psycho-
physical data
The analyses in the previous subsections established
that there are no differences between normal and
autistic children regarding the spread of qualitative
sensory problems and the psychophysical tactile
thresholds. However, there seems to be a correlation
between emotional and tactile problems. There may
also be correlations between qualitative sensory
problems and psychophysical thresholds for each
subject group, or when both groups are combined.
This would imply that the qualitative sensory
problems may originate from perceptual deficits,
although this cannot be strictly proven because
correlation does not show a causal relationship.
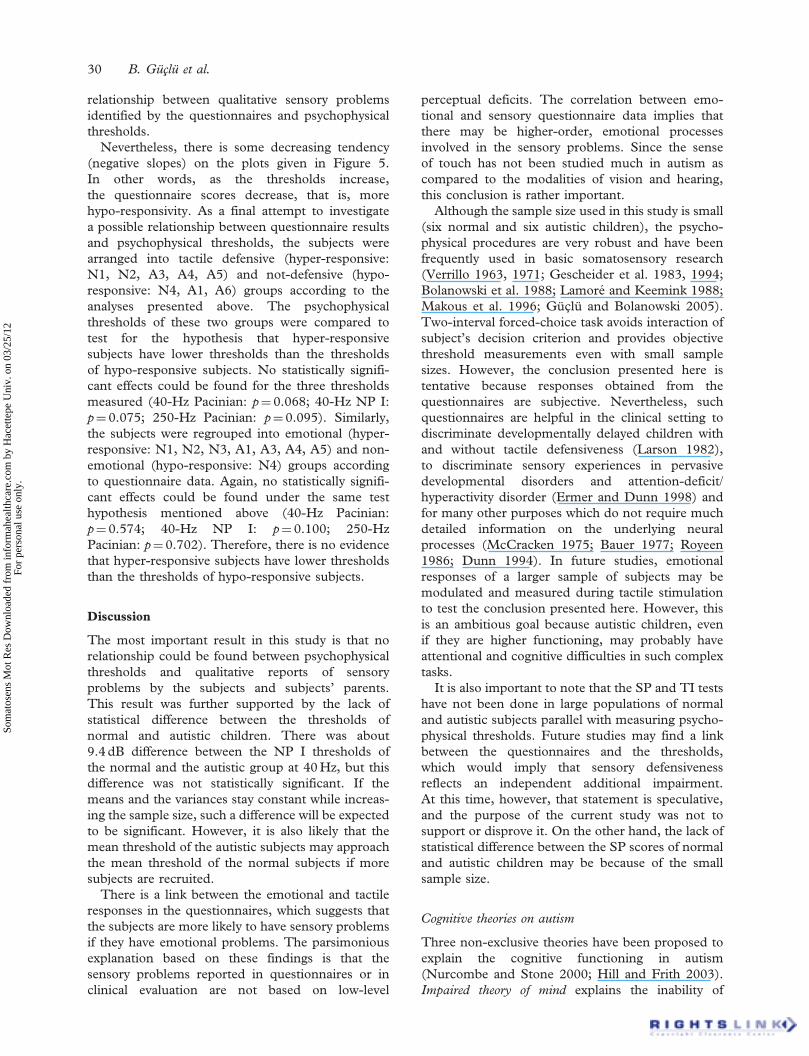
First, each subject group was treated separately.
Correlations were calculated between the psycho-
physical thresholds (40-Hz Pacinian, 250-Hz
Pacinian, 40-Hz NP I) and questionnaire results
(TI score, SP score, SP touch subset score,
SP emotional/social subset score). Although all
combinations of psychophysical data and
questionnaire data were tested, no significant corre-
lations could be found. For the normal group, the
highest (r¼�0.545; p¼ 0.264) correlation is
between the SP touch subset score and 40-Hz NP I
threshold (Figure 5A; n¼ 6). For the autistic group,
the highest (r¼�0.807; p¼ 0.052) correlation is
between the TI score and 250-Hz Pacinian threshold
(Figure 5B; n¼ 6). Then, all subject data were
pooled and every combination of questionnaire and
psychophysical data was tested. However, no sig-
nificant correlations were found in this analysis
either. If all subjects are included in the analysis,
the highest (r¼�0.547; p¼ 0.066) correlation is
between TI score and 250-Hz Pacinian threshold
(Figure 5C; n¼ 12). Regarding the emotional/social
subset of the SP test, the highest correlation
(r¼�0.152; p¼ 0.638) is for the 40-Hz NP I
thresholds (Figure 5D; n¼ 12) if all subjects are
included. Additionally, no significant correlations
were found between the psychophysical thresholds
and CARS scores for the autistic subjects. These
analyses show that there is probably no causal
0
5
10
15
20
25(A)
(C) (D)
0 20 40 60 80 100
40-Hz NP I threshold (µm)
SP
touc
h po
sitiv
e sc
ore
r = −0.545p = 0.264Normal
0
10
20
30
40
50
60
70(B)
0 0.1 0.2 0.3 0.4 0.5 0.6
250-Hz Pacinian threshold (µm)
TI r
aw s
core
s
r = −0.807p = 0.052Autistic
0
10
20
30
40
50
60
70
0 0.1 0.2 0.3 0.4 0.5 0.6
250-Hz Pacinian threshold (µm)
TI r
aw s
core
s
r = −0.547
p = 0.066
0
5
10
15
20
25
0 20 40 60 80 100
40-Hz NP I threshold (µm)
SP
em
otio
nal/s
ocia
l sco
res
r = −0.152p = 0.638
Figure 5. The highest correlations between the psychophysical and questionnaire data are presented (including all subjectsunless otherwise noted), but there are no significant correlations (see p-values). (A) SP touch subset score and 40-Hz NP Ithreshold, (B) TI raw score and 250-Hz Pacinian threshold, (C) TI raw score and 250-Hz Pacinian threshold, and (D) SPemotional/social subset score and 40-Hz NP I threshold. Correlation coefficients and p-values are given on the plots.SP¼Sensory Profile questionnaire; TI¼Touch Inventory for Elementary-School-Aged Children; NP I¼Non-Pacinian Itactile channel.
Tactile sensitivity of normal and autistic children 29
Som
atos
ens
Mot
Res
Dow
nloa
ded
from
info
rmah
ealth
care
.com
by
Hac
ette
pe U
niv.
on
03/2
5/12
For
pers
onal
use
onl
y.
relationship between qualitative sensory problems
identified by the questionnaires and psychophysical
thresholds.
Nevertheless, there is some decreasing tendency
(negative slopes) on the plots given in Figure 5.
In other words, as the thresholds increase,
the questionnaire scores decrease, that is, more
hypo-responsivity. As a final attempt to investigate
a possible relationship between questionnaire results
and psychophysical thresholds, the subjects were
arranged into tactile defensive (hyper-responsive:
N1, N2, A3, A4, A5) and not-defensive (hypo-
responsive: N4, A1, A6) groups according to the
analyses presented above. The psychophysical
thresholds of these two groups were compared to
test for the hypothesis that hyper-responsive
subjects have lower thresholds than the thresholds
of hypo-responsive subjects. No statistically signifi-
cant effects could be found for the three thresholds
measured (40-Hz Pacinian: p¼ 0.068; 40-Hz NP I:
p¼ 0.075; 250-Hz Pacinian: p¼ 0.095). Similarly,
the subjects were regrouped into emotional (hyper-
responsive: N1, N2, N3, A1, A3, A4, A5) and non-
emotional (hypo-responsive: N4) groups according
to questionnaire data. Again, no statistically signifi-
cant effects could be found under the same test
hypothesis mentioned above (40-Hz Pacinian:
p¼ 0.574; 40-Hz NP I: p¼ 0.100; 250-Hz
Pacinian: p¼ 0.702). Therefore, there is no evidence
that hyper-responsive subjects have lower thresholds
than the thresholds of hypo-responsive subjects.
Discussion
The most important result in this study is that no
relationship could be found between psychophysical
thresholds and qualitative reports of sensory
problems by the subjects and subjects’ parents.
This result was further supported by the lack of
statistical difference between the thresholds of
normal and autistic children. There was about
9.4 dB difference between the NP I thresholds of
the normal and the autistic group at 40Hz, but this
difference was not statistically significant. If the
means and the variances stay constant while increas-
ing the sample size, such a difference will be expected
to be significant. However, it is also likely that the
mean threshold of the autistic subjects may approach
the mean threshold of the normal subjects if more
subjects are recruited.
There is a link between the emotional and tactile
responses in the questionnaires, which suggests that
the subjects are more likely to have sensory problems
if they have emotional problems. The parsimonious
explanation based on these findings is that the
sensory problems reported in questionnaires or in
clinical evaluation are not based on low-level
perceptual deficits. The correlation between emo-
tional and sensory questionnaire data implies that
there may be higher-order, emotional processes
involved in the sensory problems. Since the sense
of touch has not been studied much in autism as
compared to the modalities of vision and hearing,
this conclusion is rather important.
Although the sample size used in this study is small
(six normal and six autistic children), the psycho-
physical procedures are very robust and have been
frequently used in basic somatosensory research
(Verrillo 1963, 1971; Gescheider et al. 1983, 1994;
Bolanowski et al. 1988; Lamore and Keemink 1988;
Makous et al. 1996; Guclu and Bolanowski 2005).
Two-interval forced-choice task avoids interaction of
subject’s decision criterion and provides objective
threshold measurements even with small sample
sizes. However, the conclusion presented here is
tentative because responses obtained from the
questionnaires are subjective. Nevertheless, such
questionnaires are helpful in the clinical setting to
discriminate developmentally delayed children with
and without tactile defensiveness (Larson 1982),
to discriminate sensory experiences in pervasive
developmental disorders and attention-deficit/
hyperactivity disorder (Ermer and Dunn 1998) and
for many other purposes which do not require much
detailed information on the underlying neural
processes (McCracken 1975; Bauer 1977; Royeen
1986; Dunn 1994). In future studies, emotional
responses of a larger sample of subjects may be
modulated and measured during tactile stimulation
to test the conclusion presented here. However, this
is an ambitious goal because autistic children, even
if they are higher functioning, may probably have
attentional and cognitive difficulties in such complex
tasks.
It is also important to note that the SP and TI tests
have not been done in large populations of normal
and autistic subjects parallel with measuring psycho-
physical thresholds. Future studies may find a link
between the questionnaires and the thresholds,
which would imply that sensory defensiveness
reflects an independent additional impairment.
At this time, however, that statement is speculative,
and the purpose of the current study was not to
support or disprove it. On the other hand, the lack of
statistical difference between the SP scores of normal
and autistic children may be because of the small
sample size.
Cognitive theories on autism
Three non-exclusive theories have been proposed to
explain the cognitive functioning in autism
(Nurcombe and Stone 2000; Hill and Frith 2003).
Impaired theory of mind explains the inability of
30 B. Guclu et al.
Som
atos
ens
Mot
Res
Dow
nloa
ded
from
info
rmah
ealth
care
.com
by
Hac
ette
pe U
niv.
on
03/2
5/12
For
pers
onal
use
onl
y.
autistic children to recognize and understand other
people’s mental states (Baron-Cohen 1989). The
executive dysfunction theory stresses on the frontal-
lobe dysfunction of autistic children which is
observed by their cognitive inflexibility and perse-
veration (Hughes et al. 1994). The weak central
coherence theory discusses the tendency of autistic
children to focus on local, rather than global aspects
of objects (Frith and Happe 1994). The latter theory
attempts to explain experimental data by suggesting
poor connectivity between basic perceptual processes
and top-down modulating processes. The influence
of top-down modulating processes has been recog-
nized to be important in developmental disorders
long ago (Ayres 1964, 1979). Hypo- and hyper-
responsivity to sensory input have been attributed to
sensory modulation dysfunction. The neural activity
originating from sensory input is thought to be not
regulated properly in relation with the other func-
tions of the nervous system. The limbic system, and
therefore, emotions may be closely associated with
this problem.
Emotional modulation of the sensory response
Children with sensory modulation dysfunction show
larger electrodermal responses (McIntosh et al.
1999). The orbitofrontal–amygdala circuit is impli-
cated in self-regulation of social–emotional behavior
in autism (Bachevalier and Loveland 2006). The
facial-affect expressions of autistic children are
abnormal (Yirmiya et al. 1989), and attention-
deficit/hyperactivity, mood, and anxiety disorders
may accompany autism as comorbid conditions
(Nurcombe and Stone 2000). Therefore, it is
certainly possible that emotions can modulate
hypo- and hyper-responsivity to tactile sensory
input in autism and other developmental disorders.
However, studies which target this relationship are
scarce in the literature (Baranek and Berkson 1994;
Parush et al. 1997; Mangeot et al. 2001) and they do
not provide clear evidence of the modulatory effect.
The reason for that may be due to the lack of critical
control of the sensory input. In order to study the
effects of emotions on the sensory response, the
state of the tactile psychophysical channels should
be carefully controlled as in the psychophysical
experiments described here. If the low-level neural
processing is accurately determined, a top-down
modulatory effect may be less ambiguous. Note,
however, that a careful control of emotional states is
also essential, and there is no unique best paradigm
for that. Salmond et al. (2003) studied the emotional
modulation of the startle response in autistic children
who had abnormalities in the amygdala as observed
from MRI scans, but could not find an effect.
Similarly, Bernier et al. (2005) showed that autistic
children have normal responses to a fear–potential
startle paradigm.
There may also be a reverse effect between
emotions and sensory input for autistic children.
Some children with developmental disorders benefit
from receiving many sensory stimuli during sensory
integration therapy (Bundy et al. 2002; Sidney Chu,
personal communication) and touch therapy (Field
et al. 1997). Although such interventions are con-
troversial (Baranek 2002), more studies with criti-
cally controlled stimuli are required before finding
definite answers.
It is also interesting to note that normal children
responded similarly to the questionnaires in the
presented study, although they do not suffer from
clinical sensory problems. This may be explained
by using the top-down modulation hypothesis.
The sensory responses tested by the questionnaires
may be distributed uniformly across the general
population. Normal children, who may have normal
emotional modulation, do not display the same
sensory responses as strongly as seen at a clinical
level, or they may tolerate sensory modulation
dysfunctions at a higher cognitive level. Autistic
children may have more serious modulation dysfunc-
tions and/or less capability to tolerate them. In future
studies, normal children who give more positive
responses to questionnaires can be retested in
experiments with emotional modulation.
Low-level sensory processing in autism
Visual stimuli have been used frequently in autism,
but the experiments largely focused on attentional or
cognitive mechanisms and not on lower-level neural
and perceptual processes (Swettenham et al. 2003).
There have been more studies of basic neural
processing in the hearing modality. Brain stem
auditory evoked responses were found to be abnor-
mal in autism (Thivierge et al. 1990). By using
transiently evoked otoacoustic emissions, Khalfa
et al. (2001) reported a difference in the efferent
activity of the medial olivocochlear system.
In addition to genetic factors, brain stem injury due
to environmental factors during the earliest stages of
brain development was hypothesized for some
anomalies associated with autism (Rodier and
Hyman 1998; Rodier 2002). Damage to brain stem
nuclei may be the reason for some of the sensory
abnormalities (Patricia Rodier and Susan Hyman,
personal communication).
In addition to the brain stem, many other
structural abnormalities are associated with autism
(Nurcombe and Stone 2000), especially in
cerebellum, amygdala, hippocampus, and cerebral
cortex. Disruption of minicolumns in cerebral
centers was reported by Casanova et al. (2002).
Tactile sensitivity of normal and autistic children 31
Som
atos
ens
Mot
Res
Dow
nloa
ded
from
info
rmah
ealth
care
.com
by
Hac
ette
pe U
niv.
on
03/2
5/12
For
pers
onal
use
onl
y.
Cortical dysfunction has also been documented. Less
activation was observed in cortical speech-related
areas (Boddaert et al. 2004). There seems to be a
reorganization of left–right hemisphere functions of
cortical auditory areas (Bruneau et al. 2003). Basic
auditory perception is affected. Plaisted et al. (2003)
found abnormally broad psychophysical auditory
filters in autistic children. In addition, smaller
auditory dynamic ranges were found in autism, as
well as increased perception of loudness (Khalfa
et al. 2004).
Low-level tactile processing has not captured
attention in the literature despite the many tactile
problems mentioned in this paper. Therefore,
the study presented here may be an important
contribution. If the brain stem is abnormal in
autism, cuneate and gracile nuclei may be affected
and the tactile afferent input may be altered.
However, the structural abnormalities are not homo-
geneous across the autistic population. Interestingly,
a very recent study by Blakemore et al. (2006) shows
a slight decrease in the 200-Hz tactile thresholds of
adults having the Asperger syndrome (a class of
autism spectrum disorders) as compared to normals,
but there is no difference at 30Hz. Perhaps, the
neural changes underlying tactile sensory problems
do not affect absolute thresholds seriously, but
modify intensity discrimination or magnitude
estimation in autism. Another possibility is the
contribution of the anterolateral system for crude
touch, which has direct connections with the
reticular formation. These questions, among many
others, remain to be tested for this enigmatic
disorder.
Acknowledgements
This work was supported by Bogazici University
Research Fund (04HX101) and TUB_ITAK
(104S228) to Dr Guclu. We thank Cigdem Oztek
for help in experiments with normal subjects, Patricia
Rodier for discussions on brain stem injury in
autism, Susan Hyman for discussions on infantile
autism, and Sidney Chu for comments on the
sensory integration theory. We also appreciate the
editing by Ronald Verrillo.
References
Achenbach TM. 1991. Manual for the Child Behavior Checklist/
4–18 and 1991 profile Burlington, VT: University of Vermont.
Ayres AJ. 1964. Tactile functions. Their relation to hyperactive
and perceptual motor behavior. Am J Occup Ther 18:6–11.
Ayres AJ. 1979. Sensory integration and the child. Los Angeles:
Western Psychological Services.
Ayres AJ, Tickle LS. 1980. Hyper-responsivity to touch and
vestibular stimuli as a predictor of positive response to sensory
integration procedures by autistic children. Am J Occup Ther
34:375–381.
Bachevalier J, Loveland KA. 2006. The orbitofrontal–amygdala
circuit and self-regulation of social–emotional behavior in
autism. Neurosci Biobehav Rev 30:97–117.
Baranek GT. 2002. Efficacy of sensory and motor interventions
for children with autism. J Autism Dev Disord 32:397–422.
Baranek GT, Berkson G. 1994. Tactile defensiveness in children
with developmental disabilities: Responsiveness and habitua-
tion. J Autism Dev Disord 24:457–471.
Baron-Cohen S. 1989. The autistic child’s theory of mind: A case
of specific developmental delay. J Child Psychol Psychiatry
30:285–297.
Bauer BA. 1977. Tactile sensitivity: Development of a behavioral
responses checklist. Am J Occup Ther 31:357–361.
Bernier R, Dawson G, Panagiotides H, Webb S. 2005. Individuals
with autism spectrum disorder show normal responses to a fear
potential startle paradigm. J Autism Dev Disord 35:575–583.
Blakemore S-J, Tavassoli T, Calo S, Thomas RM, Catmur C,
Frith U, Haggard P. 2006. Tactile sensitivity in Asperger
syndrome. Brain Cogn 61:5–13.
Boddaert N, Chabane N, Belin P, Bourgeois M, Royer V,
Barthelemy C, Mouren-Simeoni M-C, Philippe A, Brunelle F,
Samson Y, et al. 2004. Perception of complex sounds in autism:
Abnormal auditory cortical processing in children. Am J
Psychiatry 161:2117–2120.
Bolanowski SJ, Gescheider GA, Verrillo RT, Checkosky CM.
1988. Four channels mediate the mechanical aspects of touch.
J Acoust Soc Am 84:1680–1694.
Bruneau N, Bonnet-Brilhault F, Gomot M, Adrien J-L,
Barthelemy C. 2003. Cortical auditory processing and com-
munication in children with autism: Electrophysiological/
behavioral relations. Int J Psychophysiol 51:17–25.
Bundy AC, Lane SJ, Murray EA. 2002. Sensory integration.
Theory and practice., 2nd ed. Philadelphia: F. A. Davis.
Casanova MF, Buxhoeveden DP, Switala AE, Roy E. 2002.
Minicolumnar pathology in autism. Neurology 58:428–432.
Dunn W. 1994. Performance of typical children on the sensory
profile: An item analysis. Am J Occup Ther 48:967–974.
Dunn W, Westman K. 1997. The sensory profile: The perfor-
mance of a national sample of children without disabilities.
Am J Occup Ther 51:25–34.
Ermer J, Dunn W. 1998. The Sensory Profile: A discriminant
analysis of children with and without disabilities. Am J Occup
Ther 52:283–290.
Field T, Lasko D, Mundy P, Henteleff T, Kabat S, Talpins S,
Dowling M. 1997. Brief report: Autistic children’s attentiveness
and responsivity improve after touch therapy. J Autism Dev
Disord 27:333–338.
Fombonne E. 2003. The prevalence of autism. J Am Med Assoc
289:87–89.
Frith U, Happe F. 1994. Autism: Beyond ‘‘theory of mind’’.
Cognition 50:115–132.
Gescheider GA, Bolanowski SJ, Hall KL, Hoffman KE,
Verrillo RT. 1994. The effects of aging on information-
processing channels in the sense of touch: I. Absolute
sensitivity. Somatosens Mot Res 11:345–357.
Gescheider GA, Bolanowski SJ, Hardick KR. 2001.
The frequency selectivity of information-processing channels
in the tactile sensory system. Somatosens Mot Res 18:191–201.
Gescheider GA, O’Malley MJ, Verrillo RT. 1983. Vibrotactile
forward masking: Evidence for channel independence. J Acoust
Soc Am 74:474–485.
Guclu B, Bolanowski SJ. 2002. Modeling population responses of
rapidly-adapting mechanoreceptive fibers. J Comput Neurosci
12:201–218.
32 B. Guclu et al.
Som
atos
ens
Mot
Res
Dow
nloa
ded
from
info
rmah
ealth
care
.com
by
Hac
ette
pe U
niv.
on
03/2
5/12
For
pers
onal
use
onl
y.
Guclu B, Bolanowski SJ. 2004. Probability of stimulus detection
in a model population of rapidly adapting fibers. Neural
Comput 16:39–58.
Guclu B, Bolanowski SJ. 2005. Vibrotactile thresholds of the
non-pacinian I channel: I. Methodological issues. Somatosens
Mot Res 22:49–56.
Guclu B, Tanidir C, Motvalli N, Mukaddes N, Unai F. 2006.
Tactile defensiveness in avtism is probably not caused by
perceptual deficits. Society for Neuroscience Abstracts, 32,
Program no: 692.20.
Harrison J, Hare DJ. 2004. Brief report: Assessment of sensory
abnormalities in people with autistic spectrum disorders.
J Autism Dev Disord 34:727–730.
Hill EL, Frith U. 2003. Understanding autism: Insights from
mind and brain. In: Frith U, Hill EL, editors. Autism: Mind
and brain. Oxford: Oxford University Press. pp 1–19.
Hughes C, Russell J, Robbins TW. 1994. Evidence for executive
dysfunction in autism. Neuropsychologia 32:477–492.
Kalkanc| O, Guclu B. (2005). Masking the Pacinian (P) tactile
channel in humans [in Turkish]. _Istefanopulos Y, Gulcur HO,
editors. BIYOMUT (2005), National Meeting of Biomedical
Engineering. Istanbul: Bogazici University Press. pp 42–46.
Khalfa S, Bruneau N, Roge B, Georgieff N, Veuillet E,
Adrien J-L, Barthelemy C, Collet L. 2001. Peripheral
auditory asymmetry in infantile autism. Eur J Neurosci
13:628–632.
Khalfa S, Bruneau N, Roge B, Georgieff N, Veuillet E,
Adrien J-L, Barthelemy C, Collet L. 2004. Increased perception
of loudness in autism. Hearing Res 198:87–92.
Lamore PJJ, Keemink CJ. 1988. Evidence for different types of
mechanoreceptors from measurements of the psychophysical
threshold for vibrations under different stimulation conditions.
J Acoust Soc Am 83:2339–2351.
Larson KA. 1982. The sensory history of developmentally delayed
children with and without tactile defensiveness. Am J Occup
Ther 36:590–596.
Makous JC, Gescheider GA, Bolanowski SJ. 1996. Decay in the
effect of vibrotactile masking. J Acoust Soc Am 99:1124–1129.
Mangeot SD, Miller LJ, McIntosh DM, McGrath-Clarke J,
Simon J, Hagerman RJ, Goldson E. 2001. Sensory modulation
dysfunction in children with attention-deficit-hyperactivity
disorder. Dev Med Child Neurol 43:399–406.
McCracken A. 1975. Tactile function of educable mentally
retarded children. Am J Occup Ther 29:397–402.
McIntosh DN, Miller LJ, Shyu V, Hagerman RJ. 1999. Sensory-
modulation disruption, electrodermal responses, and functional
behaviors. Dev Med Child Neurol 41:608–615.
Nurcombe B, Stone W. 2000. Pervasive developmental disorders.
In: Ebert MH, Loosen PT, Nurcombe B, editors. Current
diagnosis & treatment in psychiatry. New York: Lange Medical
Books/McGraw-Hill. pp 546–555.
Ornitz EM. 1983. The functional neuroanatomy of infantile
autism. Int J Neurosci 19:85–124.
Parush S, Sohmer H, Steinberg A, Kaitz M. 1997. Somatosensory
functioning in children with attention deficit hyperactivity
disorder. Dev Med Child Neurol 39:464–468.
Plaisted K, Saksida L, Alcantara J, Weisblatt E. 2003. Towards an
understanding of the mechanisms of weak central coherence
effects: Experiments in visual configural learning and auditory
perception. In: Frith U, Hill EL, editors. Autism: Mind and
brain. Oxford: Oxford University Press. pp. 187–210.
Rodier PM. 2002. Converging evidence for brain stem injury in
autism. Dev Psychopathol 14:537–557.
Rodier PM, Hyman SL. 1998. Early environmental factors in
autism. Ment Retard Disabil Res Rev 4:121–128.
Rogers SJ, Ozonoff S. 2005. Annotation: What do we know about
sensory dysfunction in autism? A critical review of the empirical
evidence. J Child Psychol Psychiatry 46:1255–1268.
Royeen CB. 1986. The development of a touch scale for
measuring tactile defensiveness in children. Am J Occup Ther
40:414–419.
Royeen CB, Fortune JC. 1990. Touch Inventory for elementary-
school-aged children. Am J Occup Ther 44:155–159.
Salmond CH, de Haan M, Friston KJ, Gadian DG,
Vargha-Khadem F. 2003. Investigating individual differences
in brain abnormalities in autism. In: Frith U, Hill EL, editors.
Autism: Mind and brain. Oxford: Oxford University Press.
pp 247–265.
Schopler E, Reichler RT, DeVellis RF, Daly K. 1980. Toward
objective classification of childhood autism: Childhood Autism
Rating Scale (CARS). J Autism Dev Disord 10:91–103.
Swettenham J, Condie S, Campbell R, Milne E, Coleman M.
2003. Does the perception of moving eyes trigger
reflexive visual orienting in autism? In: Frith U, Hill EL,
editors. Autism: Mind and brain. Oxford: Oxford University
Press. pp 89–107.
Tan|d|r C, Guclu B, Motavall| Mukaddes N, Unal F. (2005).
Tactile sensitivity in autism. Soc Neurosci Abstr 31, program
no: 564.8.
Thivierge J, Bedard C, Cote R, Maziade M. 1990. Brainstem
auditory evoked response and subcortical abnormalities in
autism. Am J Psychiatry 147:1609–1613.
Verrillo RT. 1963. Effect of contactor area on the vibrotactile
threshold. J Acoust Soc Am 35:1962–1966.
Verrillo RT. 1971. Vibrotactile thresholds measured at the finger.
Percept Psychophys 9:329–330.
Yirmiya N, Kasari C, Sigman M, Mundy P. 1989. Facial
expressions of affect in autistic, mentally retarded and normal
children. J Child Psychol Psychiatry 30:725–735.
Zwislocki JJ, Relkin EM. 2001. On a psychophysical transformed-
rule up and down method converging on a 75% level of correct
responses. Proc Natl Acad Sci USA 98:4811–4814.
Tactile sensitivity of normal and autistic children 33
Som
atos
ens
Mot
Res
Dow
nloa
ded
from
info
rmah
ealth
care
.com
by
Hac
ette
pe U
niv.
on
03/2
5/12
For
pers
onal
use
onl
y.
Related Documents