90148 2007 Graphs

90148 2007 Graphs. Question 1 Use the grids alongside to draw the graphs of:
Dec 17, 2015
Welcome message from author
This document is posted to help you gain knowledge. Please leave a comment to let me know what you think about it! Share it to your friends and learn new things together.
Transcript

90148
2007 Graphs

Question 1
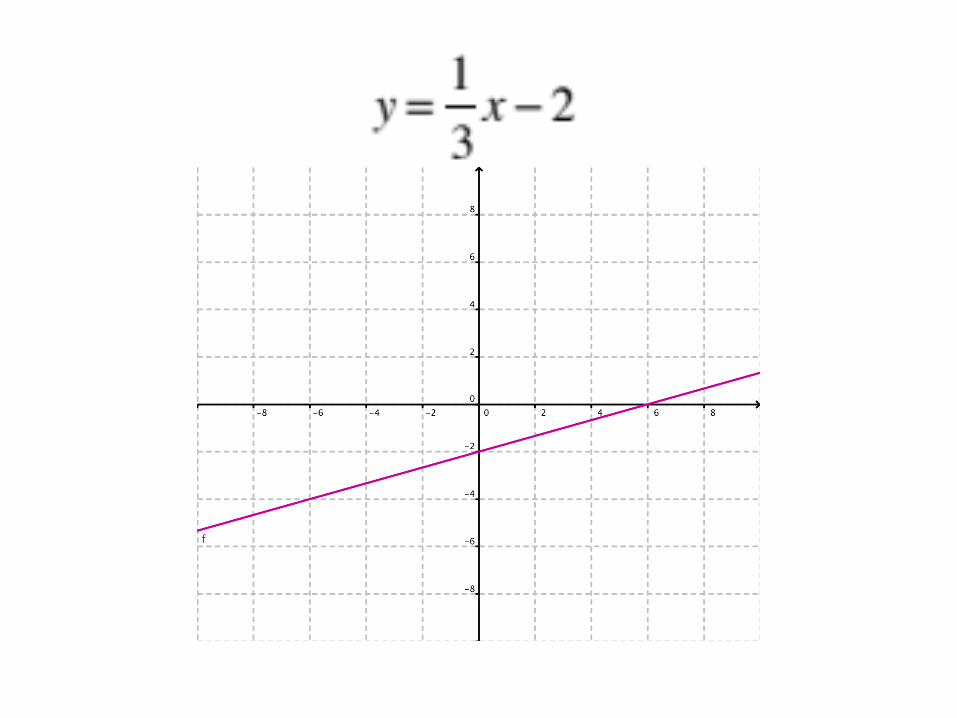
• Use the grids alongside to draw the graphs of:
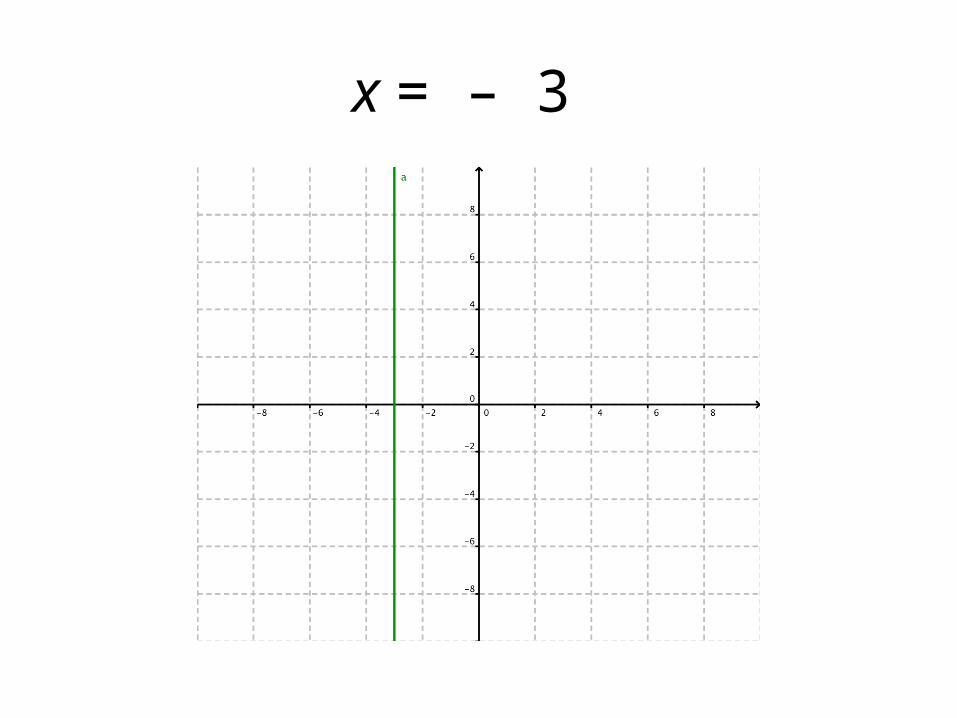
x = – 3
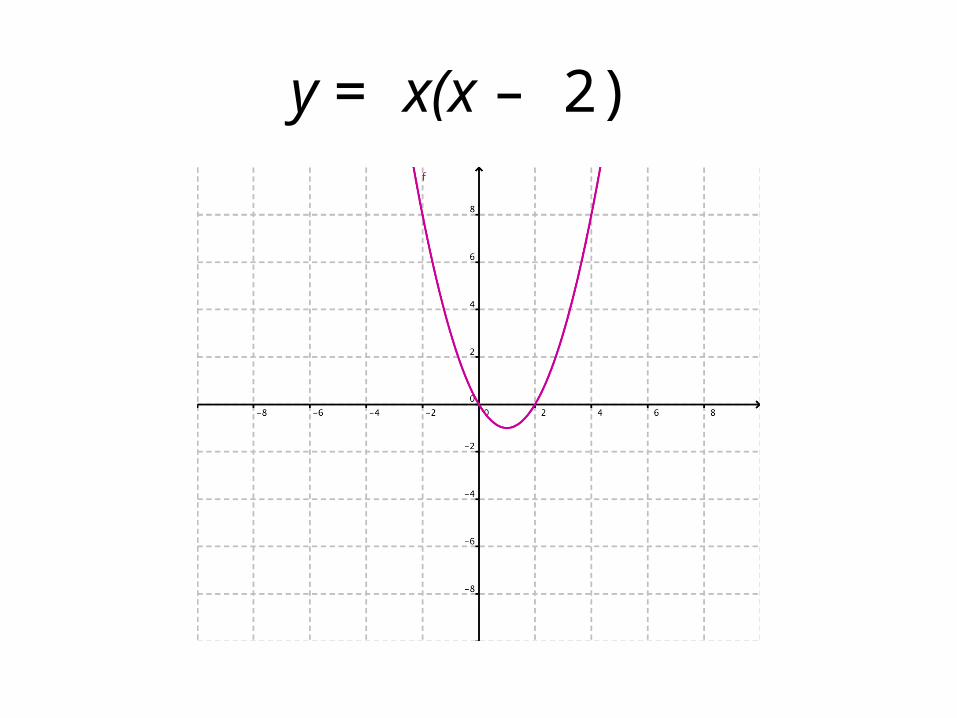
y = x(x – 2)
Question 2
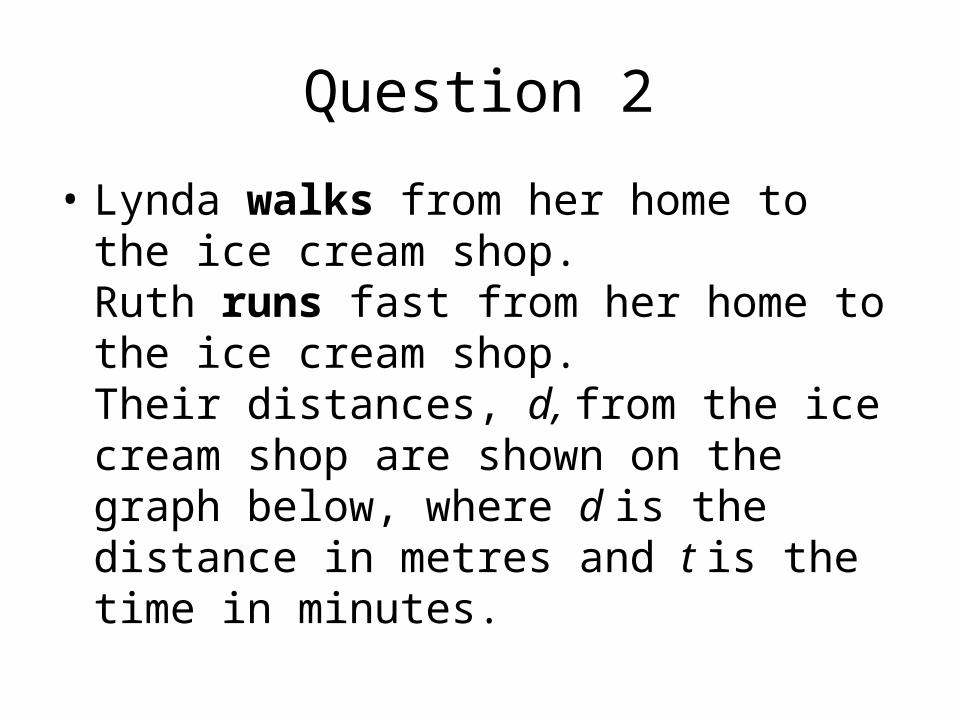
• Lynda walks from her home to the ice cream shop.Ruth runs fast from her home to the ice cream shop.Their distances, d, from the ice cream shop are shown on the graph below, where d is the distance in metres and t is the time in minutes.
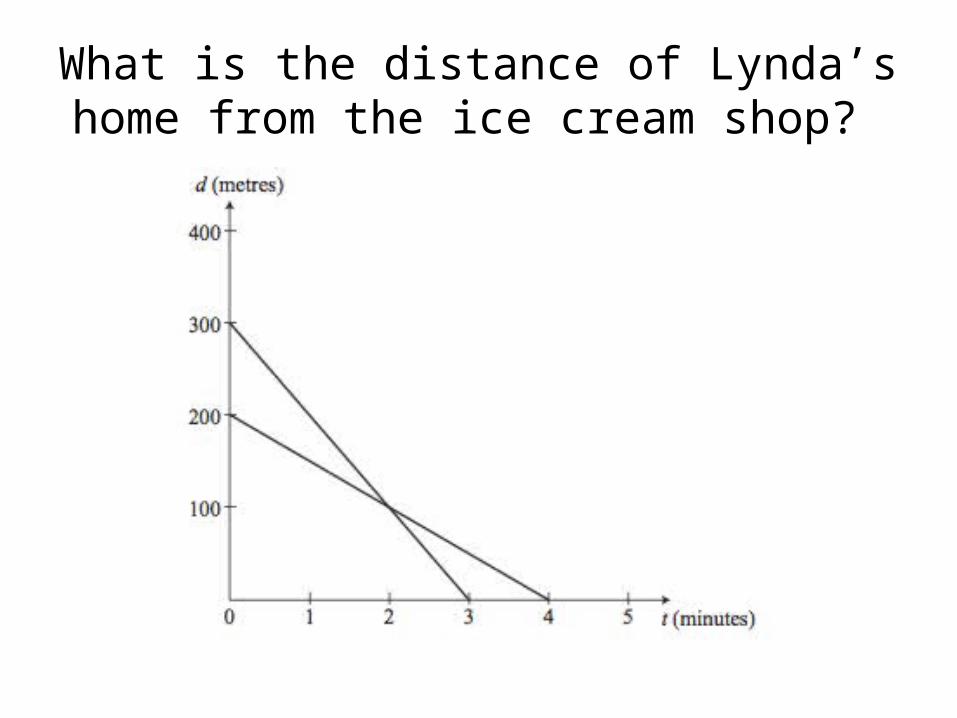
What is the distance of Lynda’s home from the ice cream shop?

What is the distance of Lynda’s home from the ice cream shop?
200m
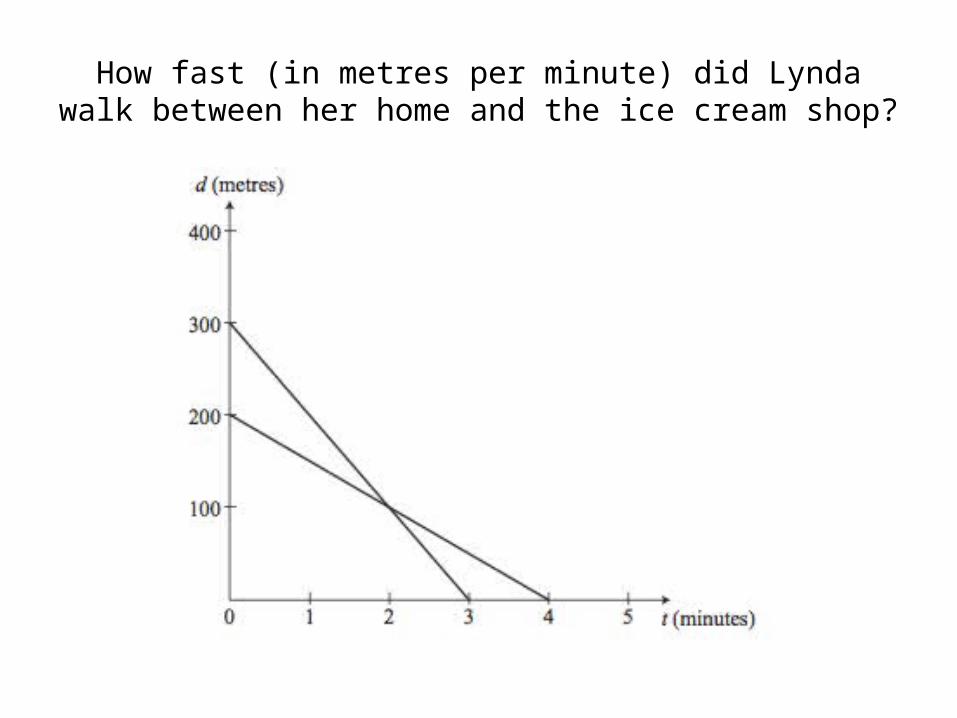
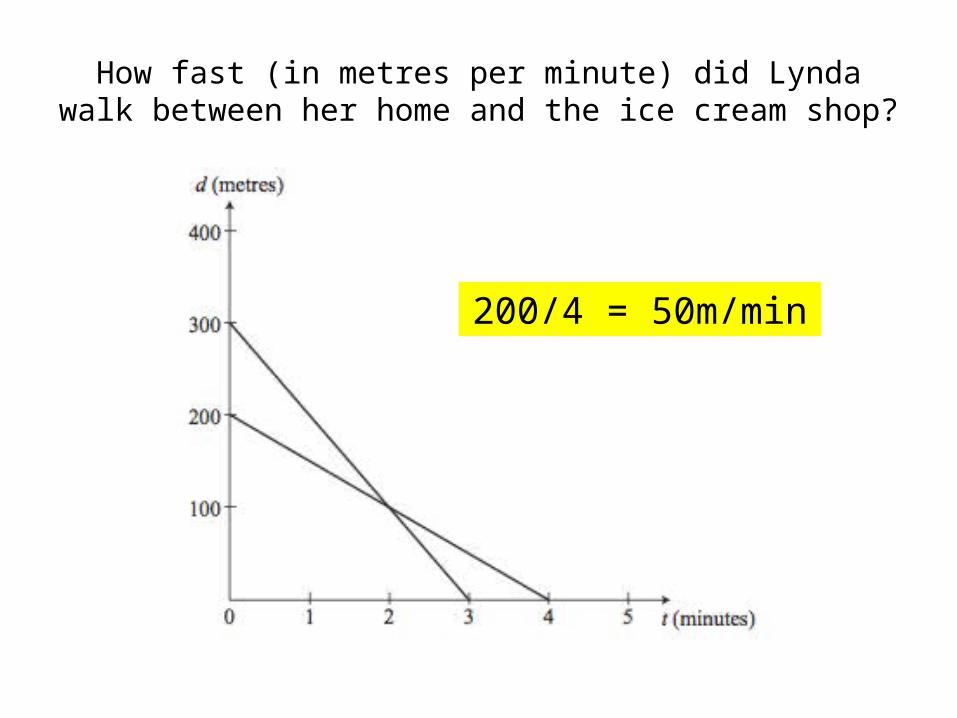
How fast (in metres per minute) did Lynda walk between her home and the ice cream shop?
How fast (in metres per minute) did Lynda walk between her home and the ice cream shop?
200/4 = 50m/min
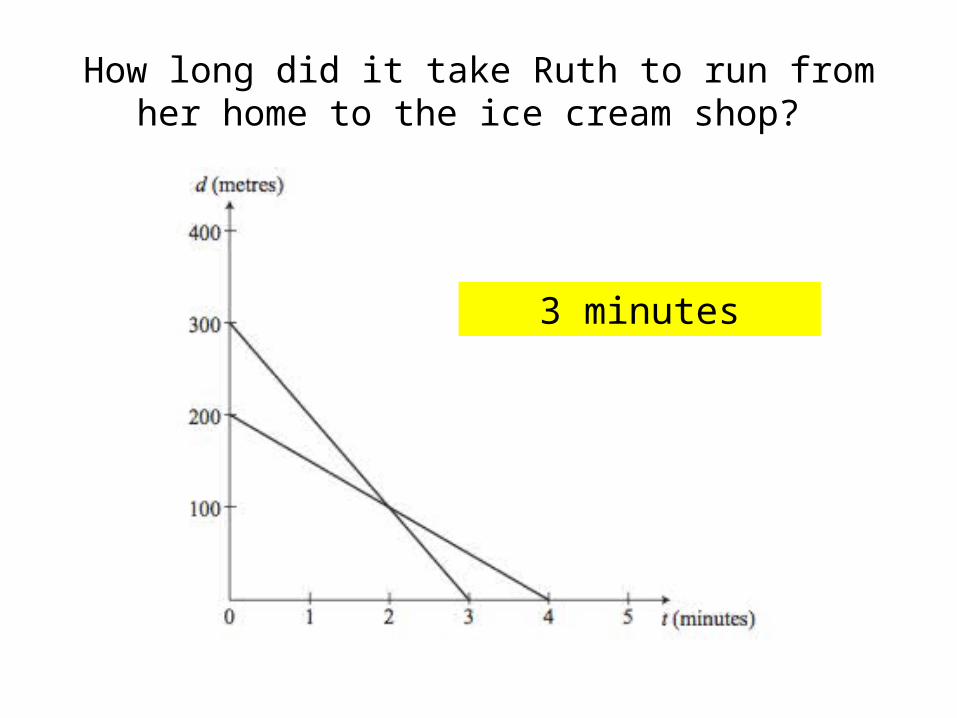
How long did it take Ruth to run from her home to the ice cream shop?
3 minutes

Write the equation for Ruth’s distance, d, from the ice cream shop.

Write the equation for Ruth’s distance, d, from the ice cream shop.

Lynda and Ruth both left home at 4.30 pm to go to the ice cream shop. When would they be the same distance
from the ice cream shop?
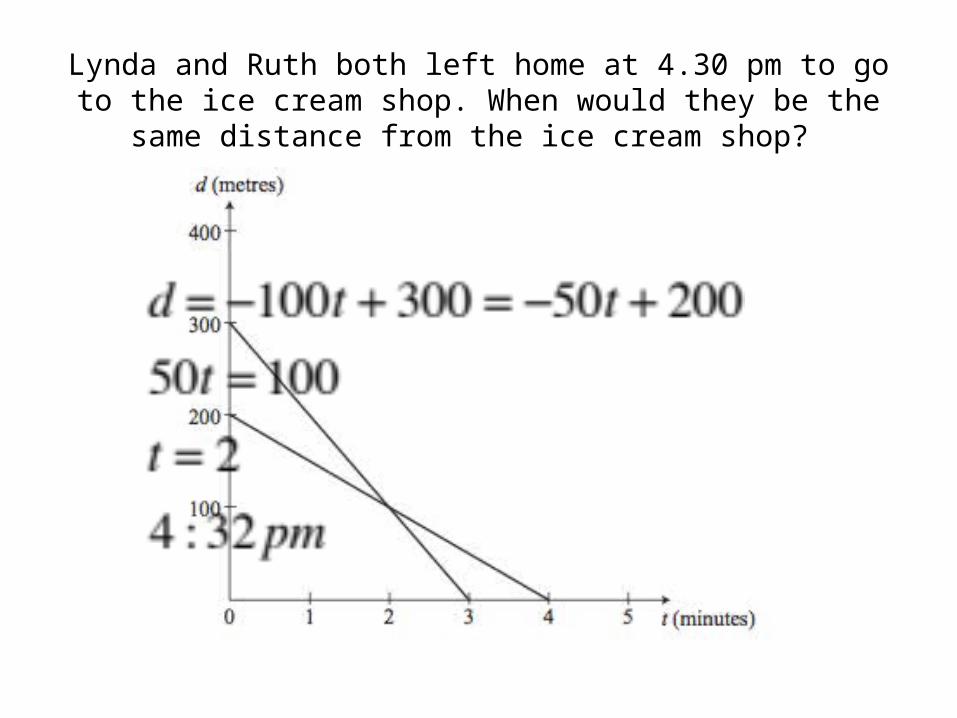
Lynda and Ruth both left home at 4.30 pm to go to the ice cream shop. When would they be the same distance
from the ice cream shop?

Question 3
• Write the equations of the lines drawn on the grid below.

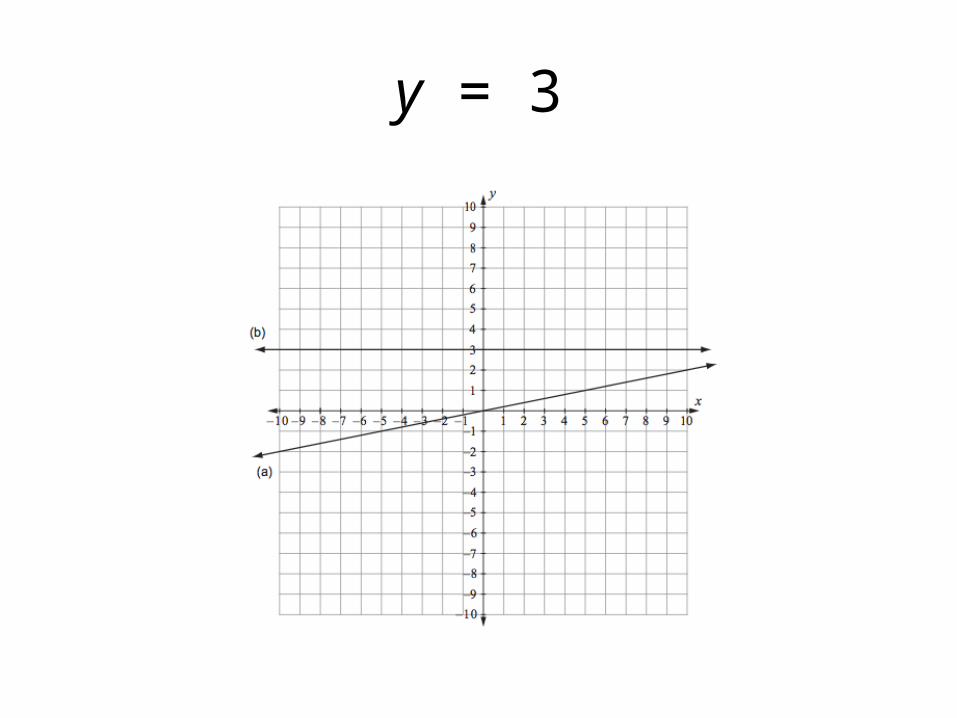
y = 3

Question 4

2y + 3x = 6
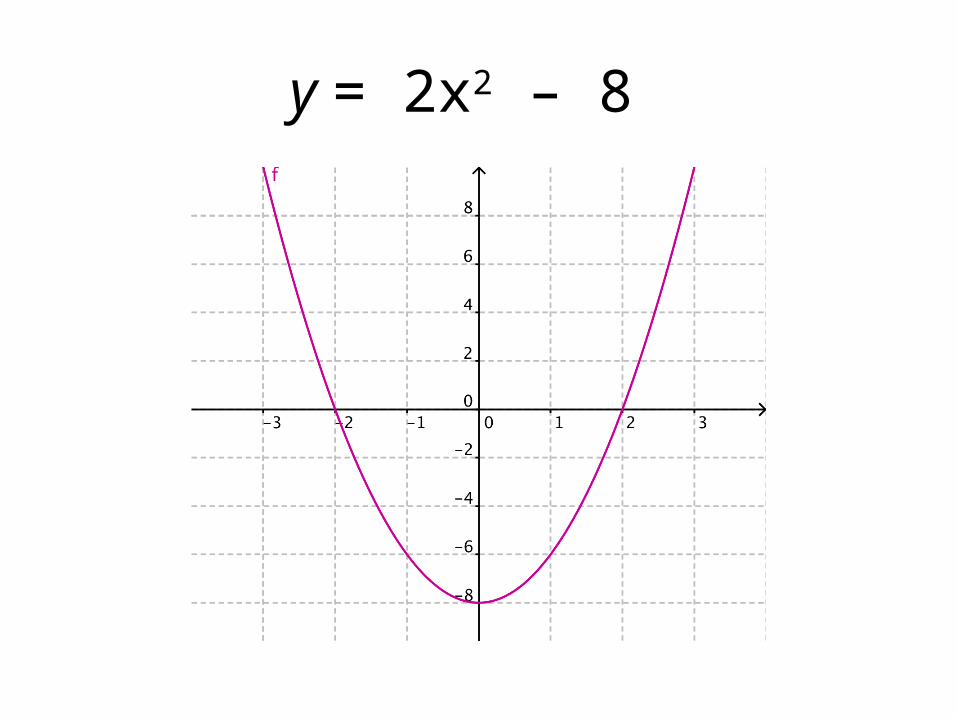
y = 2x2 – 8

y = –x(x – 1) – 2 = –x2 + x – 2
Question 5
• John and Richard were playing with a soccer ball.The graph shows the height of the ball above the ground, during one kick from John, J, towards Richard, R.The height of the ball above the ground is y metres.The horizontal distance of the ball from John is x metres.
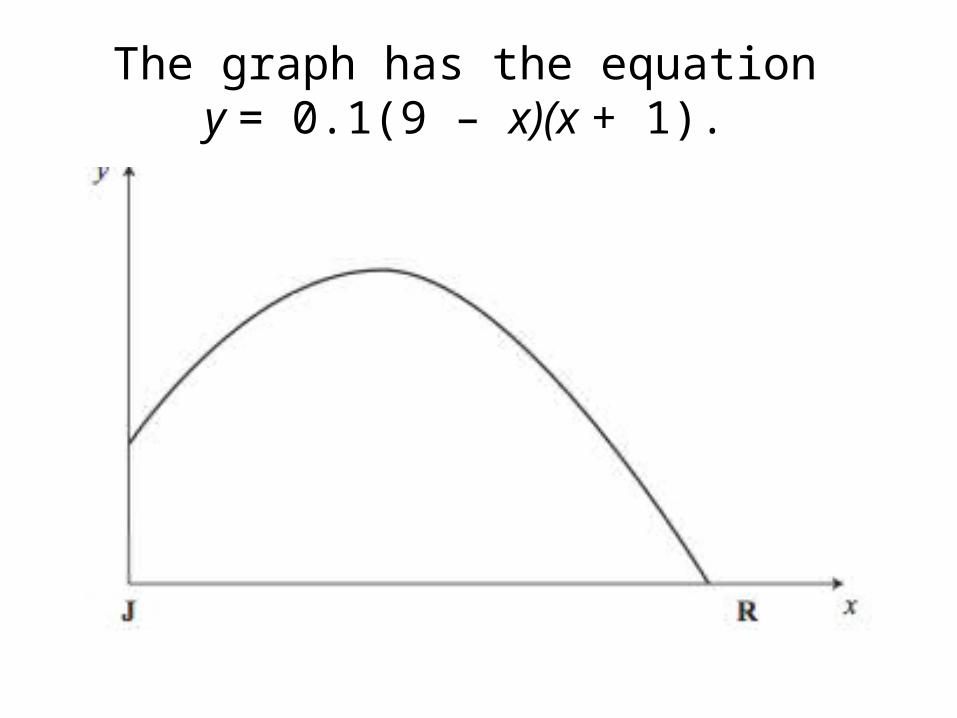
The graph has the equation y = 0.1(9 – x)(x + 1).

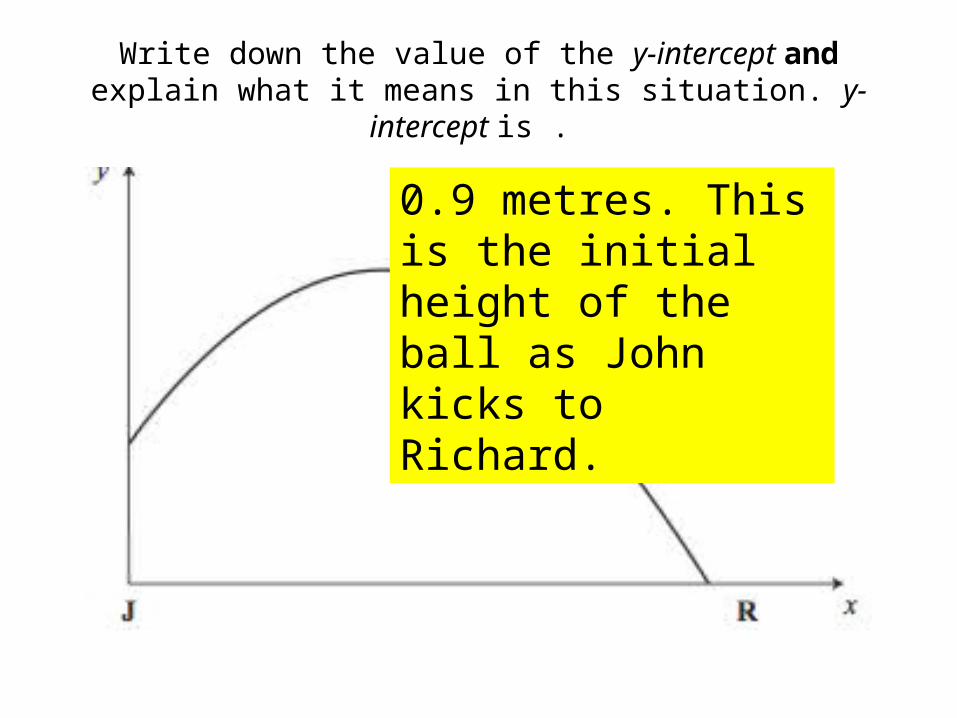
Write down the value of the y-intercept and explain what it means in this situation. y-intercept is .
Write down the value of the y-intercept and explain what it means in this situation. y-intercept is .
0.9 metres. This is the initial height of the ball as John kicks to Richard.

What is the greatest height of the ball above the ground?

What is the greatest height of the ball above the ground?
Use x =4 to get 2.5 metres.
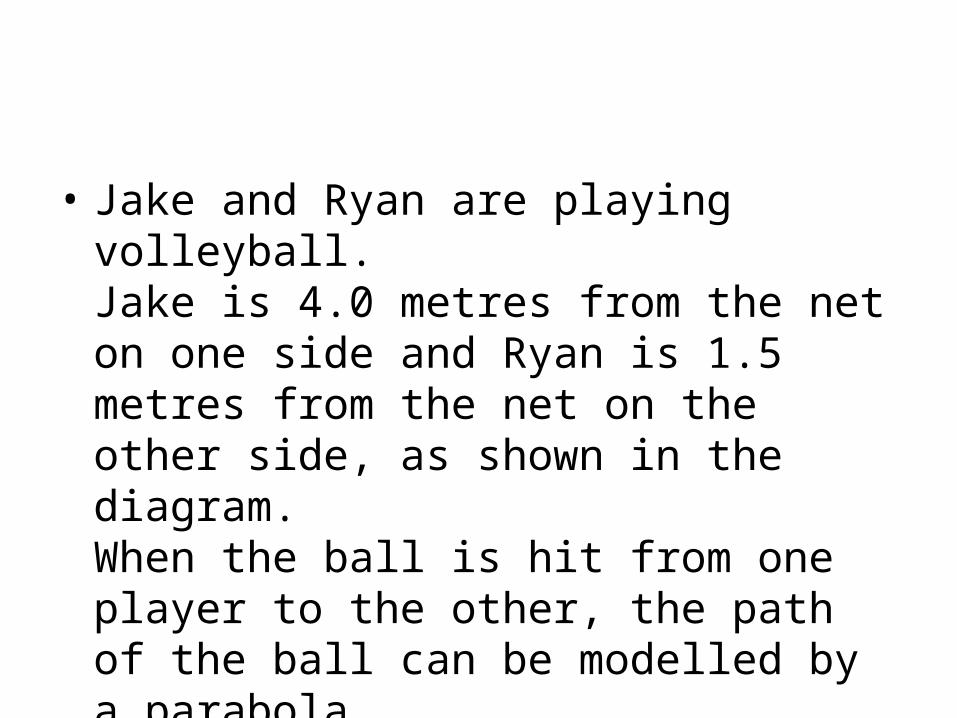
• Jake and Ryan are playing volleyball.Jake is 4.0 metres from the net on one side and Ryan is 1.5 metres from the net on the other side, as shown in the diagram.When the ball is hit from one player to the other, the path of the ball can be modelled by a parabola.
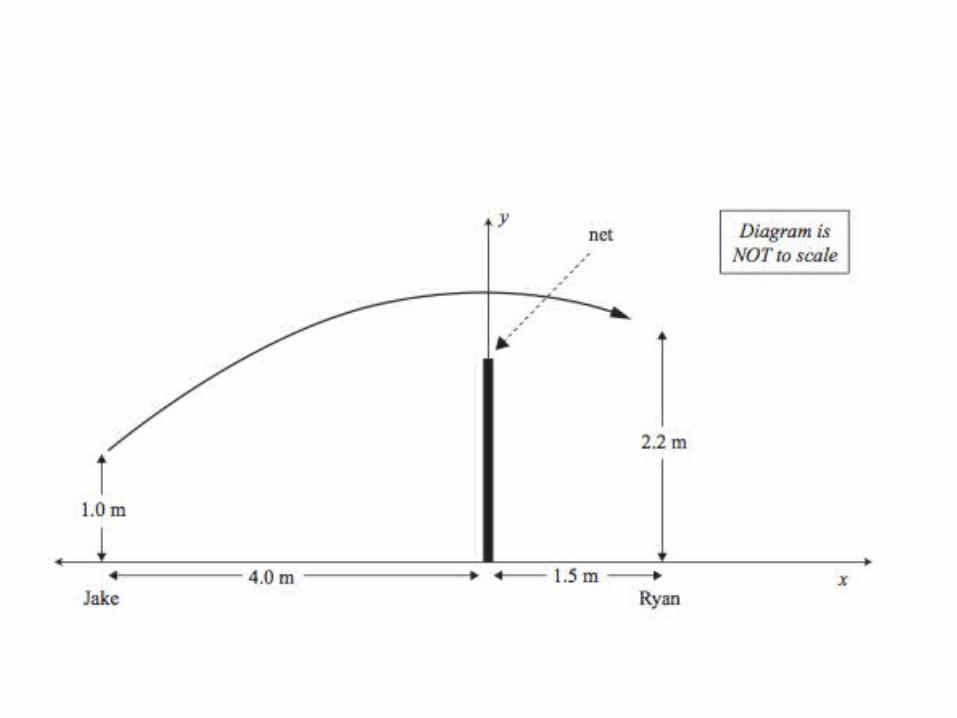
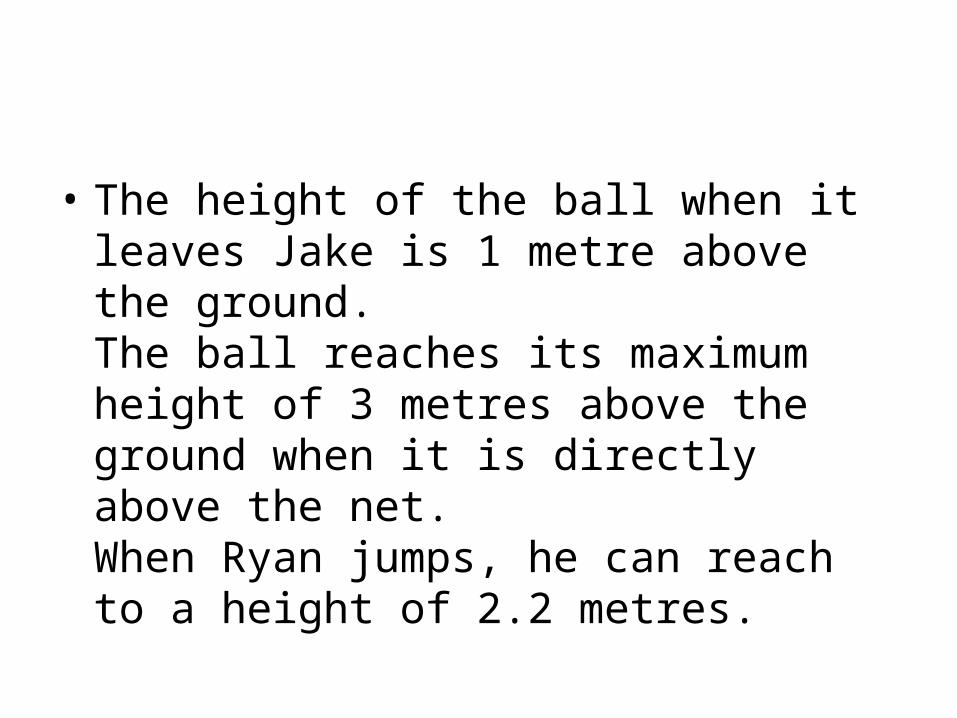
• The height of the ball when it leaves Jake is 1 metre above the ground.The ball reaches its maximum height of 3 metres above the ground when it is directly above the net.When Ryan jumps, he can reach to a height of 2.2 metres.

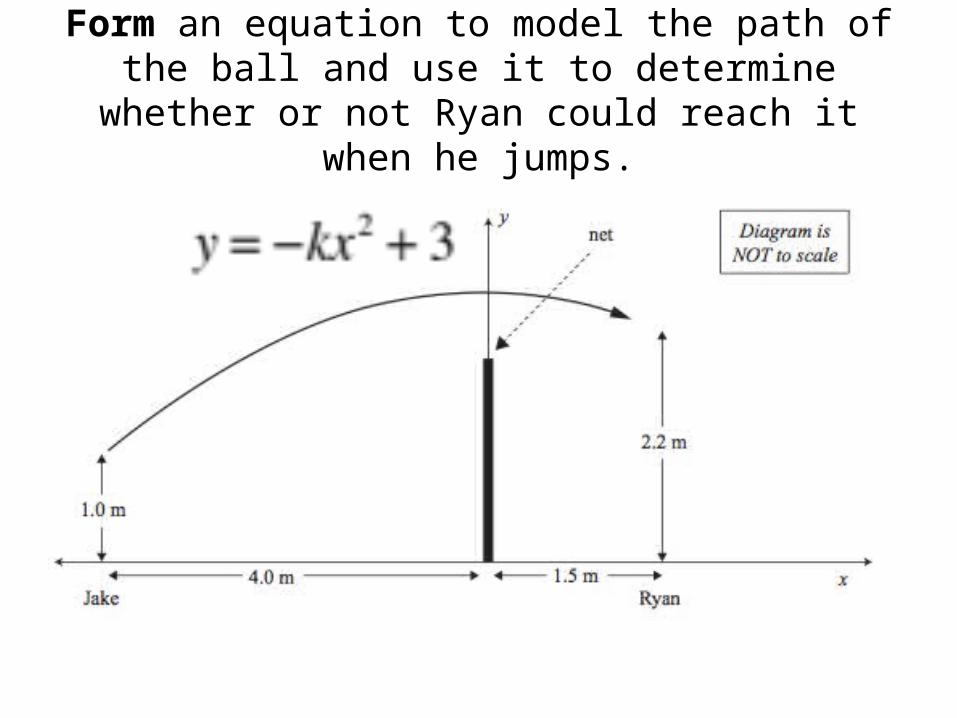
Form an equation to model the path of the ball and use it to determine whether or not Ryan could reach it
when he jumps.
Form an equation to model the path of the ball and use it to determine whether or not Ryan could reach it
when he jumps.
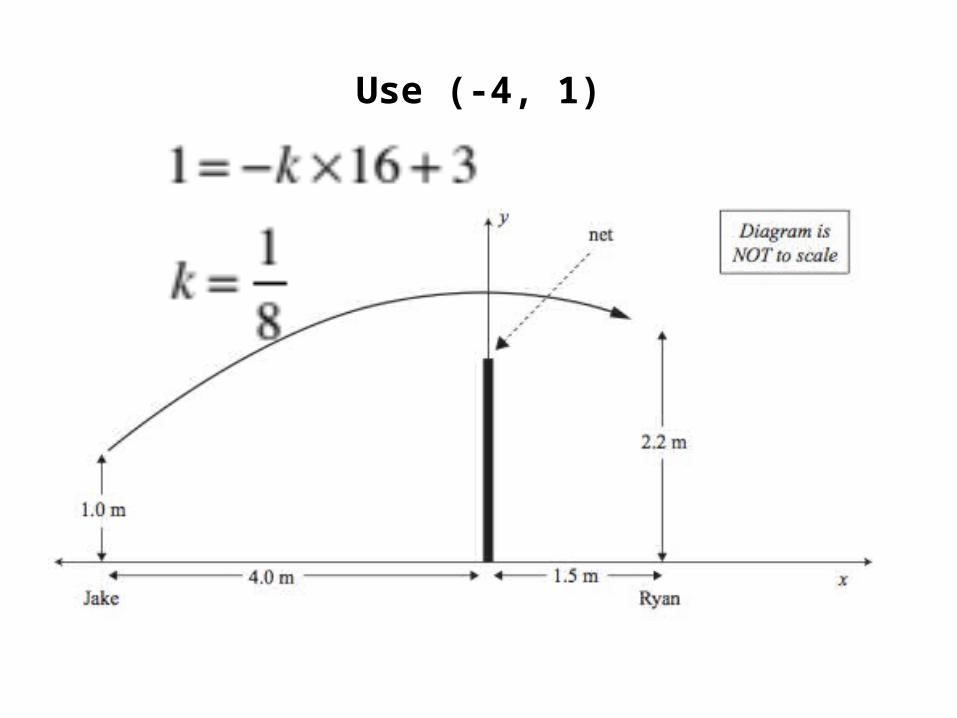
Use (-4, 1)
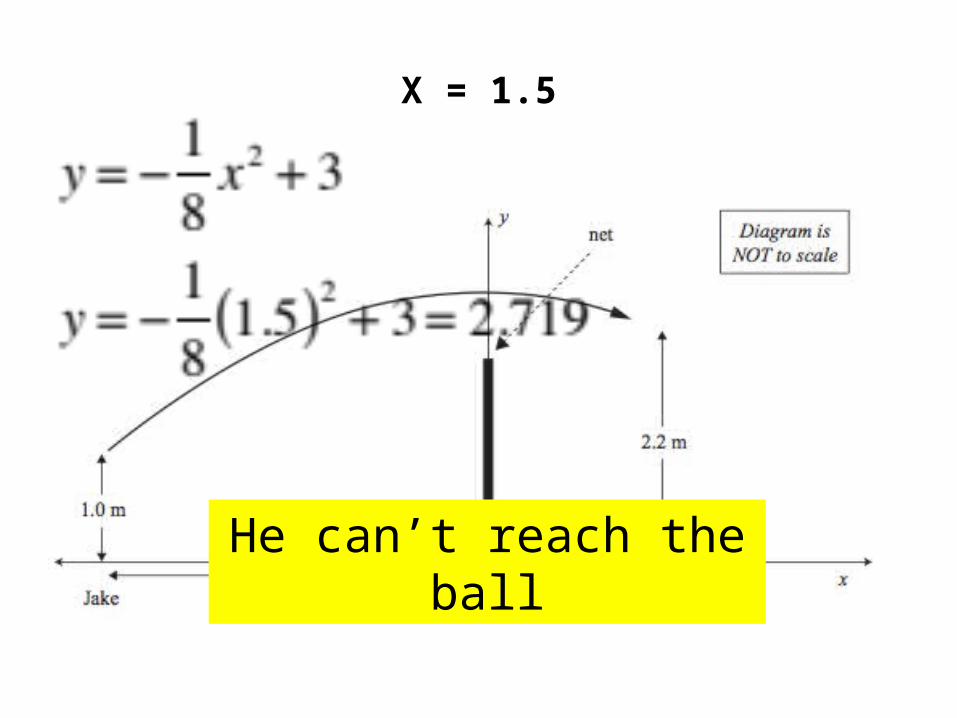
X = 1.5
He can’t reach the ball
Related Documents