Review Notes

Review Notes. Visual Statistics Stem-and-Leaf Graphs (Stemplots) Line Graphs Bar Graphs.
Dec 18, 2015
Welcome message from author
This document is posted to help you gain knowledge. Please leave a comment to let me know what you think about it! Share it to your friends and learn new things together.
Transcript

Review Notes

Visual Statistics
Stem-and-Leaf Graphs (Stemplots)
Line Graphs
Bar Graphs

Visual Statistics
Histograms
Box Plots
Center
Mean
Median
Mode

Center and Spread (Median)
Median
Quartiles
5 Number Summary
IQR
Box Plot
Outliers

Center and Spread (Mean)
Mean
Deviations from mean
Zero property of deviations from mean
ADM (MAD)
Standard Deviation and Variance

Symmetry
Symmetry
Skew (Left; Right)
Mean, median and skew
Questions
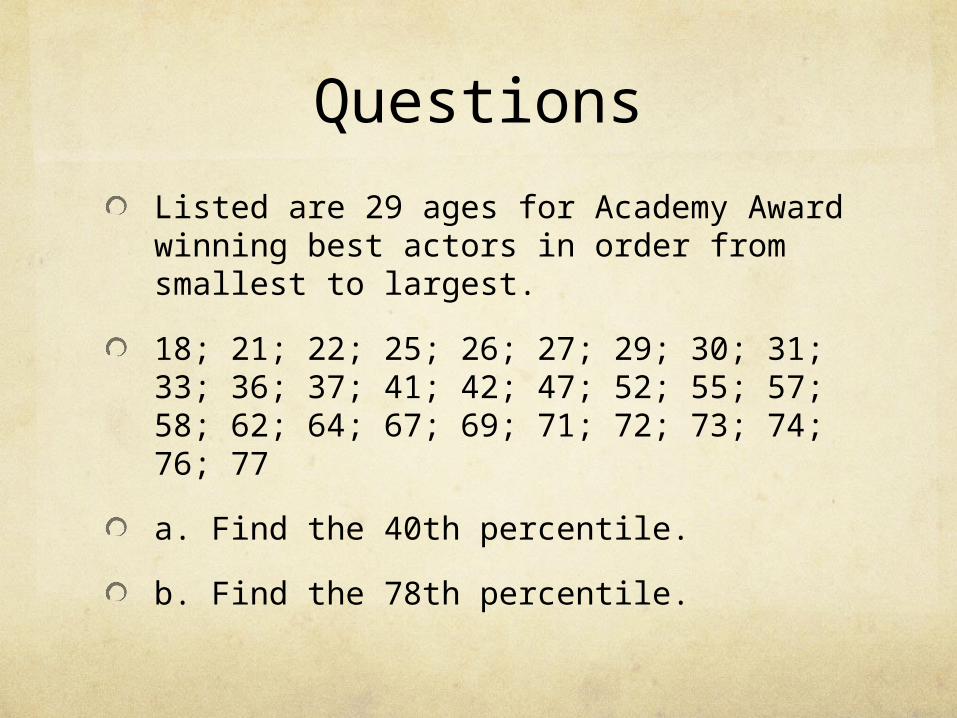
Listed are 29 ages for Academy Award winning best actors in order from smallest to largest.
18; 21; 22; 25; 26; 27; 29; 30; 31; 33; 36; 37; 41; 42; 47; 52; 55; 57; 58; 62; 64; 67; 69; 71; 72; 73; 74; 76; 77
a. Find the 40th percentile.
b. Find the 78th percentile.

Questions
Sketch the box plot

In a survey of 20-year-olds in China, Germany, and the United States, people were asked the number of foreign countries they had visited in their lifetime. The following box plots display the results.
a. In complete sentences, describe what the shape of each box plot implies about the distribution of the datacollected.

b. Have more Americans or more Germans surveyed been to over eight foreign countries?
c. Compare the three box plots. What do they imply about the foreign travel of 20-year-old residents of the three countries when compared to each other?
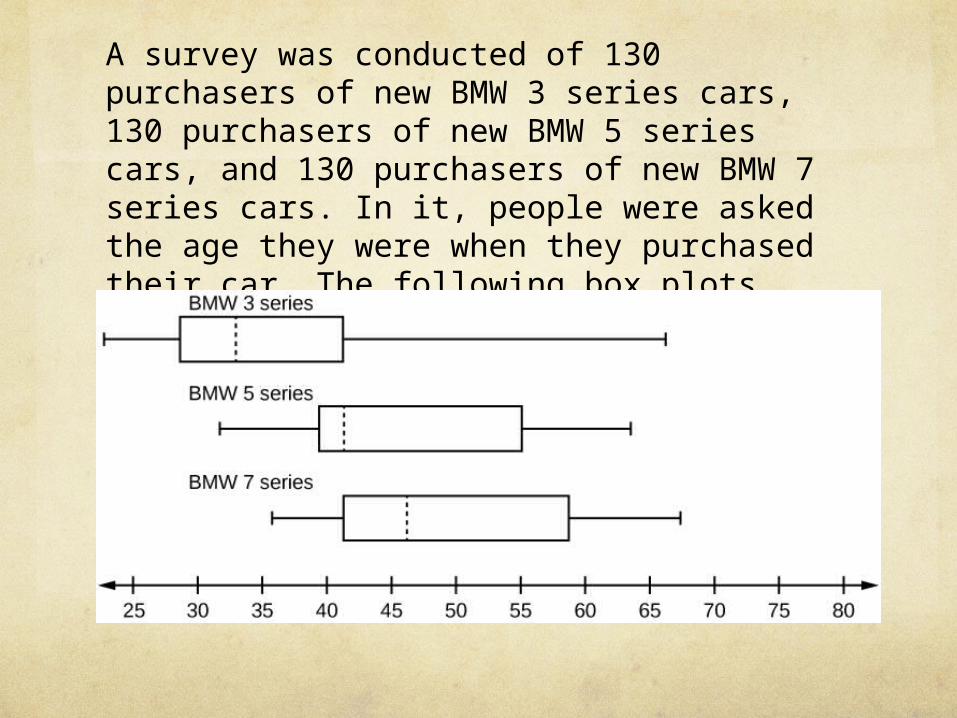
A survey was conducted of 130 purchasers of new BMW 3 series cars, 130 purchasers of new BMW 5 series cars, and 130 purchasers of new BMW 7 series cars. In it, people were asked the age they were when they purchased their car. The following box plots display the results.
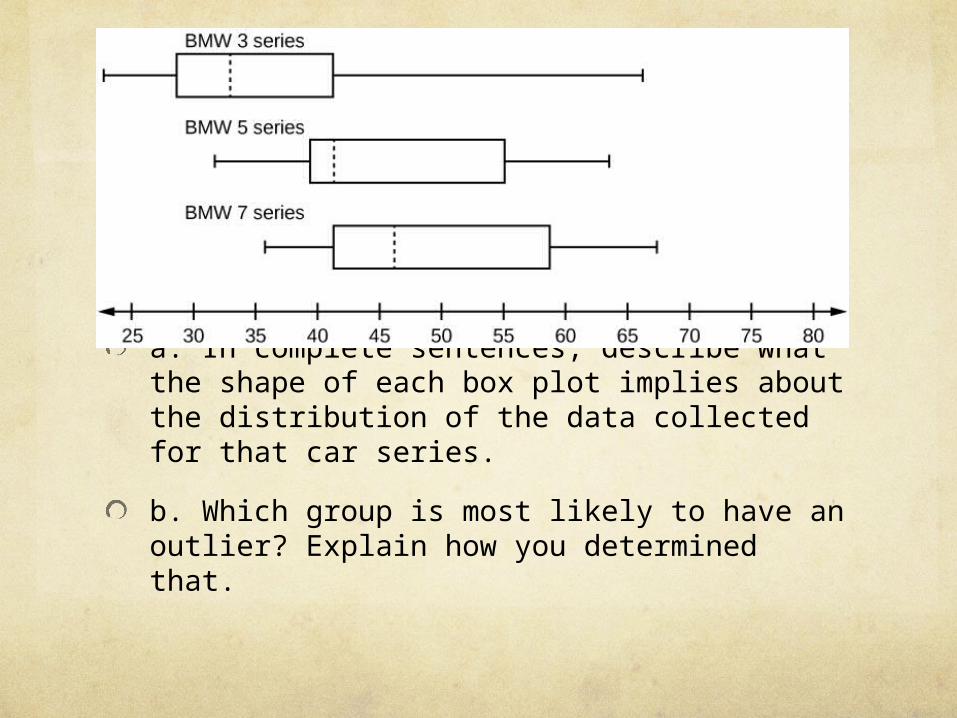
a. In complete sentences, describe what the shape of each box plot implies about the distribution of the data collected for that car series.
b. Which group is most likely to have an outlier? Explain how you determined that.
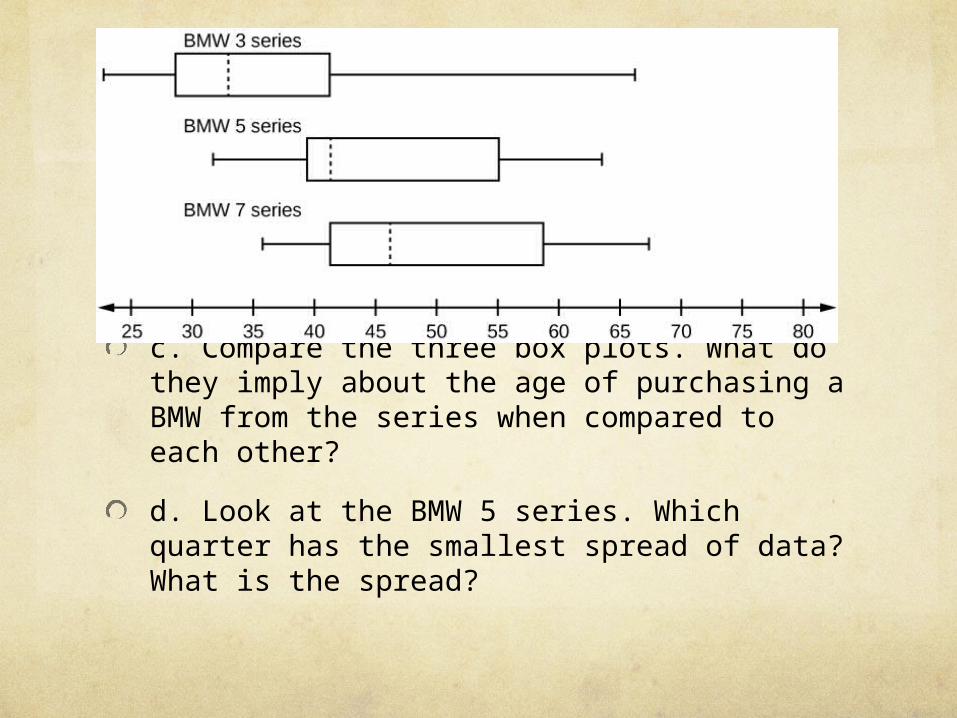
c. Compare the three box plots. What do they imply about the age of purchasing a BMW from the series when compared to each other?
d. Look at the BMW 5 series. Which quarter has the smallest spread of data? What is the spread?

e. Look at the BMW 5 series. Which quarter has the largest spread of data? What is the spread?
f. Look at the BMW 5 series. Estimate the interquartile range (IQR).
g. Look at the BMW 5 series. Are there more data in the interval 31 to 38 or in the interval 45 to 55? How do you know this?

h. Look at the BMW 5 series. Which interval has the fewest data in it? How do you know this?
i. 31–35
ii. 38–41
iii. 41–64
Related Documents