Title: CASH HOLDING – THE SIGNAL FOR MERGERS AND ACQUISITIONS IN NON-FINANCIAL ACQUIRING FIRMS CASE: JAPAN NIKKEI 225 2018 Master’s Thesis Graduate School of Business Student ID 3 D 1 6 0 1 3 0 Name PHAN VIET HUNG Submission Date (yyyy/mm/dd) 2018 / 06 / 29 Supervisor Professor Philip Sugai

Welcome message from author
This document is posted to help you gain knowledge. Please leave a comment to let me know what you think about it! Share it to your friends and learn new things together.
Transcript
Title:
CASH HOLDING – THE SIGNAL FOR MERGERS AND ACQUISITIONS IN
NON-FINANCIAL ACQUIRING FIRMS
CASE: JAPAN NIKKEI 225
2018 Master’s Thesis
Graduate School of Business
Student ID 3 D 1 6 0 1 3 0
Name PHAN VIET HUNG
Submission Date
(yyyy/mm/dd)
2018
/
06
/
29
Supervisor Professor Philip Sugai
DECLARATION OF ORIGINALITY OF WORK
I affirm that the attached work is entirely my own except where the words or ideas of other
writers are specifically acknowledged through the use of inverted commas and in-text
references. This assignment has not been submitted for any other subject at Doshisha
University (or other institution). I have revised, edited, and proofread this paper.
Word count: 10,123
Student signature:
I
ABSTRACT
This research empirically tests the relation between M&A and Cash holding
level in turbulent context of Japanese economies with double finance crisis in the
period of 2009-2013. The fact, that the cash holding in Japanese non-financial
firms climbed rapidly while the M&A value just fluctuated or even went down in
this period, need to be relooked by agency problem and related concepts. The
empirical evidence shows that there is no significant difference of M&A value
among the groups of Cash holding levels in the scope of Japanese Nikkei 200 non-
financial firms in this period. The research points out the absence of agency
concept in M&A value and utilizes the light of precautionary motive to cover.
CASH HOLDING – THE SIGNAL FOR MERGERS AND ACQUISITIONS IN
NON-FINANCIAL ACQUIRING FIRMS
…
CASE: JAPAN NIKKEI 225
Hung Phan Viet
June 2018
Keywords: Cash holding; Cash holding level; M&A value, agency problem.

II
DEDICATION
…
With all respect and love, to my parents,
who have supported me all things, from material to spirit,
who have sacrificed all things they have for me without recalling,
who have reminded me that I owe to the world, and my responsibility is contributing
my life to make it more beautiful,
and who I just have once in my life
…
To my dear,
who wakes up me in the dayspring to enjoy together with study and work passion,
who encourages me when I feel tired after the heavy workload,
who is my inspiration in my all works and paths I have experienced

III
ACKNOWLEDGMENT
…
I thank the Konosuke Matsushita Memorial Foundation (松下幸之助記念財団) for their vital
financial funding in the two-year period of academic life in Japan 2016-2018.
I thank the Doshisha University Graduate School of Business - Global MBA program with
excellent and enthusiastic faculty and staff for making the valuable two-year academic period.
I specially thank Professor Philip Sugai for the outstanding instruction. You make me realize
clearly how to define and solve the research issues and sharp highly my researching mindset
in the statistics section. “Standing on the giant shoulders” should be my core method I apply
to all next paths of academic and real life.
I also thank Professor Shigeru Matsumoto for the guiding of initiation in research theme of
Mergers and Acquisitions.
I thank my friends who support me to achieve the necessary database to conduct my research.
I also thank the people who share to me the knowledge, opinions, and consulting to my
research theme of Nikkei 225. Without their aids, the research will confront the issues of
sufficiency and accuracy.
Finally, I thank all my foreign friends in Japan and Vietnam, in global MBA program, in
various cities I have lived in Japan for all your loves and supports. I always cherish and keep
my whole life.
IV
TABLE OF CONTENTS
DEDICATION .................................................................................................................................. II
ACKNOWLEDGMENT ................................................................................................................... III
TABLE OF CONTENTS ................................................................................................................. IV
LIST OF TABLES ........................................................................................................................... VI
LIST OF FIGURES ......................................................................................................................... VI
LIST OF ABBREVIATIONS ......................................................................................................... VII
CHAPTER 1: INTRODUCTION ........................................................................................................1
1.1. Background ..............................................................................................................................1
1.2. Research problem .....................................................................................................................3
1.3. Research question.....................................................................................................................8
1.4. Research objectives ..................................................................................................................8
1.5. Research outline .......................................................................................................................9
CHAPTER 2: LITERATURE REVIEW ........................................................................................... 12
2.1. Theory review ........................................................................................................................ 12
2.2. Empirical evidence review ...................................................................................................... 14
CHAPTER 3: METHODOLOGY ..................................................................................................... 15
3.1. Data sample ........................................................................................................................... 15
3.2. Methodology .......................................................................................................................... 19
CHAPTER 4: FINDING & DISCUSSION ........................................................................................ 30
4.1. Finding................................................................................................................................... 30
4.1.1. Description of Cash holding & M&A ............................................................................... 30
4.1.2. The result of statistical tests ............................................................................................. 31
4.2. Discussion .............................................................................................................................. 40
CHAPTER 5: CONCLUSION .......................................................................................................... 45
V
5.1. Summary ................................................................................................................................ 45
5.2. Contribution and recommendation .......................................................................................... 47
5.2.1. Contribution .................................................................................................................... 47
5.2.2. Recommendation ............................................................................................................. 50
5.3. Limitation and future research ................................................................................................ 51
APPENDIX ...................................................................................................................................... 53
Appendix 1: The Market Cap data between Nikkei - TSE: The data in 2009- 2014 ...................... 53
Appendix 2: Why Exclude 25 Financial companies ....................................................................... 55
Appendix 3: Descriptive table about median of cash holding in whole 200 Nikkei and every
industry group in Nikkei 200 ......................................................................................................... 56
Appendix 4: Analyzed summary of M&A value of 200 Nikkei firms in the period of 2009-2014
<List of Nikkei 200 Updated in December 2017> .......................................................................... 57
REFERENCE ................................................................................................................................... 67
VI
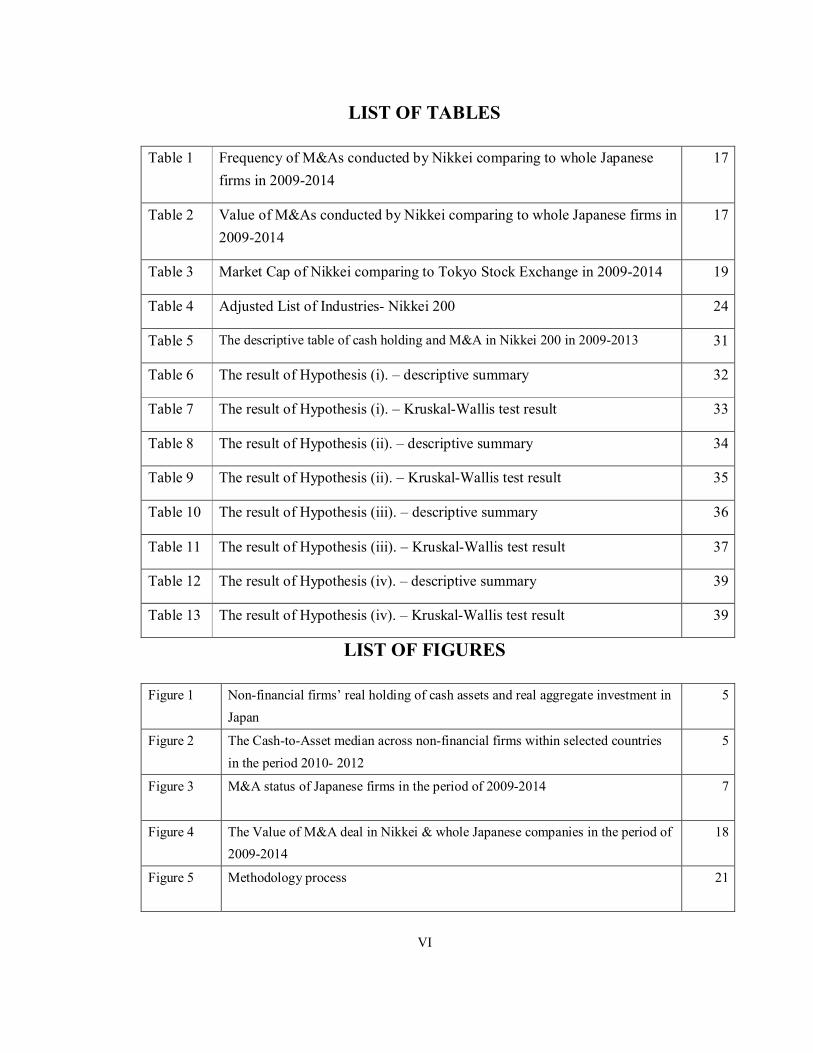
LIST OF TABLES
Table 1 Frequency of M&As conducted by Nikkei comparing to whole Japanese
firms in 2009-2014
17
Table 2 Value of M&As conducted by Nikkei comparing to whole Japanese firms in
2009-2014
17
Table 3 Market Cap of Nikkei comparing to Tokyo Stock Exchange in 2009-2014 19
Table 4 Adjusted List of Industries- Nikkei 200 24
Table 5 The descriptive table of cash holding and M&A in Nikkei 200 in 2009-2013 31
Table 6 The result of Hypothesis (i). – descriptive summary 32
Table 7 The result of Hypothesis (i). – Kruskal-Wallis test result 33
Table 8 The result of Hypothesis (ii). – descriptive summary 34
Table 9 The result of Hypothesis (ii). – Kruskal-Wallis test result 35
Table 10 The result of Hypothesis (iii). – descriptive summary 36
Table 11 The result of Hypothesis (iii). – Kruskal-Wallis test result 37
Table 12 The result of Hypothesis (iv). – descriptive summary 39
Table 13 The result of Hypothesis (iv). – Kruskal-Wallis test result 39
LIST OF FIGURES
Figure 1 Non-financial firms’ real holding of cash assets and real aggregate investment in
Japan
5
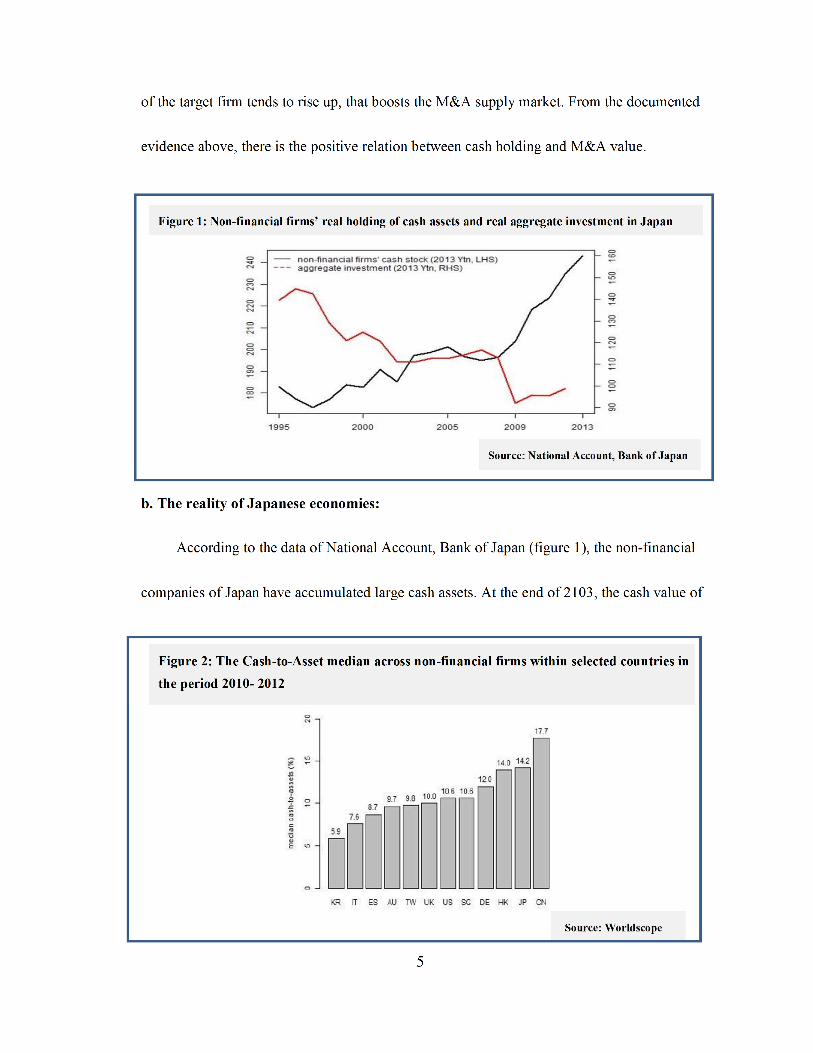
Figure 2 The Cash-to-Asset median across non-financial firms within selected countries
in the period 2010- 2012
5
Figure 3 M&A status of Japanese firms in the period of 2009-2014 7
Figure 4 The Value of M&A deal in Nikkei & whole Japanese companies in the period of
2009-2014
18
Figure 5 Methodology process 21
VII
LIST OF ABBREVIATIONS
TSE Tokyo Stock Exchange
M&As Mergers and Acquisitions
UNCTAD United Nations Conference on Trade and Development
Nikkei 200 200 non-financial firms in Nikkei 225 (updated to Dec 2017)
C/A Cash-to-Asset
Kruskal-Wallis H test KW test
1
CHAPTER 1: INTRODUCTION
The first chapter starts by describing the background of Mergers and Acquisitions
(hereafter called M&A). In this part, the research will focus on describing the important roles
of M&A in the business entities generally and Japan, the national economic theme which the
research is conducted. Then, the research will review briefly the factors influencing the M&A,
in which cash holding is highlighted for leading to next part. In that way, the research problem
will be figured out from the clear difference between documented hypothesis and reality based
on database analyzing. Next, the research question and the research objectives will be given.
The last part covers all the structure of the whole thesis by the outline map.
1.1. Background:
Mergers and Acquisitions
According to the United Nations Conference on Trade and Development (UNCTAD),
Mergers and Acquisitions (M&As) term is defined as “situations where there is a legal operation
between two or more enterprises whereby firms legally unify assets formerly subject to separate
control”, (UNCTAD, 2017). According to Investopedia (2018), “M&As is a general term that
refers to the consolidation of companies or assets through various types of financial transactions.
M&A can include a number of different transactions, such as mergers, acquisitions,
consolidations, tender offers, purchase of assets and management acquisitions. In all cases, two
2
companies are involved.”
Important roles of M&As
In term of M&A size, according to Thomson Reuter, the global M&As in 2018 has reached
to $3 trillion for four consecutive years, that remarks the more and more important roles of
M&A in the economies. Updated to 2016, Japan-sourced acquisitions reached the value of JPY
10.4 trillion (equivalent to USD 100 billion), three times higher than domestic transactions’
value rotated within Japan (UNCTAD, 2017).
In the trend of growing economy and globalization, M&As become one of most common
shortcuts of business to get the optimum growth. According to Marks & Mirvis (1998), the core
strategy behind M&As is one plus one makes three. From the “one” of the acquiring firm’s
value and “one” of the targeting firm, the total value generated is three and more. The important
role of M&A in various aspects of business has been studied in the range of theories and
documented evidence.
Following the seminal papers by Jensen and Ruback (1983), Jensen (1986), the M&As market
has influenced whole economies and business. Anju. S (1990) classifies M&As into the two
main types: “value-maximizing theory” and “managerial theory”. Barney (1988) and Prahalad
and Hamel (1990) proved M&A role in the performance promotion of core competencies and
3
resources. In term of empirical evidence, Capron (1990) pointed out the effect of the long-term
acquisition on the asset divestiture and resource redeployment, or Jarell et al. (1988) and
Bradley et al. (1988) researched the M&A as a net-value-increasing deal. In the work of Steven
et al. (2013), the acquiring firms in industries are strongly proved to achieve the comparative
advantages. The efficiency and strategic motives of M&A are also emphasized in this study.
Matsumoto (2017) proves the generation of integration and synergy in the cases of failure and
success “made in Japan” in cross border M&As. A cost-saving benefit is mentioned in the work
of Hayn (1989) about the tax-shield, and of Richard et al. (2007) about the overall cost reduction
leading the buying power boost. Clearly, because of the important documented roles of M&A,
it is necessary to study the influencing factors to M&A decision. In the next section, the author
points out the research problem basing on the relation between M&A and an influencing factor-
cash holding.
1.2. Research problem:
The lesson from theory & empirical evidence
In this research, the term “Cash” refers to Cash and Cash equivalent. According to
International Accounting Standard 7 (IAS 7), Cash “comprises cash on hand and demand
deposits”. And cash equivalents are “short-term, highly liquid investments that are readily
convertible to known amounts of cash and which are subject to an insignificant risk of changes
4
in value”. The definition from Investopedia (2018) is “Cash and cash equivalents (Cash) refer
to the line item on the balance sheet that reports the value of a company’s assets that are cash
or can be converted into cash immediately. These include bank accounts, marketable securities,
commercial paper, Treasury bills and short-term government bonds with a maturity date of three
months or less.” From that way, the definition of “Cash holding” in this research refers the Cash
and Cash equivalents in the balance sheet at the end of fiscal year.
Because of the important effects of M&A, a range of previous papers study the factors which
affect M&As. In this research scope, the factor mentioned is Cash Holding.
Jensen and Meckling (1976) and Jensen (1986) note in their seminal theory of agency cost
between manager and shareholder. In the company which has the large cash holding, the
manager considers the acquisition as the primary method of spending money instead of paying
out to shareholder. Harford (1999) proves that the firm which reserves the large cash holding is
more likely than other firms to conduct acquisition and industry diversification. He also points
out in his empirical evidence that the rise of capital liquidity is the one of the most important
reasons for the increase of M&A activity in the US from the second half of the 1990s (Harford,
2005). In the work of Shleifer and Vishny (1992), cash holding is mentioned as the result of
free cash flow, in which the firm holding the large free cash can increase stock prices, that
makes the financial constraint on the acquiring firm relaxed. Consequently, the evaluated price
5
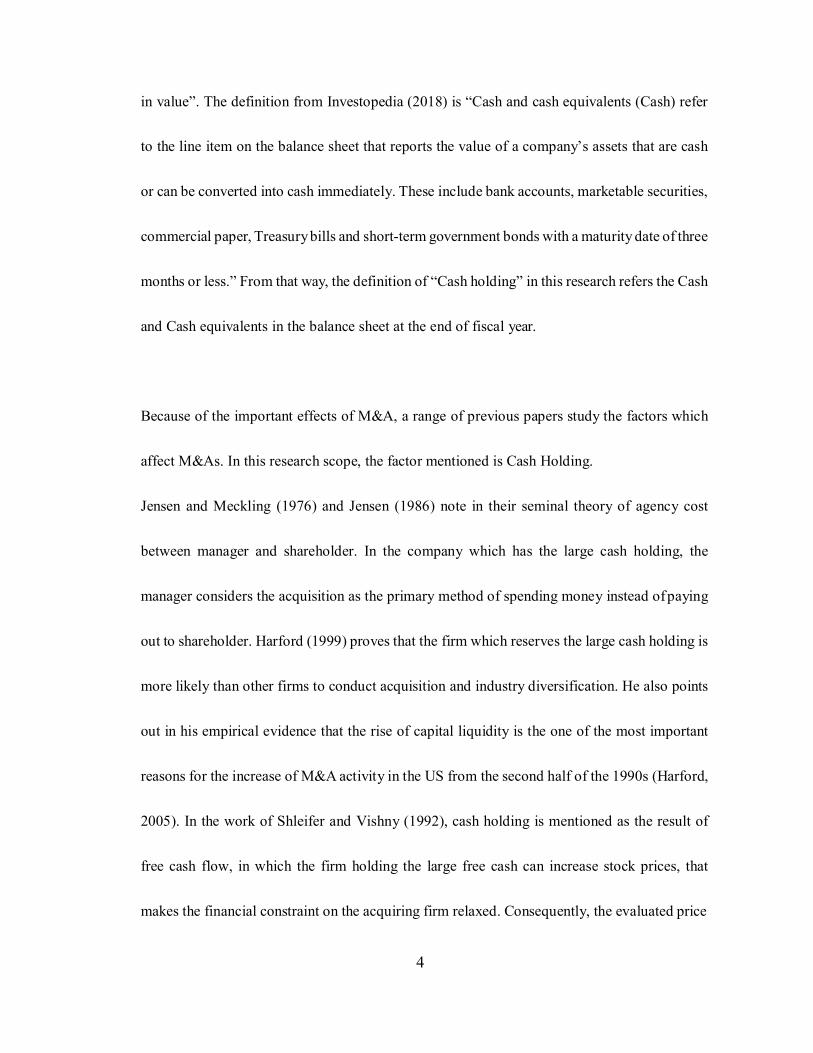
Figure 1: Non-financial firms’ real holding of cash assets and real aggregate investment in Japan
Source: National Account, Bank of Japan
6
Japanese non-financial firm reserved has accounted for 50 percent of nominal GDP. However,
contrary to the rapid increase of cash holding, the value of the whole Japanese aggregate
investment has just decreased since 1995 as the main trend. The big gap between these opposite
trends has occurred since the period around 2009. In the work of Naoki (2012) with the scope
of 2,200 listed Japanese stocks, the median firm’s cash-to-asset ratio just dropped to 8% in 1988,
before rising rapidly to above 10% in the period of 2009-2010. Shinada, N. (2012) also points
out the strong increase of cash holding in Japanese firms under the effects of internal and
external economies factors.
Figure 2 presents the outstandingly high cash holding of Japanese non-financial firms in
comparison with other countries. In the period of 2010-2012, the median of cash holding in
Japan is even four percent higher than in the US. Nevertheless, in this context, according to the
analyzed database from Bloomberg (figure 3), the M&A investment has just fluctuated or even
decreased sharply in the period of 2009-2014.
7
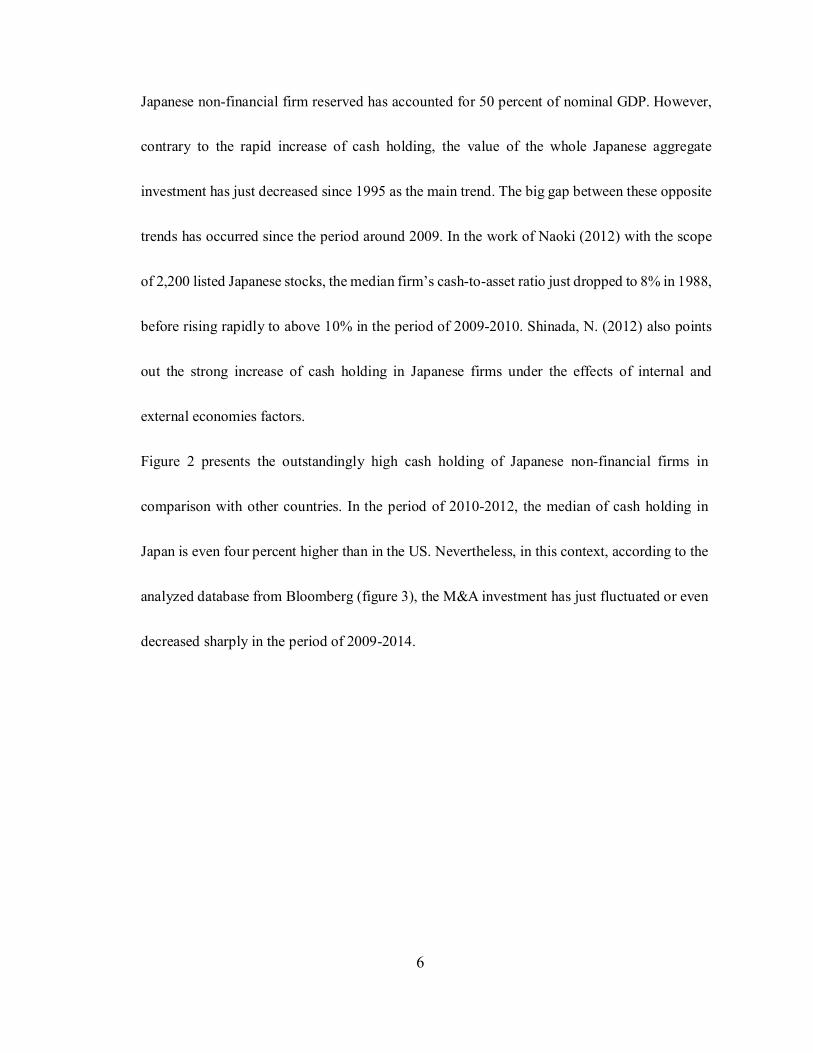
In the relationship between cash holding level and M&As, there is a clear difference
between the seminal theory and empirical evidence and reality of Japanese non-
financial firms in the period of 2009-2013.
Research problem:
Research problem insight:
The research problem is based on the opposite situation between documented academic
evidence and the reality of cash holding level and M&A in Japanese non-financial firms in the
period of 2009-2013. The research problem is highly worth to be considered because of the fact
of trendy issues that the cash holding level of Japan non-financial firms reached to the top
highest group of the global advanced countries since the 2000s, and Japanese M&A value was
ranked top group in global scope in this period.
Figure 3: M&As of Japanese firms in the period of 2009-2014
Source: Analyzed Bloomberg database
8
What is the relation between M&A and level of cash holding in Japanese non-financial
firms in the period of 2009-2013?
There is a big lack of effort or empirical evidence which study directly the relation between
cash holding and M&A investment of Japanese firms. The empirical paper which mentions
directly to agency problem in this relation of Japanese firms is also scarce.
1.3. Research question:
From this key question, the research will extend the detail questions, as follow:
Whether there is difference of the M&A value according to different levels of cash holding in
the period of 2009-2013.
Whether the M&A investment and cash holding in Japanese non-financial firms in the period
of 2009-2013 follow the concept that the higher the level of cash holding is, the more M&A
value is conducted.
1.4. Research objectives:
From the key question above, in the academic perspective, the research focuses on two
objectives:
Test the relation between the cash holding and M&A in the reality of Japanese non-financial
9
firms, then review the previous documented evidence and contribute to academic community.
This objective is considered as the most important objectives in the research.
Analyze and understand the main situation and trend of cash holding and M&A in the scope of
typical Japanese non-financial firm group in the typical period.
Respect to personal perspective, Japan really inspires the author by rich tradition value and
admirable economy achievements. To understand deeply about Japan, especially Japanese
economies, besides overcoming language barrier, studying the Japanese firms is very essential.
The research serves for the author’s personal objectives in long-term vision:
Give the chance for the author to study deeply the status of the Japan economies through the
typical and influencing firm group.
Discover the gaps or problems in Japanese firms through the process of collecting and analyzing
data not only in the theme of cash holding and M&A but also in wider economic scope. In that
way, the author can extend the scope of research in the further research path.
1.5. Research outline:
The research will go through five main chapters. In the Chapter 1, the main idea of
research will be revealed from the perspectives of documented evidence and reality of Japan
economy, the main theme utilized by the research. By figuring out the opposite arguments
10
between the theory and empirical evidence and the reality of Japan in non-financial firm term,
the research leads to research problem and research question, respectively. The research
objective in the angle of academy and individual will be explained.
Chapter 2 comprises two sections for literature reviewing. The first and second section will
present the main theories and empirical evidences respectively to describe the M&As in the
angle of cash holding.
The third chapter describe the data scope and methodology. In the section of data, the reason to
utilize the data scope will be revealed. Then, the variable of data relating to cash holding and
M&As will be also defined and explained clearly. The section of methodology helps the
audience understand how the research analyzes the data, sets up the threshold, and points out
the expected outcomes. In the last section, the set of hypothesizes will be presented, that basing
on the arguments from the research problem and research question.
Chapter 4 discloses the finding basing on analyzed data. The descriptive information and the
result of hypothesis tests will follow strictly and answer the research question. The arguments
from the chapter of literature review will be utilized to discuss this finding in multiple views.
11
In chapter 5, the research will be wrapped up by the integrated conclusion, including summary,
contribution and recommendation, limitation and further research. The summary will integrate
coherently all research content, then the section of contribution and recommendation will
highlight how the research contribute to knowledge. The last section will disclose the limitation
of research and propose the further step of studies.
12
CHAPTER 2: LITERATURE REVIEW
In this chapter, the research goes through review processing of theories and empirical
evidences that present the relation between cash holding and M&As. In the section of theory
review, the concepts of agency problem and demand for cash by firms are respectively described.
Two concept directions will be presented: agency theory suggests the positive relation between
the cash holding and M&As, while the theory of precaution and transaction cost mention the
conservative approach to hold cash for risk and cost reduction rather investment motive. Then
the section of empirical one will summary the academic evidence to support for this relation
between cash holding and M&As.
2.1. Theory review:
The agency theory
There is a range of forces drive the M&A activities, such as synergies, promotion of
economic scales, tax reduction, deregulation. In his seminal theory, Jensen (1986) suggests the
agency theory to argue as a cause of M&A activities. This theory is considered as the one of the
most influencing approach to relation between the cash holding and investment decision,
including M&As. In this theory, the manager plays a role of an agent of shareholder, however,
there are core conflicts between them because of their interest difference. When the firm
accumulates the large cash stock, the shareholders want to receive this cash as a payment.
13
However, this payment reduces the asset scale and scope controlled by managers, thereby
dwindling the power of managers in firm and forcing them to approach capital market when the
company confronts the financial shortfall. Consequently, instead of paying out for the
shareholder, the managers have the motive to expand their firm by investment decisions.
Besides, the expansion of firms also enhances the manager’s power with their controlled
resource, as well as influence their compensation with the positive increase. According to his
theory, the decision of acquisition is considered as a primary practice which the manager apply
to their firm strategy. The clear lesson from this theory is there is the positive correlation
between level of cash holding and M&A activities, in which, when the firm accumulates the
large cash holding, the manager tends to do acquisition instead of paying out to shareholder.
The theory of the demand for cash by firms:
Keynes (1936) argues that the firm holds cash for the motive of precaution and transaction
cost. In the economic context with various uncertainty, management and financial risks, or
sudden investment opportunities, the firm tends to hold more cash. With the large cash holding,
the firm can reduce the internal and external negative effects and keep the stability of financial
health. Besides, in term of transaction cost, the cash holding is beneficiary for a firm by saving
their transaction costs, which comprises: the cost of raising the external cost and the cost of
liquidating assets when needed. Following the factors of uncertainty, such as financial crisis,
14
the government or bank interference, interest rate, …, this theory can explain the demand for
cash by firms on a case-by-case basis.
2.2. Empirical evidence review:
Harford (1999) also explains the relation between the cash holding and M&A in his study
of the U.S firms for the period from 1950 to 1994. Basing the theory of agency theory, his
empirical evidence points out that the proportion of cash-rich firm conduct the diversifying
acquisition is much higher than the proportion of the cash-poor firms. From this evidence, the
M&A activities have been potentially conducted more when the firm increase their cash
reserved to the high level. Harford (2005) also emphasizes the relation between cash holding
and M&A in his study of U.S companies in the second half of the 1990s. The crucial finding
points clearly out the capital liquidity increase affect positively to the rise of M&A activities.
Backing to the research problem of cash paradox, the theory and empirical evidence, which are
based on the agency problem for the positive relation between cash and M&As, should be
relooked in the reality of Japanese economies in the period of 2009-2013. This period was
remarkable with the turbulent economies contexts with double finance crisis with various
uncertainty. The research, in the next chapter, will test how this positive relation between cash
holding and M&As occurs in this period according to theory and empirical evidence mentioned.
15
CHAPTER 3: METHODOLOGY
To answer directly the research question, the methodology chapter presents the main
method the research is conducted. There are two sections: (1). data sample introduction and (2).
methodology to analyze this database.
3.1. Data sample:
Nikkei 225
The research utilizes the non-financial firm lists of Nikkei 225 (hereafter called Nikkei)
updated in the fiscal year 2017 as the main samples. The Nikkei stands for Japan’s Nikkei 225
Stock Average, the leading and most powerful index of Japanese stocks, which comprises 225
blue-chip firms traded on the Tokyo Stock Exchange. The key secondary source comes from
the Bloomberg and the official Tokyo Stock Exchange database. The observation period of five
years starts in 2009, the fiscal year witnessed the global financial crisis with the remarkably
opposite trend between cash holding and investment in whole Japan economy.
The financial indexes studied are divided into two groups: Cash & Cash equivalent and M&A
deals’ data. In the group of Cash & Cash equivalent, the research focuses on Cash & Cash
equivalent and Net Asset to calculate the ratio of Cash & Cash equivalent to Net Asset. Turn to
M&A, there were above 400 M&A deals conducted by these 200 Nikkei blue-chips in the period
of 2009-2013. The data collected are acquiring firms and target firms, whether they did M&A,
16
the value of each M&A and total values in each year, the frequency (the number) of M&A deals
conducted, whether they complete the M&A. The currency of database is Great British Pound
– GBP.
The representative of Nikkei 225
In term of M&As
In the total above 3600 listed firms in the Tokyo Stock Exchange update to 2018, despite
the number of non-financial firms of Nikkei just account for the modest rate at 5.5%, there are
four reasons that Nikkei can representative highly in this research field.
Being the group of 225 largest companies in Tokyo Stock Exchange, their financial indexes
always account for high proportion in whole Japan stocks. The historical M&A database
analyzed in this research proves that Nikkei contributed the large part in value and frequency
in the M&A term. In the observation period, the frequency of M&As conducted was above 400,
that accounted for above 36% of total M&A deals conducted successfully by the whole 2300
listed companies at that time. The value of M&As accounted for above 50% of total value of
whole Japanese listed companies.
(Aggregate investment here means: Joint venture, long-term investment & M&A according to
Bloomberg database)
17
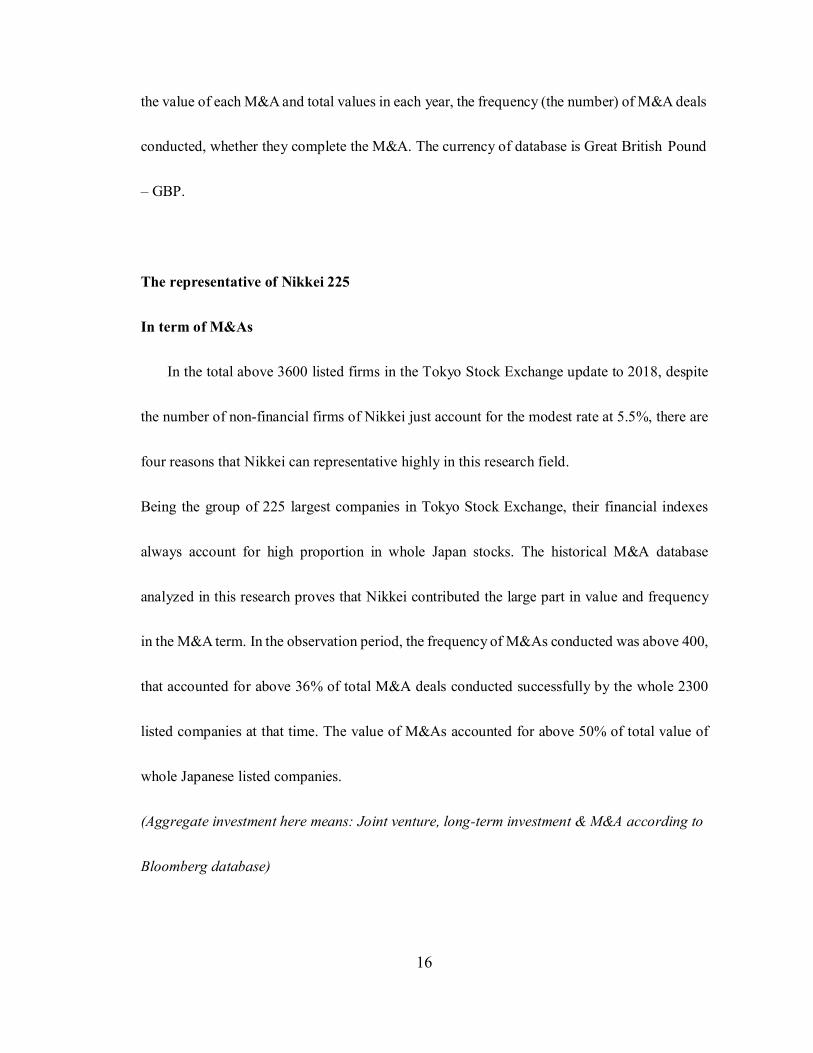
Table 1: Frequency of M&As conducted by Nikkei comparing to whole Japanese firms
in 2009-2014
2009-2010
2010-2011
2011-2012
2012-2013
2013-2014
Total period
Nikkei
91
76
91
83
60
401
Total
221
214
247
230
217
1,129
%
41%
36%
37%
36%
28%
36%
Source: Data analyzed by research from Bloomberg database
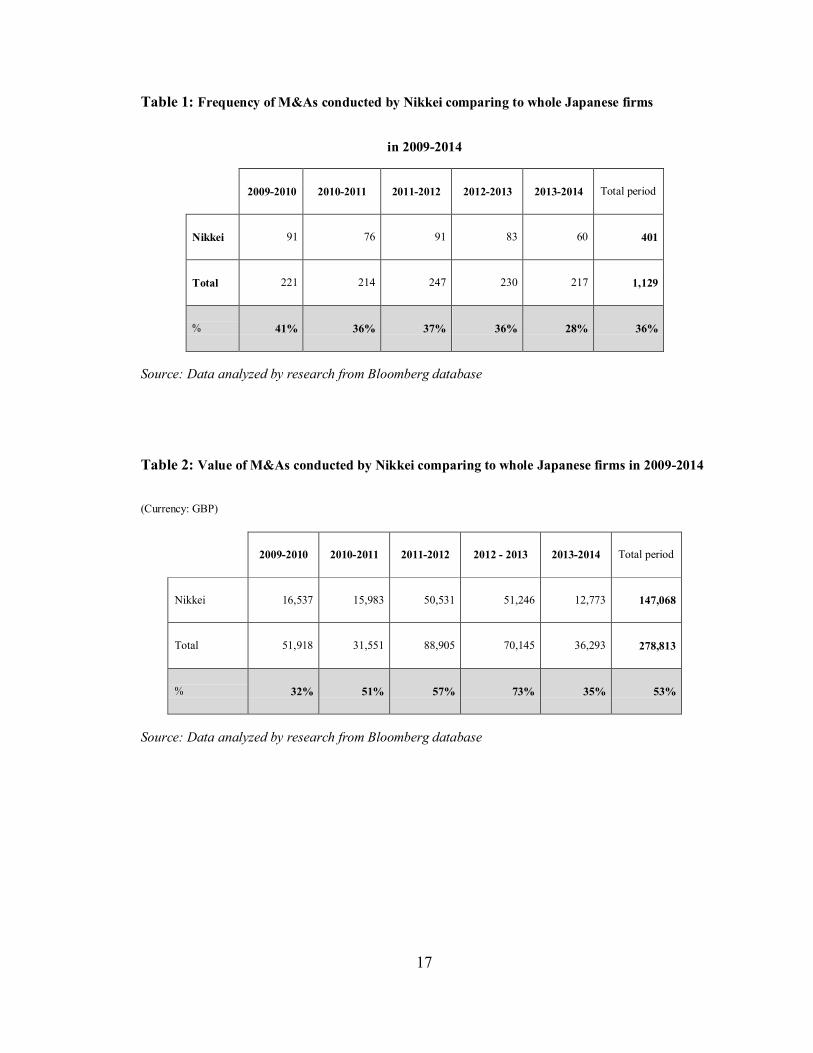
Table 2: Value of M&As conducted by Nikkei comparing to whole Japanese firms in 2009-2014
(Currency: GBP)
2009-2010
2010-2011
2011-2012
2012 - 2013
2013-2014
Total period
Nikkei
16,537
15,983
50,531
51,246
12,773
147,068
Total
51,918
31,551
88,905
70,145
36,293
278,813
%
32%
51%
57%
73%
35%
53%
Source: Data analyzed by research from Bloomberg database
18
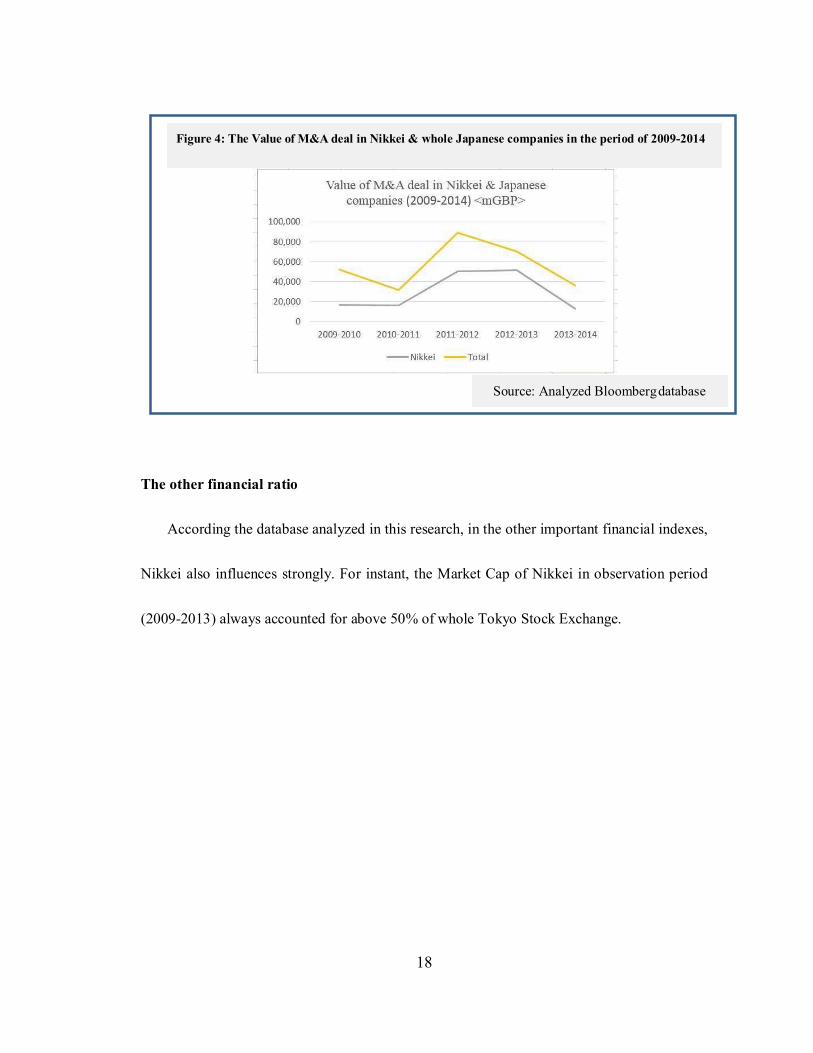
The other financial ratio
According the database analyzed in this research, in the other important financial indexes,
Nikkei also influences strongly. For instant, the Market Cap of Nikkei in observation period
(2009-2013) always accounted for above 50% of whole Tokyo Stock Exchange.
Figure 4: The Value of M&A deal in Nikkei & whole Japanese companies in the period of 2009-2014
Source: Analyzed Bloomberg database
19
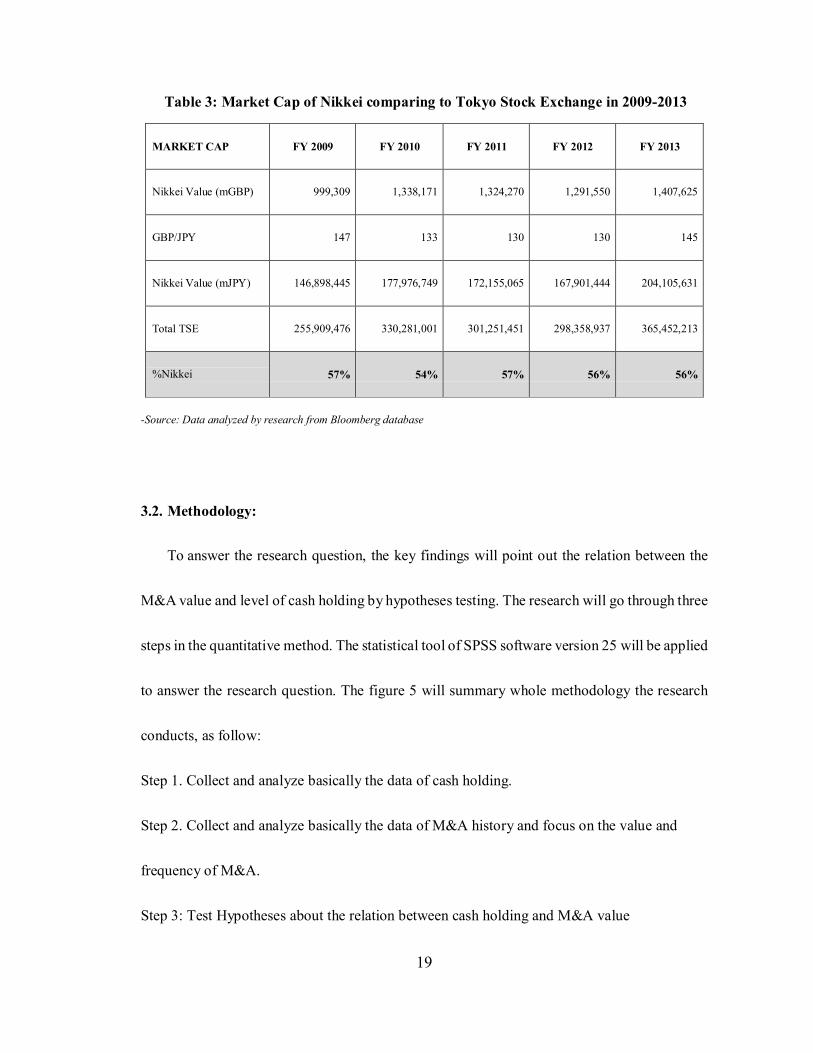
Table 3: Market Cap of Nikkei comparing to Tokyo Stock Exchange in 2009-2013
MARKET CAP
FY 2009
FY 2010
FY 2011
FY 2012
FY 2013
Nikkei Value (mGBP)
999,309
1,338,171
1,324,270
1,291,550
1,407,625
GBP/JPY
147
133
130
130
145
Nikkei Value (mJPY)
146,898,445
177,976,749
172,155,065
167,901,444
204,105,631
Total TSE
255,909,476
330,281,001
301,251,451
298,358,937
365,452,213
%Nikkei
57%
54%
57%
56%
56%
-Source: Data analyzed by research from Bloomberg database
3.2. Methodology:
To answer the research question, the key findings will point out the relation between the
M&A value and level of cash holding by hypotheses testing. The research will go through three
steps in the quantitative method. The statistical tool of SPSS software version 25 will be applied
to answer the research question. The figure 5 will summary whole methodology the research
conducts, as follow:
Step 1. Collect and analyze basically the data of cash holding.
Step 2. Collect and analyze basically the data of M&A history and focus on the value and
frequency of M&A.
Step 3: Test Hypotheses about the relation between cash holding and M&A value
20
Step 1: Collect & Analyze Cash holding:
In term of cash holding
The result of this step is the first research finding by presenting the statistical description
of cash holding in the scope of whole 200 companies and in every industry in the period of
2009-2013, and the database to conduct the relation between cash holding & M&A in the third
step.
Level of Cash holding is the main variable when tracking and testing the effect of cash holding
in the next steps. For this variable, the research bases on the ratio of Cash-to-Asset (Cash &
Cash equivalent deflated by Net Asset), hereafter marked C/A ratio. The reason to employ the
C/A ratio because it is the common ratio which is used in many reports when studying about
the level of cash holding, such as National Report, Bank of Japan. This ratio is also mentioned
in the research of Naoki (2012), Harford (1999), Harford (2005), that point out the outstanding
changes and effects of cash holding. The data source of Cash and Net Asset value is the
standardized Balance Sheet of 200 Nikkei non-financial firm annual reports from Bloomberg
database.
21
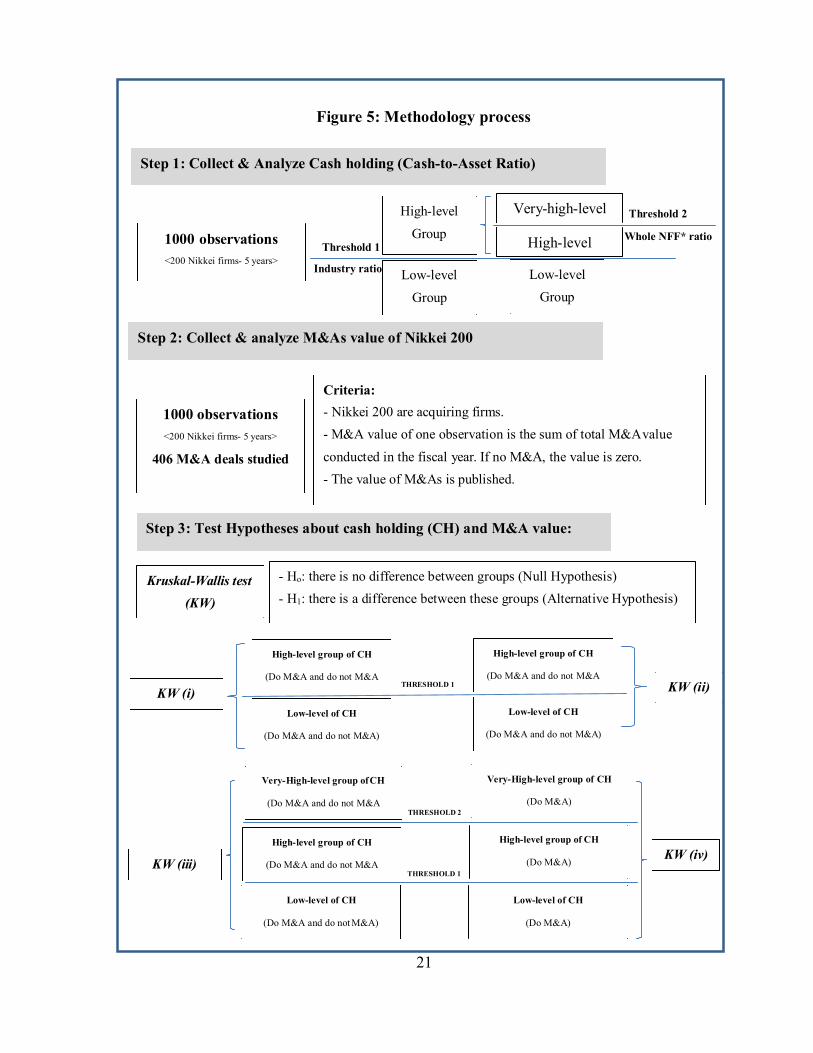
Figure 5: Methodology process
Step 1: Collect & Analyze Cash holding (Cash-to-Asset Ratio)
1000 observations
<200 Nikkei firms- 5 years>
High-level
Group Threshold 1
Industry ratio Low-level
Group
Very-high-level
High-level
Low-level
Group
Threshold 2
Whole NFF* ratio
Step 2: Collect & analyze M&As value of Nikkei 200
1000 observations
<200 Nikkei firms- 5 years>
406 M&A deals studied
Criteria:
- Nikkei 200 are acquiring firms.
- M&A value of one observation is the sum of total M&A value
conducted in the fiscal year. If no M&A, the value is zero.
- The value of M&As is published.
Step 3: Test Hypotheses about cash holding (CH) and M&A value:
Kruskal-Wallis test
(KW)
- Ho: there is no difference between groups (Null Hypothesis)
- H1: there is a difference between these groups (Alternative Hypothesis)
KW (i)
High-level group of CH
(Do M&A and do not M&A
Low-level of CH
(Do M&A and do not M&A)
THRESHOLD 1
High-level group of CH
(Do M&A and do not M&A
Low-level of CH
(Do M&A and do not M&A)
KW (ii)
Very-High-level group of CH
(Do M&A and do not M&A
THRESHOLD 2
Very-High-level group of CH
(Do M&A)
KW (iii)
High-level group of CH
(Do M&A and do not M&A
THRESHOLD 1
High-level group of CH
(Do M&A)
KW (iv)
Low-level of CH
(Do M&A and do not M&A)
Low-level of CH
(Do M&A)
22
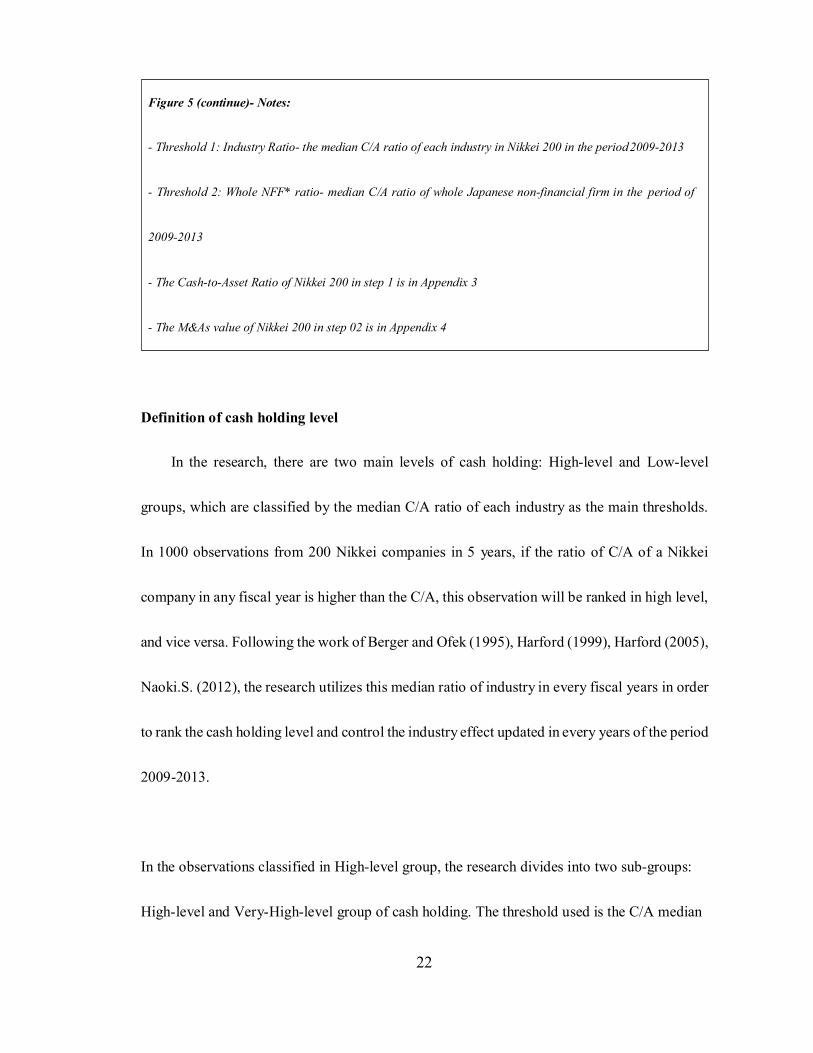
Definition of cash holding level
In the research, there are two main levels of cash holding: High-level and Low-level
groups, which are classified by the median C/A ratio of each industry as the main thresholds.
In 1000 observations from 200 Nikkei companies in 5 years, if the ratio of C/A of a Nikkei
company in any fiscal year is higher than the C/A, this observation will be ranked in high level,
and vice versa. Following the work of Berger and Ofek (1995), Harford (1999), Harford (2005),
Naoki.S. (2012), the research utilizes this median ratio of industry in every fiscal years in order
to rank the cash holding level and control the industry effect updated in every years of the period
2009-2013.
In the observations classified in High-level group, the research divides into two sub-groups:
High-level and Very-High-level group of cash holding. The threshold used is the C/A median
Figure 5 (continue)- Notes:
- Threshold 1: Industry Ratio- the median C/A ratio of each industry in Nikkei 200 in the period 2009-2013
- Threshold 2: Whole NFF* ratio- median C/A ratio of whole Japanese non-financial firm in the period of
2009-2013
- The Cash-to-Asset Ratio of Nikkei 200 in step 1 is in Appendix 3
- The M&As value of Nikkei 200 in step 02 is in Appendix 4
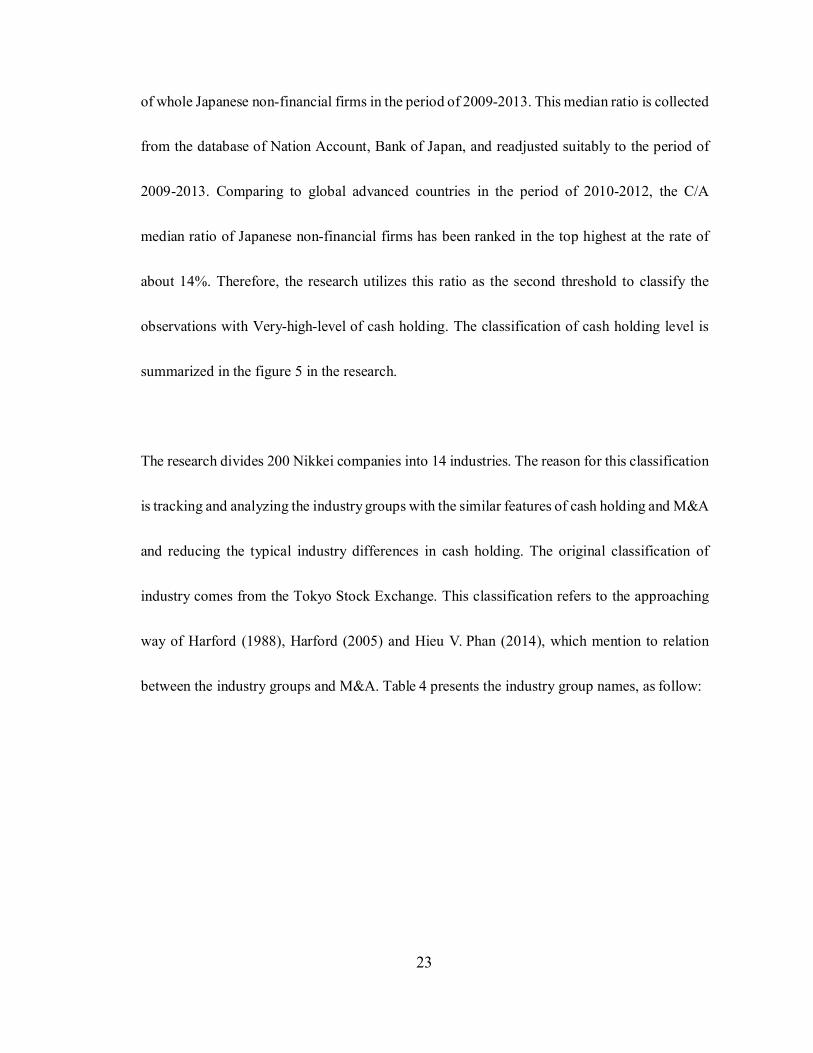
23
of whole Japanese non-financial firms in the period of 2009-2013. This median ratio is collected
from the database of Nation Account, Bank of Japan, and readjusted suitably to the period of
2009-2013. Comparing to global advanced countries in the period of 2010-2012, the C/A
median ratio of Japanese non-financial firms has been ranked in the top highest at the rate of
about 14%. Therefore, the research utilizes this ratio as the second threshold to classify the
observations with Very-high-level of cash holding. The classification of cash holding level is
summarized in the figure 5 in the research.
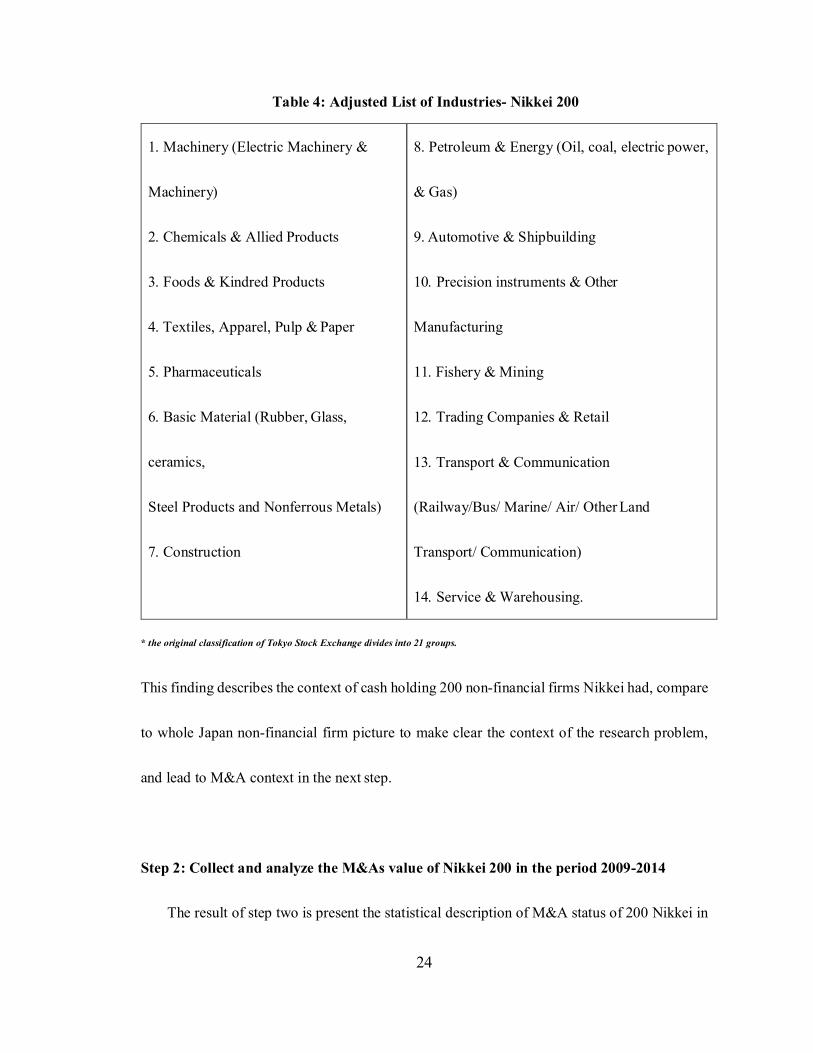
The research divides 200 Nikkei companies into 14 industries. The reason for this classification
is tracking and analyzing the industry groups with the similar features of cash holding and M&A
and reducing the typical industry differences in cash holding. The original classification of
industry comes from the Tokyo Stock Exchange. This classification refers to the approaching
way of Harford (1988), Harford (2005) and Hieu V. Phan (2014), which mention to relation
between the industry groups and M&A. Table 4 presents the industry group names, as follow:
24
Table 4: Adjusted List of Industries- Nikkei 200
1. Machinery (Electric Machinery &
Machinery)
2. Chemicals & Allied Products
3. Foods & Kindred Products
4. Textiles, Apparel, Pulp & Paper
5. Pharmaceuticals
6. Basic Material (Rubber, Glass,
ceramics,
Steel Products and Nonferrous Metals)
7. Construction
8. Petroleum & Energy (Oil, coal, electric power,
& Gas)
9. Automotive & Shipbuilding
10. Precision instruments & Other
Manufacturing
11. Fishery & Mining
12. Trading Companies & Retail
13. Transport & Communication
(Railway/Bus/ Marine/ Air/ Other Land
Transport/ Communication)
14. Service & Warehousing.
* the original classification of Tokyo Stock Exchange divides into 21 groups.
This finding describes the context of cash holding 200 non-financial firms Nikkei had, compare
to whole Japan non-financial firm picture to make clear the context of the research problem,
and lead to M&A context in the next step.
Step 2: Collect and analyze the M&As value of Nikkei 200 in the period 2009-2014
The result of step two is present the statistical description of M&A status of 200 Nikkei in
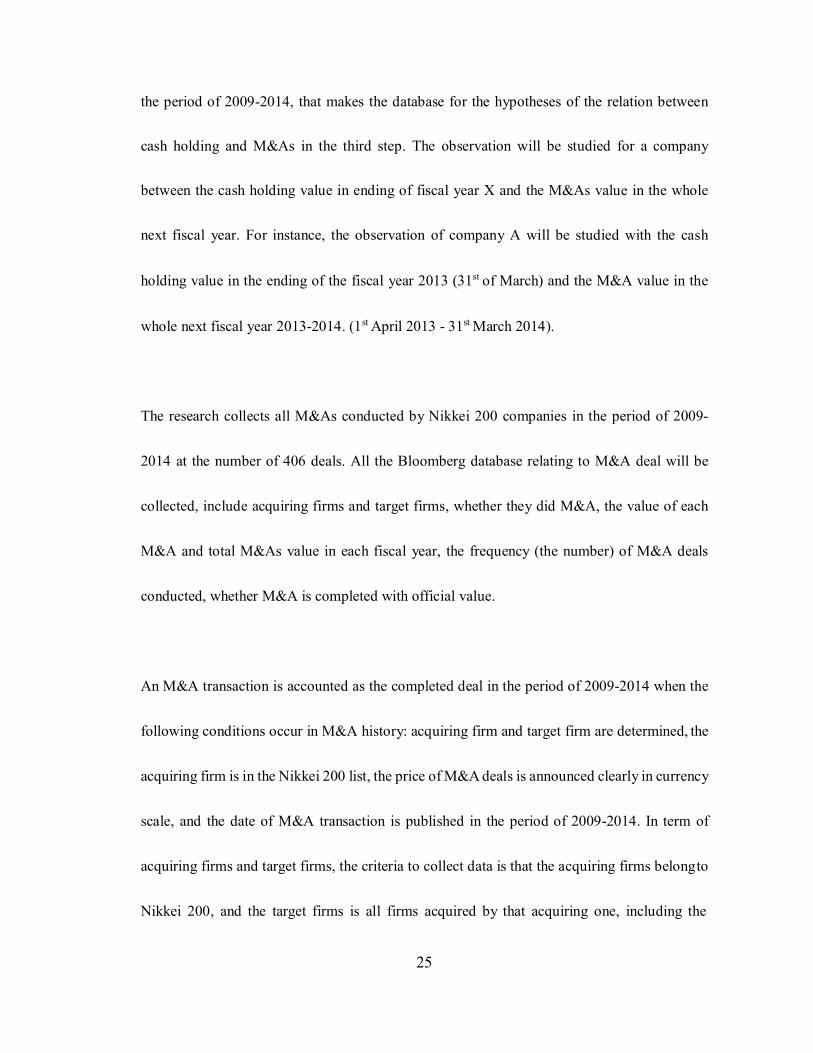
25
the period of 2009-2014, that makes the database for the hypotheses of the relation between
cash holding and M&As in the third step. The observation will be studied for a company
between the cash holding value in ending of fiscal year X and the M&As value in the whole
next fiscal year. For instance, the observation of company A will be studied with the cash
holding value in the ending of the fiscal year 2013 (31st of March) and the M&A value in the
whole next fiscal year 2013-2014. (1st April 2013 - 31st March 2014).
The research collects all M&As conducted by Nikkei 200 companies in the period of 2009-
2014 at the number of 406 deals. All the Bloomberg database relating to M&A deal will be
collected, include acquiring firms and target firms, whether they did M&A, the value of each
M&A and total M&As value in each fiscal year, the frequency (the number) of M&A deals
conducted, whether M&A is completed with official value.
An M&A transaction is accounted as the completed deal in the period of 2009-2014 when the
following conditions occur in M&A history: acquiring firm and target firm are determined, the
acquiring firm is in the Nikkei 200 list, the price of M&A deals is announced clearly in currency
scale, and the date of M&A transaction is published in the period of 2009-2014. In term of
acquiring firms and target firms, the criteria to collect data is that the acquiring firms belong to
Nikkei 200, and the target firms is all firms acquired by that acquiring one, including the
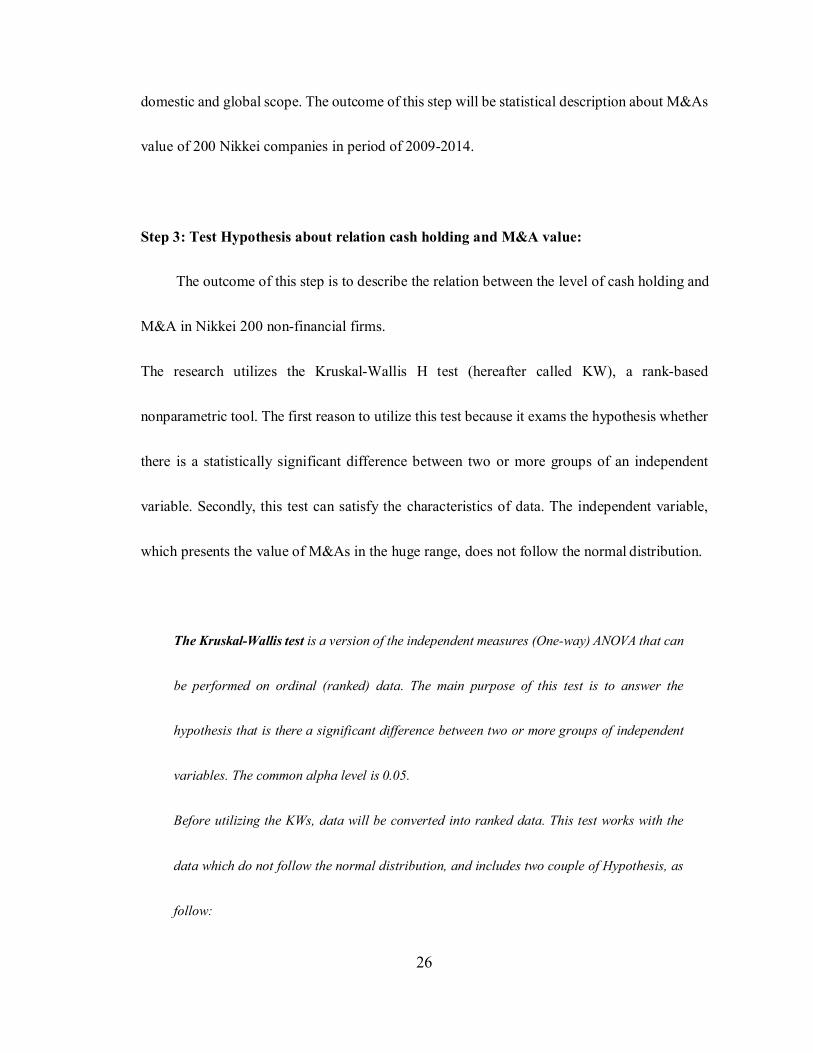
26
domestic and global scope. The outcome of this step will be statistical description about M&As
value of 200 Nikkei companies in period of 2009-2014.
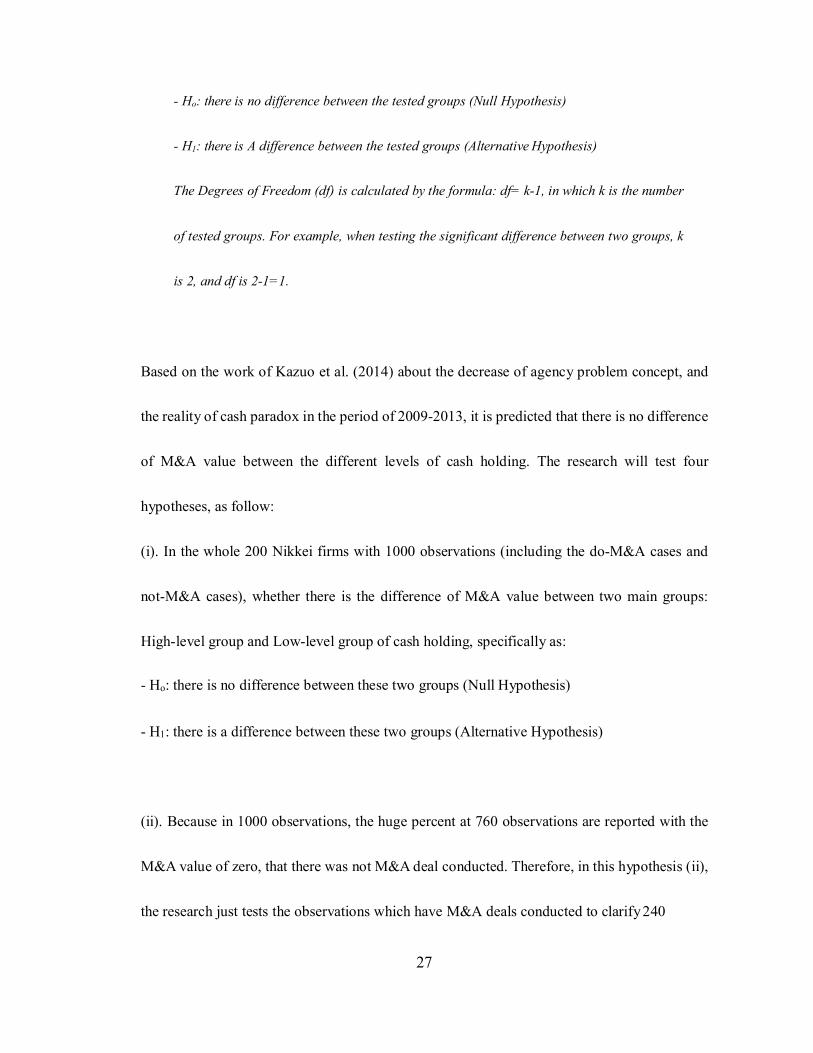
Step 3: Test Hypothesis about relation cash holding and M&A value:
The outcome of this step is to describe the relation between the level of cash holding and
M&A in Nikkei 200 non-financial firms.
The research utilizes the Kruskal-Wallis H test (hereafter called KW), a rank-based
nonparametric tool. The first reason to utilize this test because it exams the hypothesis whether
there is a statistically significant difference between two or more groups of an independent
variable. Secondly, this test can satisfy the characteristics of data. The independent variable,
which presents the value of M&As in the huge range, does not follow the normal distribution.
The Kruskal-Wallis test is a version of the independent measures (One-way) ANOVA that can
be performed on ordinal (ranked) data. The main purpose of this test is to answer the
hypothesis that is there a significant difference between two or more groups of independent
variables. The common alpha level is 0.05.
Before utilizing the KWs, data will be converted into ranked data. This test works with the
data which do not follow the normal distribution, and includes two couple of Hypothesis, as
follow:
27
- Ho: there is no difference between the tested groups (Null Hypothesis)
- H1: there is A difference between the tested groups (Alternative Hypothesis)
The Degrees of Freedom (df) is calculated by the formula: df= k-1, in which k is the number
of tested groups. For example, when testing the significant difference between two groups, k
is 2, and df is 2-1=1.
Based on the work of Kazuo et al. (2014) about the decrease of agency problem concept, and
the reality of cash paradox in the period of 2009-2013, it is predicted that there is no difference
of M&A value between the different levels of cash holding. The research will test four
hypotheses, as follow:
(i). In the whole 200 Nikkei firms with 1000 observations (including the do-M&A cases and
not-M&A cases), whether there is the difference of M&A value between two main groups:
High-level group and Low-level group of cash holding, specifically as:
- Ho: there is no difference between these two groups (Null Hypothesis)
- H1: there is a difference between these two groups (Alternative Hypothesis)
(ii). Because in 1000 observations, the huge percent at 760 observations are reported with the
M&A value of zero, that there was not M&A deal conducted. Therefore, in this hypothesis (ii),
the research just tests the observations which have M&A deals conducted to clarify 240
28
observations of “do M&A”. In the whole M&A deals conducted by Nikkei 200 in the period of
2009-2013, whether there is the difference of M&A value between High-level group and Low-
level group of Cash holding, specifically as:
- Ho: there is no difference between these two groups (Null Hypothesis)
- H1: there is a difference between these two groups (Alternative Hypothesis)
(iii). In the Nikkei 200 firms, among three groups of Cash holding level (Low, High, Very High)
in the period of 2009-2013, whether there is the difference of M&A value between these three
groups, specifically as:
- Ho: there is no difference between these three groups (Null Hypothesis)
- H1: there is a difference between these three groups (Alternative Hypothesis)
(iv). Because in 1000 observations, the huge percent at 760 observations are reported with the
M&A value of zero, that there was not M&A deal conducted. Therefore, in this hypothesis (iv),
the research just tests the observations which have M&A deals conducted to clarify 240
observations of “do M&A”. In the whole M&A deals conducted by Nikkei 200 in the period of
2009-2013, among three groups of Cash holding level (Low, High, Very High) in the period of
2009-2013, whether there is the difference of M&A value between these three groups,
specifically as:
29
- Ho: there is no difference between these three groups (Null Hypothesis)
- H1: there is a difference between these three groups (Alternative Hypothesis)
30
CHAPTER 4: FINDING & DISCUSSION
4.1. Finding:
4.1.1. Description of Cash holding & M&A:
According to table 5, the median ratio of cash holding in 200 Nikkei non-financial firms
just fluctuated in the range 7.5-8.5%, with the mean value at 8.2 in the period of 2009-2013.
Comparing to whole Japanese non-financial firms, the level of Cash holding of Nikkei is much
lower with the rate at 8.2% and 14% respectively. This statistical number is consistent with the
work of Dittmar et al (2003) which presents that the biggest firms in the global scope hold the
cash and cash equivalent stock at the rate of about 9%. This finding is explained by the seminal
theory of Keynes (1936), and the empirical evidence of Opler et al. (1999), Myers and Majluf
(1984) with transaction cost motivation for holding cash. The level of cash holding depends on
internal funds or liquidity ability of firms, in which if the firm has large scope with the high
credit in the business world, they can raise the external fund with the lower cost. Consequently,
they tend to reduce the internal fund or liquidity assets, including the cash and cash equivalent.
Backing to Nikkei 200, clearly, Nikkei is one of the most powerful and prestigious indexes not
only in Japan but also in the global scope, thereby they can approach actively to external fund
with the low cost and reduce the level of liquidity asset in the lower point than rest firms in the
Japanese economy.
31
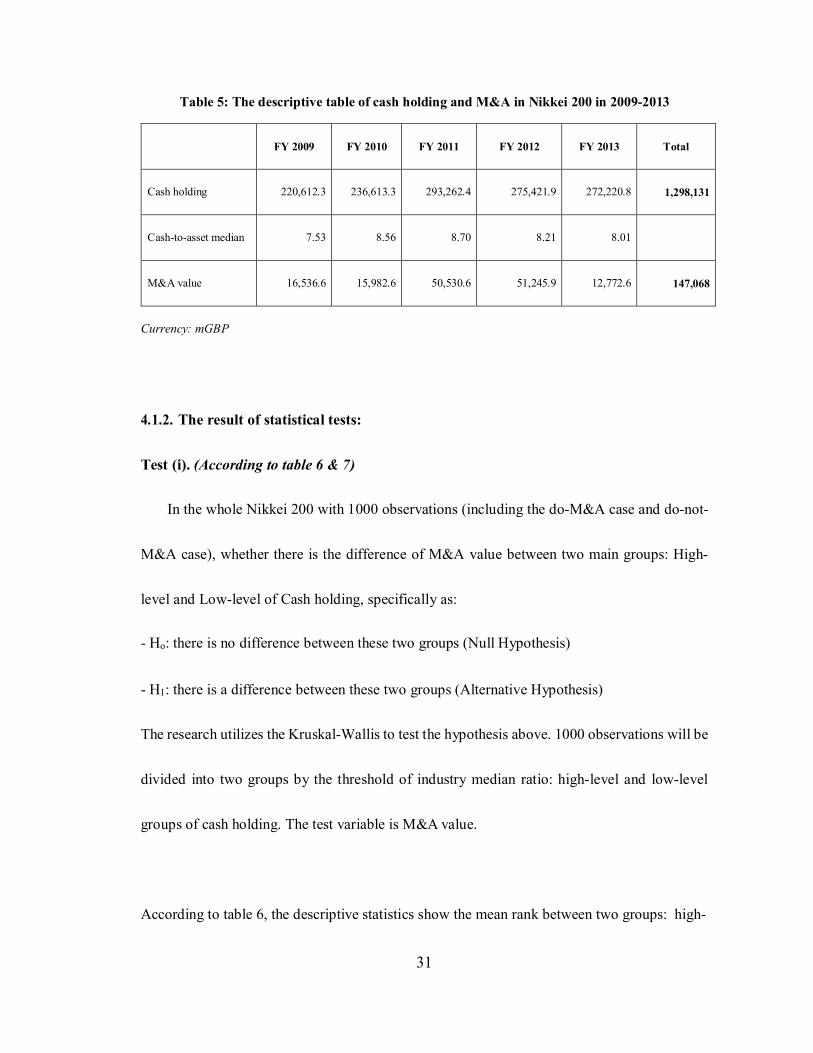
Table 5: The descriptive table of cash holding and M&A in Nikkei 200 in 2009-2013
FY 2009
FY 2010
FY 2011
FY 2012
FY 2013
Total
Cash holding
220,612.3
236,613.3
293,262.4
275,421.9
272,220.8
1,298,131
Cash-to-asset median
7.53
8.56
8.70
8.21
8.01
M&A value
16,536.6
15,982.6
50,530.6
51,245.9
12,772.6
147,068
Currency: mGBP
4.1.2. The result of statistical tests:
Test (i). (According to table 6 & 7)
In the whole Nikkei 200 with 1000 observations (including the do-M&A case and do-not-
M&A case), whether there is the difference of M&A value between two main groups: High-
level and Low-level of Cash holding, specifically as:
- Ho: there is no difference between these two groups (Null Hypothesis)
- H1: there is a difference between these two groups (Alternative Hypothesis)
The research utilizes the Kruskal-Wallis to test the hypothesis above. 1000 observations will be
divided into two groups by the threshold of industry median ratio: high-level and low-level
groups of cash holding. The test variable is M&A value.
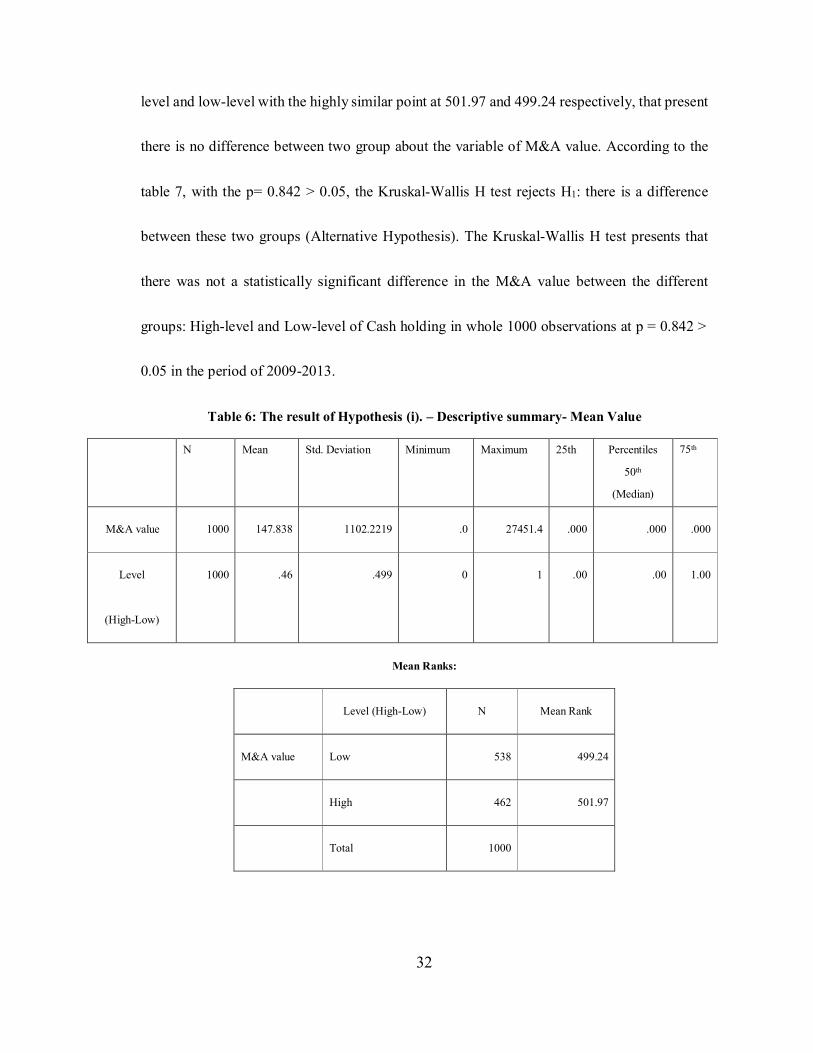
According to table 6, the descriptive statistics show the mean rank between two groups: high-
32
level and low-level with the highly similar point at 501.97 and 499.24 respectively, that present
there is no difference between two group about the variable of M&A value. According to the
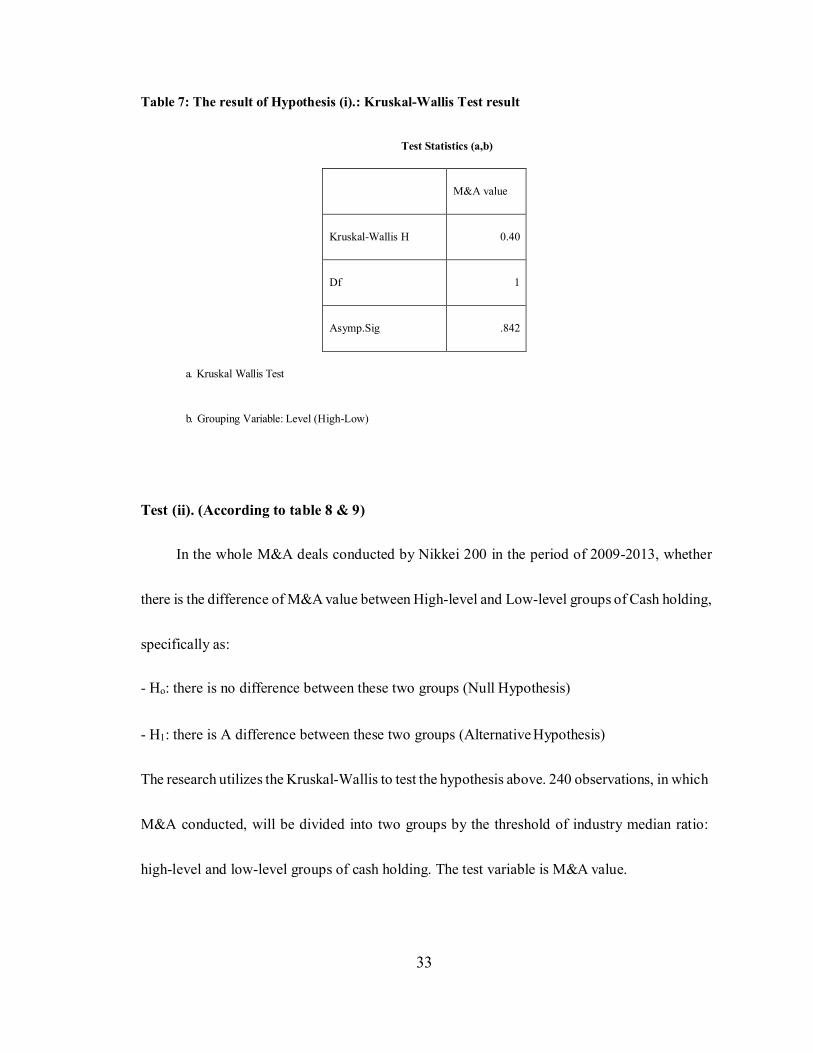
table 7, with the p= 0.842 > 0.05, the Kruskal-Wallis H test rejects H1: there is a difference
between these two groups (Alternative Hypothesis). The Kruskal-Wallis H test presents that
there was not a statistically significant difference in the M&A value between the different
groups: High-level and Low-level of Cash holding in whole 1000 observations at p = 0.842 >
0.05 in the period of 2009-2013.
Table 6: The result of Hypothesis (i). – Descriptive summary- Mean Value
N Mean Std. Deviation Minimum Maximum 25th Percentiles
50th
(Median)
75th
M&A value
1000
147.838
1102.2219
.0
27451.4
.000
.000
.000
Level
(High-Low)
1000
.46
.499
0
1
.00
.00
1.00
Mean Ranks:
Level (High-Low)
N
Mean Rank
M&A value
Low
538
499.24
High
462
501.97
Total
1000
33
Table 7: The result of Hypothesis (i).: Kruskal-Wallis Test result
Test Statistics (a,b)
M&A value
Kruskal-Wallis H
0.40
Df
1
Asymp.Sig
.842
a. Kruskal Wallis Test
b. Grouping Variable: Level (High-Low)
Test (ii). (According to table 8 & 9)
In the whole M&A deals conducted by Nikkei 200 in the period of 2009-2013, whether
there is the difference of M&A value between High-level and Low-level groups of Cash holding,
specifically as:
- Ho: there is no difference between these two groups (Null Hypothesis)
- H1: there is A difference between these two groups (Alternative Hypothesis)
The research utilizes the Kruskal-Wallis to test the hypothesis above. 240 observations, in which
M&A conducted, will be divided into two groups by the threshold of industry median ratio:
high-level and low-level groups of cash holding. The test variable is M&A value.
34
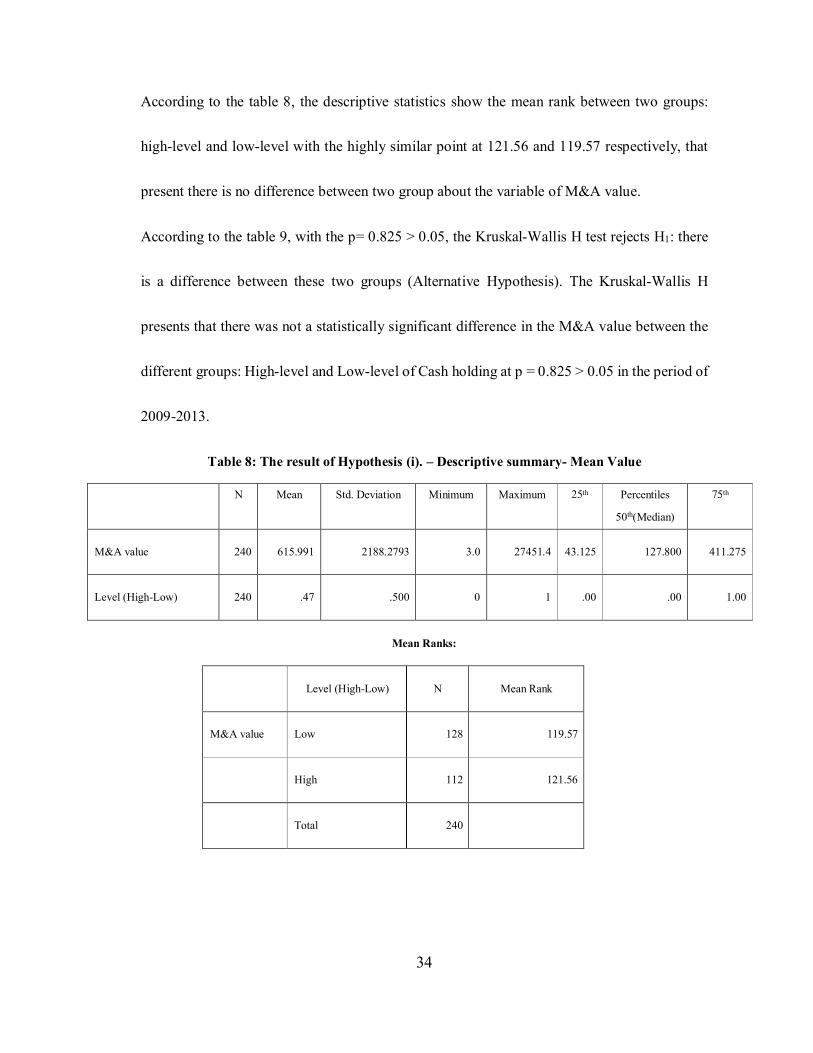
According to the table 8, the descriptive statistics show the mean rank between two groups:
high-level and low-level with the highly similar point at 121.56 and 119.57 respectively, that
present there is no difference between two group about the variable of M&A value.
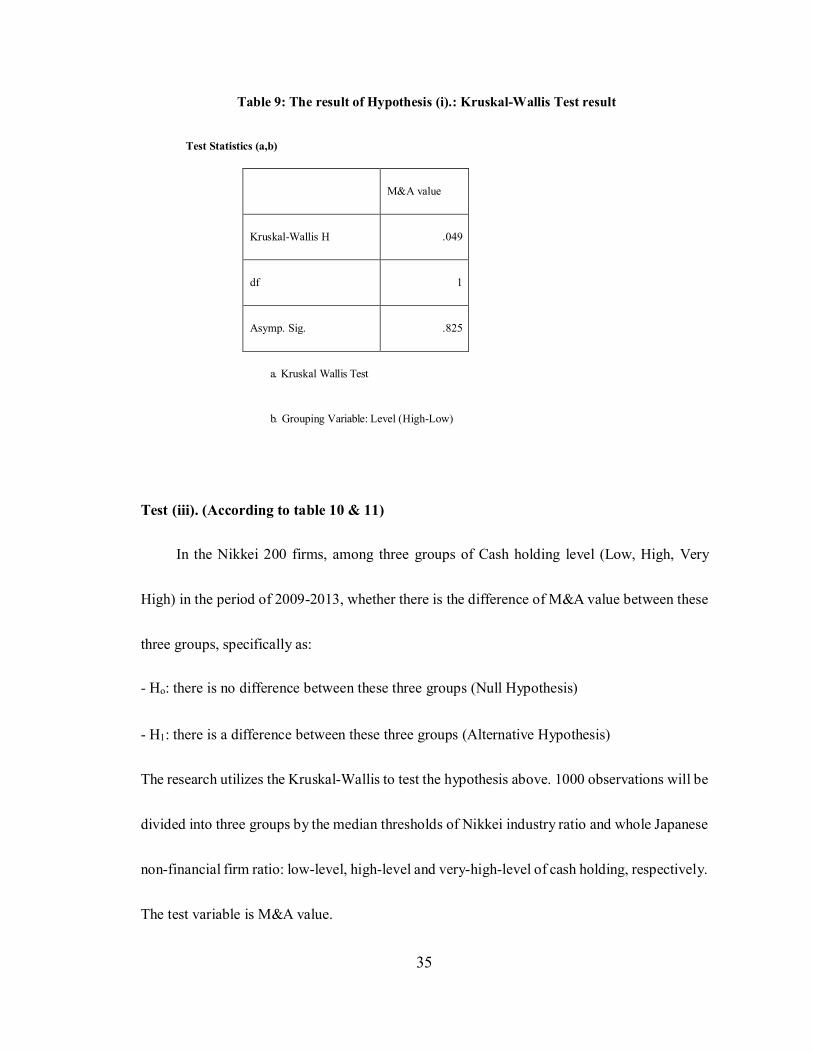
According to the table 9, with the p= 0.825 > 0.05, the Kruskal-Wallis H test rejects H1: there
is a difference between these two groups (Alternative Hypothesis). The Kruskal-Wallis H
presents that there was not a statistically significant difference in the M&A value between the
different groups: High-level and Low-level of Cash holding at p = 0.825 > 0.05 in the period of
2009-2013.
Table 8: The result of Hypothesis (i). – Descriptive summary- Mean Value
N Mean Std. Deviation Minimum Maximum 25th Percentiles
50th(Median)
75th
M&A value
240
615.991
2188.2793
3.0
27451.4
43.125
127.800
411.275
Level (High-Low)
240
.47
.500
0
1
.00
.00
1.00
Mean Ranks:
Level (High-Low)
N
Mean Rank
M&A value
Low
128
119.57
High
112
121.56
Total
240
35
Table 9: The result of Hypothesis (i).: Kruskal-Wallis Test result
Test Statistics (a,b)
M&A value
Kruskal-Wallis H
.049
df
1
Asymp. Sig.
.825
a. Kruskal Wallis Test
b. Grouping Variable: Level (High-Low)
Test (iii). (According to table 10 & 11)
In the Nikkei 200 firms, among three groups of Cash holding level (Low, High, Very
High) in the period of 2009-2013, whether there is the difference of M&A value between these
three groups, specifically as:
- Ho: there is no difference between these three groups (Null Hypothesis)
- H1: there is a difference between these three groups (Alternative Hypothesis)
The research utilizes the Kruskal-Wallis to test the hypothesis above. 1000 observations will be
divided into three groups by the median thresholds of Nikkei industry ratio and whole Japanese
non-financial firm ratio: low-level, high-level and very-high-level of cash holding, respectively.
The test variable is M&A value.
36
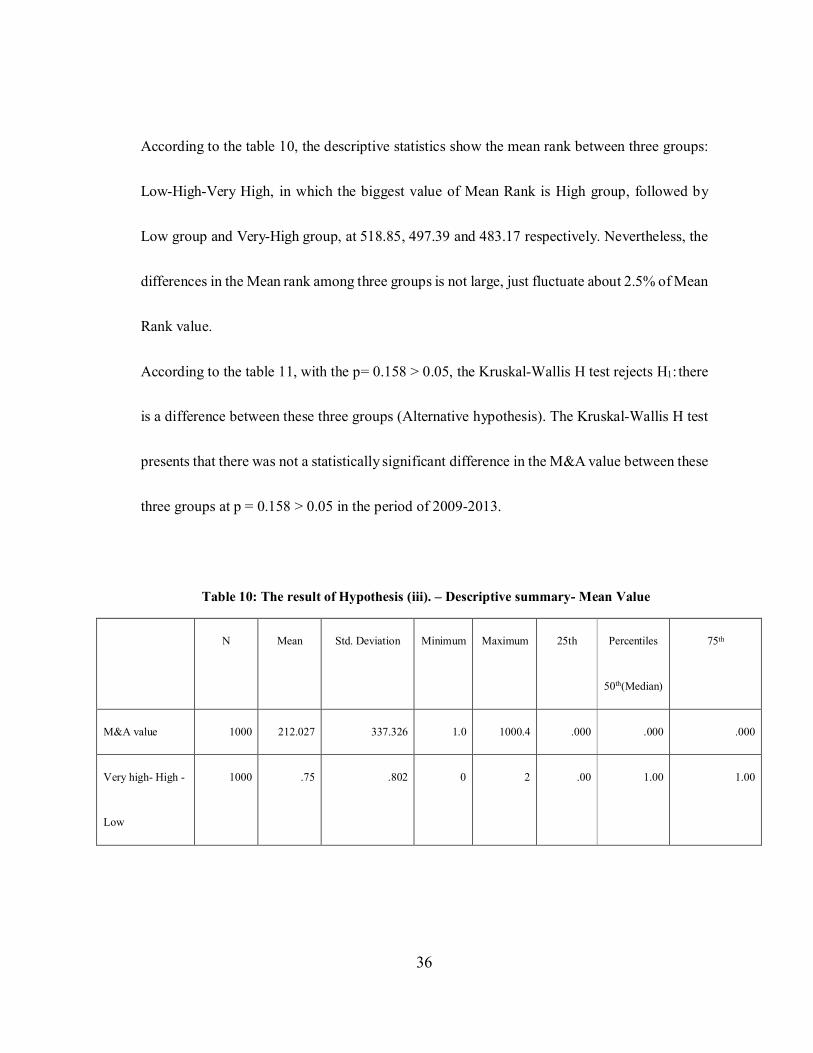
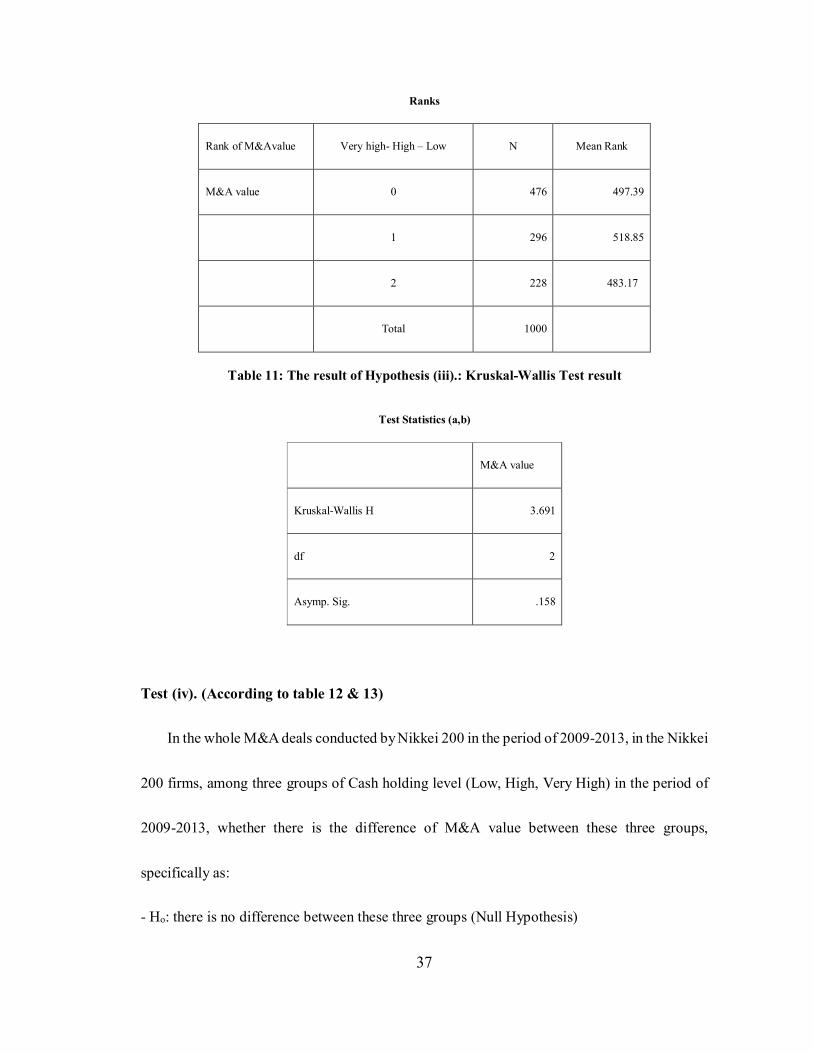
According to the table 10, the descriptive statistics show the mean rank between three groups:
Low-High-Very High, in which the biggest value of Mean Rank is High group, followed by
Low group and Very-High group, at 518.85, 497.39 and 483.17 respectively. Nevertheless, the
differences in the Mean rank among three groups is not large, just fluctuate about 2.5% of Mean
Rank value.
According to the table 11, with the p= 0.158 > 0.05, the Kruskal-Wallis H test rejects H1: there
is a difference between these three groups (Alternative hypothesis). The Kruskal-Wallis H test
presents that there was not a statistically significant difference in the M&A value between these
three groups at p = 0.158 > 0.05 in the period of 2009-2013.
Table 10: The result of Hypothesis (iii). – Descriptive summary- Mean Value
N
Mean
Std. Deviation
Minimum
Maximum
25th
Percentiles
50th(Median)
75th
M&A value
1000
212.027
337.326
1.0
1000.4
.000
.000
.000
Very high- High -
Low
1000
.75
.802
0
2
.00
1.00
1.00
37
Ranks
Rank of M&Avalue
Very high- High – Low
N
Mean Rank
M&A value
0
476
497.39
1
296
518.85
2
228
483.17
Total
1000
Table 11: The result of Hypothesis (iii).: Kruskal-Wallis Test result
Test Statistics (a,b)
M&A value
Kruskal-Wallis H
3.691
df
2
Asymp. Sig.
.158
Test (iv). (According to table 12 & 13)
In the whole M&A deals conducted by Nikkei 200 in the period of 2009-2013, in the Nikkei
200 firms, among three groups of Cash holding level (Low, High, Very High) in the period of
2009-2013, whether there is the difference of M&A value between these three groups,
specifically as:
- Ho: there is no difference between these three groups (Null Hypothesis)
38
- H1: there is a difference between these three groups (Alternative Hypothesis)
The research utilizes the Kruskal-Wallis to test the hypothesis above. 240 observations, in which
M&A conducted, will be divided into three groups by the median thresholds of Nikkei industry
ratio and whole Japanese non-financial firm ratio: low-level, high-level and very-high-level of
cash holding, respectively. The test variable is M&A value.
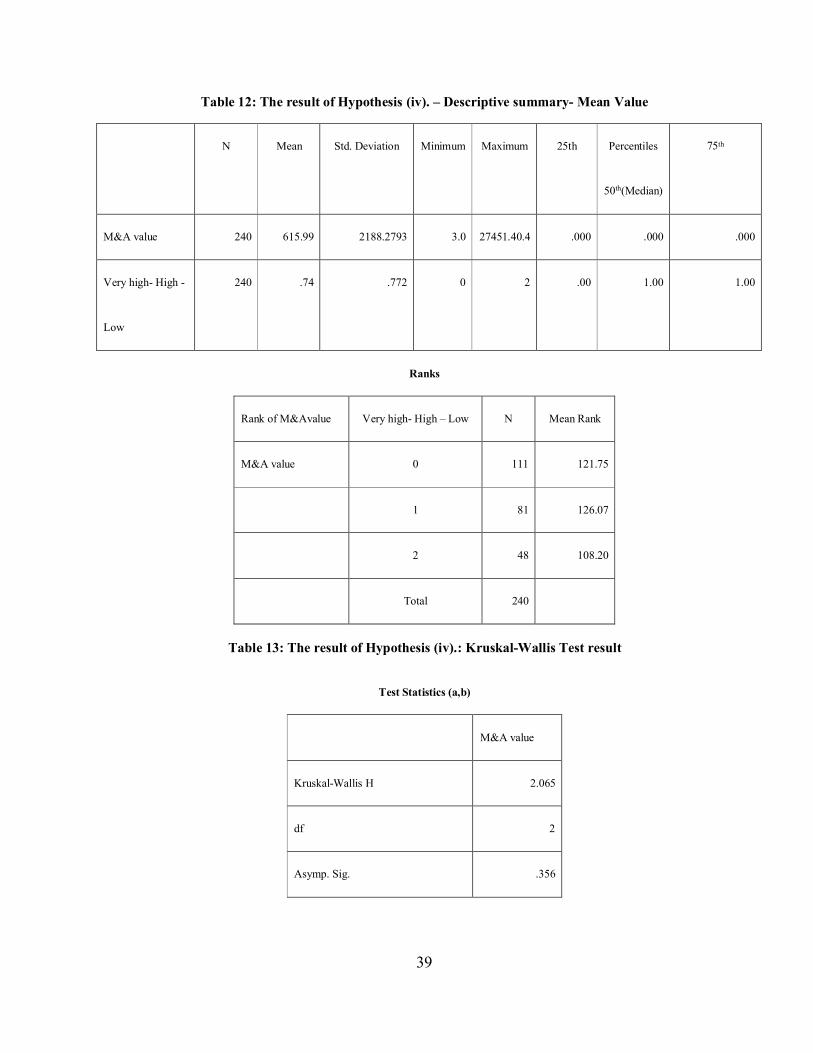
According to the table 12, in whole M&As conducted by Nikkei 200, the descriptive statistics
show the mean rank between three groups: Low-High-Very High, in which the biggest value of
Mean Rank is High group, followed by Low group and Very-High group, at 126.07, 121.75 and
108.20 respectively. The differences in the Mean rank among “Very High” and “High” group is
minor.
According to the table 13, with the p= 0.356 > 0.05, the Kruskal-Wallis H test rejects H1: there
is a difference between these three groups (Alternative hypothesis). The Kruskal-Wallis H test
presents that there was not a statistically significant difference in the M&A value between the
different three groups: Very-high-level, High-level and Low-level of Cash holding at p = 0.356
> 0.05 in the period of 2009-2013.
39
Table 12: The result of Hypothesis (iv). – Descriptive summary- Mean Value
N
Mean
Std. Deviation
Minimum
Maximum
25th
Percentiles
50th(Median)
75th
M&A value
240
615.99
2188.2793
3.0
27451.40.4
.000
.000
.000
Very high- High -
Low
240
.74
.772
0
2
.00
1.00
1.00
Ranks
Rank of M&Avalue
Very high- High – Low
N
Mean Rank
M&A value
0
111
121.75
1
81
126.07
2
48
108.20
Total
240
Table 13: The result of Hypothesis (iv).: Kruskal-Wallis Test result
Test Statistics (a,b)
M&A value
Kruskal-Wallis H
2.065
df
2
Asymp. Sig.
.356
40
4.2. Discussion:
Restate the research problem
The research problem starts from the paradox of the seminal documented evidence and the
reality of relation between Cash Holing and M&A values in the theme of Japanese non-financial
firms in the period of 2009-2013. The main idea of documented concepts is that higher level of
cash holding, the more M&As conducted. To examine comprehensively the relation between
level of cash holding and M&A value decision, the research goes through the tests with groups
of “Do M&A” and “Do not M&A”, groups of “High-level” and “Low-level” with thresholds
of industry C/A median and whole Japanese non-financial firm C/A median. Following strictly
the research question, the research findings show the main academic evidence that there was
not a statistically significant difference in the M&A value between the different groups,
specifically in high-level groups and low-level group.
The agency problem suggests that the large cash holding makes the manager tend to give more
M&A, meanwhile the research evidence shows the absence of this concept by proving that there
is not a statistically significant difference in the M&A value between the high or low level of
cash holding. Despite the cash holding in Japanese non-financial firm has rocketed to high level,
there is a huge lack of previous papers studying whether the concept of agency emerges in
Japanese economies, especially from the 2000s. This research contributes to knowledge by
41
updating the absence of this concept in the period 2009-2013 in the scope of Nikkei 200, the
most influencing firms in Japanese economies. In the limited number of paper in this theme,
the paper is consistent to the work of Kazuo et al. (2014), which points out the signal of agency
problem decrease in Japanese firms by presenting the academic evidences that these firms tend
to increase the payout to shareholders rather than hold cash for investment. The paper is also
consistent to paper of Ojo, M. (2013) with the academic evidence presenting that the bank
system of Japan has become one of the biggest investors and shareholders in Tokyo exchange
stock, therefore, in the long-term management, the bank system can boost the better
environment for communication between managers and shareholders and address the agency
problem. To interpret this situation, the research bases on two main approaching ways, as
follow:
Precautionary
In the first perspective, following the seminal theory suggested by Keynes (1936) about the
transaction cost and precautionary motive of cash in the investment decision. Basing on the
precautionary approaching, the firms tend to hold more cash to insure against to internal
financial distress and reduce future risks. The empirical work of Almeida et al. (2004) supports
this idea by proving that in financially constrained context, the firm reserves cash for the
precaution motivation as a core reason. Lins et al. (2010) argue that the firms hold
42
approximately 40% more cash than necessary to confront the financial distress and solve the
risks rather investing decision. This explaining way is more convincing in the period of 2009-
2013 when the Japanese economies suffered from double the finance crisis in 2009 and 2013.
The work of Kawai et. al (2009) suggests that the deeply negative effect on the whole Japan
economies in the finance crisis 2008-2009, or Sommer (2009) proves that the financial crisis
had a greatly negative influence on the demand for high-tech manufacturing industry (car,
electric machinery, information technology) in not only Japan domestic but also global scope.
These authors’ arguments are consistent strongly to the research data scope of Nikkei 200.
Because Nikkei 200 are the biggest companies in Japan with the huge number of top firms in
the manufacturing industry, therefore, the double finance crisis clearly had the very strong
influence on their decision of cash holding or investment spending in the precautionary
approaching. Sommer (2009) also emphasizes that the financial crisis resulted in the strong
decline the business investment of Japanese firms, that is also very consistent to the research
finding in the precautionary approaching. In the other word, in such context above, the firms
tend to hold more cash for precautionary but for investment spending with agency approaching.
The characteristics of Nikkei 200
Because Nikkei 225 are the biggest firms in Japan, besides cash holding, they can approach
to capital market or bank loan actively and easily when conducting investment decision, such
43
as M&As. The first descriptive finding supports strongly to this explanation by showing that
the ratio of cash holding level in Nikkei 200 just fluctuated around 8.2%, which is much lower
than the ratio of cash holding in whole Japanese non-financial firms peaked to over 12%. This
finding is consistent to work of Dittmar et. al (2003) that suggests the largest firms in global
scope hold the cash ratio at 9% of book value. One of the main reasons for this low ratio will
be explained by the advantages of firm size and prestige. When the firms in Nikkei 200 tend to
do investment, such as M&As, they can raise fun with a number of resources: debts, stocks,
that reduce their dependence on Cash holding. Additional, according to the descriptive finding,
the average M&A value of Nikkei 200 just accounted for the relatively small at 11.3% of the
value of Cash holding. These ratios support the argument that the decision of M&A value does
not account for the big enough in preparation of cash holding in Nikkei 200.
From these arguments above, the reality of Cash paradox in the research should be considered
in the multiple perspectives by combining the theories and empirical evidence. The research
just limits at pointing out the indifference of M&A values in the different group of cash holding
and need more evidence to explain that in further empirical evidence. Despite the research
figure out the gap between the theory of agency problem and reality, the scope of research just
be wrapped in the Nikkei 200 of non-financial firms, the finding relating to financial firms, the
rest Japanese firms in the period of 2009-2013 still need to be interpreted. From that way, the
44
research suggests the further studying directions in the following steps: how to update the theory
of agency problem in the reality of typical period with variety of events and unexpected
variables, how to integrate multiple theories and empirical evidences of cash holding and
M&As deal to reflect more accurately the reality of economies.
45
CHAPTER 5: CONCLUSION
The chapter five will point out the integrated conclusions of the research with the main
contents: summary of whole research contents, contribution and recommendation, and
limitation and future research. The summary section will describe whole research flow in the
highlighted content. Then the section of contribution and recommendation will explain the
important role in academic term and real investment implication as well as suggest the direction
for related parties in the research theme. The last section makes clear the limitation of research,
give the lesson and reveal the further step of research.
5.1. Summary:
The research is conducted in the outstanding context of Japanese economies, in which the
cash holding of non-financial firms climbed rapidly to the top level comparing to other
advanced countries in global scope in the period of 2009-2013. The research theme is built in
the relation between cash holding and M&As, the investment type which has become one of
the biggest and most influencing financial activities in the global scope. The research problem
and question, respectively, are proposed basing on the paradox between the well-known
documented evidence and reality of Japanese non-financial firms in the period 2009-2013.
According to theories and empirical evidence, with the large cash holding, the firm tends to
conduct more M&A, nevertheless, the real number of whole Japanese non-financial firms
46
shows the different context between the increase of cash holding value and fluctuation or even
decrease of M&A values. The expected answer is to describe the relation between the level of
cash holding and M&A decision.
To answer this question, the research utilizes the sample of 200 non-financial firms in Nikkei
225 as the scope of research. The reasons to use this sample are: the Nikkei 200 stands for the
biggest and most influencing firms in Japan economies, that can reflect the financial health of
Japanese economies strictly, and the financial ratio relating to M&A events accounted for the
huge part in total Japanese M&A value in this period. In the term of cash holding, the research
calculates the cash ratio basing on the value of Cash and Cash equivalent in balance sheet of
fiscal year. Comparing to the thresholds of cash holding level, the cash ratio median of industry
and whole economies, 1000 observations of 200 firms in 5 years are classified into different
levels of cash holding. In the term of M&As, the most important related financial ratios are
collected and analyzed, as follow: the acquiring and acquired firms, the M&A value, the
frequency of M&A, whether M&A is completed.
By the main test of Kruskal-Wallis H in SPSS tools, the research points out the main result that
there was not a statistically significant difference in the M&A value between the different levels
of cash holding. The theory of precautionary motive in the context of Japanese economies in
47
the period 2009-2014 and the characteristics of Nikkei 200 should be the crucial explanation
for these findings.
5.2. Contribution and recommendation:
5.2.1. Contribution:
The research contributes two key points to knowledge: (i). update the agency problem and
combine the explanation from related theory in the trending issues, and (ii). fill the gap of
research about the relation between cash holding and M&As value in the typical period.
Update the agency problem and combine the explanation of the related theory in the
trending issues
The rapid increase of cash holding has been known clearly as the outstanding phenomenon
of not only in Japanese non-financial firms but also in whole Japanese economies. The relation
between the cash holding and M&A investment has been documented in the range of theories
and empirical evidence, in which the key idea is that with the large cash holding, the firm tends
to do more M&A. The agency problem is considered as the sufficient explanation for this
concept. By giving the academic evidences that there is no significant difference in M&A value
between the levels of cash holding, the research can update this concept in the reality of
Japanese context. The research contributes to knowledge by giving the academic evidence to
48
prove the absence of agency problem in the period of 2009-2013. The finding is consistent to
the work of Kazuo et al. (2014), which points out the signal of agency problem decrease in
Japanese firms by presenting the academic evidence that these firms tend to increase payout to
shareholders rather than hold cash for investment. The paper is also consistent to paper of Ojo,
M. (2013) with the academic evidences presenting that the bank system of Japan become one
of the biggest investors and shareholders in Tokyo exchange stock, therefore, in the long-term
management, the bank system can boost the better environment for communication between
managers and shareholders and address the agency problem.
The value of research also bases on the scope of research. The research focuses on the strongest
and most representative index in Japanese economies, 200 Nikkei non-financial firms, with the
Nikkei 200’s M&A value accounting for above 53% of whole Japanese economies’ one in
average. Besides, the period of research witnessed the clear paradox between the cash holding’s
rapid increase and slight fluctuation or even decrease of M&A value in 2009-2014. The research
also supports for seminal concepts of precautionary that Japanese non-financial firms increase
the cash holding level for risk and cost reduction under the effects of turbulent macro external
factors, such as financial crisis 2009 and 2011, or micro factors, such as characteristics of the
typical firm group, Nikkei.
49
The lack of efforts to address the academic problem about Japanese firms
There is a huge lack of efforts to make clear the relation between the cash holding and
M&A events in Japanese economies in the period since 2009. With both the level of cash
holding in Japanese non-financial firms and value of Japanese M&As ranked in the global top
group of the advanced countries, this relation is worth to investigate by the deep research.
Despite there is a number of previous papers which mention about the determinants for cash
holding of Japanese firms, the relation between cash holding and M&A values of Japanese firms
still have big academic gaps to fill. This research contributes to this knowledge gap by focusing
the M&A value in the angle of cash holding levels in 2009-2013, the period witnessed the cash
paradox, and the many important economics events not only in Japan, but also in the global.
Moreover, there is very modest number of papers which study about the concept of agency
problem in Japanese non-financial firms, therefore, this research contributes to knowledge by
updating and reviewing this concept.
Last but not least, in the context that there is the shortage of academic literature, which studies
the Nikkei 225 index, the most influencing index of Japanese economies, the research
contributes to knowledge by giving the description of 200 Nikkei non-financial firms in Cash
holding and M&A ratio in whole Nikkei 200 and every industry scope.
50
5.2.2. Recommendation:
To academic understanding of this issue
From the finding of research, the recommendation focuses on the updating of the agency
problem and related concept about cash holding and M&A. The agency problem should be the
primary concept to develop and apply, nevertheless, it will be bias if not referencing related
ones: precautionary motive in the trade-off theory, or macro and micro factors related. The
Japanese economies should be the outstanding sample system in this concept reviewing because
the typical status of cash holding and M&A value in the period of 2009-2013.
To practitioners who may be investing in Japan or regulating Japanese business:
When investing on Japanese firms, it is apparent that the Nikkei 225 is always one of the
most outstanding and attractive options for investor community because of their prestige and
influences. Every investment decision of these giant Nikkei firms can affect considerably to
whole investing value of whole economies in short and long term. Specifically, the fact that the
level of cash holding has climbed up to top level comparing to global scope since the 2000s,
emerges the consideration and worries of investing and observing parties about the
effectiveness of cash flow and capital expenditure. The agency concept contributes to this
problem as a main reason. From the finding, the research supports the absence of agency
problem in the investment of cash holding, that suggests the light of healthy environment in
51
cash policy of manager.
5.3. Limitation and future research:
The section of limitation and future research will review the gaps of this research in theory
application, data scope analyzation, lack of controlling related factors. Then, the research
suggests the further direction of research to fill these blanks and figure out the comprehensive
knowledge about the relation of cash holding and M&As.
Update the theory relating to Cash holding and M&As
The research focuses on the concept of positive relation between cash holding and M&A
documented by the academic evidence relating to agency problem. This problem occurs in the
firms in variety of approaching way, such as cash or debt (Jensen, 1986). The research focuses
on cash holding as a main direction, and needs to extend in debt in further step. In addition,
despite this concept is well documented in the academic world, it will be more reasonable and
effective in answering the reality of economics when combining with another related theories.
In the further steps, the research suggests the combination of the integrated theories and
hypothesis to investigate deeply and convincingly this research theme.
Scope of research
Despite 200 non-financial firms in Nikkei 225 have the largest size and most influencing
52
roles in Japanese economies, they are just the part of whole big Japanese economies. The
research needs to extend the scope size to clearly describe the trendy issues of Cash holding
and M&As in whole Japanese economies. The research problem and question about this theme
is still the gaps in the rest parts of Japanese economies in the period of 2009-2013 and later.
Therefore, for next steps, the extension of data scope is a clear direction to achieve the valuable
paper.
Additional variables in the relation between cash holding and M&As
Clearly, cash is the one of the most important factors which the acquiring firm conducts
M&A. According to data analyzed of research, just below 7.3% of whole M&A transactions
conducted by another tools, such as debt or stock, nevertheless, the research does not mention
effects of these tools. This suggests the further steps with the integration of tools to conduct
research comprehensively. The other internal factors from the target firms should be also
considered, such as strategy section, competitive advantage or financial health to give the result
more accurately.
53
APPENDIX
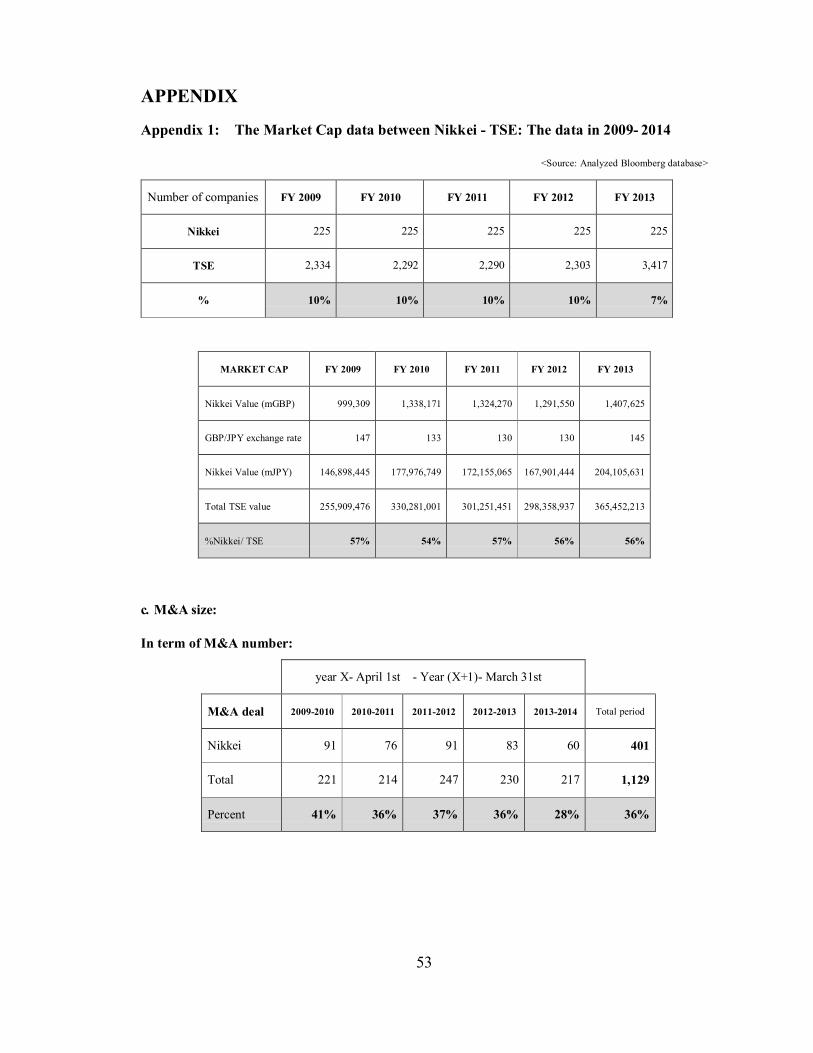
Appendix 1: The Market Cap data between Nikkei - TSE: The data in 2009- 2014
<Source: Analyzed Bloomberg database>
Number of companies FY 2009 FY 2010 FY 2011 FY 2012 FY 2013
Nikkei 225 225 225 225 225
TSE 2,334 2,292 2,290 2,303 3,417
% 10% 10% 10% 10% 7%
MARKET CAP
FY 2009
FY 2010
FY 2011
FY 2012
FY 2013
Nikkei Value (mGBP)
999,309
1,338,171
1,324,270
1,291,550
1,407,625
GBP/JPY exchange rate
147
133
130
130
145
Nikkei Value (mJPY)
146,898,445
177,976,749
172,155,065
167,901,444
204,105,631
Total TSE value
255,909,476
330,281,001
301,251,451
298,358,937
365,452,213
%Nikkei/ TSE
57%
54%
57%
56%
56%
c. M&A size:
In term of M&A number:
year X- April 1st - Year (X+1)- March 31st
M&A deal
2009-2010
2010-2011
2011-2012
2012-2013
2013-2014
Total period
Nikkei 91 76 91 83 60 401
Total 221 214 247 230 217 1,129
Percent 41% 36% 37% 36% 28% 36%
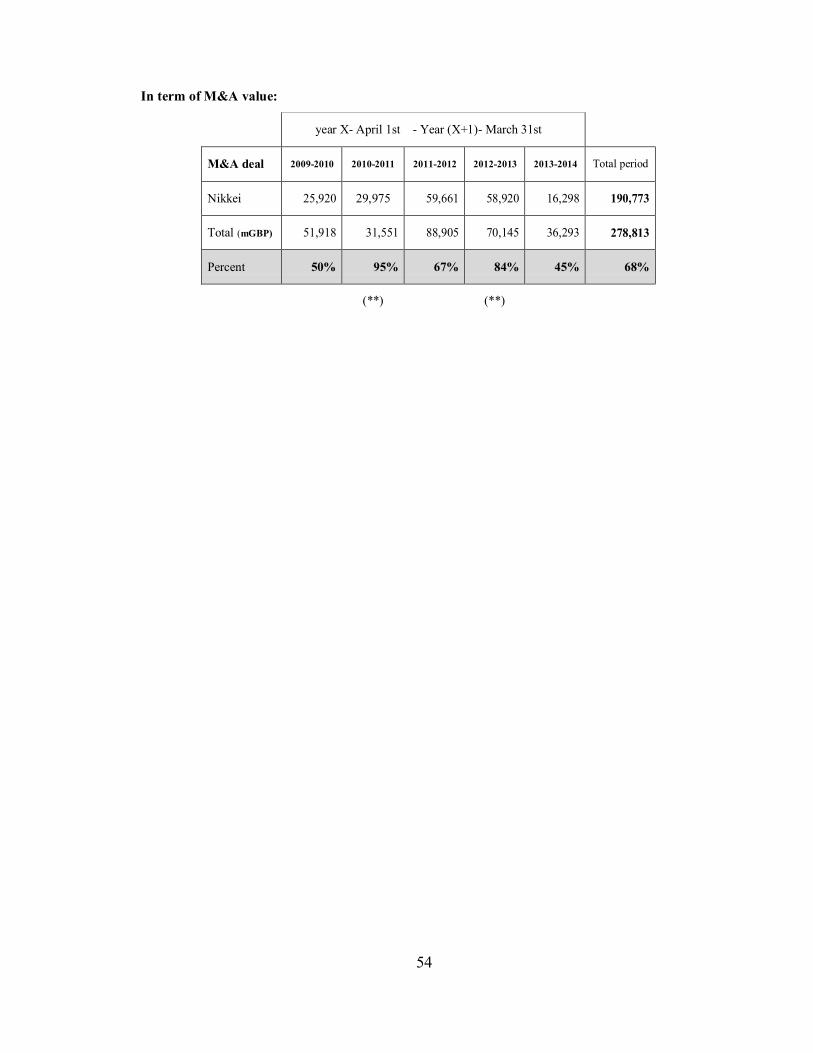
54
In term of M&A value:
year X- April 1st - Year (X+1)- March 31st
M&A deal
2009-2010
2010-2011
2011-2012
2012-2013
2013-2014 Total period
Nikkei 25,920 29,975 59,661 58,920 16,298 190,773
Total (mGBP) 51,918 31,551 88,905 70,145 36,293 278,813
Percent 50% 95% 67% 84% 45% 68%
(**)
(**)
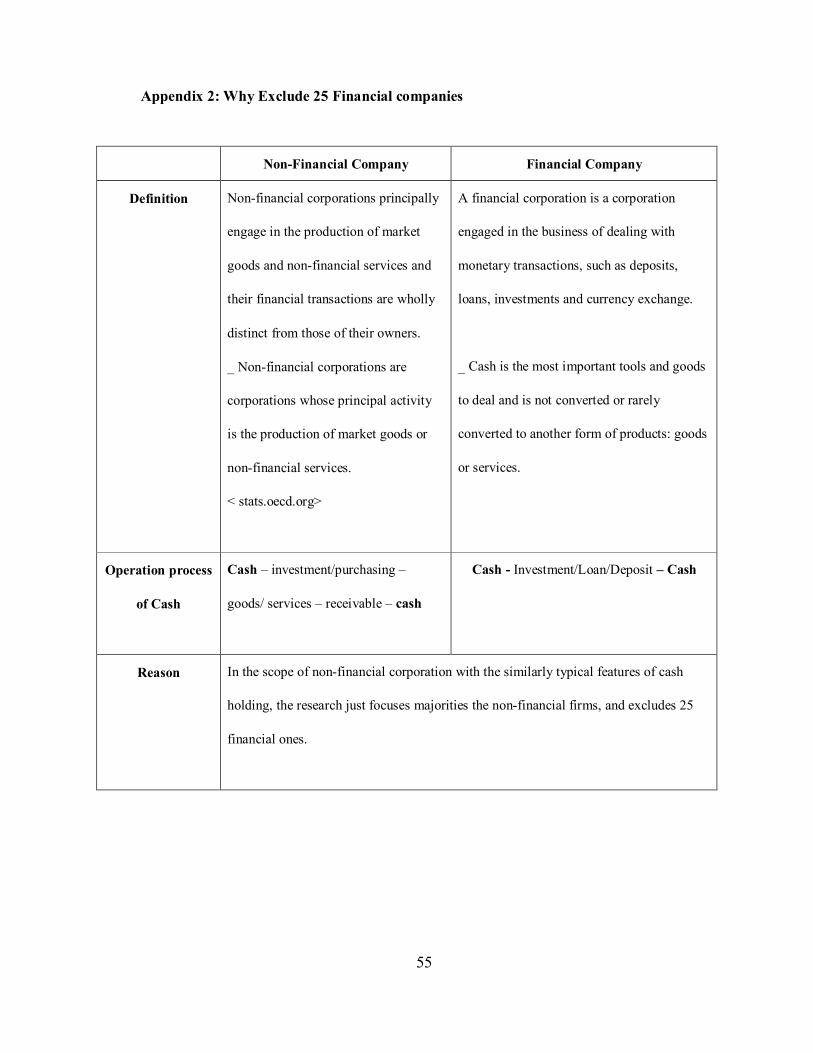
55
Appendix 2: Why Exclude 25 Financial companies
Non-Financial Company Financial Company
Definition Non-financial corporations principally
engage in the production of market
goods and non-financial services and
their financial transactions are wholly
distinct from those of their owners.
_ Non-financial corporations are
corporations whose principal activity
is the production of market goods or
non-financial services.
< stats.oecd.org>
A financial corporation is a corporation
engaged in the business of dealing with
monetary transactions, such as deposits,
loans, investments and currency exchange.
_ Cash is the most important tools and goods
to deal and is not converted or rarely
converted to another form of products: goods
or services.
Operation process
of Cash
Cash – investment/purchasing –
goods/ services – receivable – cash
Cash - Investment/Loan/Deposit – Cash
Reason In the scope of non-financial corporation with the similarly typical features of cash
holding, the research just focuses majorities the non-financial firms, and excludes 25
financial ones.
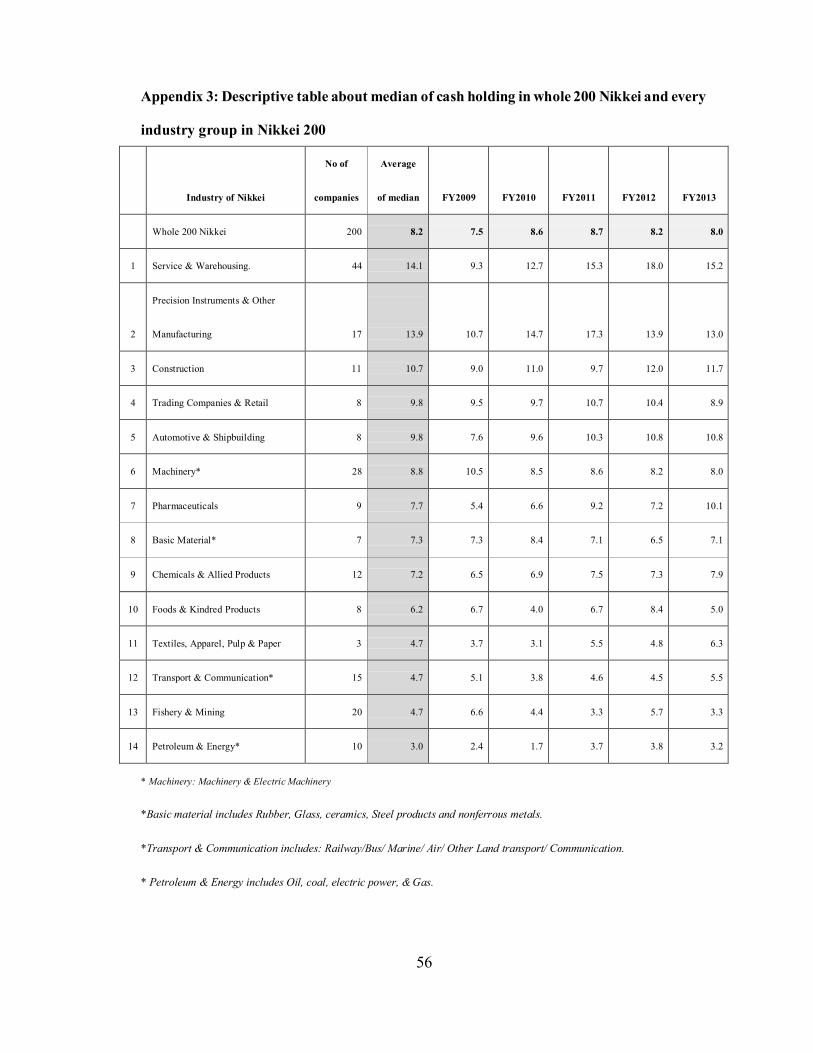
56
Appendix 3: Descriptive table about median of cash holding in whole 200 Nikkei and every
industry group in Nikkei 200
* Machinery: Machinery & Electric Machinery
*Basic material includes Rubber, Glass, ceramics, Steel products and nonferrous metals.
*Transport & Communication includes: Railway/Bus/ Marine/ Air/ Other Land transport/ Communication.
* Petroleum & Energy includes Oil, coal, electric power, & Gas.
Industry of Nikkei
No of
companies
Average
of median
FY2009
FY2010
FY2011
FY2012
FY2013
Whole 200 Nikkei
200
8.2
7.5
8.6
8.7
8.2
8.0
1
Service & Warehousing.
44
14.1
9.3
12.7
15.3
18.0
15.2
2
Precision Instruments & Other
Manufacturing
17
13.9
10.7
14.7
17.3
13.9
13.0
3
Construction
11
10.7
9.0
11.0
9.7
12.0
11.7
4
Trading Companies & Retail
8
9.8
9.5
9.7
10.7
10.4
8.9
5
Automotive & Shipbuilding
8
9.8
7.6
9.6
10.3
10.8
10.8
6
Machinery*
28
8.8
10.5
8.5
8.6
8.2
8.0
7
Pharmaceuticals
9
7.7
5.4
6.6
9.2
7.2
10.1
8
Basic Material*
7
7.3
7.3
8.4
7.1
6.5
7.1
9
Chemicals & Allied Products
12
7.2
6.5
6.9
7.5
7.3
7.9
10
Foods & Kindred Products
8
6.2
6.7
4.0
6.7
8.4
5.0
11
Textiles, Apparel, Pulp & Paper
3
4.7
3.7
3.1
5.5
4.8
6.3
12
Transport & Communication*
15
4.7
5.1
3.8
4.6
4.5
5.5
13
Fishery & Mining
20
4.7
6.6
4.4
3.3
5.7
3.3
14
Petroleum & Energy*
10
3.0
2.4
1.7
3.7
3.8
3.2
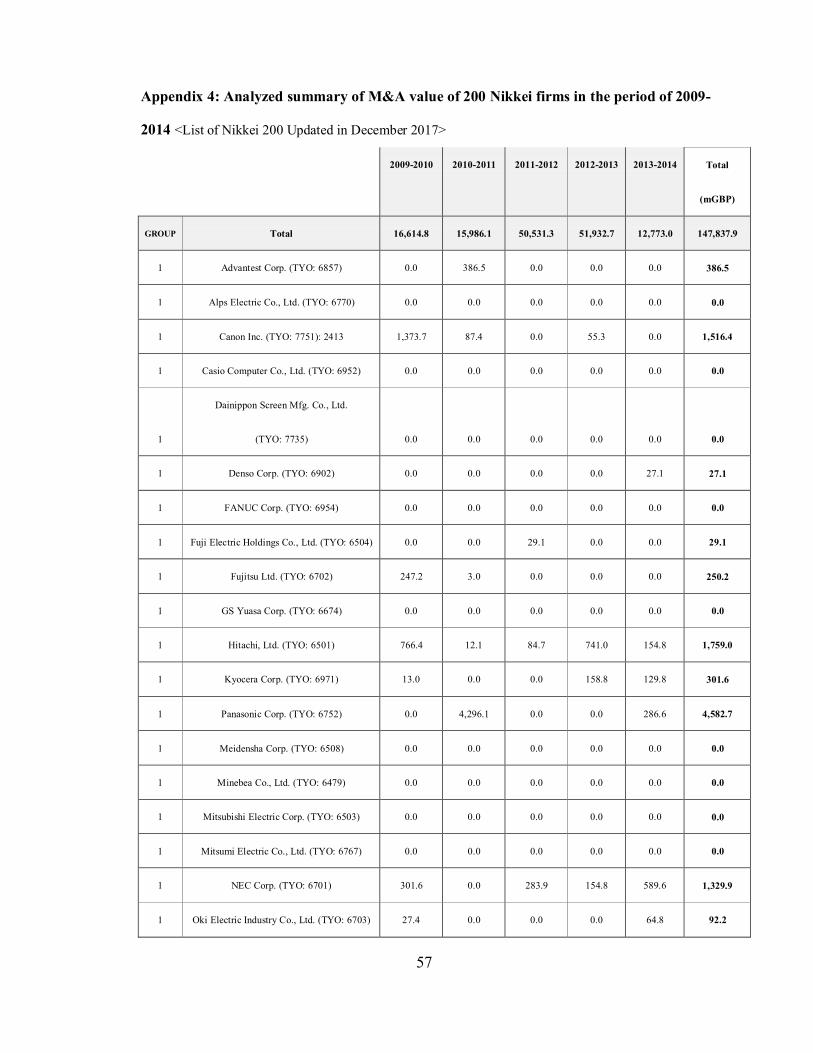
57
Appendix 4: Analyzed summary of M&A value of 200 Nikkei firms in the period of 2009-
2014 <List of Nikkei 200 Updated in December 2017>
2009-2010
2010-2011
2011-2012
2012-2013
2013-2014
Total
(mGBP)
GROUP
Total
16,614.8
15,986.1
50,531.3
51,932.7
12,773.0
147,837.9
1
Advantest Corp. (TYO: 6857)
0.0
386.5
0.0
0.0
0.0
386.5
1
Alps Electric Co., Ltd. (TYO: 6770)
0.0
0.0
0.0
0.0
0.0
0.0
1
Canon Inc. (TYO: 7751): 2413
1,373.7
87.4
0.0
55.3
0.0
1,516.4
1
Casio Computer Co., Ltd. (TYO: 6952)
0.0
0.0
0.0
0.0
0.0
0.0
1
Dainippon Screen Mfg. Co., Ltd.
(TYO: 7735)
0.0
0.0
0.0
0.0
0.0
0.0
1
Denso Corp. (TYO: 6902)
0.0
0.0
0.0
0.0
27.1
27.1
1
FANUC Corp. (TYO: 6954)
0.0
0.0
0.0
0.0
0.0
0.0
1
Fuji Electric Holdings Co., Ltd. (TYO: 6504)
0.0
0.0
29.1
0.0
0.0
29.1
1
Fujitsu Ltd. (TYO: 6702)
247.2
3.0
0.0
0.0
0.0
250.2
1
GS Yuasa Corp. (TYO: 6674)
0.0
0.0
0.0
0.0
0.0
0.0
1
Hitachi, Ltd. (TYO: 6501)
766.4
12.1
84.7
741.0
154.8
1,759.0
1
Kyocera Corp. (TYO: 6971)
13.0
0.0
0.0
158.8
129.8
301.6
1
Panasonic Corp. (TYO: 6752)
0.0
4,296.1
0.0
0.0
286.6
4,582.7
1
Meidensha Corp. (TYO: 6508)
0.0
0.0
0.0
0.0
0.0
0.0
1
Minebea Co., Ltd. (TYO: 6479)
0.0
0.0
0.0
0.0
0.0
0.0
1
Mitsubishi Electric Corp. (TYO: 6503)
0.0
0.0
0.0
0.0
0.0
0.0
1
Mitsumi Electric Co., Ltd. (TYO: 6767)
0.0
0.0
0.0
0.0
0.0
0.0
1
NEC Corp. (TYO: 6701)
301.6
0.0
283.9
154.8
589.6
1,329.9
1
Oki Electric Industry Co., Ltd. (TYO: 6703)
27.4
0.0
0.0
0.0
64.8
92.2
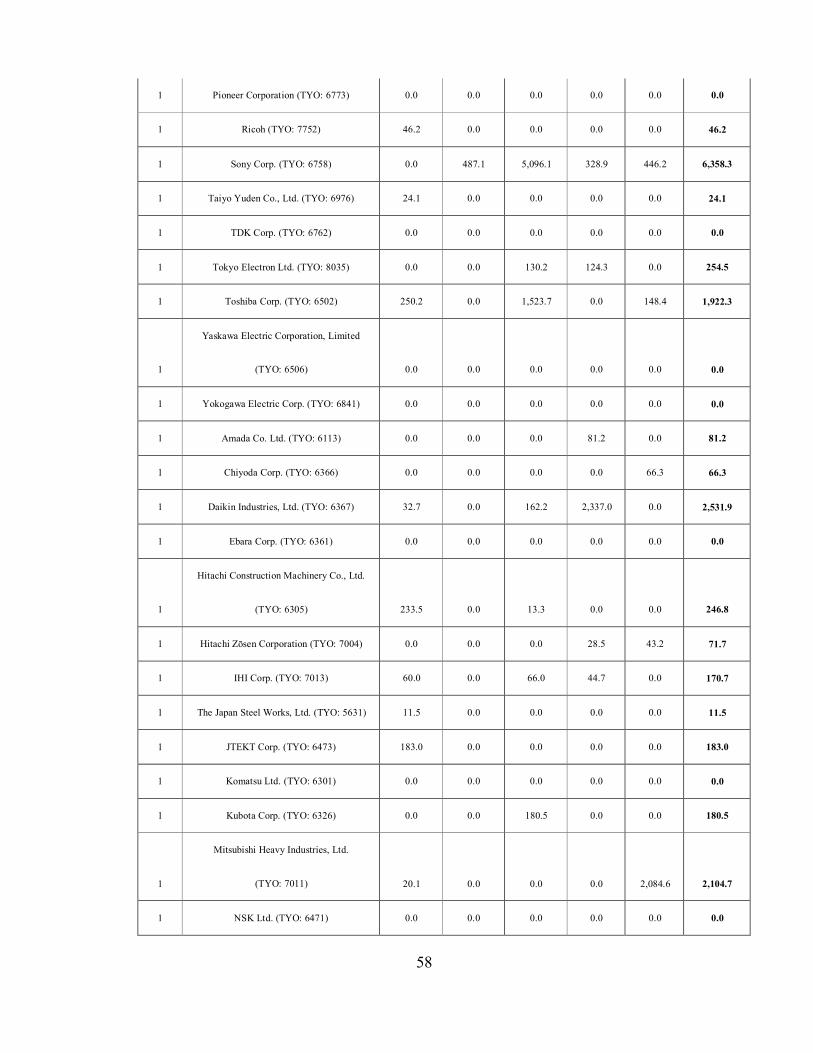
58
1
Pioneer Corporation (TYO: 6773)
0.0
0.0
0.0
0.0
0.0
0.0
1
Ricoh (TYO: 7752)
46.2
0.0
0.0
0.0
0.0
46.2
1
Sony Corp. (TYO: 6758)
0.0
487.1
5,096.1
328.9
446.2
6,358.3
1
Taiyo Yuden Co., Ltd. (TYO: 6976)
24.1
0.0
0.0
0.0
0.0
24.1
1
TDK Corp. (TYO: 6762)
0.0
0.0
0.0
0.0
0.0
0.0
1
Tokyo Electron Ltd. (TYO: 8035)
0.0
0.0
130.2
124.3
0.0
254.5
1
Toshiba Corp. (TYO: 6502)
250.2
0.0
1,523.7
0.0
148.4
1,922.3
1
Yaskawa Electric Corporation, Limited
(TYO: 6506)
0.0
0.0
0.0
0.0
0.0
0.0
1
Yokogawa Electric Corp. (TYO: 6841)
0.0
0.0
0.0
0.0
0.0
0.0
1
Amada Co. Ltd. (TYO: 6113)
0.0
0.0
0.0
81.2
0.0
81.2
1
Chiyoda Corp. (TYO: 6366)
0.0
0.0
0.0
0.0
66.3
66.3
1
Daikin Industries, Ltd. (TYO: 6367)
32.7
0.0
162.2
2,337.0
0.0
2,531.9
1
Ebara Corp. (TYO: 6361)
0.0
0.0
0.0
0.0
0.0
0.0
1
Hitachi Construction Machinery Co., Ltd.
(TYO: 6305)
233.5
0.0
13.3
0.0
0.0
246.8
1
Hitachi Zōsen Corporation (TYO: 7004)
0.0
0.0
0.0
28.5
43.2
71.7
1
IHI Corp. (TYO: 7013)
60.0
0.0
66.0
44.7
0.0
170.7
1
The Japan Steel Works, Ltd. (TYO: 5631)
11.5
0.0
0.0
0.0
0.0
11.5
1
JTEKT Corp. (TYO: 6473)
183.0
0.0
0.0
0.0
0.0
183.0
1
Komatsu Ltd. (TYO: 6301)
0.0
0.0
0.0
0.0
0.0
0.0
1
Kubota Corp. (TYO: 6326)
0.0
0.0
180.5
0.0
0.0
180.5
1
Mitsubishi Heavy Industries, Ltd.
(TYO: 7011)
20.1
0.0
0.0
0.0
2,084.6
2,104.7
1
NSK Ltd. (TYO: 6471)
0.0
0.0
0.0
0.0
0.0
0.0
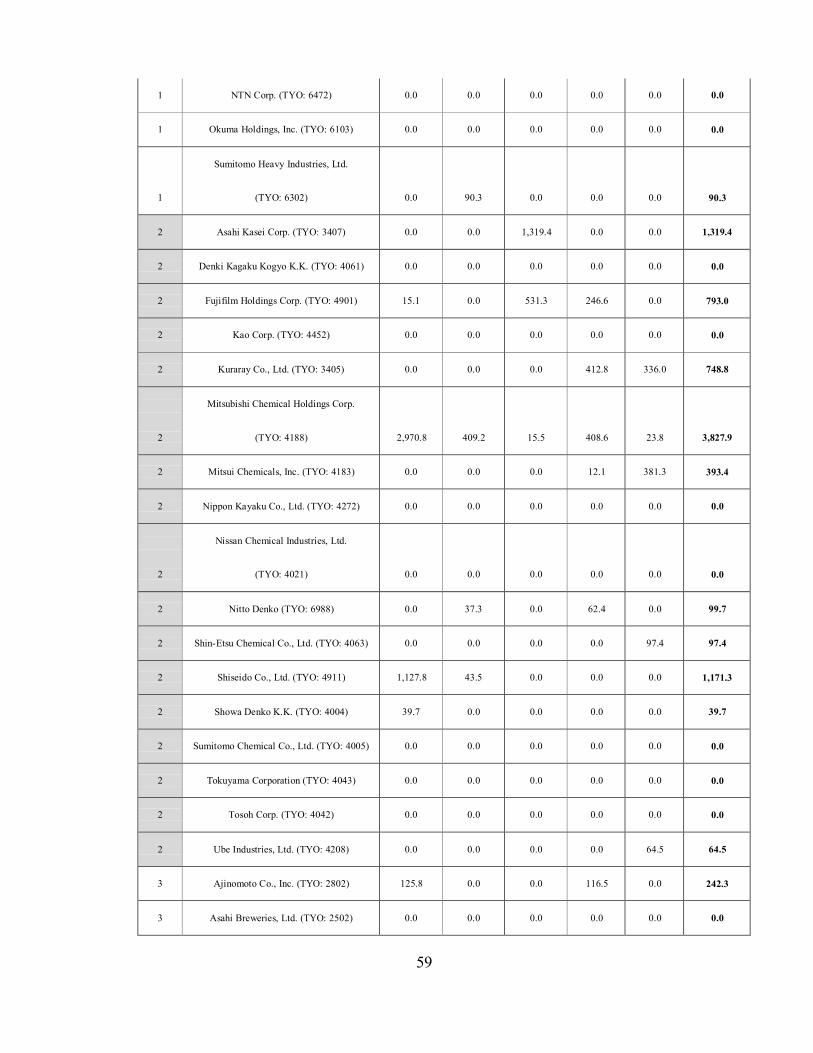
59
1
NTN Corp. (TYO: 6472)
0.0
0.0
0.0
0.0
0.0
0.0
1
Okuma Holdings, Inc. (TYO: 6103)
0.0
0.0
0.0
0.0
0.0
0.0
1
Sumitomo Heavy Industries, Ltd.
(TYO: 6302)
0.0
90.3
0.0
0.0
0.0
90.3
2
Asahi Kasei Corp. (TYO: 3407)
0.0
0.0
1,319.4
0.0
0.0
1,319.4
2
Denki Kagaku Kogyo K.K. (TYO: 4061)
0.0
0.0
0.0
0.0
0.0
0.0
2
Fujifilm Holdings Corp. (TYO: 4901)
15.1
0.0
531.3
246.6
0.0
793.0
2
Kao Corp. (TYO: 4452)
0.0
0.0
0.0
0.0
0.0
0.0
2
Kuraray Co., Ltd. (TYO: 3405)
0.0
0.0
0.0
412.8
336.0
748.8
2
Mitsubishi Chemical Holdings Corp.
(TYO: 4188)
2,970.8
409.2
15.5
408.6
23.8
3,827.9
2
Mitsui Chemicals, Inc. (TYO: 4183)
0.0
0.0
0.0
12.1
381.3
393.4
2
Nippon Kayaku Co., Ltd. (TYO: 4272)
0.0
0.0
0.0
0.0
0.0
0.0
2
Nissan Chemical Industries, Ltd.
(TYO: 4021)
0.0
0.0
0.0
0.0
0.0
0.0
2
Nitto Denko (TYO: 6988)
0.0
37.3
0.0
62.4
0.0
99.7
2
Shin-Etsu Chemical Co., Ltd. (TYO: 4063)
0.0
0.0
0.0
0.0
97.4
97.4
2
Shiseido Co., Ltd. (TYO: 4911)
1,127.8
43.5
0.0
0.0
0.0
1,171.3
2
Showa Denko K.K. (TYO: 4004)
39.7
0.0
0.0
0.0
0.0
39.7
2
Sumitomo Chemical Co., Ltd. (TYO: 4005)
0.0
0.0
0.0
0.0
0.0
0.0
2
Tokuyama Corporation (TYO: 4043)
0.0
0.0
0.0
0.0
0.0
0.0
2
Tosoh Corp. (TYO: 4042)
0.0
0.0
0.0
0.0
0.0
0.0
2
Ube Industries, Ltd. (TYO: 4208)
0.0
0.0
0.0
0.0
64.5
64.5
3
Ajinomoto Co., Inc. (TYO: 2802)
125.8
0.0
0.0
116.5
0.0
242.3
3
Asahi Breweries, Ltd. (TYO: 2502)
0.0
0.0
0.0
0.0
0.0
0.0
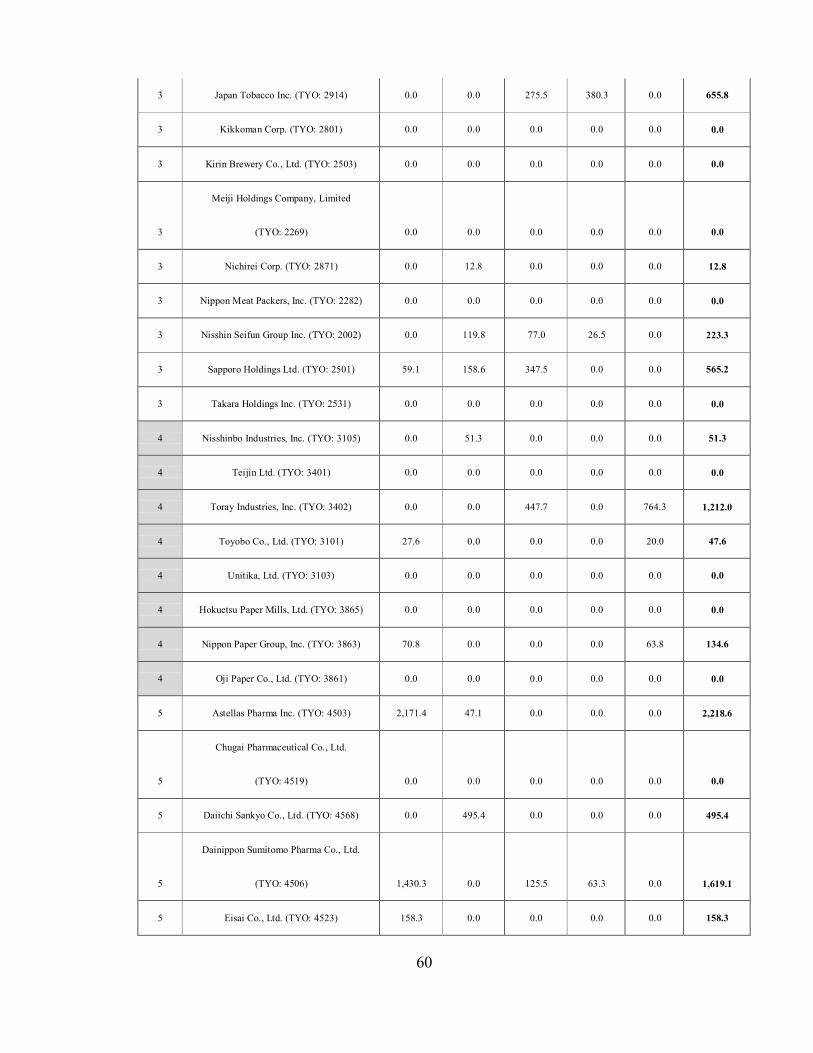
60
3
Japan Tobacco Inc. (TYO: 2914)
0.0
0.0
275.5
380.3
0.0
655.8
3
Kikkoman Corp. (TYO: 2801)
0.0
0.0
0.0
0.0
0.0
0.0
3
Kirin Brewery Co., Ltd. (TYO: 2503)
0.0
0.0
0.0
0.0
0.0
0.0
3
Meiji Holdings Company, Limited
(TYO: 2269)
0.0
0.0
0.0
0.0
0.0
0.0
3
Nichirei Corp. (TYO: 2871)
0.0
12.8
0.0
0.0
0.0
12.8
3
Nippon Meat Packers, Inc. (TYO: 2282)
0.0
0.0
0.0
0.0
0.0
0.0
3
Nisshin Seifun Group Inc. (TYO: 2002)
0.0
119.8
77.0
26.5
0.0
223.3
3
Sapporo Holdings Ltd. (TYO: 2501)
59.1
158.6
347.5
0.0
0.0
565.2
3
Takara Holdings Inc. (TYO: 2531)
0.0
0.0
0.0
0.0
0.0
0.0
4
Nisshinbo Industries, Inc. (TYO: 3105)
0.0
51.3
0.0
0.0
0.0
51.3
4
Teijin Ltd. (TYO: 3401)
0.0
0.0
0.0
0.0
0.0
0.0
4
Toray Industries, Inc. (TYO: 3402)
0.0
0.0
447.7
0.0
764.3
1,212.0
4
Toyobo Co., Ltd. (TYO: 3101)
27.6
0.0
0.0
0.0
20.0
47.6
4
Unitika, Ltd. (TYO: 3103)
0.0
0.0
0.0
0.0
0.0
0.0
4
Hokuetsu Paper Mills, Ltd. (TYO: 3865)
0.0
0.0
0.0
0.0
0.0
0.0
4
Nippon Paper Group, Inc. (TYO: 3863)
70.8
0.0
0.0
0.0
63.8
134.6
4
Oji Paper Co., Ltd. (TYO: 3861)
0.0
0.0
0.0
0.0
0.0
0.0
5
Astellas Pharma Inc. (TYO: 4503)
2,171.4
47.1
0.0
0.0
0.0
2,218.6
5
Chugai Pharmaceutical Co., Ltd.
(TYO: 4519)
0.0
0.0
0.0
0.0
0.0
0.0
5
Daiichi Sankyo Co., Ltd. (TYO: 4568)
0.0
495.4
0.0
0.0
0.0
495.4
5
Dainippon Sumitomo Pharma Co., Ltd.
(TYO: 4506)
1,430.3
0.0
125.5
63.3
0.0
1,619.1
5
Eisai Co., Ltd. (TYO: 4523)
158.3
0.0
0.0
0.0
0.0
158.3
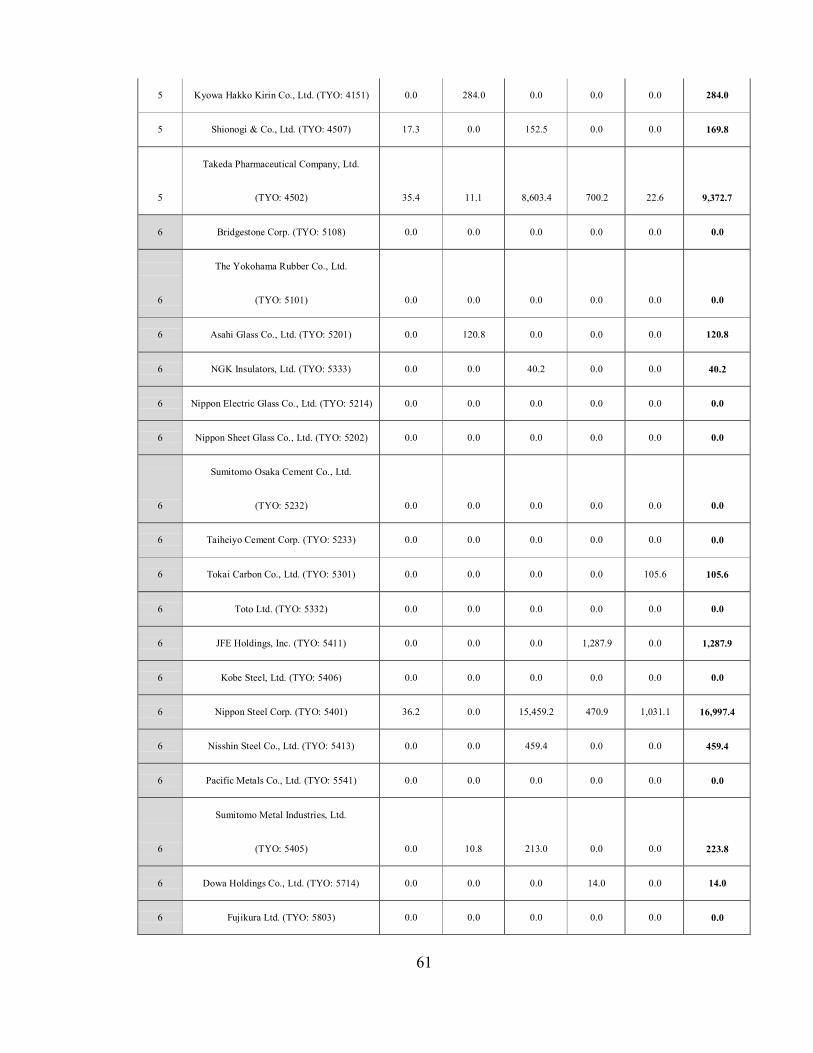
61
5
Kyowa Hakko Kirin Co., Ltd. (TYO: 4151)
0.0
284.0
0.0
0.0
0.0
284.0
5
Shionogi & Co., Ltd. (TYO: 4507)
17.3
0.0
152.5
0.0
0.0
169.8
5
Takeda Pharmaceutical Company, Ltd.
(TYO: 4502)
35.4
11.1
8,603.4
700.2
22.6
9,372.7
6
Bridgestone Corp. (TYO: 5108)
0.0
0.0
0.0
0.0
0.0
0.0
6
The Yokohama Rubber Co., Ltd.
(TYO: 5101)
0.0
0.0
0.0
0.0
0.0
0.0
6
Asahi Glass Co., Ltd. (TYO: 5201)
0.0
120.8
0.0
0.0
0.0
120.8
6
NGK Insulators, Ltd. (TYO: 5333)
0.0
0.0
40.2
0.0
0.0
40.2
6
Nippon Electric Glass Co., Ltd. (TYO: 5214)
0.0
0.0
0.0
0.0
0.0
0.0
6
Nippon Sheet Glass Co., Ltd. (TYO: 5202)
0.0
0.0
0.0
0.0
0.0
0.0
6
Sumitomo Osaka Cement Co., Ltd.
(TYO: 5232)
0.0
0.0
0.0
0.0
0.0
0.0
6
Taiheiyo Cement Corp. (TYO: 5233)
0.0
0.0
0.0
0.0
0.0
0.0
6
Tokai Carbon Co., Ltd. (TYO: 5301)
0.0
0.0
0.0
0.0
105.6
105.6
6
Toto Ltd. (TYO: 5332)
0.0
0.0
0.0
0.0
0.0
0.0
6
JFE Holdings, Inc. (TYO: 5411)
0.0
0.0
0.0
1,287.9
0.0
1,287.9
6
Kobe Steel, Ltd. (TYO: 5406)
0.0
0.0
0.0
0.0
0.0
0.0
6
Nippon Steel Corp. (TYO: 5401)
36.2
0.0
15,459.2
470.9
1,031.1
16,997.4
6
Nisshin Steel Co., Ltd. (TYO: 5413)
0.0
0.0
459.4
0.0
0.0
459.4
6
Pacific Metals Co., Ltd. (TYO: 5541)
0.0
0.0
0.0
0.0
0.0
0.0
6
Sumitomo Metal Industries, Ltd.
(TYO: 5405)
0.0
10.8
213.0
0.0
0.0
223.8
6
Dowa Holdings Co., Ltd. (TYO: 5714)
0.0
0.0
0.0
14.0
0.0
14.0
6
Fujikura Ltd. (TYO: 5803)
0.0
0.0
0.0
0.0
0.0
0.0
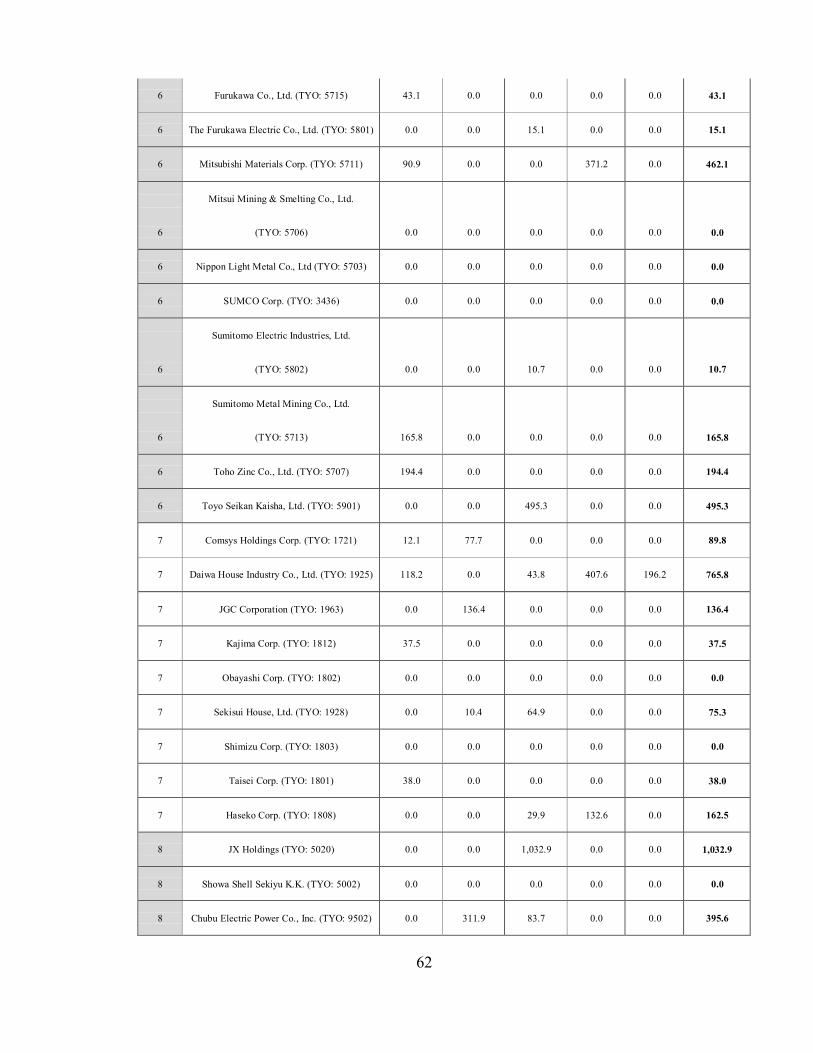
62
6
Furukawa Co., Ltd. (TYO: 5715)
43.1
0.0
0.0
0.0
0.0
43.1
6
The Furukawa Electric Co., Ltd. (TYO: 5801)
0.0
0.0
15.1
0.0
0.0
15.1
6
Mitsubishi Materials Corp. (TYO: 5711)
90.9
0.0
0.0
371.2
0.0
462.1
6
Mitsui Mining & Smelting Co., Ltd.
(TYO: 5706)
0.0
0.0
0.0
0.0
0.0
0.0
6
Nippon Light Metal Co., Ltd (TYO: 5703)
0.0
0.0
0.0
0.0
0.0
0.0
6
SUMCO Corp. (TYO: 3436)
0.0
0.0
0.0
0.0
0.0
0.0
6
Sumitomo Electric Industries, Ltd.
(TYO: 5802)
0.0
0.0
10.7
0.0
0.0
10.7
6
Sumitomo Metal Mining Co., Ltd.
(TYO: 5713)
165.8
0.0
0.0
0.0
0.0
165.8
6
Toho Zinc Co., Ltd. (TYO: 5707)
194.4
0.0
0.0
0.0
0.0
194.4
6
Toyo Seikan Kaisha, Ltd. (TYO: 5901)
0.0
0.0
495.3
0.0
0.0
495.3
7
Comsys Holdings Corp. (TYO: 1721)
12.1
77.7
0.0
0.0
0.0
89.8
7
Daiwa House Industry Co., Ltd. (TYO: 1925)
118.2
0.0
43.8
407.6
196.2
765.8
7
JGC Corporation (TYO: 1963)
0.0
136.4
0.0
0.0
0.0
136.4
7
Kajima Corp. (TYO: 1812)
37.5
0.0
0.0
0.0
0.0
37.5
7
Obayashi Corp. (TYO: 1802)
0.0
0.0
0.0
0.0
0.0
0.0
7
Sekisui House, Ltd. (TYO: 1928)
0.0
10.4
64.9
0.0
0.0
75.3
7
Shimizu Corp. (TYO: 1803)
0.0
0.0
0.0
0.0
0.0
0.0
7
Taisei Corp. (TYO: 1801)
38.0
0.0
0.0
0.0
0.0
38.0
7
Haseko Corp. (TYO: 1808)
0.0
0.0
29.9
132.6
0.0
162.5
8
JX Holdings (TYO: 5020)
0.0
0.0
1,032.9
0.0
0.0
1,032.9
8
Showa Shell Sekiyu K.K. (TYO: 5002)
0.0
0.0
0.0
0.0
0.0
0.0
8
Chubu Electric Power Co., Inc. (TYO: 9502)
0.0
311.9
83.7
0.0
0.0
395.6
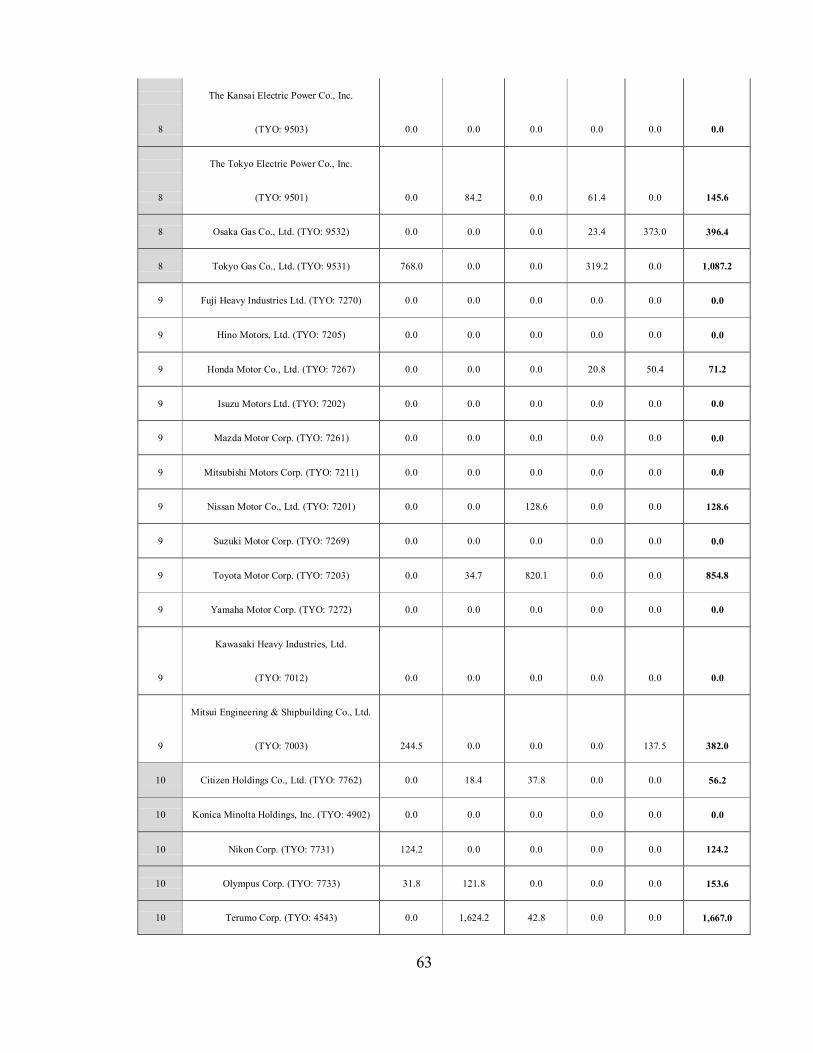
63
8
The Kansai Electric Power Co., Inc.
(TYO: 9503)
0.0
0.0
0.0
0.0
0.0
0.0
8
The Tokyo Electric Power Co., Inc.
(TYO: 9501)
0.0
84.2
0.0
61.4
0.0
145.6
8
Osaka Gas Co., Ltd. (TYO: 9532)
0.0
0.0
0.0
23.4
373.0
396.4
8
Tokyo Gas Co., Ltd. (TYO: 9531)
768.0
0.0
0.0
319.2
0.0
1,087.2
9
Fuji Heavy Industries Ltd. (TYO: 7270)
0.0
0.0
0.0
0.0
0.0
0.0
9
Hino Motors, Ltd. (TYO: 7205)
0.0
0.0
0.0
0.0
0.0
0.0
9
Honda Motor Co., Ltd. (TYO: 7267)
0.0
0.0
0.0
20.8
50.4
71.2
9
Isuzu Motors Ltd. (TYO: 7202)
0.0
0.0
0.0
0.0
0.0
0.0
9
Mazda Motor Corp. (TYO: 7261)
0.0
0.0
0.0
0.0
0.0
0.0
9
Mitsubishi Motors Corp. (TYO: 7211)
0.0
0.0
0.0
0.0
0.0
0.0
9
Nissan Motor Co., Ltd. (TYO: 7201)
0.0
0.0
128.6
0.0
0.0
128.6
9
Suzuki Motor Corp. (TYO: 7269)
0.0
0.0
0.0
0.0
0.0
0.0
9
Toyota Motor Corp. (TYO: 7203)
0.0
34.7
820.1
0.0
0.0
854.8
9
Yamaha Motor Corp. (TYO: 7272)
0.0
0.0
0.0
0.0
0.0
0.0
9
Kawasaki Heavy Industries, Ltd.
(TYO: 7012)
0.0
0.0
0.0
0.0
0.0
0.0
9
Mitsui Engineering & Shipbuilding Co., Ltd.
(TYO: 7003)
244.5
0.0
0.0
0.0
137.5
382.0
10
Citizen Holdings Co., Ltd. (TYO: 7762)
0.0
18.4
37.8
0.0
0.0
56.2
10
Konica Minolta Holdings, Inc. (TYO: 4902)
0.0
0.0
0.0
0.0
0.0
0.0
10
Nikon Corp. (TYO: 7731)
124.2
0.0
0.0
0.0
0.0
124.2
10
Olympus Corp. (TYO: 7733)
31.8
121.8
0.0
0.0
0.0
153.6
10
Terumo Corp. (TYO: 4543)
0.0
1,624.2
42.8
0.0
0.0
1,667.0
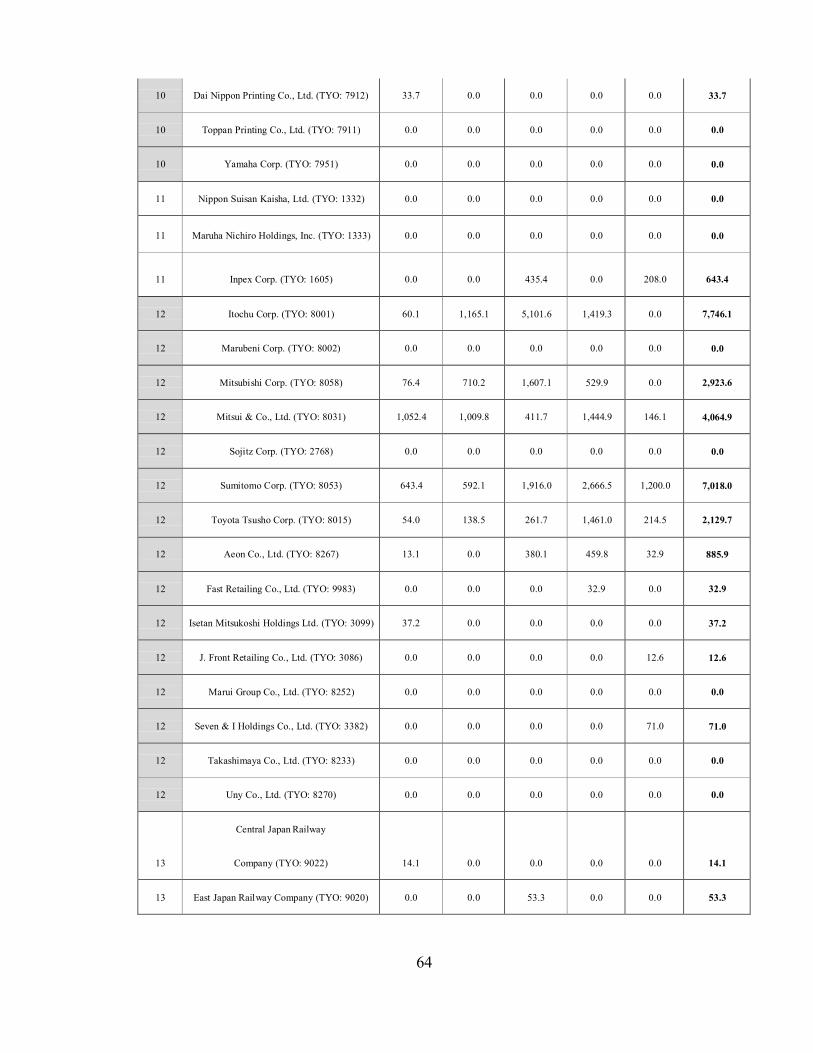
64
10
Dai Nippon Printing Co., Ltd. (TYO: 7912)
33.7
0.0
0.0
0.0
0.0
33.7
10
Toppan Printing Co., Ltd. (TYO: 7911)
0.0
0.0
0.0
0.0
0.0
0.0
10
Yamaha Corp. (TYO: 7951)
0.0
0.0
0.0
0.0
0.0
0.0
11
Nippon Suisan Kaisha, Ltd. (TYO: 1332)
0.0
0.0
0.0
0.0
0.0
0.0
11
Maruha Nichiro Holdings, Inc. (TYO: 1333)
0.0
0.0
0.0
0.0
0.0
0.0
11
Inpex Corp. (TYO: 1605)
0.0
0.0
435.4
0.0
208.0
643.4
12
Itochu Corp. (TYO: 8001)
60.1
1,165.1
5,101.6
1,419.3
0.0
7,746.1
12
Marubeni Corp. (TYO: 8002)
0.0
0.0
0.0
0.0
0.0
0.0
12
Mitsubishi Corp. (TYO: 8058)
76.4
710.2
1,607.1
529.9
0.0
2,923.6
12
Mitsui & Co., Ltd. (TYO: 8031)
1,052.4
1,009.8
411.7
1,444.9
146.1
4,064.9
12
Sojitz Corp. (TYO: 2768)
0.0
0.0
0.0
0.0
0.0
0.0
12
Sumitomo Corp. (TYO: 8053)
643.4
592.1
1,916.0
2,666.5
1,200.0
7,018.0
12
Toyota Tsusho Corp. (TYO: 8015)
54.0
138.5
261.7
1,461.0
214.5
2,129.7
12
Aeon Co., Ltd. (TYO: 8267)
13.1
0.0
380.1
459.8
32.9
885.9
12
Fast Retailing Co., Ltd. (TYO: 9983)
0.0
0.0
0.0
32.9
0.0
32.9
12
Isetan Mitsukoshi Holdings Ltd. (TYO: 3099)
37.2
0.0
0.0
0.0
0.0
37.2
12
J. Front Retailing Co., Ltd. (TYO: 3086)
0.0
0.0
0.0
0.0
12.6
12.6
12
Marui Group Co., Ltd. (TYO: 8252)
0.0
0.0
0.0
0.0
0.0
0.0
12
Seven & I Holdings Co., Ltd. (TYO: 3382)
0.0
0.0
0.0
0.0
71.0
71.0
12
Takashimaya Co., Ltd. (TYO: 8233)
0.0
0.0
0.0
0.0
0.0
0.0
12
Uny Co., Ltd. (TYO: 8270)
0.0
0.0
0.0
0.0
0.0
0.0
13
Central Japan Railway
Company (TYO: 9022)
14.1
0.0
0.0
0.0
0.0
14.1
13
East Japan Railway Company (TYO: 9020)
0.0
0.0
53.3
0.0
0.0
53.3
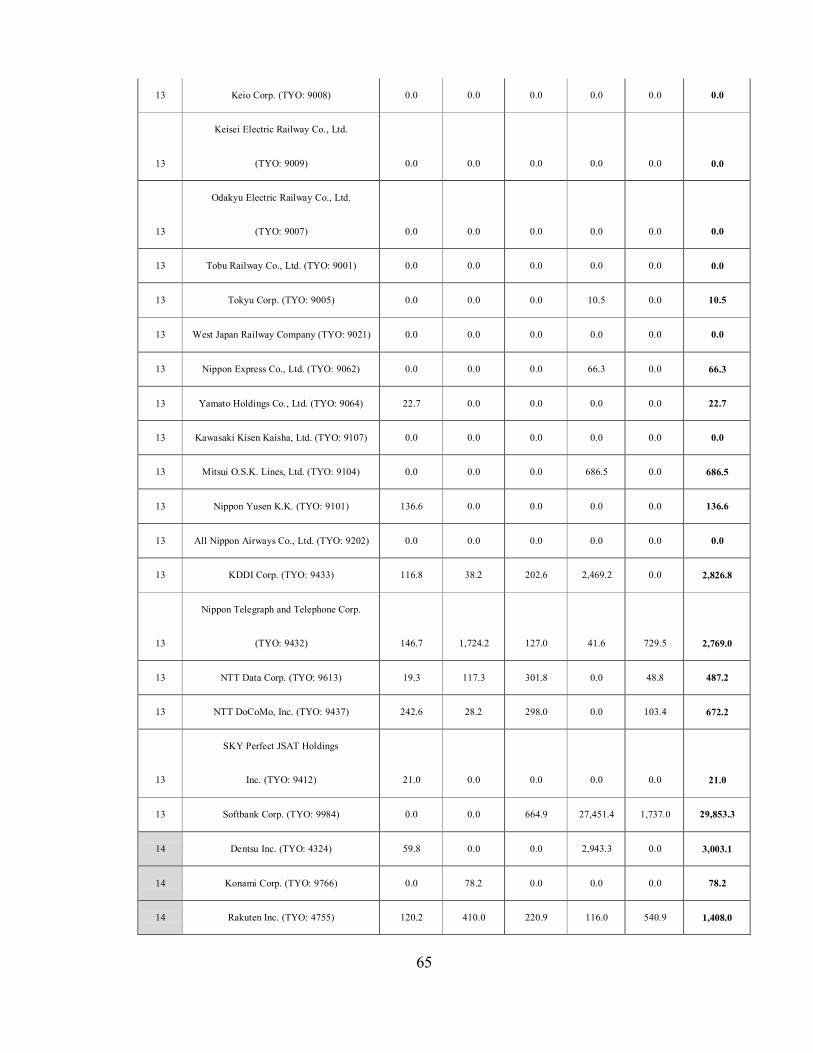
65
13
Keio Corp. (TYO: 9008)
0.0
0.0
0.0
0.0
0.0
0.0
13
Keisei Electric Railway Co., Ltd.
(TYO: 9009)
0.0
0.0
0.0
0.0
0.0
0.0
13
Odakyu Electric Railway Co., Ltd.
(TYO: 9007)
0.0
0.0
0.0
0.0
0.0
0.0
13
Tobu Railway Co., Ltd. (TYO: 9001)
0.0
0.0
0.0
0.0
0.0
0.0
13
Tokyu Corp. (TYO: 9005)
0.0
0.0
0.0
10.5
0.0
10.5
13
West Japan Railway Company (TYO: 9021)
0.0
0.0
0.0
0.0
0.0
0.0
13
Nippon Express Co., Ltd. (TYO: 9062)
0.0
0.0
0.0
66.3
0.0
66.3
13
Yamato Holdings Co., Ltd. (TYO: 9064)
22.7
0.0
0.0
0.0
0.0
22.7
13
Kawasaki Kisen Kaisha, Ltd. (TYO: 9107)
0.0
0.0
0.0
0.0
0.0
0.0
13
Mitsui O.S.K. Lines, Ltd. (TYO: 9104)
0.0
0.0
0.0
686.5
0.0
686.5
13
Nippon Yusen K.K. (TYO: 9101)
136.6
0.0
0.0
0.0
0.0
136.6
13
All Nippon Airways Co., Ltd. (TYO: 9202)
0.0
0.0
0.0
0.0
0.0
0.0
13
KDDI Corp. (TYO: 9433)
116.8
38.2
202.6
2,469.2
0.0
2,826.8
13
Nippon Telegraph and Telephone Corp.
(TYO: 9432)
146.7
1,724.2
127.0
41.6
729.5
2,769.0
13
NTT Data Corp. (TYO: 9613)
19.3
117.3
301.8
0.0
48.8
487.2
13
NTT DoCoMo, Inc. (TYO: 9437)
242.6
28.2
298.0
0.0
103.4
672.2
13
SKY Perfect JSAT Holdings
Inc. (TYO: 9412)
21.0
0.0
0.0
0.0
0.0
21.0
13
Softbank Corp. (TYO: 9984)
0.0
0.0
664.9
27,451.4
1,737.0
29,853.3
14
Dentsu Inc. (TYO: 4324)
59.8
0.0
0.0
2,943.3
0.0
3,003.1
14
Konami Corp. (TYO: 9766)
0.0
78.2
0.0
0.0
0.0
78.2
14
Rakuten Inc. (TYO: 4755)
120.2
410.0
220.9
116.0
540.9
1,408.0
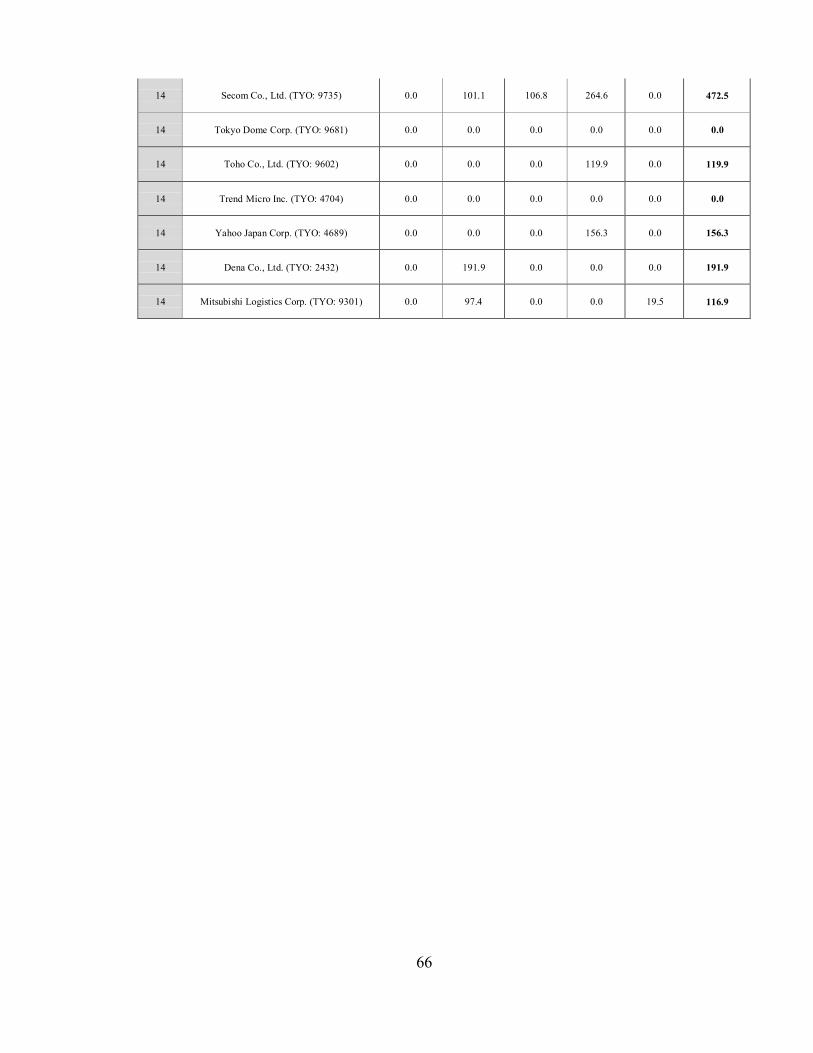
66
14
Secom Co., Ltd. (TYO: 9735)
0.0
101.1
106.8
264.6
0.0
472.5
14
Tokyo Dome Corp. (TYO: 9681)
0.0
0.0
0.0
0.0
0.0
0.0
14
Toho Co., Ltd. (TYO: 9602)
0.0
0.0
0.0
119.9
0.0
119.9
14
Trend Micro Inc. (TYO: 4704)
0.0
0.0
0.0
0.0
0.0
0.0
14
Yahoo Japan Corp. (TYO: 4689)
0.0
0.0
0.0
156.3
0.0
156.3
14
Dena Co., Ltd. (TYO: 2432)
0.0
191.9
0.0
0.0
0.0
191.9
14
Mitsubishi Logistics Corp. (TYO: 9301)
0.0
97.4
0.0
0.0
19.5
116.9
67
REFERENCE Almeida, H., Campello, M., & Weisbach, M. S. (2004). The cash flow sensitivity of cash. The
Journal of Finance, 59(4), 1777-1804.
Anju, S. (1990). Value creation in acquisitions: A re-examination of performance issues.
Strategic Management Journal, 11(2), 99-115. doi:10.1002/smj.4250110203
Arikawa, Y., & Miyajima, H. (2007). Understanding the M&A boom in japan: What drives
japanese M&A? doi:10.2139/ssrn.1013931
Barney, J. B. (1988). Returns to bidding firms in mergers and acquisitions: Reconsidering the
relatedness hypothesis. Strategic Management Journal, 9, 71-78.
doi:10.1002/smj.4250090708
Berger, P. G., & Ofek, E. (1995). Diversification's effect on firm value. Journal of Financial
Economics; Symposium on Corporate Focus, 37(1), 39-65.
doi:https://doi.org/10.1016/0304-405X(94)00798-6
Bloomberg. (2009 to 2014) Bloomberg Professional. [Online]. Available at: Subscription
Service (Accessed: April 2018)
Bradley, M.,D., Desai, A.,S., & Han Kim, E. (1988). Synergistic gains from corporate
acquisitions and their division between the stockholders of target and acquiring firms
doi:10.1016/0304-405X (88)90030-X
Ferreira, M., Custodio, C., & Raposo, C.,C. (2005). Cash holdings and business conditions
doi:10.2139/ssrn.608664
Harford, J. (2005). What drives merger waves? Journal of Financial Economics, 77(3), 529-
560. Retrieved from
https://EconPapers.repec.org/RePEc:eee:jfinec:v:77:y:2005:i:3:p:529-560
Hayn, C. (1989). Tax attributes as determinants of shareholder gains in corporate acquisitions
doi:https://doi.org/10.1016/0304-405X(89)90008-1
Investopedia. (2018). Mergers and Acquisitions - M&A. Retrieved from
https://www.investopedia.com/terms/m/mergersandacquisitions.asp
Jarrad, H. (1999). Corporate cash reserves and acquisitions. The Journal of Finance, 54(6),
1969-1997. Retrieved from https://onlinelibrary.wiley.com/doi/abs/10.1111/0022-
1082.00179
Jarrad, H. (1999). Corporate cash reserves and acquisitions. The Journal of Finance, 54(6),
1969-1997. doi:10.1111/0022-1082.00179
Jarrell, G. A., Brickley, J. A., & Netter, J. M. (1988). The market for corporate control: The
empirical evidence since 1980. The Journal of Economic Perspectives, 2(1), 49-68.
Retrieved from http://www.jstor.org/stable/1942739
Jensen, M. C. (1986). Agency costs of free cash flow, corporate finance, and takeovers. The
American Economic Review, 76(2), 323-329. Retrieved from
http://www.jstor.org/stable/1818789
68
Jensen, M. C., & Meckling, W. H. (1976). Theory of the firm: Managerial behavior, agency
costs and ownership structure. Journal of Financial Economics, 3(4), 305-360.
doi:https://doi.org/10.1016/0304-405X(76)90026-X
Jensen, M. C., & Ruback, R. S. (1983). The market for corporate control: The scientific
evidence. Journal of Financial Economics, 11(1), 5-50. doi: https://doi.org/10.1016/0304-
405X(83)90004-1
Kato, K., Li, M., & Skinner, D. J. (2017). Is japan really a "buy"? The corporate governance,
cash holdings and economic performance of Japanese companies. Journal of Business
Finance & Accounting, 44(3-4), 480-523.
Kawai, M., & Takagi, S.Why was japan hit so hard by the global financial crisis?
Laurence, C. (1999). The long-term performance of horizontal acquisitions. Strategic
Management Journal, 20(11), 987-1018. doi:10.1002/(SICI)1097-0266(199911)20:11
<987:AID-SMJ61>3.0.CO;2-B
Lins, K., Servaes, H., & Tufano, P. (2008). What drives corporate liquidity? An international
survey of cash holdings and lines of credit doi:10.1016/j.jfineco.2010.04.006
Matsumoto, S., & Jackson, K. (2017). Integration and synergy generation in cross border
acquisitions: A case study of business failure and success "made in japan"
doi:10.5539/ibr.v10n9p122
Maynard Keynes, J. (1936). The general theory of employment, interest and money
doi:10.2307/20048216
Myers, S. C., & Majluf, N. S. (1984). Corporate financing and investment decisions when firms
have information that investors do not have. Journal of Financial Economics, 13(2), 187-
221. doi: https://doi.org/10.1016/0304-405X(84)90023-0
Ojo, M. (2013). Why the traditional principal agent theory may no longer apply to concentrated
ownership systems and structures. Business and Economic Horizons, 9(3), 87-98.
Opler, T., Pinkowitz, L., Stulz, R., & Williamson, R. (1999). The determinants and implications
of cash holdings doi:10.1016/S0304-405X(99)00003-3
PENMAN, S. H., & THEODORE, S. (1998). A comparison of dividend, cash flow, and
earnings approaches to equity valuation*. Contemporary Accounting Research, 15(3),
343-383. doi:10.1111/j.1911-3846.1998.tb00564.x
Phan, H. (2014). Inside debt and mergers and acquisitions
Prahalad, C.,K., & Hamel, G. (2006). The core competence of corporation doi:10.1007/3-540-
30763-X_14
Sher, G. (2014). Cashing in for growth: Corporate cash holdings as an opportunity for
investment in japan Washington, DC: IMF. Retrieved from
http://dx.doi.org/10.5089/9781498322171.001
69
Shinada, N. (2012). Firms' cash holdings and performance: Evidence from Japanese corporate
finance Tokyo: Research Inst. of Economy, Trade and Industry. Retrieved from
http://www.rieti.go.jp/jp/publications/dp/12e031.pdf
Shleifer, A., & Vishny, R. W. (1992). Liquidation values and debt capacity: A market
equilibrium approach. The Journal of Finance, 47(4), 1343-1366. doi:10.2307/2328943
Sommer, M. (2009). Why has japan been hit so hard by the global recession? International
Monetary Fund.
Steven, B., Harry, G., Van, M. C., & Van, W. A. (2013). Cross-Border merger & acquisition
activity and revealed comparative advantage in manufacturing industries. Journal of
Economics & Management Strategy, 22(1), 28-57. doi:10.1111/jems.12007
Tokyo Stock Exchange (2009-2017). Tokyo Stock Exchange [Online]. (Accessed: March 2018)
UNCTAD. (2017). Country Fact Sheets 2017. Retrieved from http://www.unctad.org.
Arash Massoudi. et al (2017 Dec.28). Global M&A exceeds $3tn for fourth straight year.
Financial Times. Retrieved from https://www.ft.com/content/9f0270aa-eabf-11e7-bd17-
521324c81e23
Weisbach, M., Almeida, H., & Campello, M. (2004). The cash flow sensitivity of cash
doi:10.2139/ssrn.345840
Related Documents