2018 Annual Report

Welcome message from author
This document is posted to help you gain knowledge. Please leave a comment to let me know what you think about it! Share it to your friends and learn new things together.
Transcript
2018 Annual Report

TO OUR SHAREHOLDERS
In 1989, Dr. Richard Caruso had a vision to expand access to promising technology that enabled the human body to regenerate damaged or diseased tissues. Through his vision and persistence, he founded Integra LifeSciences and revolutionized the field of regenerative medicine, giving burn victims hope where it did not exist. Under the leadership of Stuart Essig, the company further expanded the use of this technology to other areas such as dural and nerve repair.
Thirty years later, Integra LifeSciences has become a global leader in regenerative medicine and neurosurgery. Every day, 4,500 Integra colleagues continue to bring hope to patients around the world through our broad portfolio of innovative medical technologies and products for wound care, surgical reconstruction, neurosurgery and extremity orthopedics.
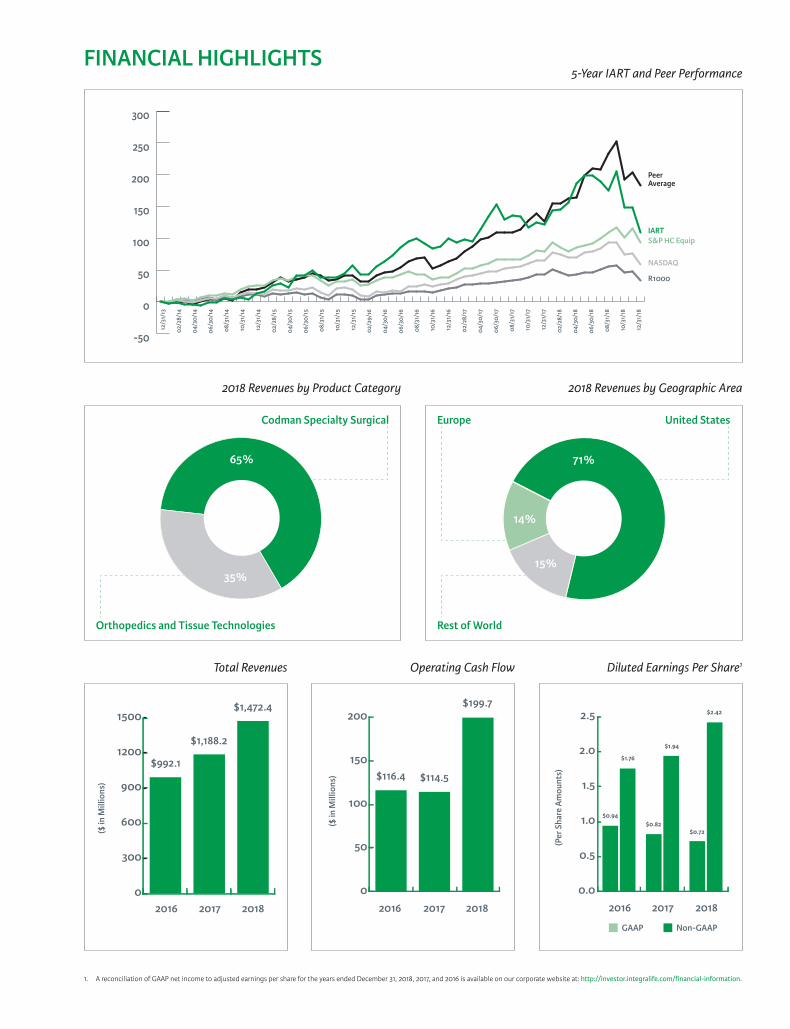
For the fifth consecutive year, Integra delivered double-digit revenue and adjusted earnings per share growth. Total revenues increased 24 percent to $1.47 billion and adjusted earnings per share increased 25 percent to $2.42. We generated nearly $200 million of operating cash and over $120 million in free cash flow, both of which were records for the company. We significantly strengthened our capital structure, providing additional flexibility to support our long-term strategic plans.
Our Codman Specialty Surgical business grew 33.8 percent to nearly $964 million in reported sales versus the prior year, while organic sales increased 3.4 percent. This growth was driven by the Codman Neurosurgery acquisition, continued strength of our CUSA® Clarity Ultrasonic Tissue Ablation System, and growth in our dural access and repair franchise.
Orthopedics and Tissue Technologies revenues were $508 million dollars, representing an increase of 8.7 percent on a reported basis and 5.5 percent on an organic basis compared to the prior year. This performance is the result of the broad-based strength of our regenerative technologies business, resulting from the expansion and increased focus of our commercial sales teams.
ACCELERATING GROWTH
We remained steadfast to the four pillars of our strategy, which we implemented a few years ago, and sharpened our focus on our priorities, positioning us well to accelerate growth.
In 2018, we delivered on the transition goals for the Codman Neurosurgery business, executing our integration plan with minimal commercial disruption while preserving employee and customer retention rates at or above plan. In July, we exited transition services agreements in the United States, Canada, Australia, New Zealand and China. We opened a new facility in Mansfield, Massachusetts, and relocated the first group of Codman conveyed colleagues in March. We also transitioned the Le Locle, Switzerland, manufacturing operations in the fourth quarter of 2018. To support the Codman integration, we made investments in global infrastructure, manufacturing, distribution and support services, which maximize the potential of our larger commercial organizations and our broader product portfolio, extending our international reach.
With the acquisition of Codman, and the investments we’ve made, we now have relevant scale in the global neurosurgery market to match our leadership position in the regenerative tissue space.
In the Orthopedics and Tissue Technologies business, we realigned our inpatient wound reconstruction and extremity orthopedic sales coverage as part of our channel expansion strategy. As a result, we saw strong sales performance in our regenerative technologies franchise, which we attribute to more focused customer attention. We established several important partnerships, including a program with Healogics®, Inc., in which we are a primary provider of cellular-based tissue products for the treatment of acute and chronic wounds. We recently signed an agreement with the Consortium of Focused Orthopedists for the development of a short stem and stemless shoulder system, a key addition to Integra’s extremity orthopedics portfolio in a fast-growing segment of the shoulder arthroplasty market. In addition, our ability to pursue broader contracting ensures we deliver greater value to our customers and patients.
Driving innovation with our new product pipeline is essential to improving clinical care, and ultimately, patient outcomes. Last year, we launched AmnioExcel® Plus Amniotic Allograft Membrane, our next-generation amniotic tissue product, in Veterans Affairs hospitals in the United States. We also launched the Integra® XT Revision Total Ankle Replacement System, which has been well-received by surgeons who expressed excitement for our approach to ankle revision surgery. In Japan, we introduced the CUSA Clarity Ultrasonic Surgical Aspirator System platform and received regulatory approval for the Bactiseal® catheter. CUSA Clarity continues to gain traction in the United States with 30 percent of the top neurosurgery and pediatric hospitals now using our tissue ablation platform.
Recently, we announced the full market release of the Integra® Titan Reverse Shoulder System-S, which includes a new glenoid baseplate design to expand the Integra® Titan Reverse Shoulder System. We also launched Integra® Panta® 2 TTC Arthrodesis Nail System for tibio-talo-calcaneal (TTC) fusion of the ankle due to severe arthritis, offering surgeons and patients the latest innovations in implants and instrumentation for effective TTC fusion.
We continued to focus on improving operational efficiency. During the second half of 2018, we invested in our regenerative manufacturing facilities to increase capacity by adding shifts, running additional lines and making capital improvements to drive efficiencies. Last year, we took the final steps to streamline our ERP systems from 30 a few years ago, to just one global platform. This implementation will play a significant role in laying the foundation to integrate more systems, increasing colleague productivity and positively impacting customer experience. For example, we introduced an online customer portal in the United States for our customers to track their order status and invoices in real time. Moving forward, we will easily be able to further enhance our customer interactions and service delivery, increasing our agility as a company.
COMMITMENT TO OUR PEOPLE
At the heart of our business are our 4,500 Integra colleagues. Our success is dependent on our ability to attract, develop and retain the most talented individuals, and to inspire them with our mission of making a difference in the quality of life of patients that encounter an Integra product, service or colleague.
As our company evolves, we are focused on acquiring and building critical skills and capabilities to support our strategy. In 2018, we welcomed a significant number of new colleagues globally and built skill sets for the future
through training programs, job rotations, expanded roles, and new job opportunities. We continue to enhance our leadership pipeline, providing tools designed to deliver results and enable leaders to more effectively set direction, communicate, and develop their teams.
We have made great strides in our aspiration of an inclusive and engaged culture. In 2018, I took the action pledge for diversity and inclusion through the CEO Action for Diversity & Inclusion™, the largest CEO-driven business commitment to advance diversity and inclusion within the workplace. In addition, our senior leaders completed micro-inequities training to strengthen their awareness of unconscious biases and micro-inequities, so our colleagues at Integra feel valued, and their ideas and perspectives are appreciated. Finally, our employee resource groups continue to grow and serve as forums to connect, share best practices, and develop professionally. Specifically, our Women of Integra Network now has chapters at each of our major locations around the world.
In November, we welcomed Eric Schwartz as corporate vice president, general counsel and secretary. Eric brings extensive experience in the healthcare industry, including in the areas of strategic acquisitions, regulatory, commercial contracting, and corporate governance.
Last year, we suffered a loss with the passing of longtime board member James Sullivan, who had been a director since 1992. Jim was a champion of Integra’s mission and values, and was passionate about bringing healthcare solutions to patients.
We also welcomed Rhonda Germany Ballintyn to the Integra board of directors in December. Her extensive experience in general management, marketing, operations, and strategy are strong assets as we grow and expand globally.
A PROMISING OUTLOOK
With the integration of Codman Neurosurgery nearing completion, important channel investments in place, and exciting new product introductions on the horizon, we expect to reap the benefits of a comprehensive product portfolio, a larger and more focused sales team, and a broader global footprint.
We have adhered to a strong set of core values, including integrity, focus on our people, excellence, embracing change, decisiveness, and teamwork. We live these values every day with passion, determination, and purpose. We make products that help surgeons remove brain tumors, repair shoulders, heal burnt skin, and restore damaged nerves. It is this unwavering commitment and our tireless efforts to do well for our customers, patients, and colleagues that have been central to our success.
As we approach the company’s 30th year, I remain as confident as ever in Integra’s ability to meet our full potential. We have the right strategy, the right teams, and the right areas of focus to accelerate growth. I believe in our people and in our ability to do well for shareholders and the communities we serve, while making a difference for patients.
On behalf of the board of directors, executive leadership team, and our 4,500 Integra colleagues, thank you for your trust and confidence. It is a privilege to make products that have such a positive impact on the lives of people around the world.
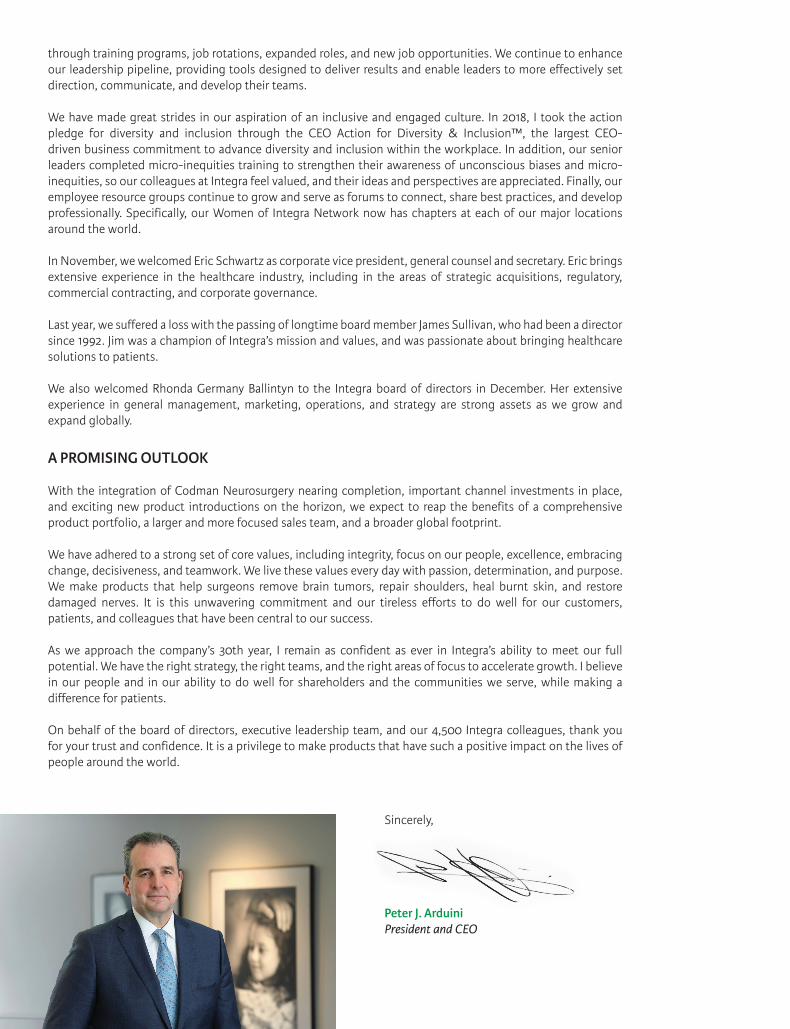
Peter J. ArduiniPresident and CEO
Sincerely,

Peter J. ArduiniPresident and Chief Executive Officer
Paul GonsalvesSenior Vice President, Chief Commercial Officer
John MooradianCorporate Vice President, Global Operations and Supply Chain
Michael McBreenSenior Vice President and President, International
Kenneth BurhopCorporate Vice President, Chief Scientific Officer
Judith E. O’Grady, R.N., M.S.N., R.A.C.Corporate Vice President, Global Regulatory Affairs
Glenn G. ColemanChief Financial Officer and Corporate Vice President, International
William ComptonSenior Vice President, Chief Information Officer
Maria PlatsisSenior Vice President, Corporate Development
Robert T. Davis, Jr.Corporate Vice President and President, Orthopedics and Tissue Technologies
Dan ReuversCorporate Vice President and President, Codman Specialty Surgical
Joseph VinhaisCorporate Vice President, Global Quality Assurance
Eric SchwartzCorporate Vice President,General Counsel and Secretary
Sravan K. EmanySenior Vice President, Strategy, Treasury, and Investor Relations
Lisa EvoliCorporate Vice President, Chief Human Resources Officer
MANAGEMENT TEAM
Standing (L to R): Stuart M. Essig, Ph.D., Managing Director, Prettybrook Partners, LLC, and Chairman of the Board; Christian S. Schade, President and Chief Executive Officer, Aprea Therapeutics, and Chair, Finance Committee; Rhonda G. Ballintyn, former Chief Strategy and Marketing Officer, Honeywell International; Peter J. Arduini, President and Chief Executive Officer, Integra LifeSciences; Donald E. Morel, Jr., Ph.D., former Chief Executive Officer, West Pharmaceutical Services, Inc., and Chair, Compensation Committee; Keith Bradley, Ph.D., former Professor of International Management and Management Strategy, Open University and Cass Business School, U.K. Seated (L to R): Lloyd W. Howell, Jr., Chief Financial Officer and Treasurer, Booz Allen Hamilton; Barbara B. Hill, Operating Partner, NexPhase Capital, and Chair, Nominating and Corporate Governance Committee; Raymond G. Murphy, former Senior Vice President and Treasurer, Time Warner Inc., and Chair, Audit Committee
BOARD OF DIRECTORS
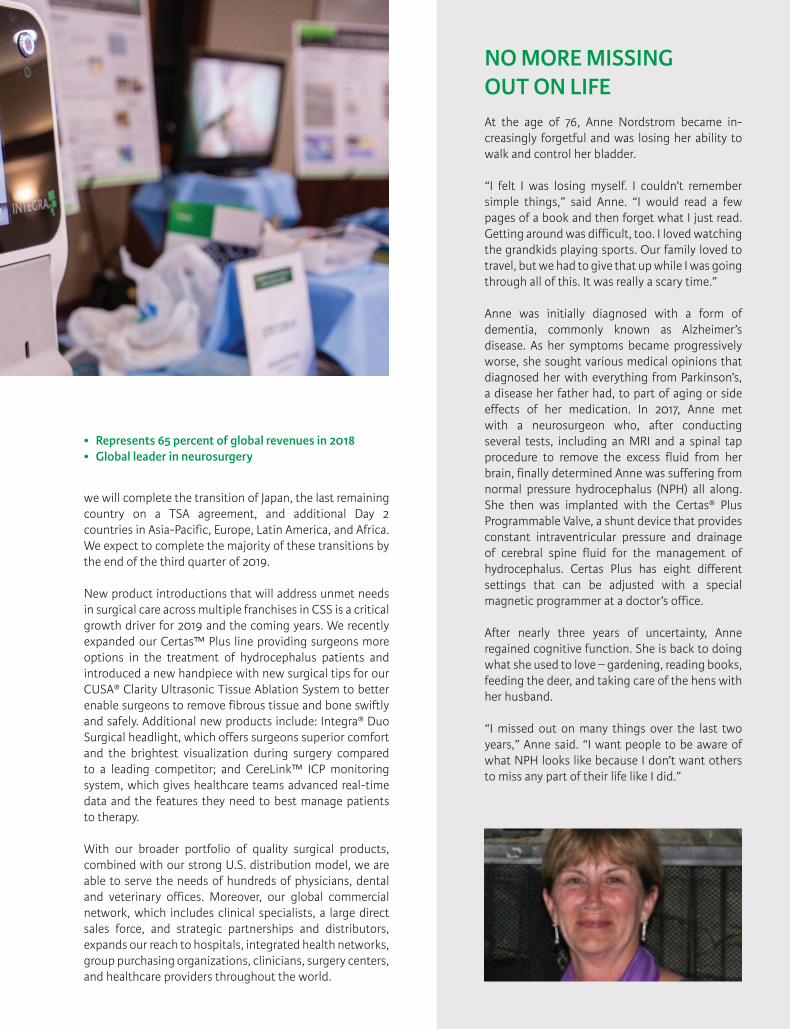
CODMAN SPECIALTY SURGICALCodman Specialty Surgical (CSS) offers global, market-leading technologies, brands and instrumentation. Our product portfolio represents a continuum of care from pre-operative, to the neurosurgery operating room, to the neuro-critical care unit and post-care for both adult and pediatric patients suffering from brain injuries, cerebrospinal fluid pressure complications and other neurological conditions. Additionally, our CSS portfolio includes a range of surgical instrumentation, as well as specialty instruments, used in acute care surgical centers. CSS also offers valuable services to central sterile processing departments of hospitals with its proprietary asset management software and inventory support.
After the acquisition of Codman Neurosurgery from Johnson & Johnson in 2017, Integra continued to execute the integration plan throughout 2018 with minimal disruption. In July, we exited transition service agreements (TSAs) in the United States, Canada, Australia, New Zealand and China. We also transitioned service and repair and regulatory services in China, and manufacturing operations in Le Locle, Switzerland. We relocated conveyed employees in Raynham, Massachusetts, to a new facility in Mansfield, Massachusetts, which will also be the future Codman manufacturing facility.
More recently, we successfully exited TSAs covering 15 countries in Western Europe and migrated our ERP system from multiple platforms to one. We also transitioned several countries in Asia-Pacific and Latin America, which are referred to as Day 2 countries. In the coming months,
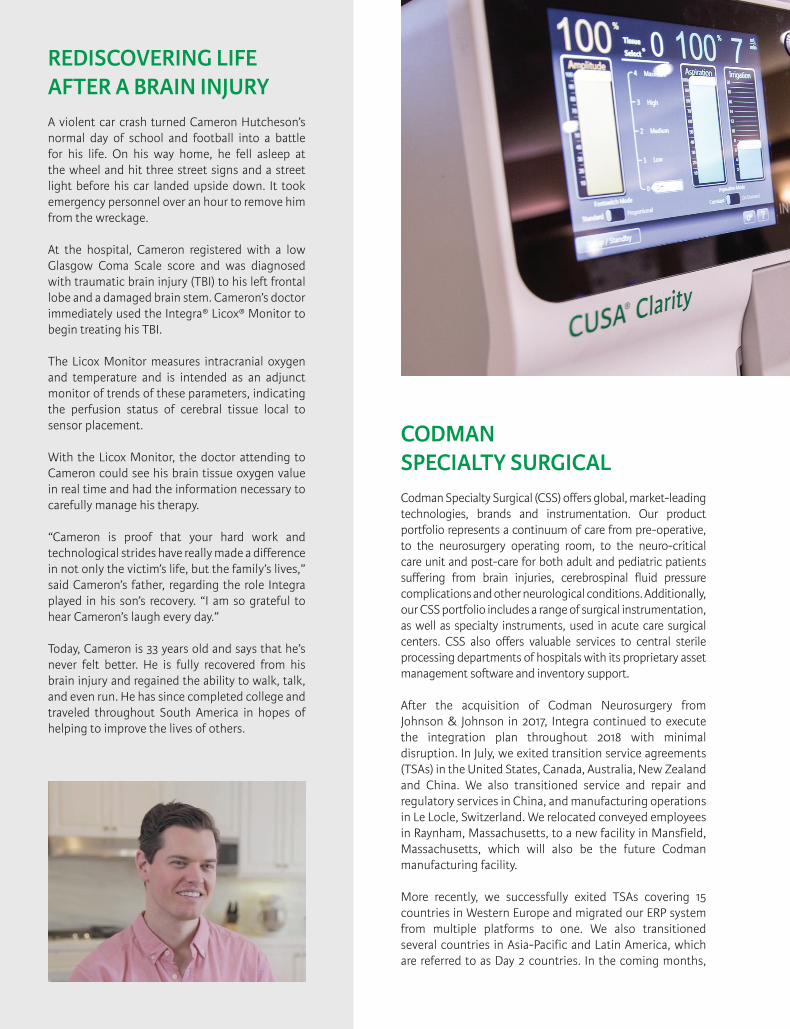
REDISCOVERING LIFEAFTER A BRAIN INJURYA violent car crash turned Cameron Hutcheson’s normal day of school and football into a battle for his life. On his way home, he fell asleep at the wheel and hit three street signs and a street light before his car landed upside down. It took emergency personnel over an hour to remove him from the wreckage.
At the hospital, Cameron registered with a low Glasgow Coma Scale score and was diagnosed with traumatic brain injury (TBI) to his left frontal lobe and a damaged brain stem. Cameron’s doctor immediately used the Integra® Licox® Monitor to begin treating his TBI.
The Licox Monitor measures intracranial oxygen and temperature and is intended as an adjunct monitor of trends of these parameters, indicating the perfusion status of cerebral tissue local to sensor placement.
With the Licox Monitor, the doctor attending to Cameron could see his brain tissue oxygen value in real time and had the information necessary to carefully manage his therapy.
“Cameron is proof that your hard work and technological strides have really made a difference in not only the victim’s life, but the family’s lives,” said Cameron’s father, regarding the role Integra played in his son’s recovery. “I am so grateful to hear Cameron’s laugh every day.”
Today, Cameron is 33 years old and says that he’s never felt better. He is fully recovered from his brain injury and regained the ability to walk, talk, and even run. He has since completed college and traveled throughout South America in hopes of helping to improve the lives of others.
we will complete the transition of Japan, the last remaining country on a TSA agreement, and additional Day 2 countries in Asia-Pacific, Europe, Latin America, and Africa. We expect to complete the majority of these transitions by the end of the third quarter of 2019.
New product introductions that will address unmet needs in surgical care across multiple franchises in CSS is a critical growth driver for 2019 and the coming years. We recently expanded our Certas™ Plus line providing surgeons more options in the treatment of hydrocephalus patients and introduced a new handpiece with new surgical tips for our CUSA® Clarity Ultrasonic Tissue Ablation System to better enable surgeons to remove fibrous tissue and bone swiftly and safely. Additional new products include: Integra® Duo Surgical headlight, which offers surgeons superior comfort and the brightest visualization during surgery compared to a leading competitor; and CereLink™ ICP monitoring system, which gives healthcare teams advanced real-time data and the features they need to best manage patients to therapy.
With our broader portfolio of quality surgical products, combined with our strong U.S. distribution model, we are able to serve the needs of hundreds of physicians, dental and veterinary offices. Moreover, our global commercial network, which includes clinical specialists, a large direct sales force, and strategic partnerships and distributors, expands our reach to hospitals, integrated health networks, group purchasing organizations, clinicians, surgery centers, and healthcare providers throughout the world.
NO MORE MISSING OUT ON LIFEAt the age of 76, Anne Nordstrom became in-creasingly forgetful and was losing her ability to walk and control her bladder.
“I felt I was losing myself. I couldn’t remember simple things,” said Anne. “I would read a few pages of a book and then forget what I just read. Getting around was difficult, too. I loved watching the grandkids playing sports. Our family loved to travel, but we had to give that up while I was going through all of this. It was really a scary time.”
Anne was initially diagnosed with a form of dementia, commonly known as Alzheimer’s disease. As her symptoms became progressively worse, she sought various medical opinions that diagnosed her with everything from Parkinson’s, a disease her father had, to part of aging or side effects of her medication. In 2017, Anne met with a neurosurgeon who, after conducting several tests, including an MRI and a spinal tap procedure to remove the excess fluid from her brain, finally determined Anne was suffering from normal pressure hydrocephalus (NPH) all along. She then was implanted with the Certas® Plus Programmable Valve, a shunt device that provides constant intraventricular pressure and drainage of cerebral spine fluid for the management of hydrocephalus. Certas Plus has eight different settings that can be adjusted with a special magnetic programmer at a doctor’s office.
After nearly three years of uncertainty, Anne regained cognitive function. She is back to doing what she used to love – gardening, reading books, feeding the deer, and taking care of the hens with her husband.
“I missed out on many things over the last two years,” Anne said. “I want people to be aware of what NPH looks like because I don’t want others to miss any part of their life like I did.”
• Represents 65 percent of global revenues in 2018• Global leader in neurosurgery
INTEGRATED MEDICINEWhile in her kitchen, Kelly Rader-Murphy hit her head on the corner of one of her cabinet doors. She sustained a small puncture wound, which caused no concern to Kelly until a few weeks later when she and her husband realized the wound was not healing.
After a doctor’s visit to get her wound checked, her physician had suspicions and sent her to a specialist for verification. The specialist diagnosed Kelly with basal cell carcinoma, a form of skin cancer that required surgical treatment. Mohs surgery was performed, and after several attempts to remove all the cancerous tissue, there was no skin left to help close Kelly’s wound.
She was transferred to a nearby hospital where the surgeon offered Kelly a plan of treatment that was unsettling. Kelly wanted better for herself, and after working closely with her surgeon, they agreed on a course of treatment that involved Integra® Dermal Regeneration Template (IDRT).
IDRT is a two-layer skin regeneration system indicated for the treatment of burns and wounds. When applied to an excise-viable wound bed, IDRT acts as the skin epidermis and heals in phases that lead to skin regeneration. After IDRT allowed Kelly’s scalp to regenerate and cover her exposed skull, her surgeon was able to apply a split-thickness skin graft that incorporated so well that Kelly’s hair and skin were restored, allowing her to return to her normal activities.
“My story is about my skin and Integra skin – and they’ve become one,” said Kelly.
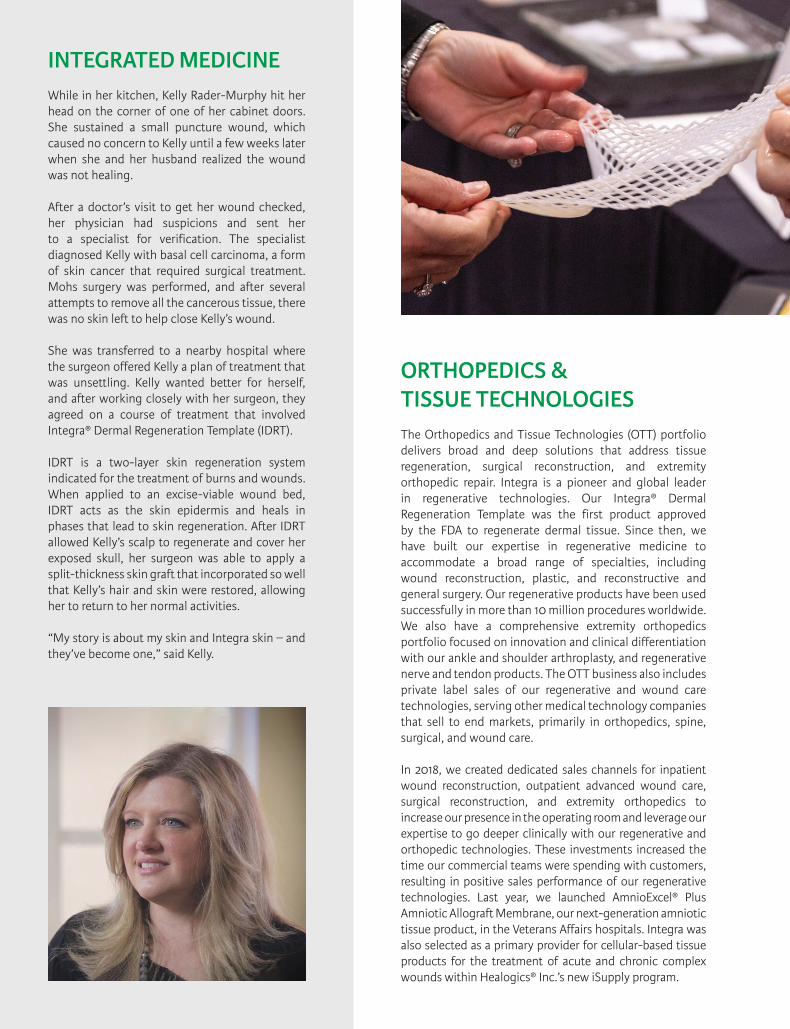
ORTHOPEDICS & TISSUE TECHNOLOGIESThe Orthopedics and Tissue Technologies (OTT) portfolio delivers broad and deep solutions that address tissue regeneration, surgical reconstruction, and extremity orthopedic repair. Integra is a pioneer and global leader in regenerative technologies. Our Integra® Dermal Regeneration Template was the first product approved by the FDA to regenerate dermal tissue. Since then, we have built our expertise in regenerative medicine to accommodate a broad range of specialties, including wound reconstruction, plastic, and reconstructive and general surgery. Our regenerative products have been used successfully in more than 10 million procedures worldwide. We also have a comprehensive extremity orthopedics portfolio focused on innovation and clinical differentiation with our ankle and shoulder arthroplasty, and regenerative nerve and tendon products. The OTT business also includes private label sales of our regenerative and wound care technologies, serving other medical technology companies that sell to end markets, primarily in orthopedics, spine, surgical, and wound care.
In 2018, we created dedicated sales channels for inpatient wound reconstruction, outpatient advanced wound care, surgical reconstruction, and extremity orthopedics to increase our presence in the operating room and leverage our expertise to go deeper clinically with our regenerative and orthopedic technologies. These investments increased the time our commercial teams were spending with customers, resulting in positive sales performance of our regenerative technologies. Last year, we launched AmnioExcel® Plus Amniotic Allograft Membrane, our next-generation amniotic tissue product, in the Veterans Affairs hospitals. Integra was also selected as a primary provider for cellular-based tissue products for the treatment of acute and chronic complex wounds within Healogics® Inc.’s new iSupply program.
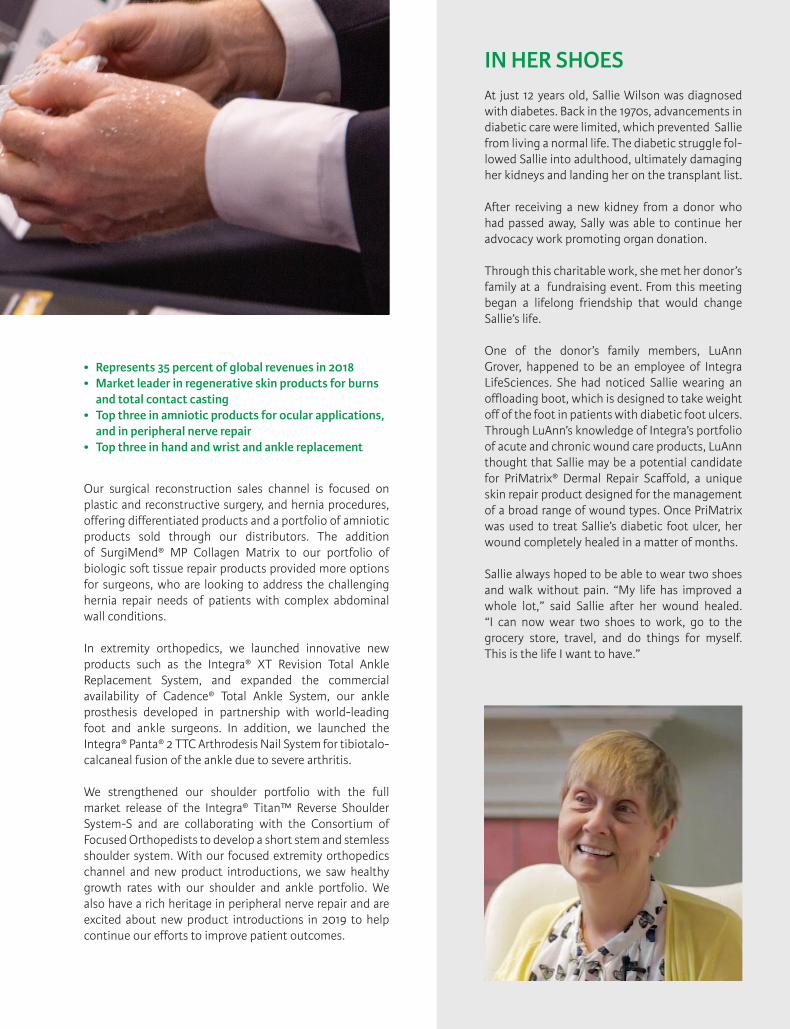
IN HER SHOESAt just 12 years old, Sallie Wilson was diagnosed with diabetes. Back in the 1970s, advancements in diabetic care were limited, which prevented Sallie from living a normal life. The diabetic struggle fol-lowed Sallie into adulthood, ultimately damaging her kidneys and landing her on the transplant list.
After receiving a new kidney from a donor who had passed away, Sally was able to continue her advocacy work promoting organ donation.
Through this charitable work, she met her donor’s family at a fundraising event. From this meeting began a lifelong friendship that would change Sallie’s life.
One of the donor’s family members, LuAnn Grover, happened to be an employee of Integra LifeSciences. She had noticed Sallie wearing an offloading boot, which is designed to take weight off of the foot in patients with diabetic foot ulcers. Through LuAnn’s knowledge of Integra’s portfolio of acute and chronic wound care products, LuAnn thought that Sallie may be a potential candidate for PriMatrix® Dermal Repair Scaffold, a unique skin repair product designed for the management of a broad range of wound types. Once PriMatrix was used to treat Sallie’s diabetic foot ulcer, her wound completely healed in a matter of months.
Sallie always hoped to be able to wear two shoes and walk without pain. “My life has improved a whole lot,” said Sallie after her wound healed. “I can now wear two shoes to work, go to the grocery store, travel, and do things for myself. This is the life I want to have.”
Our surgical reconstruction sales channel is focused on plastic and reconstructive surgery, and hernia procedures, offering differentiated products and a portfolio of amniotic products sold through our distributors. The addition of SurgiMend® MP Collagen Matrix to our portfolio of biologic soft tissue repair products provided more options for surgeons, who are looking to address the challenging hernia repair needs of patients with complex abdominal wall conditions.
In extremity orthopedics, we launched innovative new products such as the Integra® XT Revision Total Ankle Replacement System, and expanded the commercial availability of Cadence® Total Ankle System, our ankle prosthesis developed in partnership with world-leading foot and ankle surgeons. In addition, we launched the Integra® Panta® 2 TTC Arthrodesis Nail System for tibiotalo-calcaneal fusion of the ankle due to severe arthritis.
We strengthened our shoulder portfolio with the full market release of the Integra® Titan™ Reverse Shoulder System-S and are collaborating with the Consortium of Focused Orthopedists to develop a short stem and stemless shoulder system. With our focused extremity orthopedics channel and new product introductions, we saw healthy growth rates with our shoulder and ankle portfolio. We also have a rich heritage in peripheral nerve repair and are excited about new product introductions in 2019 to help continue our efforts to improve patient outcomes.
• Represents 35 percent of global revenues in 2018• Market leader in regenerative skin products for burns
and total contact casting• Top three in amniotic products for ocular applications,
and in peripheral nerve repair• Top three in hand and wrist and ankle replacement
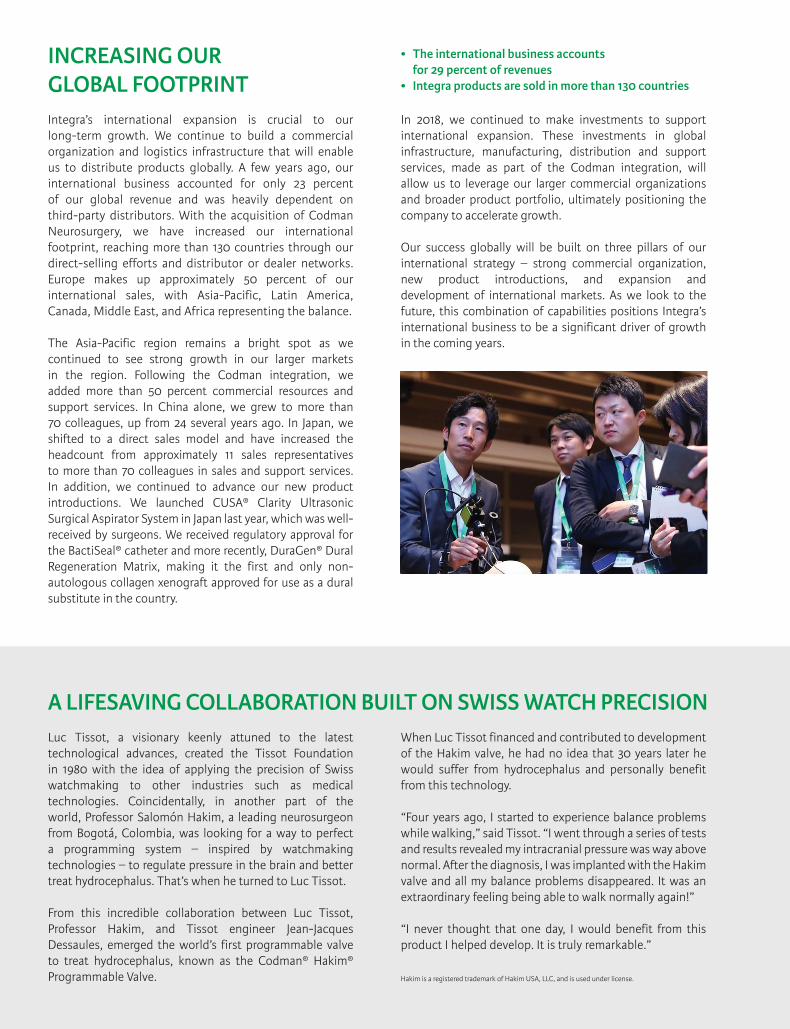
INCREASING OUR GLOBAL FOOTPRINTIntegra’s international expansion is crucial to our long-term growth. We continue to build a commercial organization and logistics infrastructure that will enable us to distribute products globally. A few years ago, our international business accounted for only 23 percent of our global revenue and was heavily dependent on third-party distributors. With the acquisition of Codman Neurosurgery, we have increased our international footprint, reaching more than 130 countries through our direct-selling efforts and distributor or dealer networks. Europe makes up approximately 50 percent of our international sales, with Asia-Pacific, Latin America, Canada, Middle East, and Africa representing the balance.
The Asia-Pacific region remains a bright spot as we continued to see strong growth in our larger markets in the region. Following the Codman integration, we added more than 50 percent commercial resources and support services. In China alone, we grew to more than 70 colleagues, up from 24 several years ago. In Japan, we shifted to a direct sales model and have increased the headcount from approximately 11 sales representatives to more than 70 colleagues in sales and support services. In addition, we continued to advance our new product introductions. We launched CUSA® Clarity Ultrasonic Surgical Aspirator System in Japan last year, which was well-received by surgeons. We received regulatory approval for the BactiSeal® catheter and more recently, DuraGen® Dural Regeneration Matrix, making it the first and only non-autologous collagen xenograft approved for use as a dural substitute in the country.
Luc Tissot, a visionary keenly attuned to the latest technological advances, created the Tissot Foundation in 1980 with the idea of applying the precision of Swiss watchmaking to other industries such as medical technologies. Coincidentally, in another part of the world, Professor Salomón Hakim, a leading neurosurgeon from Bogotá, Colombia, was looking for a way to perfect a programming system – inspired by watchmaking technologies – to regulate pressure in the brain and better treat hydrocephalus. That’s when he turned to Luc Tissot.
From this incredible collaboration between Luc Tissot, Professor Hakim, and Tissot engineer Jean-Jacques Dessaules, emerged the world’s first programmable valve to treat hydrocephalus, known as the Codman® Hakim® Programmable Valve. Hakim is a registered trademark of Hakim USA, LLC, and is used under license.
In 2018, we continued to make investments to support international expansion. These investments in global infrastructure, manufacturing, distribution and support services, made as part of the Codman integration, will allow us to leverage our larger commercial organizations and broader product portfolio, ultimately positioning the company to accelerate growth.
Our success globally will be built on three pillars of our international strategy – strong commercial organization, new product introductions, and expansion and development of international markets. As we look to the future, this combination of capabilities positions Integra’s international business to be a significant driver of growth in the coming years.
• The international business accounts for 29 percent of revenues
• Integra products are sold in more than 130 countries
When Luc Tissot financed and contributed to development of the Hakim valve, he had no idea that 30 years later he would suffer from hydrocephalus and personally benefit from this technology.
“Four years ago, I started to experience balance problems while walking,” said Tissot. “I went through a series of tests and results revealed my intracranial pressure was way above normal. After the diagnosis, I was implanted with the Hakim valve and all my balance problems disappeared. It was an extraordinary feeling being able to walk normally again!”
“I never thought that one day, I would benefit from this product I helped develop. It is truly remarkable.”
A LIFESAVING COLLABORATION BUILT ON SWISS WATCH PRECISION
0
50
100
150
200
0
300
600
900
1200
1500
FINANCIAL HIGHLIGHTS
($ in
Mill
ions
)
2016 2017
$114.5$116.4
2018
$199.7
(Per
Sha
re A
mou
nts)
2016
$0.94
2017
$0.82
2018
$0.72
0.0
0.5
1.0
1.5
2.0
2.5
-50
0
50
100
150
200
250
300
12/3
1/13
01/3
1/14
02/2
8/14
03/3
1/14
04/3
0/14
05/3
1/14
06/3
0/14
07/3
1/14
08/3
1/14
09/3
0/14
10/3
1/14
11/3
0/14
12/3
1/14
01/3
1/15
02/2
8/15
03/3
1/15
04/3
0/15
05/3
1/15
06/3
0/15
07/3
1/15
08/3
1/15
09/3
0/15
10/3
1/15
11/3
0/15
12/3
1/15
01/3
1/16
02/2
9/16
03/3
1/16
04/3
0/16
05/3
1/16
06/3
0/16
07/3
1/16
08/3
1/16
09/3
0/16
10/3
1/16
11/3
0/16
12/3
1/16
01/3
1/17
02/2
8/17
03/3
1/17
04/3
0/17
05/3
1/17
06/3
0/17
07/3
1/17
08/3
1/17
09/3
0/17
10/3
1/17
11/3
0/17
12/3
1/17
01/3
1/18
02/2
8/18
03/3
1/18
04/3
0/18
05/3
1/18
06/3
0/18
07/3
1/18
08/3
1/18
09/3
0/18
10/3
1/18
11/3
0/18
12/3
1/18
Peer Average
IARTS&P HC Equip
NASDAQ
R1000
5-Year IART and Peer Performance
2018 Revenues by Geographic Area
Diluted Earnings Per Share1Operating Cash FlowTotal Revenues
2018 Revenues by Product Category
Codman Specialty Surgical United StatesEurope
Orthopedics and Tissue Technologies Rest of World
65%
35%
71%
14%
15%
2016
$992.1
2017
$1,188.2
2018
$1,472.4
($ in
Mill
ions
)
$1.76
$1.94
$2.42A LIFESAVING COLLABORATION BUILT ON SWISS WATCH PRECISION
1. A reconciliation of GAAP net income to adjusted earnings per share for the years ended December 31, 2018, 2017, and 2016 is available on our corporate website at: http://investor.integralife.com/financial-information.
GAAP Non-GAAP
ABOUT INTEGRAIntegra LifeSciences is a global leader in regenerative technologies, neurosurgical and extremity orthopedic solutions dedicated to limiting uncertainty for clinicians, so they can focus on providing the best patient care. Integra offers a comprehensive portfolio of high quality, leadership brands that include AmnioExcel®, Bactiseal®, Cadence®, Certas™, Codman®, CUSA®, DuraGen®, DuraSeal®, ICP Express®, Integra®, MAYFIELD®, MediHoney®, MicroFrance®, PriMatrix®, Salto Talaris®, SurgiMend®, TCC-EZ®, Titan™, and VersaTru™. For the latest news and information about Integra and its brands, please visit www.integralife.com.
CORPORATE INFORMATIONAnnual MeetingThe 2019 Annual Meeting of Stockholders willbe held at 9:00 a.m., Thursday, May 16, 2019 at:
Integra LifeSciences Holdings Corporation315 Enterprise Drive, Plainsboro, New Jersey, 08536
Stock Trading InformationIntegra stock trades on the Nasdaq National Market under the symbol ‘‘IART.’’
Investor RelationsContact the Integra Investor Relations department at [email protected] for business-related inquiries.
Stockholders may obtain, without charge, a copy of the following documents:
• Proxy statement for the 2019 Annual Meeting of Stockholders
• Quarterly reports on Form 10-Q• Additional copies of the 2018 Annual Report
Requests for these documents should be addressed to:
Investor Relations Department Integra LifeSciences Holdings Corporation 311 Enterprise Drive, Plainsboro, New Jersey, 08536 Email: [email protected]
Website AddressAdditional information about the Company, including a copy of this Annual Report and quarterly reports on Form 10-Q, a description of our business and products, recent financial data and press releases, investor relations calendar, and stock price information is available on our website at www.integralife.com.
HeadquartersIntegra LifeSciences Holdings Corporation 311 Enterprise Drive, Plainsboro, New Jersey, 08536 Telephone: 800-654-2873 Fax: 888-980-7742
Stock Account MaintenanceOur transfer agent, American Stock Transfer and Trust Company, can help you with a variety of stockholder-related services, including:
• Change of address • Lost stock certificates • Transfer of stock to another person • Verification of your holdings
You can call our transfer agent toll-free at (800) 937-5449 or reach them on the internet at www.astfinancial.com.
Independent Registered Public Accounting FirmPricewaterhouseCoopers LLP Florham Park, New Jersey
UNITED STATESAñasco, Puerto RicoAustin, TexasBillerica, MassachusettsBoston, MassachusettsCincinnati, OhioMansfield, MassachusettsMemphis, TennesseePlainsboro, New JerseyReno, NevadaSan Diego, California
Ghent, BelgiumGuzman, MexicoLe Locle, SwitzerlandLyon, FranceMilan, ItalyNantong, ChinaOakville, CanadaRatingen, GermanyRietheim-Weilheim, GermanySaint-Aubin, France
West Valley City, UtahYork, Pennsylvania
INTERNATIONALAndover, United KingdomBeijing, ChinaBiot, FranceClayton, AustraliaDubai, United Arab EmiratesDublin, Ireland
Shanghai, ChinaTokyo, JapanToronto, CanadaTullamore, IrelandZapopan, MexicoZaventem, Belgium
OUR LOCATIONS
Integra and the Integra logo are registered trademarks of Integra LifeSciences Corporation in the United States and/or other countries. MAYFIELD is a registered trademark of SM USA, Inc. and is used by Integra under license. ©2019 Integra LifeSciences Corporation. All rights reserved.
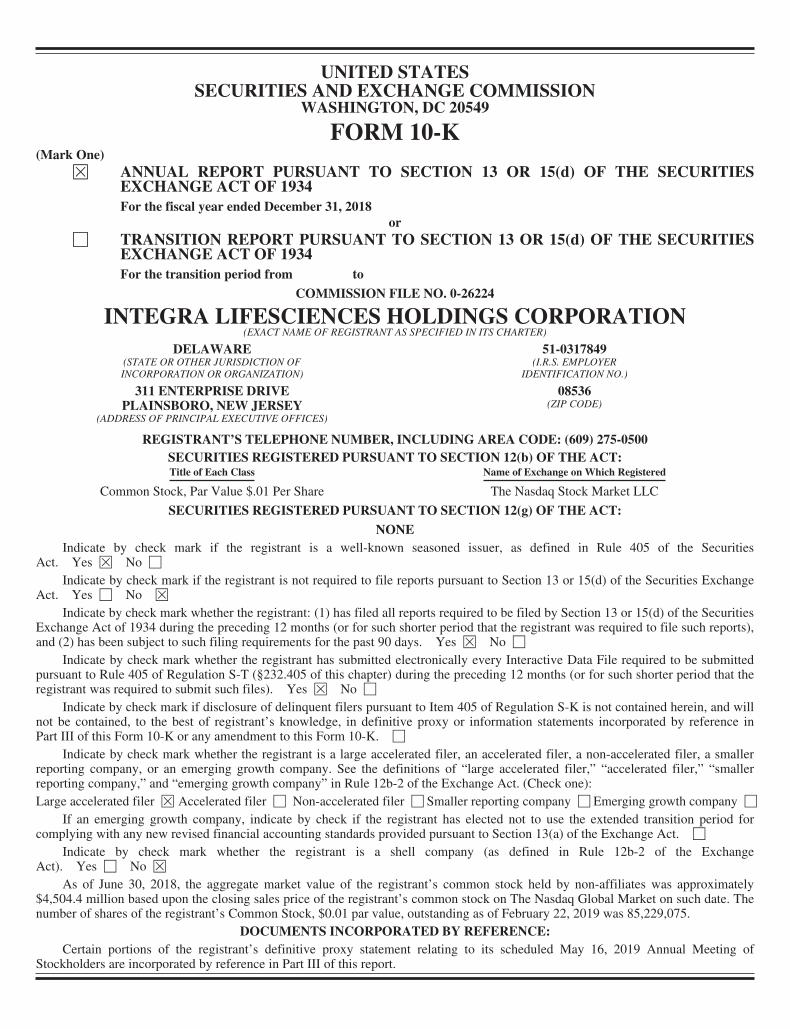
UNITED STATESSECURITIES AND EXCHANGE COMMISSION
WASHINGTON, DC 20549
FORM 10-K(Mark One)
È ANNUAL REPORT PURSUANT TO SECTION 13 OR 15(d) OF THE SECURITIESEXCHANGE ACT OF 1934For the fiscal year ended December 31, 2018
or‘ TRANSITION REPORT PURSUANT TO SECTION 13 OR 15(d) OF THE SECURITIES
EXCHANGE ACT OF 1934For the transition period from to
COMMISSION FILE NO. 0-26224
INTEGRA LIFESCIENCES HOLDINGS CORPORATION(EXACT NAME OF REGISTRANT AS SPECIFIED IN ITS CHARTER)
DELAWARE 51-0317849(STATE OR OTHER JURISDICTION OFINCORPORATION OR ORGANIZATION)
(I.R.S. EMPLOYERIDENTIFICATION NO.)
311 ENTERPRISE DRIVEPLAINSBORO, NEW JERSEY
08536(ZIP CODE)
(ADDRESS OF PRINCIPAL EXECUTIVE OFFICES)
REGISTRANT’S TELEPHONE NUMBER, INCLUDING AREA CODE: (609) 275-0500SECURITIES REGISTERED PURSUANT TO SECTION 12(b) OF THE ACT:Title of Each Class Name of Exchange on Which Registered
Common Stock, Par Value $.01 Per Share The Nasdaq Stock Market LLC
SECURITIES REGISTERED PURSUANT TO SECTION 12(g) OF THE ACT:
NONEIndicate by check mark if the registrant is a well-known seasoned issuer, as defined in Rule 405 of the Securities
Act. Yes È No ‘
Indicate by check mark if the registrant is not required to file reports pursuant to Section 13 or 15(d) of the Securities ExchangeAct. Yes ‘ No È
Indicate by check mark whether the registrant: (1) has filed all reports required to be filed by Section 13 or 15(d) of the SecuritiesExchange Act of 1934 during the preceding 12 months (or for such shorter period that the registrant was required to file such reports),and (2) has been subject to such filing requirements for the past 90 days. Yes È No ‘
Indicate by check mark whether the registrant has submitted electronically every Interactive Data File required to be submittedpursuant to Rule 405 of Regulation S-T (§232.405 of this chapter) during the preceding 12 months (or for such shorter period that theregistrant was required to submit such files). Yes È No ‘
Indicate by check mark if disclosure of delinquent filers pursuant to Item 405 of Regulation S-K is not contained herein, and willnot be contained, to the best of registrant’s knowledge, in definitive proxy or information statements incorporated by reference inPart III of this Form 10-K or any amendment to this Form 10-K. ‘
Indicate by check mark whether the registrant is a large accelerated filer, an accelerated filer, a non-accelerated filer, a smallerreporting company, or an emerging growth company. See the definitions of “large accelerated filer,” “accelerated filer,” “smallerreporting company,” and “emerging growth company” in Rule 12b-2 of the Exchange Act. (Check one):Large accelerated filer È Accelerated filer ‘ Non-accelerated filer ‘ Smaller reporting company ‘ Emerging growth company ‘
If an emerging growth company, indicate by check if the registrant has elected not to use the extended transition period forcomplying with any new revised financial accounting standards provided pursuant to Section 13(a) of the Exchange Act. ‘
Indicate by check mark whether the registrant is a shell company (as defined in Rule 12b-2 of the ExchangeAct). Yes ‘ No È
As of June 30, 2018, the aggregate market value of the registrant’s common stock held by non-affiliates was approximately$4,504.4 million based upon the closing sales price of the registrant’s common stock on The Nasdaq Global Market on such date. Thenumber of shares of the registrant’s Common Stock, $0.01 par value, outstanding as of February 22, 2019 was 85,229,075.
DOCUMENTS INCORPORATED BY REFERENCE:Certain portions of the registrant’s definitive proxy statement relating to its scheduled May 16, 2019 Annual Meeting of
Stockholders are incorporated by reference in Part III of this report.
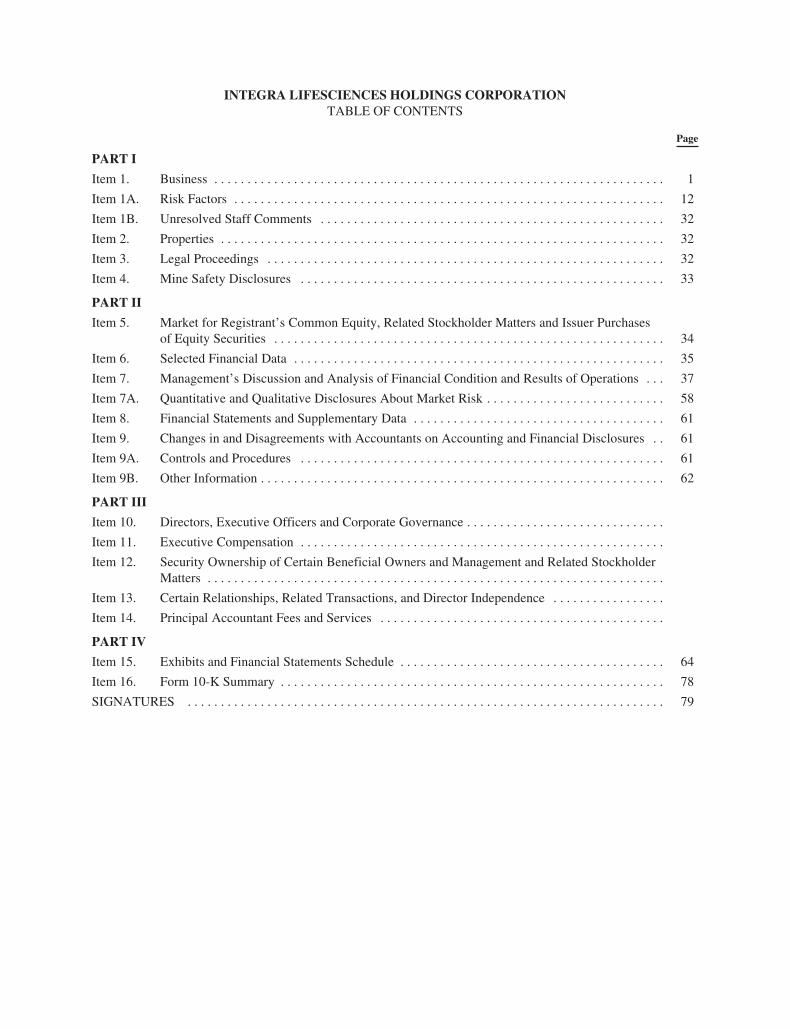
INTEGRA LIFESCIENCES HOLDINGS CORPORATIONTABLE OF CONTENTS
Page
PART I
Item 1. Business . . . . . . . . . . . . . . . . . . . . . . . . . . . . . . . . . . . . . . . . . . . . . . . . . . . . . . . . . . . . . . . . . . . . 1
Item 1A. Risk Factors . . . . . . . . . . . . . . . . . . . . . . . . . . . . . . . . . . . . . . . . . . . . . . . . . . . . . . . . . . . . . . . . . 12
Item 1B. Unresolved Staff Comments . . . . . . . . . . . . . . . . . . . . . . . . . . . . . . . . . . . . . . . . . . . . . . . . . . . . 32
Item 2. Properties . . . . . . . . . . . . . . . . . . . . . . . . . . . . . . . . . . . . . . . . . . . . . . . . . . . . . . . . . . . . . . . . . . . 32
Item 3. Legal Proceedings . . . . . . . . . . . . . . . . . . . . . . . . . . . . . . . . . . . . . . . . . . . . . . . . . . . . . . . . . . . . 32
Item 4. Mine Safety Disclosures . . . . . . . . . . . . . . . . . . . . . . . . . . . . . . . . . . . . . . . . . . . . . . . . . . . . . . . 33
PART II
Item 5. Market for Registrant’s Common Equity, Related Stockholder Matters and Issuer Purchasesof Equity Securities . . . . . . . . . . . . . . . . . . . . . . . . . . . . . . . . . . . . . . . . . . . . . . . . . . . . . . . . . . . 34
Item 6. Selected Financial Data . . . . . . . . . . . . . . . . . . . . . . . . . . . . . . . . . . . . . . . . . . . . . . . . . . . . . . . . 35
Item 7. Management’s Discussion and Analysis of Financial Condition and Results of Operations . . . 37
Item 7A. Quantitative and Qualitative Disclosures About Market Risk . . . . . . . . . . . . . . . . . . . . . . . . . . . 58
Item 8. Financial Statements and Supplementary Data . . . . . . . . . . . . . . . . . . . . . . . . . . . . . . . . . . . . . . 61
Item 9. Changes in and Disagreements with Accountants on Accounting and Financial Disclosures . . 61
Item 9A. Controls and Procedures . . . . . . . . . . . . . . . . . . . . . . . . . . . . . . . . . . . . . . . . . . . . . . . . . . . . . . . 61
Item 9B. Other Information . . . . . . . . . . . . . . . . . . . . . . . . . . . . . . . . . . . . . . . . . . . . . . . . . . . . . . . . . . . . . 62
PART III
Item 10. Directors, Executive Officers and Corporate Governance . . . . . . . . . . . . . . . . . . . . . . . . . . . . . .
Item 11. Executive Compensation . . . . . . . . . . . . . . . . . . . . . . . . . . . . . . . . . . . . . . . . . . . . . . . . . . . . . . .
Item 12. Security Ownership of Certain Beneficial Owners and Management and Related StockholderMatters . . . . . . . . . . . . . . . . . . . . . . . . . . . . . . . . . . . . . . . . . . . . . . . . . . . . . . . . . . . . . . . . . . . . .
Item 13. Certain Relationships, Related Transactions, and Director Independence . . . . . . . . . . . . . . . . .
Item 14. Principal Accountant Fees and Services . . . . . . . . . . . . . . . . . . . . . . . . . . . . . . . . . . . . . . . . . . .
PART IV
Item 15. Exhibits and Financial Statements Schedule . . . . . . . . . . . . . . . . . . . . . . . . . . . . . . . . . . . . . . . . 64
Item 16. Form 10-K Summary . . . . . . . . . . . . . . . . . . . . . . . . . . . . . . . . . . . . . . . . . . . . . . . . . . . . . . . . . . 78
SIGNATURES . . . . . . . . . . . . . . . . . . . . . . . . . . . . . . . . . . . . . . . . . . . . . . . . . . . . . . . . . . . . . . . . . . . . . . . . 79
PART I
ITEM 1. BUSINESS
OVERVIEW
The terms “we,” “our,” “us,” “Company” and “Integra” refer to Integra LifeSciences Holdings Corporation,a Delaware corporation, and its subsidiaries, unless the context suggests otherwise.
Integra, headquartered in Plainsboro, New Jersey, is a world leader in medical technology. The Companywas founded in 1989 with the acquisition of an engineered collagen technology platform used to repair andregenerate tissue. Since then, Integra has developed numerous product lines from this technology for applicationsranging from burn and deep tissue wounds, to the repair of dura mater in the brain, and the repair of nerves andtendons. The Company has expanded its base regenerative technology business to include surgical instruments,neurosurgical products, advanced wound care, and orthopedic hardware through a combination of several globalacquisitions and by developing products internally to further meet the needs of its customers.
Integra employs approximately 4,500 people dedicated to limiting uncertainty for surgeons, so that they canconcentrate on providing the best care for their patients. Integra provides innovative healthcare solutions in morethan 130 countries through its nearly 50 offices and its worldwide distribution network.
VISION
We aspire to be a worldwide leader in neurosurgery & reconstructive surgery, with a portfolio of leadingbusinesses that delivers outstanding customer experience through innovation, execution and teamwork topositively impact the lives of millions of patients and families.
STRATEGY
Integra is committed to delivering high quality products that positively impact the lives of millions ofpatients and their families. We focus on four key pillars: 1) building an execution-focused culture, 2) achievingrelevant scale, 3) improving agility and innovation, and 4) leading in customer excellence. We believe that bysharpening our focus on these areas through improved planning and communication, optimization of ourinfrastructure, and strategically aligned tuck-in acquisitions, we can build scale, increase competitiveness andachieve our long-term goals.
To this end, our executive leadership team has established the following key priorities aligned to thisstrategy:
Strategic Acquisitions. An important part of our strategy is pursuing strategic transactions and licensingagreements that increase relevant scale in the clinical areas in which we compete. In 2018, integrating theCodman Neurosurgery business, which was acquired from Johnson and Johnson in the previous year, remained atop priority and we will continue to transition the business throughout 2019. This acquisition expanded ourportfolio of neurosurgery products and established us as the world leader in neurosurgery. It has also enabled usto bring our entire Integra portfolio to a global market.
Portfolio Optimization and New Product Introductions. We are investing in innovative product developmentto drive a multi-generational pipeline for our key product franchises. Our product development efforts focus onregenerative technologies and other projects with the potential for significant returns on investment. In 2018, weachieved significant milestones in research and development by successfully launching nine new products. Inaddition to new product development, we are funding studies to gather clinical evidence to support launches,ensure market access and improve reimbursement for existing products. We also continue to identify low-growth,low-margin products and product franchises for discontinuation and will continue to look at other ways ofoptimizing our portfolio.
1
Commercial Channel Investments. With acquisitions, new product introductions and a broader portfolio ofproducts, investing in our sales channels is a core part of our strategy to create specialization and greater focus onreaching our customers and addressing their needs. Internationally, we have increased our commercial resourcessignificantly in almost all markets and are making investments to support our sales organization and maximizeour commercial opportunities. We now have a strong international sales channel that will deliver our currentportfolio as well as position us for expansion. In addition, we continue to build upon our leadership brands acrossour product franchises to enable us to engage hospital systems through enterprise-wide contracts.
Customer Excellence. We aspire to be ranked as a best-in-class provider and are committed to strengtheningour relationships with all of our customers. We strive to consistently deliver outstanding customer service andcontinue to invest in technologies, systems and processes to improve the way our customers do business with us.Additionally, we expect to build on the success of our professional education programs to drive continuedcustomer appreciation of our growing portfolio of medical technologies globally.
BUSINESS SEGMENTS
We currently manufacture and sell our products in the following two global reportable business segments:Codman Specialty Surgical and Orthopedics and Tissue Technologies. We include financial informationregarding our reportable business segments and certain geographic information under “Item 7. Management’sDiscussion and Analysis of Financial Condition and Results of Operations” and in Note 16, Segment andGeographic Information to our consolidated financial statements.
Codman Specialty Surgical
Our Codman Specialty Surgical business offers global, neurosurgery market-leading technologies,brands and instrumentation. The product portfolio represents a continuum of care from pre-operative, to theneurosurgery operating room, to the neuro-critical care unit and post care for both adult and pediatricpatients suffering from brain tumors, brain injury, cerebrospinal fluid pressure complications and otherneurological conditions.
The acquisition of Codman Neurosurgery from Johnson & Johnson increased our global direct salesrepresentation and commercial presence. This acquisition expanded the product portfolio of our well known,leading technologies in dural repair, ultrasonic tissue ablation, intracranial pressure (“ICP”) monitoring,hydrocephalus management, and cranial stabilization systems, while providing a rich research anddevelopment pipeline for growth.
Rounding out the portfolio is a catalog of surgical headlamps, surgical instrumentation, as well as assetmanagement software and support, and after-market service. With thousands of surgical instrumentproducts, including specialty surgical instruments, we call on the central sterile processing unit of hospitalsand acute care surgical centers. Additionally, through a strong U.S. distribution model, we can serve theneeds of hundreds of physicians, dental and veterinary offices.
Our global commercial network includes clinical specialists, a large direct global sales force andstrategic partnerships and distributors that serve hospitals, integrated health networks, group purchasingorganizations, clinicians, surgery centers and health care providers.
Orthopedics and Tissue Technologies
Orthopedics and Tissue Technologies products serve some of the fastest growing markets in themedical technology industry and provide solutions that primarily address the needs of orthopedic, plastic,reconstructive and general surgeons. These products focus on addressing soft tissue, nerve, and tendonrepairs as well as reconstruction in the hand, wrist, elbow, shoulder, ankle and foot.
2
We provide regenerative technology solutions for the treatment of acute wounds, such as burns,chronic wounds, including diabetic foot ulcers, surgical tissue repair including hernia repair, peripheralnerve repair and protection, and tendon repair. For extremity bone and joint reconstruction procedures, wesell hardware products, such as bone and joint fixation and joint replacement devices, implants andinstruments, which provide for the reconstruction of bone in the hand, wrist, elbow and shoulder (UpperExtremity), and the foot, ankle and leg below the knee (Lower Extremity). In addition, we createdopportunities to further expand our presence in the plastic and reconstructive surgery segments with ouradvanced wound care products such as Medihoney ®, weight offloading, and amniotic tissue.
We made significant investments over the last two years with our channel expansion in the U.S. andcreated four dedicated sales channels to have more focus and specialization within our call points to drivesustainable growth. We have a specialized sales organization composed of directly employed salesrepresentatives, as well as specialty distributors, organized based upon their call point. Our extremityorthopedics sales representatives call on surgeons who treat extremity orthopedic disorders, includingosteoarthritis, rheumatoid arthritis, wrist, ankle and shoulder arthroplasty, and other conditions requiringfoot or hand reconstruction. Additionally, we sell our shoulder products through a specialty distributornetwork of sales agents who call on shoulder surgeons. Our wound reconstruction acute (inpatient) salesrepresentatives call on surgeons doing procedures in limb salvage, trauma, wound reconstruction and burns,while our advanced wound care sales representatives call on physicians who treat chronic wounds in theoutpatient wound care clinic setting. We also have a dedicated surgical reconstruction sales team focused onplastic and reconstructive surgery and hernia procedures with differentiated products. Finally, we have adistributor network focused on biologics.
Outside the U.S., we have a small direct sales presence, primarily in certain European countries,Australia, New Zealand, and Canada, and use distributors in other international markets to sell certainproduct lines.
This business segment also includes private-label sales of a broad set of our regenerative and woundcare technologies. Our customers are other medical technology companies that sell to end markets primarilyin orthopedics, spine, surgical and wound care.
RESEARCH AND DEVELOPMENT STRATEGY
Our research and development activities focus on identifying unmet surgical needs and addressing thoseneeds with innovative solutions and products. We apply our core competency in regenerative technology toproducts for neurosurgical, orthopedic and wound applications, and we have extensive programs for our coreplatforms of orthopedic hardware and electromechanical technologies. We are focusing our research anddevelopment efforts on products and clinical studies to generate efficacy and health economic evidence.
Regenerative Technologies. Integra was the first and only company to receive a United States Food andDrug Administration (“FDA”) claim for regeneration of dermal tissue and is a world leader in regenerativetechnology. Because regenerative technology products represent a fast-growing, high-margin opportunity for us,we allocate a large portion of our research and development budget to these projects. Our regenerativetechnology development program applies our expertise in bioengineering to a range of biomaterials includingnatural collagen and human tissues as well as synthetics such as polymers. These unique product designs are usedfor neurosurgical and orthopedic surgical applications, as well as dermal regeneration, including the healing ofchronic and acute wounds, tendon and nerve repair. Our regenerative technology platform includes our legacyIntegra ® Dermal Regeneration Template (IDRT) products and complementary technologies that we haveacquired over the last few years. Our collagen manufacturing capability, combined with our history ofinnovation, provides us with strong platform technologies for multiple indications. In 2017 and 2018, weintroduced ten new regenerative technology products, including SurgiMend MP to address Abdominal Hernias,SurgiMend PRS for plastic and reconstructive surgery, AmnioExcel Plus and new sizes of PriMatrix ® andOmnigraft for treatment of wounds.
3
Orthopedic Reconstruction. We develop fixation and small joint reconstruction implants and instruments forupper and lower extremities to both provide next generation solutions and expand our product portfolio. Thisportfolio focuses on joint replacement products. Integra has a strong shoulder portfolio, which includes a totalshoulder system and a reverse shoulder. We continue to work on advanced shoulder products and are developingnext generation anatomical designs, bone preserving products and techniques, and a pyrocarbon shoulderhemiarthroplasty product to add to that portfolio. We have a strong differentiated asset that resides in ourpatented pyrocarbon products, and we continue to invest to bring new products to market with this technology,which has shown significantly less wear on bone than traditional metals. To expand our ankle offering, welaunched the Integra ® XT Ankle Revision System which may be used to revise most ankle prosthesis currentlyin the market. The non-randomized, prospective, multi-center post-market studies we launched in 2017 in theU.S., Europe and Canada to evaluate 2-year implant survivorship in subjects who received the Cadence ® TotalAnkle System for primary ankle arthroplasty is progressing and will further evaluate implant survivorship at5 and 10 years post-operatively.
Electromechanical Technologies and Instrumentation. Because our electromechanical products andinstruments address significant needs in surgical procedures and limit uncertainty for surgeons, we continue toinvest in approvals for new indications and next generation improvements to our market-leading products. Wehave several active programs focused on life cycle management and innovation, for capital and disposableproducts in our portfolio. Our product development efforts are focused on core clinical applications in cerebralspinal fluid (CSF) management, neuro-critical care (NCC) monitoring, minimally invasive instruments andelectrosurgery and ultrasonic medical technologies. We also work with several instrument partners to bring newsurgical instrument patterns to the market, enabling us to add new instruments with minimal expense. Finally,our lighting franchise is among the most dynamic in the industry, and we continue to invest in ongoingdevelopment in LED technology.
COMPETITION
Our competitors for Codman Specialty Surgical are the Aesculap division of B. Braun Medical, Inc.,Medtronic, Inc., Stryker Corporation and Becton Dickinson and Company. In addition, we compete with manysmaller specialized companies and larger companies that do not otherwise focus on the offerings that CodmanSpecialty Surgical technologies does. We rely on the depth and breadth of our sales and marketing organization,our innovative technology, and our procurement and manufacturing operations to maintain our competitiveposition.
Our competition in Orthopedics and Tissue Technologies includes the DePuy/Synthes business ofJohnson & Johnson, ACell, Inc., Stryker Corporation, Wright Medical Group, N.V., Smith & Nephew plc,MiMedx Group, Inc., LifeCell Corporation, a subsidiary of Allergan PLC, and Zimmer Biomet Holdings, Inc., aswell as other major orthopedic companies that carry a full line of small bone and joint fixation and soft tissueproducts.
Finally, in certain cases our products compete primarily against medical practices that treat a conditionwithout using a medical device or any particular product, such as medical practices that utilize autograft tissueinstead of our dermal regeneration products, duraplasty products and nerve repair products. Depending on theproduct line, we compete based on our products’ features, strength of our sales force or distributors,sophistication of our technology and cost effectiveness of our solution.
GOVERNMENT REGULATION
We are a manufacturer and marketer of medical devices, and therefore are subject to extensive regulation bythe FDA, the Center for Medicare Services of the U.S. Department of Health and Human Services, other federalgovernmental agencies and, in some jurisdictions, by state and foreign governmental authorities. Theseregulations govern the introduction of new medical devices, the observance of certain standards with respect to
4
the design, manufacture, testing, labeling, promotion and sales of the devices, the maintenance of certain records,the ability to track devices, the reporting of potential product defects, the import and export of devices, and othermatters.
United States Food and Drug Administration
The regulatory process for obtaining product approvals and clearances can be onerous and costly. The FDArequires, as a condition to marketing a medical device in the U.S., that we secure a Premarket Notificationclearance pursuant to Section 510(k) of the Federal Food, Drug and Cosmetic Act (the “FD&C Act”) or anapproved PMA application (or supplemental PMA application). Obtaining these approvals and clearances cantake up to several years and may involve preclinical studies and clinical trials. The FDA also may require a post-approval clinical study as a condition of approval. To perform clinical trials for significant risk devices in theU.S. on an unapproved product, we are required to obtain an Investigational Device Exemption (“IDE”) from theFDA. The FDA may also require a filing for approval prior to marketing products that are modifications ofexisting products or new indications for existing products. Moreover, after clearance/approval is given, if theproduct is shown to be hazardous or defective, the FDA and foreign regulatory agencies have the power towithdraw the clearance or approval, as the case may be, or require us to change the device, its manufacturingprocess or its labeling, to supply additional proof of its safety and effectiveness or to recall, repair, replace orrefund the cost of the medical device. Because we currently export medical devices manufactured in the U.S. thathave not been approved by the FDA for distribution in the U.S., we are required to obtain approval/registration inthe country to which we are exporting and maintain certain records relating to exports and make these availableto the FDA for inspection, if required.
Human Cells, Tissues and Cellular and Tissue-Based Products
Integra, through the acquisition of Derma Sciences and BioD LLC (“BioD”) is involved with the recovery,processing, storage, transportation and distribution of donated amniotic tissue. The FDA has specific regulationsgoverning human cells, tissues and cellular and tissue-based products, or HCT/Ps. An HCT/P is a productcontaining, or consisting of, human cells or tissue intended for transplantation into a human patient. Examplesinclude bone, ligament, skin and cornea.
Some HCT/Ps fall within the definition of a biological product, medical device or drug regulated under theFD&C Act. These biologic, device or drug HCT/Ps must comply both with the requirements exclusivelyapplicable to HCT/Ps and, in addition, with requirements applicable to biologics, devices or drugs, includingpremarket clearance or approval from the FDA.
Section 361 of the Public Health Service Act (“Section 361”), authorizes the FDA to issue regulations toprevent the introduction, transmission or spread of communicable disease. HCT/Ps regulated as “361” HCT/Psare subject to requirements relating to registering facilities and listing products with the FDA, screening andtesting for tissue donor eligibility, and Good Tissue Practice when processing, storing, labeling, and distributingHCT/Ps, including required labeling information, stringent record keeping, and adverse event reporting.
The American Association of Tissue Banks (“AATB”) has issued operating standards for tissue banking.Compliance with these standards is a requirement in order to become an AATB-accredited tissue establishment.In addition, some states have their own tissue banking regulations. We are licensed or have permits for tissuebanking in California, Florida, New York and Maryland.
National Organ Transplant Act. Procurement of certain human organs and tissue for transplantation issubject to the restrictions of the National Organ Transplant Act, which prohibits the transfer of certain humanorgans, including skin and related tissue for valuable consideration, but permits the reasonable paymentassociated with the removal, transportation, implantation, processing, preservation, quality control and storage ofhuman tissue and skin. Our subsidiary, BioD LLC is a registered Tissue Bank and is involved with the recovery,storage and transportation of donated human amniotic tissue.
5
Amniotic tissue is considered an HCT/P. However, on June 22, 2015, the FDA issued an Untitled Letteralleging that BioD’s morselized amniotic membrane tissue-based products do not meet the criteria for regulationas HCT/Ps solely under Section 361 and that, as a result, BioD would need a biologics license to lawfully marketthose morselized products. Since the issuance of the Untitled Letter, BioD and more recently the Company havebeen in discussions with the FDA to communicate their disagreement with the FDA’s assertion that certainproducts are more than minimally manipulated. The FDA has not changed its position that certain of the BioDacquired products are not eligible for marketing solely under Section 361. In November 2017, the FDA issued thefinal guidance document related to human tissue titled, “Regulatory Considerations for Human Cells, Tissues,and Cellular and Tissue-Based Products: Minimal Manipulation and Homologous Use” (the “HCT/P FinalGuidance”). The HCT/P Final Guidance maintains the FDA’s position that products such as the Company’smorselized amniotic membrane tissue-based products do not meet the criteria for regulation solely as HCT/Ps. Inaddition, the FDA articulated a risk-based approach to enforcement and, while some uses for amniotic membranetissue-based products would enjoy as much as thirty-six months of enforcement discretion, other high-risk usescould be subject to immediate enforcement action. The Company does not believe the uses for its amnioticmembrane tissue-based products fall into the high risk category. As of February 26, 2019, the Company has notreceived any further notice of enforcement action from the FDA regarding its morselized amniotic tissue-basedproducts. Revenues from BioD morselized amniotic membrane-based products for the year ended December 31,2018 were less than 1.0% of consolidated revenues. See “Item 1A. Risk Factors—Certain of our products arederived from human tissue and are subject to additional regulations and requirements. ”
Medical Device Regulations
We also are required to register with the FDA as a medical device manufacturer. As such, ourmanufacturing sites are subject to periodic inspection by the FDA for compliance with the FDA’s Quality SystemRegulations. These regulations require that we manufacture our products and maintain our documents in aprescribed manner with respect to design, manufacturing, testing and control activities. Further, we are requiredto comply with various FDA requirements and other legal requirements for labeling and promotion. If the FDAbelieves that a company is not in compliance with applicable regulations, it may issue a warning letter, instituteproceedings to detain or seize products, issue a recall order, impose operating restrictions, enjoin futureviolations and assess civil penalties against that company, its officers or its employees and may recommendcriminal prosecution to the U.S. Department of Justice.
Medical device regulations also are in effect in many of the countries in which we do business outside theU.S. These laws range from comprehensive medical device approval and Quality System requirements for someor all of our medical device products to simpler requests for product data or certifications. Under the EuropeanUnion Medical Device Directive, medical devices must meet the Medical Device Directive standards and receiveCE Mark Certification prior to marketing in the European Union (the “EU”). In addition, the EU enacted the EUMedical Device Regulation, which imposes stricter requirements on the marketing and sales of medical deviceswhich includes but is not limited to quality systems and labeling. CE Mark Certification requires acomprehensive quality system program, technical documentation, clinical evaluation and data on the product,which are then reviewed by a Notified Body. A Notified Body is an organization designated by the nationalgovernments of the EU member states to make independent judgments about whether a product complies withthe requirements established by each CE marking directive. The Medical Device Directive, Medical DeviceRegulation, ISO 9000 series and ISO 13485 are recognized international quality standards that are designed toensure that we develop and manufacture quality medical devices. Other countries are also instituting regulationsregarding medical devices or interpreting and enforcing existing regulations more strictly. Compliance with theseregulations requires extensive documentation and clinical reports for all of our products, revisions to labeling,and other requirements such as facility inspections to comply with the registration requirements. A recognizedNotified Body audits our facilities annually to verify our compliance with the ISO 13485 Quality Systemstandard.
Certain countries, as well as the EU, have issued regulations that govern products that contain materialsderived from animal sources. Regulatory authorities are particularly concerned with materials infected with the
6
agent that causes bovine spongiform encephalopathy (“BSE”), otherwise known as mad cow disease. Theseregulations affect our dermal regeneration products, duraplasty products, hernia repair products, biomaterialproducts for the spine, nerve and tendon repair products and certain other products, all of which contain materialderived from bovine tissue. Although we take great care to provide that our products are safe and free of agentsthat can cause disease, products that contain materials derived from animals, including our products, may becomesubject to additional regulation, or even be banned in certain countries, because of concern over the potential forprion transmission. Significant new regulations, a ban of our products, or a movement away from bovine-derivedproducts because of an outbreak of BSE could have a material, adverse effect on our current business or ourability to expand our business. See “Item 1A. Risk Factors—Certain of our products contain materials derivedfrom animal sources and may become subject to additional regulation.”
Postmarket Requirements. After a device is cleared or approved for commercial distribution, numerousregulatory requirements apply. These include the FDA Quality System Regulations which cover the proceduresand documentation of the design, testing, production, control, quality assurance, labeling, packaging,sterilization, storage and shipping of medical devices; the FDA’s general prohibition against promoting productsfor unapproved or ‘off-label’ uses; the Medical Device Reporting regulation, which requires that manufacturersreport to the FDA if their device may have caused or contributed to a death or serious injury or malfunctioned ina way that would likely cause or contribute to a death or serious injury if it were to recur; and the Reports ofCorrections and Removals regulation, which require manufacturers to report recalls and field corrective actionsto the FDA if initiated to reduce a risk to health posed by the device or to remedy a violation of the FD&C Act.
Other regulations
Anti-Bribery Laws. In the U.S., we are subject to laws and regulations pertaining to healthcare fraud andabuse, including anti-kickback laws and physician self-referral laws that regulate the means by which companiesin the health care industry may market their products to hospitals and health care professionals and may competeby discounting the prices of their products. Similar anti-bribery laws exist in many of the countries in which wesell our products outside the U.S., as well as the United States Foreign Corrupt Practices Act (which addressesthe activities of U.S. companies in foreign markets). Our products also are subject to regulation regardingreimbursement, and U.S. healthcare laws apply when a customer submits a claim for a product that is reimbursedunder a federally funded healthcare program. These global laws require that we exercise care in designing oursales and marketing practices, including involving interactions with healthcare professionals, and customerdiscount arrangements. See “Item 1A. Risk Factors—Oversight of the medical device industry might affect themanner in which we may sell medical devices and compete in the marketplace.”
Import-export. Our international operations subject us to laws regarding sanctioned countries, entities andpersons, customs, and import-export. Among other things, these laws restrict, and in some cases can prevent,U.S. companies from directly or indirectly selling goods, technology or services to people or entities in certaincountries. In addition, these laws require that we exercise care in our business dealings with entities in and fromforeign countries.
Hazardous materials. Our research, development and manufacturing processes involve the controlled use ofcertain hazardous materials. We are subject to country-specific, federal, state and local laws and regulationsgoverning the use, manufacture, storage, handling and disposal of these materials and certain waste products. Webelieve that our environmental, health and safety procedures for handling and disposing of these materialscomply with the standards prescribed by the controlling laws and regulations. However, risk of accidentalreleases or injury from these materials is possible. These risks are managed to minimize or eliminate associatedbusiness impacts. In the event of this type of accident, we could be held liable for damages that may result, andany liability could exceed our resources. We could be subject to a regulatory shutdown of a facility that couldprevent the distribution and sale of products manufactured there for a significant period of time, and we couldsuffer a casualty loss that could require a shutdown of the facility in order to repair it, any of which could have amaterial, adverse effect on our business. Although we continuously strive to maintain full compliance with
7
respect to all applicable global environmental, health and safety laws and regulations, we could incur substantialcosts to fully comply with future laws and regulations, and our operations, business or assets may be negativelyaffected. Furthermore, global environmental, health and safety compliance is an ongoing process. Integra hascompliance procedures in place for compliance with Employee Health & Safety laws, driven by a centrally ledorganizational structure that ensures proper implementation, which is essential to our overall business objectives.
In addition to the above regulations, we are, and may be, subject to regulation under country-specific federaland state laws, including, but not limited to, requirements regarding record keeping, and the maintenance ofpersonal information, including personal health information. As a public company, we are subject to thesecurities laws and regulations, including the Sarbanes-Oxley Act of 2002. We also are subject to other presentand could be subject to possible future, local, state, federal and foreign regulations.
Third-Party Reimbursement. Healthcare providers that purchase medical devices generally rely on third-party payors, including, in the U.S., the Medicare and Medicaid programs and private payors, such as indemnityinsurers, employer group health insurance programs and managed care plans, to reimburse all or part of the costof the products. As a result, demand for our products is and will continue to be dependent in part on the coverageand reimbursement policies of these payors. The manner in which reimbursement is sought and obtained variesbased upon the type of payor involved and the setting in which the product is furnished and utilized.Reimbursement from Medicare, Medicaid and other third-party payors may be subject to periodic adjustments asa result of legislative, regulatory and policy changes, as well as budgetary pressures. Possible reductions in, oreliminations of, coverage or reimbursement by third-party payors, or denial of, or provision of uneconomicalreimbursement for new products may affect our customers’ revenue and ability to purchase our products. Anychanges in the healthcare regulatory, payment or enforcement landscape relative to our customers’ healthcareservices have the potential to significantly affect our operations and revenue.
Data Privacy and Cybersecurity Laws and Regulations. As a business with a significant global footprint,compliance with evolving regulations and standards in data privacy and cybersecurity (relating to theconfidentiality and security of our information technology systems, products such as medical devices, and otherservices provided by us) may result in increased costs, lower revenue, new complexities in compliance, newchallenges for competition, and the threat of increased regulatory enforcement activity. Our business relies on thesecure electronic transmission, storage and hosting of sensitive information, including personal information,financial information, intellectual property, and other sensitive information related to our customers andworkforce.
For example, in the U.S. the collection, maintenance, protection, use, transmission, disclosure and disposalof certain personal information and the security of medical devices are regulated at the U.S. federal and state, andindustry levels. U.S. federal and state laws protect the confidentiality of certain patient health information,including patient medical records, and restrict the use and disclosure of patient health information by health careproviders. In addition, the FDA has issued guidance advising manufacturers to take cybersecurity risks intoaccount in product design for connected medical devices and systems, to assure that appropriate safeguards are inplace to reduce the risk of unauthorized access or modification to medical devices that contain software andreduce the risk of introducing threats into hospital systems that are connected to such devices. The FDA alsoissued guidance on post market management of cyber security in medical devices.
Outside the U.S., we are impacted by the privacy and data security requirements at the international,national and regional level, and on an industry specific basis. Legal requirements in these countries relating to thecollection, storage, handling and transfer of personal data and, potentially, intellectual property continue toevolve with increasingly strict enforcement regimes. In Europe, for example, we are subject to the EU dataprotection regulations, including the current EU Directive on Data Protection, which requires member states toimpose minimum restrictions on the collection, use and transfer of personal data. A new EU General DataProtection Regulation (“GDPR”) which became enforceable in May 2018 includes, among other things, arequirement for prompt notice of data breaches to data subjects and supervisory authorities in certain
8

circumstances and significant fines for non-compliance. The GDPR also requires companies processing personaldata of individuals residing in the EU to comply with EU privacy and data protection rules.
These laws and regulations impact the ways in which we use and manage personal data, protected healthinformation, and our information technology systems. They also impact our ability to move, store, and accessdata across geographic boundaries. Compliance with these requirements may require changes in businesspractices, complicate our operations, and add complexity and additional management and oversight needs. Theyalso may complicate our clinical research activities, as well as product offerings that involve transmission or useof clinical data.
INTELLECTUAL PROPERTY
We seek patent and trademark protection for our key technology, products and product improvements, bothin the U.S. and in selected foreign countries. When determined appropriate, we have enforced and plan tocontinue to enforce and defend our patent and trademark rights. In general, however, we do not rely solely on ourpatent and trademark estate to provide us with any significant competitive advantages as it relates to our existingproduct lines. We also rely upon trade secrets and continuing technological innovations to develop and maintainour competitive position. In an effort to protect our trade secrets, we have a policy of requiring our employees,consultants and advisors to execute proprietary information and invention assignment agreements uponcommencement of employment or consulting relationships with us. These agreements also provide that allconfidential information developed or made known to the individual during the course of their relationship withus must be kept confidential, except in specified circumstances.
AccuDrain ®, AmnioExcel ®, AmnioMatrix ®, BioDFactor ®, BioDFence ®, BioDOptix ®, BioDRestore™,Bioguard ®, BioMotion ®, Bold ®, Budde ®, Buzz™, Cadence ®, Capture™, Codman ®, Codman Certas ®,Codman VersaTru ®, CRW ®, CUSA ®, DigiFuse ®, DirectLink ®, DuraGen ®, DuraSeal ®, First Choice ®, Hallu®, HeliCote ®, HeliPlug ®, HeliTape ®, HeliMend ®, Helistat ®, Helitene ®, Integra ®, IntegraLink ®, IPP-ON ®,Isocool ®, Jarit ®, Licox ®, LimiTorr™, Luxtec ®, MediHoney ®, MemoFix ®, MicroFrance ®, Miltex ®,Movement ®, NeuraGen ®, NeuraWrap™, NuGrip ®, Omnigraft ®, Omni-Tract ®, OSV II ®, Qwix ®, Padgett ®,Panta ®, PriMatrix ®, PyroSphere ®, Redmond™, Ruggles ®, SafeGuard ®, Salto Talaris ®, Subtalar MBA ®,SurgiMend ®, TCC-EZ ®, TenoGlide ®, Ti6 ®, Tibiaxys ®, TissueMend ®, Titan™, TruArch ®, Uni-CP ®, Uni-Clip ®, Xtrasorb ® and the Integra logo are some of the material trademarks of Integra LifeSciences Corporationand its subsidiaries. MAYFIELD ® is a registered trademark of SM USA, Inc., and is used by Integra underlicense.
EMPLOYEES
At December 31, 2018, we had approximately 4,500 employees engaged in production and productionsupport for warehouse, engineering and facilities, quality assurance, quality control, research and development,regulatory and clinical affairs, sales, marketing, administration and finance. Except for certain employees at ourfacilities in Austria, Belgium, Brazil, France, Germany, Italy and Mexico, none of our employees are subject to acollective bargaining agreement.
FINANCIAL INFORMATION ABOUT GEOGRAPHIC AREAS
Financial information about our geographical areas is set forth under “Item 7. Management’s Discussionand Analysis of Financial Condition and Results of Operations—Geographic Product Revenues and Operations”and in our financial statements Note 16, Segment and Geographic Information, to our consolidated financialstatements.
SOURCES OF RAW MATERIALS
In general, raw materials essential to our businesses are readily available from multiple sources. For reasonsof quality assurance, availability, or cost effectiveness, certain components and raw materials are available only
9
from a sole supplier. Our policy is to maintain sufficient inventory of components so that our production will notbe significantly disrupted even if a particular component or material is not available for a period of time.
Certain of our products, including our dermal regeneration products, duraplasty products, wound careproducts, bone void fillers, nerve and tendon repair products and certain other products, contain material derivedfrom bovine tissue. We take great care to provide that our products are safe and free of agents that can causedisease. In particular, the collagen used in the products that Integra manufactures is derived either from the deepflexor tendon of cattle less than 24 months old from New Zealand, a country that has never had a reported case ofbovine spongiform encephalopathy, or from the U.S. or from fetal bovine dermis. The World HealthOrganization classifies different types of cattle tissue for relative risk of BSE transmission. Deep flexor tendonand fetal bovine skin are in the lowest-risk category for BSE transmission, and is therefore considered to have anegligible risk of containing the agent that causes BSE.
SEASONALITY
Revenues during our fourth quarter tend to be stronger than other quarters because many hospitals increasetheir purchases of our products during the fourth quarter to coincide with the end of their budget cycles in theU.S. In general, our first quarter usually has lower revenues than the preceding fourth quarter, the second andthird quarters have higher revenues than the first quarter, and the fourth quarter revenues are the highest in theyear. The main exceptions to this pattern occur because of material intervening acquisitions.
AVAILABLE INFORMATION
We are subject to the informational requirements of the Securities Exchange Act of 1934, as amended, (the“Exchange Act”). In accordance with the Exchange Act, we file annual, quarterly and special reports, proxystatements and other information with the Securities and Exchange Commission. You may view our financialinformation, including the information contained in this report, and other reports we file with the Securities andExchange Commission, on the Internet, without charge as soon as reasonably practicable after we file them withthe Securities and Exchange Commission, in the “SEC Filings” page of the Investor Relations section of ourwebsite at www.integralife.com. You may also obtain a copy of any of these reports, without charge, from ourInvestor Relations department, 311 Enterprise Drive, Plainsboro, NJ 08536. Alternatively, you may view orobtain reports filed with the Securities and Exchange Commission at the SEC Public Reference Room at100 F Street, N.E. in Washington, D.C. 20549, or at the Securities and Exchange Commission’s Internet site atwww.sec.gov. Please call the Securities and Exchange Commission at 1-800-SEC-0330 for further informationon the operation of the public reference facilities.
10
SPECIAL NOTE REGARDING FORWARD-LOOKING STATEMENTS
We have made statements in this report, including statements under “Business” and “Management’sDiscussion and Analysis of Financial Condition and Results of Operations” that constitute forward-lookingstatements within the meaning of Section 27A of the Securities Act of 1933, as amended (the “Securities Act”),and Section 21E of the Exchange Act. These forward-looking statements are subject to a number of risks,uncertainties and assumptions about us including, among other things:
• general economic and business conditions, both nationally and in our international markets;
• our expectations and estimates concerning future financial performance, financing plans and the impactof competition;
• anticipated trends in our business;
• anticipated demand for our products, particularly capital equipment;
• our ability to produce regenerative-based products in sufficient quantities to meet sales demands;
• our expectations concerning our ongoing restructuring, integration and manufacturing transfer andexpansion activities;
• existing and future regulations affecting our business, and enforcement of those regulations;
• our ability to obtain additional debt and equity financing to fund capital expenditures, working capitalrequirements and acquisitions;
• physicians’ willingness to adopt our recently launched and planned products, third-party payors’willingness to provide or continue reimbursement for any of our products and our ability to secureregulatory approval for products in development;
• initiatives launched by our competitors;
• our ability to protect our intellectual property, including trade secrets;
• our ability to complete acquisitions, integrate operations post-acquisition and maintain relationshipswith customers of acquired entities;
• our ability to remediate all matters identified in FDA observations and warning letters that we receivedor may receive; and
• other risk factors described in the section entitled “Risk Factors” in this report.
You can identify these forward-looking statements by forward-looking words such as “believe,” “may,”“could,” “might,” “will,” “estimate,” “continue,” “anticipate,” “intend,” “seek,” “plan,” “expect,” “should,”“would” and similar expressions in this report. We undertake no obligation to publicly update or revise anyforward-looking statements, whether as a result of new information, future events or otherwise. In light of theserisks and uncertainties, the forward-looking events and circumstances discussed in this report may not occur andactual results could differ materially from those anticipated or implied in the forward-looking statements.
11

ITEM 1A. RISK FACTORS
Risks Related to Our Business
Our operating results may fluctuate.
Our operating results, including components of operating results such as gross margin and cost of productsales, may fluctuate from time to time, and such fluctuations could affect our stock price. Our operating resultshave fluctuated in the past and can be expected to fluctuate from time to time in the future. Some of the factorsthat may cause these fluctuations include:
• economic conditions worldwide, which could affect the ability of hospitals and other customers topurchase our products and could result in a reduction in elective and non-reimbursed operativeprocedures;
• the impact of acquisitions and our ability to integrate acquisitions;
• the impact of our restructuring activities;
• expenditures for major initiatives, including acquired businesses and integrations thereof andrestructuring;
• the timing of significant customer orders, which tend to increase in the fourth quarter to coincide withthe end of budget cycles for many hospitals;
• increased competition for a wide range of customers across all our product lines in the markets ourproducts are sold;
• market acceptance of our existing products, as well as products in development;
• the timing of regulatory approvals as well as changes in country-specific regulatory requirements;
• changes in the rates of exchange between the U.S. dollar and other currencies of foreign countries inwhich we do business;
• changes in the variable interest rates of our debt instruments which could impact debt servicerequirements;
• potential backorders, lost sales and expenses incurred in connection with product recalls or fieldcorrective actions;
• disruption of our operations and sales resulting from extreme weather conditions or natural disastersthat damage our manufacturing or distribution facilities, the suppliers and service providers for thosefacilities, or the infrastructure in the locations of those facilities;
• our ability to manufacture and ship our products efficiently or in sufficient quantities to meet salesdemands;
• changes in the cost or decreases in the supply of raw materials, including energy, steel, pyrocarbon andhoney;
• the timing of our research and development expenditures;
• reimbursement for our products by third-party payors such as Medicare, Medicaid, private and publichealth insurers and foreign governmental health systems;
• the ability to maintain existing distribution rights to and from certain third parties;
• the ability to maintain business if or when we opt to convert such business from distributors to a directsales model;
• the ability of our new commercial sales representatives to obtain sales targets in a reasonable timeframe;
12

• the impact of changes to our sales organization, including channel expansion in the U.S. and increasedspecialization;
• peer-reviewed publications discussing the clinical effectiveness of the products we sell;
• inspections of our manufacturing facilities for compliance with Quality System Regulations (GoodManufacturing Practices) which could result in Form 483 observations, warning letters, injunctions orother adverse findings from the FDA or from equivalent regulatory bodies, and corrective actions,procedural changes and other actions that we determine are necessary or appropriate to address theresults of those inspections, any of which may affect production and our ability to supply our customerswith our products;
• changes in regulations or guidelines that impact the sales and marketing practices for products that wesell;
• the increased regulatory scrutiny of certain of our products, including products which we manufacturefor others, could result in their being removed from the market or involve field corrective actions thatcould affect the marketability of our products;
• enforcement or defense of intellectual property rights;
• changes in tax laws, or their interpretations; and
• the impact of goodwill and intangible asset impairment charges if future operating results of theacquired businesses are significantly less than the results anticipated at the time of the acquisitions.
The industry and market segments in which we operate are highly competitive, and we may be unable tocompete effectively with other companies.
There is intense competition among medical device companies. We compete with established medicaltechnology companies in many of our product areas. Competition also comes from early-stage companies thathave alternative technological solutions for our primary clinical targets, as well as universities, researchinstitutions and other non-profit entities. In certain cases, our products compete primarily against medicalpractices that treat a condition without using a device or any particular product, such as the medical practices thatuse autograft tissue instead of our dermal regeneration products, duraplasty products and nerve repair products,or that use other technologies that cost less than our products. Many of our competitors have access to greaterfinancial, technical, research and development, marketing, manufacturing, sales, distribution, administrative,consulting and other resources than we do. Our competitors may be more effective at developing commercialproducts. Our competitors may be able to gain market share by offering lower-cost products or by offeringproducts that enjoy better reimbursement from third-party payors, such as Medicare, Medicaid, private andpublic health insurers and foreign governmental health systems.
Our competitive position depends on our ability to achieve market acceptance for our products, develop newproducts, implement production and marketing plans, secure regulatory approval for products underdevelopment, obtain and maintain reimbursement coverage under Medicare, Medicaid, private and public healthinsurers and foreign governmental health systems, obtain patent protection and produce products consistently insufficient quantities to meet demand. We may need to develop new applications for our products to remaincompetitive. Technological advances by one or more of our current or future competitors or their achievement ofsuperior reimbursement from Medicare, Medicaid, private and public health insurers and foreign governmentalhealth systems could render our present or future products obsolete or uneconomical. Our future success willdepend upon our ability to compete effectively against current technology as well as to respond effectively totechnological advances, changes in customers’ requirements, or changes in payor or regulatory evidencerequirements. Additionally, purchasing decisions of our customers may be based on clinical evidence orcomparative effectiveness studies and, because of our vast array of products, we might not be able to fund thestudies necessary to gain entry or maintain our position or provide the required information to compete
13
effectively. Other companies may have more resources available to fund such studies. For example, competitorshave launched and have been developing products to compete with our dural repair products, extremityreconstruction implants, regenerative skin, neuro critical care monitors and ultrasonic tissue ablation devices,among others. Further, in the current environment of managed care, consolidation among health care providers,increased competition, and declining reimbursement rates, we have been increasingly required to compete on thebasis of price. Competitive pressures could adversely affect our profitability. Given these factors, we cannotguarantee that we will be able to compete effectively or continue our level of success in the areas in which wecompete.
If there is a determination that the spin-off of SeaSpine is taxable for U.S. federal income tax purposes,then we and our stockholders that are subject to U.S. federal income tax could incur significant U.S. federalincome tax liabilities and, in certain circumstances, we could be required to indemnify SeaSpine formaterial taxes pursuant to indemnification obligations under the tax matters agreement.
On July 1, 2015, we completed the separation (the “Separation”) of our orthobiologics and spinal fusionhardware business, now known as SeaSpine Holdings Corporation (“SeaSpine”), from the Company. Wereceived an opinion of Latham & Watkins LLP, tax counsel to us (the “Tax Opinion”), substantially to the effectthat (i) the contribution of the stock of SeaSpine Orthopedics Corporation to SeaSpine, together with the internaldistribution of the stock of SeaSpine to Integra (collectively, the “internal distribution”), will constitute areorganization under Sections 355 and 368(a)(1)(D) of the Internal Revenue Code of 1986, as amended (the“Code”) and (ii) the contribution of cash from us to SeaSpine (the “cash contribution”), together with thedistribution of the stock of SeaSpine to our shareholders (the “distribution”), will constitute a reorganizationunder Sections 355 and 368(a)(1)(D) of the Code. Based on this tax treatment, the distribution will be tax-free toIntegra and its stockholders for U.S. federal income tax purposes (except for any cash received in lieu offractional shares). The Tax Opinion relied on certain facts, assumptions, representations and undertakings fromus and SeaSpine regarding the past and future conduct of the companies’ respective businesses and other matters.The Tax Opinion is not binding on the U.S. Internal Revenue Service (the “IRS”) or the courts. Notwithstandingthe opinion, the IRS could determine on audit that the internal distribution, the cash contribution and thedistribution should be treated as taxable transactions if it determines that any of the facts, assumptions,representations or undertakings we or SeaSpine have made is not correct or has been violated, or that the internaldistribution, the cash contribution and the distribution should be taxable for other reasons, including as a result ofa significant change in stock or asset ownership after the distribution. If the distribution ultimately is determinedto be taxable, the distribution could be treated as a taxable dividend or capital gain to our stockholders forU.S. federal income tax purposes, and our stockholders could incur significant U.S. federal income tax liabilities.In addition, we would recognize gain in an amount equal to the excess of the fair market value of shares ofSeaSpine common stock distributed to our stockholders on the distribution date over our tax basis in such sharesof SeaSpine common stock. Moreover, we could incur significant U.S. federal income tax liabilities if it isultimately determined that the internal distribution does not qualify as a transaction that is tax-free forU.S. federal income tax purposes.
We may be subject to continuing contingent liabilities of SeaSpine following the spin-off.
After the Separation, there are several significant areas where the liabilities of SeaSpine may become ourobligations. For example, under the Code and the related rules and regulations, each corporation that was amember of our consolidated U.S. federal income tax reporting group during any taxable period or portion of anytaxable period ending on or before the effective time of the spin-off is jointly and severally liable for theU.S. federal income tax liability of the entire consolidated tax reporting group for that taxable period. If SeaSpineis unable to pay any prior period taxes for which it is responsible, we could be required to pay the entire amountof such taxes.
14
Our current strategy involves growth through acquisitions, which requires us to incur substantial costs andpotential liabilities for which we may never realize the anticipated benefits.
In addition to internally generated growth, our current strategy involves growth through acquisitions.Between January 1, 2016 and December 31, 2018, we have acquired 3 businesses at a total cost of approximately$1.2 billion.
We may be unable to continue to implement our growth strategy, and our strategy ultimately may beunsuccessful. A significant portion of our growth in revenues has resulted from, and is expected to continue toresult from, the acquisition of businesses or products complementary to our own. We engage in evaluations ofpotential acquisitions and are in various stages of discussion regarding possible acquisitions, certain of which, ifconsummated, could be significant to us. Any new acquisition could result in material transaction expenses,increased interest and amortization expense, increased depreciation expense, increased operating expense, andpossible in-process research and development charges for acquisitions that do not meet the definition of a“business,” any of which could have a material, adverse effect on our operating results. Certain businesses thatwe acquire may not have adequate financial, disclosure, regulatory, quality or other compliance controls at thetime we acquire them and could require significant expenditures to address those controls or subject us toincreased risk. As we grow by acquisition, we must manage and integrate the new businesses to bring them intoour systems for financial, disclosure, compliance, regulatory and quality control, realize economies of scale, andcontrol costs. If we cannot integrate acquired businesses and operations, manage the cost of providing ourproducts or price our products appropriately, our profitability could suffer. In addition, acquisitions involve otherrisks, including diversion of management resources otherwise available for the running of our business and thedevelopment of our business as well as risks associated with entering markets in which our marketing teams andsales force has limited experience or where experienced distribution alliances are not available. Our futureprofitability will depend in part upon our ability to develop further our resources to adapt to these new productsor business areas and to identify and enter into or maintain satisfactory distribution networks. Further, as a resultof our acquisitions of other healthcare businesses, we may be subject to the risk of unanticipated businessuncertainties, regulatory and other compliance matters or legal liabilities relating to those acquired businesses forwhich the sellers of the acquired businesses may not indemnify us, for which we may not be able to obtaininsurance (or adequate insurance), or for which the indemnification may not be sufficient to cover the ultimateliabilities. We may not be able to identify suitable acquisition candidates in the future, obtain acceptablefinancing or consummate any future acquisitions. Certain potential acquisitions are subject to antitrust andcompetition laws, which laws could impact our ability to pursue strategic acquisitions and could result inmandated divestitures. If we are unsuccessful in our acquisition strategy, we may be unable to meet our financialtargets and our financial performance could be materially and adversely affected.
Our future financial results could be adversely affected by impairments or other charges.
Since we have grown through acquisitions, we have $926.4 million of goodwill and $163.1 million ofindefinite-lived intangible assets as of December 31, 2018. Under the authoritative guidance for determining theuseful life of intangible assets, we are required to test both goodwill and indefinite-lived intangible assets forimpairment on an annual basis based upon a fair value approach, rather than amortizing them over time. We arealso required to test goodwill and indefinite-lived intangible assets for impairment between annual tests if anevent occurs such as a significant decline in revenues or cash flows for certain products, or the discount ratesused in the calculations of discounted cash flow change significantly, or circumstances change that would morelikely than not reduce our enterprise fair value below its book value. If such a decline, rate change orcircumstance were to materialize, we may record an impairment of these intangible assets that could be materialto the financial statements. See “Management’s Discussion and Analysis of Financial Condition and Results ofOperations - Critical Accounting Estimates” of this report.
The guidance on long-lived assets requires that we assess the impairment of our long-lived assets, includingfinite-lived intangible assets, whenever events or changes in circumstances indicate that the carrying value may
15
not be recoverable as measured by the sum of the expected future undiscounted cash flows. As of December 31,2018, we had $916.4 million and $300.1 million of finite-lived intangible assets and property, plant andequipment, respectively.
At December 31, 2018, our trade names had a carrying value of $241.4 million and decisions relating to ourtrade names may occur over time. Additionally, we may discontinue certain products in the future as we continueto assess the profitability of our product lines. As a result, we may need to record impairment charges oraccelerate amortization on certain trade names or technology-related intangible assets in the future.
The value of a medical device business is often volatile, and the assumptions underlying our estimates madein connection with our assessments under the guidance may change as a result of that volatility or other factorsoutside our control and may result in impairment charges. The amount of any such impairment charges could besignificant and could have a material, adverse effect on our reported financial results for the period in which thecharge is taken and could have an adverse effect on the market price of our securities, including the notes and thecommon stock into which they may be converted.
The adoption of healthcare reform in the U.S. and initiatives sponsored by other governments mayadversely affect our business, results of operations and/or financial condition.
Our operations may be substantially affected by potential fundamental changes in the global political,economic and regulatory landscape of the healthcare industry. Government and private sector initiatives to limitthe growth of healthcare costs are continuing in the U.S., and in many other countries in which we do business,causing the marketplace to put increased emphasis on the delivery of more cost-effective treatments. Theseinitiatives include price regulation, competitive pricing, coverage and payment policies, comparativeeffectiveness of therapies, technology assessments and managed-care arrangements. The adoption of some or allof these initiatives could have a material, adverse effect on our financial condition and results of operations.
The Patient Protection and Affordable Care Act (the “ACA”), signed into law in March 2010, includesseveral provisions that impact our businesses in the U.S. The ACA includes provisions that, among other things,reduce and/or limit Medicare reimbursement, require all individuals to have health insurance (with limitedexceptions), require detailed disclosure of gifts and other remuneration made to healthcare professionals.Specifically, commencing on January 1, 2013, the ACA requires the medical device industry to subsidizehealthcare reform by implementing a 2.3% excise tax on the sale of certain medical devices by a manufacturer,producer or importer of such devices in the U.S. In December 2015, President Obama signed into law TheConsolidated Appropriations Act, which included a two-year moratorium on the excise tax for 2016 and 2017.On January 22, 2018, President Trump signed into law a funding bill, which extended the moratorium on theexcise tax through December 31, 2019. Unless there is further legislative action during that period, the medicaldevice excise tax will be reinstated on or after January 1, 2020. While this two-year moratorium on the medicaldevice excise tax could provide a short-term benefit to the Company in terms of providing additional moniesavailable to spend on various projects in 2018 and 2019, we are unable to predict what the long-term impact willhave on our financial statements and financial performance.
Since the adoption of the ACA, the law has been challenged before the U.S. Supreme Court, and severalbills have been and may continue to be introduced in Congress to delay, defund or repeal implementation of oramend significant provisions of the ACA. In addition, there continues to be ongoing litigation over theinterpretation and implementation of certain provisions of the law. Furthermore, on January 20, 2017, anexecutive order was issued that, among other things, stated the intention of the administration to repeal the ACAand, pending that repeal, instructed the executive branch of the Federal government to defer or delay theimplementation of any provision or requirement of the ACA that would impose a fiscal burden on any state or acost, fee, tax or penalty on any individual, family, health care provider, health insurer, or manufacturer ofpharmaceuticals or medical devices. On December 22, 2017, President Trump signed into law the Tax Cuts andJobs Act, which eliminates the penalty for individuals who fail to purchase acceptable health insurance starting in
16
2019 and will most likely result in the reduction in the number of insured people in the U.S. We cannot predictwhether the ACA will be repealed, replaced, or further modified, what impact the President’s executive orderwill have on the implementation and enforcement of the provisions of the ACA, or what impact the eliminationof the penalty and resulting reduction in the number of insured people in the U.S. will have on the demand andpricing for our products. In addition, if the ACA is replaced or modified, we cannot predict what the replacementplan or modifications would be, when the replacement plan or modifications would become effective, or whetherany of the existing provisions of the ACA would remain in place. As a result, while we are unable to predict theeffect of the ACA and the various activities surrounding it on our business, financial condition or results ofoperations, changes to this law, or a new law that replaces it, could materially and adversely affect our businessand results of operations.
In addition to the ACA, the Medicare Access and CHIP Reauthorization Act of 2015 (“MACRA”) repealedthe Sustainable Growth Rate formula used to calculate Medicare payment updates for physicians providingservices to Medicare beneficiaries. In its place, MACRA introduced the Quality Payment Program (“QPP”),which is a value-based program that focuses on quality and outcomes as a metric for physician reimbursement.The Centers for Medicare and Medicaid Services released its final rules for the QPP in October 2016. The QPP,which impacts more than 600,000 physicians and other practice-based clinicians, represents a fundamentalchange in physician reimbursement, transitioning from a system that solely rewards volume of care to one thatalso rewards quality and value of care. While the full impact of QPP on physicians’ practices and productselection decisions will not be fully known until payment adjustments go into effect in 2019, 2017 representedthe first performance measurement year. The program’s increased emphasis on quality and cost of care mayencourage physicians to merge practices or seek direct employment with hospitals. In addition, the ACAencourages hospitals and physicians to work collaboratively through shared savings programs as well as otherbundled payment initiatives. These shifts could lead to a consolidation of hospital providers into larger deliverynetworks with increased price negotiation strength resulting in downward pressure on our selling prices.Although we believe that we are well positioned to minimize any such impact on our business, our inability toaddress the consolidation trend could materially and adversely affect our business and results of operations.
Other initiatives sponsored by government agencies, legislative bodies and the private sector to limit thegrowth of healthcare costs, including price regulation and competitive pricing, are ongoing in the markets wherewe do business. We cannot predict what healthcare programs and regulations will ultimately be implemented atthe U.S. federal or state level or elsewhere, or the effect of any future legislation or regulation in the U.S. orelsewhere. That said, any changes that lower reimbursements for our products or reduce medical procedurevolumes could have a material, adverse effect on our business, financial condition and results of operations. Wecontinue to monitor the implementation of such legislation and, to the extent new market or industry trends ornew governmental programs evolve, we will consider implementing or implement programs in response.
Changes in the healthcare industry may require us to decrease the selling price for our products, mayreduce the size of the market for our products, or may eliminate a market, any of which could have anegative impact on our financial performance.
Trends toward managed care, healthcare cost containment and other changes in government and privatesector initiatives in the U.S. and other countries in which we do business are placing increased emphasis on thedelivery of more cost-effective medical therapies that could adversely affect the sale and/or the prices of ourproducts. For example:
• third-party payors of hospital services and hospital outpatient services, including Medicare, Medicaid,private and public health insurers and foreign governmental health systems, annually revise theirpayment methodologies, which can result in stricter standards for reimbursement of hospital chargesfor certain medical procedures or the elimination of reimbursement;
• several foreign countries have implemented reforms of their respective healthcare sectors in an effort toreduce healthcare spending, including restricting funding to only those medical technologies and
17
procedures with proven effectiveness, and increasing patient co-payments. Governmental healthsystems have revised and continue to consider revisions of healthcare budgets, which could result instricter standards for implementing certain medical procedures, increased scrutiny of medical devices,and downward pricing pressure;
• Medicare, Medicaid, private and public health insurer and foreign governmental cutbacks could createdownward pricing pressure on our products;
• in the U.S., Medicare and Medicaid coverage as well as commercial payor coverage determinationscould reduce or eliminate reimbursement or coverage for certain of our wound matrix, amniotic, andadvanced wound dressing products as well as other products in most regions, negatively affecting ourmarket for these products, and future determinations could reduce or eliminate reimbursement orcoverage for these products in other regions and could reduce or eliminate reimbursement or coveragefor other products;
• there has been a consolidation among healthcare facilities and purchasers of medical devices in theU.S., some of whom prefer to limit the number of suppliers from whom they purchase medicalproducts, and these entities may decide to stop purchasing our products or demand discounts on ourprices;
• there has been a growing movement of physicians becoming employees of hospitals and otherhealthcare entities, which aligns surgeon product choices with his or her employers’ purchasingdecisions, and adds to pricing pressures;
• in the U.S., we are party to contracts with group purchasing organizations, which negotiate pricing formany member hospitals, require us to discount our prices for certain of our products and limit ourability to raise prices for certain of our products, particularly surgical instruments;
• there is economic pressure to contain healthcare costs in domestic and international markets, and,regardless of the consolidation discussed above, providers generally are exploring ways to cut costs byeliminating purchases or driving reductions in the prices that they pay for medical devices, orincreasing clinical or economic evidence thresholds for product formularies;
• there are proposed and existing laws, regulations and industry policies in domestic and internationalmarkets regulating the sales and marketing practices and the pricing and profitability of companies inthe healthcare industry;
• proposed laws or regulations may permit hospitals to provide financial incentives to doctors forreducing hospital costs, will award physician efficiency, and will encourage partnerships withhealthcare service and goods providers to reduce prices; and
• there have been initiatives by third-party payors and foreign governmental health systems to challengethe prices charged for medical products that could affect our ability to sell products on a competitivebasis.
Any and all of the above factors could materially and adversely affect our levels of revenue and ourprofitability.
We are subject to stringent domestic and foreign medical device regulation and any adverse regulatoryaction may adversely affect our financial condition and business operations.
Our products, development activities and manufacturing processes are subject to extensive and rigorousregulation by numerous government agencies, including the FDA and comparable foreign agencies. To varyingdegrees, each of these agencies monitors and enforces our compliance with laws and regulations governing thedevelopment, testing, manufacturing, labeling, marketing and distribution of our medical devices. We are alsosubject to regulations that may apply to certain of our products that are Drug/Device Combination products or areconsidered to be subject to pharmaceutical regulations outside the U.S. The process of obtaining marketing
18
approval or clearance from the FDA and comparable foreign regulatory agencies for new products, or forenhancements or modifications to existing products, could
• take a significant amount of time;
• require the expenditure of substantial financial and other resources;
• involve rigorous and expensive pre-clinical and clinical testing, as well as increased post-marketsurveillance;
• involve modifications, repairs or replacements of our products; and
• result in limitations on the indicated uses of our products.
We cannot be certain that we will receive required approval or clearance from the FDA and foreignregulatory agencies for new products or modifications to existing products on a timely basis. The failure toreceive approval or clearance for significant new products or modifications to existing products on a timely basiscould have a material, adverse effect on our financial condition and results of operations.
Both before and after a product is commercially released, we have ongoing responsibilities under FDA andforeign regulations. For example, we are required to comply with the FDA’s Quality System Regulation, whichmandates that manufacturers of medical devices adhere to certain quality assurance requirements pertaining to,among other things, validation of manufacturing processes, controls for purchasing product components, anddocumentation practices. As another example, the Federal Medical Device Reporting regulation requires us toprovide information to the FDA whenever there is evidence that reasonably suggests that a device may havecaused or contributed to a death or serious injury or, that a malfunction occurred which would be likely to causeor contribute to a death or serious injury upon recurrence. Compliance with applicable regulatory requirements issubject to continual review and is monitored rigorously through periodic inspections by the FDA, which mayresult in observations on Form 483, and in some cases warning letters, that require corrective action. If the FDAor equivalent foreign agency were to conclude that we are not in compliance with applicable laws or regulations,or that any of our medical devices are ineffective or pose an unreasonable health risk, the FDA or equivalentforeign agency could ban such medical devices, detain or seize such medical devices, order a recall, repair,replacement, or refund of such devices, or require us to notify health professionals and others that the devicespresent unreasonable risks of substantial harm to the public health.
Governments are expected to continue to scrutinize the industry closely with inspections, and possiblyenforcement actions, by the FDA or equivalent foreign agencies. Additionally, the FDA may restrictmanufacturing and impose other operating restrictions, enjoin and restrain certain violations of applicable lawpertaining to medical devices, and assess civil or criminal penalties against our officers, employees, or us. TheFDA may also recommend prosecution to the Department of Justice. Any adverse regulatory action, dependingon its magnitude, may restrict us from effectively manufacturing, marketing and selling our products and couldhave a material, adverse effect on our financial condition and results of operations. In addition, negative publicityand product liability claims resulting from any adverse regulatory action could have a material, adverse effect onour financial condition and results of operations.
While we have taken measures to enhance our Quality System, we cannot assure you that future inspectionsby the FDA and the standards they apply will not result in warning letters for any facility in the future. We arealso subject to inspections of our Quality System by regulatory agencies outside the U.S. which could result inthe issuance of nonconformance or significant requirements to our Quality System.
The FDA Reauthorization Act of 2017 (“FDARA”), which includes the reauthorization of the MedicalDevice User Fee Amendments of 2012, as well as other medical device provisions, went into effect October 1,2017. This includes performance goals and user fees paid to the FDA by medical device companies when theyregister and list with the FDA and when they submit an application to market a device in the U.S. Under
19
FDARA, this user fee program has been reauthorized through fiscal year 2022. Under the Medical Device UserFee Amendments, or MDUFA III, there are additional requirements regarding the FDA EstablishmentRegistration and Listing of Medical Devices. All U.S. and foreign manufacturers must register and list medicaldevices for sale in the U.S. All of our facilities comply with these requirements. That said, we also sourceproducts from foreign contract manufacturers. From this business practice, it is possible that some of our foreigncontract manufacturers will not comply with these requirements and choose not to register with the FDA. In suchan event, we will need to determine if there are alternative foreign contract manufacturers who comply with theFDA Establishment Registration requirements. If such a foreign contract manufacturer is a sole supplier of one ofour products, there is a risk that we may not be able to source another supplier and our business could beadversely affected.
We are subject to extensive complex regulatory requirements by domestic and foreign government agenciesand any failure to comply with our ongoing responsibilities under their applicable laws and regulations couldresult in a material adverse impact on our business.
In addition, the United States Federal Food, Drug, and Cosmetic Act (“ FDCA”) permits devicemanufacturers to promote products solely for the uses and indications set forth in the approved product labeling.A number of enforcement actions have been taken against manufacturers that promote products for “off-label”uses, including actions alleging that federal health care program reimbursement of products promoted for“off-label” uses are false and fraudulent claims to the government. The failure to comply with “off-label”promotion restrictions can result in significant financial penalties and a required corporate integrity agreementwith the federal government imposing significant administrative obligations and costs, and potential evaluationfrom federal health care programs.
Foreign governmental regulations have become more stringent and we may become subject to even morerigorous regulation by foreign governmental authorities in the future, which could have a material, adverse effecton our business, financial condition and results of operations. Penalties for a company’s noncompliance withforeign governmental regulation could be severe, including revocation or suspension of a company’s businesslicense and criminal sanctions. For example, we are subject to Good Manufacturing Practice regulations forPharmaceuticals in the EU for certain of our products. These regulations also mandate that manufacturers ofmedical devices (or those that are considered pharmaceuticals) adhere to certain quality assurance requirementspertaining to, among other things, validation of manufacturing processes, controls for purchasing productcomponents, and documentation practices. There may be additional regulations if such products are consideredpharmaceuticals outside the U.S.
In addition, the new European Medical Device Regulation (“EU MDR”) passed in the European Parliamenton April 5, 2017 and went into effect on May 25, 2017, replacing the Medical Device Directive. The EU MDR isan extensive reform of the rules that govern the medical device industry in Europe. Under this regulation,manufacturers will have three (3) years to comply with a broad set of new rules for almost every kind of medicaldevice. The EU MDR will require changes in the clinical evidence required for medical devices, post-marketclinical follow-up evidence, annual reporting of safety information for Class III products, and bi-annual reportingfor Class II products, Unique Device Identification (“UDI”) for all products, submission of core data elements toa European UDI database prior to placement of a device on the market, reclassification of medical devices, andmultiple other labeling changes.
Under the new EU MDR rules, medical device companies will have to, among other things. do thefollowing:
• provide significantly more clinical evidence to get new products to market and even to keep existingproducts on the market;
• make changes to product labeling and make certain product data available to the public; and
20
• conduct product portfolio assessments to determine the impact of the EU MDR on the Company’smargins.
Overall, medical device companies can expect longer lead times to obtain product registrations (CE MarkCertification) in the EU and a substantially costlier pathway to compliance in the EU. We are not yet able todetermine the costs of complying with these regulations, how the EU will interpret and enforce them, what thetimelines for approvals of products will be and the overall effect of the EU MDR on the marketplace. Given thesignificant additional pre-market and post-market requirements imposed by the EU MDR, the overall impact ofthese new rules could have a material, adverse effect on the Company’s revenues and expenses.
Certain of our products contain materials derived from animal sources and may become subject toadditional regulation.
Certain of our products, including our dermal regeneration products, duraplasty products, wound careproducts, bone void fillers, nerve and tendon repair products and certain other products, contain material derivedfrom bovine tissue. In 2018, approximately 37% of our revenues derived from products containing materialderived from bovine tissue. Products that contain materials derived from animal sources, including food,pharmaceuticals and medical devices, are subject to scrutiny in the media and by regulatory authorities.Regulatory authorities are concerned about the potential for the transmission of disease from animals to humansvia those materials. This public scrutiny has been particularly acute in Japan and Western Europe with respect toproducts derived from animal sources, because of concern that materials infected with the agent that causesbovine spongiform encephalopathy, otherwise known as BSE or mad cow disease, may, if ingested or implanted,cause a variant of the human Creutzfeldt-Jakob Disease, an ultimately fatal disease with no known cure. TheWorld Organization for Animal Health (“OIE”) recognizes the U.S. as having a negligible risk for BSE, which isthe highest status available.
We take care to provide that our products are safe and free of agents that can cause disease. In particular, wequalified a source of collagen from a country outside the U.S. that is considered BSE/TSE-free. The WorldHealth Organization classifies different types of bovine tissue for relative risk of BSE transmission. Deep flexortendon and bovine fetal skin, which are used in our products, are in the lowest-risk categories for BSEtransmission and are therefore considered to have a negligible risk of containing the agent that causes BSE (animproperly folded protein known as a prion). Nevertheless, products that contain materials derived from animals,including our products, could become subject to additional regulation, or even be banned in certain countries,because of concern over the potential for the transmission of prions. Significant new regulation, or a ban of ourproducts, could have a material, adverse effect on our current business or our ability to expand our business.
Certain countries, such as Japan, China, Taiwan and Argentina, have issued regulations that require ourcollagen products be sourced from countries where no cases of BSE have occurred, and the EU has requested thatour dural replacement products and other products that are used in neurological tissue be sourced from a countrywhere no cases of BSE have occurred. Currently, we source bovine fetal hides from the U.S. and purchase tendonfrom the U.S. and New Zealand. New Zealand has never had a case of BSE. We received approval in the U.S.,the EU, Japan, Taiwan, China, Argentina as well as other countries for the use of New Zealand-sourced tendon inthe manufacturing of our products. If we cannot continue to use or qualify a source of tendon from New Zealandor another country that has never had a case of BSE, we could be prohibited from selling our collagen products incertain countries.
Certain of our products are derived from human tissue and are subject to additional regulations andrequirements.
We manufacture and distribute products derived from human tissue. The FDA has specific regulationsgoverning human cells, tissues and cellular and tissue-based products, or HCT/Ps. An HCT/P is a productcontaining or consisting of human cells or tissue intended for transplantation into a human patient. Examples
21
include bone, ligament, skin, amniotic tissue and cornea. HCT/Ps that meet the criteria for regulation solelyunder Section 361 of the Public Health Service Act (“Section 361”) are not subject to any premarket clearance orapproval requirements but are subject to post-market regulatory requirements.
Some HCT/Ps also meet the definition of a biological product, medical device or drug regulated under theFDCA. These biologic, device or drug HCT/Ps must comply both with the requirements exclusively applicable toSection 361 HCT/Ps and, in addition, with requirements applicable to biologics, devices or drugs, includingpremarket clearance or approval.
On June 22, 2015, the FDA issued an Untitled Letter alleging that BioD’s morselized amniotic membranetissue based products do not meet the criteria for regulation as HCT/Ps solely under Section 361 and that, as aresult, BioD would need a biologics license to lawfully market those morselized products. Since the issuance ofthe Untitled Letter, BioD and more recently the Company have been in discussions with the FDA tocommunicate their disagreement with the FDA’s assertion that certain products are more than minimallymanipulated. The FDA has not changed its position that certain of the BioD acquired products are not eligible formarketing solely under Section 361.
In November 2017, the FDA issued the final guidance document related to human tissue titled, “RegulatoryConsiderations for Human Cells, Tissues, and Cellular and Tissue-Based Products: Minimal Manipulation andHomologous Use” (the “HCT/P Final Guidance”). The HCT/P Final Guidance maintains the FDA’s position thatproducts such as the Company’s morselized amniotic membrane tissue-based products do not meet the criteriafor regulation solely as HCT/Ps. In addition, the FDA articulated a risk-based approach to enforcement and,while some uses for amniotic membrane tissue-based products would enjoy as much as thirty-six months ofenforcement discretion, other high risk uses could be subject to immediate enforcement action. The Companydoes not believe the uses for its amniotic membrane tissue-based products fall into the high risk-category.Nonetheless, we can make no assurances that the FDA will continue to exercise its enforcement discretion withrespect to the Company’s amniotic membrane tissue-based products, and any potential action of the FDA couldhave a financial impact regarding the sales of such products. The Company has been considering and continuesto consider regulatory approval pathways for its amniotic membrane tissue-based products. Revenues from BioDmorselized amniotic material-based products for the year ended December 31, 2018 was less than 1% ofconsolidated revenues.
Lack of market acceptance for our products or market preference for technologies that compete with ourproducts could reduce our revenues and profitability.
We cannot be certain that our current products or any other products that we develop or market will achieveor maintain market acceptance. Certain of the medical indications that our devices can treat can also be treated byother medical devices or by medical practices that do not include a device. The medical community widelyaccepts many alternative treatments, and certain of these other treatments have a long history of use. Forexample, the use of autograft tissue is a well-established means for repairing the dermis, and it competes foracceptance in the market with our collagen-based wound care products.
We cannot be certain that our new devices and procedures will be able to replace those establishedtreatments or that physicians, the medical community or third-party payors, including Medicare, Medicaid,private and public health insurers and foreign governmental health systems, will accept and utilize our devices orany other medical products that we may develop. For example, greater market acceptance of our wound graftproducts may ultimately depend on our ability to demonstrate that higher rates of reimbursement are justifiedbecause they are an attractive and cost-effective alternative to other treatment options. Additionally, if there arenegative events in the industry, whether real or perceived, there could be a negative impact on the industry as awhole.
In addition, our future success depends, in part, on our ability to license and develop additional products.Even if we determine that a product candidate has medical benefits, the cost of commercializing that product
22
candidate, either through internal development or payments associated with licensing arrangements, could be toohigh to justify development. Competitors could develop products that are more effective, achieve or maintainmore favorable reimbursement status from third-party payors both domestically and internationally, includingMedicare, Medicaid, private and public health insurers, and foreign governmental health systems, cost less or areready for commercial introduction before our products. If we are unable to develop additional commerciallyviable products, our future prospects could be materially and adversely affected.
Market acceptance of our products depends on many factors, including our ability to convince prospectivecollaborators and customers that our technology is an attractive alternative to other technologies, to manufactureproducts in sufficient quantities and at acceptable costs, and to supply and service sufficient quantities of ourproducts directly or through our distribution alliances. In addition, unfavorable reimbursement methodologies, oradverse determinations of third-party payors, including Medicare, Medicaid, private and public health insurers,and foreign governmental health systems, regarding our products or third-party determinations that favor acompetitor’s product over ours, could harm acceptance or continued use of our products. The industry is subjectto rapid and continuous change arising from, among other things, consolidation, technological improvements, thepressure on governments, third-party payors and providers to reduce healthcare costs, and healthcare reformlegislation and initiatives domestically and internationally. One or more of these factors could varyunpredictably, and such variations could have a material, adverse effect on our competitive position. We may notbe able to adjust our contemplated plan of development to meet changing market demands.
Economic and political instability around the world could adversely affect the ability of hospitals, othercustomers, suppliers and distributors to access funds or otherwise have available liquidity, which couldreduce orders for our products or interrupt our production or distribution or result in a reduction in electiveand non-reimbursed operative procedures.
Economic and political instability around the world could adversely affect the ability of hospitals and othercustomers to access funds to enable them to fund their operating and capital budgets. As a result, hospitals andother customers could reduce budgets or put all or part of their budgets on hold or close their operations, whichcould have a negative effect on our sales, particularly the sales of capital equipment such as our ultrasonicsurgical aspirators, neuromonitors and stereotactic products, or result in a reduction in elective andnon-reimbursed procedures. The occurrence of those economic conditions could make it more difficult for us toaccurately forecast and plan our future business activities and depending on their severity, could have a material,adverse effect on our business, financial condition and results of operations.
We may have additional tax liabilities.
We are subject to income taxes in the U.S. and many foreign jurisdictions and are commonly audited byvarious tax authorities. In the ordinary course of our business, there are many transactions and calculations wherethe ultimate tax determination is uncertain. Significant judgment is required in determining our worldwideprovision for income taxes. Although we believe that our tax estimates are reasonable, the final determination oftax audits and any related litigation could be materially different from our historical income tax provisions andaccruals. The results of an audit or litigation could have a material, adverse effect on our financial statements inthe period or periods for which that determination is made.
Our leverage and debt service obligations could adversely affect our business.
As of December 31, 2018, our total consolidated external debt was approximately $1.4 billion. (See Item 7for a discussion of our consolidated external debt.) We may also incur additional indebtedness in the future. Oursubstantial indebtedness could have material, adverse consequences, including:
• making it more difficult for us to satisfy our financial obligations;
• increasing our vulnerability to adverse economic, regulatory and industry conditions, and placing us ata disadvantage compared to our competitors that are less leveraged;
23
• limiting our ability to compete and our flexibility in planning for, or reacting to, changes in ourbusiness and the industry in which we operate; and
• limiting our ability to borrow additional funds for working capital, capital expenditures, acquisitionsand general corporate or other purposes.
Our debt service obligations will require us to use a portion of our operating cash flow to pay interest andprincipal on indebtedness instead of for other corporate purposes, including funding future expansion of ourbusiness, acquisitions, and ongoing capital expenditures, which could impede our growth. In addition, theCompany may attempt to refinance or extend this obligation depending on prevailing market conditions. Ourability to refinance or extend this obligation will depend on our operating and financial performance, which inturn is subject to prevailing economic conditions and financial, business and other factors beyond ourcontrol. Any disruptions in our operations, the financial markets, or overall economy may adversely affect theavailability and cost of credit to us.
It could be difficult to replace some of our suppliers.
Outside vendors, some of whom are sole-source suppliers, provide key components and raw materials usedin the manufacture of our products. Although we believe that alternative sources for many of these componentsand raw materials are available, any interruption in supply of a limited or sole-source component or raw materialcould harm our ability to manufacture our products until a new or alternative source of supply is identified andqualified. In addition, an uncorrected defect or supplier’s variation in a component or raw material, eitherunknown to us or incompatible with our manufacturing process, could harm our ability to manufacture products.We may not be able to find a sufficient alternative supplier in a reasonable time period, or on commerciallyreasonable terms, if at all, and our ability to produce and supply our products could be impaired. We believe thatthese factors are most likely to affect the following products that we manufacture:
• our collagen-based products, such as the Integra Dermal Regeneration Template and wound matrixproducts, the DuraGen® family of products, our Absorbable Collagen Sponges, Primatrix andSurgiMend products;
• our products made from silicone, such as our neurosurgical shunts and drainage systems andhemodynamic shunts;
• products which use many different specialty parts from numerous suppliers, such as our intracranialmonitors, catheters and headlights;
• products that use pyrolytic carbon (i.e., PyroCarbon) technology, such as certain of our reconstructiveextremity orthopedic implants;
• products which are amniotic tissue based;
• products that use medical grade leptospermum honey, such as our Medihoney products; and
• our TCC-EZ ® total contact cast system products.
In connection with our Confluent Surgical acquisition in January 2014, we entered into a multi-year supplyagreement with an affiliate of the seller to continue to manufacture the acquired surgical sealant and adhesionbarrier product lines. Pursuant to a contract we entered in 2015, we transferred manufacturing of these productlines to a third party in 2018.
If we were suddenly unable to purchase products or services from one or more of the companies identifiedabove, we would need a significant period of time to qualify a replacement, and the production of any affectedproducts could be disrupted, which could have a material, adverse effect on our financial condition and businessoperations.
24
While it is our policy to maintain sufficient inventory of components so that our production will not besignificantly disrupted even if a particular component or material is not available for a period of time, we remainat risk that we will not be able to qualify new components or materials quickly enough to prevent a disruption ifone or more of our suppliers ceases production of important components or materials.
Our intellectual property rights may not provide meaningful commercial protection for our products,potentially enabling third parties to use our technology or very similar technology and could reduce ourability to compete in the market.
To compete effectively, we depend, in part, on our ability to maintain the proprietary nature of ourtechnologies and manufacturing processes, which includes the ability to obtain, protect and enforce patents onour technology and to protect our trade secrets. We own or have licensed patents that cover aspects of some ofour product lines. Our patents, however, may not provide us with any significant competitive advantage. Othersmay challenge our patents and, as a result, our patents could be narrowed, invalidated or rendered unenforceable.Competitors may develop products similar to ours that our patents do not cover. In addition, the approval orrejection of patent applications may take several years and our current and future patent applications may notresult in the issuance of patents in the U.S. or foreign countries.
Our competitive position depends, in part, upon unpatented trade secrets, which we may be unable toprotect.
Our competitive position also depends upon unpatented trade secrets, which are difficult to protect. Wecannot assure you that others will not independently develop substantially equivalent proprietary information andtechniques or otherwise gain access to our trade secrets, that our trade secrets will not be disclosed or that we caneffectively protect our rights to unpatented trade secrets.
In an effort to protect our trade secrets, we require our employees, consultants and advisors to executeconfidentiality and invention assignment agreements upon commencement of employment or consultingrelationships with us. These agreements provide that, except in specified circumstances, all confidentialinformation developed or made known to the individual during the course of their relationships with us must bekept confidential. We cannot assure you, however, that these agreements will provide meaningful protection forour trade secrets or other proprietary information in the event of the unauthorized use or disclosure ofconfidential information.
Our success will depend partly on our ability to operate without infringing or misappropriating theproprietary rights of others.
We may be sued for infringing the intellectual property rights of others. In addition, we may find itnecessary, if threatened, to initiate a lawsuit seeking a declaration from a court that we do not infringe theproprietary rights of others or that their rights are invalid or unenforceable. If we do not prevail in any litigation,in addition to any damages we might have to pay, we would be required to stop the infringing activity (whichcould include a cessation of selling the products in question) or obtain a license for the proprietary rightsinvolved. Any required license may be unavailable to us on acceptable terms, if at all. In addition, some licensesmay be nonexclusive and allow our competitors to access the same technology we license.
If we fail to obtain a required license or are unable to design our products so as not to infringe on theproprietary rights of others, we may be unable to sell some of our products, and this potential inability could havea material, adverse effect on our revenues and profitability.
We may be involved in lawsuits relating to our intellectual property rights and promotional practices, whichmay be expensive.
To protect or enforce our intellectual property rights, we may have to initiate or defend legal proceedings,such as infringement suits or opposition proceedings, against or by third parties. In addition, we may have to
25
institute proceedings regarding our competitors’ promotional practices or defend proceedings regarding ourpromotional practices. Legal proceedings are costly, and, even if we prevail, the cost of the legal proceedingscould affect our profitability. In addition, litigation is time-consuming and could divert management’s attentionand resources away from our business. Moreover, in response to our claims against other parties, those partiescould assert counterclaims against us.
If we do not successfully integrate newly acquired businesses into our business operations, includingCodman Neurosurgery, our business could be materially and adversely affected.
We will need to successfully integrate the operations of recently and pending acquired businesses, includingour acquisition of Codman Neurosurgery, with our business operations. The failure to integrate the businessoperations of the acquired businesses successfully would have a material, adverse effect on our business,financial condition and results of operations. As a result of these acquisitions, we will undergo substantialchanges in a short period of time and our business will change and broaden in size and the scope of products weoffer. Integrating the operations of multiple new businesses with that of our own is a complex, costly and time-consuming process, which requires significant management attention and resources, including the coordination ofinformation technologies, sales and marketing, research and development, operations, manufacturing and financefunctions. The integration process could disrupt the businesses and, if implemented ineffectively, could precluderealization of the full benefits that we expect from these transactions. Our failure to meet the challenges involvedin integrating the businesses in order to realize the anticipated benefits of the acquisitions could cause aninterruption of, or a loss of momentum in, our activities and could materially and adversely affect our results ofoperations. Prior to each acquisition, the acquired business operated independently, with its own business,corporate culture, locations, employees and systems. There may be substantial difficulties, costs and delaysinvolved in any integration of other businesses with that of our own. These may include:
• distracting management from day-to-day operations;
• potential incompatibility of corporate cultures;
• an inability to achieve synergies as planned;
• risks associated with the assumption of contingent or other liabilities of acquisition targets;
• adverse effects on existing business relationships with suppliers or customers, including failure toretain key customers and suppliers;
• failure to retain key employees of our company and of the acquired businesses;
• inheriting and uncovering previously unknown issues, problems and costs from the acquired company;
• delays between our expenditures to acquire new products, technologies or businesses and thegeneration of revenues from those acquired products, technologies or businesses;
• realization of assets and settlement of liabilities at amounts equal to estimated fair value as of theacquisition date of any acquisition or disposition;
• an inability to integrate information technology systems of acquired businesses in a secure and reliablemanner;
• costs and delays in implementing common systems and procedures (including technology, complianceprograms, financial systems, distribution and general business operations, among others);
• liabilities that are significantly larger than we currently anticipate and unforeseen increased expenses ordelays associated with the acquisitions, including transition costs to integrate the businesses that mayexceed the costs that we currently anticipate;
• challenges involved with the increased scale of our operations resulting from the acquisitions; and
• increased difficulties in managing our business due to the addition of international locations.
26
These risks may be heightened in cases where the majority of the former businesses’ operations, employeesand customers are located outside the U.S. Any one or all of these factors could increase operating costs or loweranticipated financial performance. Many of these factors are also outside of our control. In addition, dispositionsof certain key products, technologies and other rights, including pursuant to conditions imposed on us to obtainregulatory approvals, may affect our business operations.
In connection with the acquisition of the Codman Neurosurgery business from Johnson & Johnson, weentered into certain transition services agreements with Johnson & Johnson under which they are providingcertain manufacturing, distribution and other services to the Company. While we have transitioned off of certainof the transition services, any interruption in, or inability of Johnson & Johnson to provide, these services for anyreason could have a material, adverse effect on our business, financial condition and results of operations.
Even if the operations of the businesses are integrated successfully, we may not realize the full benefits ofthe acquisition, including the synergies, cost savings or sales or growth opportunities that we expect. Thesebenefits may not be achieved within the anticipated time frame, or at all. Additional unanticipated costs could beincurred in the integration of the businesses. All of these factors could cause a reduction to our earnings pershare, decrease or delay the expected accretive effect of the transaction, and negatively impact the price of ourordinary shares.
If any of our facilities were damaged and/or our manufacturing or business processes interrupted, we couldexperience lost revenues and our business could be seriously harmed.
Damage to our manufacturing, distribution, development and/or research facilities because of fire, extremeweather conditions, natural disaster, power loss, communications failure, unauthorized entry or other events, suchas a flu or other health epidemic, could significantly disrupt our operations, the operations of suppliers andcritical infrastructure and delay or prevent product manufacture and shipment during the time required to repair,rebuild or replace the damaged facilities. Certain of our manufacturing facilities are located in Puerto Rico,which in the past has experienced both severe earthquakes and other natural disasters. We believe the riskassociated with operating a manufacturing plant in Puerto Rico, post Hurricane Maria, has returned to historicallevels. While there are still some challenges with the energy system and service is occasionally disrupted forshort periods, it has not impacted operations primarily due to the generator capacity at the plant. Although wemaintain property damage and business interruption insurance coverage on these facilities, our insurance mightnot cover all losses under such circumstances, and we may not be able to renew or obtain such insurance in thefuture on acceptable terms with adequate coverage or at reasonable costs.
In addition, certain of our surgical instruments have some manufacturing processes performed by thirdparties in Pakistan, and we purchase a much smaller amount of instruments directly from vendors there. Pakistanis subject to political instability and unrest. Such instability could interrupt our ability to sell surgical instrumentsto our customers and could have a material, adverse effect on our revenues and earnings. While we havedeveloped a relationship with an alternative provider of these services in another country, and continue to workto develop other providers in other countries, we cannot guarantee that we will be completely successful inestablishing all of these relationships. Even if we are successful in establishing all of these alternativerelationships, we cannot guarantee that we will be able to do so at the same level of costs or that we will be ableto pass along additional costs to our customers.
Further, we manufacture certain products in Europe and our European headquarters is located in France,which has experienced labor strikes and acts of terrorism. Thus far, strikes and acts of terrorism have not had amaterial impact on our business; however, if either were to occur, there is no assurance that they would notdisrupt our business, and any such disruption could have a material, adverse effect on our business.
An experienced third-party hosts and maintains the enterprise business system used to support certain of ourtransaction processing for accounting and financial reporting, supply chain and manufacturing. Currently, we
27
have developed a comprehensive disaster recovery plan for the Company’s infrastructure. As we have not fullytested the plan, we have adopted alternative solutions to mitigate business risk, including backup equipment,power and communications. We also implemented a comprehensive backup and recovery process for our keyapplications. Our global production and distribution operations are dependent on the effective management ofinformation flow between facilities. An interruption of the support provided by our enterprise business systemscould have a material, adverse effect on the business.
We may experience difficulties, delays, performance impact or unexpected costs from consolidation offacilities.
We consolidated several facilities in recent years and may further consolidate our operations in the future inorder to improve our cost structure, achieve increased operating efficiencies, and improve our competitivestanding or results of operations and/or to address unfavorable economic conditions. As part of these initiatives,we may also lose favorable tax incentives or not be able to renew leases on acceptable terms. We may furtherreduce staff, make changes to certain capital projects, close certain production operations and abandon leases forcertain facilities that will not be used in our operations. In conjunction with any actions, we will continue tomake significant investments and build the framework for our future growth. We may not realize, in full or inpart, the anticipated benefits and savings from these efforts because of unforeseen difficulties, delays,implementation issues or unexpected costs. If we are unable to achieve or maintain all of the resulting savings orbenefits to our business or other unforeseen events occur, our business and results of operations may be adverselyaffected.
We are exposed to a variety of risks relating to our international sales and operations.
We generate significant revenues outside the U.S. in multiple foreign currencies, and in U.S. dollar-denominated transactions conducted with customers who generate revenue in currencies other than theU.S. dollar. For those foreign customers who purchase our products in U.S. dollars, currency fluctuationsbetween the U.S. dollar and the currencies in which those customers do business may have a negative impact onthe demand for our products in foreign countries where the U.S. dollar has increased in value compared to thelocal currency.
Since we have operations based outside the U.S. and we generate revenues and incur operating expenses inmultiple foreign currencies, we experience currency exchange risk with respect to those foreign currency-denominated revenues and expenses. Our most significant currency exchange risk relates to transactionsconducted in Australian dollars, British pounds, Canadian dollars, Chinese yuan, euros, Japanese yen, and Swissfrancs.
We cannot predict the consolidated effects of exchange rate fluctuations upon our future operating resultsbecause of the number of currencies involved, the variability of currency exposure and the potential volatility ofcurrency exchange rates. Although we address currency risk management through regular operating andfinancing activities, and, on a limited basis, through the use of derivative financial instruments, those actions maynot prove to be fully effective. For a description of our use of derivative financial instruments, see Note 6,Derivative Instruments in our consolidated financial statements.
Our international operations subject us to laws regarding sanctioned countries, entities and persons,customs, import-export, laws regarding transactions in foreign countries, the U.S. Foreign Corrupt Practices Actand local anti-bribery and other laws regarding interactions with healthcare professionals, and productregistration requirements. Among other things, these laws restrict, and in some cases prevent, U.S. companiesfrom directly or indirectly selling goods, technology or services to people or entities in certain countries. Inaddition, these laws require that we exercise care in structuring our sales and marketing practices and effectingproduct registrations in foreign countries.
28
On June 23, 2016, the United Kingdom (UK) held a referendum in which voters approved an exit from theEU, commonly referred to as “Brexit.” As a result of the referendum, the British government began negotiatingthe terms of the UK’s future relationship with the EU. Until the terms of the UK’s exit from the EU on March 29,2019 are determined, including any transition period, it is difficult to predict its impact. It is possible that thewithdrawal could, among other things, affect the legal and regulatory environments to which our business issubject, impose greater restrictions on imports and exports between the UK and the EU and other parties, andcreate economic and political uncertainty in the region.
From time to time, proposals are made to significantly change existing trade agreements and relationshipsbetween the U.S. and other countries. Recently, the U.S. and China have imposed tariffs on products importedinto their respective countries. While we currently do not anticipate that these tariffs will have a material impacton our business, the list of items subject to these tariffs could change and it is possible that they could adverselyimpact our supply chain costs or our ability to sell certain of our products in China. More generally, additionaltariffs or other trade barriers imposed by the U.S. or other countries could materially and adversely affect ouroperations and financial results.
Oversight of the medical device industry might affect the manner in which we may sell medical devices andcompete in the marketplace.
There are laws and regulations that govern the means by which companies in the healthcare industry maymarket their products to healthcare professionals and may compete by discounting the prices of their products,including for example, the federal Anti- Kickback Statute, the federal False Claims Act, the federal HealthInsurance Portability and Accountability Act of 1996, state law equivalents to these federal laws that are meant toprotect against fraud and abuse and analogous laws in foreign countries. Violations of these laws are punishableby criminal and civil sanctions, including, but not limited to, in some instances civil and criminal penalties,damages, fines, exclusion from participation in federal and state healthcare programs, including Medicare andMedicaid. Although we exercise care in structuring our sales and marketing practices and customer discountarrangements to comply with those laws and regulations, we cannot assure that:
• government officials charged with responsibility for enforcing those laws will not assert that our salesand marketing practices or customer discount arrangements are in violation of those laws orregulations; or
• government regulators or courts will interpret those laws or regulations in a manner consistent with ourinterpretation.
Correspondingly, federal and state laws are also sometimes open to interpretation, and from time to time wemay find ourselves at a competitive disadvantage if our interpretation differs from that of our competitors.AdvaMed (for the U.S. and China), MedTech Europe (Europe), Mecomed (Middle East), and APACMed (AsiaPacific), some of the principal trade associations for the medical device industry, promulgate model codes ofethics that set forth standards by which its members should (and non-member companies may) abide in thepromotion of their products. We have in place policies and procedures for compliance that we believe are at leastas stringent as those set forth in the AdvaMed Code, and we regularly train our sales and marketing personnel onour policies regarding sales and marketing practices. Pursuant to the AdvaMed Code, we have certified ouradoption of the AdvaMed Code. Nevertheless, the sales and marketing practices of our industry have been thesubject of increased scrutiny from federal and state government agencies, and we believe that this trend willcontinue. Various hospital organizations, medical societies and trade associations are establishing their ownpractices that may require detailed disclosures of relationships between healthcare professionals and medicaldevice companies or ban or restrict certain marketing and sales practices such as gifts and business meals.
29
Our private-label product lines depend significantly on key relationships with third parties, which we couldbe unable to establish and maintain.
Our private-label business depends in part on our entering into and maintaining long-term supplyagreements with third parties. The third parties with whom we have entered into agreements might terminatethese agreements for a variety of reasons, including developing other sources for the products that we supply.Termination of our most important relationships could adversely affect our expectations for the growth ofprivate-label products.
We may have significant product liability exposure and our insurance may not cover all potential claims.
We are exposed to product liability and other claims if our technologies or products are alleged to havecaused harm. We may not be able to obtain insurance for the potential liability on acceptable terms with adequatecoverage or at reasonable costs. Any potential product liability claims could exceed the amount of our insurancecoverage or may be excluded from coverage under the terms of the policy. Our insurance may not be renewed ata cost and level of coverage comparable to that then in effect.
We are subject to requirements relating to hazardous materials which may impose significant compliance orother costs on us.
Our manufacturing, product development, research, and development operations and processes involve thecontrolled use of certain hazardous materials. In addition, we own and/or lease a number of facilities at whichhazardous materials have been used in the past. Finally, we have acquired various companies that historicallyhave used certain hazardous materials and that have owned and/or leased facilities at which hazardous materialshave been used. For all of these reasons, we are subject to federal, state, foreign, and local laws and regulationsgoverning the use, manufacture, storage, transportation, handling, treatment, remediation, and disposal ofhazardous materials and certain waste products (“Environmental, Health, Safety and Transportation Laws”).Although we believe that our procedures for handling, transporting, and disposing of hazardous materials complywith the Environmental, Health, Safety and Transportation Laws, the Environmental Health, Safety andTransportation Laws may be amended in ways that increase our cost of compliance, perhaps materially.
Furthermore, the potential risk of accidental contamination or injury from these materials cannot beeliminated, and there is also a risk that such contamination previously has occurred in connection with one of ourfacilities or in connection with one of the companies we have purchased. In the event of such an accident orcontamination, we could be held liable for any damages that result and any related liability could exceed thelimits or fall outside the coverage of our insurance and could exceed our resources. We may not be able tomaintain insurance on acceptable terms or at all.
Cyber-attacks or other disruptions to our information technology systems could adversely affect ourbusiness.
We are increasingly dependent on sophisticated information technology for our infrastructure and to supportbusiness decisions. As a result of technology initiatives, recently enacted regulations, changes in our systemplatforms and integration of new business acquisitions, we have been consolidating and integrating our systems.Our information systems require an ongoing commitment of significant resources to maintain, protect, andenhance existing systems and develop new systems to keep pace with continuing changes in informationprocessing technology, evolving systems and regulatory standards, the increasing need to protect patient andcustomer information, and changing customer patterns. Any significant breakdown, intrusion, interruption,corruption, or destruction of these systems, as well as any data breaches, could have a material, adverse effect onour business.
In addition, third parties may attempt to breach our systems and may obtain data relating to patients, theCompany’s proprietary information, or other sensitive data. If we fail to maintain or protect our information
30
systems and data integrity effectively, we could lose existing customers, have difficulty attracting newcustomers, suffer backlash from negative public relations, have problems in determining product cost estimatesand establishing appropriate pricing, have difficulty preventing, detecting, and controlling fraud, have disputeswith customers, physicians, and other health care professionals, have regulatory sanctions or penalties imposed,have increases in operating expenses, incur expenses or lose revenues as a result of a data privacy breach, orsuffer other adverse consequences.
We have programs, processes and technologies in place to prevent, detect, contain, respond to and mitigatesecurity related threats and potential incidents. We undertake considerable ongoing improvements to oursystems, connected devices and information-sharing products in order to minimize vulnerabilities, in accordancewith industry and regulatory standards. Because the techniques used to obtain unauthorized access changefrequently and can be difficult to detect, anticipating, identifying or preventing these intrusions or mitigatingthem if and when they occur, may be challenging.
We also rely on third party vendors to supply and/or support certain aspects of our information technologysystems. Third party systems may contain defects in design or manufacture or other problems that could result insystem disruption or unexpectedly compromise the information security of our own systems, and we aredependent on these third parties to provide reliable systems and software and to deploy appropriate securityprograms to protect their systems.
In addition, we continue to grow in part through new business acquisitions. As a result of acquisitions, wemay face risks due to implementation, modification, or remediation of controls, procedures, and policies relatingto data privacy and cybersecurity at the acquired business. We continue to consolidate and integrate the numberof systems we operate, and to upgrade and expand our information system capabilities for stable and securebusiness operations.
If we are unable to maintain reliable information technology systems and prevent disruptions, outages, ordata breaches, we may suffer regulatory consequences in addition to business consequences. Our worldwideoperations mean that we are subject to laws and regulations, including data protection and cyber security lawsand regulations, in many jurisdictions. The variety of U.S. and international privacy and cybersecurity laws andregulations impacting our operations are described in “Item 1. Business—Government Regulation—OtherFactors—Data Privacy and Cybersecurity Laws and Regulations.” We have programs to ensure compliance withsuch laws and regulations. However, there is no guarantee that we will avoid enforcement actions bygovernmental bodies. Enforcement actions may be costly and interrupt regular operations of our business. Inaddition, there has been a developing trend of civil lawsuits and class actions relating to breaches of consumerdata held by large companies or incidents arising from other cyber-attacks. While Integra has not been named inany such suits, if a substantial breach or loss of data were to occur, we could become a target of such litigation.
Changes in the calculation and or complete replacement of LIBOR could have an impact on our business.
The United Kingdom’s Financial Conduct Authority, which regulates LIBOR, announced in July 2017 thatit will no longer persuade or require banks to submit rates for LIBOR after 2021. This announcement and globalfinancial benchmark reforms generally have resulted in the future of certain interest rate benchmarks being moreuncertain. There is a chance that LIBOR may be disrupted, materially change, or no longer be published in thefuture. Currently, there is no definitive information regarding the future of LIBOR or a replacement rate. Wehave multiple debt facilities which bear interest at a variable rate equal to the Eurodollar LIBOR rate in effectfrom time to time. A change or transition away from LIBOR as a common reference rate in the global financialmarket could have a material, adverse effect on our business. Management continues to monitor the status anddiscussions regarding LIBOR.
31
ITEM 1B. UNRESOLVED STAFF COMMENTS
As of the filing of this Annual Report on Form 10-K, we had no unresolved comments from the staff of theSecurities and Exchange Commission that were received not less than 180 days before the end of our 2018 fiscalyear.
ITEM 2. PROPERTIES
Our principal executive offices are located in Plainsboro, New Jersey. Our principal manufacturing andresearch facilities are located in New Jersey, Ohio, Pennsylvania, Massachusetts, Tennessee, Canada, France,Germany, Ireland, Switzerland, and Puerto Rico. Our instrument procurement operations are located in Germany.Our primary distribution centers are located in Nevada, Ohio, Pennsylvania, Kentucky, Australia, Belgium,Canada and France. In addition, we lease several smaller facilities to support additional administrative, assembly,and distribution operations. Third parties own and operate the facilities in Nevada, Kentucky and Belgium. Weown our facilities in Biot, France, Saint Aubin Le Monial, France, Rietheim-Weilheim, Germany, Ohio, andPennsylvania and we lease all of our other facilities. We also have repair centers in California, Massachusetts,Ohio, Australia and Germany.
Our manufacturing facilities are registered with the FDA. Our facilities are subject to FDA inspection toensure compliance with Quality System regulations. For further information regarding the status of FDAinspections, see the “Government Regulation” and “Management’s Discussion and Analysis of FinancialCondition and Results of Operations—Update on Remediation Activities” sections in this Form 10-K.
ITEM 3. LEGAL PROCEEDINGS
Various lawsuits, claims and proceedings are pending or have been settled by us; the most significant ofwhich are described below.
The Company is subject to various claims, lawsuits and proceedings in the ordinary course of theCompany’s business, including claims by current or former employees, distributors and competitors and withrespect to its products and product liability claims, lawsuits and proceedings, some of which have been settled bythe Company. In the opinion of management, such claims are either adequately covered by insurance orotherwise indemnified, or are not expected, individually or in the aggregate, to result in a material, adverse effecton our financial condition. However, it is possible that the Company’s results of operations, financial positionand cash flows in a particular period could be materially affected by these contingencies.
TEI
TEI, acquired by Integra on July 17, 2015, manufactures a bovine-derived surgical mesh product for BostonScientific Corporation (“BSC”) and has been named as a defendant in lawsuits under a broad range of productsliability theories, many of which have not been served on TEI. As of January 14, 2019, only one active caseremained against TEI. Pursuant to an indemnification agreement with BSC (i) BSC is managing the litigation;and (ii) TEI has in place a product liability insurance policy, of which it must exhaust $3.0 million before BSC’sindemnity begins to cover relevant claims (and of which only a small portion has been utilized to date andagainst which the insurer has reserved the entire $3.0 million ). In addition, Integra has certain protections in themerger agreements with TEI which would indemnify it for approximately $30.0 million for the first fifteenmonths after closing and between $20.0 and $30.0 million for the remainder of the three -year period afterclosing for losses relating to a variety of matters, including half of certain products liability claims (includingthose related to the product it manufactures for BSC) not covered by insurance. As of December 31, 2018, noindemnification payments were received nor owed in relation to the lawsuits.
32
BioD
On April 7, 2017, the Company’s indirect wholly-owned subsidiary, BioD filed an action in the SuperiorCourt of New Jersey, Chancery Division, Middlesex County seeking a declaration that the resignation of RussellOlsen, the former CEO of BioD, was “for Good Reason” (as defined in Olsen’s employment agreement); afinding that Olsen breached the implied covenant of good faith and fair dealing, committed legal fraud, equitablefraud and negligent misrepresentation; and an award of damages for such actions, including a return of severancefees paid to Olsen. BioD was acquired in August 2016 by Derma Sciences, which Integra subsequently acquiredin February 2017. After receiving a job offer from Integra that Olsen believed materially diminished his title andauthority, on February 24, 2017 Olsen indicated his intention to terminate his position with BioD for GoodReason, as otherwise permitted by his employment agreement with BioD. Shortly thereafter, Cynthia Weatherly(as representative of the former equity owners of BioD) claimed in a letter to Derma Sciences that Olsen’sresignation was a “termination Without Cause” (as also defined in Olsen’s employment agreement), which wouldarguably trigger an acceleration of the earn out under a merger agreement between Derma Sciences, BioD andother parties (the “BioD Merger Agreement”), which was entered into in July 2016, and require as a result of theacceleration the payment of $26.5 million by BioD. As previously disclosed and described inNote 4—Acquisitions and Pro Forma Results, Integra assumed this contingent liability in connection with itsacquisition of Derma Sciences. The action for a declaratory judgment was filed to clarify that Olsen’stermination was for Good Reason and not Without Cause. If the employment agreement was terminated for GoodReason, then the Company believes that the earn out provision under the BioD Merger Agreement should not beaccelerated and the likelihood of loss is remote.
The Company accrues for loss contingencies when it is deemed probable that a loss has been incurred andthat loss is estimable. The amounts accrued are based on the full amount of the estimated loss before consideringinsurance proceeds, and do not include an estimate for legal fees expected to be incurred in connection with theloss contingency. The Company consistently accrues legal fees expected to be incurred in connection with losscontingencies as those fees are incurred by outside counsel as a period cost.
ITEM 4. MINE SAFETY DISCLOSURES
Not applicable.
33

PART II
ITEM 5. MARKET FOR REGISTRANT’S COMMON EQUITY, RELATED STOCKHOLDER MATTERSAND ISSUER PURCHASES OF EQUITY SECURITIES
Market Information, Holders and Dividends
Our common stock trades on The NASDAQ Global Market under the symbol “IART.” The following tablelists the high and low closing sales prices for our common stock for each quarter for the last two years:
2018 2017
High Low High Low
Fourth Quarter $64.51 $42.62 $51.77 $46.22
Third Quarter $65.87 $57.63 $55.76 $47.80
Second Quarter $67.23 $54.05 $54.54 $40.86
First Quarter $57.38 $46.55 $44.90 $41.09
We have not paid any cash dividends on our common stock since our formation. Our credit facility limitsthe amount of dividends that we may pay. See “Item 7. Management’s Discussion and Analysis of FinancialCondition and Results of Operations—Liquidity and Capital Resources—Amended and Restated Senior CreditAgreement.” Any future determinations to pay cash dividends on the common stock will be at the discretion ofour Board of Directors and will depend upon our results of operations, cash flows, and financial condition andother factors deemed relevant by the Board of Directors.
The number of stockholders of record as of February 22, 2019 was approximately 971, which includesstockholders whose shares were held in nominee name.
Sales of Unregistered Securities
There were no sales of unregistered securities during the years ended December 31, 2018, 2017 or 2016.
Sale of Registered Securities
In May 2018, the Company commenced and closed on a public offering of common stock. The Companyissued 6.0 million shares of common stock and received total proceeds, net of underwriting fees and offeringexpenses, of approximately $349.6 million. The net proceeds from the offering were used to reduce outstandingborrowings under the revolving credit portion of the Company’s Senior Credit Facility.
Issuer Purchases of Equity Securities
On December 11, 2018, the Board of Directors authorized the Company to repurchase up to $225.0 millionof the Company’s common stock. The program allows the Company to repurchase its shares opportunisticallyfrom time to time. The repurchase authorization expires in December 2020. Purchases may be affected throughone or more open market transactions, privately negotiated transactions, transactions structured throughinvestment banking institutions, or a combination of the foregoing. This stock repurchase authorization replacesthe previous $150.0 million stock repurchase authorization, approved by the Board in 2016.
There have been no shares of common stock repurchased by the Company for the years ended December 31,2018, 2017 or 2016.
See Note 8, Treasury Stock, in our consolidated financial statements for further details.
34
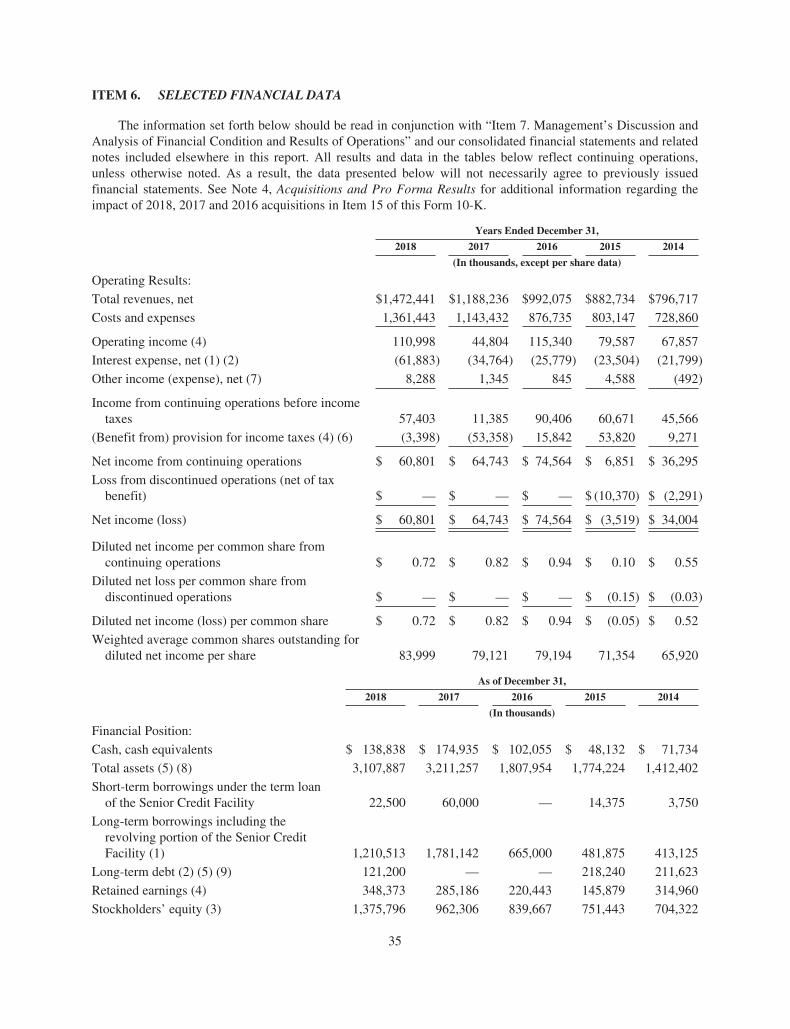
ITEM 6. SELECTED FINANCIAL DATA
The information set forth below should be read in conjunction with “Item 7. Management’s Discussion andAnalysis of Financial Condition and Results of Operations” and our consolidated financial statements and relatednotes included elsewhere in this report. All results and data in the tables below reflect continuing operations,unless otherwise noted. As a result, the data presented below will not necessarily agree to previously issuedfinancial statements. See Note 4, Acquisitions and Pro Forma Results for additional information regarding theimpact of 2018, 2017 and 2016 acquisitions in Item 15 of this Form 10-K.
Years Ended December 31,
2018 2017 2016 2015 2014
(In thousands, except per share data)
Operating Results:
Total revenues, net $1,472,441 $1,188,236 $992,075 $882,734 $796,717
Costs and expenses 1,361,443 1,143,432 876,735 803,147 728,860
Operating income (4) 110,998 44,804 115,340 79,587 67,857
Interest expense, net (1) (2) (61,883) (34,764) (25,779) (23,504) (21,799)
Other income (expense), net (7) 8,288 1,345 845 4,588 (492)
Income from continuing operations before incometaxes 57,403 11,385 90,406 60,671 45,566
(Benefit from) provision for income taxes (4) (6) (3,398) (53,358) 15,842 53,820 9,271
Net income from continuing operations $ 60,801 $ 64,743 $ 74,564 $ 6,851 $ 36,295
Loss from discontinued operations (net of taxbenefit) $ — $ — $ — $ (10,370) $ (2,291)
Net income (loss) $ 60,801 $ 64,743 $ 74,564 $ (3,519) $ 34,004
Diluted net income per common share fromcontinuing operations $ 0.72 $ 0.82 $ 0.94 $ 0.10 $ 0.55
Diluted net loss per common share fromdiscontinued operations $ — $ — $ — $ (0.15) $ (0.03)
Diluted net income (loss) per common share $ 0.72 $ 0.82 $ 0.94 $ (0.05) $ 0.52
Weighted average common shares outstanding fordiluted net income per share 83,999 79,121 79,194 71,354 65,920
As of December 31,
2018 2017 2016 2015 2014
(In thousands)
Financial Position:
Cash, cash equivalents $ 138,838 $ 174,935 $ 102,055 $ 48,132 $ 71,734
Total assets (5) (8) 3,107,887 3,211,257 1,807,954 1,774,224 1,412,402
Short-term borrowings under the term loanof the Senior Credit Facility 22,500 60,000 — 14,375 3,750
Long-term borrowings including therevolving portion of the Senior CreditFacility (1) 1,210,513 1,781,142 665,000 481,875 413,125
Long-term debt (2) (5) (9) 121,200 — — 218,240 211,623
Retained earnings (4) 348,373 285,186 220,443 145,879 314,960
Stockholders’ equity (3) 1,375,796 962,306 839,667 751,443 704,322
35
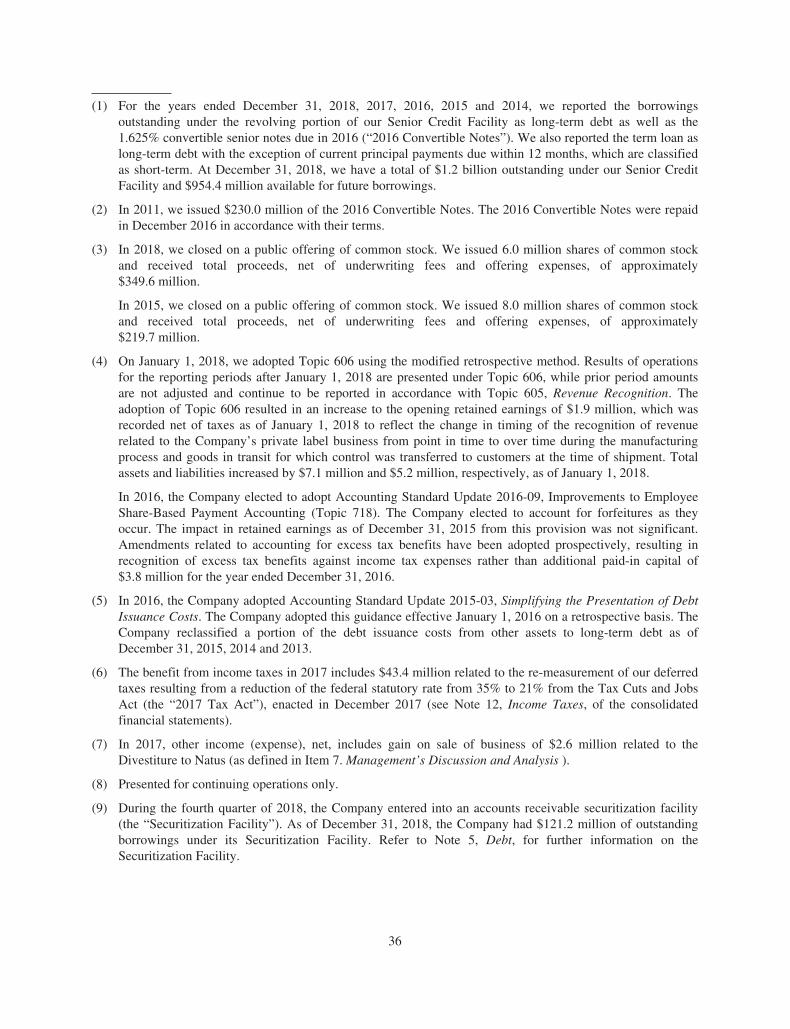
(1) For the years ended December 31, 2018, 2017, 2016, 2015 and 2014, we reported the borrowingsoutstanding under the revolving portion of our Senior Credit Facility as long-term debt as well as the1.625% convertible senior notes due in 2016 (“2016 Convertible Notes”). We also reported the term loan aslong-term debt with the exception of current principal payments due within 12 months, which are classifiedas short-term. At December 31, 2018, we have a total of $1.2 billion outstanding under our Senior CreditFacility and $954.4 million available for future borrowings.
(2) In 2011, we issued $230.0 million of the 2016 Convertible Notes. The 2016 Convertible Notes were repaidin December 2016 in accordance with their terms.
(3) In 2018, we closed on a public offering of common stock. We issued 6.0 million shares of common stockand received total proceeds, net of underwriting fees and offering expenses, of approximately$349.6 million.
In 2015, we closed on a public offering of common stock. We issued 8.0 million shares of common stockand received total proceeds, net of underwriting fees and offering expenses, of approximately$219.7 million.
(4) On January 1, 2018, we adopted Topic 606 using the modified retrospective method. Results of operationsfor the reporting periods after January 1, 2018 are presented under Topic 606, while prior period amountsare not adjusted and continue to be reported in accordance with Topic 605, Revenue Recognition. Theadoption of Topic 606 resulted in an increase to the opening retained earnings of $1.9 million, which wasrecorded net of taxes as of January 1, 2018 to reflect the change in timing of the recognition of revenuerelated to the Company’s private label business from point in time to over time during the manufacturingprocess and goods in transit for which control was transferred to customers at the time of shipment. Totalassets and liabilities increased by $7.1 million and $5.2 million, respectively, as of January 1, 2018.
In 2016, the Company elected to adopt Accounting Standard Update 2016-09, Improvements to EmployeeShare-Based Payment Accounting (Topic 718). The Company elected to account for forfeitures as theyoccur. The impact in retained earnings as of December 31, 2015 from this provision was not significant.Amendments related to accounting for excess tax benefits have been adopted prospectively, resulting inrecognition of excess tax benefits against income tax expenses rather than additional paid-in capital of$3.8 million for the year ended December 31, 2016.
(5) In 2016, the Company adopted Accounting Standard Update 2015-03, Simplifying the Presentation of DebtIssuance Costs. The Company adopted this guidance effective January 1, 2016 on a retrospective basis. TheCompany reclassified a portion of the debt issuance costs from other assets to long-term debt as ofDecember 31, 2015, 2014 and 2013.
(6) The benefit from income taxes in 2017 includes $43.4 million related to the re-measurement of our deferredtaxes resulting from a reduction of the federal statutory rate from 35% to 21% from the Tax Cuts and JobsAct (the “2017 Tax Act”), enacted in December 2017 (see Note 12, Income Taxes, of the consolidatedfinancial statements).
(7) In 2017, other income (expense), net, includes gain on sale of business of $2.6 million related to theDivestiture to Natus (as defined in Item 7. Management’s Discussion and Analysis ).
(8) Presented for continuing operations only.
(9) During the fourth quarter of 2018, the Company entered into an accounts receivable securitization facility(the “Securitization Facility”). As of December 31, 2018, the Company had $121.2 million of outstandingborrowings under its Securitization Facility. Refer to Note 5, Debt, for further information on theSecuritization Facility.
36
ITEM 7. MANAGEMENT’S DISCUSSION AND ANALYSIS OF FINANCIAL CONDITION ANDRESULTS OF OPERATIONS
The following discussion and analysis of our financial condition and results of operations should be readtogether with the selected consolidated financial data and our financial statements and the related notes appearingelsewhere in this report. This discussion and analysis contains forward-looking statements that involve risks,uncertainties and assumptions. Our actual results may differ materially from those anticipated in these forward-looking statements as a result of many factors, including but not limited to those under the heading “RiskFactors.”
GENERAL
Integra, headquartered in Plainsboro, New Jersey, is a world leader in medical technology. The Companywas founded in 1989 with the acquisition of an engineered collagen technology platform used to repair andregenerate tissue. Since then, Integra has developed numerous product lines from this technology for applicationsranging from burn and deep tissue wounds, to the repair of dura mater in the brain, and the repair of nerves andtendons. The Company has expanded its base regenerative technology business to include surgical instruments,neurosurgical products, advanced wound care, and orthopedic hardware through a combination of several globalacquisitions and by developing products internally to further meet the needs of its customers.
We manufacture and sell our products in two reportable business segments: Codman Specialty Surgical andOrthopedics and Tissue Technologies. Our Codman Specialty Surgical products offer specialty surgical implantsand instrumentation for a broad range of specialties. This product category includes products and solutions fordural access and repair, precision tools and instruments, advanced energy, cerebral spinal fluid (“CSF”)management and neuro monitoring including market-leading product portfolios used in neurosurgery operationsuites and critical care units. Our Orthopedics and Tissue Technologies products portfolios consists ofdifferentiated regenerative technology products for soft tissue repair and tissue regeneration products, and smallbone fixation and joint replacement hardware products for both upper extremities and lower extremities. Thisbusiness also includes private-label sales of a broad set of our regenerative and wound care medicinetechnologies.
We manufacture many of our products in plants located in the United States (the “U.S.”), Canada, France,Germany, Ireland, Switzerland, and Puerto Rico. We also source most of our handheld surgical instruments,specialty metal and pyrocarbon implants, and dural sealant products through specialized third-party vendors.
Codman Specialty Surgical products are sold through a combination of directly employed salesrepresentatives, distributors and wholesalers, depending on the customer call point. In 2018, we fully integratedthe commercial teams from the acquired Codman Neurosurgery business.
Orthopedics and Tissue Technologies products are sold through directly employed sales representatives,distributors focused on their respective surgical specialties and strategic partners. During 2018, we completed theexpansion of our sales channels by establishing dedicated teams for the extremity orthopedics, acute woundreconstruction, outpatient wound care and surgical reconstruction markets.
Integra is committed to delivering high quality products that positively impact the lives of millions ofpatients and their families. We focus on four key pillars: 1) building an execution-focused culture, 2) achievingrelevant scale, 3) improving agility and innovation, and 4) leading in customer excellence. We believe that bysharpening our focus on these areas through improved planning and communication, optimization of ourinfrastructure, and strategically aligned tuck-in acquisitions, we can build scale, increase competitiveness andachieve our long-term goals.
We aim to achieve growth in our revenues while maintaining strong financial results. While we payattention to any meaningful trend in our financial results, we pay particular attention to measurements that are
37
indicative of long-term profitable growth. These measurements include (1) revenue growth (including organicgrowth and acquisitions), (2) gross margins on total revenues, (3) earnings before interest, taxes, depreciation,and amortization, (4) earnings per diluted share of common stock, and (5) operating cash flows.
To this end, our executive leadership team has established the following key priorities aligned to thisstrategy:
• Strategic Acquisitions. An important part of our strategy is pursuing strategic transactions and licensingagreements that increase relevant scale in the clinical areas in which we compete. In 2018, integratingthe Codman Neurosurgery business, which was acquired from Johnson and Johnson in the previousyear, remained a top priority and we will continue to transition the business throughout 2019. Thisacquisition expanded our portfolio of neurosurgery products and established us as the world leader inneurosurgery. It has also enabled us to bring our entire Integra portfolio to a global market.
• Portfolio Optimization and New Product Introductions. We are investing in innovative productdevelopment to drive a multi-generational pipeline for our key product franchises. Our productdevelopment efforts focus on regenerative technologies and other projects with the potential forsignificant returns on investment. In 2018, we achieved significant milestones in research anddevelopment by successfully launching nine new products. In addition to new product development, weare funding studies to gather clinical evidence to support launches, ensure market access and improvereimbursement for existing products. We also continue to identify low-growth, low-margin productsand product franchises for discontinuation and will continue to look at other ways of optimizing ourportfolio.
• Commercial Channel Investments. With acquisitions, new product introductions and a broader portfolioof products, investing in our sales channels is a core part of our strategy to create specialization andgreater focus on reaching our customers and addressing their needs. Internationally, we have increasedour commercial resources significantly in all markets and are making investments to support our salesorganization and maximize our commercial opportunities. We now have a strong international saleschannel that will deliver our current portfolio as well as position us for expansion. In addition, wecontinue to build upon our leadership brands across our product franchises to enable us to engagehospital systems through enterprise-wide contracts.
• Customer Excellence. We aspire to be ranked as a best-in-class provider and are committed tostrengthen our relationships with all customers. We strive to consistently deliver outstanding customerservice and continue to invest in technologies, systems and processes to improve the way ourcustomers do business with us. Additionally, we expect to build on the success of our professionaleducation programs to drive continued customer appreciation of our growing portfolio of medicaltechnologies globally.
Equity Offering
In May 2018, the Company commenced and closed on a public offering of common stock. The Companyissued 6.0 million shares of common stock and received total proceeds, net of underwriting fees and offeringexpenses of approximately $349.6 million. The net proceeds from the offering were used to reduce outstandingborrowings under the revolving credit portion of the Company’s Senior Credit Facility.
Clinical and Product Development Activities
We continue to invest in collecting clinical evidence to support our existing products and new productlaunches, and to ensure that we obtain market access for broader and more cost-effective solutions. In 2017, weintroduced seven new regenerative technology products, including new sizes of PriMatrix ® and OmniGraft ®,and our largest electromechanical product, the CUSA ® Clarity. In 2018, we launched the CUSA ® Clarityplatform in Japan, AmnioExcel ® Plus, Integra ® XT ankle revision system and Panta ® II in the U.S. We
38
continue to work on advanced shoulder products and are developing a pyrocarbon hemi shoulder product to addto our orthopedic reconstruction portfolio. We launched Panta ® II outside the U.S. during the first quarter of2019. Panta ® II is a new fusion nail used in ankle fixation. In our electromechanical technologies portfolio, weare focused on the development of core clinical applications and anticipate a steady flow of product launches inearly 2019, including the introduction of a new electrosurgery generator, a next generation ICP monitor platformand an innovative customer-centric toolkit for our Certas ™ valve along with additional shunt configurations. Wecontinue to work with several instrument partners to bring new surgical instrument patterns to the market,enabling us to add new instruments with minimal expense and invest in ongoing development, such as in LEDtechnology.
FDA Untitled Letter
On June 22, 2015, the FDA issued an Untitled Letter (the “Untitled Letter”) alleging that BioD LLC’s(“BioD”) morselized amniotic membrane tissue based products do not meet the criteria for regulation as HCT/Pssolely under Section 361 of the Public Health Services Act (“Section 361”) and that, as a result, BioD wouldneed a biologics license to lawfully market those morselized products. Since the issuance of the Untitled Letter,BioD and more recently the Company have been in discussions with the FDA to communicate their disagreementwith the FDA’s assertion that certain products are more than minimally manipulated. The FDA has not changedits position that certain of the BioD acquired products are not eligible for marketing solely under Section 361.
In November 2017, the FDA issued the final guidance document related to human tissue titled, “RegulatoryConsiderations for Human Cells, Tissues, and Cellular and Tissue-Based Products: Minimal Manipulation andHomologous Use” (the “HCT/P Final Guidance”). The HCT/P Final Guidance maintains the FDA’s position thatproducts such as the Company’s morselized amniotic membrane tissue-based products do not meet the criteriafor regulation solely as HCT/Ps. In addition, the FDA articulated a risk-based approach to enforcement and,while some uses for amniotic membrane tissue-based products would have as much as thirty-six months ofenforcement discretion, other high risk uses could be subject to immediate enforcement action. The Companydoes not believe the uses for its amniotic membrane tissue-based products fall into the high-risk category. As ofFebruary 26, 2019 the Company has not received any further notice of enforcement action from the FDAregarding its morselized amniotic tissue-based products. Nonetheless, we can make no assurances that the FDAwill continue to exercise its enforcement discretion with respect to the Company’s morselized amnioticmembrane tissue-based products, and any potential action of the FDA could have a financial impact regarding thesales of such products. The Company has been considering and continues to consider regulatory approvalpathways for its morselized amniotic membrane tissue-based products.
Revenues from BioD morselized amniotic material-based products for the year ended December 31, 2018were less than 1.0% of consolidated revenues.
ACQUISITIONS & DIVESTITURES
Acquisitions
Our growth strategy includes the acquisition of businesses, assets or products lines to increase the breadth ofour offerings and reach of our product portfolios and drive relevant scale to our customers. As a result of severalrecent acquisitions, our financial results for the year ended December 31, 2018 may not be directly comparable tothose of the corresponding prior-year periods. See Note 4—Acquisitions and Pro Forma Results, to ourconsolidated financial statements for a further discussion.
Johnson & Johnson’s Codman Neurosurgery Business
On May 11, 2017, the Company entered into an asset purchase agreement (the “Purchase Agreement”) withDePuy Synthes, Inc., a Delaware corporation (“DePuy Synthes”), a wholly-owned subsidiary of Johnson &
39
Johnson, pursuant to which the Company agreed to acquire certain assets, and assume certain liabilities, ofJohnson & Johnson’s Codman neurosurgery business (the “Codman Acquisition”). The assets and liabilitiessubject to the Codman Acquisition relate to the research, development, manufacturing, marketing, distributionand sale of certain products used in connection with neurosurgery procedures.
On October 2, 2017, based upon the terms and subject to the conditions set forth in the Purchase Agreement,the Codman Acquisition was completed. Under the terms of the Purchase Agreement, the Company paid anaggregate purchase price of $1.014 billion, subject to adjustments set forth in the Purchase Agreement relating tothe book value of inventory transferred to us at the closing of the Codman Acquisition, the book value of certaininventory retained by DePuy Synthes that will be transferred to the Company in the future along with certainprepaid taxes.
Derma Sciences
On February 24, 2017, the Company executed the Agreement and Plan of Merger (the “MergerAgreement”) under which the Company acquired all the outstanding shares of Derma Sciences, Inc., a Delawarecorporation (“Derma Sciences”) for an aggregate purchase price of approximately $210.8 million includingpayment of certain of Derma Sciences’ closing expenses and settlement of stock-based compensation plans of$4.8 million and $4.3 million, respectively. The purchase price consisted of a cash payment to the formershareholders of Derma Sciences of approximately $201.7 million upon the closing of the transaction.
Derma Sciences is a tissue regeneration company focused on advanced wound and burn care that offersproducts to help manage chronic and hard-to-heal wounds, especially those resulting from diabetes and poorvascular functioning.
Divestitures
On September 8, 2017, the Company and certain of its subsidiaries entered into an asset purchase agreement(the “Divestiture Agreement”) with Natus Medical Incorporated (“Natus”), pursuant to which the Companyagreed to divest its Camino Intracranial Pressure monitoring and the U.S. rights to the fixed pressure shuntsbusinesses together with certain of the neurosurgery assets that were acquired as part of the Codman Acquisition(the “Divestiture”). The Divestiture Agreement was entered in connection with the review of the CodmanAcquisition by the Federal Trade Commission and the antitrust authority of Spain. The Divestiture wasconditioned upon completion of the Codman Acquisition.
On October 6, 2017, upon the terms and subject to the conditions set forth in the Divestiture Agreement (seeNote 4—Acquisitions and Pro Forma Results ), the Divestiture was completed and Natus paid an aggregatepurchase price of $46.4 million. Revenues related to the Divestiture included in the Company’s financial resultsfor the period ended December 31, 2017 was $27.0 million.
OPTIMIZATION AND INTEGRATION ACTIVITIES
As a result of our ongoing acquisition strategy and significant growth in recent years, we have undertakencost-saving initiatives to consolidate manufacturing operations, distribution facilities and transfer activities,implement a common ERP system, eliminate duplicative positions, realign various sales and marketing activities,and expand and upgrade production capacity for our regenerative technology products. These efforts are expectedto continue and while we expect a positive impact from ongoing restructuring, integration, and manufacturingtransfer and expansion activities, such results remain uncertain.
40
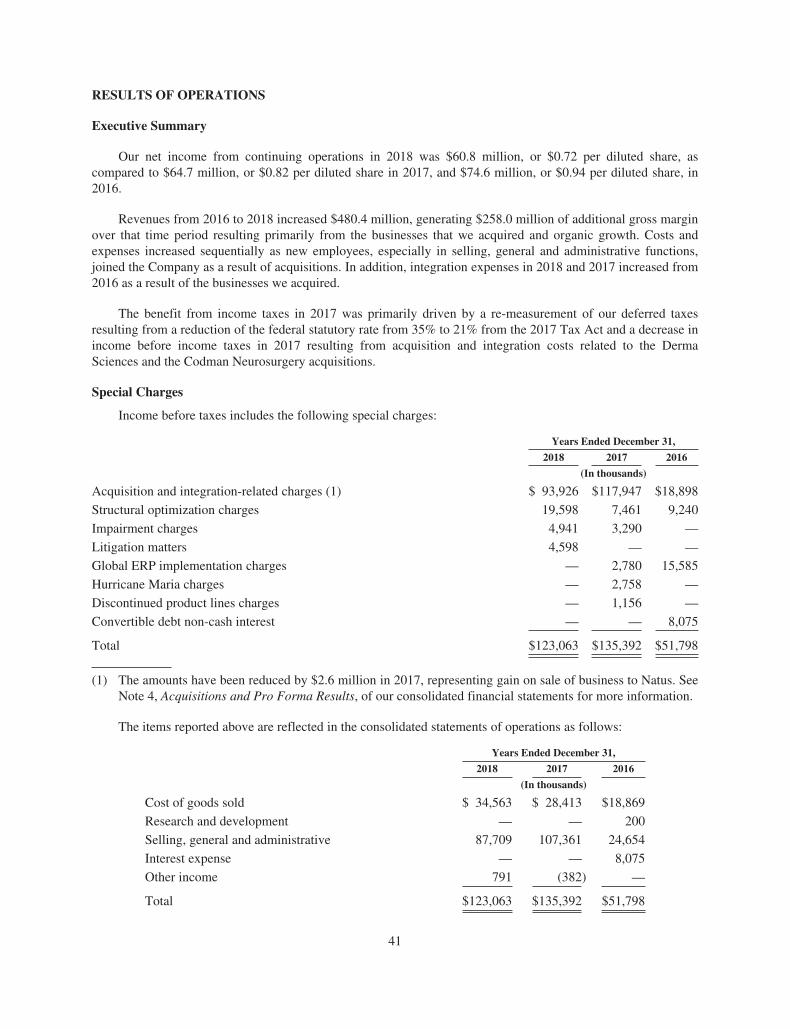
RESULTS OF OPERATIONS
Executive Summary
Our net income from continuing operations in 2018 was $60.8 million, or $0.72 per diluted share, ascompared to $64.7 million, or $0.82 per diluted share in 2017, and $74.6 million, or $0.94 per diluted share, in2016.
Revenues from 2016 to 2018 increased $480.4 million, generating $258.0 million of additional gross marginover that time period resulting primarily from the businesses that we acquired and organic growth. Costs andexpenses increased sequentially as new employees, especially in selling, general and administrative functions,joined the Company as a result of acquisitions. In addition, integration expenses in 2018 and 2017 increased from2016 as a result of the businesses we acquired.
The benefit from income taxes in 2017 was primarily driven by a re-measurement of our deferred taxesresulting from a reduction of the federal statutory rate from 35% to 21% from the 2017 Tax Act and a decrease inincome before income taxes in 2017 resulting from acquisition and integration costs related to the DermaSciences and the Codman Neurosurgery acquisitions.
Special Charges
Income before taxes includes the following special charges:
Years Ended December 31,
2018 2017 2016
(In thousands)
Acquisition and integration-related charges (1) $ 93,926 $117,947 $18,898
Structural optimization charges 19,598 7,461 9,240
Impairment charges 4,941 3,290 —
Litigation matters 4,598 — —
Global ERP implementation charges — 2,780 15,585
Hurricane Maria charges — 2,758 —
Discontinued product lines charges — 1,156 —
Convertible debt non-cash interest — — 8,075
Total $123,063 $135,392 $51,798
(1) The amounts have been reduced by $2.6 million in 2017, representing gain on sale of business to Natus. SeeNote 4, Acquisitions and Pro Forma Results, of our consolidated financial statements for more information.
The items reported above are reflected in the consolidated statements of operations as follows:
Years Ended December 31,
2018 2017 2016
(In thousands)
Cost of goods sold $ 34,563 $ 28,413 $18,869
Research and development — — 200
Selling, general and administrative 87,709 107,361 24,654
Interest expense — — 8,075
Other income 791 (382) —
Total $123,063 $135,392 $51,798
41
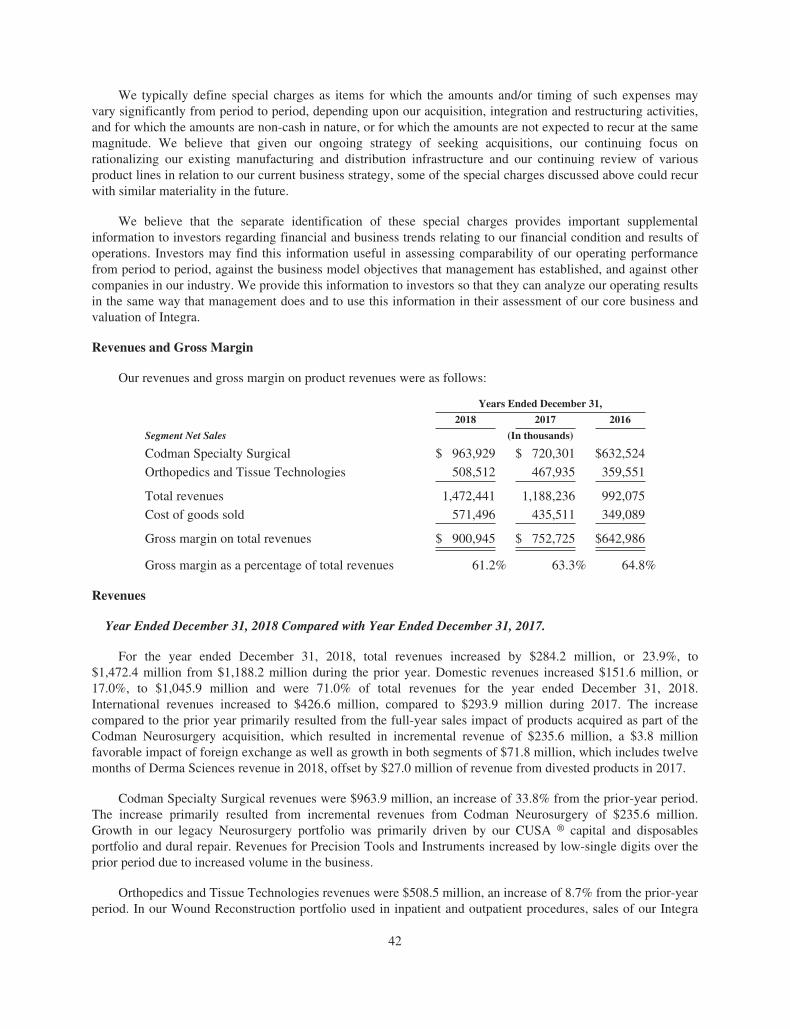
We typically define special charges as items for which the amounts and/or timing of such expenses mayvary significantly from period to period, depending upon our acquisition, integration and restructuring activities,and for which the amounts are non-cash in nature, or for which the amounts are not expected to recur at the samemagnitude. We believe that given our ongoing strategy of seeking acquisitions, our continuing focus onrationalizing our existing manufacturing and distribution infrastructure and our continuing review of variousproduct lines in relation to our current business strategy, some of the special charges discussed above could recurwith similar materiality in the future.
We believe that the separate identification of these special charges provides important supplementalinformation to investors regarding financial and business trends relating to our financial condition and results ofoperations. Investors may find this information useful in assessing comparability of our operating performancefrom period to period, against the business model objectives that management has established, and against othercompanies in our industry. We provide this information to investors so that they can analyze our operating resultsin the same way that management does and to use this information in their assessment of our core business andvaluation of Integra.
Revenues and Gross Margin
Our revenues and gross margin on product revenues were as follows:
Years Ended December 31,
2018 2017 2016
Segment Net Sales (In thousands)
Codman Specialty Surgical $ 963,929 $ 720,301 $632,524
Orthopedics and Tissue Technologies 508,512 467,935 359,551
Total revenues 1,472,441 1,188,236 992,075
Cost of goods sold 571,496 435,511 349,089
Gross margin on total revenues $ 900,945 $ 752,725 $642,986
Gross margin as a percentage of total revenues 61.2% 63.3% 64.8%
Revenues
Year Ended December 31, 2018 Compared with Year Ended December 31, 2017.
For the year ended December 31, 2018, total revenues increased by $284.2 million, or 23.9%, to$1,472.4 million from $1,188.2 million during the prior year. Domestic revenues increased $151.6 million, or17.0%, to $1,045.9 million and were 71.0% of total revenues for the year ended December 31, 2018.International revenues increased to $426.6 million, compared to $293.9 million during 2017. The increasecompared to the prior year primarily resulted from the full-year sales impact of products acquired as part of theCodman Neurosurgery acquisition, which resulted in incremental revenue of $235.6 million, a $3.8 millionfavorable impact of foreign exchange as well as growth in both segments of $71.8 million, which includes twelvemonths of Derma Sciences revenue in 2018, offset by $27.0 million of revenue from divested products in 2017.
Codman Specialty Surgical revenues were $963.9 million, an increase of 33.8% from the prior-year period.The increase primarily resulted from incremental revenues from Codman Neurosurgery of $235.6 million.Growth in our legacy Neurosurgery portfolio was primarily driven by our CUSA ® capital and disposablesportfolio and dural repair. Revenues for Precision Tools and Instruments increased by low-single digits over theprior period due to increased volume in the business.
Orthopedics and Tissue Technologies revenues were $508.5 million, an increase of 8.7% from the prior-yearperiod. In our Wound Reconstruction portfolio used in inpatient and outpatient procedures, sales of our Integra
42
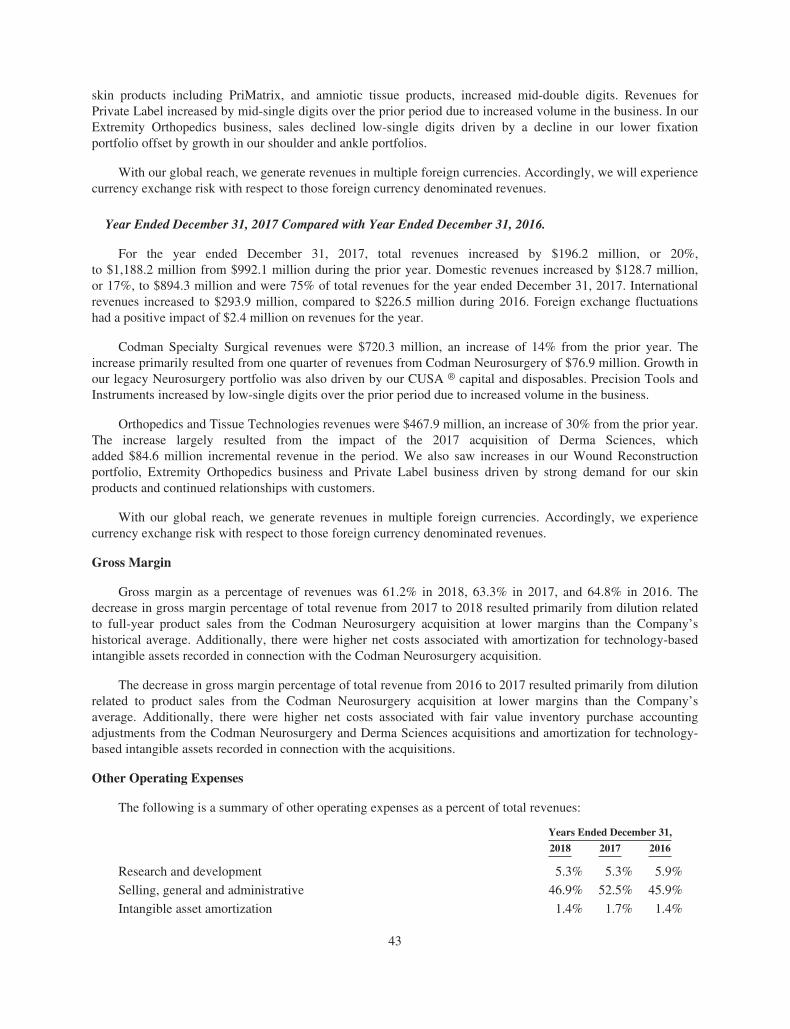
skin products including PriMatrix, and amniotic tissue products, increased mid-double digits. Revenues forPrivate Label increased by mid-single digits over the prior period due to increased volume in the business. In ourExtremity Orthopedics business, sales declined low-single digits driven by a decline in our lower fixationportfolio offset by growth in our shoulder and ankle portfolios.
With our global reach, we generate revenues in multiple foreign currencies. Accordingly, we will experiencecurrency exchange risk with respect to those foreign currency denominated revenues.
Year Ended December 31, 2017 Compared with Year Ended December 31, 2016.
For the year ended December 31, 2017, total revenues increased by $196.2 million, or 20%,to $1,188.2 million from $992.1 million during the prior year. Domestic revenues increased by $128.7 million,or 17%, to $894.3 million and were 75% of total revenues for the year ended December 31, 2017. Internationalrevenues increased to $293.9 million, compared to $226.5 million during 2016. Foreign exchange fluctuationshad a positive impact of $2.4 million on revenues for the year.
Codman Specialty Surgical revenues were $720.3 million, an increase of 14% from the prior year. Theincrease primarily resulted from one quarter of revenues from Codman Neurosurgery of $76.9 million. Growth inour legacy Neurosurgery portfolio was also driven by our CUSA ® capital and disposables. Precision Tools andInstruments increased by low-single digits over the prior period due to increased volume in the business.
Orthopedics and Tissue Technologies revenues were $467.9 million, an increase of 30% from the prior year.The increase largely resulted from the impact of the 2017 acquisition of Derma Sciences, whichadded $84.6 million incremental revenue in the period. We also saw increases in our Wound Reconstructionportfolio, Extremity Orthopedics business and Private Label business driven by strong demand for our skinproducts and continued relationships with customers.
With our global reach, we generate revenues in multiple foreign currencies. Accordingly, we experiencecurrency exchange risk with respect to those foreign currency denominated revenues.
Gross Margin
Gross margin as a percentage of revenues was 61.2% in 2018, 63.3% in 2017, and 64.8% in 2016. Thedecrease in gross margin percentage of total revenue from 2017 to 2018 resulted primarily from dilution relatedto full-year product sales from the Codman Neurosurgery acquisition at lower margins than the Company’shistorical average. Additionally, there were higher net costs associated with amortization for technology-basedintangible assets recorded in connection with the Codman Neurosurgery acquisition.
The decrease in gross margin percentage of total revenue from 2016 to 2017 resulted primarily from dilutionrelated to product sales from the Codman Neurosurgery acquisition at lower margins than the Company’saverage. Additionally, there were higher net costs associated with fair value inventory purchase accountingadjustments from the Codman Neurosurgery and Derma Sciences acquisitions and amortization for technology-based intangible assets recorded in connection with the acquisitions.
Other Operating Expenses
The following is a summary of other operating expenses as a percent of total revenues:
Years Ended December 31,
2018 2017 2016
Research and development 5.3% 5.3% 5.9%
Selling, general and administrative 46.9% 52.5% 45.9%
Intangible asset amortization 1.4% 1.7% 1.4%
43
Total operating expenses, which consist of research and development expenses, selling, general andadministrative expenses, and intangible asset amortization expense, increased $82.0 million or 12% to$789.9 million in 2018, compared to $707.9 million in the prior year.
RESEARCH AND DEVELOPMENT. Research and development totaled $78.0 million in 2018, compared to$63.5 million in 2017 and $58.2 million in 2016. Similar to the prior year, the increase in research anddevelopment costs from 2017 to 2018 primarily resulted from the full-year impact of the acquisitions of DermaSciences and Codman Neurosurgery and additional spending on new product development and clinical studies.
SELLING, GENERAL AND ADMINISTRATIVE. Selling, general and administrative expenses in the yearended December 31, 2018 increased by $66.7 million or 10.7% to $690.7 million, compared to $624.1 million inthe same period in the prior year. Selling and marketing expenses increased by $72.3 million, primarily resultingfrom the full-year impact of the Derma Sciences and Codman Neurosurgery acquisitions, higher headcount in oursales force compared to the prior year, higher commission costs resulting from increases in revenue and channelexpansion. General and administrative costs decreased by $5.6 million, primarily resulting from one-time costsfor the year ended December 31, 2017 related to acquiring and integrating the Derma Sciences and CodmanNeurosurgery businesses in the year of acquisition.
Selling, general and administrative expenses for the year ended December 31, 2017 increased by$168.5 million or 37.0% to $624.1 million, compared to $455.6 million in 2016. Selling and marketing expensesincreased by $63.9 million, primarily resulting from the Derma Sciences and Codman Neurosurgery acquisitions,higher headcount in our sales force compared to the prior year, and higher commission costs resulting fromincreases in revenue. General and administrative costs increased by $104.6 million, primarily resulting from thecosts related to acquiring and integrating the Derma Sciences and Codman Neurosurgery businesses andincreased compensation costs.
INTANGIBLE ASSET AMORTIZATION. Amortization expense (excluding amounts reported in cost ofproduct revenues for technology-based intangible assets) in the year ended December 31, 2018 was$21.2 million, compared to $20.4 million in 2017. The increase primarily resulted from the full-year impact ofamortization on the intangible assets added as part of the Derma Sciences acquisition.
In 2017, amortization expense (excluding amounts reported in cost of product revenues for technology-based intangible assets) in the year ended December 31, 2017 was $20.4 million, compared to $13.9 million in2016. The increase primarily resulted from amortization on the intangible assets added as part of our DermaSciences acquisition.
We may discontinue certain products in the future as we continue to assess the profitability of our productlines. As our profitability assessment evolves, we may make further decisions about our trade names and incuradditional impairment charges or accelerated amortization. We expect total annual amortization expense(including amounts reported in cost of product revenues, but excluding any possible future amortizationassociated with acquired in-process research and development (“IPR&D”)) to be approximately $66.2 million in2019, $65.9 million in 2020, $64.8 million in 2021, $61.3 million in 2022, $60.4 million in 2023 and$596.6 million thereafter.
44
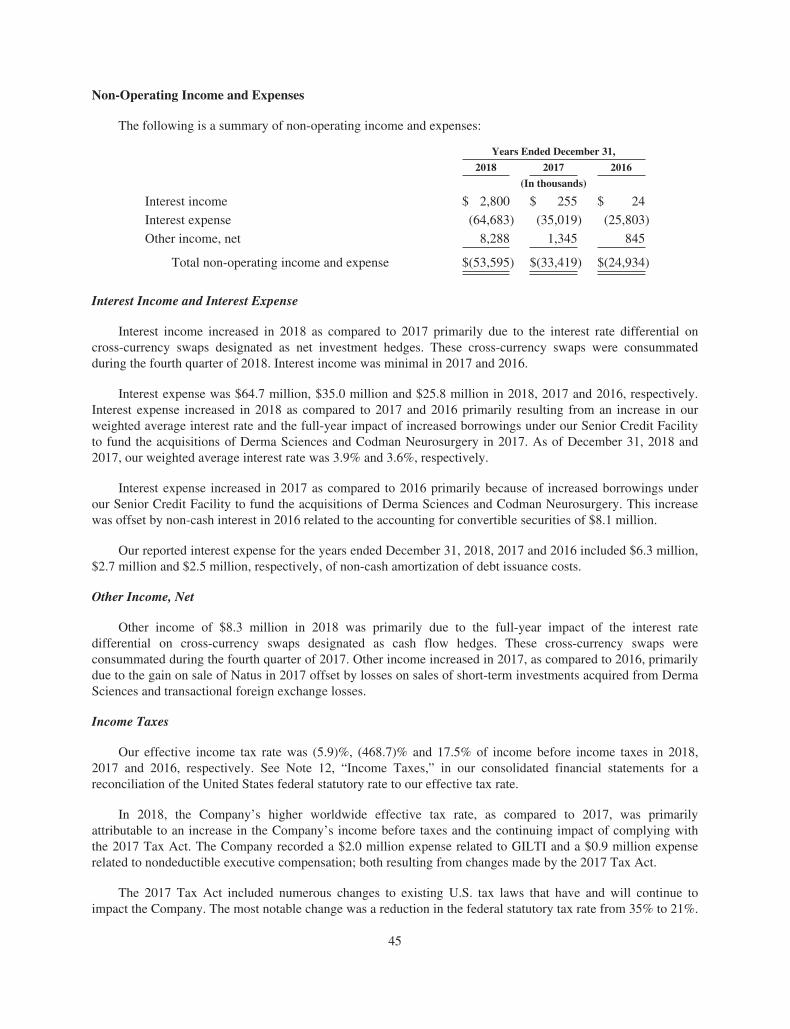
Non-Operating Income and Expenses
The following is a summary of non-operating income and expenses:
Years Ended December 31,
2018 2017 2016
(In thousands)
Interest income $ 2,800 $ 255 $ 24
Interest expense (64,683) (35,019) (25,803)
Other income, net 8,288 1,345 845
Total non-operating income and expense $(53,595) $(33,419) $(24,934)
Interest Income and Interest Expense
Interest income increased in 2018 as compared to 2017 primarily due to the interest rate differential oncross-currency swaps designated as net investment hedges. These cross-currency swaps were consummatedduring the fourth quarter of 2018. Interest income was minimal in 2017 and 2016.
Interest expense was $64.7 million, $35.0 million and $25.8 million in 2018, 2017 and 2016, respectively.Interest expense increased in 2018 as compared to 2017 and 2016 primarily resulting from an increase in ourweighted average interest rate and the full-year impact of increased borrowings under our Senior Credit Facilityto fund the acquisitions of Derma Sciences and Codman Neurosurgery in 2017. As of December 31, 2018 and2017, our weighted average interest rate was 3.9% and 3.6%, respectively.
Interest expense increased in 2017 as compared to 2016 primarily because of increased borrowings underour Senior Credit Facility to fund the acquisitions of Derma Sciences and Codman Neurosurgery. This increasewas offset by non-cash interest in 2016 related to the accounting for convertible securities of $8.1 million.
Our reported interest expense for the years ended December 31, 2018, 2017 and 2016 included $6.3 million,$2.7 million and $2.5 million, respectively, of non-cash amortization of debt issuance costs.
Other Income, Net
Other income of $8.3 million in 2018 was primarily due to the full-year impact of the interest ratedifferential on cross-currency swaps designated as cash flow hedges. These cross-currency swaps wereconsummated during the fourth quarter of 2017. Other income increased in 2017, as compared to 2016, primarilydue to the gain on sale of Natus in 2017 offset by losses on sales of short-term investments acquired from DermaSciences and transactional foreign exchange losses.
Income Taxes
Our effective income tax rate was (5.9)%, (468.7)% and 17.5% of income before income taxes in 2018,2017 and 2016, respectively. See Note 12, “Income Taxes,” in our consolidated financial statements for areconciliation of the United States federal statutory rate to our effective tax rate.
In 2018, the Company’s higher worldwide effective tax rate, as compared to 2017, was primarilyattributable to an increase in the Company’s income before taxes and the continuing impact of complying withthe 2017 Tax Act. The Company recorded a $2.0 million expense related to GILTI and a $0.9 million expenserelated to nondeductible executive compensation; both resulting from changes made by the 2017 Tax Act.
The 2017 Tax Act included numerous changes to existing U.S. tax laws that have and will continue toimpact the Company. The most notable change was a reduction in the federal statutory tax rate from 35% to 21%.
45
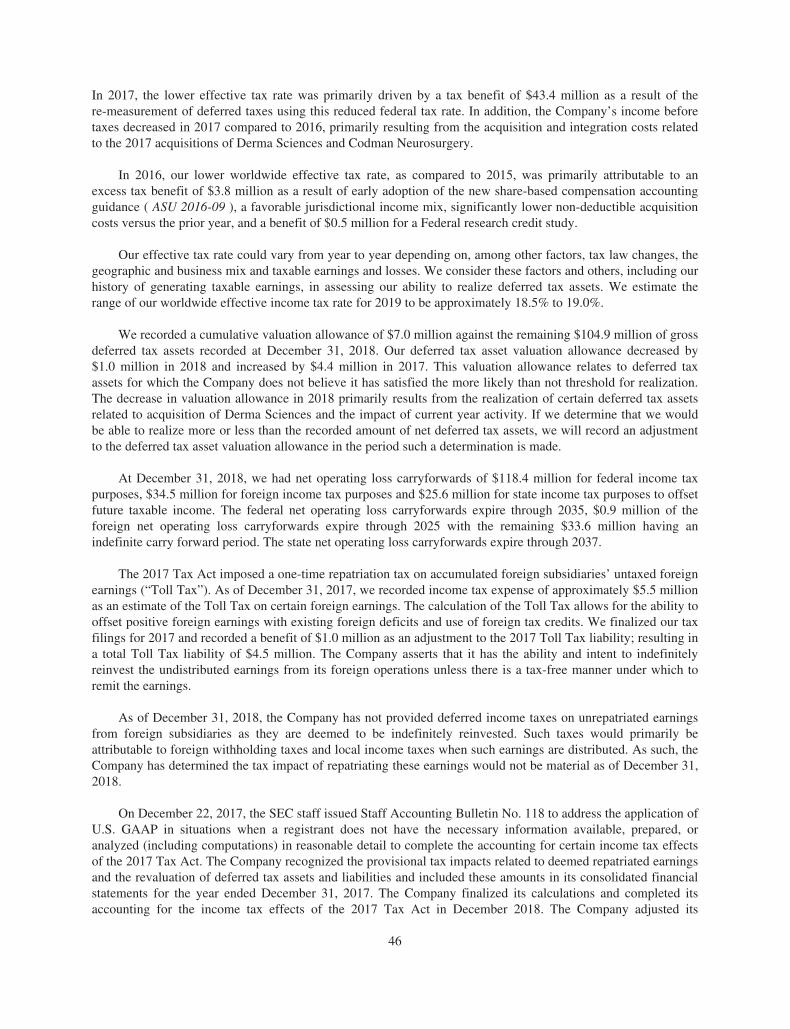
In 2017, the lower effective tax rate was primarily driven by a tax benefit of $43.4 million as a result of there-measurement of deferred taxes using this reduced federal tax rate. In addition, the Company’s income beforetaxes decreased in 2017 compared to 2016, primarily resulting from the acquisition and integration costs relatedto the 2017 acquisitions of Derma Sciences and Codman Neurosurgery.
In 2016, our lower worldwide effective tax rate, as compared to 2015, was primarily attributable to anexcess tax benefit of $3.8 million as a result of early adoption of the new share-based compensation accountingguidance ( ASU 2016-09 ), a favorable jurisdictional income mix, significantly lower non-deductible acquisitioncosts versus the prior year, and a benefit of $0.5 million for a Federal research credit study.
Our effective tax rate could vary from year to year depending on, among other factors, tax law changes, thegeographic and business mix and taxable earnings and losses. We consider these factors and others, including ourhistory of generating taxable earnings, in assessing our ability to realize deferred tax assets. We estimate therange of our worldwide effective income tax rate for 2019 to be approximately 18.5% to 19.0%.
We recorded a cumulative valuation allowance of $7.0 million against the remaining $104.9 million of grossdeferred tax assets recorded at December 31, 2018. Our deferred tax asset valuation allowance decreased by$1.0 million in 2018 and increased by $4.4 million in 2017. This valuation allowance relates to deferred taxassets for which the Company does not believe it has satisfied the more likely than not threshold for realization.The decrease in valuation allowance in 2018 primarily results from the realization of certain deferred tax assetsrelated to acquisition of Derma Sciences and the impact of current year activity. If we determine that we wouldbe able to realize more or less than the recorded amount of net deferred tax assets, we will record an adjustmentto the deferred tax asset valuation allowance in the period such a determination is made.
At December 31, 2018, we had net operating loss carryforwards of $118.4 million for federal income taxpurposes, $34.5 million for foreign income tax purposes and $25.6 million for state income tax purposes to offsetfuture taxable income. The federal net operating loss carryforwards expire through 2035, $0.9 million of theforeign net operating loss carryforwards expire through 2025 with the remaining $33.6 million having anindefinite carry forward period. The state net operating loss carryforwards expire through 2037.
The 2017 Tax Act imposed a one-time repatriation tax on accumulated foreign subsidiaries’ untaxed foreignearnings (“Toll Tax”). As of December 31, 2017, we recorded income tax expense of approximately $5.5 millionas an estimate of the Toll Tax on certain foreign earnings. The calculation of the Toll Tax allows for the ability tooffset positive foreign earnings with existing foreign deficits and use of foreign tax credits. We finalized our taxfilings for 2017 and recorded a benefit of $1.0 million as an adjustment to the 2017 Toll Tax liability; resulting ina total Toll Tax liability of $4.5 million. The Company asserts that it has the ability and intent to indefinitelyreinvest the undistributed earnings from its foreign operations unless there is a tax-free manner under which toremit the earnings.
As of December 31, 2018, the Company has not provided deferred income taxes on unrepatriated earningsfrom foreign subsidiaries as they are deemed to be indefinitely reinvested. Such taxes would primarily beattributable to foreign withholding taxes and local income taxes when such earnings are distributed. As such, theCompany has determined the tax impact of repatriating these earnings would not be material as of December 31,2018.
On December 22, 2017, the SEC staff issued Staff Accounting Bulletin No. 118 to address the application ofU.S. GAAP in situations when a registrant does not have the necessary information available, prepared, oranalyzed (including computations) in reasonable detail to complete the accounting for certain income tax effectsof the 2017 Tax Act. The Company recognized the provisional tax impacts related to deemed repatriated earningsand the revaluation of deferred tax assets and liabilities and included these amounts in its consolidated financialstatements for the year ended December 31, 2017. The Company finalized its calculations and completed itsaccounting for the income tax effects of the 2017 Tax Act in December 2018. The Company adjusted its
46
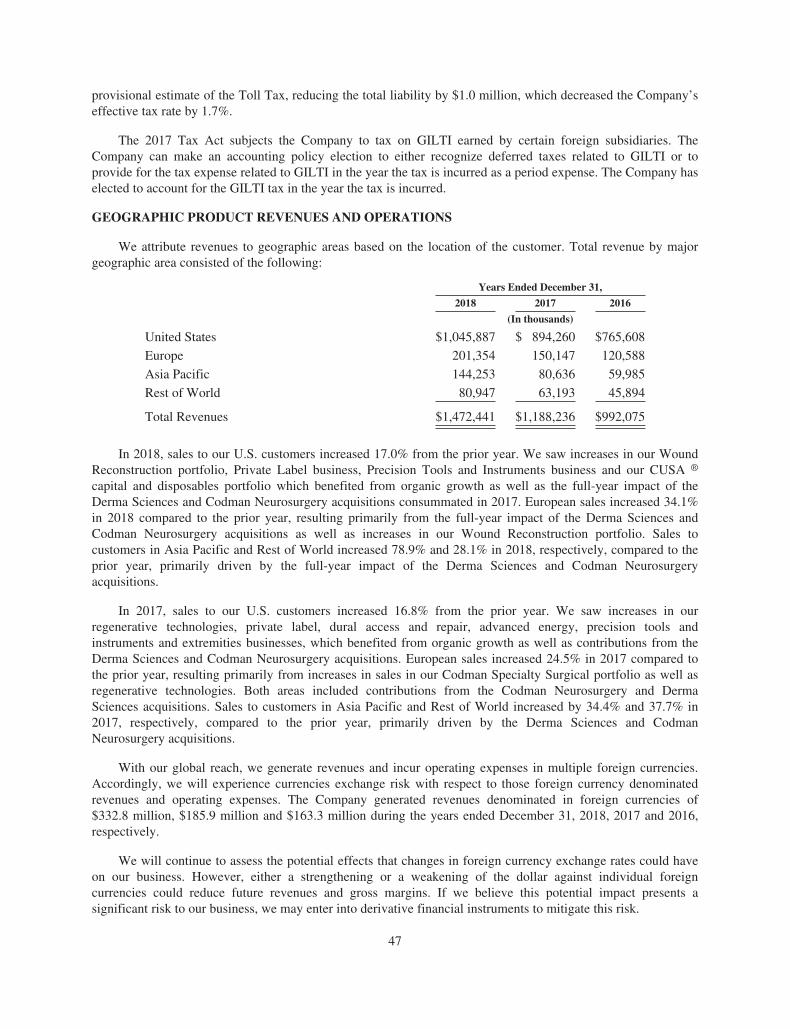
provisional estimate of the Toll Tax, reducing the total liability by $1.0 million, which decreased the Company’seffective tax rate by 1.7%.
The 2017 Tax Act subjects the Company to tax on GILTI earned by certain foreign subsidiaries. TheCompany can make an accounting policy election to either recognize deferred taxes related to GILTI or toprovide for the tax expense related to GILTI in the year the tax is incurred as a period expense. The Company haselected to account for the GILTI tax in the year the tax is incurred.
GEOGRAPHIC PRODUCT REVENUES AND OPERATIONS
We attribute revenues to geographic areas based on the location of the customer. Total revenue by majorgeographic area consisted of the following:
Years Ended December 31,
2018 2017 2016
(In thousands)
United States $1,045,887 $ 894,260 $765,608
Europe 201,354 150,147 120,588
Asia Pacific 144,253 80,636 59,985
Rest of World 80,947 63,193 45,894
Total Revenues $1,472,441 $1,188,236 $992,075
In 2018, sales to our U.S. customers increased 17.0% from the prior year. We saw increases in our WoundReconstruction portfolio, Private Label business, Precision Tools and Instruments business and our CUSA ®
capital and disposables portfolio which benefited from organic growth as well as the full-year impact of theDerma Sciences and Codman Neurosurgery acquisitions consummated in 2017. European sales increased 34.1%in 2018 compared to the prior year, resulting primarily from the full-year impact of the Derma Sciences andCodman Neurosurgery acquisitions as well as increases in our Wound Reconstruction portfolio. Sales tocustomers in Asia Pacific and Rest of World increased 78.9% and 28.1% in 2018, respectively, compared to theprior year, primarily driven by the full-year impact of the Derma Sciences and Codman Neurosurgeryacquisitions.
In 2017, sales to our U.S. customers increased 16.8% from the prior year. We saw increases in ourregenerative technologies, private label, dural access and repair, advanced energy, precision tools andinstruments and extremities businesses, which benefited from organic growth as well as contributions from theDerma Sciences and Codman Neurosurgery acquisitions. European sales increased 24.5% in 2017 compared tothe prior year, resulting primarily from increases in sales in our Codman Specialty Surgical portfolio as well asregenerative technologies. Both areas included contributions from the Codman Neurosurgery and DermaSciences acquisitions. Sales to customers in Asia Pacific and Rest of World increased by 34.4% and 37.7% in2017, respectively, compared to the prior year, primarily driven by the Derma Sciences and CodmanNeurosurgery acquisitions.
With our global reach, we generate revenues and incur operating expenses in multiple foreign currencies.Accordingly, we will experience currencies exchange risk with respect to those foreign currency denominatedrevenues and operating expenses. The Company generated revenues denominated in foreign currencies of$332.8 million, $185.9 million and $163.3 million during the years ended December 31, 2018, 2017 and 2016,respectively.
We will continue to assess the potential effects that changes in foreign currency exchange rates could haveon our business. However, either a strengthening or a weakening of the dollar against individual foreigncurrencies could reduce future revenues and gross margins. If we believe this potential impact presents asignificant risk to our business, we may enter into derivative financial instruments to mitigate this risk.
47
Additionally, we generate significant revenues outside the U.S., a portion of which are U.S. dollar-denominated transactions conducted with customers who generate revenue in currencies other than the U.S.dollar. As a result, currency fluctuations between the U.S. dollar and the currencies in which those customers dobusiness may have an impact on the demand for our products in foreign countries.
Local economic conditions, regulatory, legal or political considerations, the effectiveness of our salesrepresentatives and distributors, local competition and changes in local medical practice all could combine toaffect our sales into markets outside the U.S.
Relationships with customers and effective terms of sale frequently vary by country, often with longer-termreceivables than are typical in the U.S.
LIQUIDITY AND CAPITAL RESOURCES
Cash and Marketable Securities
We had cash and cash equivalents totaling $138.8 million and $174.9 million at December 31, 2018 and2017, respectively.
In 2019, we anticipate that our principal uses of cash will be for support and maintenance of our existingplants for facility automation and developments of our new Mansfield, Massachusetts manufacturing facility.
We determined that our existing cash, future cash to be generated from operations, and our remaining$954.4 million of borrowing capacity under our senior secured revolving credit facility at December 31, 2018, ifneeded, will satisfy our foreseeable working capital, debt repayment and capital expenditure requirements for atleast the next twelve months after the date the financial statements are issued or are available to be issued.
At December 31, 2018, our non-U.S. subsidiaries held approximately $110.5 million of cash and cashequivalents that are available for use by all of our operations around the world. The Company asserts that it hasthe ability and intent to indefinitely reinvest the undistributed earnings from its foreign operations unless there isa tax-free manner under which to remit the earnings.
Cash Flows
Year Ended December 31,
2018 2017
(In thousands)
Net cash provided by operating activities $ 199,683 $ 114,544
Net cash used in investing activities (49,705) (1,221,335)
Net cash provided (used in) by financing activities (180,872) 1,168,947
Effect of exchange rate fluctuations on cash (5,203) 10,724
Net increase (decrease) in cash and cash equivalents $ (36,097) $ 72,880
Cash Flows Provided by Operating Activities
We generated operating cash flows of $199.7 million, $114.5 million and $116.4 million for years endedDecember 31, 2018, 2017 and 2016, respectively.
Operating cash flows in 2018 increased compared to the same period in 2017. Net income for the year,adjusted for items included in net income which did not result in a change to our cash balance, amounted to cashinflows of $197.9 million, compared to $115.9 million in 2017. The increase to net income, adjusted for items
48
included in net income year over year is primarily attributed to the full-year operating impact of the Derma andCodman acquisitions consummated during 2017 and organic growth of the Company during 2018. Changes inworking capital in 2018 increased cash flows by approximately $0.3 million. Among the changes in workingcapital, accounts receivable used $17.0 million of cash, inventory provided $8.3 million of cash, prepaidexpenses and other current assets provided $3.9 million of cash, accounts payable, accrued expenses and othercurrent liabilities provided $3.6 million of cash and deferred revenue provided $1.5 million of cash.
Operating cash flows in 2017 decreased compared to the same period in 2016. Net income in 2017decreased compared to 2016 due to an increase in expenses related to the acquisitions and integrations ofCodman Neurosurgery and Derma Sciences. Net income for the year, adjusted for items included in net incomewhich did not result in a change to our cash balance, amounted to cash inflows of $115.9 million, comparedto $170.4 million in 2016. Changes in working capital in 2017 decreased cash flows byapproximately $24.2 million. Among the changes in working capital, accounts receivable used $89.7 million ofcash, inventory provided $0.1 million of cash, prepaid expenses and other current assets used $33.8 million ofcash, and accounts payable, accrued expenses and other current liabilities provided $95.3 million of cash.
Operating cash flows in 2016 decreased compared to the same period in 2015. Net income in 2016 increasedcompared to 2015 due to an increase in income from continuing operations before income taxes and because ofthe impact of the tax valuation allowance recorded in 2015 in conjunction with the SeaSpine spin-off, which wasa non-cash adjustment. In 2016, we also made payments of accreted interest of $42.8 million compared to$0.4 million paid in 2015, which are included in operating activities. Net income for the year, adjusted for itemsincluded in net income which did not result in a change to our cash balance, amounted to cash inflows of$170.4 million, compared to $127.8 million in 2015. Changes in working capital in 2016 decreased cash flows byapproximately $11.3 million. Among the changes in working capital, accounts receivable used $17.5 million ofcash, inventory used $9.6 million of cash, prepaid expenses and other current assets provided $14.9 million ofcash, and accounts payable, accrued expenses and other current liabilities used $0.4 million of cash.
Cash Flows Used in Investing Activities
During the year ended December 31, 2018, we paid $77.7 million for capital expenditures, most of whichwere directed to the expansion of our new Mansfield, Massachusetts facility and commercial expansion. Wereceived $26.7 million from the Codman Neurosurgery acquisition for a working capital adjustment.
During the year ended December 31, 2017, we paid an aggregate of $1.2 billion for the acquisitions ofCodman Neurosurgery and Derma Sciences. The payment for Derma Sciences included a $210.5 millionpayment of the purchase price plus a $26.6 million payment for the BioD Product Payment in May 2017(see Note 4, Acquisitions and Pro Forma Results ). We received $17.0 million from the sale of short-terminvestments acquired from Derma Sciences. We also received $46.4 million from the Divestiture to Natus inOctober 2017. We paid $43.5 million in cash for capital expenditures, most of which was directed towards theexpansion of our manufacturing facilities and commercial expansion.
During the year ended December 31, 2016, we paid $47.3 million in cash for capital expenditures, most ofwhich was directed to the expansion of our collagen manufacturing center, new instruments for several productlaunches, facility improvements and enterprise resource planning implementation.
Cash Flows Provided by Financing Activities
Our principal sources of cash from financing activities in the year ended December 31, 2018 were$349.6 million from the issuance of common stock and $171.2 million in borrowings under our Senior CreditFacility and Securitization Facility. These were offset by repayments of $660.0 million on the revolving portionof our Senior Credit Facility, payments of $15.9 million for inventory that was included in the initial purchaseaccounting for Codman Neurosurgery and $22.3 million of payments relating to contingent consideration.
49
Our principal sources of cash from financing activities in the year ended December 31, 2017 were $700.0million under the Term Loan component of our Senior Credit Facility, and $607.0 million of borrowings underthe revolver component of our Senior Credit Facility offset by $117.0 million in repayments under our SeniorCredit Facility, and $19.0 million in debt issuance costs related to our Senior Credit Facility.
Our principal sources of cash from financing activities in the year ended December 31, 2016 were$500.0 million under the term loan component of our Senior Credit Facility, $180.0 million of borrowings underthe revolver component of our Senior Credit Facility, and a $184.3 million repayment of the 2016 ConvertibleNotes offset by $511.3 million in repayments under our Senior Credit Facility.
Working Capital
At December 31, 2018 and December 31, 2017, working capital was $512.5 million and $473.2 million,respectively. Working capital consists of total current assets less total current liabilities as presented in theconsolidated balance sheets.
Upcoming Debt Maturities
The first quarterly installment of the Company’s Term Loan component of its Senior Credit Facility is dueon September 30, 2019. We recorded a total of $22.5 million of the Term Loan component of the Senior CreditFacility as a current liability in the Company’s consolidated balance sheets.
Amended and Restated Senior Credit Agreement
On May 3, 2018, the Company entered into the fifth amendment and restatement (the “May 2018Amendment”) of its Senior Credit Facility (the “Senior Credit Facility”) with a syndicate of lending banks withBank of America, N.A., as Administrative Agent. The May 2018 Amendment extended the maturity date toMay 3, 2023 and decreased the applicable rate, as described below. The Company continues to have theaggregate principal amount of $2.2 billion available to it through the following facilities:
i. a $900.0 million Term Loan facility; and
ii. a $1.3 billion revolving credit facility, which includes a $60.0 million sublimit for the issuance ofstandby letters of credit and a $60.0 million sublimit for swingline loans.
In connection with the May 2018 Amendment, the Company’s maximum consolidated total leverage ratio inthe financial covenants (as defined in the Senior Credit Facility) was modified to the following:
Fiscal QuarterMaximum Consolidated
Total Leverage Ratio
Execution of May 2018 Amendment through March 31, 2019 5.50: 1.00
June 30, 2019 through March 31, 2020 5.00: 1.00
June 30, 2020 through March 31, 2021 4.50: 1.00
June 30, 2021 and thereafter 4.00: 1.00
Borrowings under the Senior Credit Facility bear interest, at the Company’s option, at a rate equal to thefollowing:
i. the Eurodollar Rate (as defined in the amendment and restatement) in effect from time to time plus theapplicable rate (ranging from 1.00% to 1.75% ), or
ii. the highest of:
1. the weighted average overnight Federal funds rate, as published by the Federal Reserve Bank ofNew York, plus 0.50%, or plus the applicable rate (ranging from 0% to 0.75% ),
50
2. the prime lending rate of Bank of America, N.A. plus the applicable rate (ranging from 0%to 0.75% ), and
3. the one-month Eurodollar Rate plus 1.00% plus the applicable rate (ranging from 0% to 0.75% ).
The applicable rates are based on the Company’s consolidated total leverage ratio (defined as the ratio of(a) consolidated funded indebtedness less cash that is not subject to any restriction on the use or investmentthereof to (b) consolidated EBITDA at the time of the applicable borrowing).
The Company will also pay an annual commitment fee (ranging from 0.15% to 0.35% ), based on theCompany’s consolidated total leverage ratio, on the amount available for borrowing under the revolving creditfacility.
We plan to utilize the Senior Credit Facility for working capital, capital expenditures, acquisitions, debtrepayments and other general corporate purposes. At December 31, 2018 and 2017, there was $345.0 million and$655.0 million outstanding, respectively, under the revolving portion of the Senior Credit Facility at a weightedaverage interest rate of 4.0% and 3.7%, respectively. At December 31, 2018 and 2017, there was $900.0 millionand $1.2 billion outstanding under the Term Loan component of the Senior Credit Facility at a weighted averageinterest rate of 3.9% and 3.6%, respectively.
The Senior Credit Facility is collateralized by substantially all of the assets of the Company’sU.S. subsidiaries, excluding intangible assets. The Senior Credit Facility is subject to various financial andnegative covenants and at December 31, 2018 the Company was in compliance with all such covenants. TheCompany capitalized $4.2 million and $19.1 million of incremental financing costs in 2018 and 2017,respectively, in connection with the modifications of the Senior Credit Facility.
Letters of credit outstanding as of December 31, 2018 and 2017 totaled $0.6 million, respectively. Therewere no amounts drawn as of December 31, 2018.
Securitization Facility
During the fourth quarter of 2018, the Company entered into an accounts receivable Securitization Facilityunder which accounts receivable of certain domestic subsidiaries are sold on a non-recourse basis to a specialpurpose entity (“SPE”), which is a bankruptcy-remote, consolidated subsidiary of the Company. Accordingly, theassets of the SPE are not available to satisfy the obligations of the Company or any of its subsidiaries. From timeto time, the SPE may finance such accounts receivable with a revolving loan facility secured by a pledge of suchaccounts receivable. The amount of outstanding borrowings on the revolving loan facility at any one time islimited to $150.0 million. The Securitization Facility agreement is for an initial three -year term and may beextended. The agreement governing the Securitization Facility contains certain covenants and termination events.An occurrence of an event of default or a termination event under this facility may give rise to the right of itscounterparty to terminate this facility. As of December 31, 2018, the Company was in compliance with thecovenants and none of the termination events had occurred. As of December 31, 2018, the Companyhad $121.2 million of outstanding borrowings under its Securitization Facility at a weighted average interest rateof 3.4%.
The fair value of outstanding borrowings of the Senior Credit Facility’s revolving credit facility and TermLoan component at December 31, 2018 were approximately $322.2 million and $852.1 million, respectively. Thefair value of the outstanding borrowing of the Securitization Facility at December 31, 2018 was approximately$116.4 million. These fair values were determined by using a discounted cash flow model based on currentmarket interest rates available to the Company. These inputs are corroborated by observable market data forsimilar liabilities and therefore classified within Level 2 of the fair value hierarchy. Level 2 inputs representinputs that are observable for the asset or liability, either directly or indirectly and are other than active marketobservable inputs that reflect unadjusted quoted prices for identical assets or liabilities.
51
Convertible Debt and Related Hedging Activities
On December 15, 2016, the Company extinguished its 2016 Convertible Notes by paying the remainingprincipal amount of $227.1 million and issued 2.9 million shares of common stock with a fair value of$122.0 million related to excess conversion value. No gain or loss on extinguishment was recognized as a resultof the conversion. The Company also received 2.9 million shares of common stock from the exercise of calloptions with hedge participants (as defined below) with a fair value of $123.1 million at the date of the exercise.The shares of common stock received from the exercise of the call options were held as treasury stock as ofDecember 31, 2016 at a weighted average price of $41.78 per share for a total of $123.1 million.
The 2016 Convertible Notes were issued on June 15, 2011 with the aggregate principal of $230.0 millionand maturity date of December 15, 2016. The 2016 Convertible Notes bore interest at a rate of 1.625% perannum payable semi-annually in arrears on December 15 and June 15 of each year. The 2016 Convertible Noteswere senior, unsecured obligations and were convertible into cash and, if applicable, shares of its common stockbased on a conversion rate defined within the note agreement.
In connection with the issuance of the 2016 Convertible Notes, we entered into call transactions and warranttransactions, primarily with affiliates of the initial purchasers of such notes (the “hedge participants”). The initialstrike price of the call transaction was approximately $28.72 per share, subject to customary anti-dilutionadjustments. The initial strike price of the warrant transaction was approximately $35.03 per share, subject tocustomary anti-dilution adjustments. The strike price of the call transactions and warrant transactions has beenadjusted similar to the 2016 Convertible Notes as a result of the spin-off of the Company’s spine business in July2015 to $26.42 per share and $32.22 per share, respectively. The warrants expired on a series of expiration datesfrom March 2017 to August 2017. For the year ended December 31, 2017, the hedge participants exercised8,707,202 warrants, and, as a result, the Company issued 2,839,743 shares of common stock for the year endedDecember 31, 2017. The Company has no warrants outstanding as of December 31, 2018.
Share Repurchase Plan
On December 11, 2018, the Board of Directors authorized the Company to repurchase up to $225 million ofthe Company’s common stock. The program allows the Company to repurchase its shares opportunistically fromtime to time. The repurchase authorization expires in December 2020. Purchases may be affected through one ormore open market transactions, privately negotiated transactions, transactions structured through investmentbanking institutions, or a combination of the foregoing. This stock repurchase authorization replaces the previous$150 million stock repurchase authorization which was approved by the Board in 2016.
There have been no shares of common stock repurchased by the Company under any of these authorizationsin the years ended December 31, 2018 or 2017.
Dividend Policy
We have not paid any cash dividends on our common stock since our formation. Our Senior Credit Facilitylimits the amount of dividends that we may pay. Any future determinations to pay cash dividends on ourcommon stock will be at the discretion of our Board of Directors and will depend upon our financial condition,results of operations, cash flows and other factors deemed relevant by the Board of Directors.
52
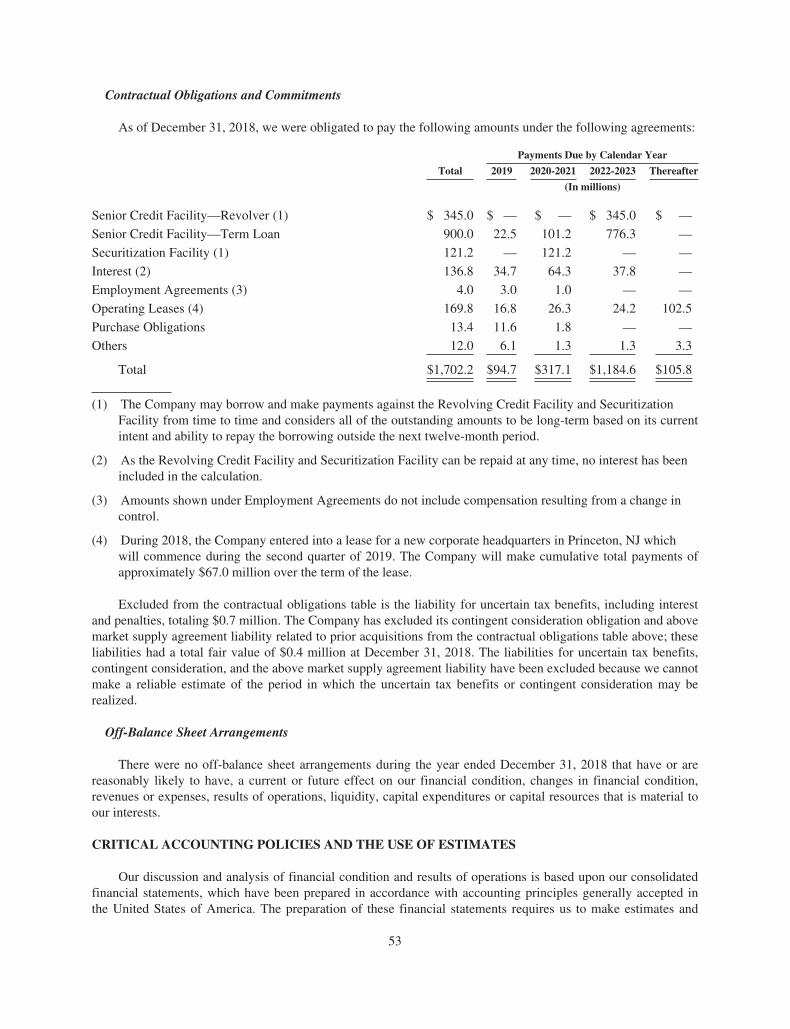
Contractual Obligations and Commitments
As of December 31, 2018, we were obligated to pay the following amounts under the following agreements:
Total
Payments Due by Calendar Year
2019 2020-2021 2022-2023 Thereafter
(In millions)
Senior Credit Facility—Revolver (1) $ 345.0 $ — $ — $ 345.0 $ —
Senior Credit Facility—Term Loan 900.0 22.5 101.2 776.3 —
Securitization Facility (1) 121.2 — 121.2 — —
Interest (2) 136.8 34.7 64.3 37.8 —
Employment Agreements (3) 4.0 3.0 1.0 — —
Operating Leases (4) 169.8 16.8 26.3 24.2 102.5
Purchase Obligations 13.4 11.6 1.8 — —
Others 12.0 6.1 1.3 1.3 3.3
Total $1,702.2 $94.7 $317.1 $1,184.6 $105.8
(1) The Company may borrow and make payments against the Revolving Credit Facility and SecuritizationFacility from time to time and considers all of the outstanding amounts to be long-term based on its currentintent and ability to repay the borrowing outside the next twelve-month period.
(2) As the Revolving Credit Facility and Securitization Facility can be repaid at any time, no interest has beenincluded in the calculation.
(3) Amounts shown under Employment Agreements do not include compensation resulting from a change incontrol.
(4) During 2018, the Company entered into a lease for a new corporate headquarters in Princeton, NJ whichwill commence during the second quarter of 2019. The Company will make cumulative total payments ofapproximately $67.0 million over the term of the lease.
Excluded from the contractual obligations table is the liability for uncertain tax benefits, including interestand penalties, totaling $0.7 million. The Company has excluded its contingent consideration obligation and abovemarket supply agreement liability related to prior acquisitions from the contractual obligations table above; theseliabilities had a total fair value of $0.4 million at December 31, 2018. The liabilities for uncertain tax benefits,contingent consideration, and the above market supply agreement liability have been excluded because we cannotmake a reliable estimate of the period in which the uncertain tax benefits or contingent consideration may berealized.
Off-Balance Sheet Arrangements
There were no off-balance sheet arrangements during the year ended December 31, 2018 that have or arereasonably likely to have, a current or future effect on our financial condition, changes in financial condition,revenues or expenses, results of operations, liquidity, capital expenditures or capital resources that is material toour interests.
CRITICAL ACCOUNTING POLICIES AND THE USE OF ESTIMATES
Our discussion and analysis of financial condition and results of operations is based upon our consolidatedfinancial statements, which have been prepared in accordance with accounting principles generally accepted inthe United States of America. The preparation of these financial statements requires us to make estimates and
53
assumptions that affect the reported amounts of assets and liabilities, the disclosure of contingent liabilities, andthe reported amounts of revenues and expenses. Significant estimates affecting amounts reported or disclosed inthe consolidated financial statements include allowances for doubtful accounts receivable and sales returns andallowances, net realizable value of inventories, valuation of intangible assets including in-process research anddevelopment, amortization periods for acquired intangible assets, estimates of projected cash flows and discountrates used to value intangible assets and test goodwill and intangible assets for impairment, estimates of projectedcash flows and depreciation and amortization periods for long-lived assets, computation of taxes, computation ofvaluation allowances recorded against deferred tax assets, valuation of stock-based compensation, valuation ofpension assets and liabilities, valuation of derivative instruments, valuation of the equity component ofconvertible debt instruments, valuation of debt instruments and loss contingencies. These estimates are based onhistorical experience and on various other assumptions that are believed to be reasonable under the currentcircumstances. Actual results could differ from these estimates.
We believe that the following accounting policies, which form the basis for developing these estimates, arethose that are most critical to the presentation of our consolidated financial statements and require the moredifficult subjective and complex judgments:
Allowances for Doubtful Accounts Receivable and Sales Returns and Allowances
We evaluate the collectability of accounts receivable based on a combination of factors. In circumstanceswhere a specific customer is unable to meet its financial obligations to us, we record an allowance againstamounts due to reduce the net recognized receivable to the amount that we reasonably expect to collect. For allother customers, we record allowances for doubtful accounts based on the length of time the receivables are pastdue, the current business environment and our historical experience. If the financial condition of customers or thelength of time that receivables are past due were to change, we may change the recorded amount of allowancesfor doubtful accounts in the future through charges or reductions to selling, general and administrative expense.
We record a provision for estimated sales returns and allowances on revenues in the same period as therelated revenues are recorded. We base these estimates on historical sales returns and allowances and otherknown factors. If actual returns or allowances differ from our estimates and the related provisions for salesreturns and allowances, we may change the provision in the future through an increase or decrease in revenues.
Inventories
Inventories, consisting of purchased materials, direct labor and manufacturing overhead, are stated at thelower of cost (determined by the first-in, first-out method) or net realizable value. At each balance sheet date, weevaluate ending inventories for excess quantities, obsolescence or shelf-life expiration. Our evaluation includesan analysis of historical sales levels by product, projections of future demand by product, the risk oftechnological or competitive obsolescence for our products, general market conditions, a review of the shelf-lifeexpiration dates for our products, and the feasibility of reworking or using excess or obsolete products orcomponents in the production or assembly of other products that are not obsolete or for which we do not haveexcess quantities in inventory. To the extent that we determine there are excess or obsolete quantities orquantities with a shelf life that is too near its expiration for us to reasonably expect that we can sell thoseproducts prior to their expiration, we adjust their carrying value to estimated net realizable value. If futuredemand or market conditions are lower than our projections, or if we are unable to rework excess or obsoletequantities into other products, we may record further adjustments to the carrying value of inventory through acharge to cost of product revenues in the period the revision is made.
Acquisitions
Results of operations of acquired companies are included in the Company’s results of operations as of therespective acquisition dates. Net assets acquired are recorded at fair value at the date of the acquisition. Any
54
purchase price in excess of these net assets is recorded as goodwill. The fair values of net assets acquired may besubject to revision based on the final determination of fair values during the measurement period, which may beup to one year from the acquisition date.
Contingent consideration is recognized at the estimated fair value on the acquisition date. Subsequentchanges to the fair value of contingent payments are recognized in earnings. Contingent payments related toacquisitions consist of development, regulatory, and commercial milestone payments, in addition to sales-basedpayments, and are valued using discounted cash flow techniques. The fair value of development, regulatory, andcommercial milestone payments reflects management’s expectations of the probability of payment and increasesor decreases as the probability of payment or expectation of timing of payments changes. The fair value of sales-based payments is based upon probability-weighted future revenue estimates and increases or decreases asrevenue estimates or expectation of timing of payments changes.
Valuation of Goodwill
The excess of the cost over the fair value of net assets of acquired businesses is recorded as goodwill.Goodwill is not subject to amortization, but is reviewed for impairment at the reporting unit level annually, ormore frequently if impairment indicators arise. Our assessment of the recoverability of goodwill is based upon acomparison of the carrying value of goodwill with its estimated fair value. We review goodwill for impairmentannually as of July 31 and whenever events or changes in circumstances indicate the carrying value of goodwillmay not be recoverable. Refer to Note 7—Goodwill and Other Intangible Assets for more information onreportable segments.
Valuation of Identifiable Intangible Assets
Other intangible assets include patents, trademarks, purchased technology, and supplier and customerrelationships. Identifiable intangible assets are initially recorded at fair market value at the time of acquisitiongenerally using an income or cost approach. The Company capitalizes costs incurred to renew or extend the termof recognized intangible assets and amortizes those costs over their expected useful lives.
Derivatives
We develop, manufacture, and sell medical devices globally. Our earnings and cash flows are exposed tomarket risk from changes in interest rates and currency exchange rates. We address these risks through a riskmanagement program that includes the use of derivative financial instruments and operate the program pursuantto documented corporate risk management policies. All derivative financial instruments are recognized in thefinancial statements at fair value in accordance with the authoritative guidance. Under the guidance, for thoseinstruments that are designated and qualify as hedging instruments, the hedging instrument must be designated asa fair value hedge, cash flow hedge, or a hedge of a net investment in a foreign operation, based on the exposurebeing hedged. The accounting for changes in the fair value of a derivative instrument depends on whether it hasbeen designated and qualifies as part of a hedging relationship and, further, on the type of hedging relationship.Our derivative instruments do not subject our earnings or cash flows to material risk, and gains and losses onthese derivatives generally offset losses and gains on the item being hedged. We have not entered into derivativetransactions for speculative purposes and from time to time, we may enter into derivatives that are not designatedas hedging instruments in order to protect the Company from currency volatility due to intercompany balances.
All derivative instruments are recognized at their fair values as either assets or liabilities on the balancesheet. We determine the fair value of our derivative instruments, using the framework prescribed by theauthoritative guidance, by considering the estimated amount we would receive to sell or transfer theseinstruments at the reporting date and by taking into account expected forward interest rates, currency exchangerates, the creditworthiness of the counterparty for assets, and our creditworthiness for liabilities. In certaininstances, we may utilize a discounted cash flow model to measure fair value. Generally, we use inputs that
55
include quoted prices for similar assets or liabilities in active markets, other observable inputs for the asset orliability, and inputs that are derived principally from, or corroborated by, observable market data by correlationor other means.
Income Taxes
Since we conduct operations on a global basis, our effective tax rate has and will depend upon thegeographic distribution of our pre-tax earnings among locations with varying tax rates. Changes in the tax ratesof the various jurisdictions in which we operate affect our profits. In addition, we maintain a reserve for uncertaintax benefits, changes to which could impact our effective tax rate in the period such changes are made. Theeffective tax rate can also be impacted by changes in valuation allowances of deferred tax assets, and tax lawchanges.
Our provision for income taxes may change period-to-period based on specific events, such as thesettlement of income tax audits and changes in tax laws, as well as general factors, including the geographic mixof income before taxes, state and local taxes and the effects of the Company’s global income tax strategies. Wemaintain strategic management and operational activities in overseas subsidiaries. See Note 12, Income Taxes, inour consolidated financial statements for disclosures related to foreign and domestic pretax income, foreign anddomestic income tax expense (benefit) and the effect foreign taxes have on our overall effective tax rate.
We recognize a tax benefit from an uncertain tax position only if it is more likely than not to be sustainedupon examination based on the technical merits of the position. The amount of the accrual for which an exposureexists is measured by determining the amount that has a greater than 50 percent likelihood of being realized uponultimate settlement of the position. Components of the reserve are classified as a long-term liability in theconsolidated balance sheets. We record interest and penalties accrued in relation to uncertain tax benefits as acomponent of income tax expense.
We believe that we have identified all reasonably identifiable exposures and that the reserve we haveestablished for identifiable exposures is appropriate under the circumstances; however, it is possible thatadditional exposures exist and that exposures will be settled at amounts different from the amounts reserved. It isalso possible that changes in facts and circumstances could cause us to either materially increase or reduce thecarrying amount of our tax reserves.
Our deferred income taxes reflect the net tax effects of temporary differences between the carrying amountsof assets and liabilities for financial reporting purposes and their basis for income tax purposes, and thetemporary differences created by the tax effects of capital loss, net operating loss and tax credit carryforwards.We record valuation allowances to reduce deferred tax assets to the amounts that are more likely than not to berealized. We could recognize no benefit from our deferred tax assets or we could recognize some or all of thefuture benefit depending on the amount and timing of taxable income we generate in the future.
We intend to indefinitely reinvest substantially all of our foreign earnings in our foreign subsidiaries unlessthere is a tax–free manner under which to remit the earnings. The current analysis indicates that we havesufficient U.S. liquidity, including borrowing capacity, to fund foreseeable U.S. cash needs without requiring therepatriation of foreign cash. The 2017 Tax Act imposed a Toll Tax on a deemed repatriation of undistributedearnings of foreign subsidiaries. One time or unusual items that may impact our ability or intent to keep theforeign earnings and cash indefinitely reinvested include significant U.S. acquisitions, loans from a foreignsubsidiary, and changes in tax laws.
As of December 31, 2018, the Company has not provided deferred income taxes on unrepatriated earningsfrom foreign subsidiaries as they are deemed to be indefinitely reinvested. Such taxes would primarily beattributable to foreign withholding taxes and local income taxes when such earnings are distributed. As such, theCompany has determined the tax impact of repatriating these earnings would not be material as of December 31,2018.
56
On December 22, 2017, the SEC staff issued Staff Accounting Bulletin No. 118 to address the application ofU.S. GAAP in situations where a registrant does not have the necessary information available, prepared, oranalyzed (including computations) in reasonable detail to complete the accounting for certain income tax effectsof the 2017 Tax Act. The Company recognized the provisional tax impacts related to deemed repatriated earningsand the revaluation of deferred tax assets and liabilities and included these amounts in its consolidated financialstatements for the year ended December 31, 2017. The Company applied the guidance of SAB No. 118 whenaccounting for the enactment date effects of the 2017 Tax Act in 2017 and throughout 2018. The Companyfinalized its calculations and completed its accounting for the income tax effect of the 2017 Tax Act in December2018.
Loss Contingencies
We are subject to claims and lawsuits in the ordinary course of our business, including claims by employeesor former employees, with respect to our products and involving commercial disputes. We accrue for losscontingencies when it is deemed probable that a loss has been incurred and that loss is estimable. The amountsaccrued are based on the full amount of the estimated loss before considering insurance proceeds, if applicable,and do not include an estimate for legal fees expected to be incurred in connection with the loss contingency. Weconsistently accrue legal fees expected to be incurred in connection with loss contingencies as those fees areincurred by outside counsel as a period cost. Our financial statements do not reflect any material amounts relatedto possible unfavorable outcomes of claims and lawsuits to which we are currently a party because we currentlybelieve that such claims and lawsuits are not expected, individually or in the aggregate, to result in a material,adverse effect on our financial condition. However, it is possible that these contingencies could materially affectour results of operations, financial position and cash flows in a particular period if we change our assessment ofthe likely outcome of these matters.
Pension Benefits
The Company maintains defined benefit pension plans that cover certain employees in Austria, France,Japan, Germany and Switzerland. Various factors are considered in determining the pension liability, includingthe number of employees expected to be paid their salary levels and years of service, the expected return on planassets, the discount rate used to determine the benefit obligations, the timing of benefit payments and otheractuarial assumptions. If the actual results and events for the pension plans differ from current assumptions, thebenefit obligation may be over or under valued. We recognize the underfunded status of the defined benefitpension plans as an asset or a liability in the balance sheet, with changes in the funded status recorded throughother comprehensive income in the year in which those changes occur.
The Company’s discount rates are determined by considering current yield curves representing high quality,long-term fixed income instruments. The resulting discount rates are consistent with the duration of planliabilities. In 2018, the discount rate was prescribed as the current yield on corporate bonds with an averagerating of AA or AAA of equivalent currency and term to the liabilities.
The expected return on plan assets represents the average rate of return expected to be earned on plan assetsover the period the benefits included in the benefit obligation are to be paid. In developing the expected rate ofreturn, the Company considers returns of historical market data as well as actual returns on the plan assets. Usingthis reference information, the long-term return expectations for each asset category are developed according tothe allocation among those investment categories.
The net plan assets of the pension plans are invested in common trusts as of December 31, 2018. Commontrusts are classified as Level 2 in fair value hierarchy. The fair value of common trusts are valued at net assetvalue based on the fair values of the underlying investments of the trusts as determined by the sponsor of thetrusts.
57
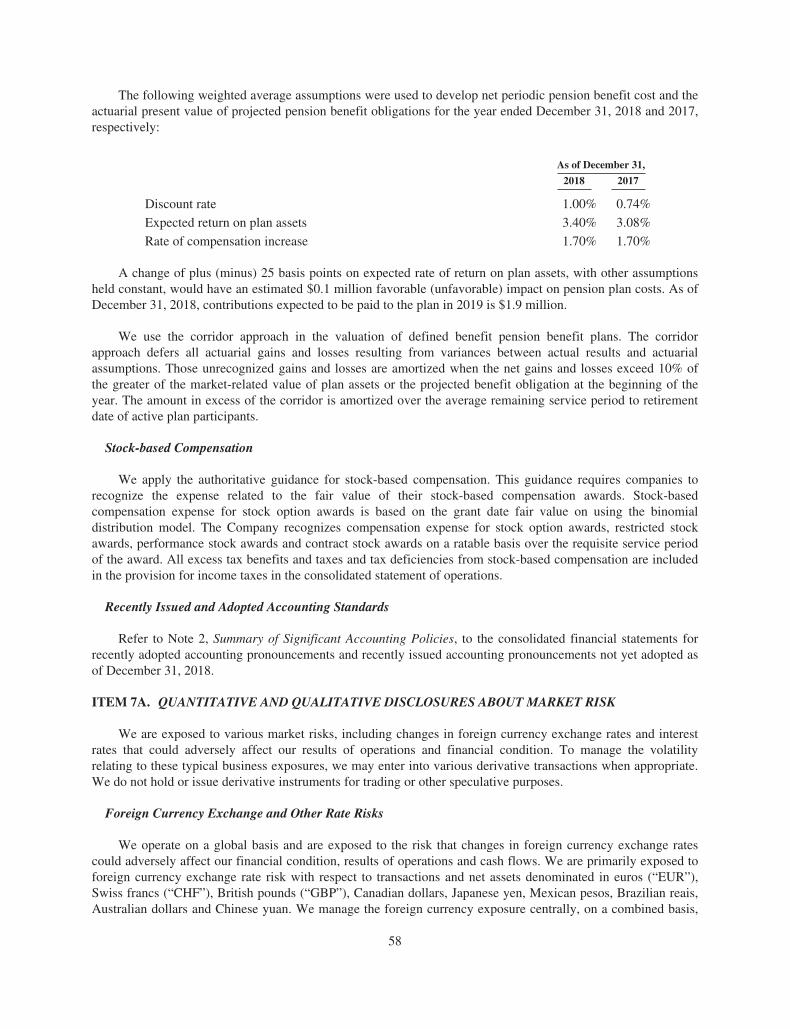
The following weighted average assumptions were used to develop net periodic pension benefit cost and theactuarial present value of projected pension benefit obligations for the year ended December 31, 2018 and 2017,respectively:
As of December 31,
2018 2017
Discount rate 1.00% 0.74%
Expected return on plan assets 3.40% 3.08%
Rate of compensation increase 1.70% 1.70%
A change of plus (minus) 25 basis points on expected rate of return on plan assets, with other assumptionsheld constant, would have an estimated $0.1 million favorable (unfavorable) impact on pension plan costs. As ofDecember 31, 2018, contributions expected to be paid to the plan in 2019 is $1.9 million.
We use the corridor approach in the valuation of defined benefit pension benefit plans. The corridorapproach defers all actuarial gains and losses resulting from variances between actual results and actuarialassumptions. Those unrecognized gains and losses are amortized when the net gains and losses exceed 10% ofthe greater of the market-related value of plan assets or the projected benefit obligation at the beginning of theyear. The amount in excess of the corridor is amortized over the average remaining service period to retirementdate of active plan participants.
Stock-based Compensation
We apply the authoritative guidance for stock-based compensation. This guidance requires companies torecognize the expense related to the fair value of their stock-based compensation awards. Stock-basedcompensation expense for stock option awards is based on the grant date fair value on using the binomialdistribution model. The Company recognizes compensation expense for stock option awards, restricted stockawards, performance stock awards and contract stock awards on a ratable basis over the requisite service periodof the award. All excess tax benefits and taxes and tax deficiencies from stock-based compensation are includedin the provision for income taxes in the consolidated statement of operations.
Recently Issued and Adopted Accounting Standards
Refer to Note 2, Summary of Significant Accounting Policies, to the consolidated financial statements forrecently adopted accounting pronouncements and recently issued accounting pronouncements not yet adopted asof December 31, 2018.
ITEM 7A. QUANTITATIVE AND QUALITATIVE DISCLOSURES ABOUT MARKET RISK
We are exposed to various market risks, including changes in foreign currency exchange rates and interestrates that could adversely affect our results of operations and financial condition. To manage the volatilityrelating to these typical business exposures, we may enter into various derivative transactions when appropriate.We do not hold or issue derivative instruments for trading or other speculative purposes.
Foreign Currency Exchange and Other Rate Risks
We operate on a global basis and are exposed to the risk that changes in foreign currency exchange ratescould adversely affect our financial condition, results of operations and cash flows. We are primarily exposed toforeign currency exchange rate risk with respect to transactions and net assets denominated in euros (“EUR”),Swiss francs (“CHF”), British pounds (“GBP”), Canadian dollars, Japanese yen, Mexican pesos, Brazilian reais,Australian dollars and Chinese yuan. We manage the foreign currency exposure centrally, on a combined basis,
58
which allows us to net exposures and to take advantage of any natural offsets. To mitigate the impact of currencyfluctuations on transactions denominated in nonfunctional currencies, we periodically enter into derivativefinancial instruments in the form of foreign currency exchange forward contracts with major financialinstitutions. We temporarily record realized and unrealized gains and losses on these contracts that qualify ascash flow hedges in other comprehensive income, and then recognize them in other income or expense when thehedged item affects net earnings.
From time to time, we enter into foreign currency forward exchange contracts to manage currencyexposures for transactions denominated in a currency other than an entity’s functional currency. As a result, theimpact of foreign currency gains/losses recognized in earnings are partially offset by gains/losses on the relatedforeign currency forward exchange contracts in the same reporting period.
On October 1, 2018, the Company entered into cross-currency swap agreements designated as netinvestment hedges to partially offset the effects of foreign currency translation on foreign subsidiaries. The totalnotional amount of our instruments designated as net investment hedges at December 31, 2018 was$354.5 million and GBP 128.3 million. Under the terms of these contracts, which have been designated as netinvestment hedges, we will make interest payments in GBP and receive interest in U.S. dollars and GBP. Uponthe maturity of these contracts, the Company will pay the notional amounts in EUR, GBP and CHF and receiveU.S. dollars and GBP from the counterparties.
On October 2, 2017, we entered into cross currency swap agreements to convert a notional amount of$300.0 million equivalent to 291.2 million of Swiss Franc denominated intercompany loans into U.S. dollars.The CHF denominated intercompany loans were the result of the purchase of intellectual property by a subsidiaryin Switzerland as part of the Codman Acquisition. The objective of these cross-currency swaps is to reducevolatility of earnings and cash flows associated with changes in the foreign currency exchange rate. Under theterms of these contracts, which have been designated as cash flow hedges, we will make interest payments inCHF and receive interest in U.S. dollars. Upon the maturity of these contracts, the Company will pay theprincipal amount of the loans in Swiss Francs and receive U.S. dollars from the counterparties. The total notionalamount of our cross-currency swap agreements designated as cash flow hedges at December 31, 2018 were$300.0 million.
On November 28, 2017, we entered into a foreign currency forward contract, with a notional amount of$8.9 million to mitigate the foreign currency exchange risk related to certain intercompany loans denominated inCHF. The contract was not designated as a hedging instrument. The foreign currency forward contract wassettled on September 28, 2018.
We maintain written policies and procedures governing our risk management activities. With respect toderivatives, changes in hedged items are generally expected to be completely offset by changes in the fair valueof hedge instruments. Consequently, foreign currency exchange contracts would not subject us to material riskdue to exchange rate movements, because gains and losses on these contracts offset gains and losses on theassets, liabilities or transactions being hedged.
The results of operations discussed herein have not been materially affected by inflation.
Interest Rate Risk
Cash and Cash Equivalents—We are exposed to the risk of interest rate fluctuations on the interest incomeearned on our cash and cash equivalents. A hypothetical 100 basis points movement in interest rates applicable toour cash and cash equivalents outstanding at December 31, 2018 would increase interest income byapproximately $1.4 million on an annual basis. No significant decrease in interest income would be expected asour cash balances are earning interest at rates of approximately 2 basis points. We are subject to foreign currencyexchange risk with respect to cash balances maintained in foreign currencies.
59
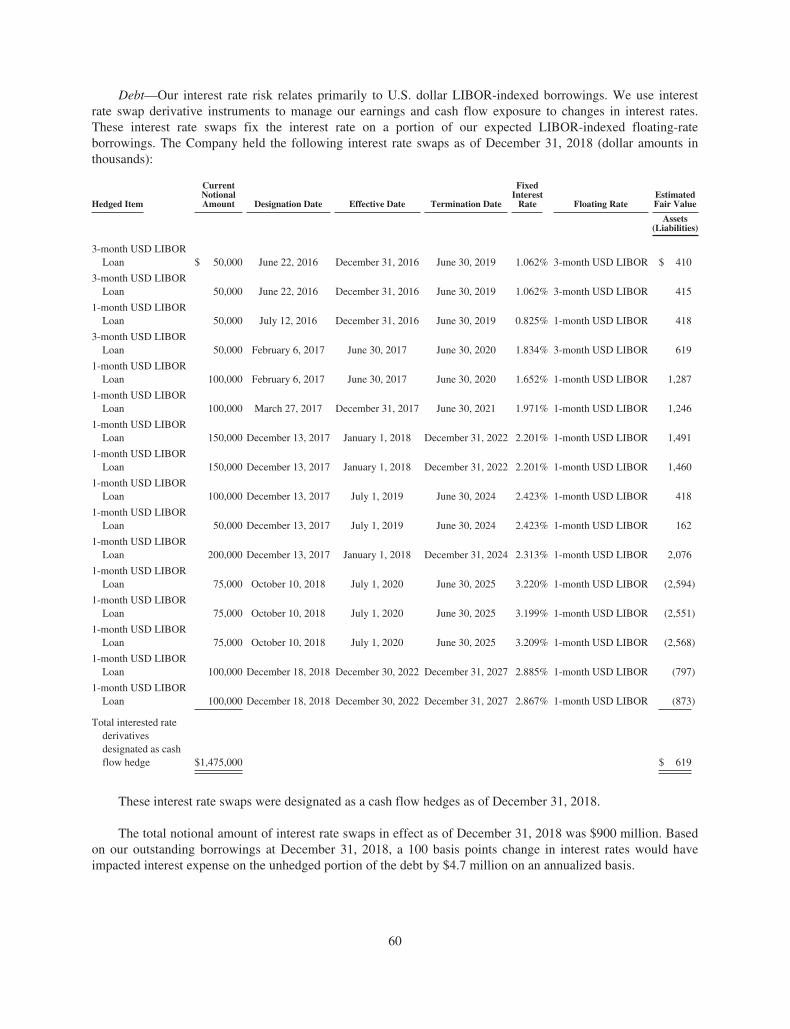
Debt—Our interest rate risk relates primarily to U.S. dollar LIBOR-indexed borrowings. We use interestrate swap derivative instruments to manage our earnings and cash flow exposure to changes in interest rates.These interest rate swaps fix the interest rate on a portion of our expected LIBOR-indexed floating-rateborrowings. The Company held the following interest rate swaps as of December 31, 2018 (dollar amounts inthousands):
Hedged Item
CurrentNotionalAmount Designation Date Effective Date Termination Date
FixedInterest
Rate Floating RateEstimatedFair Value
Assets(Liabilities)
3-month USD LIBORLoan $ 50,000 June 22, 2016 December 31, 2016 June 30, 2019 1.062% 3-month USD LIBOR $ 410
3-month USD LIBORLoan 50,000 June 22, 2016 December 31, 2016 June 30, 2019 1.062% 3-month USD LIBOR 415
1-month USD LIBORLoan 50,000 July 12, 2016 December 31, 2016 June 30, 2019 0.825% 1-month USD LIBOR 418
3-month USD LIBORLoan 50,000 February 6, 2017 June 30, 2017 June 30, 2020 1.834% 3-month USD LIBOR 619
1-month USD LIBORLoan 100,000 February 6, 2017 June 30, 2017 June 30, 2020 1.652% 1-month USD LIBOR 1,287
1-month USD LIBORLoan 100,000 March 27, 2017 December 31, 2017 June 30, 2021 1.971% 1-month USD LIBOR 1,246
1-month USD LIBORLoan 150,000 December 13, 2017 January 1, 2018 December 31, 2022 2.201% 1-month USD LIBOR 1,491
1-month USD LIBORLoan 150,000 December 13, 2017 January 1, 2018 December 31, 2022 2.201% 1-month USD LIBOR 1,460
1-month USD LIBORLoan 100,000 December 13, 2017 July 1, 2019 June 30, 2024 2.423% 1-month USD LIBOR 418
1-month USD LIBORLoan 50,000 December 13, 2017 July 1, 2019 June 30, 2024 2.423% 1-month USD LIBOR 162
1-month USD LIBORLoan 200,000 December 13, 2017 January 1, 2018 December 31, 2024 2.313% 1-month USD LIBOR 2,076
1-month USD LIBORLoan 75,000 October 10, 2018 July 1, 2020 June 30, 2025 3.220% 1-month USD LIBOR (2,594)
1-month USD LIBORLoan 75,000 October 10, 2018 July 1, 2020 June 30, 2025 3.199% 1-month USD LIBOR (2,551)
1-month USD LIBORLoan 75,000 October 10, 2018 July 1, 2020 June 30, 2025 3.209% 1-month USD LIBOR (2,568)
1-month USD LIBORLoan 100,000 December 18, 2018 December 30, 2022 December 31, 2027 2.885% 1-month USD LIBOR (797)
1-month USD LIBORLoan 100,000 December 18, 2018 December 30, 2022 December 31, 2027 2.867% 1-month USD LIBOR (873)
Total interested ratederivativesdesignated as cashflow hedge $1,475,000 $ 619
These interest rate swaps were designated as a cash flow hedges as of December 31, 2018.
The total notional amount of interest rate swaps in effect as of December 31, 2018 was $900 million. Basedon our outstanding borrowings at December 31, 2018, a 100 basis points change in interest rates would haveimpacted interest expense on the unhedged portion of the debt by $4.7 million on an annualized basis.
60
ITEM 8. FINANCIAL STATEMENTS AND SUPPLEMENTARY DATA
Financial statements and the financial statement schedule specified by this Item, together with the reportthereon of PricewaterhouseCoopers LLP, are presented following Item 15 of this report.
Information on quarterly results of operations is set forth in our financial statements under Note 17,“Selected Quarterly Information—Unaudited,” to our consolidated financial statements.
ITEM 9. CHANGES IN AND DISAGREEMENTS WITH ACCOUNTANTS ON ACCOUNTING ANDFINANCIAL DISCLOSURES
Not applicable.
ITEM 9A. CONTROLS AND PROCEDURES
Evaluation of Disclosure Controls and Procedures
We maintain disclosure controls and procedures that are designed to provide reasonable assurance thatinformation required to be disclosed in our Exchange Act reports is recorded, processed, summarized andreported within the time periods specified in the Securities and Exchange Commission’s rules and forms and thatsuch information is accumulated and communicated to our management, including our principal executive officerand principal financial officer, as appropriate, to allow for timely decisions regarding required disclosure.Disclosure controls and procedures, no matter how well designed and operated, can provide only reasonableassurance of achieving the desired control objectives, and management is required to apply its judgment inevaluating the cost-benefit relationship of possible controls and procedures. Management has designed ourdisclosure controls and procedures to provide reasonable assurance of achieving the desired control objectives.
As required by Exchange Act Rule 13a-15(b), we have carried out an evaluation, under the supervision andwith the participation of our management, including our principal executive officer and principal financialofficer, of the effectiveness of the design and operation of our disclosure controls and procedures as ofDecember 31, 2018. Based upon this evaluation, our principal executive officer and principal financial officerconcluded that our disclosure controls and procedures were effective as of December 31, 2018 to provide suchreasonable assurance.
Management’s Report on Internal Control Over Financial Reporting
Management is responsible for establishing and maintaining adequate internal control over financialreporting as defined in Rules 13a-15(f) under the Securities Exchange Act of 1934, as amended. Internal controlover financial reporting is designed to provide reasonable assurance regarding the reliability of financialreporting and the preparation of financial statements for external purposes in accordance with generally acceptedaccounting principles in the United States of America (“GAAP”). We recognize that because of its inherentlimitations, internal control over financial reporting may not prevent or detect misstatements. Also, projections ofany evaluation of effectiveness to future periods are subject to the risk that controls may become inadequatebecause of changes in conditions or that the degree of compliance with the policies and procedures maydeteriorate.
To evaluate the effectiveness of our internal control over financial reporting, management used the criteriadescribed in Internal Control—Integrated Framework (2013) issued by the Committee of SponsoringOrganizations of the Treadway Commission (“COSO”). Based upon this evaluation, management concluded thatour internal control over financial reporting was effective as of December 31, 2018.
The effectiveness of the Company’s internal control over financial reporting as of December 31, 2018 hasbeen audited by PricewaterhouseCoopers LLP, an independent registered public accounting firm, as stated intheir report which appears herein.
61

Changes in Internal Control Over Financial Reporting
There were no changes in our internal control over financial reporting (as defined in Rule 13a-15(f) underthe Exchange Act) that occurred during the quarter ended December 31, 2018 that have materially affected, orare reasonably likely to materially affect, our internal control over financial reporting.
ITEM 9B. OTHER INFORMATION
Not applicable.
62
PART III
INCORPORATION BY REFERENCE
The information called for by Item 5. Market for Registrant’s Common Equity, Related Stockholder Mattersand Issuer Purchases of Equity Securities relating to equity compensation plans, Item 10. Directors, ExecutiveOfficers and Corporate Governance, Item 11. Executive Compensation, Item 12. Security Ownership of CertainBeneficial Owners and Management and Related Stockholder Matters, Item 13. Certain Relationships andRelated Transactions, and Director Independence and Item 14. Principal Accountant Fees and Services isincorporated herein by reference to the Company’s definitive proxy statement for its Annual Meeting ofStockholders scheduled to be held on May 16, 2019, which definitive proxy statement is expected to be filed withthe Commission not later than 120 days after the end of the fiscal year to which this report relates.
63
PART IV
ITEM 15. EXHIBITS AND FINANCIAL STATEMENT SCHEDULE
(a) Documents filed as a part of this report.
1. Financial Statements.
The following financial statements and financial statement schedules are filed as a part of this report:
Report of Independent Registered Public Accounting Firm F-1
Consolidated Statements of Operations for the years ended December 31, 2018, 2017 and 2016 F-3
Consolidated Statements of Comprehensive Income (Loss) for the years ended December 31, 2018, 2017and 2016 F-4
Consolidated Balance Sheets as of December 31, 2018 and 2017 F-5
Consolidated Statements of Cash Flows for the years ended December 31, 2018, 2017 and 2016 F-6
Consolidated Statements of Changes in Stockholders’ Equity for the years ended December 31, 2018,2017 and 2016 F-7
Notes to Consolidated Financial Statements F-8
2. Financial Statement ScheduleSchedule II — Valuation and Qualifying Accounts for the years ended December 31, 2018, 2017 and
2016 F-59
All other schedules not listed above have been omitted, because they are not applicable or are not required,or because the required information is included in the consolidated financial statements or notes thereto.
3. Exhibits required to be filed by Item 601 of Regulation S-K.
2.1 Stock Purchase Agreement, dated as of October 25, 2013, by and between Covidien GroupS.A.R.L. and Integra LifeSciences Corporation (Incorporated by Reference to Exhibit 10.1 to theCompany’s Current Report on Form 8-K filed on January 15, 2014)
2.2 Stock and Asset Purchase Agreement by and among Medtronic, Inc., Medtronic XomedInstrumentation, SAS, and Integra LifeSciences Corporation, dated as of September 12, 2014(Incorporated by reference to Exhibit 2.1 to the Company’s Current Report on Form 8-K filed onOctober 27, 2014)
2.3 Separation and Distribution Agreement between Integra LifeSciences Holdings Corporation andSeaSpine Holdings Corporation, dated as of June 30, 2015 (Incorporated by reference toExhibit 2.1 to the Company’s Current Report on Form 8-K filed on July 7, 2015)
2.4 Agreement and Plan of Merger by and among Integra LifeSciences Corporation, Patriot S1, Inc.,TEI Biosciences Inc. and Dr. Yiannis Monovoukas, dated as of June 26, 2015 (Incorporated byreference to Exhibit 2.1 to the Company’s Current Report on Form 8-K filed on July 20, 2015)
2.5 Agreement and Plan of Merger by and among Integra LifeSciences Corporation, Patriot S2, Inc.,TEI Medical Inc. and Dr. Yiannis Monovoukas, dated as of June 26, 2015 (Incorporated byreference to Exhibit 2.2 to the Company’s Current Report on Form 8-K filed on July 20, 2015)
2.6 Agreement and Plan of Merger by and among Integra LifeSciences Holdings Corporation, IntegraDerma, Inc., and Derma Sciences, Inc. dated as of January 10, 2017 (Incorporated by reference toExhibit 2.1 to the Company’s Current Report on Form 8-K filed on January 11, 2017)
2.7 Binding Offer Letter by and among Integra LifeSciences Holdings Corporation and DePuySynthes, Inc., dated as of February 14, 2017 (Incorporated by reference to Exhibit 2.1 to theCompany’s Current Report on Form 8-K filed on February 15, 2017
64
2.7(a) Asset Purchase Agreement accepted and countersigned by DePuy Synthes, dated May 11, 2017(Incorporated by reference to Exhibit 2.1 to the Company’s Current Report on Form 8-K filed onMay 15, 2017)
2.8 Asset Purchase Agreement, dated September 8, 2017, between the Company and certain of itssubsidiaries and Natus Medical Incorporated (Incorporated by reference to Exhibit 2.1 to theCompany’s Quarterly Report on Form 10-Q filed on October 26, 2017)
3.1(a) Amended and Restated Certificate of Incorporation of the Company dated February 16, 1993(Incorporated by reference to Exhibit 3.1(a) to the Company’s Annual Report on Form 10-K forthe year ended December 31, 2005)
3.1(b) Certificate of Amendment to Amended and Restated Certificate of Incorporation of the Companydated May 22, 1998 (Incorporated by reference to Exhibit 3.1(b) to the Company’s Annual Reporton Form 10-K for the year ended December 31, 1998)
3.1(c) Certificate of Amendment to Amended and Restated Certificate of Incorporation of the Companydated May 17, 1999 (Incorporated by reference to Exhibit 3.1(c) to the Company’s Annual Reporton Form 10-K for the year ended December 31, 2004)
3.1(d) Certificate of Amendment to Amended and Restated Certificate of Incorporation of the Companydated December 21, 2016 (Incorporated by reference to Exhibit 3.1 to the Company’s CurrentReport on Form 8-K filed on December 22, 2016)
3.2(a) Amended and Restated Bylaws of the Company, effective as of May 17, 2012 (Incorporated byreference to Exhibit 3.2 to the Company’s Current Report on Form 8-K filed on April 13, 2012)
3.2(b) Second Amended and Restated Bylaws of Integra LifeSciences Holdings Corporation, effective asof December 11, 2018 (Incorporated by reference to Exhibit 3.2 to the Company’s Current Reporton Form 8-k filed on December 12, 2018)
4.1 Purchase Agreement, dated June 9, 2011, by and between Integra LifeSciences HoldingsCorporation and J.P. Morgan Securities LLC, Merrill Lynch, Pierce, Fenner & Smith Incorporated,Morgan Stanley & Co. LLC, Deutsche Bank Securities Inc., RBC Capital Markets, LLC and WellsFargo Securities, LLC (Incorporated by reference to Exhibit 4.1 to the Company’s Current Reporton Form 8-K filed on June 15, 2011)
4.2 Indenture, dated June 15, 2011, by and between Integra LifeSciences Holdings Corporation andWells Fargo Bank, National Association, as trustee (Incorporated by reference to Exhibit 4.2 to theCompany’s Current Report on Form 8-K filed on June 15, 2011)
4.3(a) Credit Agreement, dated as of December 22, 2005, among Integra LifeSciences HoldingsCorporation, the lenders party thereto, Bank of America, N.A., as Administrative Agent, SwingLine Lender and L/C Issuer, Citibank FSB and SunTrust Bank, as Co-Syndication Agents, andRoyal Bank of Canada and Wachovia Bank, National Association, as Co-Documentation Agents(Incorporated by reference to Exhibit 10.1 to the Company’s Current Report on Form 8-K filed onDecember 29, 2005)
4.3(b) First Amendment, dated as of February 15, 2006, among Integra LifeSciences HoldingsCorporation, the lenders party thereto, Bank of America, N.A., as Administrative Agent, SwingLine Lender and L/C Issuer, Citibank FSB and SunTrust Bank, as Co-Syndication Agents, andRoyal Bank of Canada and Wachovia Bank, National Association, as Co-Documentation Agents(Incorporated by reference to Exhibit 4.3(b) to the Company’s Annual Report on Form 10-K forthe year ended December 31, 2005)
4.3(c) Second Amendment, dated as of February 23, 2007, among Integra LifeSciences HoldingsCorporation, the lenders party thereto, Bank of America, N.A., as Administrative Agent, SwingLine Lender and L/C Issuer, Citibank FSB and SunTrust Bank, as Co-Syndication Agents, andRoyal Bank of Canada and Wachovia Bank, National Association, as Co-Documentation Agents(Incorporated by reference to Exhibit 4.1 to the Company’s Current Report on Form 8-K filed onFebruary 27, 2007)
65
4.3(d) Third Amendment, dated as of June 4, 2007, among Integra LifeSciences Holdings Corporation,the lenders party thereto, Bank of America, N.A., as Administrative Agent, Swing Line Lender andL/C Issuer, Citibank, N.A., successor by merger to Citibank, FSB, as Syndication Agent andJPMorgan Chase Bank, N.A., Deutsche Bank Trust Company Americas and Royal Bank ofCanada, as Co-Documentation Agents (Incorporated by reference to Exhibit 4.1 to the Company’sCurrent Report on Form 8-K filed on June 6, 2007)
4.3(e) Fourth Amendment, dated as of September 5, 2007, among Integra LifeSciences HoldingsCorporation, the lenders party thereto, Bank of America, N.A., as Administrative Agent, SwingLine Lender and L/C Issuer, Citibank, N.A., successor by merger to Citibank FSB, as SyndicationAgent and JPMorgan Chase Bank, N.A., Deutsche Bank Trust Company Americas and RoyalBank of Canada, as Co-Documentation Agents (Incorporated by reference to Exhibit 4.1 to theCompany’s Current Report on Form 8-K filed on September 6, 2007)
4.3(f) Amended and Restated Credit Agreement, dated as of August 10, 2010, among IntegraLifeSciences Holdings Corporation, the lenders party thereto, Bank of America, N.A., asAdministrative Agent, Swing Line Lender and L/C Issuer, JP Morgan Chase Bank, as SyndicationAgent, and HSBC Bank USA, NA, RBC Capital Markets, Wells Fargo Bank, N.A., Fifth ThirdBank, DNB NOR Bank ASA and TD Bank, N.A., as Co-Documentation Agents (Incorporated byreference to Exhibit 10.1 to the Company’s Current Report on Form 8-K filed on August 10, 2010)
4.3(g) Second Amended and Restated Credit Agreement, dated as of June 8, 2011, among IntegraLifeSciences Holdings Corporation, the lenders party thereto, Bank of America, N.A. asAdministrative Agent, Swing Line Lender and L/C Issuer, JPMorgan Chase Bank N.A. asSyndication Agent, and, HSBC Bank USA, NA, Royal Bank of Canada, Wells Fargo Bank, N.A.,Fifth Third Bank, DNB NOR Bank ASA, and TD Bank, N.A., as Co-Documentation Agents(Incorporated by reference to Exhibit 4.3 to the Company’s Quarterly Report on Form 10-Q filedon July 29, 2011)
4.3(h) First Amendment, dated as of May 11, 2012, to Second Amended and Restated Credit Agreementdated as of June 8, 2011, among Integra LifeSciences Holdings Corporation, the lenders partythereto, Bank of America, N.A., as Administrative Agent, Swing Line Lender and L/C Issuer,JPMorgan Chase Bank, N.A., as Syndication Agent, and HSBC Bank, NA, Royal Bank of Canada,Wells Fargo Bank, NA, Fifth Third Bank, DNB Nor Bank ASA and TD Bank, N.A., asCo-Documentation Agents (Incorporated by reference to Exhibit 4.1 to the Company’s CurrentReport on Form 8-K filed on May 14, 2012)
4.3(i) Second Amendment, dated as of June 21, 2013, to Second Amended and Restated CreditAgreement dated as of June 8, 2011, among Integra LifeSciences Holdings Corporation, thelenders party thereto, Bank of America, N.A., as Administrative Agent, Swing Line Lender andL/C Issuer, JPMorgan Chase Bank, N.A., as Syndication Agent, and HSBC Bank USA, NationalAssociation, Royal Bank of Canada, Wells Fargo Bank, National Association, Fifth Third Bank,DNB Bank ASA and TD Bank, N.A., as Co-Documentation Agents (Incorporated by reference toExhibit 4.1 to the Company’s Current Report on Form 8-K filed on June 24, 2013)
4.3(j) Third Amended and Restated Credit Agreement, dated as of July 2, 2014, among IntegraLifeSciences Holdings Corporation, the other lenders party hereto, Bank of America, N.A., asAdministrative Agent, Swing Line Lender and L/C Issuer, Wells Fargo Bank, NationalAssociation, as Syndication Agent and HSBC Bank USA, National Association, Royal Bank ofCanada, Citizens Bank, National Association, DNB Capital LLC, Credit Agricole-Corporate andInvestment Bank and TD Bank, N.A., as Co-Documentation Agents (Incorporated by reference toExhibit 4.1 to the Company’s Current Report on Form 8-K filed on July 9, 2014)
66
4.3(k) First Amendment, dated as of December 19, 2014, to that Third Amended and Restated CreditAgreement, among Integra LifeSciences Holdings Corporation, a syndicate of lending banks, Bankof America, N.A., as Administrative Agent, Swing Line Lender and L/C Issuer, Wells Fargo Bank,National Association, as Syndication Agent, and HSBC Bank USA, National Association, RoyalBank of Canada, Citizens Bank, National Association, DNB Capital LLC, Crédit Agricole-Corporate and Investment Bank, and TD Bank, N.A., as Co-Documentation Agents (Incorporatedby reference to Exhibit 4.1 to the Company’s Current Report on Form 8-K filed on December 29,2014)
4.3(l) Second Amendment, dated August 28, 2015, to that Third Amended and Restated CreditAgreement, among Integra LifeSciences Holdings Corporation, a syndicate of lending banks, Bankof America, N.A., as Administrative Agent, Swing Line Lender and L/C Issuer, Wells Fargo Bank,National Association, as Syndication Agent, and HSBC Bank USA, National Association, RoyalBank of Canada, Citizens Bank, National Association, DNB Capital LLC, Crédit Agricole-Corporate and Investment Bank and TD Bank, N.A., as Co-Documentation Agents (Incorporatedby reference to Exhibit 4.1 to the Company’s Current Report on Form 8-K filed on September 1,2015)
4.3(m) Fourth Amended and Restated Credit Agreement, dated as of December 7, 2016, among IntegraLifeSciences Holdings Corporation, the other lenders party hereto, Bank of America, N.A., asAdministrative Agent, Swing Line Lender and L/C Issuer, Securities, LLC, Citizens Bank, N.A.,DNB Capital LLC, HSBC Bank PLC, HSBC Bank USA. N.A., The Bank of Tokyo-MitsubishiUFJ, LTD., PNC Bank, N.A., Royal Bank of Canada, SunTrust Bank, TD Bank, N.A., JPMorganand Chase Bank, N.A., Mizuho Bank, LTD., and Bank of Nova Scotia, as Co-DocumentationAgents (Incorporated by reference to Exhibit 4.1 to the Company’s Current Report on Form 8-Kfiled on December 7, 2016)
4.3(n) First Amendment to the Fourth Amended and Restated Credit Agreement, dated as of March 31,2017, among Integra LifeSciences Holdings Corporation, a syndicate of lending banks, and Bankof America, N.A., as Administrative Agent (Incorporated by reference to Exhibit 4.1 to theCompany’s Current Report on Form 8-K filed on April 4, 2017)
4.3(o) Fifth Amended and Restated Credit Agreement, dated as of May 3, 2018, among IntegraLifeSciences Holdings Corporation, the other lenders party hereto, Bank of America, N.A., asAdministrative Agent, Swing Line Lender and L/C Issuer, JPMorgan Chase Bank, N.A. and WellsFargo Bank, N.A., as Co-Syndication Agents, and PNC Bank, N.A., The Bank of Tokyo-Mitsubishi UFJ, Ltd., Citibank N.A., Citizens Bank, N.A., DNB Bank ASA, New York Branch,HSBC Bank plc, HSBC Bank USA, National Association, Suntrust Bank, TD Bank, N.A., Bank ofNova Scotia and Capital One, National Association, as Co-Documentation Agents (Incorporatedby reference to Exhibit 4.1 to the Company’s Current Report on Form 8-K filed on May 9, 2018)
4.4 Security Agreement, dated as of December 22, 2005, among Integra LifeSciences HoldingsCorporation and the additional grantors party thereto in favor of Bank of America, N.A., asadministrative and collateral agent (Incorporated by reference to Exhibit 4.4 to the Company’sAnnual Report on Form 10-K for the year ended December 31, 2005)
4.5 Pledge Agreement, dated as of December 22, 2005, among Integra LifeSciences HoldingsCorporation and the additional grantors party thereto in favor of Bank of America, N.A., asadministrative and collateral agent (Incorporated by reference to Exhibit 4.5 to the Company’sAnnual Report on Form 10-K for the year ended December 31, 2005)
4.6 Subsidiary Guaranty Agreement, dated as of December 22, 2005, among the guarantors partythereto and individually as a “Guarantor”), in favor of Bank of America, N.A., as administrativeand collateral agent (Incorporated by reference to Exhibit 4.6 to the Company’s Annual Report onForm 10-K for the year ended December 31, 2005)
4.7 Indenture, dated June 11, 2007, among Integra LifeSciences Holdings Corporation, IntegraLifeSciences Corporation and Wells Fargo Bank, N.A., as trustee (Incorporated by reference toExhibit 4.1 to the Company’s Current Report on Form 8-K filed on June 12, 2007)
67
4.8 Form of 2.75% Senior Convertible Note due 2010 (included in Exhibit 4.8) (Incorporated byreference to Exhibit B to Exhibit 4.1 to the Company’s Current Report on Form 8-K filed onJune 12, 2007)
4.9 Indenture, dated June 11, 2007, among Integra LifeSciences Holdings Corporation, IntegraLifeSciences Corporation and Wells Fargo Bank, N.A., as trustee (Incorporated by reference toExhibit 4.3 to the Company’s Current Report on Form 8-K filed on June 12, 2007)
4.10 Form of 2.375% Senior Convertible Note due 2012 (included in Exhibit 4.10) (Incorporated byreference to Exhibit B to Exhibit 4.3 to the Company’s Current Report on Form 8-K filed onJune 12, 2007)
4.11 Registration Rights Agreement, dated June 11, 2007, among Integra LifeSciences HoldingsCorporation, Banc of America Securities LLC, J.P. Morgan Securities Inc. and Morgan Stanley &Co., Incorporated, as representatives of the several initial purchasers (Incorporated by reference toExhibit 4.5 to the Company’s Current Report on Form 8-K filed on June 12, 2007)
4.12 Registration Rights Agreement, dated June 11, 2007, among Integra LifeSciences HoldingsCorporation, Banc of America Securities LLC, J.P. Morgan Securities Inc. and Morgan Stanley &Co., Incorporated, as representatives of the several initial purchasers (Incorporated by reference toExhibit 4.6 to the Company’s Current Report on Form 8-K filed on June 12, 2007)
10.1(b) Lease Modification #2 entered into as of October 28, 2005, by and between Plainsboro Associatesand Integra LifeSciences Corporation (Incorporated by reference to Exhibit 10.1 to the Company’sCurrent Report on Form 8-K filed on November 2, 2005)
10.1(c) Lease Modification #3 entered into as of March 2, 2011, by and between Plainsboro Associatesand Integra LifeSciences Corporation (Incorporated by reference to Exhibit 10.1 to the Company’sCurrent Report on Form 8-K filed on March 3, 2011)
10.1(d) Lease Modification #4 entered into as of April 20, 2017, by and between Plainsboro Associatesand Integra LifeSciences Corporation (Incorporated by reference to Exhibit 10.1 to the Company’sCurrent Report on Form 8-K filed on April 25, 2017)
10.2 (a) Equipment Lease Agreement between Medicus Corporation and the Company, dated as of June 1,2000 (Incorporated by reference to Exhibit 10.1 to the Company’s Quarterly Report on Form 10-Qfor the quarter ended June 30, 2000)
10.2(b) First Amendment to Equipment Lease Agreement between Medicus Corporation and theCompany, dated as of June 29, 2010 (Incorporated by reference to Exhibit 10.2 to the Company’sQuarterly Report on Form 10-Q for the quarter ended June 30, 2010)
10.3(b) Form of Indemnification Agreement for Non-Employee Directors and Officers (effective prior toFebruary 15, 2019) (Incorporated by reference to Exhibit 10.1 to the Company’s Current Report onForm 8-K filed on December 24, 2008)*
10.3(c) 10.3 (c) Form of Indemnification Agreement for Non-Employee Director and Officers effectiveFebruary 15, 2019. *
10.4 1996 Incentive Stock Option and Non-Qualified Stock Option Plan (as amended throughDecember 27, 1997) (Incorporated by reference to Exhibit 10.4 to the Company’s Current Reporton Form 8-K filed on February 3, 1998)*
10.5 1998 Stock Option Plan (amended and restated as of July 26, 2005) (Incorporated by reference toExhibit 10.3 to the Company’s Quarterly Report on Form 10-Q for the quarter endedSeptember 30, 2005)*
10.6 1999 Stock Option Plan (amended and restated as of July 26, 2005) (Incorporated by reference toExhibit 10.4 to the Company’s Quarterly Report on Form 10-Q for the quarter endedSeptember 30, 2005)*
10.7(a) Employee Stock Purchase Plan (as amended on May 17, 2004) (Incorporated by reference toExhibit 4.1 to the Company’s Registration Statement on Form S-8 (Registration No. 333-127488)filed on August 12, 2005)*
68
10.7(b) First Amendment to Employee Stock Purchase Plan, dated October 26, 2005 (Incorporated byreference to Exhibit 10.1 to the Company’s Current Report on Form 8-K filed on November 1,2005)*
10.8(a) 2000 Equity Incentive Plan (amended and restated as of July 26, 2005) (Incorporated by referenceto Exhibit 10.5 to the Company’s Quarterly Report on Form 10-Q for the quarter endedSeptember 30, 2005)*
10.8(b) Amendment to 2000 Equity Incentive Plan (effective as of May 17, 2012) (Incorporated byreference to Exhibit 10.7 to the Company’s Quarterly Report on Form 10-Q for the quarter endedJune 30, 2012)*
10.8(c) Amendment to 2000 Equity Incentive Plan (effective as of January 1, 2013) (Incorporated byreference to Exhibit 10.8(c) to the Company’s Annual Report on Form 10-K for the year endedDecember 31, 2012)*
10.9(a) 2001 Equity Incentive Plan (amended and restated as of July 26, 2005) (Incorporated by referenceto Exhibit 10.6 to the Company’s Quarterly Report on Form 10-Q for the quarter endedSeptember 30, 2005)*
10.9(b) Amendment to 2001 Equity Incentive Plan (effective as of May 17, 2012) (Incorporated byreference to Exhibit 10.8 to the Company’s Quarterly Report on Form 10-Q for the quarter endedJune 30, 2012)*
10.9(c) Amendment to 2001 Equity Incentive Plan (effective as of January 1, 2013) (Incorporated byreference to Exhibit 10.9(c) to the Company’s Annual Report on Form 10-K for the year endedDecember 31, 2012)*
10.10(a) Second Amended and Restated 2003 Equity Incentive Plan effective May 19, 2010 (Incorporatedby reference to Exhibit 10 to the Company’s Current Report on Form 8-K filed May 21, 2010)*
10.10(b) Amendment to the Second Amended and Restated 2003 Equity Incentive Plan effective May 17,2012 (Incorporated by reference to Exhibit 10.9 to the Company’s Quarterly Report on Form 10-Qfor the quarter ended June 30, 2012)*
10.10(c) Amendment to the Second Amended and Restated 2003 Equity Incentive Plan effective January 1,2013 (Incorporated by reference to Exhibit 10.4 to the Company’s Quarterly Report on Form 10-Qfor the quarter ended March 31, 2013)*
10.10(d) Third Amended and Restated 2003 Equity Incentive Plan effective May 22, 2015 (Incorporated byreference to Exhibit 10.1 to the Company’s Current Report on Form 8-K filed on May 29, 2015)*
10.10(e) Fourth Amended and Restated 2003 Equity Incentive Plan, effective May 23, 2017 (Incorporatedby reference to Exhibit 10.1 to the Company’s Current Report on Form 8-K filed on May 25, 2017)
10.11(a) Second Amended and Restated Employment Agreement dated July 27, 2004 between theCompany and Stuart M. Essig (Incorporated by reference to Exhibit 10.1 to the Company’sQuarterly Report on Form 10-Q for the quarter ended September 30, 2004)*
10.11(b) Amendment 2006-1, dated as of December 19, 2006, to the Second Amended and RestatedEmployment Agreement, between the Company and Stuart M. Essig (Incorporated by reference toExhibit 10.1 to the Company’s Current Report on Form 8-K filed on December 22, 2006)*
10.11(c) Amendment 2008-1, dated as of March 6, 2008, to the Second Amended and RestatedEmployment Agreement, between the Company and Stuart M. Essig (Incorporated by reference toExhibit 10.12(c) to the Company’s Annual Report on Form 10-K for the year ended December 31,2007)*
10.11(d) Amendment 2008-2, dated as of August 6, 2008, to the Second Amended and RestatedEmployment Agreement between Stuart M. Essig and the Company (Incorporated by reference toExhibit 10.7 to the Company’s Quarterly Report on Form 10-Q for the quarter ended June 30,2008)*
10.11(e) Amendment 2009-1, dated as of April 13, 2009, to the Second Amended and RestatedEmployment Agreement between Stuart M. Essig and the Company (Incorporated by reference toExhibit 10.2 to the Company’s Current Report on Form 8-K filed on April 13, 2009)*
69
10.11(f) Letter Agreement dated May 17, 2011 between the Company and Stuart M. Essig (Incorporated byreference to Exhibit 10.1 to the Company’s Current Report on Form 8-K filed May 23, 2011)*
10.11(g) Letter dated December 20, 2011 from Stuart M. Essig to the Company (Incorporated by referenceto Exhibit 10.3 to the Company’s Current Report on Form 8-K filed December 23, 2011)*
10.11(h) Letter Agreement dated June 7, 2012 between Stuart M. Essig and the Company (Incorporated byreference to Exhibit 10.1 to the Company’s Current Report on Form 8-K filed on June 7, 2012)*
10.12 Indemnity letter agreement dated December 27, 1997 from the Company to Stuart M. Essig(Incorporated by reference to Exhibit 10.5 to the Company’s Current Report on Form 8-K filed onFebruary 3, 1998)*
10.13(a) Registration Rights Provisions for Stuart M. Essig (Incorporated by reference to Exhibit B ofExhibit 10.1 to the Company’s Current Report on Form 8-K filed on February 3, 1998)*
10.13(b) Registration Rights Provisions for Stuart M. Essig (Incorporated by reference to Exhibit 10.2 to theCompany’s Current Report on Form 8-K filed on January 8, 2001)*
10.13(c) Registration Rights Provisions for Stuart M. Essig (Incorporated by reference to Exhibit B ofExhibit 10.1 to the Company’s Quarterly Report on Form 10-Q for the quarter endedSeptember 30, 2004)*
10.14(a) Amended and Restated 2005 Employment Agreement between John B. Henneman, III and theCompany dated December 19, 2005 (Incorporated by reference to Exhibit 10.16 to the Company’sAnnual Report on Form 10-K for the year ended December 31, 2005)*
10.14(b) Amendment 2008-1, dated as of January 2, 2008, to the Amended and Restated 2005 EmploymentAgreement between John B. Henneman, III and the Company (Incorporated by reference toExhibit 10.15(b) to the Company’s Annual Report on Form 10-K for the year ended December 31,2007)*
10.14(c) Amendment 2008-2, dated as of December 18, 2008, to the Amended and Restated 2005Employment Agreement between John B. Henneman, III and the Company (Incorporated byreference to Exhibit 10.2 to the Company’s Current Report on Form 8-K filed on December 24,2008)*
10.14(d) Amendment 2009-1, dated as of April 13, 2009, to the Amended and Restated 2005 EmploymentAgreement between John B. Henneman, III and the Company (Incorporated by reference toExhibit 10.5 to the Company’s Current Report on Form 8-K filed on April 13, 2009)*
10.14(e) Amendment 2010-1, dated as of October 12, 2010, to the Amended and Restated 2005Employment Agreement between John B. Henneman, III and the Company (Incorporated byreference to Exhibit 10.3 to the Company’s Current Report on Form 8-K filed October 12, 2010)*
10.14(f) Letter dated as of February 22, 2012 from John B. Henneman, III to the Company (Incorporated byreference to Exhibit 10.1 to the Company’s Current Report on Form 8-K filed February 22, 2012)*
10.14(g) Second Amended and Restated 2005 Employment Agreement between the Company and John B.Henneman, III (Incorporated by reference to Exhibit 10.1 to the Company’s Current Report onForm 8-K filed on May 23, 2014)*
10.15 Consulting Agreement, dated October 12, 2010, between the Company and Inception Surgical(Incorporated by reference to Exhibit 10.1 to the Company’s Current Report on Form 8-K filed onOctober 12, 2010)*
10.16 Severance Agreement between Richard D. Gorelick and the Company dated as of January 3, 2012(Incorporated by reference to Exhibit 10.10 to the Company’s Quarterly Report on Form 10-Q forthe quarter ended March 31, 2013)*
10.17(a) Severance Agreement between Judith O’Grady and the Company dated as of January 4, 2010(Incorporated by reference to Exhibit 10.17 to the Company’s Annual Report on Form 10-K for theyear ended December 31, 2009)*
10.17(b) Severance Agreement between Judith O’Grady and the Company dated as of January 3, 2011(Incorporated by reference to Exhibit 10.17(a) to the Company’s Annual Report on Form 10-K forthe year ended December 31, 2010)*
70
10.17(c) Severance Agreement between Judith O’Grady and the Company dated as of January 3, 2012(Incorporated by reference to Exhibit 10.16(c) to the Company’s Annual Report on Form 10-K forthe year ended December 31, 2011)*
10.18(a) Employment Agreement, dated as of October 12, 2010, between Peter J. Arduini and the Company(Incorporated by reference to Exhibit 10.2 to the Company’s Current Report on Form 8-K filedOctober 12, 2010)*
10.18(b) Amended and Restated Employment Agreement dated December 20, 2011 between Peter J.Arduini and the Company (Incorporated by reference to Exhibit 10.1 to the Company’s CurrentReport on Form 8-K filed December 23, 2011)*
10.18(c) Second Amended and Restated Employment Agreement between the Company and Peter J.Arduini (Incorporated by reference to Exhibit 10.1 to the Company’s Current Report on Form 8-Kfiled on June 20, 2014)*
10.18(d) Third Amended and Restated Employment Agreement between the Company and Peter J. Arduini(Incorporated by reference to Exhibit 10.1 to the Company’s Quarterly Report on Form 10-Q filedon October 26, 2017)*
10.19 Form of Notice of Stock Option Grant with Eight-Year Term for Peter J. Arduini (Incorporated byreference to Exhibit 10.2 to the Company’s Current Report on Form 8-K filed December 23,2011)*
10.20 Letter Agreement dated February 19, 2013 between Peter J. Arduini and Integra LifeSciencesHoldings Corporation (Incorporated by reference to Exhibit 10.1 to the Company’s Current Reporton Form 8-K filed on February 25, 2013)*
10.21(a) Lease Contract, dated April 1, 2005, between the Puerto Rico Industrial Development Companyand Integra CI, Inc. (executed on September 15, 2006) (Incorporated by reference to Exhibit 10.3to the Company’s Quarterly Report on Form 10-Q for the quarter ended September 30, 2006)
10.21(b) Amendment to Lease Contract dated as of November 2, 2011, between Integra CI, Inc. and PuertoRico Industrial Development Company (Incorporated by reference to Exhibit 10.1 to theCompany’s Current Report on Form 8-K filed on November 7, 2011)
10.21(c) Termination of Amendment to Lease Contract, dated as of April 2, 2012, between Integra CI, Inc.and Puerto Rico Industrial Development Company (Incorporated by reference to Exhibit 10.2 tothe Company’s Quarterly Report on Form 10-Q for the quarter ended March 31, 2012)
10.22 Restricted Units Agreement dated December 27, 1997 between the Company and Stuart M. Essig(Incorporated by reference to Exhibit 10.3 to the Company’s Current Report on Form 8-K filed onFebruary 3, 1998)*
10.23 Stock Option Grant and Agreement pursuant to 1999 Stock Option Plan dated December 22, 2000between the Company and Stuart M. Essig (Incorporated by reference to Exhibit 4.1 to theCompany’s Current Report on Form 8-K filed on January 8, 2001)*
10.24 Stock Option Grant and Agreement pursuant to 2000 Equity Incentive Plan dated December 22,2000 between the Company and Stuart M. Essig (Incorporated by reference to Exhibit 4.2 to theCompany’s Current Report on Form 8-K filed on January 8, 2001)*
10.25(a) Restricted Units Agreement dated December 22, 2000 between the Company and Stuart M. Essig(Incorporated by reference to Exhibit 4.3 to the Company’s Current Report on Form 8-K filed onJanuary 8, 2001)*
10.25(b) Amendment 2006-1, dated as of October 30, 2006, to the Stuart M. Essig Restricted UnitsAgreement dated as of December 22, 2000 (Incorporated by reference to Exhibit 10.1 to theCompany’s Current Report on Form 8-K filed on November 3, 2006)*
10.26 Stock Option Grant and Agreement pursuant to 2003 Equity Incentive Plan dated July 27, 2004between the Company and Stuart M. Essig (Incorporated by reference to Exhibit 10.30 to theCompany’s Annual Report on Form 10-K for the year ended December 31, 2004)*
71
10.27(a) Contract Stock/Restricted Units Agreement pursuant to 2003 Equity Incentive Plan dated July 27,2004 between the Company and Stuart M. Essig (Incorporated by reference to Exhibit 10.31 to theCompany’s Annual Report on Form 10-K for the year ended December 31, 2004)*
10.27(b) Amendment 2006-1, dated as of October 30, 2006, to the Stuart M. Essig Contract Stock/Restricted Units Agreement dated as of July 27, 2004 (Incorporated by reference to Exhibit 10.2 tothe Company’s Current Report on Form 8-K filed on November 3, 2006)*
10.27(c) Amendment 2008-1, dated as of March 6, 2008, to the Stuart M. Essig Contract Stock/RestrictedUnits Agreement dated as of July 27, 2004 (Incorporated by reference to Exhibit 10.25(c) to theCompany’s Annual Report on Form 10-K for the year ended December 31, 2007)*
10.27(d) Amendment 2011-1, dated as of May 17, 2011, to the Stuart M. Essig Contract Stock/RestrictedUnits Agreement dated as of July 24, 2004 (Incorporated by reference to Exhibit 10.6 to theCompany’s Quarterly Report on Form 10-Q for the quarter ended June 30, 2011)*
10.28 Contract Stock/Units Agreement dated as of May 17, 2011 between the Company and StuartM. Essig (Incorporated by reference to Exhibit 10.2 to the Company’s Current Report on Form 8-Kfiled on May 23, 2011)*
10.29 Form of Amendment 2011-1 to Contract Stock/Restricted Units Agreements between the Companyand Mr. Essig (Incorporated by reference to Exhibit 10.5 to the Company’s Quarterly Report onForm 10-Q for the quarter ended June 30, 2011)*
10.30 Form of Stock Option Grant and Agreement between the Company and Stuart M. Essig(Incorporated by reference to Exhibit 10.32 to the Company’s Annual Report on Form 10-K for theyear ended December 31, 2004)*
10.31(a) Form of Contract Stock/Restricted Units Agreement for Stuart M. Essig (Incorporated by referenceto Exhibit 10.8 to the Company’s Quarterly Report on Form 10-Q for the quarter ended June 30,2008)*
10.31(b) New Form of Contract Stock/Restricted Units Agreement (for Annual Equity Awards) for StuartM. Essig (Incorporated by reference to Exhibit 10.28(b) to the Company’s Annual Report onForm 10-K for the year ended December 31, 2010)*
10.31(c) Form of Amendment 2011-1 to Contract Stock/Restricted Units Agreement between the Companyand Mr. Essig (Incorporated by reference to Exhibit 10.4 to the Company’s Quarterly Report onForm 10-Q for the quarter ended June 30, 2011)*
10.32 Form of Performance Stock Agreement for Stuart M. Essig (Incorporated by reference toExhibit 10.9 to the Company’s Quarterly Report on Form 10-Q for the quarter ended June 30,2008)*
10.33 Form of Restricted Stock Agreement for Stuart M. Essig for 2009 (Incorporated by reference toExhibit 10.3 to the Company’s Current Report on Form 8-K filed April 13, 2009)*
10.34(a) Form of Performance Stock Agreement (Executive Officers) (Incorporated by reference toExhibit 10.2 to the Company’s Current Report on Form 8-K filed on February 25, 2013)*
10.34(b) Form of Performance Stock Agreement (Executive Officers) (Incorporated by reference toExhibit 10.1 to the Company’s Current Report on Form 8-K filed on February 29, 2016)*
10.34(c) Form of Performance Stock Agreement for Peter J. Arduini (Incorporated by reference toExhibit 10.2 to the Company’s Report on Form 8-K filed on February 29, 2016)*
10.34(d) Form of Performance Stock Agreement (Executive Officers) (Incorporated by reference toExhibit 10.1 to the Company’s Quarterly Report on Form 10-Q for the quarter ended March 31,2018) *
10.34(e) Form of Performance Stock Agreement for Peter J. Arduini (Incorporated by reference toExhibit 10.1 to the Company’s Quarterly Report on Form 10-Q for the quarter ended March 31,2018)*
10.35 Performance Incentive Compensation Plan effective January 1, 2013 (Incorporated by reference toExhibit 10.3 to the Company’s Quarterly Report on Form 10-Q for the quarter ended March 31,2013)*
72
10.35(a) First Amendment, dated as of February 15, 2017, to the Performance Incentive Compensation Plan(Incorporated by reference to Exhibit 10.1 to the Company’s Current Report on Form 8-K filed onFebruary 17, 2017)
10.35(b) 2018 Performance Incentive Compensation Plan, effective January 1, 2018 (Incorporated byreference to Exhibit 10.2 to the Company’s Current Report on Form 8-K filed on May 25, 2017)
10.36 New Form of Contract Stock/Restricted Units Agreement pursuant to 2003 Equity Incentive Plan(for 2011) Annual Equity Award for Stuart M. Essig) (Incorporated by reference to Exhibit 10.3 tothe Company’s Quarterly Report on Form 10-Q for the quarter ended June 30, 2011)*
10.37 Form of Notice of Grant of Stock Option and Stock Option Agreement (Incorporated by referenceto Exhibit 10.1 to the Company’s Current Report on Form 8-K filed on July 29, 2005)*
10.38 Form of Non-Qualified Stock Option Agreement (Non-Directors) (Incorporated by reference toExhibit 10.35 to the Company’s Annual Report on Form 10-K for the year ended December 31,2004)*
10.39 Form of Incentive Stock Option Agreement (Incorporated by reference to Exhibit 10.36 to theCompany’s Annual Report on Form 10-K for the year ended December 31, 2004)*
10.40 Form of Non-Qualified Stock Option Agreement (Directors) (Incorporated by reference toExhibit 10.37 to the Company’s Annual Report on Form 10-K for the year ended December 31,2004)*
10.41 Form of Stock Option Agreement (Executive Officers) (Incorporated by reference to Exhibit 10.1to the Company’s Quarterly Report on Form 10-Q for the quarter ended March 31, 2015)*
10.42 Form of Stock Option Agreement for Glenn Coleman (Incorporated by reference to Exhibit 10.2 tothe Company’s Quarterly Report on Form 10-Q for the quarter ended March 31, 2015)*
10.43(a) Agreement and General Release by and between Robert Paltridge and Integra LifeSciencesCorporation (Incorporated by reference to Exhibit 10.3 to the Company’s Quarterly Report onForm 10-Q for the quarter ended March 31, 2015)*
10.43(b) Agreement and General Release by and between Richard D. Gorelick and Integra LifeSciencesCorporation
10.44(c) Form of Change in Control Severance Agreement (Incorporated by reference to Exhibit 10.1 to theCompany’s Current Report on Form 8-K filed on February 3, 2016)*
10.44(d) Form of Change in Control Severance Agreement (Incorporated by reference to Exhibit 10.1 to theCompany’s Current Report on Form 8-K filed on February 3, 2017)
10.44(e) Form of Change in Control Severance Agreement (Incorporated by reference to Exhibit 10.1 to theCompany’s Current Report on Form 8-K filed on February 2, 2018)*
10.45(a) Compensation of Directors of the Company effective May 17, 2011 (Incorporated by reference toExhibit 10.1 to the Company’s Current Report on Form 8-K filed on December 16, 2010)*
10.45(b) Compensation of Non-Employee Directors of the Company effective May 17, 2012 (Incorporatedby reference to Exhibit 10.1 to the Company’s Current Report on Form 8-K filed on April 13,2012)*
10.45(c) Compensation of Non-Employee Directors of the Company effective May 22, 2013 (Incorporatedby reference to Exhibit 10.1 to the Company’s Current Report on Form 8-K filed on December 14,2012)*
10.45(d) Compensation of Non-Employee Directors of the Company effective July 24, 2013 (Incorporatedby reference to Exhibit 10.1 to the Company’s Current Report on Form 8-K filed on July 29,2013)*
10.45(e) Compensation of Non-Employee Directors of the Company effective May 22, 2015 (Incorporatedby reference to Exhibit 10.1 to the Company’s Current Report on Form 8-K filed on December 18,2014)*
10.45(f) Compensation of Non-Employee Directors of the Company effective May 24, 2016 (Incorporatedby reference to Exhibit 10.1 to the Company’s Current Report on Form 8-K filed on December 17,2015)*
73
10.46(a) Form of Restricted Stock Agreement for Non-Employee Directors under the 2003 Equity IncentivePlan (Incorporated by reference to Exhibit 10.4 to the Company’s Quarterly Report on Form 10-Qfor the quarter ended June 30, 2012)*
10.46(b) New Form of Restricted Stock Agreement for Non-Employee Directors under the 2003 EquityIncentive Plan (Incorporated by reference to Exhibit 10.38(b) to the Company’s Annual Report onForm 10-K for the year ended December 31, 2012)*
10.46(c) Form of Restricted Stock Agreement for Executive Officers—Annual Vesting (Incorporated byreference to Exhibit 10.1 to the Company’s Current Report on Form 8-K filed on February 25,2009)*
10.46(d) Form of Restricted Stock Agreement for Executive Officers—Annual Vesting (Incorporated byreference to Exhibit 10.5 to the Company’s Quarterly Report on Form 10-Q for the quarter endedJune 30, 2012)*
10.46(e) New Form of Restricted Stock Agreement for Executive Officers—Annual Vesting (Incorporatedby reference to Exhibit 10.38(e) to the Company’s Annual Report on Form 10-K for the year endedDecember 31, 2012)*
10.46(f) Form of Restricted Stock Agreement for Executive Officers—Cliff Vesting (Incorporated byreference to Exhibit 10.8 to the Company’s Quarter Report on Form 10-Q for the quarter endedMarch 31, 2009)*
10.46(g) Form of Restricted Stock Agreement for Executive Officers—Cliff Vesting (Incorporated byreference to Exhibit 10.6 to the Company’s quarterly report on Form 10-Q for the quarter endedJune 30, 2012)*
10.46(h) New Form of Restricted Stock Agreement for Executive Officers—Cliff Vesting (Incorporated byreference to Exhibit 10.38(h) to the Company’s Annual Report on Form 10-K for the year endedDecember 31, 2012)*
10.46(i) Form of Restricted Stock Agreement for Mr. Henneman for 2008 and 2009 (Incorporated byreference to Exhibit 10.6 to the Company’s Current Report on Form 8-K filed on April 13, 2009)*
10.46(j) Form of Contract Stock/Restricted Units Agreement pursuant to 2003 Equity Incentive Plan forMr. Henneman (Incorporated by reference to Exhibit 10.4 to the Company’s Current Report onForm 8-K filed on December 24, 2008)*
10.46(k) Form of Option Agreement for John B. Henneman, III (Incorporated by reference to Exhibit 10.1to the Company’s Current Report on Form 8-K filed on June 6, 2008)*
10.46(l) Form of Performance Stock Agreement for John B. Henneman, III (Incorporated by reference toExhibit 10.37(b) to the Company’s Annual Report on Form 10-K for the year ended December 31,2007)*
10.46(m) Form of Contract Stock/Restricted Units Agreement (for Signing Grant) for Mr. Arduini(Incorporated by reference to Exhibit 10.4 to the Company’s Current Report on Form 8-K filed onOctober 12, 2010)*
10.46(n) Form of Contract Stock/Restricted Units Agreement (for Annual Equity Awards) for Mr. Arduini(Incorporated by reference to Exhibit 10.5 to the Company’s Current Report on Form 8-K filed onOctober 12, 2010)*
10.46(o) Form of Non-Qualified Stock Option Agreement for Mr. Arduini (Incorporated by reference toExhibit 10.6 to the Company’s Current Report on Form 8-K filed on October 12, 2010)*
10.46(p) Form of Restricted Stock Agreement for Mr. Henneman (Incorporated by reference to Exhibit 10.7to the Company’s Current Report on Form 8-K filed on October 12, 2010)*
10.46(q) Form of Restricted Stock Agreement (Annual Vesting) for Mr. Henneman (Incorporated byreference to Exhibit 10.39(n) to the Company’s Annual Report on Form 10-K for the year endedDecember 31, 2011)*
10.47(a) Coleman Promotion Summary, effective December 1, 2016 (Incorporated by reference toExhibit 10.1 to the Company’s Current Report on Form 8-K filed on December 5, 2016)*
74
10.47(b) Davis Promotion Summary, effective December 1, 2016 (Incorporated by reference to Exhibit 10.2to the Company’s Current Report on Form 8-K filed on December 5, 2016)*
10.48 Annual Executive Physical Medical Exam Arrangement (Incorporated by reference to theExhibit 10.2 to the Company’s Current Report on Form 8-K filed on July 29, 2013)*
10.49 Reimbursement of Legal Fees Arrangement for CFO (Incorporated by reference to Exhibit 10.3 tothe Company’s Current Report on Form 8-K filed on July 29, 2013)*
10.50 Amended and Restated Management Incentive Compensation Plan, as of January 1, 2008(Incorporated by reference to Exhibit 10.43(c) to the Company’s Annual Report on Form 10-K forthe year ended December 31, 2007)*
10.51 Form of 2010 Convertible Bond Hedge Transaction Confirmation, dated June 6, 2007, betweenIntegra LifeSciences Holdings Corporation and dealer (Incorporated by reference to Exhibit 10.1to the Company’s Current Report on Form 8-K filed on June 12, 2007)
10.52 Form of 2012 Convertible Bond Hedge Transaction Confirmation, dated June 6, 2007, betweenIntegra LifeSciences Holdings Corporation and dealer (Incorporated by reference to Exhibit 10.2to the Company’s Current Report on Form 8-K filed on June 12, 2007)
10.53 Form of 2010 Amended and Restated Issuer Warrant Transaction Confirmation, dated June 6,2007, between Integra LifeSciences Holdings Corporation and dealer (Incorporated by reference toExhibit 10.3 to the Company’s Current Report on Form 8-K filed on June 12, 2007)
10.54 Form of 2012 Amended and Restated Issuer Warrant Transaction Confirmation, dated June 6,2007, between Integra LifeSciences Holdings Corporation and dealer (Incorporated by reference toExhibit 10.4 to the Company’s Current Report on Form 8-K filed on June 12, 2007)
10.55 Letter Agreement, dated June 9, 2011, between Deutsche Bank AG, London Branch and IntegraLifeSciences Holdings Corporation, regarding the Base Call Option Transaction (Incorporated byreference to Exhibit 10.4 to the Company’s Form 8-K filed on June 15, 2011)
10.56 Letter Agreement, dated June 9, 2011, between Royal Bank of Canada and Integra LifeSciencesHoldings Corporation, regarding the Base Call Option Transaction (Incorporated by reference toExhibit 10.8 to the Company’s Form 8-K filed on June 15, 2011)
10.57 Letter Agreement, dated June 9, 2011, between The Royal Bank of Scotland plc and IntegraLifeSciences Holdings Corporation, regarding the Base Call Option Transaction (Incorporated byreference to Exhibit 10.6 to the Company’s Form 8-K filed on June 15, 2011)
10.58 Letter Agreement, dated June 9, 2011, between Wells Fargo Bank, National Association andIntegra LifeSciences Holdings Corporation, regarding the Base Call Option Transaction(Incorporated by reference to Exhibit 10.2 to the Company’s Form 8-K filed on June 15, 2011)
10.59 Letter Agreement, dated June 9, 2011, between Deutsche Bank AG, London Branch and IntegraLifeSciences Holdings Corporation, regarding the Base Warrant Transaction (Incorporated byreference to Exhibit 10.3 to the Company’s Form 8-K filed on June 15, 2011)
10.60 Letter Agreement, dated June 9, 2011, between Royal Bank of Canada and Integra LifeSciencesHoldings Corporation, regarding the Base Warrant Transaction (Incorporated by reference toExhibit 10.7 to the Company’s Form 8-K filed on June 15, 2011)
10.61 Letter Agreement, dated June 9, 2011, between The Royal Bank of Scotland plc and IntegraLifeSciences Holdings Corporation, regarding the Base Warrant Transaction (Incorporated byreference to Exhibit 10.5 to the Company’s Form 8-K filed on June 15, 2011)
10.62 Letter Agreement, dated June 9, 2011, between Wells Fargo Bank, National Association andIntegra LifeSciences Holdings Corporation, regarding the Base Warrant Transaction (Incorporatedby reference to Exhibit 10.1 to the Company’s Form 8-K filed on June 15, 2011)
10.63 Letter Agreement, dated June 14, 2011, between Deutsche Bank AG, London Branch and IntegraLifeSciences Holdings Corporation, regarding the Additional Call Option Transaction(Incorporated by reference to Exhibit 10.9 to the Company’s Form 8-K filed on June 15, 2011)
75
10.64 Letter Agreement, dated June 14, 2011, between Royal Bank of Canada and Integra LifeSciencesHoldings Corporation, regarding the Additional Call Option Transaction (Incorporated byreference to Exhibit 10.10 to the Company’s Form 8-K filed on June 15, 2011)
10.65 Letter Agreement, dated June 14, 2011, between The Royal Bank of Scotland plc and IntegraLifeSciences Holdings Corporation, regarding the Additional Call Option Transaction(Incorporated by reference to Exhibit 10.11 to the Company’s Form 8-K filed on June 15, 2011)
10.66 Letter Agreement, dated June 14, 2011, between Wells Fargo Bank, National Association andIntegra LifeSciences Holdings Corporation, regarding the Additional Call Option Transaction(Incorporated by reference to Exhibit 10.12 to the Company’s Form 8-K filed on June 15, 2011)
10.67 Letter Agreement, dated June 14, 2011, between Deutsche Bank AG, London Branch and IntegraLifeSciences Holdings Corporation, regarding the Additional Warrant Transaction (Incorporatedby reference to Exhibit 10.13 to the Company’s Form 8-K filed on June 15, 2011)
10.68 Letter Agreement, dated June 14, 2011, between Royal Bank of Canada and Integra LifeSciencesHoldings Corporation, regarding the Additional Warrant Transaction (Incorporated by reference toExhibit 10.14 to the Company’s Form 8-K filed on June 15, 2011)
10.69 Letter Agreement, dated June 14, 2011, between The Royal Bank of Scotland plc and IntegraLifeSciences Holdings Corporation, regarding the Additional Warrant Transaction (Incorporatedby reference to Exhibit 10.15 to the Company’s Form 8-K filed on June 15, 2011)
10.70 Letter Agreement, dated June 14, 2011, between Wells Fargo Bank, National Association andIntegra LifeSciences Holdings Corporation, regarding the Additional Warrant Transaction(Incorporated by reference to Exhibit 10.16 to the Company’s Form 8-K filed on June 15, 2011)
10.71 Piggyback Registration Rights Agreement dated December 22, 2008 between Integra LifeSciencesHoldings Corporation and George Heenan, Thomas Gilliam and Michael Evers, as trustees of TheBruce A. LeVahn 2008 Trust and Steven M. LeVahn (Incorporated by reference to Exhibit 10.1 tothe Company’s Current Report on Form 8-K filed on December 29, 2008)
10.72(a) Lease Agreement between 109 Morgan Lane, LLC and Integra LifeSciences Corporation, datedMay 15, 2008 (Incorporated by reference to Exhibit 10.10 to the Company’s Quarterly Report onForm 10-Q for the quarter ended June 30, 2008)
10.72(b) First Amendment to Lease Agreement between 109 Morgan Lane, LLC and Integra LifeSciencesCorporation, dated March 9, 2009 (Incorporated by reference to Exhibit 10.9 to the Company’sQuarterly Report on Form 10-Q for the quarter ended March 31, 2009)
10.72(c) Lease Agreement dated as of July 1, 2013, between 109 Morgan Lane, LLC and IntegraLifeSciences Corporation (Incorporated by reference to Exhibit 10.1 to the Company’s CurrentReport on Form 8-K filed on July 1, 2013)
10.73 Offer Letter between Glenn Coleman and the Company (Incorporated by reference to Exhibit 10.1to the Company’s Current Report on Form 8-K filed on April 29, 2014)*
10.74(a) Receivables Financing Agreement, dated as of December 21, 2018, by and among IntegraReceivables LLC, Integra LifeSciences Sales LLC, as Servicer, PNC Bank, National Association,as Administrative Agent, PNC Capital Markets LLC, as Structuring Agent, and certain lenders andgroup agents that are parties thereto from time to time (Incorporated by reference to Exhibit 10.1 tothe Company’s Current Report on Form 8-K filed on December 28, 2018)
10.74(b) Purchase and Sale Agreement, dated as of December 21, 2018, by and among Integra LifeSciencesSales LLC, Integra LifeSciences Corporation and Integra Receivables LLC (Incorporated byreference to Exhibit 10.1 to the Company’s Current Report on Form 8-K filed on December 28,2018)
12.1 Statement Regarding the Computation of Ratio of Earnings to Fixed Charges and Preferred ShareDividends for the Years Ended 2015, 2014, 2013, 2012 and 2011, and the Nine Months EndedSeptember 30, 2016 (Incorporated by reference to Exhibit 12.1 to the Company’s RegistrationStatement on Form S-3 ASR filed November 4, 2016)
76
18.1 Preferability letter of Independent Public Accounting Firm dated May 1, 2014 (Incorporated byreference to Exhibit 18 to the Company’s Quarterly Report on Form 10-Q for the quarter endedMarch 31, 2014)
18.2 Preferability Letter of Independent Public Accounting Firm dated July 31, 2012 (Incorporated byreference to Exhibit 18.1 to the Company’s Quarterly Report on Form 10-Q for the quarter endedJune 30, 2012)
21 Subsidiaries of the Company+
23 Consent of PricewaterhouseCoopers LLP+
31.1 Certification of Principal Executive Officer Pursuant to Section 302 of the Sarbanes-Oxley Act of2002+
31.2 Certification of Principal Financial Officer Pursuant to Section 302 of the Sarbanes-Oxley Act of2002+
32.1 Certification of Principal Executive Officer Pursuant to Section 906 of the Sarbanes-Oxley Act of2002+
32.2 Certification of Principal Financial Officer Pursuant to Section 906 of the Sarbanes-Oxley Act of2002+
99.1 Letter, dated December 21, 2011, from the United States Food and Drug Administration to IntegraLifeSciences Corporation (Incorporated by reference to Exhibit 99.1 to the Company’s CurrentReport on Form 8-K filed on January 5, 2012)
99.2 Food and Drug Administration Form FDA-483, dated July 30, 2012, relating to inspection ofPlainsboro, NJ manufacturing facility (Incorporated by reference to Exhibit 99.1 to the Company’sQuarterly Report on Form 10-Q for the quarter ended June 30, 2012)
99.3 Letter, dated November 1, 2012, from the United States Food and Drug Administration to IntegraNeuroSciences Ltd. (Incorporated by reference to Exhibit 99.1 to the Company’s Current Reporton Form 8-K filed on November 13, 2012)
99.4 Letter, dated February 13, 2013, from the United States Federal Drug Administration to IntegraLifeSciences Corporation (Incorporated by reference to Exhibit 99.1 to the Company’s CurrentReport on Form 8-K filed on February 19, 2013)
99.5 Letter, dated September 24, 2013, from the United States Federal Drug Administration to IntegraLifeSciences Corporation (Incorporated by reference to Exhibit 99.1 to the Company’s CurrentReport on Form 8-K filed on September 27, 2013)
99.6 Food and Drug Administration Form FDA-483, dated November 26, 2013, relating to theinspection of the Añasco Facility (Incorporated by reference to Exhibit 99.1 to the Company’sCurrent Report on Form 8-K filed on December 3, 2013)
99.7 Letter, dated January 14, 2015, from the United States Food and Drug Administration to IntegraLifeSciences Corporation (Incorporated by reference to Exhibit 99.1 to the Company’s CurrentReport on Form 8-K filed on January 20, 2015)
99.8 Letter, dated May 29, 2015, from the United States Food and Drug Administration to TEIBiosciences Inc. (Incorporated by reference to Exhibit 99.1 to the Company’s Quarterly Report onForm 10-Q for the quarter ended June 30, 2015)
99.9 Letter, dated June 30, 2015, from the United States Food and Drug Administration to IntegraLifeSciences (Ireland) Limited (Incorporated by reference to Exhibit 99.2 to the Company’sQuarterly Report on Form 10-Q for the quarter ended June 30, 2015)
101.INS XBRL Instance Document+#
101.SCH XBRL Taxonomy Extension Schema Document+#
101.CAL XBRL Taxonomy Extension Calculation Linkbase Document+#
101.DEF XBRL Definition Linkbase Document
77
101.LAB XBRL Taxonomy Extension Labels Linkbase Document+#
101.PRE XBRL Taxonomy Extension Presentation Linkbase Document+#
* Indicates a management contract or compensatory plan or arrangement.+ Indicates this document is filed as an exhibit herewith.# The financial information of Integra LifeSciences Holdings Corporation Annual Report on Form 10-K for the
year ended December 31, 2018 filed on February 26, 2019 formatted in XBRL (Extensible Business ReportingLanguage): (i) the Consolidated Statements of Operations, (ii) the Consolidated Statement of ComprehensiveIncome (Loss), (iii) the Consolidated Balance Sheets, (iv) Parenthetical Data to the Consolidated BalanceSheets, (v) the Consolidated Statements of Cash Flows, (vi) the Consolidated Statements of Changes inStockholders’ Equity, and (vii) Notes to Consolidated Financial Statements, is furnished electronicallyherewith.
The Company’s Commission File Number for Reports on Form 10-K, Form 10-Q and Form 8-K is 0-26224.
ITEM 16. FORM 10-K SUMMARY
None.
78
SIGNATURES
Pursuant to the requirements of Section 13 of the Securities Exchange Act of 1934, the registrant has dulycaused this report to be signed on its behalf by the undersigned, thereunto duly authorized.
INTEGRA LIFESCIENCES HOLDINGSCORPORATION
By: /s/ Peter J. Arduini
Peter J. Arduini
President and Chief Executive Officer
Date: February 26, 2019
Pursuant to the requirements of the Securities Exchange Act of 1934, this report has been signed below bythe following persons, on behalf of the registrant in the capacities indicated.
Signature Title Date
/s/ Peter J. Arduini
Peter J. Arduini
President and Chief Executive Officer, andDirector (Principal Executive Officer)
February 26, 2019
/s/ Glenn G. Coleman
Glenn G. Coleman
Corporate Vice President and Chief FinancialOfficer (Principal Financial Officer)
February 26, 2019
/s/ Jeffrey A. Mosebrook
Jeffrey A. Mosebrook
Vice President, Corporate Controller(Principal Accounting Officer)
February 26, 2019
/s/ Stuart M. Essig, Ph.D.
Stuart M. Essig, Ph.D.
Chairman of the Board February 26, 2019
/s/ Rhonda Germany Ballintyn
Rhonda Germany Ballintyn
Director February 26, 2019
/s/ Keith Bradley, Ph.D.
Keith Bradley, Ph.D.
Director February 26, 2019
/s/ Barbara B. Hill
Barbara B. Hill
Director February 26, 2019
/s/ Lloyd W. Howell, Jr.
Lloyd W. Howell, Jr.
Director February 26, 2019
/s/ Donald E. Morel, Jr., Ph.D.
Donald E. Morel, Jr., Ph.D.
Director February 26, 2019
/s/ Raymond G. Murphy
Raymond G. Murphy
Director February 26, 2019
/s/ Christian S. Schade
Christian S. Schade
Director February 26, 2019
79

[THIS PAGE INTENTIONALLY LEFT BLANK]
Report of Independent Registered Public Accounting Firm
To the Board of Directors and Stockholders ofIntegra LifeSciences Holdings Corporation
Opinions on the Financial Statements and Internal Control over Financial Reporting
We have audited the accompanying consolidated balance sheets of Integra LifeSciences HoldingsCorporation and its subsidiaries (the “Company”) as of December 31, 2018 and 2017, and the relatedconsolidated statements of operations, comprehensive income (loss), changes in stockholders’ equity and cashflows for each of the three years in the period ended December 31, 2018, including the related notes and financialstatement schedule listed in the index appearing under Item 15(a)(2) (collectively referred to as the “consolidatedfinancial statements”). We also have audited the Company’s internal control over financial reporting as ofDecember 31, 2018, based on criteria established in Internal Control—Integrated Framework (2013) issued bythe Committee of Sponsoring Organizations of the Treadway Commission (COSO).
In our opinion, the consolidated financial statements referred to above present fairly, in all material respects,the financial position of the Company as of December 31, 2018 and 2017, and the results of their operations andtheir cash flows for each of the three years in the period ended December 31, 2018 in conformity with accountingprinciples generally accepted in the United States of America. Also in our opinion, the Company maintained, inall material respects, effective internal control over financial reporting as of December 31, 2018, based on criteriaestablished in Internal Control—Integrated Framework (2013) issued by the COSO.
Change in Accounting Principle
As discussed in Note 3 to the consolidated financial statements, the Company changed the manner in whichit accounts for revenues from contracts with customers in 2018.
Basis for Opinions
The Company’s management is responsible for these consolidated financial statements, for maintainingeffective internal control over financial reporting, and for its assessment of the effectiveness of internal controlover financial reporting, included in Management’s Report on Internal Control Over Financial Reporting. Ourresponsibility is to express opinions on the Company’s consolidated financial statements and on the Company’sinternal control over financial reporting based on our audits. We are a public accounting firm registered with thePublic Company Accounting Oversight Board (United States) (PCAOB) and are required to be independent withrespect to the Company in accordance with the U.S. federal securities laws and the applicable rules andregulations of the Securities and Exchange Commission and the PCAOB.
We conducted our audits in accordance with the standards of the PCAOB. Those standards require that weplan and perform the audits to obtain reasonable assurance about whether the consolidated financial statementsare free of material misstatement, whether due to error or fraud, and whether effective internal control overfinancial reporting was maintained in all material respects.
Our audits of the consolidated financial statements included performing procedures to assess the risks ofmaterial misstatement of the consolidated financial statements, whether due to error or fraud, and performingprocedures that respond to those risks. Such procedures included examining, on a test basis, evidence regardingthe amounts and disclosures in the consolidated financial statements. Our audits also included evaluating theaccounting principles used and significant estimates made by management, as well as evaluating the overallpresentation of the consolidated financial statements. Our audit of internal control over financial reportingincluded obtaining an understanding of internal control over financial reporting, assessing the risk that a materialweakness exists, and testing and evaluating the design and operating effectiveness of internal control based onthe assessed risk. Our audits also included performing such other procedures as we considered necessary in thecircumstances. We believe that our audits provide a reasonable basis for our opinions.
F-1
Definition and Limitations of Internal Control over Financial Reporting
A company’s internal control over financial reporting is a process designed to provide reasonable assuranceregarding the reliability of financial reporting and the preparation of financial statements for external purposes inaccordance with generally accepted accounting principles. A company’s internal control over financial reportingincludes those policies and procedures that (i) pertain to the maintenance of records that, in reasonable detail,accurately and fairly reflect the transactions and dispositions of the assets of the company; (ii) provide reasonableassurance that transactions are recorded as necessary to permit preparation of financial statements in accordancewith generally accepted accounting principles, and that receipts and expenditures of the company are being madeonly in accordance with authorizations of management and directors of the company; and (iii) provide reasonableassurance regarding prevention or timely detection of unauthorized acquisition, use, or disposition of thecompany’s assets that could have a material effect on the financial statements.
Because of its inherent limitations, internal control over financial reporting may not prevent or detectmisstatements. Also, projections of any evaluation of effectiveness to future periods are subject to the risk thatcontrols may become inadequate because of changes in conditions, or that the degree of compliance with thepolicies or procedures may deteriorate.
/s/ PricewaterhouseCoopers LLP
Florham Park, New JerseyFebruary 26, 2019
We have served as the Company’s auditor since 1989.
F-2
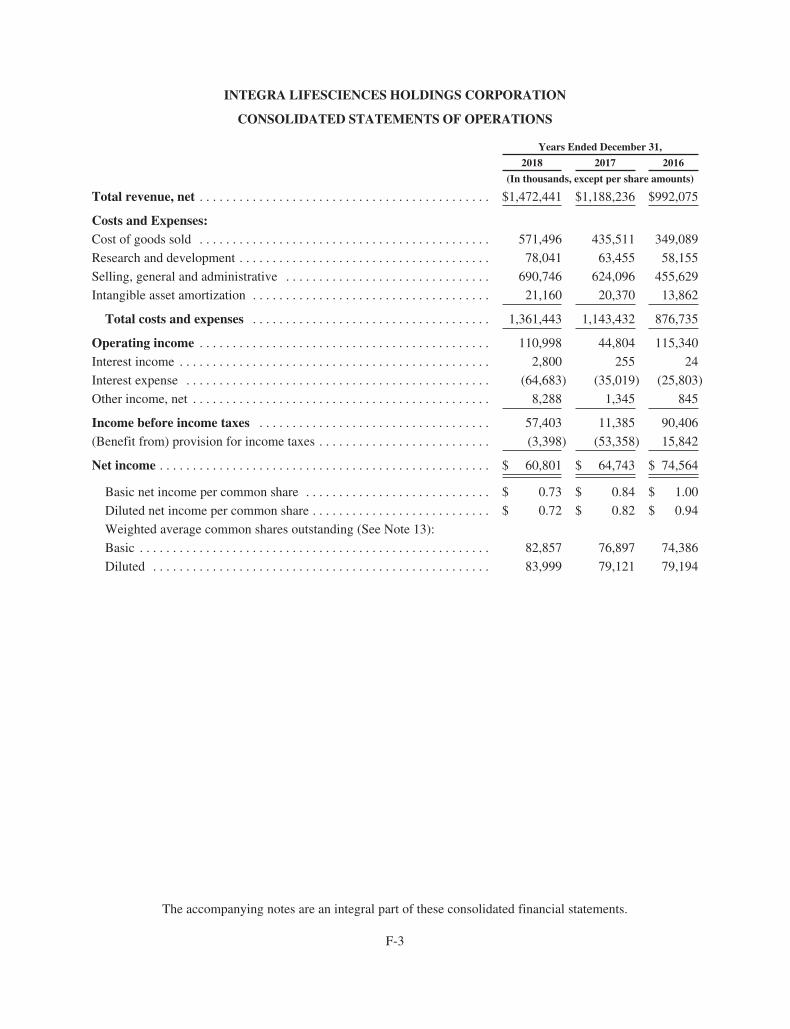
INTEGRA LIFESCIENCES HOLDINGS CORPORATION
CONSOLIDATED STATEMENTS OF OPERATIONS
Years Ended December 31,
2018 2017 2016
(In thousands, except per share amounts)
Total revenue, net . . . . . . . . . . . . . . . . . . . . . . . . . . . . . . . . . . . . . . . . . . . . $1,472,441 $1,188,236 $992,075
Costs and Expenses:Cost of goods sold . . . . . . . . . . . . . . . . . . . . . . . . . . . . . . . . . . . . . . . . . . . . 571,496 435,511 349,089
Research and development . . . . . . . . . . . . . . . . . . . . . . . . . . . . . . . . . . . . . . 78,041 63,455 58,155
Selling, general and administrative . . . . . . . . . . . . . . . . . . . . . . . . . . . . . . . 690,746 624,096 455,629
Intangible asset amortization . . . . . . . . . . . . . . . . . . . . . . . . . . . . . . . . . . . . 21,160 20,370 13,862
Total costs and expenses . . . . . . . . . . . . . . . . . . . . . . . . . . . . . . . . . . . . 1,361,443 1,143,432 876,735
Operating income . . . . . . . . . . . . . . . . . . . . . . . . . . . . . . . . . . . . . . . . . . . . 110,998 44,804 115,340
Interest income . . . . . . . . . . . . . . . . . . . . . . . . . . . . . . . . . . . . . . . . . . . . . . . 2,800 255 24
Interest expense . . . . . . . . . . . . . . . . . . . . . . . . . . . . . . . . . . . . . . . . . . . . . . (64,683) (35,019) (25,803)
Other income, net . . . . . . . . . . . . . . . . . . . . . . . . . . . . . . . . . . . . . . . . . . . . . 8,288 1,345 845
Income before income taxes . . . . . . . . . . . . . . . . . . . . . . . . . . . . . . . . . . . 57,403 11,385 90,406
(Benefit from) provision for income taxes . . . . . . . . . . . . . . . . . . . . . . . . . . (3,398) (53,358) 15,842
Net income . . . . . . . . . . . . . . . . . . . . . . . . . . . . . . . . . . . . . . . . . . . . . . . . . . $ 60,801 $ 64,743 $ 74,564
Basic net income per common share . . . . . . . . . . . . . . . . . . . . . . . . . . . . $ 0.73 $ 0.84 $ 1.00
Diluted net income per common share . . . . . . . . . . . . . . . . . . . . . . . . . . . $ 0.72 $ 0.82 $ 0.94
Weighted average common shares outstanding (See Note 13):
Basic . . . . . . . . . . . . . . . . . . . . . . . . . . . . . . . . . . . . . . . . . . . . . . . . . . . . . 82,857 76,897 74,386
Diluted . . . . . . . . . . . . . . . . . . . . . . . . . . . . . . . . . . . . . . . . . . . . . . . . . . . 83,999 79,121 79,194
The accompanying notes are an integral part of these consolidated financial statements.
F-3
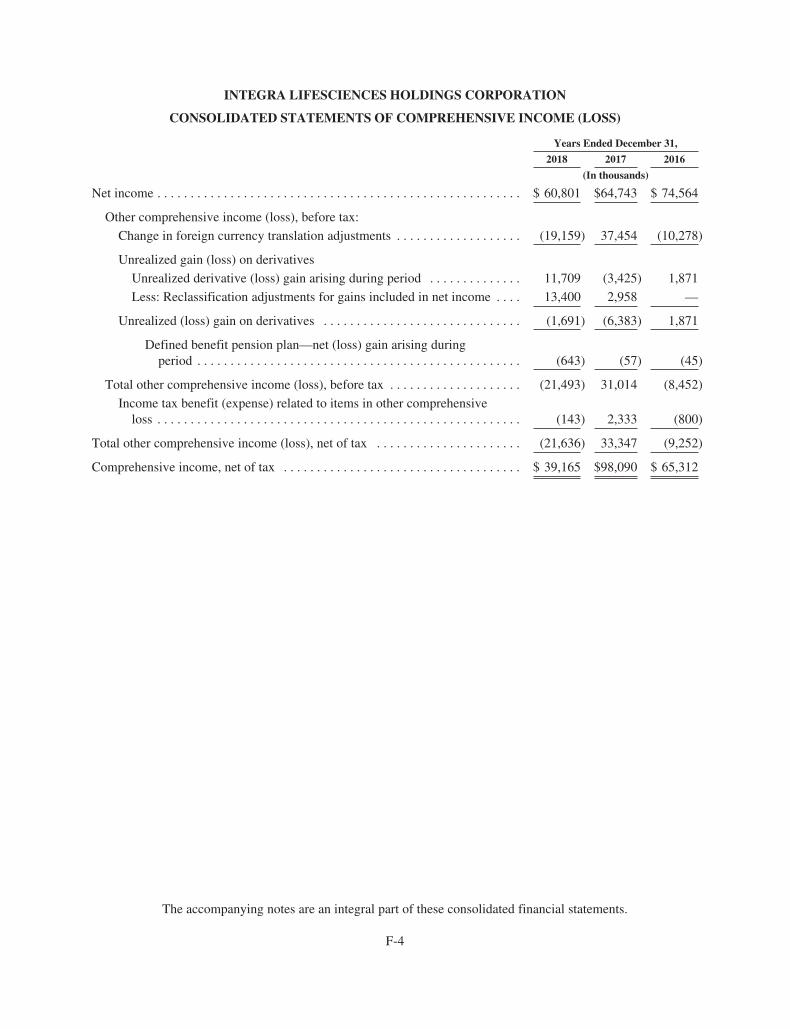
INTEGRA LIFESCIENCES HOLDINGS CORPORATION
CONSOLIDATED STATEMENTS OF COMPREHENSIVE INCOME (LOSS)
Years Ended December 31,
2018 2017 2016
(In thousands)
Net income . . . . . . . . . . . . . . . . . . . . . . . . . . . . . . . . . . . . . . . . . . . . . . . . . . . . . . . $ 60,801 $64,743 $ 74,564
Other comprehensive income (loss), before tax:
Change in foreign currency translation adjustments . . . . . . . . . . . . . . . . . . . (19,159) 37,454 (10,278)
Unrealized gain (loss) on derivatives
Unrealized derivative (loss) gain arising during period . . . . . . . . . . . . . . 11,709 (3,425) 1,871
Less: Reclassification adjustments for gains included in net income . . . . 13,400 2,958 —
Unrealized (loss) gain on derivatives . . . . . . . . . . . . . . . . . . . . . . . . . . . . . . (1,691) (6,383) 1,871
Defined benefit pension plan—net (loss) gain arising duringperiod . . . . . . . . . . . . . . . . . . . . . . . . . . . . . . . . . . . . . . . . . . . . . . . . . (643) (57) (45)
Total other comprehensive income (loss), before tax . . . . . . . . . . . . . . . . . . . . (21,493) 31,014 (8,452)
Income tax benefit (expense) related to items in other comprehensiveloss . . . . . . . . . . . . . . . . . . . . . . . . . . . . . . . . . . . . . . . . . . . . . . . . . . . . . . . (143) 2,333 (800)
Total other comprehensive income (loss), net of tax . . . . . . . . . . . . . . . . . . . . . . (21,636) 33,347 (9,252)
Comprehensive income, net of tax . . . . . . . . . . . . . . . . . . . . . . . . . . . . . . . . . . . . $ 39,165 $98,090 $ 65,312
The accompanying notes are an integral part of these consolidated financial statements.
F-4
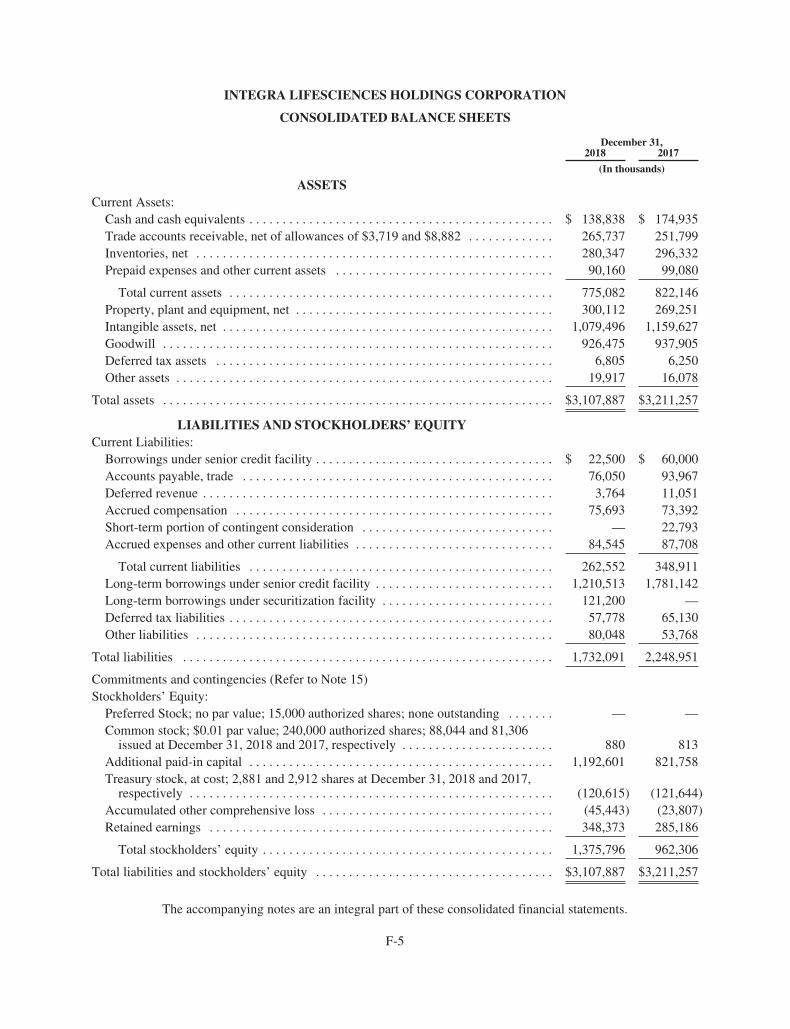
INTEGRA LIFESCIENCES HOLDINGS CORPORATION
CONSOLIDATED BALANCE SHEETS
December 31,2018 2017
(In thousands)
ASSETSCurrent Assets:
Cash and cash equivalents . . . . . . . . . . . . . . . . . . . . . . . . . . . . . . . . . . . . . . . . . . . . . . $ 138,838 $ 174,935Trade accounts receivable, net of allowances of $3,719 and $8,882 . . . . . . . . . . . . . 265,737 251,799Inventories, net . . . . . . . . . . . . . . . . . . . . . . . . . . . . . . . . . . . . . . . . . . . . . . . . . . . . . . 280,347 296,332Prepaid expenses and other current assets . . . . . . . . . . . . . . . . . . . . . . . . . . . . . . . . . 90,160 99,080
Total current assets . . . . . . . . . . . . . . . . . . . . . . . . . . . . . . . . . . . . . . . . . . . . . . . . . 775,082 822,146Property, plant and equipment, net . . . . . . . . . . . . . . . . . . . . . . . . . . . . . . . . . . . . . . . 300,112 269,251Intangible assets, net . . . . . . . . . . . . . . . . . . . . . . . . . . . . . . . . . . . . . . . . . . . . . . . . . . 1,079,496 1,159,627Goodwill . . . . . . . . . . . . . . . . . . . . . . . . . . . . . . . . . . . . . . . . . . . . . . . . . . . . . . . . . . . 926,475 937,905Deferred tax assets . . . . . . . . . . . . . . . . . . . . . . . . . . . . . . . . . . . . . . . . . . . . . . . . . . . 6,805 6,250Other assets . . . . . . . . . . . . . . . . . . . . . . . . . . . . . . . . . . . . . . . . . . . . . . . . . . . . . . . . . 19,917 16,078
Total assets . . . . . . . . . . . . . . . . . . . . . . . . . . . . . . . . . . . . . . . . . . . . . . . . . . . . . . . . . . . $3,107,887 $3,211,257
LIABILITIES AND STOCKHOLDERS’ EQUITYCurrent Liabilities:
Borrowings under senior credit facility . . . . . . . . . . . . . . . . . . . . . . . . . . . . . . . . . . . . $ 22,500 $ 60,000Accounts payable, trade . . . . . . . . . . . . . . . . . . . . . . . . . . . . . . . . . . . . . . . . . . . . . . . 76,050 93,967Deferred revenue . . . . . . . . . . . . . . . . . . . . . . . . . . . . . . . . . . . . . . . . . . . . . . . . . . . . . 3,764 11,051Accrued compensation . . . . . . . . . . . . . . . . . . . . . . . . . . . . . . . . . . . . . . . . . . . . . . . . 75,693 73,392Short-term portion of contingent consideration . . . . . . . . . . . . . . . . . . . . . . . . . . . . . — 22,793Accrued expenses and other current liabilities . . . . . . . . . . . . . . . . . . . . . . . . . . . . . . 84,545 87,708
Total current liabilities . . . . . . . . . . . . . . . . . . . . . . . . . . . . . . . . . . . . . . . . . . . . . . 262,552 348,911Long-term borrowings under senior credit facility . . . . . . . . . . . . . . . . . . . . . . . . . . . 1,210,513 1,781,142Long-term borrowings under securitization facility . . . . . . . . . . . . . . . . . . . . . . . . . . 121,200 —Deferred tax liabilities . . . . . . . . . . . . . . . . . . . . . . . . . . . . . . . . . . . . . . . . . . . . . . . . . 57,778 65,130Other liabilities . . . . . . . . . . . . . . . . . . . . . . . . . . . . . . . . . . . . . . . . . . . . . . . . . . . . . . 80,048 53,768
Total liabilities . . . . . . . . . . . . . . . . . . . . . . . . . . . . . . . . . . . . . . . . . . . . . . . . . . . . . . . . 1,732,091 2,248,951
Commitments and contingencies (Refer to Note 15)Stockholders’ Equity:
Preferred Stock; no par value; 15,000 authorized shares; none outstanding . . . . . . . — —Common stock; $0.01 par value; 240,000 authorized shares; 88,044 and 81,306
issued at December 31, 2018 and 2017, respectively . . . . . . . . . . . . . . . . . . . . . . . 880 813Additional paid-in capital . . . . . . . . . . . . . . . . . . . . . . . . . . . . . . . . . . . . . . . . . . . . . . 1,192,601 821,758Treasury stock, at cost; 2,881 and 2,912 shares at December 31, 2018 and 2017,
respectively . . . . . . . . . . . . . . . . . . . . . . . . . . . . . . . . . . . . . . . . . . . . . . . . . . . . . . . (120,615) (121,644)Accumulated other comprehensive loss . . . . . . . . . . . . . . . . . . . . . . . . . . . . . . . . . . . (45,443) (23,807)Retained earnings . . . . . . . . . . . . . . . . . . . . . . . . . . . . . . . . . . . . . . . . . . . . . . . . . . . . 348,373 285,186
Total stockholders’ equity . . . . . . . . . . . . . . . . . . . . . . . . . . . . . . . . . . . . . . . . . . . . 1,375,796 962,306
Total liabilities and stockholders’ equity . . . . . . . . . . . . . . . . . . . . . . . . . . . . . . . . . . . . $3,107,887 $3,211,257
The accompanying notes are an integral part of these consolidated financial statements.
F-5

INTEGRA LIFESCIENCES HOLDINGS CORPORATION
CONSOLIDATED STATEMENTS OF CASH FLOWS
Years Ended December 31,
2018 2017 2016
(In thousands)OPERATING ACTIVITIES:
Net income . . . . . . . . . . . . . . . . . . . . . . . . . . . . . . . . . . . . . . . . . . . . . . . . . . . . . . . . . . . . . . . . . . . . . . . . . $ 60,801 $ 64,743 $ 74,564Adjustments to reconcile net income to net cash provided by operating activities:
Depreciation and amortization . . . . . . . . . . . . . . . . . . . . . . . . . . . . . . . . . . . . . . . . . . . . . . . . . . . . . . . 110,730 88,945 72,665Non-cash impairment charges . . . . . . . . . . . . . . . . . . . . . . . . . . . . . . . . . . . . . . . . . . . . . . . . . . . . . . . . 4,941 3,290 —Deferred income tax benefit . . . . . . . . . . . . . . . . . . . . . . . . . . . . . . . . . . . . . . . . . . . . . . . . . . . . . . . . . (8,184) (67,304) (6,474)Share-based compensation . . . . . . . . . . . . . . . . . . . . . . . . . . . . . . . . . . . . . . . . . . . . . . . . . . . . . . . . . . 20,779 21,550 17,310Amortization of debt issuance costs . . . . . . . . . . . . . . . . . . . . . . . . . . . . . . . . . . . . . . . . . . . . . . . . . . . 6,270 2,722 2,529Non-cash interest expense . . . . . . . . . . . . . . . . . . . . . . . . . . . . . . . . . . . . . . . . . . . . . . . . . . . . . . . . . . . — — 8,074Realized loss on sale of short-term investments . . . . . . . . . . . . . . . . . . . . . . . . . . . . . . . . . . . . . . . . . . — 2,287 —Loss on disposal of property and equipment . . . . . . . . . . . . . . . . . . . . . . . . . . . . . . . . . . . . . . . . . . . . . 1,385 6,989 1,765Gain on divestiture of business . . . . . . . . . . . . . . . . . . . . . . . . . . . . . . . . . . . . . . . . . . . . . . . . . . . . . . . — (2,645) —Change in fair value of contingent consideration and others . . . . . . . . . . . . . . . . . . . . . . . . . . . . . . . . 1,214 (4,710) (13)Payment of accreted interest . . . . . . . . . . . . . . . . . . . . . . . . . . . . . . . . . . . . . . . . . . . . . . . . . . . . . . . . . — — (42,786)
Changes in assets and liabilities, net of business acquisitions:Accounts receivable . . . . . . . . . . . . . . . . . . . . . . . . . . . . . . . . . . . . . . . . . . . . . . . . . . . . . . . . . . . . . . (17,021) (89,698) (17,518)Inventories . . . . . . . . . . . . . . . . . . . . . . . . . . . . . . . . . . . . . . . . . . . . . . . . . . . . . . . . . . . . . . . . . . . . . 8,300 99 (9,576)Prepaid expenses and other current assets . . . . . . . . . . . . . . . . . . . . . . . . . . . . . . . . . . . . . . . . . . . . . 3,933 (33,808) 14,912Other non-current assets . . . . . . . . . . . . . . . . . . . . . . . . . . . . . . . . . . . . . . . . . . . . . . . . . . . . . . . . . . 1,052 (914) (475)Accounts payable, accrued expenses and other current liabilities . . . . . . . . . . . . . . . . . . . . . . . . . . . 3,588 95,321 (414)Deferred revenue . . . . . . . . . . . . . . . . . . . . . . . . . . . . . . . . . . . . . . . . . . . . . . . . . . . . . . . . . . . . . . . . 1,504 3,874 1,251Other non-current liabilities . . . . . . . . . . . . . . . . . . . . . . . . . . . . . . . . . . . . . . . . . . . . . . . . . . . . . . . . 391 23,803 591
Net cash provided by operating activities . . . . . . . . . . . . . . . . . . . . . . . . . . . . . . . . . . . . . . . 199,683 114,544 116,405
INVESTING ACTIVITIES:Change in restricted cash . . . . . . . . . . . . . . . . . . . . . . . . . . . . . . . . . . . . . . . . . . . . . . . . . . . . . . . . . . . . . . — — 4,165Proceeds from sale of short-term investments . . . . . . . . . . . . . . . . . . . . . . . . . . . . . . . . . . . . . . . . . . . . . . — 16,951 —Proceeds from note receivable . . . . . . . . . . . . . . . . . . . . . . . . . . . . . . . . . . . . . . . . . . . . . . . . . . . . . . . . . . 910 483 —Cash used in business acquisitions, net of cash acquired . . . . . . . . . . . . . . . . . . . . . . . . . . . . . . . . . . . . . 26,704 (1,241,946) 225Purchases of property and equipment . . . . . . . . . . . . . . . . . . . . . . . . . . . . . . . . . . . . . . . . . . . . . . . . . . . . (77,741) (43,503) (47,328)Proceeds from sales of property and equipment . . . . . . . . . . . . . . . . . . . . . . . . . . . . . . . . . . . . . . . . . . . . 422 293 316Proceeds from divestiture of business . . . . . . . . . . . . . . . . . . . . . . . . . . . . . . . . . . . . . . . . . . . . . . . . . . . . — 46,387 —
Net cash used in investing activities . . . . . . . . . . . . . . . . . . . . . . . . . . . . . . . . . . . . . . . . . . . . (49,705) (1,221,335) (42,622)
FINANCING ACTIVITIES:Proceeds from borrowings of long-term indebtedness . . . . . . . . . . . . . . . . . . . . . . . . . . . . . . . . . . . . . . . 171,200 1,307,000 680,000Payments on debt . . . . . . . . . . . . . . . . . . . . . . . . . . . . . . . . . . . . . . . . . . . . . . . . . . . . . . . . . . . . . . . . . . . . (660,000) (117,000) (511,250)Net cash paid for contingent consideration . . . . . . . . . . . . . . . . . . . . . . . . . . . . . . . . . . . . . . . . . . . . . . . . (38,196) (4,661) —Proceeds from the issuance of common stock, net of issuance costs . . . . . . . . . . . . . . . . . . . . . . . . . . . . 349,590 — —Payment of liability component of convertible notes . . . . . . . . . . . . . . . . . . . . . . . . . . . . . . . . . . . . . . . . — — (184,313)Payment of capital lease obligation . . . . . . . . . . . . . . . . . . . . . . . . . . . . . . . . . . . . . . . . . . . . . . . . . . . . . . — — (653)Debt issuance costs . . . . . . . . . . . . . . . . . . . . . . . . . . . . . . . . . . . . . . . . . . . . . . . . . . . . . . . . . . . . . . . . . . (5,037) (19,043) (4,530)Proceeds from exercised stock options . . . . . . . . . . . . . . . . . . . . . . . . . . . . . . . . . . . . . . . . . . . . . . . . . . . 9,392 9,774 10,481Cash taxes paid in net equity settlement . . . . . . . . . . . . . . . . . . . . . . . . . . . . . . . . . . . . . . . . . . . . . . . . . . (7,821) (7,123) (4,851)
Net cash provided by (used in) financing activities . . . . . . . . . . . . . . . . . . . . . . . . . . . . . . . . . . . (180,872) 1,168,947 (15,116)
Effect of exchange rate changes on cash and cash equivalents . . . . . . . . . . . . . . . . . . . . . . . . . . . . . . . . . . . (5,203) 10,724 (4,744)Net increase (decrease) in cash and cash equivalents . . . . . . . . . . . . . . . . . . . . . . . . . . . . . . . . . . . . . . . . . . (36,097) 72,880 53,923Cash and cash equivalents at beginning of period . . . . . . . . . . . . . . . . . . . . . . . . . . . . . . . . . . . . . . . . . . . . . 174,935 102,055 48,132
Cash and cash equivalents at end of period . . . . . . . . . . . . . . . . . . . . . . . . . . . . . . . . . . . . . . . . . . . . . . . . . . $ 138,838 $ 174,935 $ 102,055
The accompanying notes are an integral part of these consolidated financial statements.
F-6
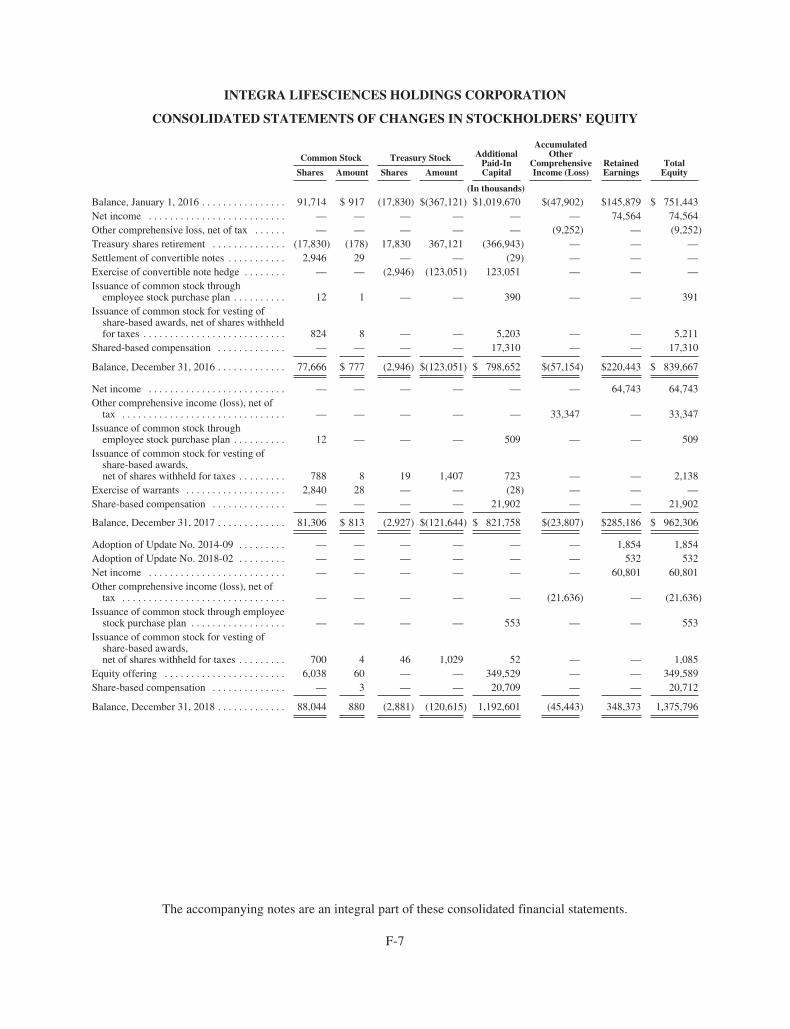
INTEGRA LIFESCIENCES HOLDINGS CORPORATION
CONSOLIDATED STATEMENTS OF CHANGES IN STOCKHOLDERS’ EQUITY
Common Stock Treasury Stock AdditionalPaid-InCapital
AccumulatedOther
ComprehensiveIncome (Loss)
RetainedEarnings
TotalEquityShares Amount Shares Amount
(In thousands)
Balance, January 1, 2016 . . . . . . . . . . . . . . . . 91,714 $ 917 (17,830) $(367,121) $1,019,670 $(47,902) $145,879 $ 751,443Net income . . . . . . . . . . . . . . . . . . . . . . . . . . — — — — — — 74,564 74,564Other comprehensive loss, net of tax . . . . . . — — — — — (9,252) — (9,252)Treasury shares retirement . . . . . . . . . . . . . . (17,830) (178) 17,830 367,121 (366,943) — — —Settlement of convertible notes . . . . . . . . . . . 2,946 29 — — (29) — — —Exercise of convertible note hedge . . . . . . . . — — (2,946) (123,051) 123,051 — — —Issuance of common stock through
employee stock purchase plan . . . . . . . . . . 12 1 — — 390 — — 391Issuance of common stock for vesting of
share-based awards, net of shares withheldfor taxes . . . . . . . . . . . . . . . . . . . . . . . . . . . 824 8 — — 5,203 — — 5,211
Shared-based compensation . . . . . . . . . . . . . — — — — 17,310 — — 17,310
Balance, December 31, 2016 . . . . . . . . . . . . . 77,666 $ 777 (2,946) $(123,051) $ 798,652 $(57,154) $220,443 $ 839,667
Net income . . . . . . . . . . . . . . . . . . . . . . . . . . — — — — — — 64,743 64,743Other comprehensive income (loss), net of
tax . . . . . . . . . . . . . . . . . . . . . . . . . . . . . . . — — — — — 33,347 — 33,347Issuance of common stock through
employee stock purchase plan . . . . . . . . . . 12 — — — 509 — — 509Issuance of common stock for vesting of
share-based awards,net of shares withheld for taxes . . . . . . . . . 788 8 19 1,407 723 — — 2,138
Exercise of warrants . . . . . . . . . . . . . . . . . . . 2,840 28 — — (28) — — —Share-based compensation . . . . . . . . . . . . . . — — — — 21,902 — — 21,902
Balance, December 31, 2017 . . . . . . . . . . . . . 81,306 $ 813 (2,927) $(121,644) $ 821,758 $(23,807) $285,186 $ 962,306
Adoption of Update No. 2014-09 . . . . . . . . . — — — — — — 1,854 1,854Adoption of Update No. 2018-02 . . . . . . . . . — — — — — — 532 532Net income . . . . . . . . . . . . . . . . . . . . . . . . . . — — — — — — 60,801 60,801Other comprehensive income (loss), net of
tax . . . . . . . . . . . . . . . . . . . . . . . . . . . . . . . — — — — — (21,636) — (21,636)Issuance of common stock through employee
stock purchase plan . . . . . . . . . . . . . . . . . . — — — — 553 — — 553Issuance of common stock for vesting of
share-based awards,net of shares withheld for taxes . . . . . . . . . 700 4 46 1,029 52 — — 1,085
Equity offering . . . . . . . . . . . . . . . . . . . . . . . 6,038 60 — — 349,529 — — 349,589Share-based compensation . . . . . . . . . . . . . . — 3 — — 20,709 — — 20,712
Balance, December 31, 2018 . . . . . . . . . . . . . 88,044 880 (2,881) (120,615) 1,192,601 (45,443) 348,373 1,375,796
The accompanying notes are an integral part of these consolidated financial statements.
F-7
INTEGRA LIFESCIENCES HOLDINGS CORPORATION
NOTES TO CONSOLIDATED FINANCIAL STATEMENTS
1. BUSINESS
Integra LifeSciences Holdings Corporation (the “Company”) was incorporated in Delaware in 1989. TheCompany, a world leader in medical devices, is dedicated to limiting uncertainty for surgeons through thedevelopment, manufacturing, and marketing of cost-effective surgical implants and medical instruments. Itsproducts are used primarily in neurosurgery, extremity reconstruction, orthopedics and general surgery.
The Company sells its products directly through various sales forces and through a variety of otherdistribution channels.
2. SUMMARY OF SIGNIFICANT ACCOUNTING POLICIES
BASIS OF PRESENTATION
These financial statements and the accompanying notes are prepared in accordance with accountingprinciples generally accepted in the United States of America and conform to Regulation S-X under theSecurities Exchange Act of 1934, as amended.
PRINCIPLES OF CONSOLIDATION
The consolidated financial statements include the accounts of the Company and its subsidiaries, all of whichare wholly owned. All intercompany accounts and transactions are eliminated in consolidation. See Note 4,Acquisitions and Pro Forma Results, for details of new subsidiaries included in the consolidation.
USE OF ESTIMATES
The preparation of consolidated financial statements in conformity with generally accepted accountingprinciples requires management to make estimates and assumptions that affect the reported amounts of assets andliabilities, the disclosure of contingent liabilities, and the reported amounts of revenues and expenses. Significantestimates affecting amounts reported or disclosed in the consolidated financial statements include allowances fordoubtful accounts receivable and sales returns and allowances, net realizable value of inventories, valuation ofintangible assets and in-process research and development (“IPR&D”), amortization periods for acquiredintangible assets, discount rates and estimated projected cash flows used to value and test impairments of long-lived assets and goodwill, estimates of projected cash flows, depreciation and amortization periods for long-livedassets, computation of taxes, valuation allowances recorded against deferred tax assets, the valuation of stock-based compensation, valuation of pension assets and liabilities, valuation of derivative instruments, and valuationof debt instruments and loss contingencies. These estimates are based on historical experience and on variousother assumptions that are believed to be reasonable under the current circumstances. Actual results could differfrom these estimates.
RECLASSIFICATIONS
Certain amounts from the prior year’s financial statements have been reclassified in order to conform to thecurrent year’s presentation.
CASH AND CASH EQUIVALENTS
The Company considers all short-term, highly liquid investments purchased with original maturities of threemonths or less to be cash equivalents. These investments are carried at cost, which approximates fair value.
TRADE ACCOUNTS RECEIVABLE AND ALLOWANCES FOR DOUBTFUL ACCOUNTS RECEIVABLE
Trade accounts receivable are recorded at the invoiced amount and do not bear interest. The Companygrants credit to customers in the normal course of business, but generally does not require collateral or any othersecurity to support its receivables.
F-8
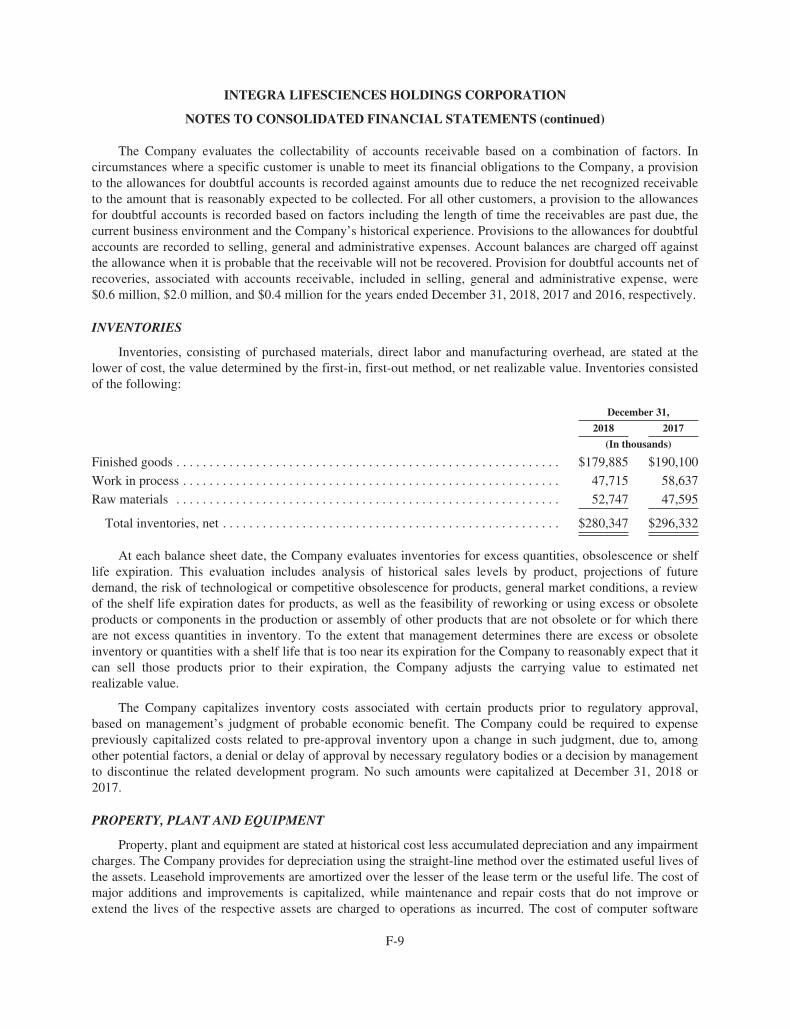
INTEGRA LIFESCIENCES HOLDINGS CORPORATION
NOTES TO CONSOLIDATED FINANCIAL STATEMENTS (continued)
The Company evaluates the collectability of accounts receivable based on a combination of factors. Incircumstances where a specific customer is unable to meet its financial obligations to the Company, a provisionto the allowances for doubtful accounts is recorded against amounts due to reduce the net recognized receivableto the amount that is reasonably expected to be collected. For all other customers, a provision to the allowancesfor doubtful accounts is recorded based on factors including the length of time the receivables are past due, thecurrent business environment and the Company’s historical experience. Provisions to the allowances for doubtfulaccounts are recorded to selling, general and administrative expenses. Account balances are charged off againstthe allowance when it is probable that the receivable will not be recovered. Provision for doubtful accounts net ofrecoveries, associated with accounts receivable, included in selling, general and administrative expense, were$0.6 million, $2.0 million, and $0.4 million for the years ended December 31, 2018, 2017 and 2016, respectively.
INVENTORIES
Inventories, consisting of purchased materials, direct labor and manufacturing overhead, are stated at thelower of cost, the value determined by the first-in, first-out method, or net realizable value. Inventories consistedof the following:
December 31,
2018 2017
(In thousands)
Finished goods . . . . . . . . . . . . . . . . . . . . . . . . . . . . . . . . . . . . . . . . . . . . . . . . . . . . . . . . . . $179,885 $190,100
Work in process . . . . . . . . . . . . . . . . . . . . . . . . . . . . . . . . . . . . . . . . . . . . . . . . . . . . . . . . . 47,715 58,637
Raw materials . . . . . . . . . . . . . . . . . . . . . . . . . . . . . . . . . . . . . . . . . . . . . . . . . . . . . . . . . . 52,747 47,595
Total inventories, net . . . . . . . . . . . . . . . . . . . . . . . . . . . . . . . . . . . . . . . . . . . . . . . . . . . $280,347 $296,332
At each balance sheet date, the Company evaluates inventories for excess quantities, obsolescence or shelflife expiration. This evaluation includes analysis of historical sales levels by product, projections of futuredemand, the risk of technological or competitive obsolescence for products, general market conditions, a reviewof the shelf life expiration dates for products, as well as the feasibility of reworking or using excess or obsoleteproducts or components in the production or assembly of other products that are not obsolete or for which thereare not excess quantities in inventory. To the extent that management determines there are excess or obsoleteinventory or quantities with a shelf life that is too near its expiration for the Company to reasonably expect that itcan sell those products prior to their expiration, the Company adjusts the carrying value to estimated netrealizable value.
The Company capitalizes inventory costs associated with certain products prior to regulatory approval,based on management’s judgment of probable economic benefit. The Company could be required to expensepreviously capitalized costs related to pre-approval inventory upon a change in such judgment, due to, amongother potential factors, a denial or delay of approval by necessary regulatory bodies or a decision by managementto discontinue the related development program. No such amounts were capitalized at December 31, 2018 or2017.
PROPERTY, PLANT AND EQUIPMENT
Property, plant and equipment are stated at historical cost less accumulated depreciation and any impairmentcharges. The Company provides for depreciation using the straight-line method over the estimated useful lives ofthe assets. Leasehold improvements are amortized over the lesser of the lease term or the useful life. The cost ofmajor additions and improvements is capitalized, while maintenance and repair costs that do not improve orextend the lives of the respective assets are charged to operations as incurred. The cost of computer software
F-9
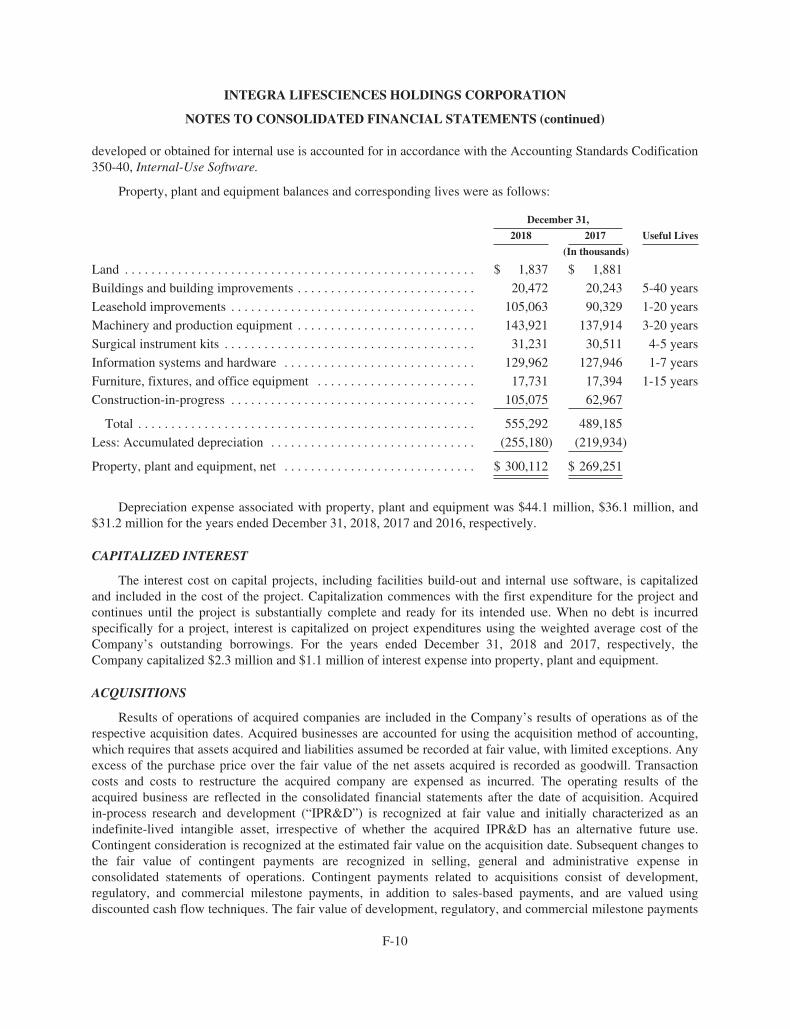
INTEGRA LIFESCIENCES HOLDINGS CORPORATION
NOTES TO CONSOLIDATED FINANCIAL STATEMENTS (continued)
developed or obtained for internal use is accounted for in accordance with the Accounting Standards Codification350-40, Internal-Use Software.
Property, plant and equipment balances and corresponding lives were as follows:
December 31,
2018 2017 Useful Lives
(In thousands)
Land . . . . . . . . . . . . . . . . . . . . . . . . . . . . . . . . . . . . . . . . . . . . . . . . . . . . . $ 1,837 $ 1,881
Buildings and building improvements . . . . . . . . . . . . . . . . . . . . . . . . . . . 20,472 20,243 5-40 years
Leasehold improvements . . . . . . . . . . . . . . . . . . . . . . . . . . . . . . . . . . . . . 105,063 90,329 1-20 years
Machinery and production equipment . . . . . . . . . . . . . . . . . . . . . . . . . . . 143,921 137,914 3-20 years
Surgical instrument kits . . . . . . . . . . . . . . . . . . . . . . . . . . . . . . . . . . . . . . 31,231 30,511 4-5 years
Information systems and hardware . . . . . . . . . . . . . . . . . . . . . . . . . . . . . 129,962 127,946 1-7 years
Furniture, fixtures, and office equipment . . . . . . . . . . . . . . . . . . . . . . . . 17,731 17,394 1-15 years
Construction-in-progress . . . . . . . . . . . . . . . . . . . . . . . . . . . . . . . . . . . . . 105,075 62,967
Total . . . . . . . . . . . . . . . . . . . . . . . . . . . . . . . . . . . . . . . . . . . . . . . . . . . 555,292 489,185
Less: Accumulated depreciation . . . . . . . . . . . . . . . . . . . . . . . . . . . . . . . (255,180) (219,934)
Property, plant and equipment, net . . . . . . . . . . . . . . . . . . . . . . . . . . . . . $ 300,112 $ 269,251
Depreciation expense associated with property, plant and equipment was $44.1 million, $36.1 million, and$31.2 million for the years ended December 31, 2018, 2017 and 2016, respectively.
CAPITALIZED INTEREST
The interest cost on capital projects, including facilities build-out and internal use software, is capitalizedand included in the cost of the project. Capitalization commences with the first expenditure for the project andcontinues until the project is substantially complete and ready for its intended use. When no debt is incurredspecifically for a project, interest is capitalized on project expenditures using the weighted average cost of theCompany’s outstanding borrowings. For the years ended December 31, 2018 and 2017, respectively, theCompany capitalized $2.3 million and $1.1 million of interest expense into property, plant and equipment.
ACQUISITIONS
Results of operations of acquired companies are included in the Company’s results of operations as of therespective acquisition dates. Acquired businesses are accounted for using the acquisition method of accounting,which requires that assets acquired and liabilities assumed be recorded at fair value, with limited exceptions. Anyexcess of the purchase price over the fair value of the net assets acquired is recorded as goodwill. Transactioncosts and costs to restructure the acquired company are expensed as incurred. The operating results of theacquired business are reflected in the consolidated financial statements after the date of acquisition. Acquiredin-process research and development (“IPR&D”) is recognized at fair value and initially characterized as anindefinite-lived intangible asset, irrespective of whether the acquired IPR&D has an alternative future use.Contingent consideration is recognized at the estimated fair value on the acquisition date. Subsequent changes tothe fair value of contingent payments are recognized in selling, general and administrative expense inconsolidated statements of operations. Contingent payments related to acquisitions consist of development,regulatory, and commercial milestone payments, in addition to sales-based payments, and are valued usingdiscounted cash flow techniques. The fair value of development, regulatory, and commercial milestone payments
F-10
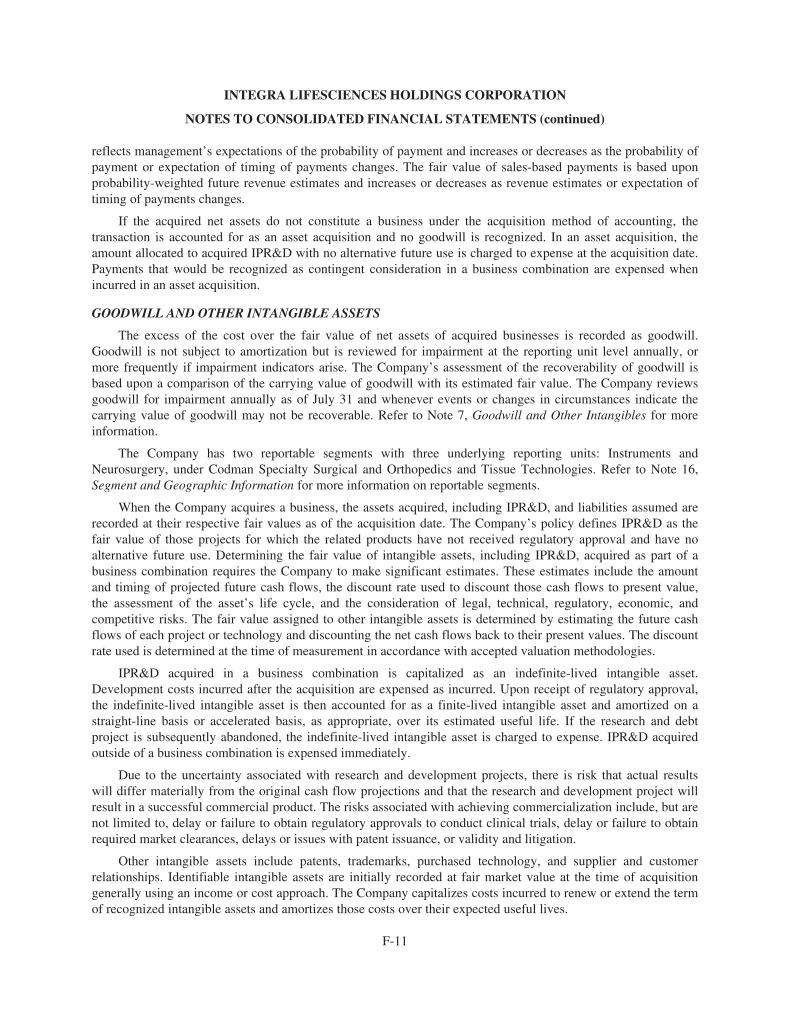
INTEGRA LIFESCIENCES HOLDINGS CORPORATION
NOTES TO CONSOLIDATED FINANCIAL STATEMENTS (continued)
reflects management’s expectations of the probability of payment and increases or decreases as the probability ofpayment or expectation of timing of payments changes. The fair value of sales-based payments is based uponprobability-weighted future revenue estimates and increases or decreases as revenue estimates or expectation oftiming of payments changes.
If the acquired net assets do not constitute a business under the acquisition method of accounting, thetransaction is accounted for as an asset acquisition and no goodwill is recognized. In an asset acquisition, theamount allocated to acquired IPR&D with no alternative future use is charged to expense at the acquisition date.Payments that would be recognized as contingent consideration in a business combination are expensed whenincurred in an asset acquisition.
GOODWILL AND OTHER INTANGIBLE ASSETS
The excess of the cost over the fair value of net assets of acquired businesses is recorded as goodwill.Goodwill is not subject to amortization but is reviewed for impairment at the reporting unit level annually, ormore frequently if impairment indicators arise. The Company’s assessment of the recoverability of goodwill isbased upon a comparison of the carrying value of goodwill with its estimated fair value. The Company reviewsgoodwill for impairment annually as of July 31 and whenever events or changes in circumstances indicate thecarrying value of goodwill may not be recoverable. Refer to Note 7, Goodwill and Other Intangibles for moreinformation.
The Company has two reportable segments with three underlying reporting units: Instruments andNeurosurgery, under Codman Specialty Surgical and Orthopedics and Tissue Technologies. Refer to Note 16,Segment and Geographic Information for more information on reportable segments.
When the Company acquires a business, the assets acquired, including IPR&D, and liabilities assumed arerecorded at their respective fair values as of the acquisition date. The Company’s policy defines IPR&D as thefair value of those projects for which the related products have not received regulatory approval and have noalternative future use. Determining the fair value of intangible assets, including IPR&D, acquired as part of abusiness combination requires the Company to make significant estimates. These estimates include the amountand timing of projected future cash flows, the discount rate used to discount those cash flows to present value,the assessment of the asset’s life cycle, and the consideration of legal, technical, regulatory, economic, andcompetitive risks. The fair value assigned to other intangible assets is determined by estimating the future cashflows of each project or technology and discounting the net cash flows back to their present values. The discountrate used is determined at the time of measurement in accordance with accepted valuation methodologies.
IPR&D acquired in a business combination is capitalized as an indefinite-lived intangible asset.Development costs incurred after the acquisition are expensed as incurred. Upon receipt of regulatory approval,the indefinite-lived intangible asset is then accounted for as a finite-lived intangible asset and amortized on astraight-line basis or accelerated basis, as appropriate, over its estimated useful life. If the research and debtproject is subsequently abandoned, the indefinite-lived intangible asset is charged to expense. IPR&D acquiredoutside of a business combination is expensed immediately.
Due to the uncertainty associated with research and development projects, there is risk that actual resultswill differ materially from the original cash flow projections and that the research and development project willresult in a successful commercial product. The risks associated with achieving commercialization include, but arenot limited to, delay or failure to obtain regulatory approvals to conduct clinical trials, delay or failure to obtainrequired market clearances, delays or issues with patent issuance, or validity and litigation.
Other intangible assets include patents, trademarks, purchased technology, and supplier and customerrelationships. Identifiable intangible assets are initially recorded at fair market value at the time of acquisitiongenerally using an income or cost approach. The Company capitalizes costs incurred to renew or extend the termof recognized intangible assets and amortizes those costs over their expected useful lives.
F-11
INTEGRA LIFESCIENCES HOLDINGS CORPORATION
NOTES TO CONSOLIDATED FINANCIAL STATEMENTS (continued)
LONG-LIVED ASSETS
Long-lived assets held and used by the Company, including property, plant and equipment and intangibleassets, are reviewed for impairment whenever events or changes in circumstances indicate that the carryingamount of an asset may not be recoverable. For purposes of evaluating the recoverability of long-lived assets tobe held and used, a recoverability test is performed using projected undiscounted net cash flows applicable to thelong-lived assets. If an impairment exists, the amount of such impairment is calculated based on the estimatedfair value of the asset. Impairments to long-lived assets to be disposed of are recorded based upon the differencebetween the carrying value and the fair value of the applicable assets.
INTEGRA FOUNDATION
The Company may periodically make contributions to the Integra Foundation, Inc. The Integra Foundationwas incorporated in 2002 exclusively for charitable, educational, and scientific purposes and qualifies underIRC 501(c)(3) as an exempt private foundation. Under its charter, the Integra Foundation engages in activitiesthat promote health, the diagnosis and treatment of disease, and the development of medical science throughgrants, contributions and other appropriate means. The Integra Foundation is a separate legal entity and is not asubsidiary of the Company; therefore, its results are not included in these consolidated financial statements. TheCompany contributed $0.8 million and $0.5 million to the Integra Foundation during the years endedDecember 31, 2018 and 2017, respectively. There were no contributions to the Integra Foundation during 2016.These contributions were recorded in selling, general, and administrative expense.
DERIVATIVES
The Company develops, manufactures, and sells medical devices globally, and its earnings and cash flowsare exposed to market risk from changes in interest rates and currency exchange rates. The Company addressesthese risks through a risk management program that includes the use of derivative financial instruments andoperates the program pursuant to documented corporate risk management policies. All derivative financialinstruments are recognized in the financial statements at fair value in accordance with the authoritative guidance.Under the guidance, for those instruments that are designated and qualify as hedging instruments, the hedginginstrument must be designated as a fair value hedge, cash flow hedge, or a hedge of a net investment in a foreignoperation, based on the exposure being hedged. The accounting for changes in the fair value of a derivativeinstrument depends on whether it has been designated and qualifies as part of a hedging relationship and, further,on the type of hedging relationship. The Company’s derivative instruments do not subject its earnings or cashflows to material risk, and gains and losses on these derivatives generally offset losses and gains on the itembeing hedged. The Company has not entered into derivative transactions for speculative purposes and from timeto time, the Company may enter into derivatives that are not designated as hedging instruments in order toprotect itself from currency volatility due to intercompany balances.
All derivative instruments are recognized at their fair values as either assets or liabilities on the balancesheet. The Company determines the fair value of its derivative instruments, using the framework prescribed bythe authoritative guidance, by considering the estimated amount the Company would receive to sell or transferthese instruments at the reporting date and by taking into account: expected forward interest rates, currencyexchange rates, the creditworthiness of the counterparty for assets, and its creditworthiness for liabilities. Incertain instances, the Company utilizes a discounted cash flow model to measure fair value. Generally, theCompany uses inputs that include quoted prices for similar assets or liabilities in active markets, other observableinputs for the asset or liability and inputs derived principally from, or corroborated by, observable market data bycorrelation or other means. The Company has classified all of its derivative assets and liabilities within Level 2of the fair value hierarchy because observable inputs are available for substantially the full term of its derivativeinstruments. The Company classifies derivatives designated as hedges in the same category as the item beinghedged for cash flow presentation purposes.
F-12
INTEGRA LIFESCIENCES HOLDINGS CORPORATION
NOTES TO CONSOLIDATED FINANCIAL STATEMENTS (continued)
The Company entered into a foreign currency forward contract that is not designated as a hedginginstrument for accounting purposes. This contract is recorded at fair value, with the changes in fair valuerecognized into other income, net on the consolidated financial statements. Refer to Note 6, DerivativeInstruments for more information.
FOREIGN CURRENCY
All assets and liabilities of foreign subsidiaries which have a functional currency other than the U.S. dollarare translated at the rate of exchange at year-end, while elements of the income statement are translated at theaverage exchange rates in effect during the year. The net effect of these translation adjustments is shown as acomponent of accumulated other comprehensive income (loss). These currency translation adjustments are notcurrently adjusted for income taxes as they relate to permanent investments in non-U.S. subsidiaries. Foreigncurrency transaction (loss) gain of $1.7 million, $(2.9) million and $0.3 million are reported in other income, netin the statements of operations, for the year ended December 31, 2018, 2017 and 2016, respectively.
INCOME TAXES
Income taxes are accounted for by using the asset and liability method. Deferred tax assets and liabilities arerecognized for the estimated future tax consequences attributable to differences between the financial statementcarrying amounts of existing assets and liabilities and their respective tax basis. A valuation allowance isprovided when it is more likely than not that some portion or all of the deferred tax assets will not be realized.The effect on deferred tax assets and liabilities of a change in tax rates is recognized in income in the periodwhen the change is enacted.
The Company recognizes a tax benefit from an uncertain tax position only if it is more likely than not to besustained upon examination based on the technical merits of the position. Reserves are established for positionsthat don’t meet this recognition threshold. The reserve is measured as the largest amount of benefit determinedon a cumulative probability basis that the Company believes is more likely than not to be realized upon ultimatesettlement of the position. These reserves are classified as long-term liabilities in the consolidated balance sheetsof the Company, unless the reserves are expected to be paid in cash during the next twelve months, in which casethey are classified as current liabilities. The Company also records interest and penalties accrued in relation touncertain tax benefits as a component of income tax expense.
While the Company believes it has identified all reasonably identifiable exposures and the reserve it hasestablished for identifiable exposures is appropriate under the circumstances, it is possible that additionalexposures exist and that exposures may be settled at amounts different than the amounts reserved. It is alsopossible that changes in facts and circumstances could cause the Company to either materially increase or reducethe carrying amount of its tax reserve.
The Company continues to indefinitely reinvest substantially all of its foreign earnings. The currentprovisional analysis indicates that the Company has sufficient U.S. liquidity, including borrowing capacity, tofund foreseeable U.S. cash needs without requiring the repatriation of foreign cash. The Tax Cuts and Jobs Act(the “2017 Tax Act”), enacted in December 2017, imposed a toll tax on a deemed repatriation of undistributedearnings of foreign subsidiaries. One time or unusual items that may impact the ability or intent to keep theforeign earnings and cash indefinitely reinvested include significant U.S. acquisitions, loans from a foreignsubsidiary, changes in tax laws.
On December 22, 2017, the SEC staff issued Staff Accounting Bulletin No. 118 to address the application ofU.S. GAAP in situations when a registrant does not have the necessary information available, prepared, oranalyzed (including computations) in reasonable detail to complete the accounting for certain income tax effectsof the 2017 Tax Act. The Company recognized the provisional tax impacts related to deemed repatriated earnings
F-13
INTEGRA LIFESCIENCES HOLDINGS CORPORATION
NOTES TO CONSOLIDATED FINANCIAL STATEMENTS (continued)
and the revaluation of deferred tax assets and liabilities and included these amounts in its consolidated financialstatements for the year ended December 31, 2017. The Company applied the guidance of SAB No. 118 whenaccounting for the enactment date effects of the 2017 Tax Act in 2017 and throughout 2018. The Companyfinalized its calculations and completed its accounting for the income tax effect of the 2017 Tax Act in December2018.
REVENUE RECOGNITION
Revenue is recognized upon the transfer of control of promised products or services to the customers in anamount that reflects the consideration the Company expects to receive in exchange for those products andservices.
Total revenue, net, includes product sales, product royalties and other revenues, such as fees received fromservices.
For products shipped with FOB shipping point terms, the control of the product passes to the customer at thetime of shipment. For shipments in which the control of the product is transferred when the customer receives theproduct, the Company recognizes revenue upon receipt by the customer. Certain products that the Companyproduces for private label customers have no alternative use and the Company has a right of payment forperformance to date. Revenues from those products are recognized over the period that the Companymanufactures these products, which is typically one to three months. The Company uses the input method tomeasure the manufacturing activities completed to date, which depicts the progress of the Company’sperformance obligation of transferring control of goods being manufactured for private label customers.
A portion of the Company’s product revenue is generated from consigned inventory maintained at hospitalsand distributors, and also from inventory physically held by field sales representatives. For these types ofproducts sales, the Company retains control until the product has been used or implanted, at which time revenueis recognized.
Revenues from sale of products and services are evidenced by either a contract with the customer or a validpurchase order and an invoice which includes all relevant terms of sale. For product sales, invoices are generallyissued upon the transfer of control (or upon the completion of the manufacturing in the case of the private labeltransactions recognized over time) and are typically payable 30 days after the invoice date. The Companyperforms a review of each specific customer’s creditworthiness and ability to pay prior to acceptance as acustomer. Further, the Company performs periodic reviews of its customers’ creditworthiness prospectively.Refer to Note 3, Revenue From Contracts With Customers for more information.
RESEARCH AND DEVELOPMENT
Research and development costs, including salaries, depreciation, consultant and other external fees, andfacility costs directly attributable to research and development activities, are expensed in the period in which theyare incurred.
EMPLOYEE TERMINATION BENEFITS AND OTHER EXIT-RELATED COSTS
The Company does not have a written severance plan, and it does not offer similar termination benefits toaffected employees in all restructuring initiatives. Accordingly, in situations where minimum statutorytermination benefits must be paid to the affected employees, the Company records employee severance costsassociated with these restructuring activities in accordance with the authoritative guidance for non-retirementpost-employment benefits. Charges associated with these activities are recorded when the payment of benefits isprobable and can be reasonably estimated. In all other situations where the Company pays out terminationbenefits, including supplemental benefits paid in excess of statutory minimum amounts and benefits offered to
F-14
INTEGRA LIFESCIENCES HOLDINGS CORPORATION
NOTES TO CONSOLIDATED FINANCIAL STATEMENTS (continued)
affected employees based on management’s discretion, the Company records these termination costs inaccordance with the authoritative guidance for ASC Topic 712 Compensation-Nonretirement Benefits and ASCTopic 420 One-time Employee Termination Benefits.
The timing of the recognition of charges for employee severance costs other than minimum statutorybenefits depends on whether the affected employees are required to render service beyond their legal notificationperiod in order to receive the benefits. If affected employees are required to render service beyond their legalnotification period, charges are recognized over the future service period. Otherwise, charges are recognizedwhen management has approved a specific plan and employee communication requirements have been met.
For leased facilities and equipment that have been abandoned, the Company records estimated lease lossesbased on the fair value of the lease liability, as measured by the present value of future lease paymentssubsequent to abandonment, less the present value of any estimated sublease income on the cease-use date. Forowned facilities and equipment that will be disposed of, the Company records impairment losses based on fairvalue less costs to sell. The Company also reviews the remaining useful life of long-lived assets following adecision to exit a facility and may accelerate depreciation or amortization of these assets, as appropriate.
AMENDMENT TO THE CERTIFICATE OF INCORPORATION AND STOCK SPLIT
On October 25, 2016, the Board of Directors recommended, subject to stockholder approval, an Amendmentto the Company’s Certificate of Incorporation (the “Amendment”) to increase the number of authorized shares ofcommon stock from 60.0 million shares to 240.0 million shares with $0.01 per share par value, for the purposeof, among other things, affecting a two -for-one stock split. The Stockholders approved the amendment on itsspecial Stockholders Meeting on December 21, 2016 and the Company filed a certificate of amendment to theamended and restated certificate of incorporation to affect the increase in authorized share of common stock andthe two -for-one-stock split. Stockholders of record, as of the close of markets on December 21, 2016, becameentitled to receive one additional share of common stock for each share held. The shares were distributed onJanuary 3, 2017. No fractional shares of common stock were issued as a result of the two -for-one stock split. Theadjusted stock price was reflected on the NASDAQ stock market on January 4, 2017.
The shares of common stock retained a par value of $0.01 per share. Accordingly, the stockholders’ equityreflects the stock split by reclassifying from “Additional paid-in capital” to “Common stock” in an amount equalto the par value of the increased shares resulting from the stock split. All share and per share amounts of commonstock contained in the Company’s financial statements have been restated for all periods to give retroactive effectto the stock split.
STOCK-BASED COMPENSATION
The Company applies the authoritative guidance for stock-based compensation. This guidance requirescompanies to recognize the expense related to the fair value of their stock-based compensation awards. Stock-based compensation expense for stock option awards are based on the grant date fair value using the binomialdistribution model. The Company recognizes compensation expense for stock option awards, restricted stockawards, performance stock awards and contract stock awards over the requisite service period of the award. Allexcess tax benefits and taxes and tax deficiencies from stock-based compensation are included in provision forincome taxes in the consolidated statement of operations. Refer to Note 9, Stock-based Compensation for moreinformation.
PENSION BENEFITS
The Company maintains defined benefit pension plans that cover certain employees in Austria, France,Japan, Germany and Switzerland. Various factors are considered in determining the pension liability, including
F-15
INTEGRA LIFESCIENCES HOLDINGS CORPORATION
NOTES TO CONSOLIDATED FINANCIAL STATEMENTS (continued)
the number of employees expected to be paid their salary levels and years of service, the expected return on planassets, the discount rate used to determine the benefit obligations, the timing of benefit payments and otheractuarial assumptions.
Retirement benefit plan assumptions are reassessed on an annual basis or more frequently if changes incircumstances indicate a re-evaluation of assumptions are required. The key benefit plan assumptions are thediscount rate and expected rate of return on plan assets. The discount rate is based on average rates on bonds thatmatched the expected cash outflows of the benefit plans. The expected rate of return is based on historical andexpected returns on the various categories of plan assets.
Total contributions to the defined benefit plans were $1.7 million and $0.5 million during the years endedDecember 31, 2018 and 2017. There were no contributions to the defined benefit plans for the year endedDecember 31, 2016.
The Company uses the corridor approach in measuring the amount of net periodic benefit pension cost torecognize each period. The corridor approach defers all actuarial gains and losses resulting from variancesbetween actual results and actuarial assumptions. Those unrecognized gains and losses are amortized when thenet gains and losses exceed 10% of the greater of the market-related value of plan assets or the projected benefitobligation at the beginning of the year. The amount in excess of the corridor is amortized over the averageremaining service period to retirement date of active plan participants.
CONCENTRATION OF CREDIT RISK
Financial instruments, which potentially subject the Company to concentrations of credit risk, consistprincipally of cash and cash equivalents, which are held at major financial institutions, investment-grademarketable debt securities and trade receivables.
The Company’s products are sold on an uncollateralized basis and on credit terms based upon a credit riskassessment of each customer. A portion of the Company’s trade receivables to customers outside the UnitedStates includes sales to foreign distributors, who then sell to government owned or supported healthcare systems.
None of the Company’s customers accounted for 10% or more of the consolidated net sales during the yearsended December 31, 2018, 2017 and 2016.
NEW ACCOUNTING PRINCIPLES ADOPTED
In May 2014, the FASB issued Update No. 2014-09, Revenue from Contracts with Customers (Topic 606).The core principle of the guidance is that an entity should recognize revenue to depict the transfer of promisedgoods or services to customers in an amount that reflects the consideration to which the entity expects to beentitled in exchange for those goods or services. To achieve that core principle, an entity should 1) identify thecontract(s) with a customer, 2) identify the performance obligations in the contract, 3) determine the transactionprice, 4) allocate the transaction price to the performance obligations in the contract, and 5) recognize revenuewhen (or as) the entity satisfies a performance obligation. This update became effective for all annual periods andinterim reporting periods beginning after December 15, 2017. The Company adopted Topic 606 as of January 1,2018 using the modified retrospective method. The Company applies the practical expedient as defined inTopic 606 to recognize the incremental costs of obtaining contracts as an expense when incurred if theamortization period of the assets that the Company otherwise would have recognized is one year or less. Thesecosts which are included in selling, general, and administrative expenses are consistent with the accountingprior to the adoption of Topic 606. The Company also elected to use the practical expedient to not adjust thepromised amount of consideration for the effects of the time value of money for contracts in which theanticipated period between when the Company transfers the goods or services to the customer and when thecustomer pays is equal to one year or less. See Note 3, Revenues from Contracts with Customers, for furtherinformation.
F-16
INTEGRA LIFESCIENCES HOLDINGS CORPORATION
NOTES TO CONSOLIDATED FINANCIAL STATEMENTS (continued)
In August 2016, the FASB issued Update No. 2016-15, Classification of Certain Cash Receipts and CashPayments. The guidance addresses the classification of cash flows related to debt repayment or extinguishmentcosts, settlement of zero-coupon debt instruments or debt instruments with coupon rates that are insignificant inrelation to the effective interest rate of the borrowing, contingent consideration payments made after businesscombinations, proceeds from the settlement of insurance claims and corporate-owned life insurance, distributionsreceived from equity method investees and beneficial interests in securitization transaction. This update becameeffective for all annual periods and interim reporting periods beginning after December 15, 2017. The Companyadopted ASU 2016-15 effective January 1, 2018 on a retrospective basis. The adoption of this guidance had nosignificant impact on the Company’s consolidated financial statements.
In October 2016, the FASB issued Update No. 2016-16, Intra-Entity Transfers of Assets Other ThanInventory. The guidance requires that the income tax consequences of intra-entity transfers of assets other thaninventory be recognized as a current-period income tax expense or benefit and removes the requirement to deferand amortize the consolidated tax consequences of intra-entity transfers. The new standard became effective forall annual periods beginning after December 15, 2017. The Company adopted ASU 2016-16 effective January 1,2018. The adoption of this guidance had no significant impact on the Company’s consolidated financialstatements.
In March 2017, the FASB issued Update No. 2017-07, Compensation—Retirement Benefits (Topic 715):Improving the Presentation of Net Periodic Pension Cost and Net Periodic Postretirement Benefit Cost. Theguidance requires that an employer report the service cost component in the same line item or items as othercompensation costs arising from services rendered by the pertinent employees during the period. The othercomponents of net benefit cost are required to be presented in the income statement separately from the servicecost component and outside a subtotal of income from operations if one is presented. If a separate line item oritems were to be used to present the other components of net benefit cost, that line item or items must beappropriately described. If a separate line item or items is/are not used, the line item or items used in the incomestatement to present the other components of net benefit cost must be disclosed. In addition, the amendments alsoallow only the service cost component to be eligible for capitalization when applicable. The new standardbecame effective for annual periods beginning after December 15, 2017. The Company adoptedASU 2017-07 effective January 1, 2018. The Company recognized the components of net periodic benefit costother than the service cost component in other (expense) income, net in the consolidated statements ofoperations. The adoption of this guidance had no significant impact on the Company’s consolidated financialstatements.
In May 2017, the FASB issued ASU 2017-09, Stock Compensation (Topic 718): Scope of ModificationAccounting. The update serves to provide clarity and reduce both (1) diversity in practice and (2) cost andcomplexity when applying the guidance in Topic 718, Compensation-Stock Compensation, to a change to theterms or conditions of a share-based payment award. The new standard became effective for all annual periodsbeginning after December 15, 2017. The Company adopted ASU 2017-09 effective January 1, 2018. Theadoption of this guidance had no significant impact on the Company’s consolidated financial statements.
In August 2017, the FASB issued ASU 2017-12, Derivatives and Hedging (Topic 815): TargetedImprovements to Accounting for Hedging Activities. This update amends the hedge accounting rules to simplifythe application of hedge accounting guidance and better portray the economic results of risk managementactivities in the financial statements. The guidance expands the ability to hedge non-financial and financial riskcomponents, reduces complexity in fair value hedges of interest rate risk, eliminates the requirement toseparately measure and report hedge ineffectiveness, as well as eases certain hedge effectiveness assessmentrequirements. This update will become effective for all annual periods and interim reporting periods beginningafter December 15, 2018. Early adoption is permitted. The Company elected to early adoptASU 2017-12 effective January 1, 2017 using the modified retrospective method. The adoption of this guidancehad no significant impact on the Company’s consolidated financial statements.
F-17
INTEGRA LIFESCIENCES HOLDINGS CORPORATION
NOTES TO CONSOLIDATED FINANCIAL STATEMENTS (continued)
In February 2018, the FASB issued ASU 2018-02, Reclassification of Certain Tax Effects FromAccumulated Other Comprehensive Income. This amendment allows a reclassification from accumulated othercomprehensive income to retained earnings for stranded tax effects resulting from the 2017 Tax Act (as definedin Note 12, Income Taxes). This guidance is effective for annual and interim periods beginning afterDecember 15, 2018. Early adoption is permitted. The Company elected to early adopt the ASU 2018-02 effectiveJanuary 1, 2018, which resulted in the reclassification of $0.5 million from accumulated other comprehensiveloss to retained earnings related to a net unrealized loss on cash flow hedges.
NEW ACCOUNTING PRINCIPLES NOT YET ADOPTED
In February 2016, the FASB issued ASU 2016-02, Leases (Topic 842). Under current accounting guidance,an entity is not required to report operating leases on the balance sheet. The amendment requires that lesseesrecognize virtually all of its leases on the balance sheet by recording a right-of-use asset and lease liability (otherthan leases that meet the definition of a “short-term lease”). This update will become effective for all annualperiods and interim reporting periods beginning after December 15, 2018. The Company will adopt this standardon January 1, 2019 using the modified retrospective method. The Company is currently finalizing the changes toits processes, systems and controls which are necessary to support recognition and disclosure under the new leasestandard. The estimated impact of recording a right-of-use asset and lease liability for operating leases willincrease total assets and total liabilities 2% and 4% respectively, when considering the balances of total assetsand total liabilities as of December 31, 2018. During 2018, the Company entered into a lease for a new corporateheadquarters in Princeton, NJ which will commence during the second quarter of 2019. The estimated impactabove excludes the impact of this lease. The Company will make cumulative total payments of approximately$67.0 million over the term of the lease.
In July 2018, the FASB issued ASU Number 2018-11, Leases (Topic 842): Targeted Improvements. Thisupdate provides entities with an additional and optional transition method to adopt ASU Number 2016-02 with acumulative-effect adjustment in the period of adoption. This update also provides guidance for a practicalexpedient that permits lessors to not separate non-lease components from the associated lease components.Additionally, in July 2018, the FASB issued ASU Number 2018-10, Codification Improvements to Topic 842,Leases. This update provides additional guidance on the new lease model with improvements in numerousaspects of the guidance in ASC 842 including, but not limited to, implicit rates, reassessment of leaseclassification, terms and purchase options, investment tax credits, and various other transition guidance. TheCompany will adopt this ASU concurrently with ASU Number 2016-02.
In August 2018, the FASB issued ASU 2018-14, Compensation-Retirement Benefits-Defined Benefit Plans-General (Subtopic 715-20). The new guidance modifies the disclosure requirements for employers that sponsordefined benefit pension or other postretirement plans, including removing certain previous disclosurerequirements, adding certain new disclosure requirements, and clarifying certain other disclosure requirements.The ASU will be effective for fiscal years beginning after December 15, 2020, including interim periods withinthose fiscal years. Early adoption is permitted. The Company plans to early adopt ASU 2018-14 on January 1,2019. The adoption of this ASU is not expected to have a material impact on the consolidated financialstatements.
In October 2018, the FASB issued ASU 2018-16, Derivatives and Hedging (Topic 815): Inclusion of theSecured Overnight Financing Rate (SOFR) Overnight Index Swap (OIS) Rate as Benchmark Interest Rate forHedge Accounting Purposes. This ASU permits use of the OIS rate based on the SOFR as a U.S. benchmarkinterest rate for hedge accounting purposes. This ASU is effective for fiscal years beginning after December 15,2018 (fiscal 2020), and interim periods within those fiscal years, with early adoption permitted. The newguidance must be applied on a prospective basis. The Company plans to early adopt ASU 2018-16 on January 1,2019. The adoption of this ASU is not expected to have a material impact on the consolidated financialstatements.
F-18
INTEGRA LIFESCIENCES HOLDINGS CORPORATION
NOTES TO CONSOLIDATED FINANCIAL STATEMENTS (continued)
There are no other recently issued accounting pronouncements that are expected to have a material effect onthe Company’s financial position, results of operations or cash flows.
SUPPLEMENTAL CASH FLOW INFORMATION
Cash paid for interest during the years ended December 31, 2018, 2017 and 2016 was $58.3 million (net of$2.3 million that was capitalized into construction in progress), $32.3 million (net of $1.1 million that wascapitalized into construction in progress) and $57.2 million (net of $1.0 million that was capitalized intoconstruction in progress), respectively. Cash paid for interest during the year ended December 31, 2016 includesa $42.8 million payment of accreted interest associated with convertible notes issued in 2016.
In December 2016, the Company settled convertible notes issued in 2011 and issued 2.9 million shares ofcommon stock with a fair value of $122.0 million. The Company also received 2.9 million shares of commonstock from the exercise of call options with hedge participants with fair value of $123.1 million at the date of theexercise which was held as treasury stock as of December 31, 2016.
For the year ended December 31, 2017, the Company issued 2.8 million shares of common stock due to theexercise of 8.7 million warrants associated with convertible notes issued in 2011.
Cash paid for income taxes, net of refunds, for the years ended December 31, 2018, 2017 and 2016 was$10.4 million, $14.6 million and $4.3 million, respectively.
Property and equipment purchases included in liabilities at December 31, 2018, 2017 and 2016 were$5.4 million, $7.8 million and $4.7 million, respectively.
3. REVENUES FROM CONTRACTS WITH CUSTOMERS
Summary of Accounting Policies on Revenue Recognition
Revenue is recognized upon the transfer of control of promised products or services to the customers in anamount that reflects the consideration the Company expects to receive in exchange for those products andservices.
Total revenue, net, includes product sales, product royalties and other revenues, such as fees received fromservices.
For products shipped with FOB shipping point terms, the control of the product passes to the customer at thetime of shipment. For shipments in which the control of the product is transferred when the customer receives theproduct, the Company recognizes revenue upon receipt by the customer. Certain products that the Companyproduces for private label customers have no alternative use and the Company has a right of payment forperformance to date. Revenues from those products are recognized over the period that the Companymanufactures these products, which is approximately one to three months. The Company uses the input methodto measure the manufacturing activities completed to date, which depicts the progress of the Company’sperformance obligation of transferring control of goods being manufactured for private label customers.
A portion of the Company’s product revenue is generated from consigned inventory maintained at hospitalsand distributors, and also from inventory physically held by field sales representatives. For these types ofproducts sales, the Company retains control until the product has been used or implanted, at which time revenueis recognized.
Revenues from sale of products and services are evidenced by either a contract with the customer or a validpurchase order and an invoice which includes all relevant terms of sale. For product sales, invoices are generallyissued upon the transfer of control (or upon the completion of the manufacturing in the case of the private labeltransactions recognized over time) and are typically payable 30 days after the invoice date. The Company
F-19
INTEGRA LIFESCIENCES HOLDINGS CORPORATION
NOTES TO CONSOLIDATED FINANCIAL STATEMENTS (continued)
performs a review of each specific customer’s creditworthiness and ability to pay prior to acceptance as acustomer. Further, the Company performs periodic reviews of its customers’ creditworthiness prospectively.
Performance Obligations
The Company’s performance obligations consist mainly of transferring control of goods and servicesidentified in the contracts, purchase orders, or invoices. The Company has no significant multi-element contractswith customers.
Significant Judgments
Usage-based royalties and licenses are estimated based on the provisions of contracts with customers andrecognized in the same period that the royalty-based products are sold by the Company’s strategic partners. TheCompany estimates and recognizes royalty revenue based upon communication with licensees, historicalinformation, and expected sales trends. Differences between actual reported licensee sales and those that wereestimated are adjusted in the period in which they become known, which is typically the following quarter.Historically, such adjustments have not been significant.
The Company estimates returns, price concessions, and discount allowances using the expected valuemethod based on historical trends and other known factors. Rebate allowances are estimated using the mostlikely method based on each customer contract.
The Company’s return policy, as set forth in its product catalogs and sales invoices, requires the Companyto review and authorize the return of a product in advance. Upon the authorization, a credit will be issued for thegoods returned within a set amount of days from the shipment, which is generally ninety days.
The Company disregards the effects of a financing component if the Company expects, at contractinception, that the period between the transfer and customer payment for the good or services will be one year orless. The Company has no significant revenues recognized on payments expected to be received more thanone year after the transfer of control of products or services to customers.
Contract Asset and Liability
Revenues recognized from the Company’s private label business that are not invoiced to the customers as aresult of recognizing revenue over time are recorded as a contract asset included in the prepaid expenses andother current assets account in the consolidated balance sheet.
Other operating revenues may include fees received under service agreements. Non-refundable fees receivedunder multiple-period service agreements are recognized as revenue as the Company satisfies the performanceobligations to the other party. A portion of the transaction price allocated to the performance obligations to besatisfied in the future periods is recognized as contract liability.
F-20
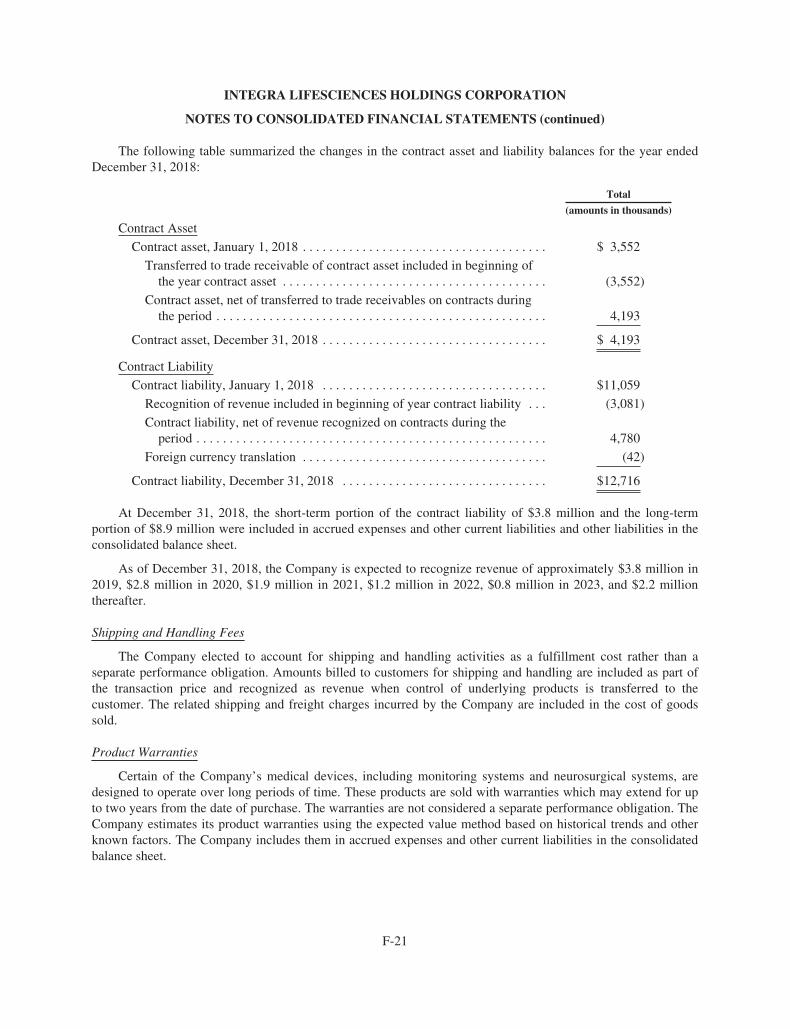
INTEGRA LIFESCIENCES HOLDINGS CORPORATION
NOTES TO CONSOLIDATED FINANCIAL STATEMENTS (continued)
The following table summarized the changes in the contract asset and liability balances for the year endedDecember 31, 2018:
Total
(amounts in thousands)
Contract Asset
Contract asset, January 1, 2018 . . . . . . . . . . . . . . . . . . . . . . . . . . . . . . . . . . . . . $ 3,552
Transferred to trade receivable of contract asset included in beginning ofthe year contract asset . . . . . . . . . . . . . . . . . . . . . . . . . . . . . . . . . . . . . . . . (3,552)
Contract asset, net of transferred to trade receivables on contracts duringthe period . . . . . . . . . . . . . . . . . . . . . . . . . . . . . . . . . . . . . . . . . . . . . . . . . . 4,193
Contract asset, December 31, 2018 . . . . . . . . . . . . . . . . . . . . . . . . . . . . . . . . . . $ 4,193
Contract Liability
Contract liability, January 1, 2018 . . . . . . . . . . . . . . . . . . . . . . . . . . . . . . . . . . $11,059
Recognition of revenue included in beginning of year contract liability . . . (3,081)
Contract liability, net of revenue recognized on contracts during theperiod . . . . . . . . . . . . . . . . . . . . . . . . . . . . . . . . . . . . . . . . . . . . . . . . . . . . . 4,780
Foreign currency translation . . . . . . . . . . . . . . . . . . . . . . . . . . . . . . . . . . . . . (42)
Contract liability, December 31, 2018 . . . . . . . . . . . . . . . . . . . . . . . . . . . . . . . $12,716
At December 31, 2018, the short-term portion of the contract liability of $3.8 million and the long-termportion of $8.9 million were included in accrued expenses and other current liabilities and other liabilities in theconsolidated balance sheet.
As of December 31, 2018, the Company is expected to recognize revenue of approximately $3.8 million in2019, $2.8 million in 2020, $1.9 million in 2021, $1.2 million in 2022, $0.8 million in 2023, and $2.2 millionthereafter.
Shipping and Handling Fees
The Company elected to account for shipping and handling activities as a fulfillment cost rather than aseparate performance obligation. Amounts billed to customers for shipping and handling are included as part ofthe transaction price and recognized as revenue when control of underlying products is transferred to thecustomer. The related shipping and freight charges incurred by the Company are included in the cost of goodssold.
Product Warranties
Certain of the Company’s medical devices, including monitoring systems and neurosurgical systems, aredesigned to operate over long periods of time. These products are sold with warranties which may extend for upto two years from the date of purchase. The warranties are not considered a separate performance obligation. TheCompany estimates its product warranties using the expected value method based on historical trends and otherknown factors. The Company includes them in accrued expenses and other current liabilities in the consolidatedbalance sheet.
F-21
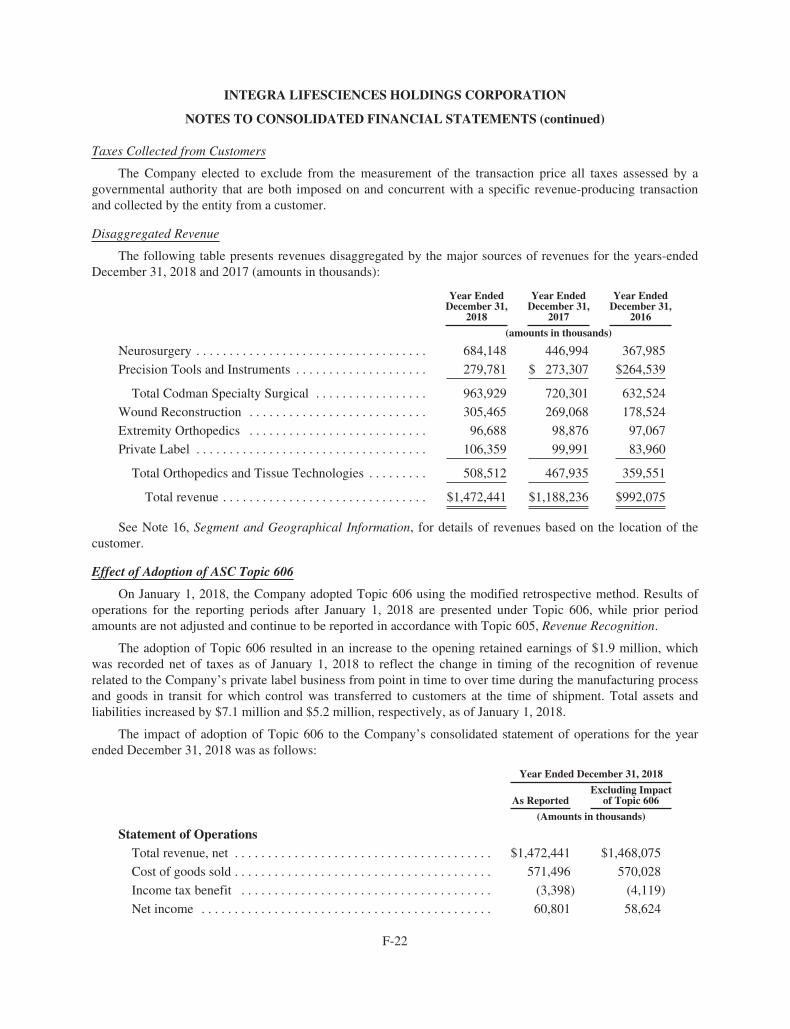
INTEGRA LIFESCIENCES HOLDINGS CORPORATION
NOTES TO CONSOLIDATED FINANCIAL STATEMENTS (continued)
Taxes Collected from Customers
The Company elected to exclude from the measurement of the transaction price all taxes assessed by agovernmental authority that are both imposed on and concurrent with a specific revenue-producing transactionand collected by the entity from a customer.
Disaggregated Revenue
The following table presents revenues disaggregated by the major sources of revenues for the years-endedDecember 31, 2018 and 2017 (amounts in thousands):
Year EndedDecember 31,
2018
Year EndedDecember 31,
2017
Year EndedDecember 31,
2016
(amounts in thousands)
Neurosurgery . . . . . . . . . . . . . . . . . . . . . . . . . . . . . . . . . . . 684,148 446,994 367,985
Precision Tools and Instruments . . . . . . . . . . . . . . . . . . . . 279,781 $ 273,307 $264,539
Total Codman Specialty Surgical . . . . . . . . . . . . . . . . . 963,929 720,301 632,524
Wound Reconstruction . . . . . . . . . . . . . . . . . . . . . . . . . . . 305,465 269,068 178,524
Extremity Orthopedics . . . . . . . . . . . . . . . . . . . . . . . . . . . 96,688 98,876 97,067
Private Label . . . . . . . . . . . . . . . . . . . . . . . . . . . . . . . . . . . 106,359 99,991 83,960
Total Orthopedics and Tissue Technologies . . . . . . . . . 508,512 467,935 359,551
Total revenue . . . . . . . . . . . . . . . . . . . . . . . . . . . . . . . $1,472,441 $1,188,236 $992,075
See Note 16, Segment and Geographical Information, for details of revenues based on the location of thecustomer.
Effect of Adoption of ASC Topic 606
On January 1, 2018, the Company adopted Topic 606 using the modified retrospective method. Results ofoperations for the reporting periods after January 1, 2018 are presented under Topic 606, while prior periodamounts are not adjusted and continue to be reported in accordance with Topic 605, Revenue Recognition.
The adoption of Topic 606 resulted in an increase to the opening retained earnings of $1.9 million, whichwas recorded net of taxes as of January 1, 2018 to reflect the change in timing of the recognition of revenuerelated to the Company’s private label business from point in time to over time during the manufacturing processand goods in transit for which control was transferred to customers at the time of shipment. Total assets andliabilities increased by $7.1 million and $5.2 million, respectively, as of January 1, 2018.
The impact of adoption of Topic 606 to the Company’s consolidated statement of operations for the yearended December 31, 2018 was as follows:
Year Ended December 31, 2018
As ReportedExcluding Impact
of Topic 606
(Amounts in thousands)
Statement of OperationsTotal revenue, net . . . . . . . . . . . . . . . . . . . . . . . . . . . . . . . . . . . . . . . $1,472,441 $1,468,075
Cost of goods sold . . . . . . . . . . . . . . . . . . . . . . . . . . . . . . . . . . . . . . . 571,496 570,028
Income tax benefit . . . . . . . . . . . . . . . . . . . . . . . . . . . . . . . . . . . . . . (3,398) (4,119)
Net income . . . . . . . . . . . . . . . . . . . . . . . . . . . . . . . . . . . . . . . . . . . . 60,801 58,624
F-22
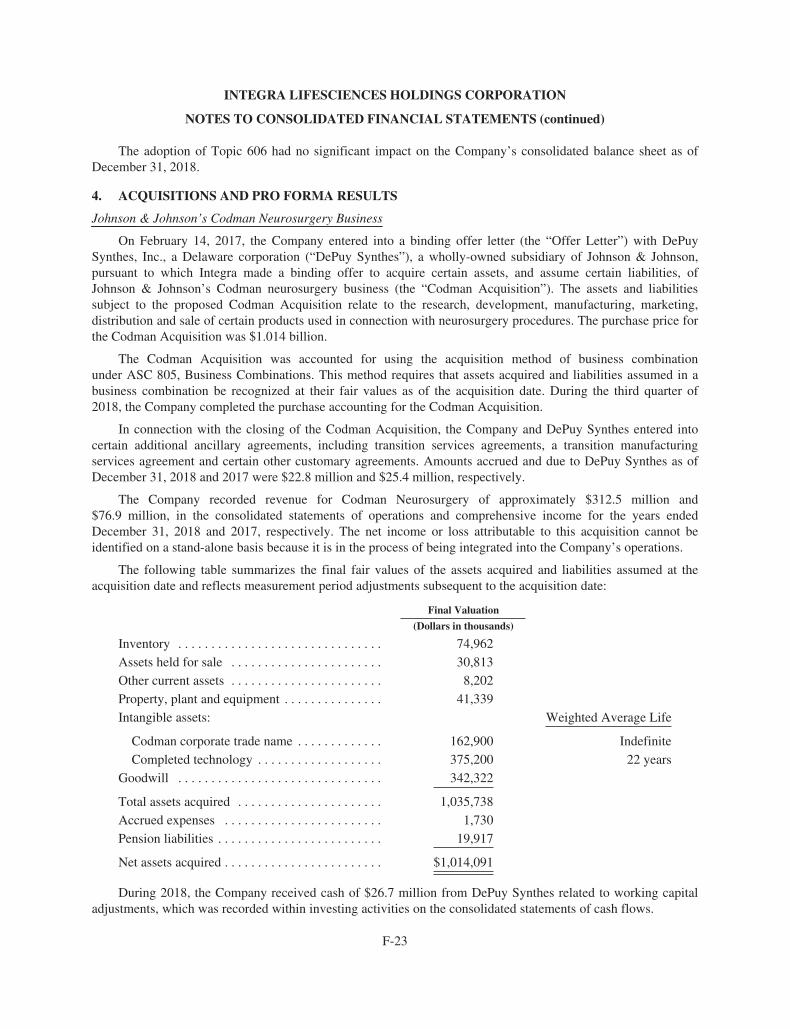
F-23
INTEGRA LIFESCIENCES HOLDINGS CORPORATION
NOTES TO CONSOLIDATED FINANCIAL STATEMENTS (continued)
The adoption of Topic 606 had no significant impact on the Company’s consolidated balance sheet as ofDecember 31, 2018.
4. ACQUISITIONS AND PRO FORMA RESULTS
Johnson & Johnson’s Codman Neurosurgery Business
On February 14, 2017, the Company entered into a binding offer letter (the “Offer Letter”) with DePuySynthes, Inc., a Delaware corporation (“DePuy Synthes”), a wholly-owned subsidiary of Johnson & Johnson,pursuant to which Integra made a binding offer to acquire certain assets, and assume certain liabilities, ofJohnson & Johnson’s Codman neurosurgery business (the “Codman Acquisition”). The assets and liabilitiessubject to the proposed Codman Acquisition relate to the research, development, manufacturing, marketing,distribution and sale of certain products used in connection with neurosurgery procedures. The purchase price forthe Codman Acquisition was $1.014 billion.
The Codman Acquisition was accounted for using the acquisition method of business combinationunder ASC 805, Business Combinations. This method requires that assets acquired and liabilities assumed in abusiness combination be recognized at their fair values as of the acquisition date. During the third quarter of2018, the Company completed the purchase accounting for the Codman Acquisition.
In connection with the closing of the Codman Acquisition, the Company and DePuy Synthes entered intocertain additional ancillary agreements, including transition services agreements, a transition manufacturingservices agreement and certain other customary agreements. Amounts accrued and due to DePuy Synthes as ofDecember 31, 2018 and 2017 were $22.8 million and $25.4 million, respectively.
The Company recorded revenue for Codman Neurosurgery of approximately $312.5 million and$76.9 million, in the consolidated statements of operations and comprehensive income for the years endedDecember 31, 2018 and 2017, respectively. The net income or loss attributable to this acquisition cannot beidentified on a stand-alone basis because it is in the process of being integrated into the Company’s operations.
The following table summarizes the final fair values of the assets acquired and liabilities assumed at theacquisition date and reflects measurement period adjustments subsequent to the acquisition date:
Final Valuation
(Dollars in thousands)
Inventory . . . . . . . . . . . . . . . . . . . . . . . . . . . . . . . 74,962Assets held for sale . . . . . . . . . . . . . . . . . . . . . . . 30,813Other current assets . . . . . . . . . . . . . . . . . . . . . . . 8,202Property, plant and equipment . . . . . . . . . . . . . . . 41,339Intangible assets: Weighted Average Life
Codman corporate trade name . . . . . . . . . . . . . 162,900 IndefiniteCompleted technology . . . . . . . . . . . . . . . . . . . 375,200 22 years
Goodwill . . . . . . . . . . . . . . . . . . . . . . . . . . . . . . . 342,322
Total assets acquired . . . . . . . . . . . . . . . . . . . . . . 1,035,738Accrued expenses . . . . . . . . . . . . . . . . . . . . . . . . 1,730Pension liabilities . . . . . . . . . . . . . . . . . . . . . . . . . 19,917
Net assets acquired . . . . . . . . . . . . . . . . . . . . . . . . $1,014,091
During 2018, the Company received cash of $26.7 million from DePuy Synthes related to working capitaladjustments, which was recorded within investing activities on the consolidated statements of cash flows.
F-24
INTEGRA LIFESCIENCES HOLDINGS CORPORATION
NOTES TO CONSOLIDATED FINANCIAL STATEMENTS (continued)
The Company recorded measurement period adjustments to goodwill totaling $4.0 million. During the firsthalf of 2018, the Company adjusted goodwill by $3.2 million because of working capital adjustmentsof $6.2 million that were offset by inventory adjustments of $3.0 million. During the third quarter 2018, theCompany adjusted goodwill by $0.8 million after finalizing the valuation step up of property, plant andequipment of $5.5 million. The adjustment for property, plant and equipment was offset by completedtechnology intangible asset adjustments of $4.7 million.
During the first three quarters of 2018, the Company paid $15.9 million for inventory that was included inthe initial purchase accounting. The payment was included within financing activities on the consolidatedstatements of cash flows.
The Company recorded $17.3 million in cost of goods sold related to fair value inventory purchaseaccounting adjustments for the year ended December 31, 2018.
Goodwill was allocated to the Codman Specialty Surgical segment. Goodwill is the excess of theconsideration transferred over the net assets recognized and represents the expected revenue and cost synergiesof the combined company and assembled workforce. Goodwill recognized as a result of the acquisition isgenerally deductible for income tax purposes.
In the fourth quarter of 2017, the Company wrote-off construction in progress of $6.3 million related to aproject acquired from Codman Neurosurgery that the Company decided to discontinue after the CodmanAcquisition.
Divestiture to Natus
On September 8, 2017, to facilitate the acquisition of the Codman Neurosurgery Business, the Company andcertain of its subsidiaries entered into an asset purchase agreement (the “Divestiture Agreement”) with NatusMedical Incorporated (“Natus”), pursuant to which the Company agreed to divest its Camino® IntracranialPressure monitoring and the U.S. rights to its fixed pressure shunts businesses within its Codman SpecialtySurgical segment together with certain neurosurgery assets acquired as part of the Codman Acquisition, whichincludes Codman U.S. dural graft implant, external ventricular drainage catheter and cerebrospinal fluidcollection systems businesses (the “Divestiture”). The Divestiture Agreement was entered into in connection withthe review of the Codman Acquisition by the Federal Trade Commission and the antitrust authority of Spain.
On October 6, 2017, upon the terms and subject to the conditions of the Divestiture Agreement, theDivestiture was completed and Natus paid an aggregate purchase price of $46.4 million.
Assets and liabilities divested consisted of the following as of October 6, 2017 (amounts in thousands):
Inventories . . . . . . . . . . . . . . . . . . . . . . . . . . . . . . . . . . . . . . . . . . . . . . . . . . . . . . . . . . . . . . . . $ 8,348
Prepaid expenses and other current assets . . . . . . . . . . . . . . . . . . . . . . . . . . . . . . . . . . . . . . . . 36
Assets held for sale . . . . . . . . . . . . . . . . . . . . . . . . . . . . . . . . . . . . . . . . . . . . . . . . . . . . . . . . . . 30,813
Property, plant and equipment, net . . . . . . . . . . . . . . . . . . . . . . . . . . . . . . . . . . . . . . . . . . . . . 1,122
Goodwill . . . . . . . . . . . . . . . . . . . . . . . . . . . . . . . . . . . . . . . . . . . . . . . . . . . . . . . . . . . . . . . . . . 2,861
Total assets divested . . . . . . . . . . . . . . . . . . . . . . . . . . . . . . . . . . . . . . . . . . . . . . . . . . . . . . . $43,180
Deferred revenue . . . . . . . . . . . . . . . . . . . . . . . . . . . . . . . . . . . . . . . . . . . . . . . . . . . . . . . . . . . $ 1,082
Accrued compensation . . . . . . . . . . . . . . . . . . . . . . . . . . . . . . . . . . . . . . . . . . . . . . . . . . . . . . . 209
Total liabilities divested . . . . . . . . . . . . . . . . . . . . . . . . . . . . . . . . . . . . . . . . . . . . . . . . . . . . $ 1,291
F-25
INTEGRA LIFESCIENCES HOLDINGS CORPORATION
NOTES TO CONSOLIDATED FINANCIAL STATEMENTS (continued)
Assets held for sale includes assets and liabilities related to U.S. dural graft implant, external ventriculardrainage catheters and cerebrospinal fluid collection systems businesses acquired as part of acquisition ofCodman Neurosurgery.
The transitional supply agreement with Natus requires the Company to provide to Natus certain assetsdefined in the transitional supply agreement upon termination. The Company recognized a liability of$1.3 million, included in other liabilities in consolidated balance sheet, related to estimated cost of assets to beprovided to Natus upon termination of transitional supply agreement.
The Divestiture does not represent a strategic shift that will have a major effect on the Company’soperations and financial statements. Goodwill was allocated to the assets and liabilities divested using the relativefair value method. The Company recognized a gain on sale of business of $2.6 million included in other income,net in its consolidated statement of operations for the year ended December 31, 2017.
Derma Sciences
On February 24, 2017, the Company executed the Agreement and Plan of Merger (the “MergerAgreement”) under which the Company acquired all of the outstanding shares of Derma Sciences, Inc., aDelaware corporation (“Derma Sciences”) for an aggregate purchase price of approximately $210.8 million,including payment of certain of Derma Sciences’ closing expenses and settlement of stock-based compensationplans of $4.8 million and $4.3 million, respectively. The purchase price consisted of a cash payment to theformer shareholders of Derma Sciences of approximately $201.7 million upon the closing of the transaction.
Derma Sciences is a tissue regeneration company focused on advanced wound and burn care that offersproducts to help manage chronic and hard-to-heal wounds, especially those resulting from diabetes and poorvascular functioning.
The revenue and net income or loss attributable to this acquisition cannot be identified on a stand-alonebasis because it has been integrated into the Company’s operations.
The Derma Sciences acquisition was accounted for using the acquisition method of business combinationunder ASC 805, Business Combinations. This method requires that assets acquired and liabilities assumed in abusiness combination be recognized at their fair values as of the acquisition date.
INTEGRA LIFESCIENCES HOLDINGS CORPORATION
NOTES TO CONSOLIDATED FINANCIAL STATEMENTS (continued)
The following table summarizes the final fair values of the assets acquired and liabilities assumed at theacquisition date and reflects purchase accounting adjustments subsequent to the acquisition date:
Final Valuation
(Dollars in thousands)
Cash and cash equivalents . . . . . . . . . . . . . . . . . . . . . . $ 16,512
Short-term investments . . . . . . . . . . . . . . . . . . . . . . . . 19,238
Accounts receivable . . . . . . . . . . . . . . . . . . . . . . . . . . 8,949
Inventory . . . . . . . . . . . . . . . . . . . . . . . . . . . . . . . . . . . 17,977
Prepaid expenses and other current assets . . . . . . . . . 4,369
Property, plant and equipment . . . . . . . . . . . . . . . . . . 4,311
Intangible assets: Weighted Average Life
Customer relationship . . . . . . . . . . . . . . . . . . . . . . . 78,300 14 years
Trademarks/brand names . . . . . . . . . . . . . . . . . . . . 13,500 15 years
Completed technology . . . . . . . . . . . . . . . . . . . . . . . 11,600 14 years
Non-compete agreement . . . . . . . . . . . . . . . . . . . . . 280 1 year
Goodwill . . . . . . . . . . . . . . . . . . . . . . . . . . . . . . . . . . . 73,765
Deferred tax assets . . . . . . . . . . . . . . . . . . . . . . . . . . . 14,524
Other assets . . . . . . . . . . . . . . . . . . . . . . . . . . . . . . . . . 101
Total assets acquired . . . . . . . . . . . . . . . . . . . . . . . . 263,426
Accounts payable . . . . . . . . . . . . . . . . . . . . . . . . . . . . 4,560
Accrued expenses and other current liabilities . . . . . . 7,409
Contingent liability . . . . . . . . . . . . . . . . . . . . . . . . . . . 37,174
Other liabilities . . . . . . . . . . . . . . . . . . . . . . . . . . . . . . 3,805
Net assets acquired . . . . . . . . . . . . . . . . . . . . . . . . . . . $210,478
Goodwill related to the Derma Sciences acquisition was allocated to the Orthopedics and TissueTechnologies segment. Goodwill is the excess of the consideration transferred over the net assets recognized andrepresents the expected revenue and cost synergies of the combined company and assembled workforce.Goodwill recognized as a result of this acquisition is not deductible for income tax purposes. During the firstquarter of 2018, the Company completed its purchase accounting of Derma Sciences.
Short-term Investments
Short-term investments recognized at the acquisition date of Derma Sciences are investments in equity anddebt securities including certificates of deposit purchased with an original maturity greater than three monthswhich are deposited in various U.S. financial institutions and are fully insured by the Federal Deposit InsuranceCorporation. The Company considers securities with original maturities of greater than 90 days to be availablefor sale securities. Securities under this classification are recorded at fair value and unrealized gains and lossesare recorded within accumulated other comprehensive income. The estimated fair value of the available for salesecurities is determined based on quoted market prices. The Company evaluates securities with unrealized lossesto determine whether such losses, if any, are other than temporary. Short-term investments are classified asLevel 1 in fair value hierarchy. Fair values of short-term investments are determined using the unadjusted quotedprices in active markets for identical assets or liabilities that the Company has the ability to access at the balancesheet date.
F-26
INTEGRA LIFESCIENCES HOLDINGS CORPORATION
NOTES TO CONSOLIDATED FINANCIAL STATEMENTS (continued)
In the second quarter of 2017, the Company sold the acquired short-term investments and recognized arealized loss of $2.3 million included in other income, net in the consolidated statement of operations.
Deferred Taxes
The acquired deferred taxes of $14.5 million include a deferred tax asset of $39.7 million related to a federalnet operating loss which the Company expects to utilize against income in future periods and a deferred tax assetof $16.4 million related to intangibles acquired by Derma Sciences in previous periods, offset by a deferred taxliability of $41.1 million for new intangibles for which the Company will not receive a tax benefit and deferredtax liability $0.5 million related to various deferred items. In the second quarter of 2017, the Company decreasedthe preliminary estimated value of the net deferred tax assets by $1.5 million to reflect adjustments topreliminary estimated fair values of assets and liabilities acquired. In fourth quarter of 2017, the Companydecreased the preliminary value of the deferred tax asset by $3.3 million to reflect returns filed for periods priorto the acquisition date and adjustments for expected effective state tax rates.
United States Food and Drug Administration (“FDA”) Untitled Letter
On June 22, 2015, the FDA issued an Untitled Letter (the “Untitled Letter”) alleging that BioD morselizedamniotic membrane based products do not meet the criteria for regulation as human cellular tissue-basedproducts (“HCT/Ps”) solely under Section 361 of the Public Health Service Act and that, as a result, BioD wouldneed a biologics license to lawfully market those morselized products. Since the issuance of the Untitled Letter,BioD and more recently, the Company have been in discussion with the FDA to communicate its disagreementwith the FDA’s assertion that certain products are more than minimally manipulated. The FDA has not changedits position that certain of the BioD acquired products are not eligible for marketing solely under Section 361.
In November 2017, the FDA issued the final guidance document related to human tissue titled, “RegulatoryConsiderations for Human Cells, Tissues, and Cellular and Tissue-Based Products: Minimal Manipulation andHomologous Use” (the “HCT/P Final Guidance”). The HCT/P Final Guidance maintains the FDA’s position thatproducts such as the Company’s morselized amniotic membrane tissue-based products do not meet the criteriafor regulation solely as HCT/Ps. In addition, the FDA articulated a risk-based approach to enforcement and,while some uses for amniotic membrane tissue-based products would enjoy as much as thirty-six months ofenforcement discretion, other high risk uses could be subject to immediate enforcement action. The Companydoes not believe the uses for its amniotic membrane tissue-based products fall into the high-risk category. As ofFebruary 26, 2019, the Company has not received any further notice of enforcement action from the FDAregarding its morselized amniotic tissue-based products. Nonetheless, the Company can make no assurances thatthe FDA will continue to exercise its enforcement discretion with respect to the Company’s amniotic membranetissue-based products, and any potential action of the FDA could have a financial impact regarding the sales ofsuch products. The Company has been evaluating and is considering regulatory approval pathways for itsmorselized amniotic membrane tissue-based products.
Revenues from BioD morselized amniotic material-based products for the year ended December 31, 2018were less than 1.0% of consolidated revenues.
Contingent Consideration
The Company assumed contingent consideration incurred by Derma Sciences related to its acquisitions ofBioD and the intellectual property related to the Medihoney product. The Company accounted for the contingentliabilities by recording their fair value on the date of the acquisition based on a discounted cash-flow model. Thecontingent liabilities recognized as part of the Derma Sciences acquisition relate to the following:
i. contractual incentive payments that could be made to former equity owners of BioD if net sales ofBioD products exceed a certain amount for the twelve-month periods ending June 30, 2017 and 2018(“BioD Earnout Payments”);
F-27
INTEGRA LIFESCIENCES HOLDINGS CORPORATION
NOTES TO CONSOLIDATED FINANCIAL STATEMENTS (continued)
ii. a contractual incentive payment that could be made to the former equity owners if there has been nospecific enforcement action or notice by the FDA against the specific BioD products as a result of theUntitled Letter for a certain period after closing as defined by the agreement (“Product Payment”); and
iii. contractual incentive payments that could be made to the former owner of the intellectual propertyrelating to the Medihoney product line, if net sales of Medihoney products exceed certain amountsdefined in the agreement between Derma Sciences and the former owner of the intellectual property ofMedihoney for any twelve-month period (“Medihoney Earnout Payments”).
At the date of the acquisition, net sales used in estimating the BioD Earnout Payments is based on theweighted average of different possible scenarios using revenue volatility of 13.5%. The BioD Earnout Paymentswere valued using a discount rate of 3.0%. The maximum payout related to the BioD Earnout Payments is$26.5 million. The estimated fair value as of February 24, 2017 was $9.1 million. In August 2017, the Companypaid $4.8 million for the twelve-month period ending June 30, 2017 component of the BioD Earnout Payments.The Company made no additional payments after the final earn out period ended on June 30, 2018. As ofDecember 31, 2017, the estimated fair value of the remaining portion of the BioD Earnout Payments was$0.3 million.
At the date of acquisition, the Company estimated that the probability of the Product Payment was 98.0%and valued it at a discount rate of 2.5%. The maximum payout related to the Product Payment is $29.7 million.The estimated fair value as of February 24, 2017 was $26.8 million. In the second quarter of 2017, the Companyadjusted the preliminary estimated fair value to increase the Product Payment by $0.9 million related toadditional products that should have been included in the preliminary estimate based on the Merger Agreement.On May 25, 2017, the Company made full payment for the Product Payment of $26.6 million. The payment wasincluded in cash used in business acquisition, net of cash acquired within investing activities in the condensedconsolidated statements of cash flows since the payment was made shortly after the acquisition.
At the date of the acquisition, net sales used in estimating the Medihoney Earnout Payments was based onthe weighted average of different possible scenarios using revenue volatility of 27.5%. The Medihoney EarnoutPayments were valued using a discount rate of 4.5%. The maximum payout related to the Medihoney EarnoutPayments is $5.0 million. During the second quarter of 2018, the Company paid $2.0 million for the MedihoneyEarnout Payment. The estimated fair value as of December 31, 2018 was $0.2 million. The estimated fair valueas of February 24, 2017 and December 31, 2017 was $1.4 million.
These fair value measurements were based on significant inputs not observed in the market and thusrepresented a Level 3 measurement. Contingent consideration is re-measured to fair value at each reporting dateuntil the contingency is resolved, and those changes in fair value are recognized in earnings. Depending on theexpected timing of the estimated payments, the acquisition date fair values and subsequent remeasurement couldbe different.
Pro Forma Results (unaudited)
The following unaudited pro forma financial information summarizes the results of operations for the yearsended December 31, 2017 and 2016 as if the acquisitions of Codman Neurosurgery, Derma Sciences anddivestiture to Natus, which were completed by the Company during 2017 had been completed as of the beginning2016. The pro forma results are based upon certain assumptions and estimates, and they give effect to actualoperating results prior to the acquisitions and adjustments to reflect (i) the change in interest expense,depreciation expense, intangible asset amortization and fair value inventory step-up, (ii) timing of recognition forcertain expenses that will not be recurring in the post-acquisition period, which includes $2.9 million incurred byDerma Sciences prior to acquisition and $24.9 million incurred by Integra, (iii) gain from the sale of business of$2.6 million related to the Divestiture to Natus, and (iv) income taxes at a rate consistent with the Company’s
F-28
INTEGRA LIFESCIENCES HOLDINGS CORPORATION
NOTES TO CONSOLIDATED FINANCIAL STATEMENTS (continued)
statutory rate at the date of the acquisitions. No effect has been given to other cost reductions or operatingsynergies. As a result, these pro forma results do not necessarily represent results that would have occurred if theacquisitions had taken place on the basis assumed above, nor are they indicative of the results of future combinedoperations.
Year Ended December 31,
2017 2016
(Pro forma)
(In thousands except per share amounts)
Total revenue from continuing operations . . . . . . . . . . . . . . . . . . $1,428,491 $1,446,903
Net income from continuing operations . . . . . . . . . . . . . . . . . . . $ 81,730 $ 27,520
Basic earnings per share from continuing operations . . . . . . . . . $ 1.06 $ 0.37
Consortium of Focused Orthopedists
On January 8, 2019, the Company announced that it had signed a license and development agreement withConsortium of Focused Orthopedists, LLC, for a short stem and stemless shoulder system. The Company isassessing the economics of the transaction and expects to complete the accounting for the transaction during thefirst quarter of 2019.
5. DEBT
Amended and Restated Senior Credit Agreement
On May 3, 2018, the Company entered into the fifth amendment and restatement (the “May 2018Amendment”) of its Senior Credit Facility (the “Senior Credit Facility”) with a syndicate of lending banks withBank of America, N.A., as Administrative Agent. The May 2018 Amendment extended the maturity date toMay 3, 2023 and decreased the applicable rate, as described below. The Company continues to have theaggregate principal amount of $2.2 billion available to it through the following facilities:
i. a $900.0 million Term Loan facility; and
ii. a $1.3 billion revolving credit facility, which includes a $60.0 million sublimit for the issuance ofstandby letters of credit and a $60.0 million sublimit for swingline loans.
In connection with the May 2018 Amendment, the Company’s maximum consolidated total leverage ratio inthe financial covenants (as defined in the Senior Credit Facility) was modified to the following:
Fiscal QuarterMaximum Consolidated Total
Leverage Ratio
Execution of May 2018 Amendment through March 31, 2019 . . . . . . . . . . . . . . . . . . . 5.50: 1.00
June 30, 2019 through March 31, 2020 . . . . . . . . . . . . . . . . . . . . . . . . . . . . . . . . . . . . . 5.00: 1.00
June 30, 2020 through March 31, 2021 . . . . . . . . . . . . . . . . . . . . . . . . . . . . . . . . . . . . . 4.50: 1.00
June 30, 2021 and thereafter . . . . . . . . . . . . . . . . . . . . . . . . . . . . . . . . . . . . . . . . . . . . . 4.00: 1.00
Borrowings under the Senior Credit Facility bear interest, at the Company’s option, at a rate equal to thefollowing:
i. the Eurodollar Rate (as defined in the amendment and restatement) in effect from time to time plus theapplicable rate (ranging from 1.00% to 1.75% ), or
ii. the highest of:
1. the weighted average overnight Federal funds rate, as published by the Federal Reserve Bank ofNew York, plus 0.50%, or plus the applicable rate (ranging from 0% to 0.75% ),
F-29
INTEGRA LIFESCIENCES HOLDINGS CORPORATION
NOTES TO CONSOLIDATED FINANCIAL STATEMENTS (continued)
2. the prime lending rate of Bank of America, N.A. plus the applicable rate (ranging from 0%to 0.75% ), and
3. the one-month Eurodollar Rate plus 1.00% plus the applicable rate (ranging from 0% to 0.75% ).
The applicable rates are based on the Company’s consolidated total leverage ratio (defined as the ratio of(a) consolidated funded indebtedness less cash that is not subject to any restriction on the use or investmentthereof to (b) consolidated EBITDA at the time of the applicable borrowing).
The Company will also pay an annual commitment fee (ranging from 0.15% to 0.35% ), based on theCompany’s consolidated total leverage ratio, on the amount available for borrowing under the revolving creditfacility.
At December 31, 2018 and 2017, there was $345.0 million and $655.0 million outstanding, respectively,under the revolving portion of the Senior Credit Facility at a weighted average interest rate of 4.0% and 3.7%,respectively. At December 31, 2018 and 2017, there was $900.0 million and $1.2 billion outstanding under theTerm Loan component of the Senior Credit Facility at a weighted average interest rate of 3.9% and 3.6%,respectively.
The Senior Credit Facility is collateralized by substantially all of the assets of the Company’s U.S.subsidiaries, excluding intangible assets. The Senior Credit Facility is subject to various financial and negativecovenants and at December 31, 2018 the Company was in compliance with all such covenants. The Companycapitalized $4.2 million and $19.1 million of incremental financing costs in 2018 and 2017, respectively, inconnection with the modifications of the Senior Credit Facility.
Contractual repayments of the Term Loan component of Senior Credit Facility are due as follows:
Year Ended December 31,Principal
Repayment
(In thousands)
2019 . . . . . . . . . . . . . . . . . . . . . . . . . . . . . . . . . . . . . . . . . . . . . . . . . . . . . . . . . . . . . . . . . . $ 22,500
2020 . . . . . . . . . . . . . . . . . . . . . . . . . . . . . . . . . . . . . . . . . . . . . . . . . . . . . . . . . . . . . . . . . . 45,000
2021 . . . . . . . . . . . . . . . . . . . . . . . . . . . . . . . . . . . . . . . . . . . . . . . . . . . . . . . . . . . . . . . . . . 56,250
2022 . . . . . . . . . . . . . . . . . . . . . . . . . . . . . . . . . . . . . . . . . . . . . . . . . . . . . . . . . . . . . . . . . . 67,500
2023 . . . . . . . . . . . . . . . . . . . . . . . . . . . . . . . . . . . . . . . . . . . . . . . . . . . . . . . . . . . . . . . . . . 708,750
$900,000
The outstanding balance of revolving credit component of the Senior Credit Facility is due on May 3, 2023.
Securitization Facility
During the fourth quarter of 2018, the Company entered into an accounts receivable securitization facility(the “Securitization Facility”) under which accounts receivable of certain domestic subsidiaries are sold on anon-recourse basis to a special purpose entity (“SPE”), which is a bankruptcy-remote, consolidated subsidiary ofthe Company. Accordingly, the assets of the SPE are not available to satisfy the obligations of the Company orany of its subsidiaries. From time to time, the SPE may finance such accounts receivable with a revolving loanfacility secured by a pledge of such accounts receivable. The amount of outstanding borrowings on theSecuritization Facility at any one time is limited to $150.0 million. The Securitization Facility agreement is foran initial three -year term and may be extended. The agreement governing the Securitization Facility containscertain covenants and termination events. An occurrence of an event of default or a termination event under thisSecuritization Facility may give rise to the right of its counterparty to terminate this facility. As of December 31,2018, the Company was in compliance with the covenants, and none of the termination events had occurred. As
F-30
INTEGRA LIFESCIENCES HOLDINGS CORPORATION
NOTES TO CONSOLIDATED FINANCIAL STATEMENTS (continued)
of December 31, 2018, the Company had $121.2 million of outstanding borrowings under its SecuritizationFacility at a weighted average interest rate of 3.4%.
The fair value of outstanding borrowings of the Senior Credit Facility’s revolving credit facility and TermLoan component at December 31, 2018 were approximately $322.2 million and $852.1 million, respectively. Thefair value of the outstanding borrowing of the Securitization facility at December 31, 2018 was approximately$116.4 million. These fair values were determined by using a discounted cash flow model based on currentmarket interest rates available to the Company. These inputs are corroborated by observable market data forsimilar liabilities and therefore classified within Level 2 of the fair value hierarchy. Level 2 inputs representinputs that are observable for the asset or liability, either directly or indirectly and are other than active marketobservable inputs that reflect unadjusted quoted prices for identical assets or liabilities.
Letters of credit outstanding as of December 31, 2018 and 2017 totaled $0.6 million, respectively. Therewere no amounts drawn as of December 31, 2018.
6. DERIVATIVE INSTRUMENTS
Interest Rate Hedging
The Company’s interest rate risk relates to U.S. dollar denominated variable interest rate borrowings. TheCompany uses interest rate swap derivative instruments to manage earnings and cash flow exposure resultingfrom changes in interest rates. These interest rate swaps apply a fixed interest rate on a portion of our expectedLIBOR-indexed floating-rate borrowings.
F-31
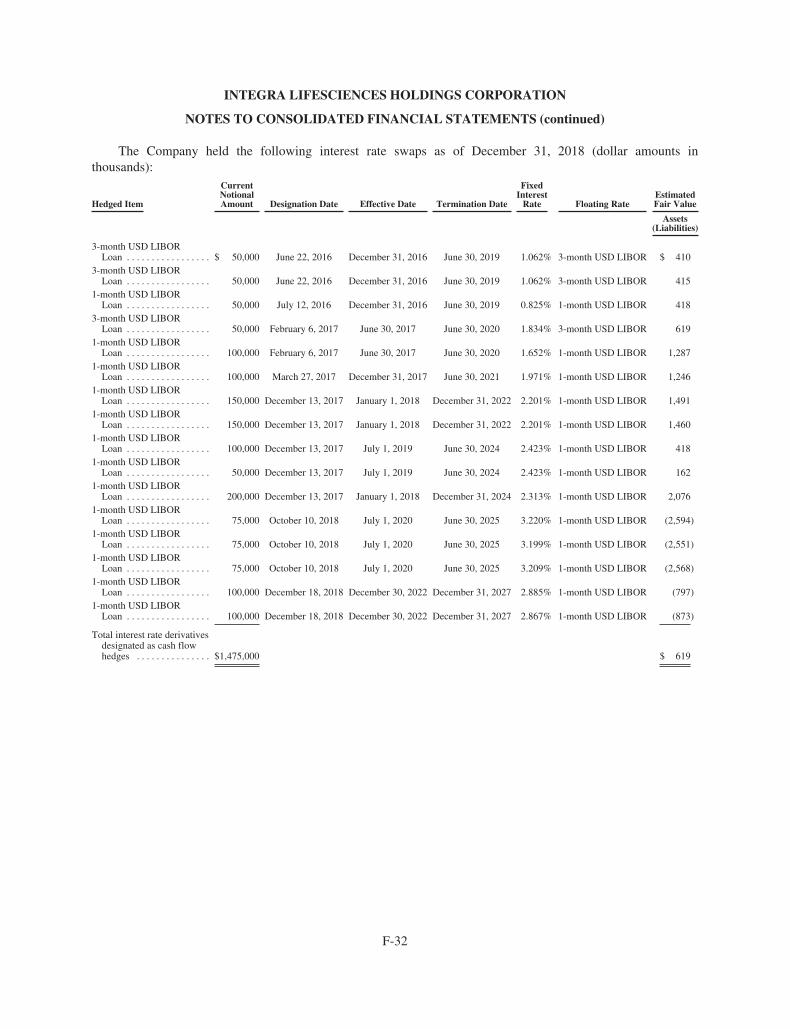
INTEGRA LIFESCIENCES HOLDINGS CORPORATION
NOTES TO CONSOLIDATED FINANCIAL STATEMENTS (continued)
The Company held the following interest rate swaps as of December 31, 2018 (dollar amounts inthousands):
Hedged Item
CurrentNotionalAmount Designation Date Effective Date Termination Date
FixedInterest
Rate Floating RateEstimatedFair Value
Assets(Liabilities)
3-month USD LIBORLoan . . . . . . . . . . . . . . . . . $ 50,000 June 22, 2016 December 31, 2016 June 30, 2019 1.062% 3-month USD LIBOR $ 410
3-month USD LIBORLoan . . . . . . . . . . . . . . . . . 50,000 June 22, 2016 December 31, 2016 June 30, 2019 1.062% 3-month USD LIBOR 415
1-month USD LIBORLoan . . . . . . . . . . . . . . . . . 50,000 July 12, 2016 December 31, 2016 June 30, 2019 0.825% 1-month USD LIBOR 418
3-month USD LIBORLoan . . . . . . . . . . . . . . . . . 50,000 February 6, 2017 June 30, 2017 June 30, 2020 1.834% 3-month USD LIBOR 619
1-month USD LIBORLoan . . . . . . . . . . . . . . . . . 100,000 February 6, 2017 June 30, 2017 June 30, 2020 1.652% 1-month USD LIBOR 1,287
1-month USD LIBORLoan . . . . . . . . . . . . . . . . . 100,000 March 27, 2017 December 31, 2017 June 30, 2021 1.971% 1-month USD LIBOR 1,246
1-month USD LIBORLoan . . . . . . . . . . . . . . . . . 150,000 December 13, 2017 January 1, 2018 December 31, 2022 2.201% 1-month USD LIBOR 1,491
1-month USD LIBORLoan . . . . . . . . . . . . . . . . . 150,000 December 13, 2017 January 1, 2018 December 31, 2022 2.201% 1-month USD LIBOR 1,460
1-month USD LIBORLoan . . . . . . . . . . . . . . . . . 100,000 December 13, 2017 July 1, 2019 June 30, 2024 2.423% 1-month USD LIBOR 418
1-month USD LIBORLoan . . . . . . . . . . . . . . . . . 50,000 December 13, 2017 July 1, 2019 June 30, 2024 2.423% 1-month USD LIBOR 162
1-month USD LIBORLoan . . . . . . . . . . . . . . . . . 200,000 December 13, 2017 January 1, 2018 December 31, 2024 2.313% 1-month USD LIBOR 2,076
1-month USD LIBORLoan . . . . . . . . . . . . . . . . . 75,000 October 10, 2018 July 1, 2020 June 30, 2025 3.220% 1-month USD LIBOR (2,594)
1-month USD LIBORLoan . . . . . . . . . . . . . . . . . 75,000 October 10, 2018 July 1, 2020 June 30, 2025 3.199% 1-month USD LIBOR (2,551)
1-month USD LIBORLoan . . . . . . . . . . . . . . . . . 75,000 October 10, 2018 July 1, 2020 June 30, 2025 3.209% 1-month USD LIBOR (2,568)
1-month USD LIBORLoan . . . . . . . . . . . . . . . . . 100,000 December 18, 2018 December 30, 2022 December 31, 2027 2.885% 1-month USD LIBOR (797)
1-month USD LIBORLoan . . . . . . . . . . . . . . . . . 100,000 December 18, 2018 December 30, 2022 December 31, 2027 2.867% 1-month USD LIBOR (873)
Total interest rate derivativesdesignated as cash flowhedges . . . . . . . . . . . . . . . $1,475,000 $ 619
F-32

INTEGRA LIFESCIENCES HOLDINGS CORPORATION
NOTES TO CONSOLIDATED FINANCIAL STATEMENTS (continued)
The Company held the following interest rate swaps as of December 31, 2017 (dollar amounts inthousands):
Hedged Item
CurrentNotionalAmount Designation Date Effective Date Termination Date
FixedInterest
Rate Floating RateEstimatedFair Value
Assets(Liabilities)
3-month USD LIBORLoan . . . . . . . . . . . . . . . . . $ 50,000 June 22, 2016 December 31, 2016 June 30, 2019 1.062% 3-month USD LIBOR $ 675
3-month USD LIBORLoan . . . . . . . . . . . . . . . . . 50,000 June 22, 2016 December 31, 2016 June 30, 2019 1.062% 3-month USD LIBOR 672
1-month USD LIBORLoan . . . . . . . . . . . . . . . . . 50,000 July 12, 2016 December 31, 2016 June 30, 2019 0.825% 1-month USD LIBOR 779
3-month USD LIBORLoan . . . . . . . . . . . . . . . . . 50,000 February 6, 2017 June 30, 2017 June 30, 2020 1.834% 3-month USD LIBOR 318
1-month USD LIBORLoan . . . . . . . . . . . . . . . . . 100,000 February 6, 2017 June 30, 2017 June 30, 2020 1.652% 1-month USD LIBOR 858
1-month USD LIBORLoan . . . . . . . . . . . . . . . . . 100,000 March 27, 2017 December 31, 2017 June 30, 2021 1.971% 1-month USD LIBOR 337
1-month USD LIBORLoan . . . . . . . . . . . . . . . . . 150,000 December 13, 2017 January 1, 2018 December 31, 2022 2.201% 1-month USD LIBOR (455)
1-month USD LIBORLoan . . . . . . . . . . . . . . . . . 150,000 December 13, 2017 January 1, 2018 December 31, 2022 2.201% 1-month USD LIBOR (434)
1-month USD LIBORLoan . . . . . . . . . . . . . . . . . 100,000 December 13, 2017 July 1, 2019 June 30, 2024 2.423% 1-month USD LIBOR (684)
1-month USD LIBORLoan . . . . . . . . . . . . . . . . . 50,000 December 13, 2017 July 1, 2019 June 30, 2024 2.423% 1-month USD LIBOR (255)
1-month USD LIBORLoan . . . . . . . . . . . . . . . . . 200,000 December 13, 2017 January 1, 2018 December 31, 2024 2.313% 1-month USD LIBOR (1,219)
Total interest rate derivativesdesignated as cash flowhedges . . . . . . . . . . . . . . . $1,050,000 $ 592
The Company designated these derivative instruments as cash flow hedges. Changes in the fair value of aderivative that is designated as a cash flow hedge and is highly effective are recorded in accumulated othercomprehensive income / (loss) until the underlying transaction affects earnings and are then reclassified toearnings in the same account as the hedged transaction. If the hedged cash flow does not occur, or if it becomesprobable that it will not occur, the Company will reclassify the amount of any gain or loss on the related cashflow hedge to interest expense at that time.
Foreign Currency Hedging
From time to time the Company enters into foreign currency hedge contracts intended to protect the U.S.dollar value of certain forecasted foreign currency denominated transactions. For contracts that are designated ashedging instruments, the Company assesses the effectiveness of the contracts. The change in fair value of foreigncurrency cash flow hedges are recorded in AOCI, net of tax, until the hedged item affects earnings. Once therelated hedged item affects earnings, the Company reclassifies amounts recorded in AOCI to earnings. If thehedged forecasted transaction does not occur, or if it becomes probable that it will not occur, the Company willreclassify the amount of any gain or loss on the related cash flow hedge to earnings at that time. For contracts notdesignated as hedging instruments, the change in fair value of the contracts are recognized in other income(expense), net in the consolidated statements of operation, along with the offsetting foreign currency gain or losson the underlying assets or liabilities.
The success of the Company’s hedging program depends, in part, on forecasts of certain activitydenominated in foreign currencies. The Company may experience unanticipated currency exchange gains orlosses to the extent that there are differences between forecasted and actual activity during periods of currency
F-33
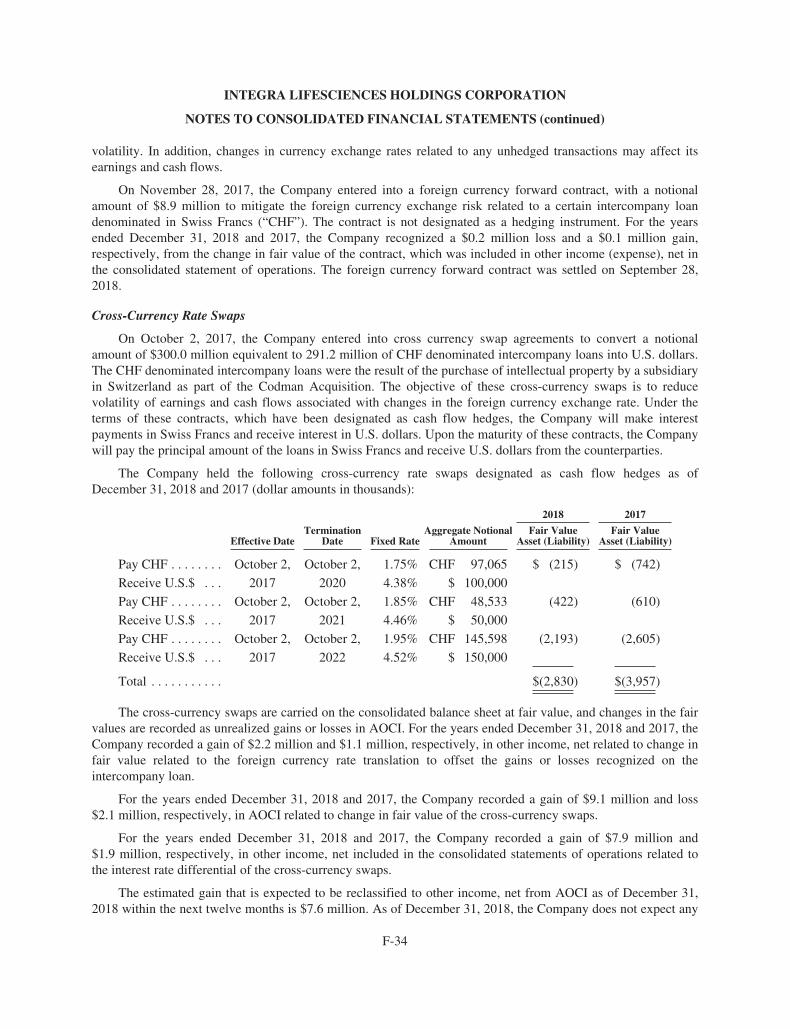
INTEGRA LIFESCIENCES HOLDINGS CORPORATION
NOTES TO CONSOLIDATED FINANCIAL STATEMENTS (continued)
volatility. In addition, changes in currency exchange rates related to any unhedged transactions may affect itsearnings and cash flows.
On November 28, 2017, the Company entered into a foreign currency forward contract, with a notionalamount of $8.9 million to mitigate the foreign currency exchange risk related to a certain intercompany loandenominated in Swiss Francs (“CHF”). The contract is not designated as a hedging instrument. For the yearsended December 31, 2018 and 2017, the Company recognized a $0.2 million loss and a $0.1 million gain,respectively, from the change in fair value of the contract, which was included in other income (expense), net inthe consolidated statement of operations. The foreign currency forward contract was settled on September 28,2018.
Cross-Currency Rate Swaps
On October 2, 2017, the Company entered into cross currency swap agreements to convert a notionalamount of $300.0 million equivalent to 291.2 million of CHF denominated intercompany loans into U.S. dollars.The CHF denominated intercompany loans were the result of the purchase of intellectual property by a subsidiaryin Switzerland as part of the Codman Acquisition. The objective of these cross-currency swaps is to reducevolatility of earnings and cash flows associated with changes in the foreign currency exchange rate. Under theterms of these contracts, which have been designated as cash flow hedges, the Company will make interestpayments in Swiss Francs and receive interest in U.S. dollars. Upon the maturity of these contracts, the Companywill pay the principal amount of the loans in Swiss Francs and receive U.S. dollars from the counterparties.
The Company held the following cross-currency rate swaps designated as cash flow hedges as ofDecember 31, 2018 and 2017 (dollar amounts in thousands):
2018 2017
Effective DateTermination
Date Fixed RateAggregate Notional
AmountFair Value
Asset (Liability)Fair Value
Asset (Liability)
Pay CHF . . . . . . . . October 2, October 2, 1.75% CHF 97,065 $ (215) $ (742)
Receive U.S.$ . . . 2017 2020 4.38% $ 100,000
Pay CHF . . . . . . . . October 2, October 2, 1.85% CHF 48,533 (422) (610)
Receive U.S.$ . . . 2017 2021 4.46% $ 50,000
Pay CHF . . . . . . . . October 2, October 2, 1.95% CHF 145,598 (2,193) (2,605)
Receive U.S.$ . . . 2017 2022 4.52% $ 150,000
Total . . . . . . . . . . . $(2,830) $(3,957)
The cross-currency swaps are carried on the consolidated balance sheet at fair value, and changes in the fairvalues are recorded as unrealized gains or losses in AOCI. For the years ended December 31, 2018 and 2017, theCompany recorded a gain of $2.2 million and $1.1 million, respectively, in other income, net related to change infair value related to the foreign currency rate translation to offset the gains or losses recognized on theintercompany loan.
For the years ended December 31, 2018 and 2017, the Company recorded a gain of $9.1 million and loss$2.1 million, respectively, in AOCI related to change in fair value of the cross-currency swaps.
For the years ended December 31, 2018 and 2017, the Company recorded a gain of $7.9 million and$1.9 million, respectively, in other income, net included in the consolidated statements of operations related tothe interest rate differential of the cross-currency swaps.
The estimated gain that is expected to be reclassified to other income, net from AOCI as of December 31,2018 within the next twelve months is $7.6 million. As of December 31, 2018, the Company does not expect any
F-34

INTEGRA LIFESCIENCES HOLDINGS CORPORATION
NOTES TO CONSOLIDATED FINANCIAL STATEMENTS (continued)
gains or losses will be reclassified into earnings as a result of the discontinuance of these cash flow hedgesbecause the original forecasted transaction will not occur.
Net Investment Hedges
The Company manages certain foreign exchange risks through a variety of strategies, including hedging.The Company is exposed to foreign exchange risk in its international operations from foreign currencypurchases, net investments in foreign subsidiaries, and foreign currency assets and liabilities created in thenormal course of business.
For net investment hedges, the effective portion of the gains and losses on the instruments arising from theeffects of foreign exchange are recorded in the currency translation adjustment component of accumulated othercomprehensive income / (loss), consistent with the underlying hedged item.
On October 1, 2018, the Company entered into cross-currency swap agreements designated as netinvestment hedges to partially offset the effects of foreign currency translation on foreign subsidiaries.
The Company held the following cross-currency rate swaps designated as net investment hedges as ofDecember 31, 2018 (dollar amounts in thousands):
Effective DateTermination
Date Fixed RateAggregate Notional
AmountFair Value
Asset (Liability)
Pay EUR . . . . . . . October 3,2018
September 30,2021
— EUR 70,738 1,359
Receive U.S.$ . . . 3.01% $ 82,000
Pay EUR . . . . . . . October 3,2018
September 30,2023
— EUR 51,760 (421)
Receive U.S.$ . . . 2.57% $ 60,000
Pay EUR . . . . . . . October 3,2018
September 30,2025
— EUR 38,820 (150)
Receive U.S.$ . . . 2.19% $ 45,000
Pay GBP . . . . . . . October 3,2018
September 30,2025
1.67% GBP 128,284 2,360
Receive U.S.$ . . . 2.71% $ 167,500
Pay CHF . . . . . . . October 3,2018
September 30,2025
— CHF 165,172 (3,780)
Receive GBP . . . . 1.67% GBP 128,284
Total . . . . . . . . . . $ (632)
The cross-currency swaps were carried on the consolidated balance sheet at fair value, and changes in thefair values were recorded as unrealized gains or losses in AOCI. For the year ended December 31, 2018, theCompany recorded a gain of $1.7 million in AOCI related to the change in fair value of the cross-currency swaps.
For the year ended December 31, 2018, the Company recorded a gain of $2.4 million in interest incomeincluded in the consolidated statements of operations related to the interest rate differential of the cross-currencyswaps.
The estimated gain that is expected to be reclassified to interest income from AOCI as of December 31,2018 within the next twelve months is $8.9 million.
Counterparty Credit Risk
The Company manages its concentration of counterparty credit risk on its derivative instruments by limitingacceptable counterparties to a group of major financial institutions with investment grade credit ratings, and byactively monitoring their credit ratings and outstanding positions on an ongoing basis. Therefore, the Company
F-35
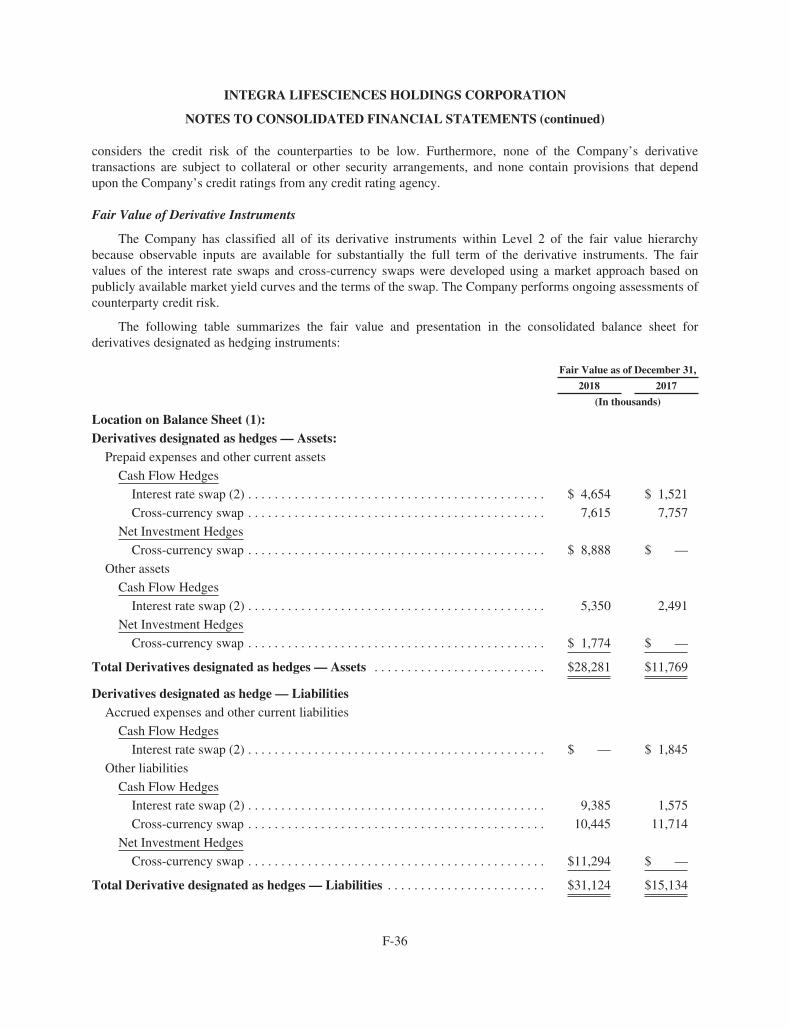
INTEGRA LIFESCIENCES HOLDINGS CORPORATION
NOTES TO CONSOLIDATED FINANCIAL STATEMENTS (continued)
considers the credit risk of the counterparties to be low. Furthermore, none of the Company’s derivativetransactions are subject to collateral or other security arrangements, and none contain provisions that dependupon the Company’s credit ratings from any credit rating agency.
Fair Value of Derivative Instruments
The Company has classified all of its derivative instruments within Level 2 of the fair value hierarchybecause observable inputs are available for substantially the full term of the derivative instruments. The fairvalues of the interest rate swaps and cross-currency swaps were developed using a market approach based onpublicly available market yield curves and the terms of the swap. The Company performs ongoing assessments ofcounterparty credit risk.
The following table summarizes the fair value and presentation in the consolidated balance sheet forderivatives designated as hedging instruments:
Fair Value as of December 31,
2018 2017
(In thousands)
Location on Balance Sheet (1):Derivatives designated as hedges — Assets:
Prepaid expenses and other current assets
Cash Flow Hedges
Interest rate swap (2) . . . . . . . . . . . . . . . . . . . . . . . . . . . . . . . . . . . . . . . . . . . . . $ 4,654 $ 1,521
Cross-currency swap . . . . . . . . . . . . . . . . . . . . . . . . . . . . . . . . . . . . . . . . . . . . . 7,615 7,757
Net Investment Hedges
Cross-currency swap . . . . . . . . . . . . . . . . . . . . . . . . . . . . . . . . . . . . . . . . . . . . . $ 8,888 $ —
Other assets
Cash Flow Hedges
Interest rate swap (2) . . . . . . . . . . . . . . . . . . . . . . . . . . . . . . . . . . . . . . . . . . . . . 5,350 2,491
Net Investment Hedges
Cross-currency swap . . . . . . . . . . . . . . . . . . . . . . . . . . . . . . . . . . . . . . . . . . . . . $ 1,774 $ —
Total Derivatives designated as hedges — Assets . . . . . . . . . . . . . . . . . . . . . . . . . . $28,281 $11,769
Derivatives designated as hedge — LiabilitiesAccrued expenses and other current liabilities
Cash Flow Hedges
Interest rate swap (2) . . . . . . . . . . . . . . . . . . . . . . . . . . . . . . . . . . . . . . . . . . . . . $ — $ 1,845
Other liabilities
Cash Flow Hedges
Interest rate swap (2) . . . . . . . . . . . . . . . . . . . . . . . . . . . . . . . . . . . . . . . . . . . . . 9,385 1,575
Cross-currency swap . . . . . . . . . . . . . . . . . . . . . . . . . . . . . . . . . . . . . . . . . . . . . 10,445 11,714
Net Investment Hedges
Cross-currency swap . . . . . . . . . . . . . . . . . . . . . . . . . . . . . . . . . . . . . . . . . . . . . $11,294 $ —
Total Derivative designated as hedges — Liabilities . . . . . . . . . . . . . . . . . . . . . . . . $31,124 $15,134
F-36
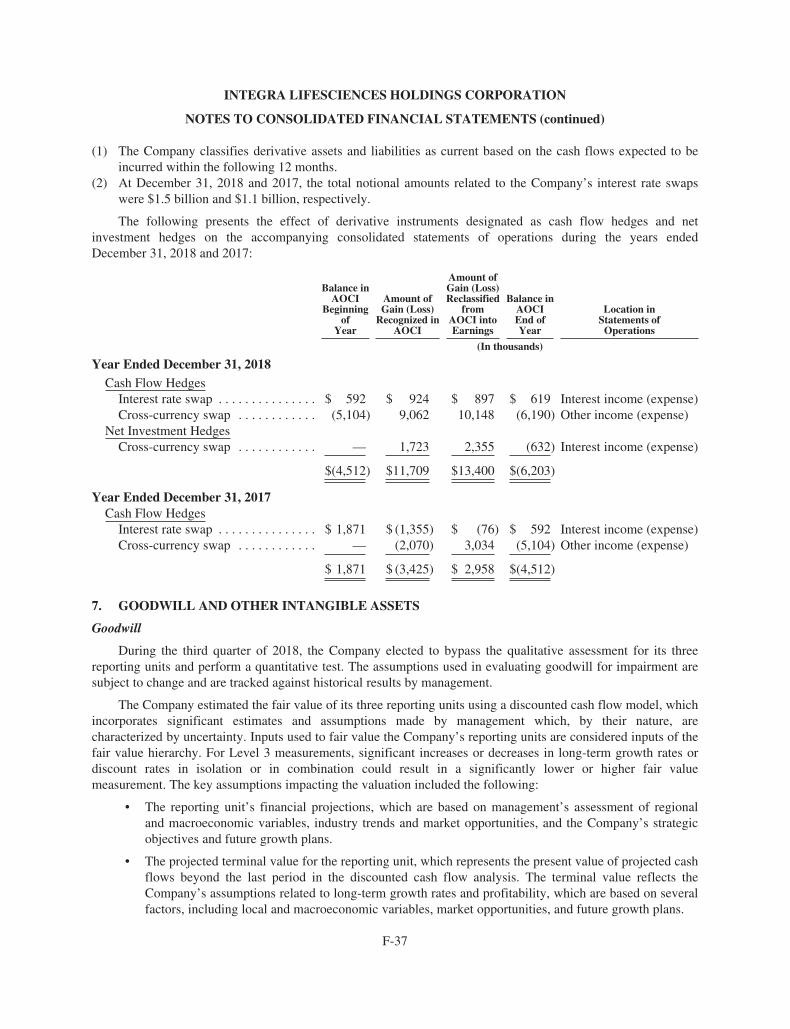
F-37
INTEGRA LIFESCIENCES HOLDINGS CORPORATION
NOTES TO CONSOLIDATED FINANCIAL STATEMENTS (continued)
(1) The Company classifies derivative assets and liabilities as current based on the cash flows expected to beincurred within the following 12 months.
(2) At December 31, 2018 and 2017, the total notional amounts related to the Company’s interest rate swapswere $1.5 billion and $1.1 billion, respectively.
The following presents the effect of derivative instruments designated as cash flow hedges and netinvestment hedges on the accompanying consolidated statements of operations during the years endedDecember 31, 2018 and 2017:
Balance inAOCI
Beginningof
Year
Amount ofGain (Loss)
Recognized inAOCI
Amount ofGain (Loss)Reclassified
fromAOCI intoEarnings
Balance inAOCIEnd ofYear
Location inStatements of
Operations
(In thousands)
Year Ended December 31, 2018Cash Flow Hedges
Interest rate swap . . . . . . . . . . . . . . . $ 592 $ 924 $ 897 $ 619 Interest income (expense)Cross-currency swap . . . . . . . . . . . . (5,104) 9,062 10,148 (6,190) Other income (expense)
Net Investment HedgesCross-currency swap . . . . . . . . . . . . — 1,723 2,355 (632) Interest income (expense)
$(4,512) $11,709 $13,400 $(6,203)
Year Ended December 31, 2017Cash Flow Hedges
Interest rate swap . . . . . . . . . . . . . . . $ 1,871 $ (1,355) $ (76) $ 592 Interest income (expense)Cross-currency swap . . . . . . . . . . . . — (2,070) 3,034 (5,104) Other income (expense)
$ 1,871 $ (3,425) $ 2,958 $(4,512)
7. GOODWILL AND OTHER INTANGIBLE ASSETS
Goodwill
During the third quarter of 2018, the Company elected to bypass the qualitative assessment for its threereporting units and perform a quantitative test. The assumptions used in evaluating goodwill for impairment aresubject to change and are tracked against historical results by management.
The Company estimated the fair value of its three reporting units using a discounted cash flow model, whichincorporates significant estimates and assumptions made by management which, by their nature, arecharacterized by uncertainty. Inputs used to fair value the Company’s reporting units are considered inputs of thefair value hierarchy. For Level 3 measurements, significant increases or decreases in long-term growth rates ordiscount rates in isolation or in combination could result in a significantly lower or higher fair valuemeasurement. The key assumptions impacting the valuation included the following:
• The reporting unit’s financial projections, which are based on management’s assessment of regionaland macroeconomic variables, industry trends and market opportunities, and the Company’s strategicobjectives and future growth plans.
• The projected terminal value for the reporting unit, which represents the present value of projected cashflows beyond the last period in the discounted cash flow analysis. The terminal value reflects theCompany’s assumptions related to long-term growth rates and profitability, which are based on severalfactors, including local and macroeconomic variables, market opportunities, and future growth plans.
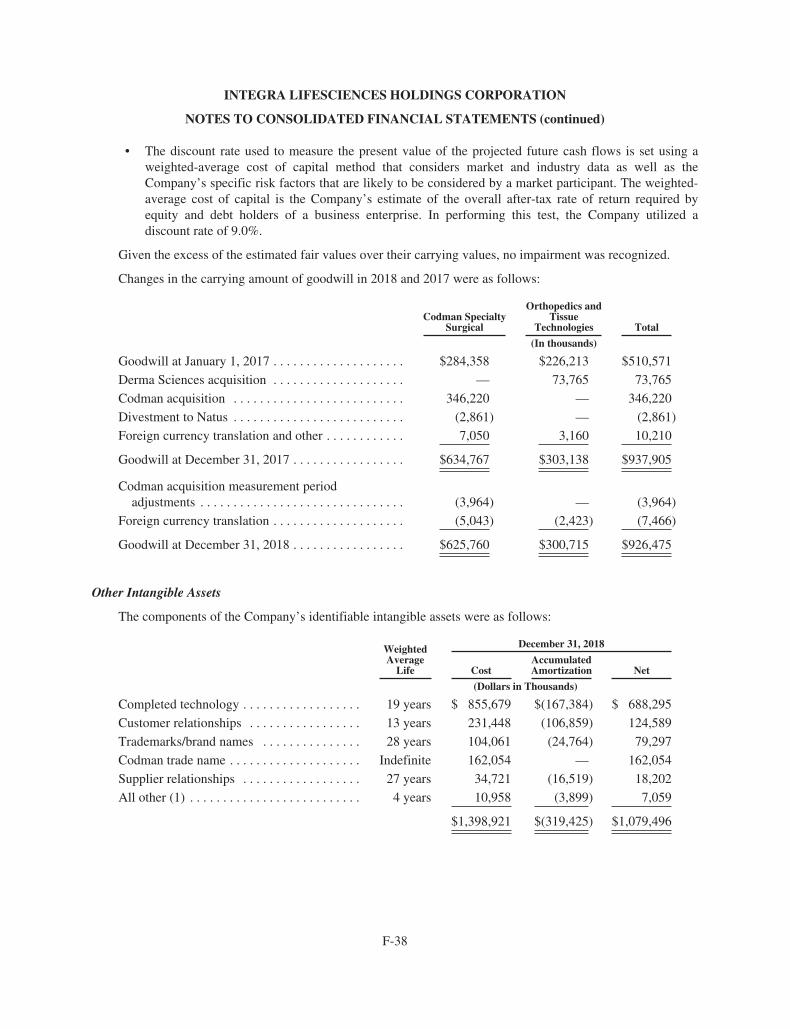
F-38
INTEGRA LIFESCIENCES HOLDINGS CORPORATION
NOTES TO CONSOLIDATED FINANCIAL STATEMENTS (continued)
• The discount rate used to measure the present value of the projected future cash flows is set using aweighted-average cost of capital method that considers market and industry data as well as theCompany’s specific risk factors that are likely to be considered by a market participant. The weighted-average cost of capital is the Company’s estimate of the overall after-tax rate of return required byequity and debt holders of a business enterprise. In performing this test, the Company utilized adiscount rate of 9.0%.
Given the excess of the estimated fair values over their carrying values, no impairment was recognized.
Changes in the carrying amount of goodwill in 2018 and 2017 were as follows:
Codman SpecialtySurgical
Orthopedics andTissue
Technologies Total
(In thousands)
Goodwill at January 1, 2017 . . . . . . . . . . . . . . . . . . . . $284,358 $226,213 $510,571
Derma Sciences acquisition . . . . . . . . . . . . . . . . . . . . — 73,765 73,765
Codman acquisition . . . . . . . . . . . . . . . . . . . . . . . . . . 346,220 — 346,220
Divestment to Natus . . . . . . . . . . . . . . . . . . . . . . . . . . (2,861) — (2,861)
Foreign currency translation and other . . . . . . . . . . . . 7,050 3,160 10,210
Goodwill at December 31, 2017 . . . . . . . . . . . . . . . . . $634,767 $303,138 $937,905
Codman acquisition measurement periodadjustments . . . . . . . . . . . . . . . . . . . . . . . . . . . . . . . (3,964) — (3,964)
Foreign currency translation . . . . . . . . . . . . . . . . . . . . (5,043) (2,423) (7,466)
Goodwill at December 31, 2018 . . . . . . . . . . . . . . . . . $625,760 $300,715 $926,475
Other Intangible Assets
The components of the Company’s identifiable intangible assets were as follows:
WeightedAverage
Life
December 31, 2018
CostAccumulatedAmortization Net
(Dollars in Thousands)
Completed technology . . . . . . . . . . . . . . . . . . 19 years $ 855,679 $(167,384) $ 688,295
Customer relationships . . . . . . . . . . . . . . . . . 13 years 231,448 (106,859) 124,589
Trademarks/brand names . . . . . . . . . . . . . . . 28 years 104,061 (24,764) 79,297
Codman trade name . . . . . . . . . . . . . . . . . . . . Indefinite 162,054 — 162,054
Supplier relationships . . . . . . . . . . . . . . . . . . 27 years 34,721 (16,519) 18,202
All other (1) . . . . . . . . . . . . . . . . . . . . . . . . . . 4 years 10,958 (3,899) 7,059
$1,398,921 $(319,425) $1,079,496
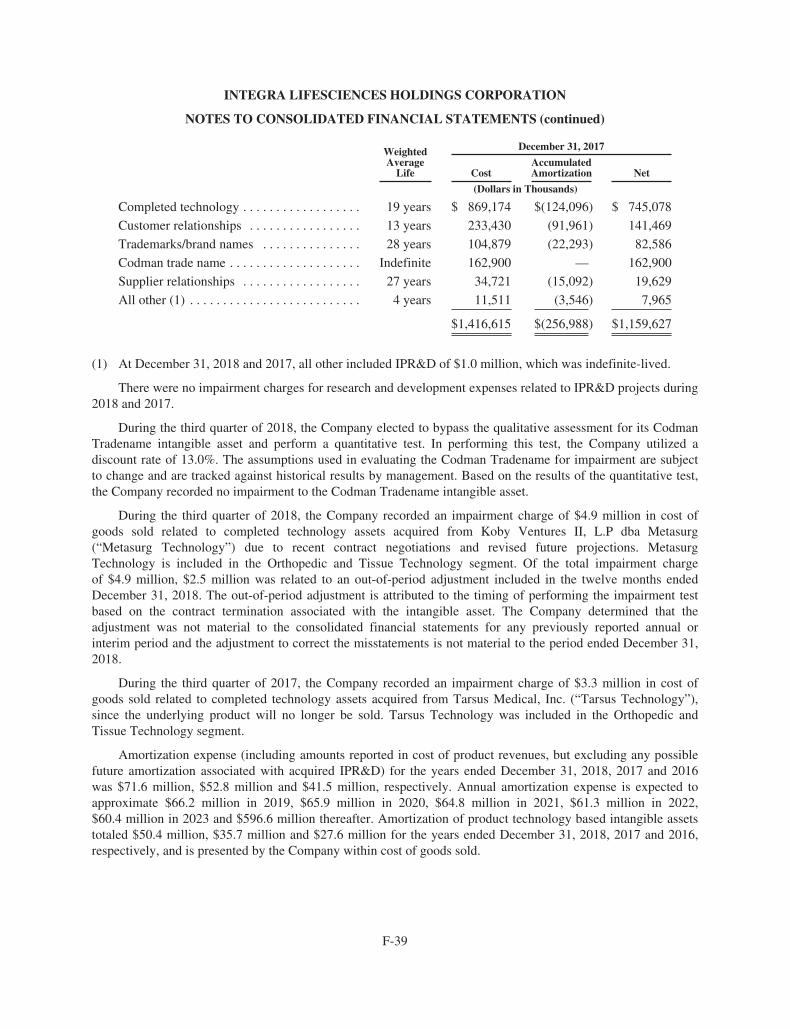
F-39
INTEGRA LIFESCIENCES HOLDINGS CORPORATION
NOTES TO CONSOLIDATED FINANCIAL STATEMENTS (continued)
WeightedAverage
Life
December 31, 2017
CostAccumulatedAmortization Net
(Dollars in Thousands)
Completed technology . . . . . . . . . . . . . . . . . . 19 years $ 869,174 $(124,096) $ 745,078
Customer relationships . . . . . . . . . . . . . . . . . 13 years 233,430 (91,961) 141,469
Trademarks/brand names . . . . . . . . . . . . . . . 28 years 104,879 (22,293) 82,586
Codman trade name . . . . . . . . . . . . . . . . . . . . Indefinite 162,900 — 162,900
Supplier relationships . . . . . . . . . . . . . . . . . . 27 years 34,721 (15,092) 19,629
All other (1) . . . . . . . . . . . . . . . . . . . . . . . . . . 4 years 11,511 (3,546) 7,965
$1,416,615 $(256,988) $1,159,627
(1) At December 31, 2018 and 2017, all other included IPR&D of $1.0 million, which was indefinite-lived.
There were no impairment charges for research and development expenses related to IPR&D projects during2018 and 2017.
During the third quarter of 2018, the Company elected to bypass the qualitative assessment for its CodmanTradename intangible asset and perform a quantitative test. In performing this test, the Company utilized adiscount rate of 13.0%. The assumptions used in evaluating the Codman Tradename for impairment are subjectto change and are tracked against historical results by management. Based on the results of the quantitative test,the Company recorded no impairment to the Codman Tradename intangible asset.
During the third quarter of 2018, the Company recorded an impairment charge of $4.9 million in cost ofgoods sold related to completed technology assets acquired from Koby Ventures II, L.P dba Metasurg(“Metasurg Technology”) due to recent contract negotiations and revised future projections. MetasurgTechnology is included in the Orthopedic and Tissue Technology segment. Of the total impairment chargeof $4.9 million, $2.5 million was related to an out-of-period adjustment included in the twelve months endedDecember 31, 2018. The out-of-period adjustment is attributed to the timing of performing the impairment testbased on the contract termination associated with the intangible asset. The Company determined that theadjustment was not material to the consolidated financial statements for any previously reported annual orinterim period and the adjustment to correct the misstatements is not material to the period ended December 31,2018.
During the third quarter of 2017, the Company recorded an impairment charge of $3.3 million in cost ofgoods sold related to completed technology assets acquired from Tarsus Medical, Inc. (“Tarsus Technology”),since the underlying product will no longer be sold. Tarsus Technology was included in the Orthopedic andTissue Technology segment.
Amortization expense (including amounts reported in cost of product revenues, but excluding any possiblefuture amortization associated with acquired IPR&D) for the years ended December 31, 2018, 2017 and 2016was $71.6 million, $52.8 million and $41.5 million, respectively. Annual amortization expense is expected toapproximate $66.2 million in 2019, $65.9 million in 2020, $64.8 million in 2021, $61.3 million in 2022,$60.4 million in 2023 and $596.6 million thereafter. Amortization of product technology based intangible assetstotaled $50.4 million, $35.7 million and $27.6 million for the years ended December 31, 2018, 2017 and 2016,respectively, and is presented by the Company within cost of goods sold.
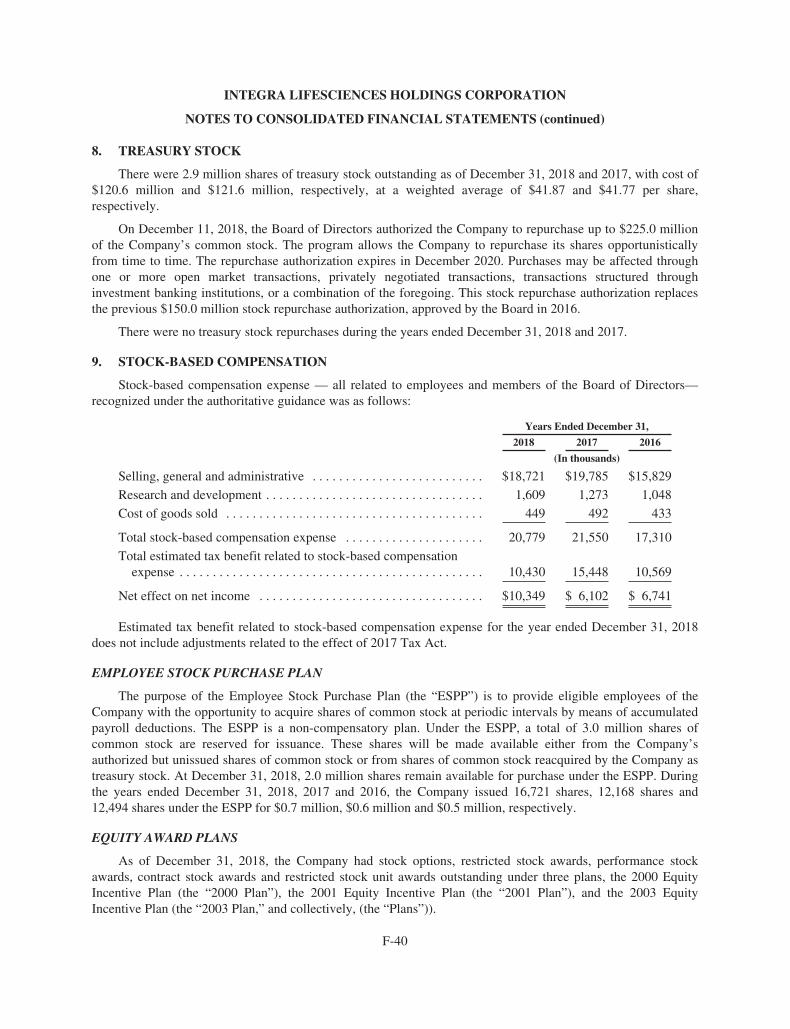
F-40
INTEGRA LIFESCIENCES HOLDINGS CORPORATION
NOTES TO CONSOLIDATED FINANCIAL STATEMENTS (continued)
8. TREASURY STOCK
There were 2.9 million shares of treasury stock outstanding as of December 31, 2018 and 2017, with cost of$120.6 million and $121.6 million, respectively, at a weighted average of $41.87 and $41.77 per share,respectively.
On December 11, 2018, the Board of Directors authorized the Company to repurchase up to $225.0 millionof the Company’s common stock. The program allows the Company to repurchase its shares opportunisticallyfrom time to time. The repurchase authorization expires in December 2020. Purchases may be affected throughone or more open market transactions, privately negotiated transactions, transactions structured throughinvestment banking institutions, or a combination of the foregoing. This stock repurchase authorization replacesthe previous $150.0 million stock repurchase authorization, approved by the Board in 2016.
There were no treasury stock repurchases during the years ended December 31, 2018 and 2017.
9. STOCK-BASED COMPENSATION
Stock-based compensation expense — all related to employees and members of the Board of Directors—recognized under the authoritative guidance was as follows:
Years Ended December 31,
2018 2017 2016
(In thousands)
Selling, general and administrative . . . . . . . . . . . . . . . . . . . . . . . . . . $18,721 $19,785 $15,829
Research and development . . . . . . . . . . . . . . . . . . . . . . . . . . . . . . . . . 1,609 1,273 1,048
Cost of goods sold . . . . . . . . . . . . . . . . . . . . . . . . . . . . . . . . . . . . . . . 449 492 433
Total stock-based compensation expense . . . . . . . . . . . . . . . . . . . . . 20,779 21,550 17,310
Total estimated tax benefit related to stock-based compensationexpense . . . . . . . . . . . . . . . . . . . . . . . . . . . . . . . . . . . . . . . . . . . . . . 10,430 15,448 10,569
Net effect on net income . . . . . . . . . . . . . . . . . . . . . . . . . . . . . . . . . . $10,349 $ 6,102 $ 6,741
Estimated tax benefit related to stock-based compensation expense for the year ended December 31, 2018does not include adjustments related to the effect of 2017 Tax Act.
EMPLOYEE STOCK PURCHASE PLAN
The purpose of the Employee Stock Purchase Plan (the “ESPP”) is to provide eligible employees of theCompany with the opportunity to acquire shares of common stock at periodic intervals by means of accumulatedpayroll deductions. The ESPP is a non-compensatory plan. Under the ESPP, a total of 3.0 million shares ofcommon stock are reserved for issuance. These shares will be made available either from the Company’sauthorized but unissued shares of common stock or from shares of common stock reacquired by the Company astreasury stock. At December 31, 2018, 2.0 million shares remain available for purchase under the ESPP. Duringthe years ended December 31, 2018, 2017 and 2016, the Company issued 16,721 shares, 12,168 shares and12,494 shares under the ESPP for $0.7 million, $0.6 million and $0.5 million, respectively.
EQUITY AWARD PLANS
As of December 31, 2018, the Company had stock options, restricted stock awards, performance stockawards, contract stock awards and restricted stock unit awards outstanding under three plans, the 2000 EquityIncentive Plan (the “2000 Plan”), the 2001 Equity Incentive Plan (the “2001 Plan”), and the 2003 EquityIncentive Plan (the “2003 Plan,” and collectively, (the “Plans”)).
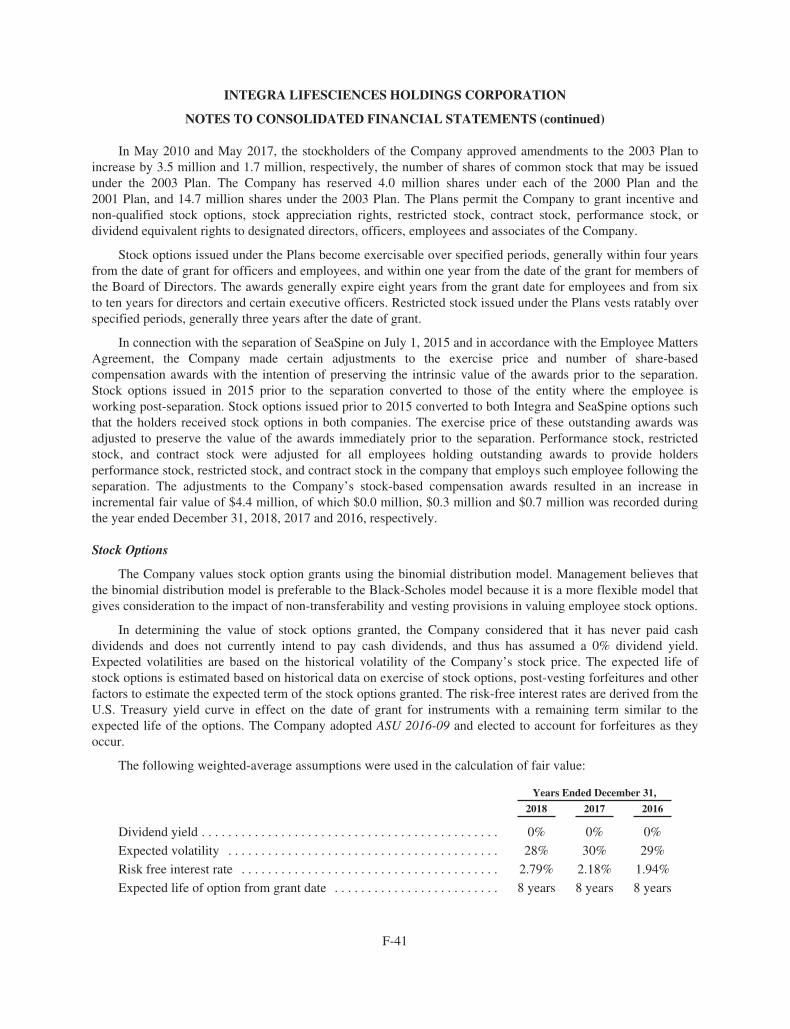
F-41
INTEGRA LIFESCIENCES HOLDINGS CORPORATION
NOTES TO CONSOLIDATED FINANCIAL STATEMENTS (continued)
In May 2010 and May 2017, the stockholders of the Company approved amendments to the 2003 Plan toincrease by 3.5 million and 1.7 million, respectively, the number of shares of common stock that may be issuedunder the 2003 Plan. The Company has reserved 4.0 million shares under each of the 2000 Plan and the2001 Plan, and 14.7 million shares under the 2003 Plan. The Plans permit the Company to grant incentive andnon-qualified stock options, stock appreciation rights, restricted stock, contract stock, performance stock, ordividend equivalent rights to designated directors, officers, employees and associates of the Company.
Stock options issued under the Plans become exercisable over specified periods, generally within four yearsfrom the date of grant for officers and employees, and within one year from the date of the grant for members ofthe Board of Directors. The awards generally expire eight years from the grant date for employees and from sixto ten years for directors and certain executive officers. Restricted stock issued under the Plans vests ratably overspecified periods, generally three years after the date of grant.
In connection with the separation of SeaSpine on July 1, 2015 and in accordance with the Employee MattersAgreement, the Company made certain adjustments to the exercise price and number of share-basedcompensation awards with the intention of preserving the intrinsic value of the awards prior to the separation.Stock options issued in 2015 prior to the separation converted to those of the entity where the employee isworking post-separation. Stock options issued prior to 2015 converted to both Integra and SeaSpine options suchthat the holders received stock options in both companies. The exercise price of these outstanding awards wasadjusted to preserve the value of the awards immediately prior to the separation. Performance stock, restrictedstock, and contract stock were adjusted for all employees holding outstanding awards to provide holdersperformance stock, restricted stock, and contract stock in the company that employs such employee following theseparation. The adjustments to the Company’s stock-based compensation awards resulted in an increase inincremental fair value of $4.4 million, of which $0.0 million, $0.3 million and $0.7 million was recorded duringthe year ended December 31, 2018, 2017 and 2016, respectively.
Stock Options
The Company values stock option grants using the binomial distribution model. Management believes thatthe binomial distribution model is preferable to the Black-Scholes model because it is a more flexible model thatgives consideration to the impact of non-transferability and vesting provisions in valuing employee stock options.
In determining the value of stock options granted, the Company considered that it has never paid cashdividends and does not currently intend to pay cash dividends, and thus has assumed a 0% dividend yield.Expected volatilities are based on the historical volatility of the Company’s stock price. The expected life ofstock options is estimated based on historical data on exercise of stock options, post-vesting forfeitures and otherfactors to estimate the expected term of the stock options granted. The risk-free interest rates are derived from theU.S. Treasury yield curve in effect on the date of grant for instruments with a remaining term similar to theexpected life of the options. The Company adopted ASU 2016-09 and elected to account for forfeitures as theyoccur.
The following weighted-average assumptions were used in the calculation of fair value:
Years Ended December 31,
2018 2017 2016
Dividend yield . . . . . . . . . . . . . . . . . . . . . . . . . . . . . . . . . . . . . . . . . . . . . 0% 0% 0%
Expected volatility . . . . . . . . . . . . . . . . . . . . . . . . . . . . . . . . . . . . . . . . . 28% 30% 29%
Risk free interest rate . . . . . . . . . . . . . . . . . . . . . . . . . . . . . . . . . . . . . . . 2.79% 2.18% 1.94%
Expected life of option from grant date . . . . . . . . . . . . . . . . . . . . . . . . . 8 years 8 years 8 years
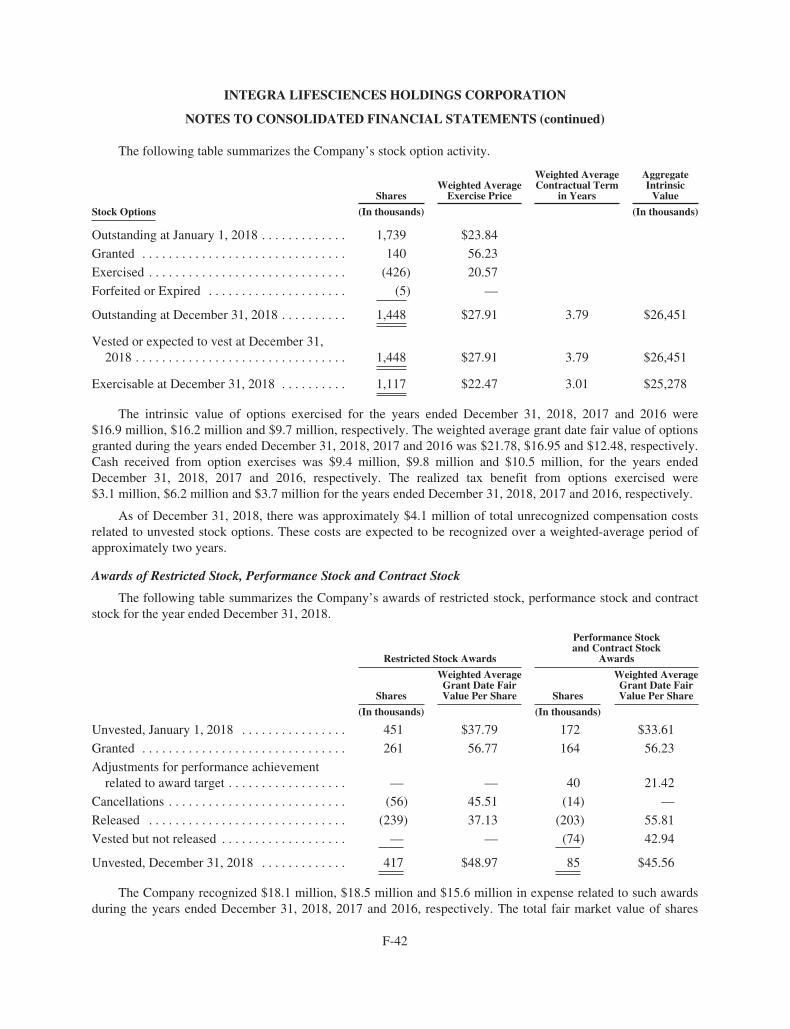
F-42
INTEGRA LIFESCIENCES HOLDINGS CORPORATION
NOTES TO CONSOLIDATED FINANCIAL STATEMENTS (continued)
The following table summarizes the Company’s stock option activity.
SharesWeighted Average
Exercise Price
Weighted AverageContractual Term
in Years
AggregateIntrinsic
Value
Stock Options (In thousands) (In thousands)
Outstanding at January 1, 2018 . . . . . . . . . . . . . 1,739 $23.84
Granted . . . . . . . . . . . . . . . . . . . . . . . . . . . . . . . 140 56.23
Exercised . . . . . . . . . . . . . . . . . . . . . . . . . . . . . . (426) 20.57
Forfeited or Expired . . . . . . . . . . . . . . . . . . . . . (5) —
Outstanding at December 31, 2018 . . . . . . . . . . 1,448 $27.91 3.79 $26,451
Vested or expected to vest at December 31,2018 . . . . . . . . . . . . . . . . . . . . . . . . . . . . . . . . 1,448 $27.91 3.79 $26,451
Exercisable at December 31, 2018 . . . . . . . . . . 1,117 $22.47 3.01 $25,278
The intrinsic value of options exercised for the years ended December 31, 2018, 2017 and 2016 were$16.9 million, $16.2 million and $9.7 million, respectively. The weighted average grant date fair value of optionsgranted during the years ended December 31, 2018, 2017 and 2016 was $21.78, $16.95 and $12.48, respectively.Cash received from option exercises was $9.4 million, $9.8 million and $10.5 million, for the years endedDecember 31, 2018, 2017 and 2016, respectively. The realized tax benefit from options exercised were$3.1 million, $6.2 million and $3.7 million for the years ended December 31, 2018, 2017 and 2016, respectively.
As of December 31, 2018, there was approximately $4.1 million of total unrecognized compensation costsrelated to unvested stock options. These costs are expected to be recognized over a weighted-average period ofapproximately two years.
Awards of Restricted Stock, Performance Stock and Contract Stock
The following table summarizes the Company’s awards of restricted stock, performance stock and contractstock for the year ended December 31, 2018.
Restricted Stock Awards
Performance Stockand Contract Stock
Awards
Shares
Weighted AverageGrant Date FairValue Per Share Shares
Weighted AverageGrant Date FairValue Per Share
(In thousands) (In thousands)
Unvested, January 1, 2018 . . . . . . . . . . . . . . . . 451 $37.79 172 $33.61
Granted . . . . . . . . . . . . . . . . . . . . . . . . . . . . . . . 261 56.77 164 56.23
Adjustments for performance achievementrelated to award target . . . . . . . . . . . . . . . . . . — — 40 21.42
Cancellations . . . . . . . . . . . . . . . . . . . . . . . . . . . (56) 45.51 (14) —
Released . . . . . . . . . . . . . . . . . . . . . . . . . . . . . . (239) 37.13 (203) 55.81
Vested but not released . . . . . . . . . . . . . . . . . . . — — (74) 42.94
Unvested, December 31, 2018 . . . . . . . . . . . . . 417 $48.97 85 $45.56
The Company recognized $18.1 million, $18.5 million and $15.6 million in expense related to such awardsduring the years ended December 31, 2018, 2017 and 2016, respectively. The total fair market value of shares
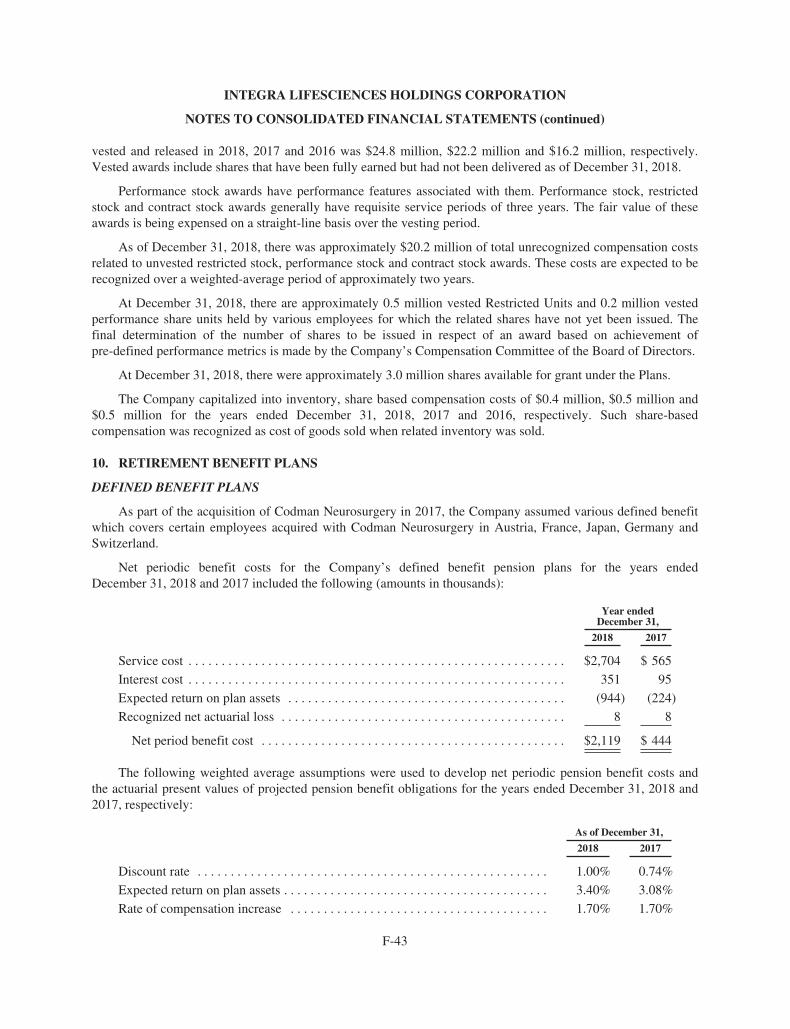
F-43
INTEGRA LIFESCIENCES HOLDINGS CORPORATION
NOTES TO CONSOLIDATED FINANCIAL STATEMENTS (continued)
vested and released in 2018, 2017 and 2016 was $24.8 million, $22.2 million and $16.2 million, respectively.Vested awards include shares that have been fully earned but had not been delivered as of December 31, 2018.
Performance stock awards have performance features associated with them. Performance stock, restrictedstock and contract stock awards generally have requisite service periods of three years. The fair value of theseawards is being expensed on a straight-line basis over the vesting period.
As of December 31, 2018, there was approximately $20.2 million of total unrecognized compensation costsrelated to unvested restricted stock, performance stock and contract stock awards. These costs are expected to berecognized over a weighted-average period of approximately two years.
At December 31, 2018, there are approximately 0.5 million vested Restricted Units and 0.2 million vestedperformance share units held by various employees for which the related shares have not yet been issued. Thefinal determination of the number of shares to be issued in respect of an award based on achievement ofpre-defined performance metrics is made by the Company’s Compensation Committee of the Board of Directors.
At December 31, 2018, there were approximately 3.0 million shares available for grant under the Plans.
The Company capitalized into inventory, share based compensation costs of $0.4 million, $0.5 million and$0.5 million for the years ended December 31, 2018, 2017 and 2016, respectively. Such share-basedcompensation was recognized as cost of goods sold when related inventory was sold.
10. RETIREMENT BENEFIT PLANS
DEFINED BENEFIT PLANS
As part of the acquisition of Codman Neurosurgery in 2017, the Company assumed various defined benefitwhich covers certain employees acquired with Codman Neurosurgery in Austria, France, Japan, Germany andSwitzerland.
Net periodic benefit costs for the Company’s defined benefit pension plans for the years endedDecember 31, 2018 and 2017 included the following (amounts in thousands):
Year endedDecember 31,
2018 2017
Service cost . . . . . . . . . . . . . . . . . . . . . . . . . . . . . . . . . . . . . . . . . . . . . . . . . . . . . . . . . $2,704 $ 565
Interest cost . . . . . . . . . . . . . . . . . . . . . . . . . . . . . . . . . . . . . . . . . . . . . . . . . . . . . . . . . 351 95
Expected return on plan assets . . . . . . . . . . . . . . . . . . . . . . . . . . . . . . . . . . . . . . . . . . (944) (224)
Recognized net actuarial loss . . . . . . . . . . . . . . . . . . . . . . . . . . . . . . . . . . . . . . . . . . . 8 8
Net period benefit cost . . . . . . . . . . . . . . . . . . . . . . . . . . . . . . . . . . . . . . . . . . . . . . $2,119 $ 444
The following weighted average assumptions were used to develop net periodic pension benefit costs andthe actuarial present values of projected pension benefit obligations for the years ended December 31, 2018 and2017, respectively:
As of December 31,
2018 2017
Discount rate . . . . . . . . . . . . . . . . . . . . . . . . . . . . . . . . . . . . . . . . . . . . . . . . . . . . . 1.00% 0.74%
Expected return on plan assets . . . . . . . . . . . . . . . . . . . . . . . . . . . . . . . . . . . . . . . . 3.40% 3.08%
Rate of compensation increase . . . . . . . . . . . . . . . . . . . . . . . . . . . . . . . . . . . . . . . 1.70% 1.70%

F-44
INTEGRA LIFESCIENCES HOLDINGS CORPORATION
NOTES TO CONSOLIDATED FINANCIAL STATEMENTS (continued)
The Company’s discount rates are determined by considering current yield curves representing high quality,long-term fixed income instruments. The resulting discount rates are consistent with the duration of planliabilities. In 2018 and 2017, the discount rates were prescribed as the current yield on corporate bonds with anaverage rating of AA or AAA of equivalent currency and term to the liabilities. The expected returns on planassets represent the average rate of return expected to be earned on plan assets over the period the benefitsincluded in the benefit obligation are to be paid. In developing the expected rates of return, the Companyconsiders returns of historical market data as well as actual returns on the plan assets. Using this referenceinformation, the long-term return expectations for each asset category are developed according to the allocationamong those investment categories.
The assessment is determined using projections from external financial sources, long-term historicalaverages, actual returns by asset class and the various asset class allocations by market.
The following sets forth the change in projected benefit obligations and the change in plan assets for theyears ended December 31, 2018 and 2017 and a reconciliation of the funded status at December 31, 2018 and2017, respectively (amounts in thousands):
Year endedDecember 31,
2018 2017
Change In Projected Benefit Obligations
Projected benefit obligations, beginning of year . . . . . . . . . . . . . . . . . . . . . . . . $47,661 $ 668
Interest cost . . . . . . . . . . . . . . . . . . . . . . . . . . . . . . . . . . . . . . . . . . . . . . . . . . . . 351 95
Service cost . . . . . . . . . . . . . . . . . . . . . . . . . . . . . . . . . . . . . . . . . . . . . . . . . . . . 2,704 565
Actuarial loss . . . . . . . . . . . . . . . . . . . . . . . . . . . . . . . . . . . . . . . . . . . . . . . . . . . 762 (12)
Employee contribution . . . . . . . . . . . . . . . . . . . . . . . . . . . . . . . . . . . . . . . . . . . 641 180
Premiums paid . . . . . . . . . . . . . . . . . . . . . . . . . . . . . . . . . . . . . . . . . . . . . . . . . . — (89)
Benefit payment . . . . . . . . . . . . . . . . . . . . . . . . . . . . . . . . . . . . . . . . . . . . . . . . (1,483) (19)
Plans transferred in . . . . . . . . . . . . . . . . . . . . . . . . . . . . . . . . . . . . . . . . . . . . . . 2,280 46,448
Effect of foreign currency exchange rates . . . . . . . . . . . . . . . . . . . . . . . . . . . . (374) (175)
Projected benefit obligations, end of year . . . . . . . . . . . . . . . . . . . . . . . . . . . . . $52,542 $47,661
Year endedDecember 31,
2018 2017
Change In Plan Assets
Plan assets at fair value, beginning of year . . . . . . . . . . . . . . . . . . . . . . . . . . . . $26,943 $ —
Actual return on plan assets . . . . . . . . . . . . . . . . . . . . . . . . . . . . . . . . . . . . . . . 1,802 82
Employer contributions . . . . . . . . . . . . . . . . . . . . . . . . . . . . . . . . . . . . . . . . . . . 1,720 450
Employee contributions . . . . . . . . . . . . . . . . . . . . . . . . . . . . . . . . . . . . . . . . . . . 641 180
Benefits paid . . . . . . . . . . . . . . . . . . . . . . . . . . . . . . . . . . . . . . . . . . . . . . . . . . . (1,463) —
Premiums paid . . . . . . . . . . . . . . . . . . . . . . . . . . . . . . . . . . . . . . . . . . . . . . . . . . — (89)
Plans transferred in . . . . . . . . . . . . . . . . . . . . . . . . . . . . . . . . . . . . . . . . . . . . . . 1,589 26,477
Effect of foreign currency exchange rates . . . . . . . . . . . . . . . . . . . . . . . . . . . . (129) (157)
Plan assets at fair value, end of year . . . . . . . . . . . . . . . . . . . . . . . . . . . . . . . . . . . $31,103 $26,943
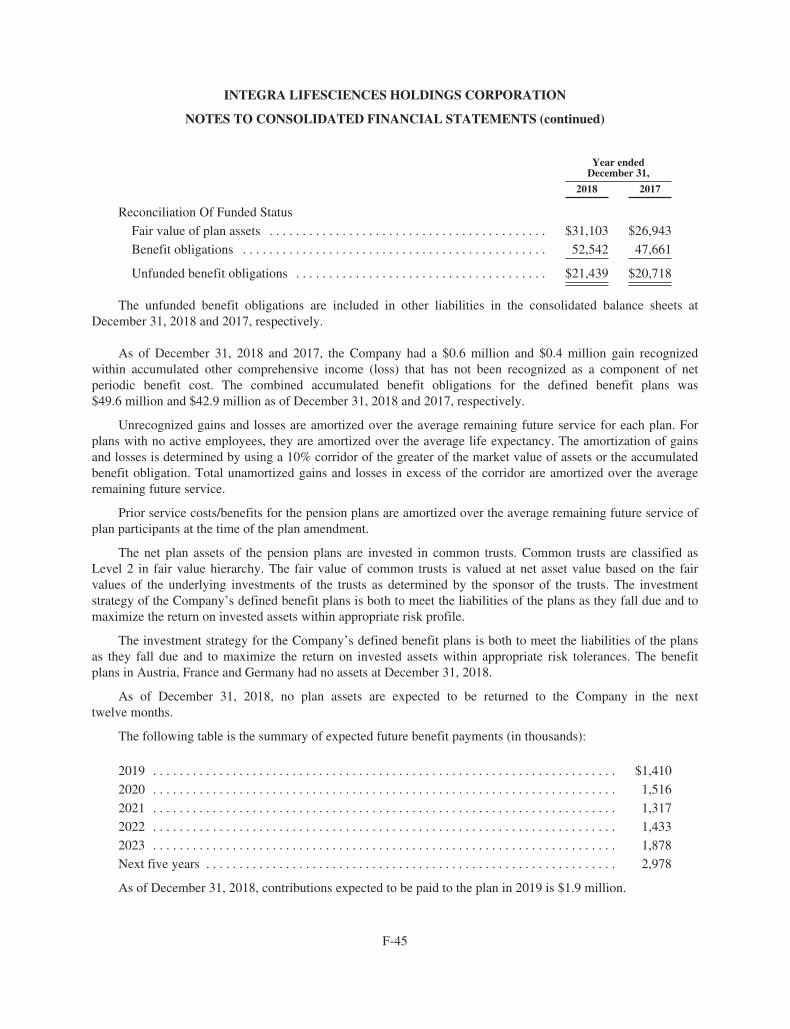
F-45
INTEGRA LIFESCIENCES HOLDINGS CORPORATION
NOTES TO CONSOLIDATED FINANCIAL STATEMENTS (continued)
Year endedDecember 31,
2018 2017
Reconciliation Of Funded Status
Fair value of plan assets . . . . . . . . . . . . . . . . . . . . . . . . . . . . . . . . . . . . . . . . . . $31,103 $26,943
Benefit obligations . . . . . . . . . . . . . . . . . . . . . . . . . . . . . . . . . . . . . . . . . . . . . . 52,542 47,661
Unfunded benefit obligations . . . . . . . . . . . . . . . . . . . . . . . . . . . . . . . . . . . . . . $21,439 $20,718
The unfunded benefit obligations are included in other liabilities in the consolidated balance sheets atDecember 31, 2018 and 2017, respectively.
As of December 31, 2018 and 2017, the Company had a $0.6 million and $0.4 million gain recognizedwithin accumulated other comprehensive income (loss) that has not been recognized as a component of netperiodic benefit cost. The combined accumulated benefit obligations for the defined benefit plans was$49.6 million and $42.9 million as of December 31, 2018 and 2017, respectively.
Unrecognized gains and losses are amortized over the average remaining future service for each plan. Forplans with no active employees, they are amortized over the average life expectancy. The amortization of gainsand losses is determined by using a 10% corridor of the greater of the market value of assets or the accumulatedbenefit obligation. Total unamortized gains and losses in excess of the corridor are amortized over the averageremaining future service.
Prior service costs/benefits for the pension plans are amortized over the average remaining future service ofplan participants at the time of the plan amendment.
The net plan assets of the pension plans are invested in common trusts. Common trusts are classified asLevel 2 in fair value hierarchy. The fair value of common trusts is valued at net asset value based on the fairvalues of the underlying investments of the trusts as determined by the sponsor of the trusts. The investmentstrategy of the Company’s defined benefit plans is both to meet the liabilities of the plans as they fall due and tomaximize the return on invested assets within appropriate risk profile.
The investment strategy for the Company’s defined benefit plans is both to meet the liabilities of the plansas they fall due and to maximize the return on invested assets within appropriate risk tolerances. The benefitplans in Austria, France and Germany had no assets at December 31, 2018.
As of December 31, 2018, no plan assets are expected to be returned to the Company in the nexttwelve months.
The following table is the summary of expected future benefit payments (in thousands):
2019 . . . . . . . . . . . . . . . . . . . . . . . . . . . . . . . . . . . . . . . . . . . . . . . . . . . . . . . . . . . . . . . . . . . . . . $1,410
2020 . . . . . . . . . . . . . . . . . . . . . . . . . . . . . . . . . . . . . . . . . . . . . . . . . . . . . . . . . . . . . . . . . . . . . . 1,516
2021 . . . . . . . . . . . . . . . . . . . . . . . . . . . . . . . . . . . . . . . . . . . . . . . . . . . . . . . . . . . . . . . . . . . . . . 1,317
2022 . . . . . . . . . . . . . . . . . . . . . . . . . . . . . . . . . . . . . . . . . . . . . . . . . . . . . . . . . . . . . . . . . . . . . . 1,433
2023 . . . . . . . . . . . . . . . . . . . . . . . . . . . . . . . . . . . . . . . . . . . . . . . . . . . . . . . . . . . . . . . . . . . . . . 1,878
Next five years . . . . . . . . . . . . . . . . . . . . . . . . . . . . . . . . . . . . . . . . . . . . . . . . . . . . . . . . . . . . . . 2,978
As of December 31, 2018, contributions expected to be paid to the plan in 2019 is $1.9 million.
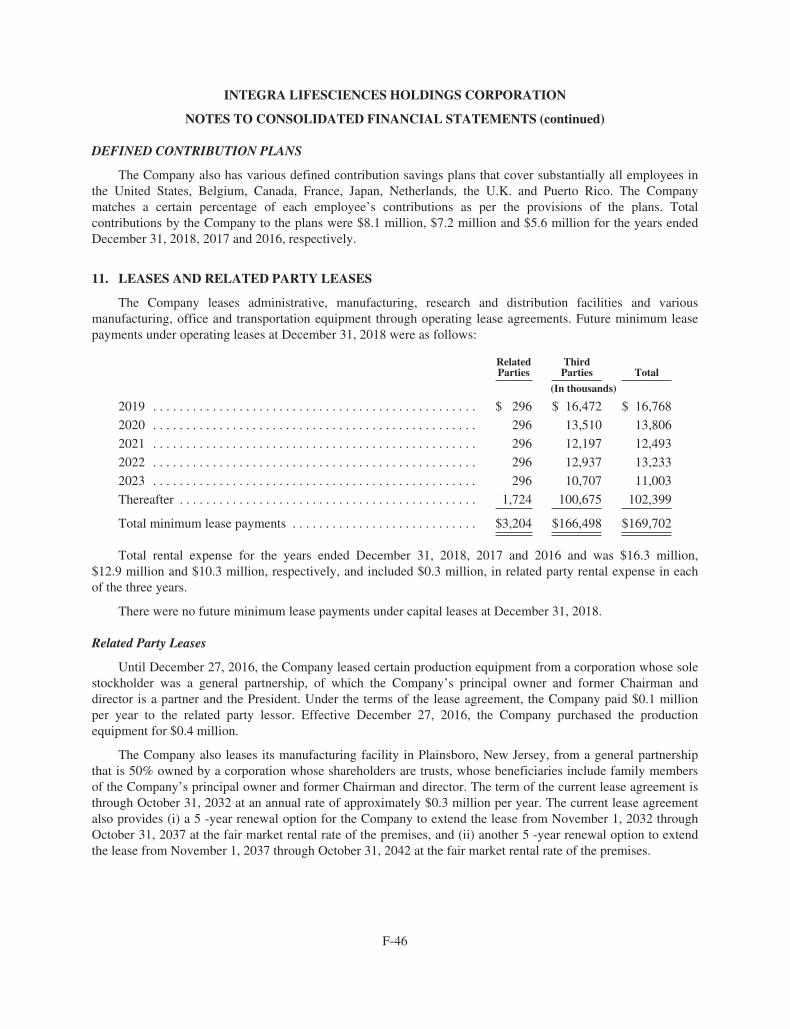
F-46
INTEGRA LIFESCIENCES HOLDINGS CORPORATION
NOTES TO CONSOLIDATED FINANCIAL STATEMENTS (continued)
DEFINED CONTRIBUTION PLANS
The Company also has various defined contribution savings plans that cover substantially all employees inthe United States, Belgium, Canada, France, Japan, Netherlands, the U.K. and Puerto Rico. The Companymatches a certain percentage of each employee’s contributions as per the provisions of the plans. Totalcontributions by the Company to the plans were $8.1 million, $7.2 million and $5.6 million for the years endedDecember 31, 2018, 2017 and 2016, respectively.
11. LEASES AND RELATED PARTY LEASES
The Company leases administrative, manufacturing, research and distribution facilities and variousmanufacturing, office and transportation equipment through operating lease agreements. Future minimum leasepayments under operating leases at December 31, 2018 were as follows:
RelatedParties
ThirdParties Total
(In thousands)
2019 . . . . . . . . . . . . . . . . . . . . . . . . . . . . . . . . . . . . . . . . . . . . . . . . . $ 296 $ 16,472 $ 16,768
2020 . . . . . . . . . . . . . . . . . . . . . . . . . . . . . . . . . . . . . . . . . . . . . . . . . 296 13,510 13,806
2021 . . . . . . . . . . . . . . . . . . . . . . . . . . . . . . . . . . . . . . . . . . . . . . . . . 296 12,197 12,493
2022 . . . . . . . . . . . . . . . . . . . . . . . . . . . . . . . . . . . . . . . . . . . . . . . . . 296 12,937 13,233
2023 . . . . . . . . . . . . . . . . . . . . . . . . . . . . . . . . . . . . . . . . . . . . . . . . . 296 10,707 11,003
Thereafter . . . . . . . . . . . . . . . . . . . . . . . . . . . . . . . . . . . . . . . . . . . . . 1,724 100,675 102,399
Total minimum lease payments . . . . . . . . . . . . . . . . . . . . . . . . . . . . $3,204 $166,498 $169,702
Total rental expense for the years ended December 31, 2018, 2017 and 2016 and was $16.3 million,$12.9 million and $10.3 million, respectively, and included $0.3 million, in related party rental expense in eachof the three years.
There were no future minimum lease payments under capital leases at December 31, 2018.
Related Party Leases
Until December 27, 2016, the Company leased certain production equipment from a corporation whose solestockholder was a general partnership, of which the Company’s principal owner and former Chairman anddirector is a partner and the President. Under the terms of the lease agreement, the Company paid $0.1 millionper year to the related party lessor. Effective December 27, 2016, the Company purchased the productionequipment for $0.4 million.
The Company also leases its manufacturing facility in Plainsboro, New Jersey, from a general partnershipthat is 50% owned by a corporation whose shareholders are trusts, whose beneficiaries include family membersof the Company’s principal owner and former Chairman and director. The term of the current lease agreement isthrough October 31, 2032 at an annual rate of approximately $0.3 million per year. The current lease agreementalso provides (i) a 5 -year renewal option for the Company to extend the lease from November 1, 2032 throughOctober 31, 2037 at the fair market rental rate of the premises, and (ii) another 5 -year renewal option to extendthe lease from November 1, 2037 through October 31, 2042 at the fair market rental rate of the premises.
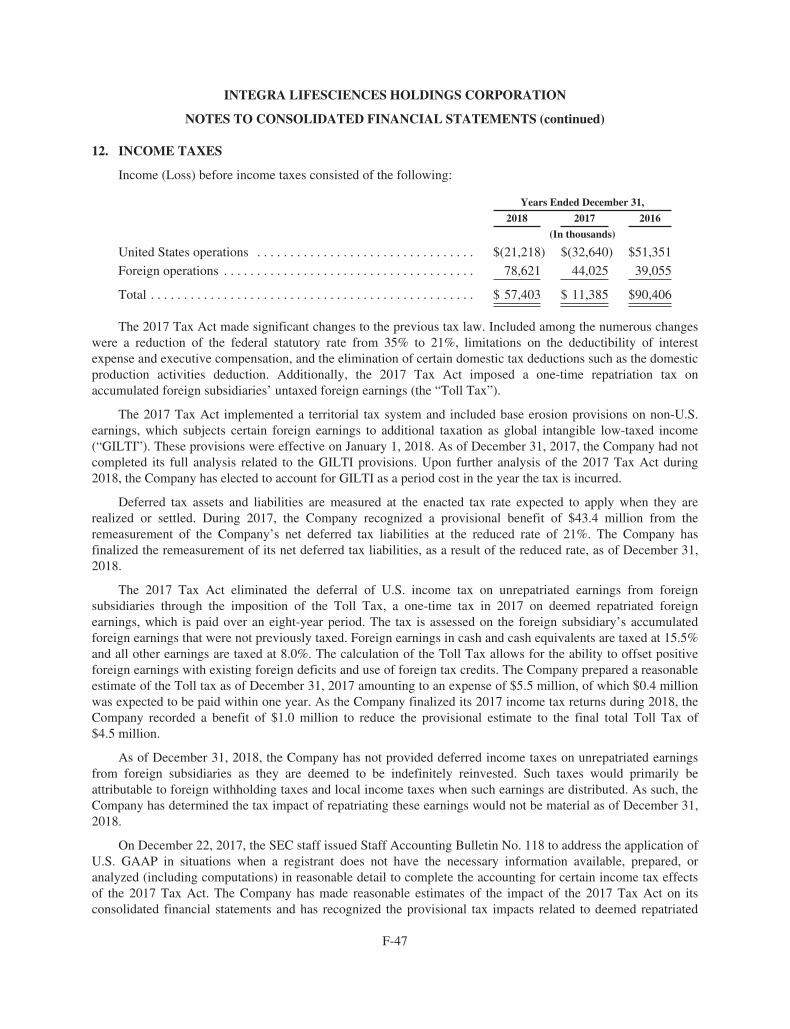
F-47
INTEGRA LIFESCIENCES HOLDINGS CORPORATION
NOTES TO CONSOLIDATED FINANCIAL STATEMENTS (continued)
12. INCOME TAXES
Income (Loss) before income taxes consisted of the following:
Years Ended December 31,
2018 2017 2016
(In thousands)
United States operations . . . . . . . . . . . . . . . . . . . . . . . . . . . . . . . . . $(21,218) $(32,640) $51,351
Foreign operations . . . . . . . . . . . . . . . . . . . . . . . . . . . . . . . . . . . . . . 78,621 44,025 39,055
Total . . . . . . . . . . . . . . . . . . . . . . . . . . . . . . . . . . . . . . . . . . . . . . . . . $ 57,403 $ 11,385 $90,406
The 2017 Tax Act made significant changes to the previous tax law. Included among the numerous changeswere a reduction of the federal statutory rate from 35% to 21%, limitations on the deductibility of interestexpense and executive compensation, and the elimination of certain domestic tax deductions such as the domesticproduction activities deduction. Additionally, the 2017 Tax Act imposed a one-time repatriation tax onaccumulated foreign subsidiaries’ untaxed foreign earnings (the “Toll Tax”).
The 2017 Tax Act implemented a territorial tax system and included base erosion provisions on non-U.S.earnings, which subjects certain foreign earnings to additional taxation as global intangible low-taxed income(“GILTI”). These provisions were effective on January 1, 2018. As of December 31, 2017, the Company had notcompleted its full analysis related to the GILTI provisions. Upon further analysis of the 2017 Tax Act during2018, the Company has elected to account for GILTI as a period cost in the year the tax is incurred.
Deferred tax assets and liabilities are measured at the enacted tax rate expected to apply when they arerealized or settled. During 2017, the Company recognized a provisional benefit of $43.4 million from theremeasurement of the Company’s net deferred tax liabilities at the reduced rate of 21%. The Company hasfinalized the remeasurement of its net deferred tax liabilities, as a result of the reduced rate, as of December 31,2018.
The 2017 Tax Act eliminated the deferral of U.S. income tax on unrepatriated earnings from foreignsubsidiaries through the imposition of the Toll Tax, a one-time tax in 2017 on deemed repatriated foreignearnings, which is paid over an eight-year period. The tax is assessed on the foreign subsidiary’s accumulatedforeign earnings that were not previously taxed. Foreign earnings in cash and cash equivalents are taxed at 15.5%and all other earnings are taxed at 8.0%. The calculation of the Toll Tax allows for the ability to offset positiveforeign earnings with existing foreign deficits and use of foreign tax credits. The Company prepared a reasonableestimate of the Toll tax as of December 31, 2017 amounting to an expense of $5.5 million, of which $0.4 millionwas expected to be paid within one year. As the Company finalized its 2017 income tax returns during 2018, theCompany recorded a benefit of $1.0 million to reduce the provisional estimate to the final total Toll Tax of$4.5 million.
As of December 31, 2018, the Company has not provided deferred income taxes on unrepatriated earningsfrom foreign subsidiaries as they are deemed to be indefinitely reinvested. Such taxes would primarily beattributable to foreign withholding taxes and local income taxes when such earnings are distributed. As such, theCompany has determined the tax impact of repatriating these earnings would not be material as of December 31,2018.
On December 22, 2017, the SEC staff issued Staff Accounting Bulletin No. 118 to address the application ofU.S. GAAP in situations when a registrant does not have the necessary information available, prepared, oranalyzed (including computations) in reasonable detail to complete the accounting for certain income tax effectsof the 2017 Tax Act. The Company has made reasonable estimates of the impact of the 2017 Tax Act on itsconsolidated financial statements and has recognized the provisional tax impacts related to deemed repatriated
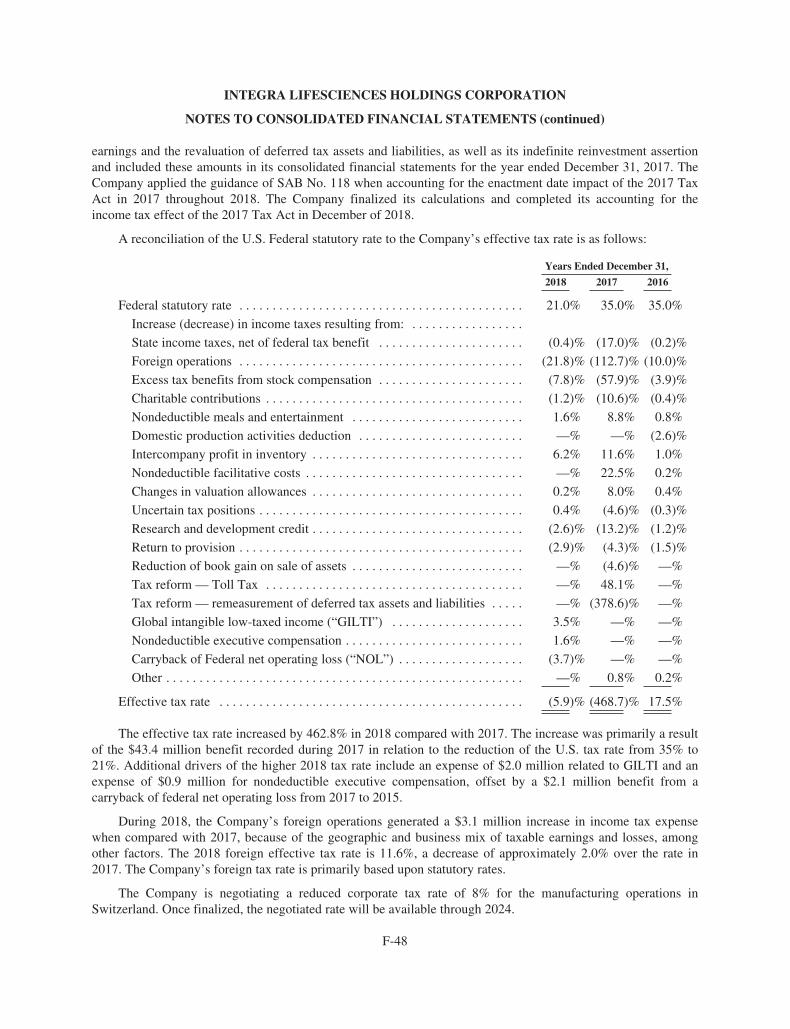
F-48
INTEGRA LIFESCIENCES HOLDINGS CORPORATION
NOTES TO CONSOLIDATED FINANCIAL STATEMENTS (continued)
earnings and the revaluation of deferred tax assets and liabilities, as well as its indefinite reinvestment assertionand included these amounts in its consolidated financial statements for the year ended December 31, 2017. TheCompany applied the guidance of SAB No. 118 when accounting for the enactment date impact of the 2017 TaxAct in 2017 throughout 2018. The Company finalized its calculations and completed its accounting for theincome tax effect of the 2017 Tax Act in December of 2018.
A reconciliation of the U.S. Federal statutory rate to the Company’s effective tax rate is as follows:
Years Ended December 31,
2018 2017 2016
Federal statutory rate . . . . . . . . . . . . . . . . . . . . . . . . . . . . . . . . . . . . . . . . . . . 21.0% 35.0% 35.0%
Increase (decrease) in income taxes resulting from: . . . . . . . . . . . . . . . . .
State income taxes, net of federal tax benefit . . . . . . . . . . . . . . . . . . . . . . (0.4)% (17.0)% (0.2)%
Foreign operations . . . . . . . . . . . . . . . . . . . . . . . . . . . . . . . . . . . . . . . . . . . (21.8)% (112.7)% (10.0)%
Excess tax benefits from stock compensation . . . . . . . . . . . . . . . . . . . . . . (7.8)% (57.9)% (3.9)%
Charitable contributions . . . . . . . . . . . . . . . . . . . . . . . . . . . . . . . . . . . . . . . (1.2)% (10.6)% (0.4)%
Nondeductible meals and entertainment . . . . . . . . . . . . . . . . . . . . . . . . . . 1.6% 8.8% 0.8%
Domestic production activities deduction . . . . . . . . . . . . . . . . . . . . . . . . . —% —% (2.6)%
Intercompany profit in inventory . . . . . . . . . . . . . . . . . . . . . . . . . . . . . . . . 6.2% 11.6% 1.0%
Nondeductible facilitative costs . . . . . . . . . . . . . . . . . . . . . . . . . . . . . . . . . —% 22.5% 0.2%
Changes in valuation allowances . . . . . . . . . . . . . . . . . . . . . . . . . . . . . . . . 0.2% 8.0% 0.4%
Uncertain tax positions . . . . . . . . . . . . . . . . . . . . . . . . . . . . . . . . . . . . . . . . 0.4% (4.6)% (0.3)%
Research and development credit . . . . . . . . . . . . . . . . . . . . . . . . . . . . . . . . (2.6)% (13.2)% (1.2)%
Return to provision . . . . . . . . . . . . . . . . . . . . . . . . . . . . . . . . . . . . . . . . . . . (2.9)% (4.3)% (1.5)%
Reduction of book gain on sale of assets . . . . . . . . . . . . . . . . . . . . . . . . . . —% (4.6)% —%
Tax reform — Toll Tax . . . . . . . . . . . . . . . . . . . . . . . . . . . . . . . . . . . . . . . —% 48.1% —%
Tax reform — remeasurement of deferred tax assets and liabilities . . . . . —% (378.6)% —%
Global intangible low-taxed income (“GILTI”) . . . . . . . . . . . . . . . . . . . . 3.5% —% —%
Nondeductible executive compensation . . . . . . . . . . . . . . . . . . . . . . . . . . . 1.6% —% —%
Carryback of Federal net operating loss (“NOL”) . . . . . . . . . . . . . . . . . . . (3.7)% —% —%
Other . . . . . . . . . . . . . . . . . . . . . . . . . . . . . . . . . . . . . . . . . . . . . . . . . . . . . . —% 0.8% 0.2%
Effective tax rate . . . . . . . . . . . . . . . . . . . . . . . . . . . . . . . . . . . . . . . . . . . . . . (5.9)% (468.7)% 17.5%
The effective tax rate increased by 462.8% in 2018 compared with 2017. The increase was primarily a resultof the $43.4 million benefit recorded during 2017 in relation to the reduction of the U.S. tax rate from 35% to21%. Additional drivers of the higher 2018 tax rate include an expense of $2.0 million related to GILTI and anexpense of $0.9 million for nondeductible executive compensation, offset by a $2.1 million benefit from acarryback of federal net operating loss from 2017 to 2015.
During 2018, the Company’s foreign operations generated a $3.1 million increase in income tax expensewhen compared with 2017, because of the geographic and business mix of taxable earnings and losses, amongother factors. The 2018 foreign effective tax rate is 11.6%, a decrease of approximately 2.0% over the rate in2017. The Company’s foreign tax rate is primarily based upon statutory rates.
The Company is negotiating a reduced corporate tax rate of 8% for the manufacturing operations inSwitzerland. Once finalized, the negotiated rate will be available through 2024.
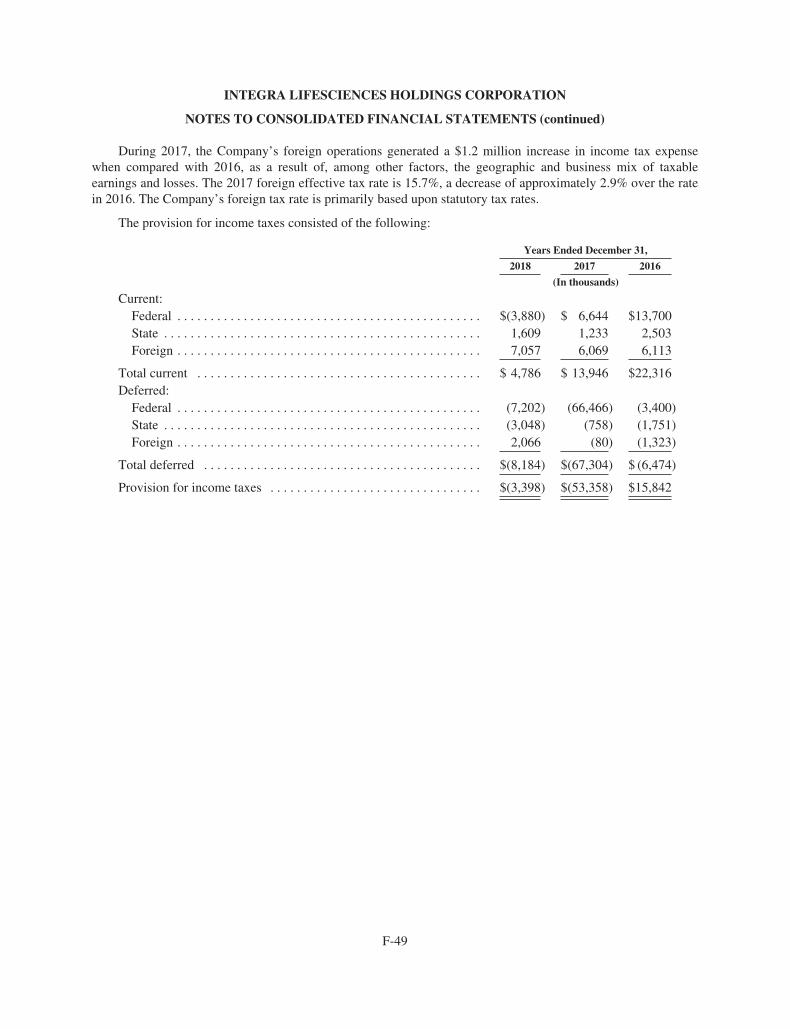
F-49
INTEGRA LIFESCIENCES HOLDINGS CORPORATION
NOTES TO CONSOLIDATED FINANCIAL STATEMENTS (continued)
During 2017, the Company’s foreign operations generated a $1.2 million increase in income tax expensewhen compared with 2016, as a result of, among other factors, the geographic and business mix of taxableearnings and losses. The 2017 foreign effective tax rate is 15.7%, a decrease of approximately 2.9% over the ratein 2016. The Company’s foreign tax rate is primarily based upon statutory tax rates.
The provision for income taxes consisted of the following:
Years Ended December 31,
2018 2017 2016
(In thousands)
Current:Federal . . . . . . . . . . . . . . . . . . . . . . . . . . . . . . . . . . . . . . . . . . . . . . $(3,880) $ 6,644 $13,700State . . . . . . . . . . . . . . . . . . . . . . . . . . . . . . . . . . . . . . . . . . . . . . . . 1,609 1,233 2,503Foreign . . . . . . . . . . . . . . . . . . . . . . . . . . . . . . . . . . . . . . . . . . . . . . 7,057 6,069 6,113
Total current . . . . . . . . . . . . . . . . . . . . . . . . . . . . . . . . . . . . . . . . . . . $ 4,786 $ 13,946 $22,316Deferred:
Federal . . . . . . . . . . . . . . . . . . . . . . . . . . . . . . . . . . . . . . . . . . . . . . (7,202) (66,466) (3,400)State . . . . . . . . . . . . . . . . . . . . . . . . . . . . . . . . . . . . . . . . . . . . . . . . (3,048) (758) (1,751)Foreign . . . . . . . . . . . . . . . . . . . . . . . . . . . . . . . . . . . . . . . . . . . . . . 2,066 (80) (1,323)
Total deferred . . . . . . . . . . . . . . . . . . . . . . . . . . . . . . . . . . . . . . . . . . $(8,184) $(67,304) $ (6,474)
Provision for income taxes . . . . . . . . . . . . . . . . . . . . . . . . . . . . . . . . $(3,398) $(53,358) $15,842
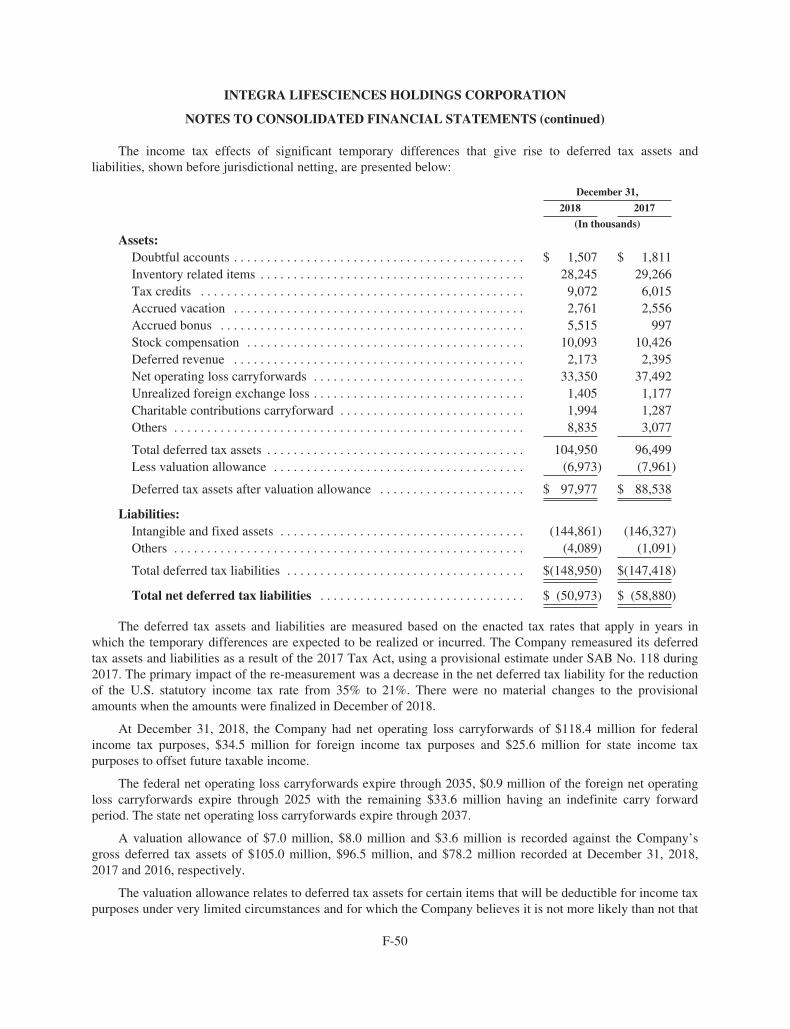
F-50
INTEGRA LIFESCIENCES HOLDINGS CORPORATION
NOTES TO CONSOLIDATED FINANCIAL STATEMENTS (continued)
The income tax effects of significant temporary differences that give rise to deferred tax assets andliabilities, shown before jurisdictional netting, are presented below:
December 31,
2018 2017
(In thousands)
Assets:Doubtful accounts . . . . . . . . . . . . . . . . . . . . . . . . . . . . . . . . . . . . . . . . . . . . $ 1,507 $ 1,811Inventory related items . . . . . . . . . . . . . . . . . . . . . . . . . . . . . . . . . . . . . . . . 28,245 29,266Tax credits . . . . . . . . . . . . . . . . . . . . . . . . . . . . . . . . . . . . . . . . . . . . . . . . . 9,072 6,015Accrued vacation . . . . . . . . . . . . . . . . . . . . . . . . . . . . . . . . . . . . . . . . . . . . 2,761 2,556Accrued bonus . . . . . . . . . . . . . . . . . . . . . . . . . . . . . . . . . . . . . . . . . . . . . . 5,515 997Stock compensation . . . . . . . . . . . . . . . . . . . . . . . . . . . . . . . . . . . . . . . . . . 10,093 10,426Deferred revenue . . . . . . . . . . . . . . . . . . . . . . . . . . . . . . . . . . . . . . . . . . . . 2,173 2,395Net operating loss carryforwards . . . . . . . . . . . . . . . . . . . . . . . . . . . . . . . . 33,350 37,492Unrealized foreign exchange loss . . . . . . . . . . . . . . . . . . . . . . . . . . . . . . . . 1,405 1,177Charitable contributions carryforward . . . . . . . . . . . . . . . . . . . . . . . . . . . . 1,994 1,287Others . . . . . . . . . . . . . . . . . . . . . . . . . . . . . . . . . . . . . . . . . . . . . . . . . . . . . 8,835 3,077
Total deferred tax assets . . . . . . . . . . . . . . . . . . . . . . . . . . . . . . . . . . . . . . . 104,950 96,499Less valuation allowance . . . . . . . . . . . . . . . . . . . . . . . . . . . . . . . . . . . . . . (6,973) (7,961)
Deferred tax assets after valuation allowance . . . . . . . . . . . . . . . . . . . . . . $ 97,977 $ 88,538
Liabilities:Intangible and fixed assets . . . . . . . . . . . . . . . . . . . . . . . . . . . . . . . . . . . . . (144,861) (146,327)Others . . . . . . . . . . . . . . . . . . . . . . . . . . . . . . . . . . . . . . . . . . . . . . . . . . . . . (4,089) (1,091)
Total deferred tax liabilities . . . . . . . . . . . . . . . . . . . . . . . . . . . . . . . . . . . . $(148,950) $(147,418)
Total net deferred tax liabilities . . . . . . . . . . . . . . . . . . . . . . . . . . . . . . . $ (50,973) $ (58,880)
The deferred tax assets and liabilities are measured based on the enacted tax rates that apply in years inwhich the temporary differences are expected to be realized or incurred. The Company remeasured its deferredtax assets and liabilities as a result of the 2017 Tax Act, using a provisional estimate under SAB No. 118 during2017. The primary impact of the re-measurement was a decrease in the net deferred tax liability for the reductionof the U.S. statutory income tax rate from 35% to 21%. There were no material changes to the provisionalamounts when the amounts were finalized in December of 2018.
At December 31, 2018, the Company had net operating loss carryforwards of $118.4 million for federalincome tax purposes, $34.5 million for foreign income tax purposes and $25.6 million for state income taxpurposes to offset future taxable income.
The federal net operating loss carryforwards expire through 2035, $0.9 million of the foreign net operatingloss carryforwards expire through 2025 with the remaining $33.6 million having an indefinite carry forwardperiod. The state net operating loss carryforwards expire through 2037.
A valuation allowance of $7.0 million, $8.0 million and $3.6 million is recorded against the Company’sgross deferred tax assets of $105.0 million, $96.5 million, and $78.2 million recorded at December 31, 2018,2017 and 2016, respectively.
The valuation allowance relates to deferred tax assets for certain items that will be deductible for income taxpurposes under very limited circumstances and for which the Company believes it is not more likely than not that
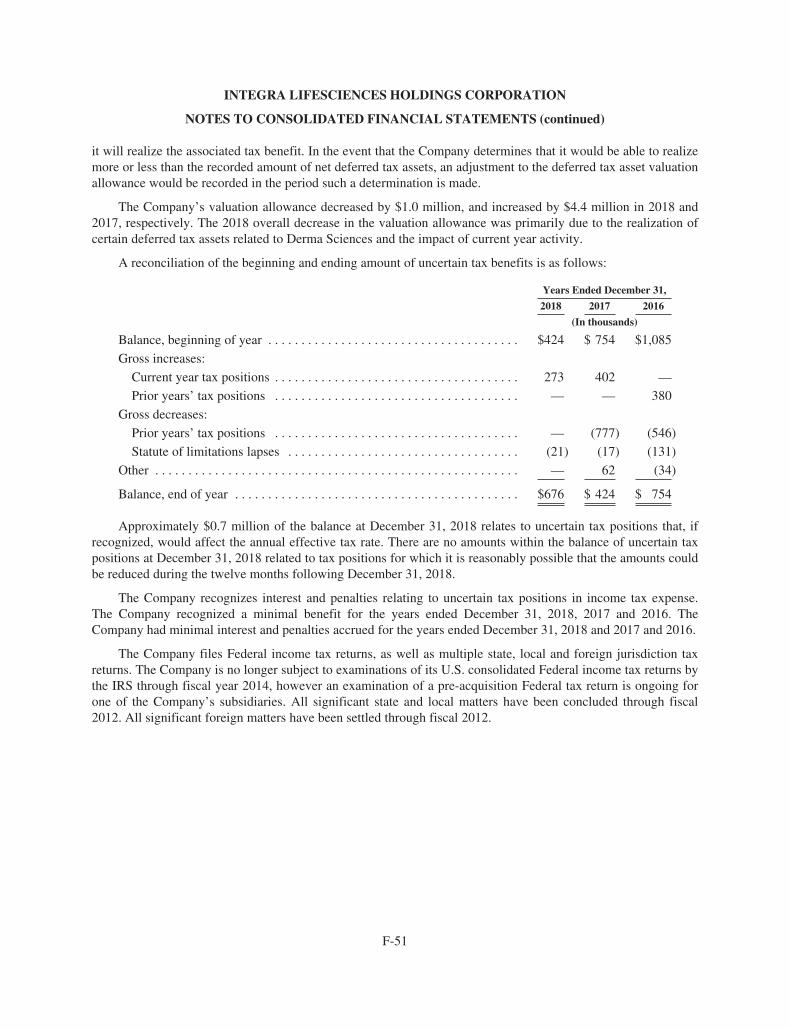
F-51
INTEGRA LIFESCIENCES HOLDINGS CORPORATION
NOTES TO CONSOLIDATED FINANCIAL STATEMENTS (continued)
it will realize the associated tax benefit. In the event that the Company determines that it would be able to realizemore or less than the recorded amount of net deferred tax assets, an adjustment to the deferred tax asset valuationallowance would be recorded in the period such a determination is made.
The Company’s valuation allowance decreased by $1.0 million, and increased by $4.4 million in 2018 and2017, respectively. The 2018 overall decrease in the valuation allowance was primarily due to the realization ofcertain deferred tax assets related to Derma Sciences and the impact of current year activity.
A reconciliation of the beginning and ending amount of uncertain tax benefits is as follows:
Years Ended December 31,
2018 2017 2016
(In thousands)
Balance, beginning of year . . . . . . . . . . . . . . . . . . . . . . . . . . . . . . . . . . . . . . $424 $ 754 $1,085
Gross increases:
Current year tax positions . . . . . . . . . . . . . . . . . . . . . . . . . . . . . . . . . . . . . 273 402 —
Prior years’ tax positions . . . . . . . . . . . . . . . . . . . . . . . . . . . . . . . . . . . . . — — 380
Gross decreases:
Prior years’ tax positions . . . . . . . . . . . . . . . . . . . . . . . . . . . . . . . . . . . . . — (777) (546)
Statute of limitations lapses . . . . . . . . . . . . . . . . . . . . . . . . . . . . . . . . . . . (21) (17) (131)
Other . . . . . . . . . . . . . . . . . . . . . . . . . . . . . . . . . . . . . . . . . . . . . . . . . . . . . . . — 62 (34)
Balance, end of year . . . . . . . . . . . . . . . . . . . . . . . . . . . . . . . . . . . . . . . . . . . $676 $ 424 $ 754
Approximately $0.7 million of the balance at December 31, 2018 relates to uncertain tax positions that, ifrecognized, would affect the annual effective tax rate. There are no amounts within the balance of uncertain taxpositions at December 31, 2018 related to tax positions for which it is reasonably possible that the amounts couldbe reduced during the twelve months following December 31, 2018.
The Company recognizes interest and penalties relating to uncertain tax positions in income tax expense.The Company recognized a minimal benefit for the years ended December 31, 2018, 2017 and 2016. TheCompany had minimal interest and penalties accrued for the years ended December 31, 2018 and 2017 and 2016.
The Company files Federal income tax returns, as well as multiple state, local and foreign jurisdiction taxreturns. The Company is no longer subject to examinations of its U.S. consolidated Federal income tax returns bythe IRS through fiscal year 2014, however an examination of a pre-acquisition Federal tax return is ongoing forone of the Company’s subsidiaries. All significant state and local matters have been concluded through fiscal2012. All significant foreign matters have been settled through fiscal 2012.
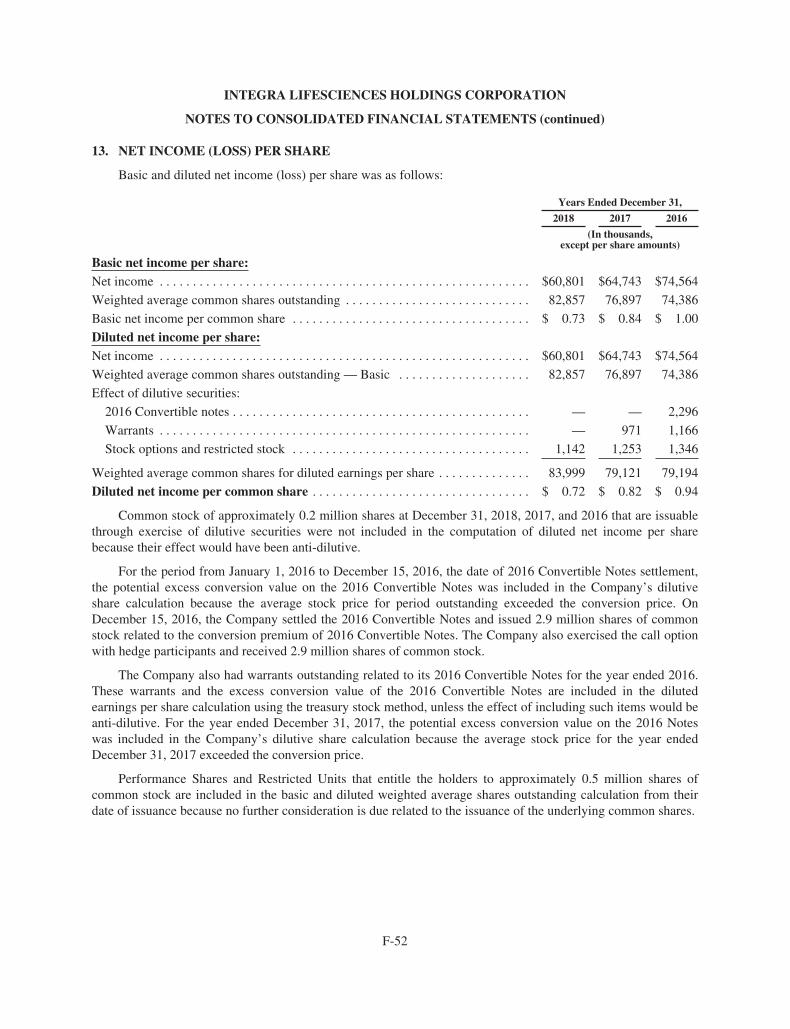
F-52
INTEGRA LIFESCIENCES HOLDINGS CORPORATION
NOTES TO CONSOLIDATED FINANCIAL STATEMENTS (continued)
13. NET INCOME (LOSS) PER SHARE
Basic and diluted net income (loss) per share was as follows:
Years Ended December 31,
2018 2017 2016
(In thousands,except per share amounts)
Basic net income per share:Net income . . . . . . . . . . . . . . . . . . . . . . . . . . . . . . . . . . . . . . . . . . . . . . . . . . . . . . . . $60,801 $64,743 $74,564
Weighted average common shares outstanding . . . . . . . . . . . . . . . . . . . . . . . . . . . . 82,857 76,897 74,386
Basic net income per common share . . . . . . . . . . . . . . . . . . . . . . . . . . . . . . . . . . . . $ 0.73 $ 0.84 $ 1.00
Diluted net income per share:Net income . . . . . . . . . . . . . . . . . . . . . . . . . . . . . . . . . . . . . . . . . . . . . . . . . . . . . . . . $60,801 $64,743 $74,564
Weighted average common shares outstanding — Basic . . . . . . . . . . . . . . . . . . . . 82,857 76,897 74,386
Effect of dilutive securities:
2016 Convertible notes . . . . . . . . . . . . . . . . . . . . . . . . . . . . . . . . . . . . . . . . . . . . . — — 2,296
Warrants . . . . . . . . . . . . . . . . . . . . . . . . . . . . . . . . . . . . . . . . . . . . . . . . . . . . . . . . — 971 1,166
Stock options and restricted stock . . . . . . . . . . . . . . . . . . . . . . . . . . . . . . . . . . . . 1,142 1,253 1,346
Weighted average common shares for diluted earnings per share . . . . . . . . . . . . . . 83,999 79,121 79,194
Diluted net income per common share . . . . . . . . . . . . . . . . . . . . . . . . . . . . . . . . . $ 0.72 $ 0.82 $ 0.94
Common stock of approximately 0.2 million shares at December 31, 2018, 2017, and 2016 that are issuablethrough exercise of dilutive securities were not included in the computation of diluted net income per sharebecause their effect would have been anti-dilutive.
For the period from January 1, 2016 to December 15, 2016, the date of 2016 Convertible Notes settlement,the potential excess conversion value on the 2016 Convertible Notes was included in the Company’s dilutiveshare calculation because the average stock price for period outstanding exceeded the conversion price. OnDecember 15, 2016, the Company settled the 2016 Convertible Notes and issued 2.9 million shares of commonstock related to the conversion premium of 2016 Convertible Notes. The Company also exercised the call optionwith hedge participants and received 2.9 million shares of common stock.
The Company also had warrants outstanding related to its 2016 Convertible Notes for the year ended 2016.These warrants and the excess conversion value of the 2016 Convertible Notes are included in the dilutedearnings per share calculation using the treasury stock method, unless the effect of including such items would beanti-dilutive. For the year ended December 31, 2017, the potential excess conversion value on the 2016 Noteswas included in the Company’s dilutive share calculation because the average stock price for the year endedDecember 31, 2017 exceeded the conversion price.
Performance Shares and Restricted Units that entitle the holders to approximately 0.5 million shares ofcommon stock are included in the basic and diluted weighted average shares outstanding calculation from theirdate of issuance because no further consideration is due related to the issuance of the underlying common shares.
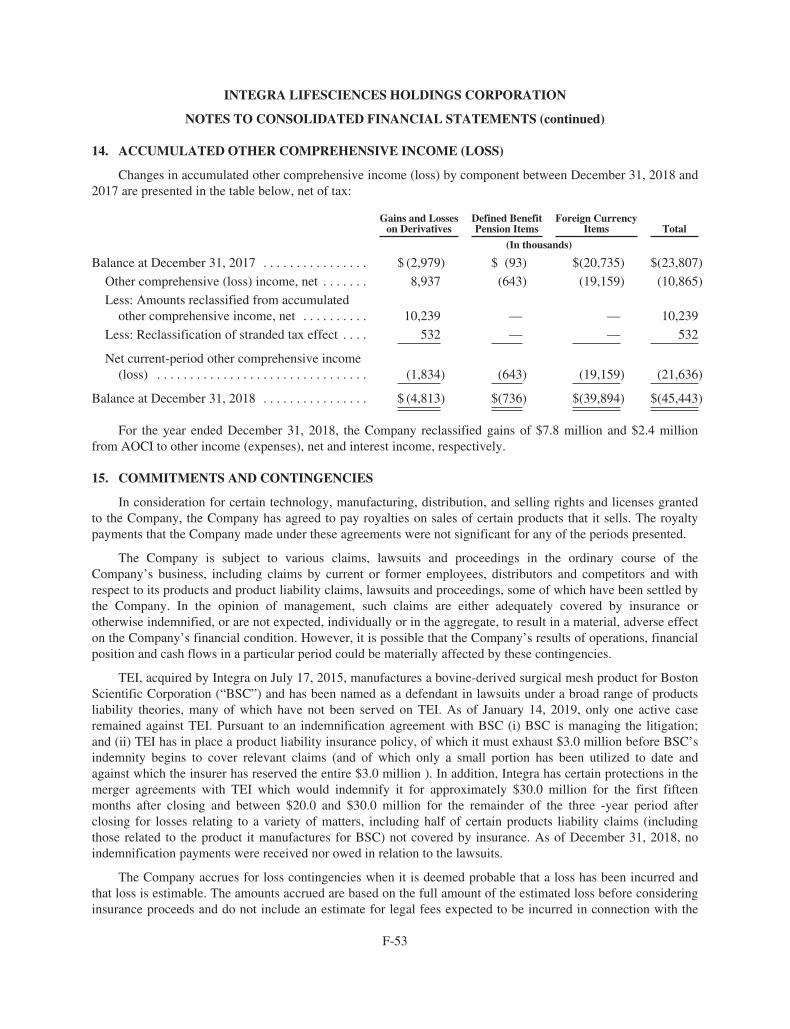
F-53
INTEGRA LIFESCIENCES HOLDINGS CORPORATION
NOTES TO CONSOLIDATED FINANCIAL STATEMENTS (continued)
14. ACCUMULATED OTHER COMPREHENSIVE INCOME (LOSS)
Changes in accumulated other comprehensive income (loss) by component between December 31, 2018 and2017 are presented in the table below, net of tax:
Gains and Losseson Derivatives
Defined BenefitPension Items
Foreign CurrencyItems Total
(In thousands)
Balance at December 31, 2017 . . . . . . . . . . . . . . . . $ (2,979) $ (93) $(20,735) $(23,807)
Other comprehensive (loss) income, net . . . . . . . 8,937 (643) (19,159) (10,865)
Less: Amounts reclassified from accumulatedother comprehensive income, net . . . . . . . . . . 10,239 — — 10,239
Less: Reclassification of stranded tax effect . . . . 532 — — 532
Net current-period other comprehensive income(loss) . . . . . . . . . . . . . . . . . . . . . . . . . . . . . . . . (1,834) (643) (19,159) (21,636)
Balance at December 31, 2018 . . . . . . . . . . . . . . . . $ (4,813) $(736) $(39,894) $(45,443)
For the year ended December 31, 2018, the Company reclassified gains of $7.8 million and $2.4 millionfrom AOCI to other income (expenses), net and interest income, respectively.
15. COMMITMENTS AND CONTINGENCIES
In consideration for certain technology, manufacturing, distribution, and selling rights and licenses grantedto the Company, the Company has agreed to pay royalties on sales of certain products that it sells. The royaltypayments that the Company made under these agreements were not significant for any of the periods presented.
The Company is subject to various claims, lawsuits and proceedings in the ordinary course of theCompany’s business, including claims by current or former employees, distributors and competitors and withrespect to its products and product liability claims, lawsuits and proceedings, some of which have been settled bythe Company. In the opinion of management, such claims are either adequately covered by insurance orotherwise indemnified, or are not expected, individually or in the aggregate, to result in a material, adverse effecton the Company’s financial condition. However, it is possible that the Company’s results of operations, financialposition and cash flows in a particular period could be materially affected by these contingencies.
TEI, acquired by Integra on July 17, 2015, manufactures a bovine-derived surgical mesh product for BostonScientific Corporation (“BSC”) and has been named as a defendant in lawsuits under a broad range of productsliability theories, many of which have not been served on TEI. As of January 14, 2019, only one active caseremained against TEI. Pursuant to an indemnification agreement with BSC (i) BSC is managing the litigation;and (ii) TEI has in place a product liability insurance policy, of which it must exhaust $3.0 million before BSC’sindemnity begins to cover relevant claims (and of which only a small portion has been utilized to date andagainst which the insurer has reserved the entire $3.0 million ). In addition, Integra has certain protections in themerger agreements with TEI which would indemnify it for approximately $30.0 million for the first fifteenmonths after closing and between $20.0 and $30.0 million for the remainder of the three -year period afterclosing for losses relating to a variety of matters, including half of certain products liability claims (includingthose related to the product it manufactures for BSC) not covered by insurance. As of December 31, 2018, noindemnification payments were received nor owed in relation to the lawsuits.
The Company accrues for loss contingencies when it is deemed probable that a loss has been incurred andthat loss is estimable. The amounts accrued are based on the full amount of the estimated loss before consideringinsurance proceeds and do not include an estimate for legal fees expected to be incurred in connection with the
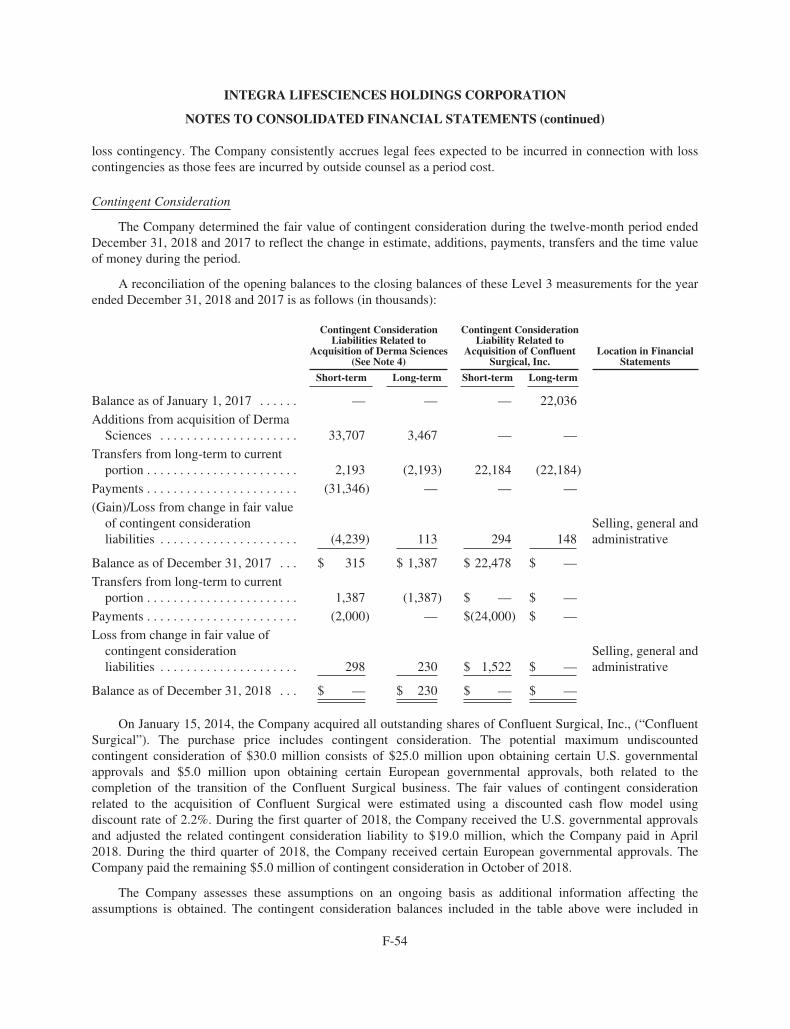
F-54
INTEGRA LIFESCIENCES HOLDINGS CORPORATION
NOTES TO CONSOLIDATED FINANCIAL STATEMENTS (continued)
loss contingency. The Company consistently accrues legal fees expected to be incurred in connection with losscontingencies as those fees are incurred by outside counsel as a period cost.
Contingent Consideration
The Company determined the fair value of contingent consideration during the twelve-month period endedDecember 31, 2018 and 2017 to reflect the change in estimate, additions, payments, transfers and the time valueof money during the period.
A reconciliation of the opening balances to the closing balances of these Level 3 measurements for the yearended December 31, 2018 and 2017 is as follows (in thousands):
Contingent ConsiderationLiabilities Related to
Acquisition of Derma Sciences(See Note 4)
Contingent ConsiderationLiability Related to
Acquisition of ConfluentSurgical, Inc.
Location in FinancialStatements
Short-term Long-term Short-term Long-term
Balance as of January 1, 2017 . . . . . . — — — 22,036
Additions from acquisition of DermaSciences . . . . . . . . . . . . . . . . . . . . . 33,707 3,467 — —
Transfers from long-term to currentportion . . . . . . . . . . . . . . . . . . . . . . . 2,193 (2,193) 22,184 (22,184)
Payments . . . . . . . . . . . . . . . . . . . . . . . (31,346) — — —
(Gain)/Loss from change in fair valueof contingent considerationliabilities . . . . . . . . . . . . . . . . . . . . . (4,239) 113 294 148
Selling, general andadministrative
Balance as of December 31, 2017 . . . $ 315 $ 1,387 $ 22,478 $ —
Transfers from long-term to currentportion . . . . . . . . . . . . . . . . . . . . . . . 1,387 (1,387) $ — $ —
Payments . . . . . . . . . . . . . . . . . . . . . . . (2,000) — $(24,000) $ —
Loss from change in fair value ofcontingent considerationliabilities . . . . . . . . . . . . . . . . . . . . . 298 230 $ 1,522 $ —
Selling, general andadministrative
Balance as of December 31, 2018 . . . $ — $ 230 $ — $ —
On January 15, 2014, the Company acquired all outstanding shares of Confluent Surgical, Inc., (“ConfluentSurgical”). The purchase price includes contingent consideration. The potential maximum undiscountedcontingent consideration of $30.0 million consists of $25.0 million upon obtaining certain U.S. governmentalapprovals and $5.0 million upon obtaining certain European governmental approvals, both related to thecompletion of the transition of the Confluent Surgical business. The fair values of contingent considerationrelated to the acquisition of Confluent Surgical were estimated using a discounted cash flow model usingdiscount rate of 2.2%. During the first quarter of 2018, the Company received the U.S. governmental approvalsand adjusted the related contingent consideration liability to $19.0 million, which the Company paid in April2018. During the third quarter of 2018, the Company received certain European governmental approvals. TheCompany paid the remaining $5.0 million of contingent consideration in October of 2018.
The Company assesses these assumptions on an ongoing basis as additional information affecting theassumptions is obtained. The contingent consideration balances included in the table above were included in
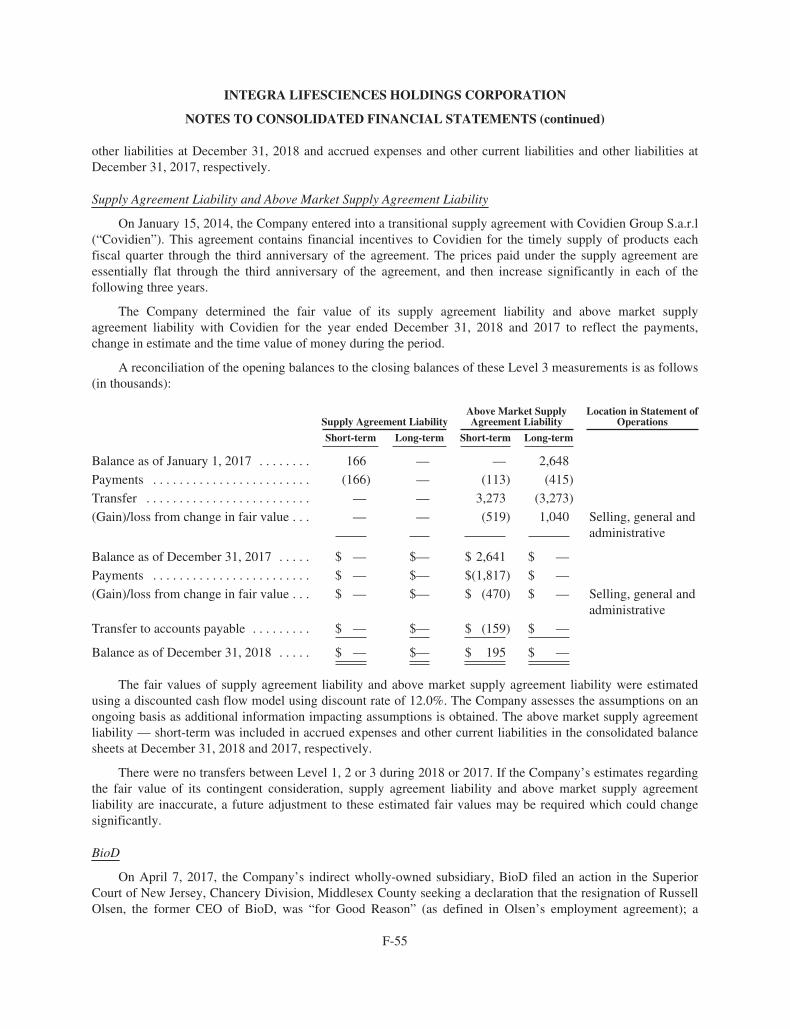
F-55
INTEGRA LIFESCIENCES HOLDINGS CORPORATION
NOTES TO CONSOLIDATED FINANCIAL STATEMENTS (continued)
other liabilities at December 31, 2018 and accrued expenses and other current liabilities and other liabilities atDecember 31, 2017, respectively.
Supply Agreement Liability and Above Market Supply Agreement Liability
On January 15, 2014, the Company entered into a transitional supply agreement with Covidien Group S.a.r.l(“Covidien”). This agreement contains financial incentives to Covidien for the timely supply of products eachfiscal quarter through the third anniversary of the agreement. The prices paid under the supply agreement areessentially flat through the third anniversary of the agreement, and then increase significantly in each of thefollowing three years.
The Company determined the fair value of its supply agreement liability and above market supplyagreement liability with Covidien for the year ended December 31, 2018 and 2017 to reflect the payments,change in estimate and the time value of money during the period.
A reconciliation of the opening balances to the closing balances of these Level 3 measurements is as follows(in thousands):
Supply Agreement LiabilityAbove Market SupplyAgreement Liability
Location in Statement ofOperations
Short-term Long-term Short-term Long-term
Balance as of January 1, 2017 . . . . . . . . 166 — — 2,648
Payments . . . . . . . . . . . . . . . . . . . . . . . . (166) — (113) (415)
Transfer . . . . . . . . . . . . . . . . . . . . . . . . . — — 3,273 (3,273)
(Gain)/loss from change in fair value . . . — — (519) 1,040 Selling, general andadministrative
Balance as of December 31, 2017 . . . . . $ — $— $ 2,641 $ —
Payments . . . . . . . . . . . . . . . . . . . . . . . . $ — $— $(1,817) $ —
(Gain)/loss from change in fair value . . . $ — $— $ (470) $ — Selling, general andadministrative
Transfer to accounts payable . . . . . . . . . $ — $— $ (159) $ —
Balance as of December 31, 2018 . . . . . $ — $— $ 195 $ —
The fair values of supply agreement liability and above market supply agreement liability were estimatedusing a discounted cash flow model using discount rate of 12.0%. The Company assesses the assumptions on anongoing basis as additional information impacting assumptions is obtained. The above market supply agreementliability — short-term was included in accrued expenses and other current liabilities in the consolidated balancesheets at December 31, 2018 and 2017, respectively.
There were no transfers between Level 1, 2 or 3 during 2018 or 2017. If the Company’s estimates regardingthe fair value of its contingent consideration, supply agreement liability and above market supply agreementliability are inaccurate, a future adjustment to these estimated fair values may be required which could changesignificantly.
BioD
On April 7, 2017, the Company’s indirect wholly-owned subsidiary, BioD filed an action in the SuperiorCourt of New Jersey, Chancery Division, Middlesex County seeking a declaration that the resignation of RussellOlsen, the former CEO of BioD, was “for Good Reason” (as defined in Olsen’s employment agreement); a
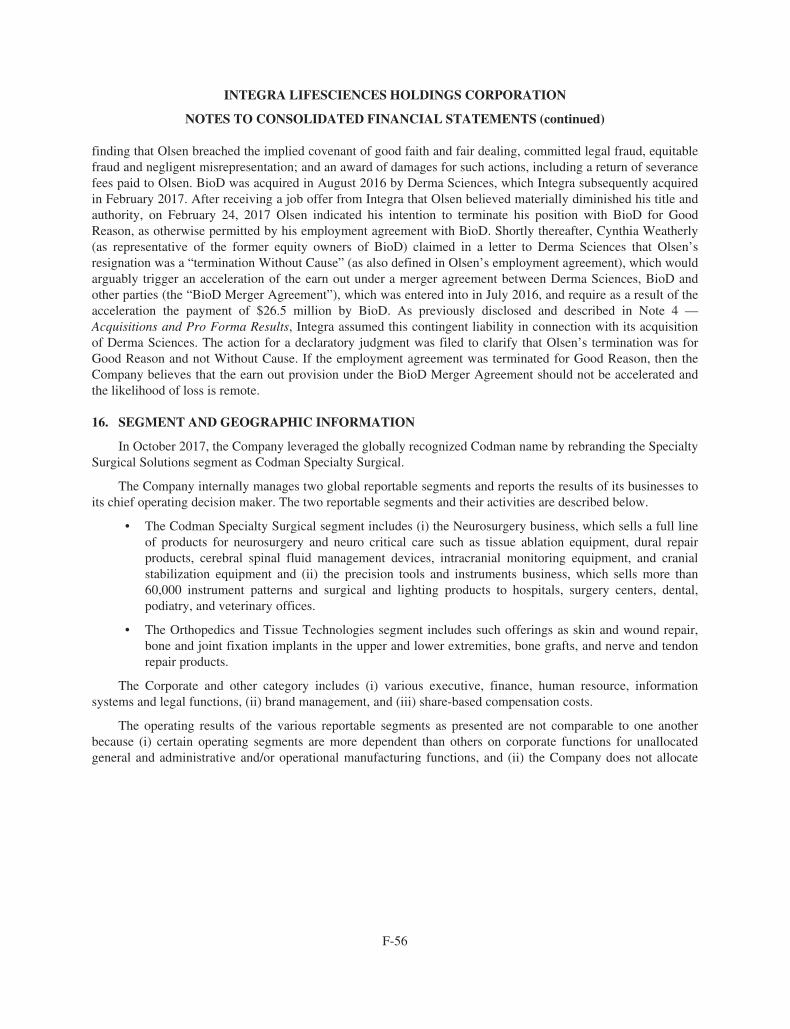
F-56
INTEGRA LIFESCIENCES HOLDINGS CORPORATION
NOTES TO CONSOLIDATED FINANCIAL STATEMENTS (continued)
finding that Olsen breached the implied covenant of good faith and fair dealing, committed legal fraud, equitablefraud and negligent misrepresentation; and an award of damages for such actions, including a return of severancefees paid to Olsen. BioD was acquired in August 2016 by Derma Sciences, which Integra subsequently acquiredin February 2017. After receiving a job offer from Integra that Olsen believed materially diminished his title andauthority, on February 24, 2017 Olsen indicated his intention to terminate his position with BioD for GoodReason, as otherwise permitted by his employment agreement with BioD. Shortly thereafter, Cynthia Weatherly(as representative of the former equity owners of BioD) claimed in a letter to Derma Sciences that Olsen’sresignation was a “termination Without Cause” (as also defined in Olsen’s employment agreement), which wouldarguably trigger an acceleration of the earn out under a merger agreement between Derma Sciences, BioD andother parties (the “BioD Merger Agreement”), which was entered into in July 2016, and require as a result of theacceleration the payment of $26.5 million by BioD. As previously disclosed and described in Note 4 —Acquisitions and Pro Forma Results, Integra assumed this contingent liability in connection with its acquisitionof Derma Sciences. The action for a declaratory judgment was filed to clarify that Olsen’s termination was forGood Reason and not Without Cause. If the employment agreement was terminated for Good Reason, then theCompany believes that the earn out provision under the BioD Merger Agreement should not be accelerated andthe likelihood of loss is remote.
16. SEGMENT AND GEOGRAPHIC INFORMATION
In October 2017, the Company leveraged the globally recognized Codman name by rebranding the SpecialtySurgical Solutions segment as Codman Specialty Surgical.
The Company internally manages two global reportable segments and reports the results of its businesses toits chief operating decision maker. The two reportable segments and their activities are described below.
• The Codman Specialty Surgical segment includes (i) the Neurosurgery business, which sells a full lineof products for neurosurgery and neuro critical care such as tissue ablation equipment, dural repairproducts, cerebral spinal fluid management devices, intracranial monitoring equipment, and cranialstabilization equipment and (ii) the precision tools and instruments business, which sells more than60,000 instrument patterns and surgical and lighting products to hospitals, surgery centers, dental,podiatry, and veterinary offices.
• The Orthopedics and Tissue Technologies segment includes such offerings as skin and wound repair,bone and joint fixation implants in the upper and lower extremities, bone grafts, and nerve and tendonrepair products.
The Corporate and other category includes (i) various executive, finance, human resource, informationsystems and legal functions, (ii) brand management, and (iii) share-based compensation costs.
The operating results of the various reportable segments as presented are not comparable to one anotherbecause (i) certain operating segments are more dependent than others on corporate functions for unallocatedgeneral and administrative and/or operational manufacturing functions, and (ii) the Company does not allocate
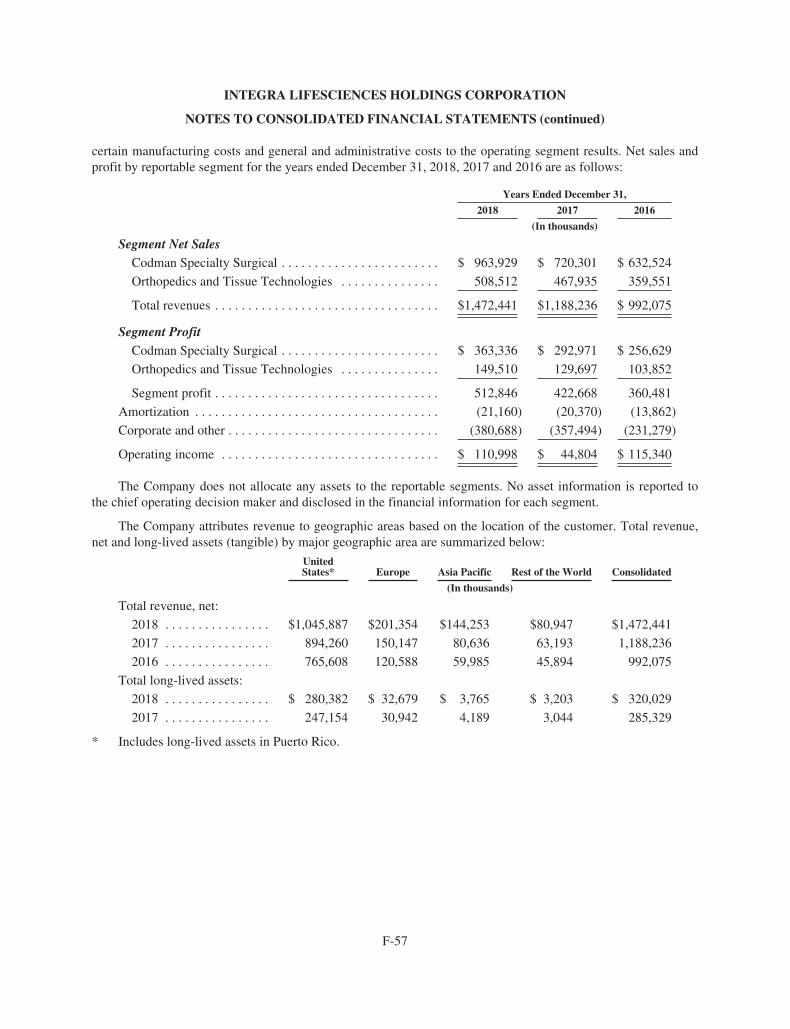
F-57
INTEGRA LIFESCIENCES HOLDINGS CORPORATION
NOTES TO CONSOLIDATED FINANCIAL STATEMENTS (continued)
certain manufacturing costs and general and administrative costs to the operating segment results. Net sales andprofit by reportable segment for the years ended December 31, 2018, 2017 and 2016 are as follows:
Years Ended December 31,
2018 2017 2016
(In thousands)
Segment Net SalesCodman Specialty Surgical . . . . . . . . . . . . . . . . . . . . . . . . $ 963,929 $ 720,301 $ 632,524
Orthopedics and Tissue Technologies . . . . . . . . . . . . . . . 508,512 467,935 359,551
Total revenues . . . . . . . . . . . . . . . . . . . . . . . . . . . . . . . . . . $1,472,441 $1,188,236 $ 992,075
Segment ProfitCodman Specialty Surgical . . . . . . . . . . . . . . . . . . . . . . . . $ 363,336 $ 292,971 $ 256,629
Orthopedics and Tissue Technologies . . . . . . . . . . . . . . . 149,510 129,697 103,852
Segment profit . . . . . . . . . . . . . . . . . . . . . . . . . . . . . . . . . . 512,846 422,668 360,481
Amortization . . . . . . . . . . . . . . . . . . . . . . . . . . . . . . . . . . . . . (21,160) (20,370) (13,862)
Corporate and other . . . . . . . . . . . . . . . . . . . . . . . . . . . . . . . . (380,688) (357,494) (231,279)
Operating income . . . . . . . . . . . . . . . . . . . . . . . . . . . . . . . . . $ 110,998 $ 44,804 $ 115,340
The Company does not allocate any assets to the reportable segments. No asset information is reported tothe chief operating decision maker and disclosed in the financial information for each segment.
The Company attributes revenue to geographic areas based on the location of the customer. Total revenue,net and long-lived assets (tangible) by major geographic area are summarized below:
UnitedStates* Europe Asia Pacific Rest of the World Consolidated
(In thousands)
Total revenue, net:
2018 . . . . . . . . . . . . . . . . $1,045,887 $201,354 $144,253 $80,947 $1,472,441
2017 . . . . . . . . . . . . . . . . 894,260 150,147 80,636 63,193 1,188,236
2016 . . . . . . . . . . . . . . . . 765,608 120,588 59,985 45,894 992,075
Total long-lived assets:
2018 . . . . . . . . . . . . . . . . $ 280,382 $ 32,679 $ 3,765 $ 3,203 $ 320,029
2017 . . . . . . . . . . . . . . . . 247,154 30,942 4,189 3,044 285,329
* Includes long-lived assets in Puerto Rico.
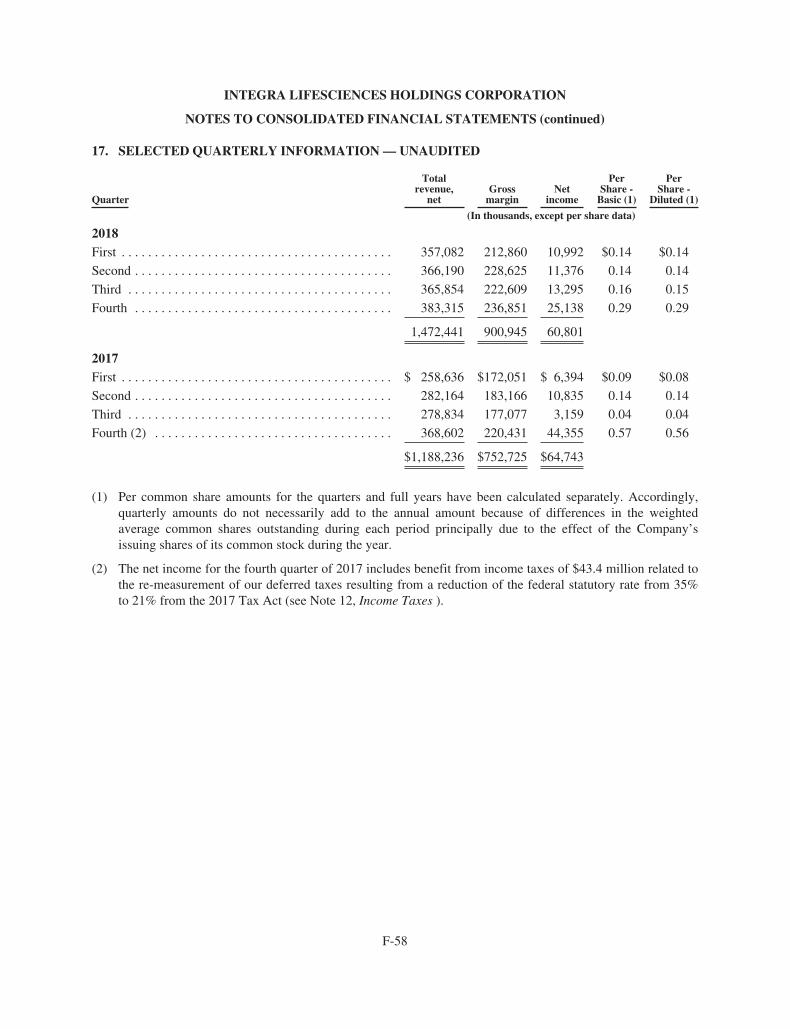
F-58
INTEGRA LIFESCIENCES HOLDINGS CORPORATION
NOTES TO CONSOLIDATED FINANCIAL STATEMENTS (continued)
17. SELECTED QUARTERLY INFORMATION — UNAUDITED
Quarter
Totalrevenue,
netGross
marginNet
income
PerShare -
Basic (1)
PerShare -
Diluted (1)
(In thousands, except per share data)
2018First . . . . . . . . . . . . . . . . . . . . . . . . . . . . . . . . . . . . . . . . . 357,082 212,860 10,992 $0.14 $0.14
Second . . . . . . . . . . . . . . . . . . . . . . . . . . . . . . . . . . . . . . . 366,190 228,625 11,376 0.14 0.14
Third . . . . . . . . . . . . . . . . . . . . . . . . . . . . . . . . . . . . . . . . 365,854 222,609 13,295 0.16 0.15
Fourth . . . . . . . . . . . . . . . . . . . . . . . . . . . . . . . . . . . . . . . 383,315 236,851 25,138 0.29 0.29
1,472,441 900,945 60,801
2017First . . . . . . . . . . . . . . . . . . . . . . . . . . . . . . . . . . . . . . . . . $ 258,636 $172,051 $ 6,394 $0.09 $0.08
Second . . . . . . . . . . . . . . . . . . . . . . . . . . . . . . . . . . . . . . . 282,164 183,166 10,835 0.14 0.14
Third . . . . . . . . . . . . . . . . . . . . . . . . . . . . . . . . . . . . . . . . 278,834 177,077 3,159 0.04 0.04
Fourth (2) . . . . . . . . . . . . . . . . . . . . . . . . . . . . . . . . . . . . 368,602 220,431 44,355 0.57 0.56
$1,188,236 $752,725 $64,743
(1) Per common share amounts for the quarters and full years have been calculated separately. Accordingly,quarterly amounts do not necessarily add to the annual amount because of differences in the weightedaverage common shares outstanding during each period principally due to the effect of the Company’sissuing shares of its common stock during the year.
(2) The net income for the fourth quarter of 2017 includes benefit from income taxes of $43.4 million related tothe re-measurement of our deferred taxes resulting from a reduction of the federal statutory rate from 35%to 21% from the 2017 Tax Act (see Note 12, Income Taxes ).
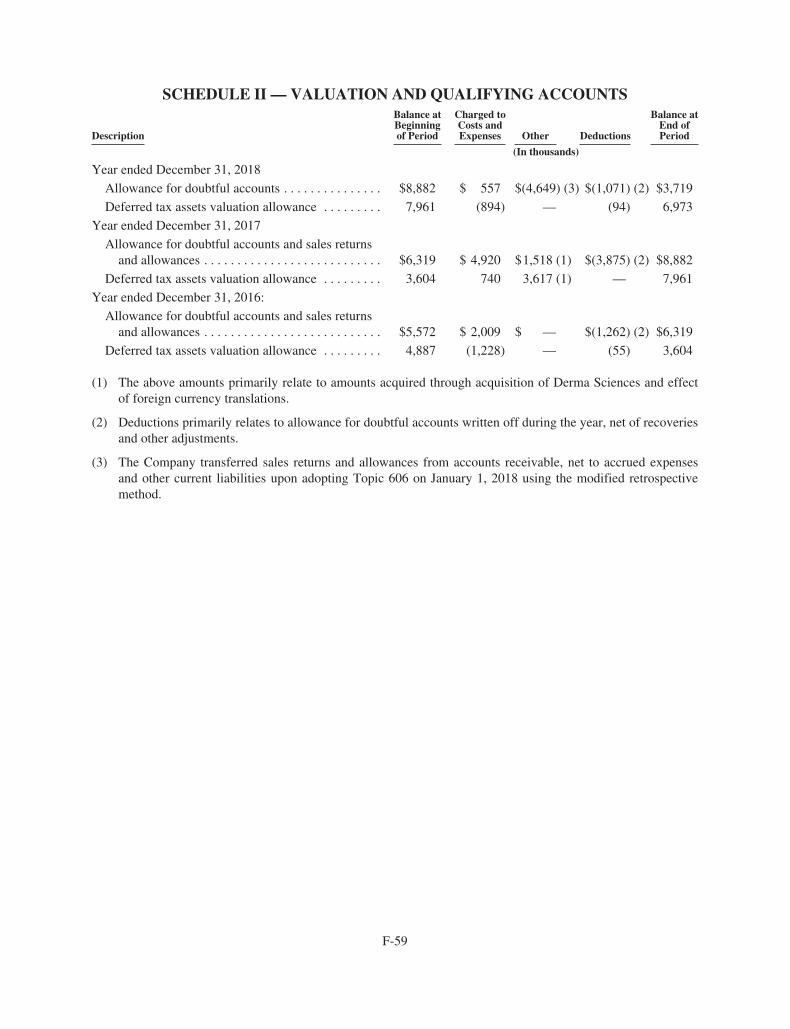
F-59
SCHEDULE II — VALUATION AND QUALIFYING ACCOUNTS
Description
Balance atBeginningof Period
Charged toCosts andExpenses Other Deductions
Balance atEnd ofPeriod
(In thousands)
Year ended December 31, 2018
Allowance for doubtful accounts . . . . . . . . . . . . . . . $8,882 $ 557 $(4,649) (3) $(1,071) (2) $3,719
Deferred tax assets valuation allowance . . . . . . . . . 7,961 (894) — (94) 6,973
Year ended December 31, 2017
Allowance for doubtful accounts and sales returnsand allowances . . . . . . . . . . . . . . . . . . . . . . . . . . . $6,319 $ 4,920 $1,518 (1) $(3,875) (2) $8,882
Deferred tax assets valuation allowance . . . . . . . . . 3,604 740 3,617 (1) — 7,961
Year ended December 31, 2016:
Allowance for doubtful accounts and sales returnsand allowances . . . . . . . . . . . . . . . . . . . . . . . . . . . $5,572 $ 2,009 $ — $(1,262) (2) $6,319
Deferred tax assets valuation allowance . . . . . . . . . 4,887 (1,228) — (55) 3,604
(1) The above amounts primarily relate to amounts acquired through acquisition of Derma Sciences and effectof foreign currency translations.
(2) Deductions primarily relates to allowance for doubtful accounts written off during the year, net of recoveriesand other adjustments.
(3) The Company transferred sales returns and allowances from accounts receivable, net to accrued expensesand other current liabilities upon adopting Topic 606 on January 1, 2018 using the modified retrospectivemethod.

[THIS PAGE INTENTIONALLY LEFT BLANK]

[THIS PAGE INTENTIONALLY LEFT BLANK]

[THIS PAGE INTENTIONALLY LEFT BLANK]

For 30 years, Integra has made life-saving and life-enhancing products that have helped millions of people around the world. Our 4,500 colleagues have contributed to improving our environment, maintaining the health and safety of our colleagues, promoting diversity and inclusion in our culture, giving back to our communities, and complying with regulatory and government standards. We abide by a strong ethical code of conduct that guides our business and inspires us to do well by doing good for our shareholders, our colleagues, our customers, and our patients every day.
Enhancing the quality of lives is not only our business, but it is also our responsibility
Judith E. O’Grady,R.N., M.S.N., R.A.C.Corporate Vice President, Global Regulatory Affairs
One of the first Integra colleagues

CUTTING BACK ONELECTRICITY CONSUMPTION
Integra LifeSciences has committed to installing energy-efficient lighting and using light motion sensors to help conserve energy in its global facilities. Many of our newer Integra facilities in the United States, Europe, Asia, Middle East and Africa have already adopted this practice and begun minimizing their environmental impact on energy consumption.
LEED CERTIFICATION
As we stand up new facilities and renovate current facilities, we aim to achieve LEED-certified facilities throughout the United States. LEED is a top rating system that analyzes green building design and construction to ensure that buildings have a positive impact on people and the planet. Our soon-to-be worldwide headquarters in Princeton, New Jersey, is a LEED-certified building.
REDUCING GREENHOUSEGAS EMISSIONS
As stewards of the environment in which we live and work, Integra is doing its part to reduce greenhouse gas emissions from its more than 30 locations around the world to help decrease pollution, improve global water supply, and slow down the effects of climate change.“We know our
environmental impact and
responsibility does not end once our
products leave the plant. We believe we have an important
role to play to make the world a greener, safer and healthier
place to live.”
Pierre De TaillandierPlant Manager
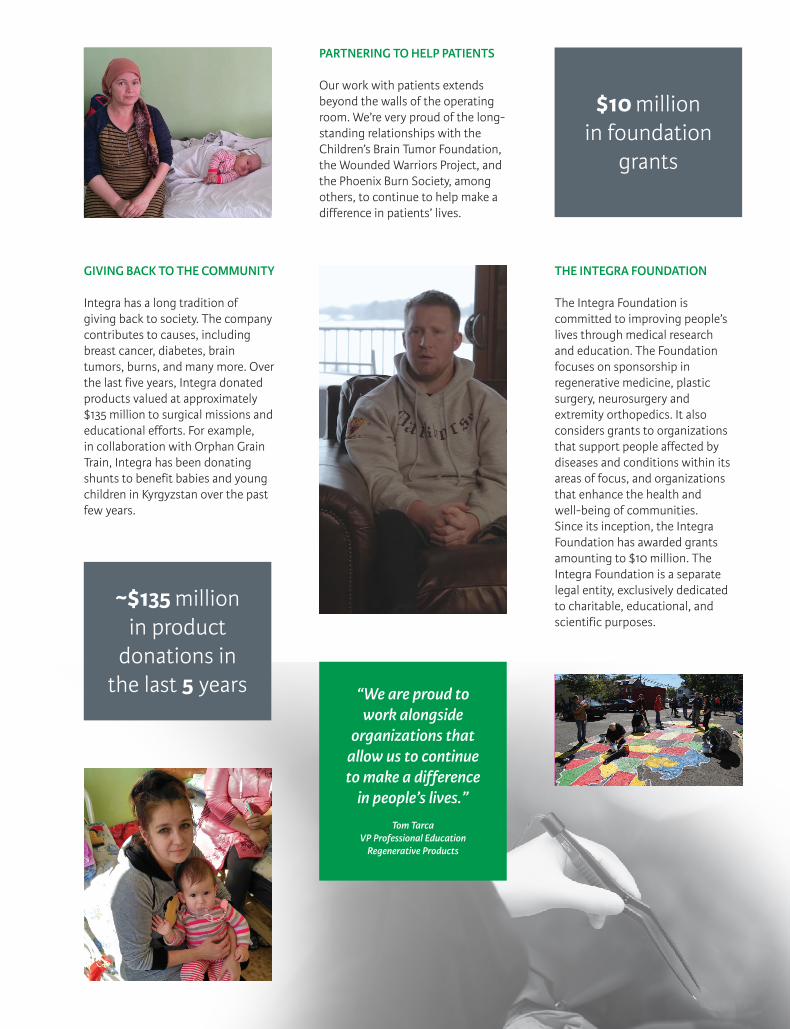
GIVING BACK TO THE COMMUNITY
Integra has a long tradition of giving back to society. The company contributes to causes, including breast cancer, diabetes, brain tumors, burns, and many more. Over the last five years, Integra donated products valued at approximately $135 million to surgical missions and educational efforts. For example, in collaboration with Orphan Grain Train, Integra has been donating shunts to benefit babies and young children in Kyrgyzstan over the past few years.
PARTNERING TO HELP PATIENTS
Our work with patients extends beyond the walls of the operating room. We’re very proud of the long-standing relationships with the Children’s Brain Tumor Foundation, the Wounded Warriors Project, and the Phoenix Burn Society, among others, to continue to help make a difference in patients’ lives.
THE INTEGRA FOUNDATION
The Integra Foundation is committed to improving people’s lives through medical research and education. The Foundation focuses on sponsorship in regenerative medicine, plastic surgery, neurosurgery and extremity orthopedics. It also considers grants to organizations that support people affected by diseases and conditions within its areas of focus, and organizations that enhance the health and well-being of communities. Since its inception, the Integra Foundation has awarded grants amounting to $10 million. The Integra Foundation is a separate legal entity, exclusively dedicated to charitable, educational, and scientific purposes.
~$135 millionin product
donations in the last 5 years
$10 million in foundation
grants
“We are proud to work alongside
organizations that allow us to continue to make a difference
in people’s lives.”
Tom TarcaVP Professional Education
Regenerative Products

THE WOMEN OF INTEGRA NETWORK (WIN)
Last year, the Women’s Leadership Council, an action-oriented advisory groupto the CEO, was formed to focus on understanding the current environmentfor the women of Integra and determine the areas of opportunity the companyshould address. One of the key areas of focus was the development of women’snetworks that would help connect colleagues across Integra and coordinateactivities to support the advancement of women. To date, there are more than15 Women of Integra Network (WIN) chapters across the company. For thesecond year in a row, Integra celebrated International Women’s Day across thecompany, which was actively supported by the WIN chapters.
INTEGRA AFRICAN AMERICANAFFINITY GROUP
The Integra African American Affinity Group (IAAAG) is a forum for our African American colleagues to focus on professional development, sharing of best practices, fostering an environment of inclusion and collaboration across our sites, raising awareness of the many contributions of our African American members, and striving to be role models for all employees of Integra.
COMPLIANCE
Integra is a company that values integrity, and we are committed to our Code of Conduct, which was drafted in consideration of laws, regulations, and codes of ethics relevant to our industry around the world. To hold our company accountable as a leader in medical technology, Integra operates a comprehensive compliance program, which serves to help prevent and detect potential violations of laws, regulations and industry codes of ethics applicable to a publicly traded and global medical technology company.
“It is a tremendous feeling when your
colleagues recognize and engage in your culture.”
Tyhesha CromwellChair, IAAAG

“As a company, we believethat our responsibilityextends beyond the wallsof the operating room. Weare driven to do well by doinggood for each other and thecommunities we serve.”
Peter J. Arduini President and CEO Integra LifeSciences

Doing Well By Doing Good
Related Documents