2013 BSP | Annual Report Bank of South Pacific Limited

Welcome message from author
This document is posted to help you gain knowledge. Please leave a comment to let me know what you think about it! Share it to your friends and learn new things together.
Transcript

2013BSP | Annual ReportBank of South Pacific Limited
1B S P A n n u a l R e p o r t 2 0 1 3
The VisionTo be the Leading Bank in the South Pacific
Key FeaTures oF BsP’s sTraTegy
• A Focus on Sales & Service
• High Performing Teams
• Operational Excellence
• Profitable Growth
BsP’s Core Values
• Integrity
• Leadership
• People
• Professionalism
• Quality
• Team Work
ConTenT
Chairman’s Report 4---------------------------------------------------------------------------------------------A Brief History of Bank South Pacific 6---------------------------------------------------------------------------------------------Board of Directors 8---------------------------------------------------------------------------------------------Chief Executive Officer’s Report 10---------------------------------------------------------------------------------------------2013 Strategic Business Unit Review 13---------------------------------------------------------------------------------------------Corporate Governance Principles 23---------------------------------------------------------------------------------------------Historical Summary 2013 34---------------------------------------------------------------------------------------------Contributions by BSP to PNG 35---------------------------------------------------------------------------------------------Overseas Branches and Subsidiaries 36--------------------------------------------------------------------------------------------- Directors’ Report and Financial Statements 42
• Directors’ Report 42• Statement by the Directors 44• Statement of Comprehensive Income 45• Statement of Financial Position 46• Statement of Changes in Shareholders’ Equity 47• Statement of Cash Flow 48• Notes to the Financial Statements 49
---------------------------------------------------------------------------------------------Independent Audit Report 90---------------------------------------------------------------------------------------------Shareholder Information 92--------------------------------------------------------------------------------------------- Branch Network 98--------------------------------------------------------------------------------------------- Corporate Social Responsibility 104---------------------------------------------------------------------------------------------
2 B S P A n n u a l R e p o r t 2 0 1 3
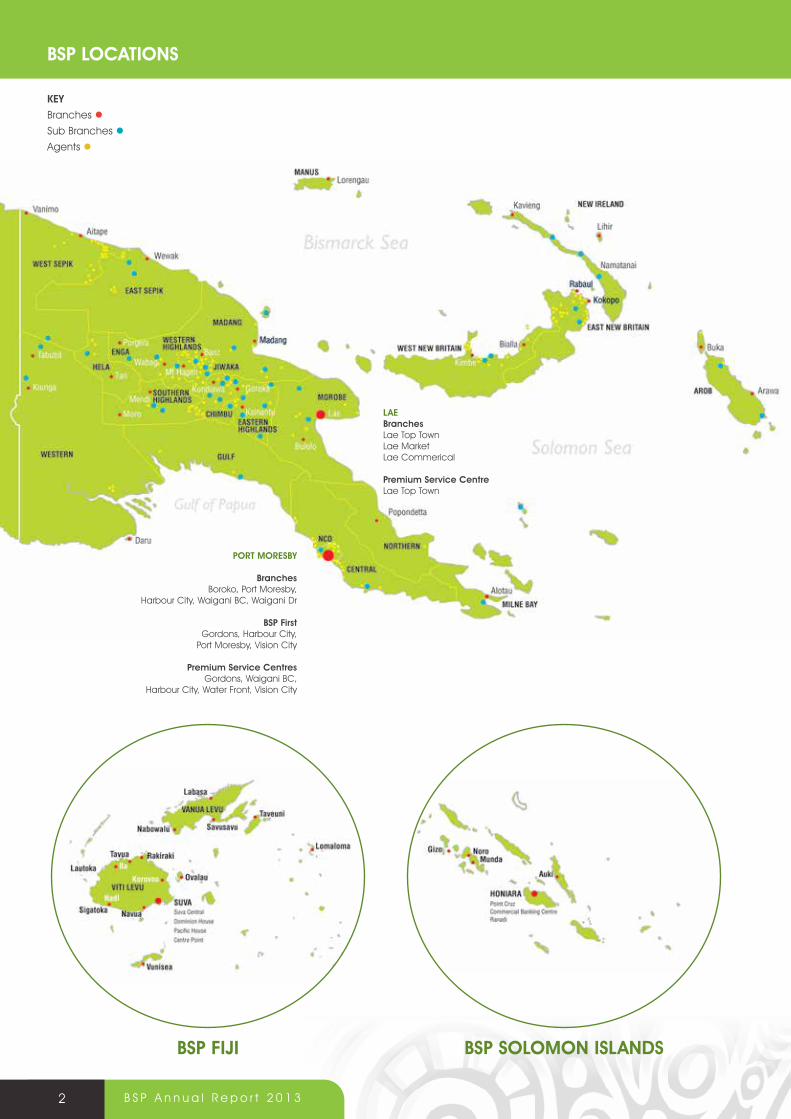
PaPua new guinea• 42 Branches • 38 Sub Branches• 226 Agents• 300 ATMs• 10,800+ EFTPoS• XX Premium Service Centres
Fiji • 18 Branches • 6 Priority Centres• 3 FX Bureau’s• 107 aTMs• 1, 589 eFTPos
soloMon islands
• 7 Branches • 7 agencies• 8 Branchless Banking agents• 18 aTMs• 120 eFTPos
PorT MoresBy
BranchesBoroko, Port Moresby,
Harbour City, Waigani BC, Waigani Dr
BsP First Gordons, Harbour City,
Port Moresby, Vision City
Premium service CentresGordons, Waigani BC,
Harbour City, Water Front, Vision City
lae BranchesLae Top Town Lae MarketLae Commerical
Premium service CentreLae Top Town
BsP loCaTions
Key
Branches l
Sub Branches l
Agents l
BsP Fiji BsP soloMon islands
3B S P A n n u a l R e p o r t 2 0 1 3
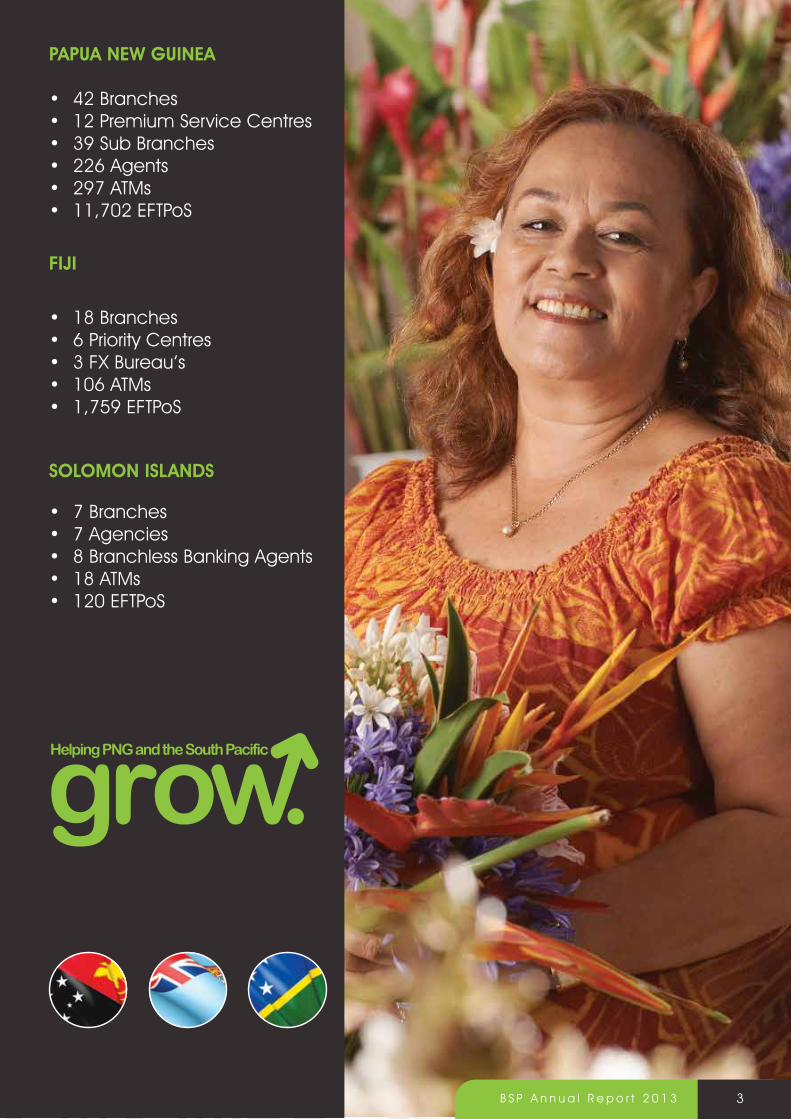
PaPua new guinea
• 42 Branches • 12 Premium Service Centres • 39 Sub Branches• 226 Agents• 297 ATMs• 11,702 EFTPoS
Fiji
• 18 Branches • 6 Priority Centres• 3 FX Bureau’s• 106 ATMs• 1,759 EFTPoS
soloMon islands
• 7 Branches • 7 Agencies• 8 Branchless Banking Agents• 18 ATMs• 120 EFTPoS
4 B S P A n n u a l R e p o r t 2 0 1 3
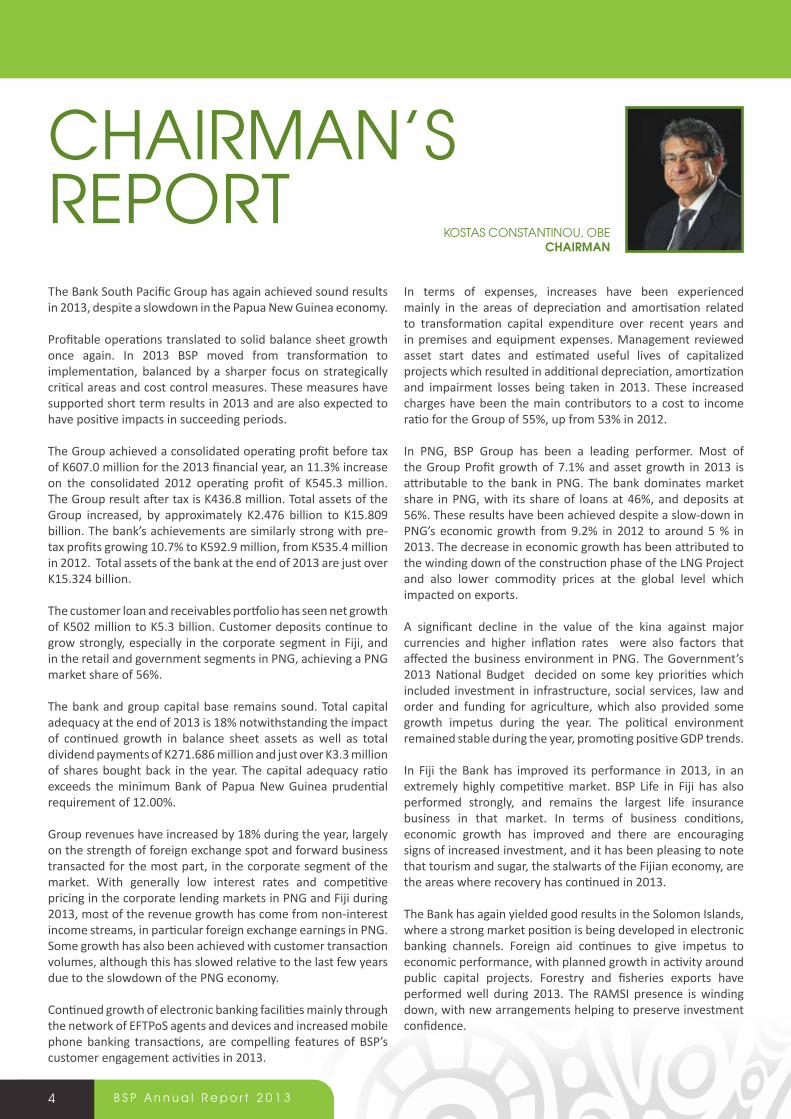
The Bank South Pacific Group has again achieved sound results in 2013, despite a slowdown in the Papua New Guinea economy.
Profitable operations translated to solid balance sheet growth once again. In 2013 BSP moved from transformation to implementation, balanced by a sharper focus on strategically critical areas and cost control measures. These measures have supported short term results in 2013 and are also expected to have positive impacts in succeeding periods.
The Group achieved a consolidated operating profit before tax of K607.0 million for the 2013 financial year, an 11.3% increase on the consolidated 2012 operating profit of K545.3 million. The Group result after tax is K436.8 million. Total assets of the Group increased, by approximately K2.476 billion to K15.809 billion. The bank’s achievements are similarly strong with pre-tax profits growing 10.7% to K592.9 million, from K535.4 million in 2012. Total assets of the bank at the end of 2013 are just over K15.324 billion.
The customer loan and receivables portfolio has seen net growth of K502 million to K5.3 billion. Customer deposits continue to grow strongly, especially in the corporate segment in Fiji, and in the retail and government segments in PNG, achieving a PNG market share of 56%.
The bank and group capital base remains sound. Total capital adequacy at the end of 2013 is 18% notwithstanding the impact of continued growth in balance sheet assets as well as total dividend payments of K271.686 million and just over K3.3 million of shares bought back in the year. The capital adequacy ratio exceeds the minimum Bank of Papua New Guinea prudential requirement of 12.00%.
Group revenues have increased by 18% during the year, largely on the strength of foreign exchange spot and forward business transacted for the most part, in the corporate segment of the market. With generally low interest rates and competitive pricing in the corporate lending markets in PNG and Fiji during 2013, most of the revenue growth has come from non-interest income streams, in particular foreign exchange earnings in PNG. Some growth has also been achieved with customer transaction volumes, although this has slowed relative to the last few years due to the slowdown of the PNG economy.
Continued growth of electronic banking facilities mainly through the network of EFTPoS agents and devices and increased mobile phone banking transactions, are compelling features of BSP’s customer engagement activities in 2013.
In terms of expenses, increases have been experienced mainly in the areas of depreciation and amortisation related to transformation capital expenditure over recent years and in premises and equipment expenses. Management reviewed asset start dates and estimated useful lives of capitalized projects which resulted in additional depreciation, amortization and impairment losses being taken in 2013. These increased charges have been the main contributors to a cost to income ratio for the Group of 55%, up from 53% in 2012.
In PNG, BSP Group has been a leading performer. Most of the Group Profit growth of 7.1% and asset growth in 2013 is attributable to the bank in PNG. The bank dominates market share in PNG, with its share of loans at 46%, and deposits at 56%. These results have been achieved despite a slow-down in PNG’s economic growth from 9.2% in 2012 to around 5 % in 2013. The decrease in economic growth has been attributed to the winding down of the construction phase of the LNG Project and also lower commodity prices at the global level which impacted on exports.
A significant decline in the value of the kina against major currencies and higher inflation rates were also factors that affected the business environment in PNG. The Government’s 2013 National Budget decided on some key priorities which included investment in infrastructure, social services, law and order and funding for agriculture, which also provided some growth impetus during the year. The political environment remained stable during the year, promoting positive GDP trends.
In Fiji the Bank has improved its performance in 2013, in an extremely highly competitive market. BSP Life in Fiji has also performed strongly, and remains the largest life insurance business in that market. In terms of business conditions, economic growth has improved and there are encouraging signs of increased investment, and it has been pleasing to note that tourism and sugar, the stalwarts of the Fijian economy, are the areas where recovery has continued in 2013.
The Bank has again yielded good results in the Solomon Islands, where a strong market position is being developed in electronic banking channels. Foreign aid continues to give impetus to economic performance, with planned growth in activity around public capital projects. Forestry and fisheries exports have performed well during 2013. The RAMSI presence is winding down, with new arrangements helping to preserve investment confidence.
KOSTAS COnSTAnTInOu, OBEChairman
CHAIRMAn’S REPORT

5B S P A n n u a l R e p o r t 2 0 1 3
PNG’s growth prospects remain positive and Fiji and the Solomon Islands have shown promising signs of recovery and return to normalcy. As large projects in PNG change PNG’s economic capacity, and anticipated public infrastructure investments progress, the country moves closer to realising its development potential.
Pacific regional economic relationships and interactions are also anticipated to grow, and BSP plans to be part of that growth, delivering valued, effective financial products and services to its markets, in an efficient and responsible manner.
BSP Group is also reaching a stage in its life cycle in PNG where it can realistically consider further diversification of its Pacific business, and at the same time develop a focus on growth opportunities in growth regions adjacent to the Pacific.
The 2013 results demonstrate again, how a committed, motivated, enterprising group of people, working as a team, can deliver outstanding results across diverse markets and cultural settings.
BSP will continue to meet its challenges, return more profitable results for shareholders and ultimately serve our customers better in 2014.
The coming years will present their own challenges and BSP Group with its local strength and presence in the region, is in a great position to anticipate market conditions, adapt to changes and continue to remain competitive.
Kostas Constantinou, oBEChairman
Whilst BSP’s performance continues to trace the positive trends in the economies of PNG and its Pacific neighbours, it is also a strong proponent of the financial inclusion program in the Pacific. Investments continue to be made in technology, risk management and other resources, to extend banking services at minimal cost to customers in parts of the market that have poor access to banking services.
A concerted effort is being made to introduce low cost, simple accessible savings products for children and students. The Bank has been collaborating actively with the central banks in PNG, Solomon Islands, and Fiji, to support and participate in financial literacy exercises, and publicity campaigns.
BSP has continued to engage with, and be a part of, the communities where it operates. In 2013 Community support projects have continued in PNG, Solomon Islands and Fiji, worth over half a million Kina.
BSP Group also supports local sports and charity organisations as part of this community engagement, and as a responsible corporate citizen of the Pacific, BSP continues to work in partnership with community and government organizations to deliver programs that sustain and improve the lives of people in PNG and the Pacific.
Being the Offical Sponsor of the 2015 Pacific Games is one such initiative and we are proud to work closely with the PNG Government and our Pacific neighbours, to ensure that it is successfully hosted in Port Moresby.
In 2014, an improving but fragile global economy will continue to pose challenges. Growth rates are expected to slow slightly in the emerging market economies of Asia, Africa, Eurasia and South-Latin America. In the traditional developed economies of Europe and North America the outlook is improving, but fundamentals are not robust, and they are forecast to remain subdued.
2009 2010 2011 2012 2013
9.4010.03
11.68
13.33
15.81
Kina
Bill
ion
ToTal asseTs
2009 2010 2011 2012 2013
257.118
Kina
mill
ion
NeT ProfiT afTer Tax
283.147
355.947
407.744436.828

GoiNG WHere THe oTHer BaNKs DoN’Ta BsP rural team travelling up the Purari river, Gulf Province to set up an agent in Baimuru.
6 B S P A n n u a l R e p o r t 2 0 1 3
a BrieF hisTory oF BanK souTh PaCiFiC
Bank South Pacific Limited opened its doors in 1957 in Port Moresby as a branch of the National Bank of Australasia Limited. In 1995 a consortium of Papua New Guinea businesses acquired the bank creating the first and only PNG private sector owned bank.
Bank South Pacific purchased the State Owned - Papua New Guinea Banking Corporation (PNGBC - formerly CBA PNG) in 2002 creating the largest Bank in PNG. Other acquisitions followed: National Bank of Solomon Islands 2005, Habib Bank in Fiji in 2006, Colonial Group of Companies (Banking & Life Businesses) in Fiji in 2010.
Bank South Pacific rebranded to become “BSP” in 2008. Our shareholders include major PNG Institutions – IPBC, Nasfund, Nambawan Super, Petroleum Resources Kutubu, Credit Corporation, MVIL, PNG Teachers Savings & Loan, Comrade Trustees, and the International Finance Corporate (IFC).
In 2012, BSP’s account opening process employing a tablet computer and instant card issuance, won the award for the world’s Best Bank Led Mobile Money Program at the 2012 Connected World Global Awards.
Bank South Pacific continues to be a dominant force in the market leading the way with innovation and technology.
Today BSP has the largest fleet of EFTPoS and ATMs in the country, including an increasing customer base in electronic and mobile banking channels. Over 80 million transactions were processed through all electronic and mobile phone channels in 2013.

7B S P A n n u a l R e p o r t 2 0 1 3
BaNKiNG oN THe Go
in 2013, new features were introduced to BsP’s Mobile Banking channel including a domestic remittance product, known as Wantok Moni.
Wantok Moni facilitates the remittance of money from BsP
customers to non-banked relatives and friends and the receiver of the
remittance is able to transact using these funds at any BsP efTPos terminal
or withdraw from a BsP aTM without the need for a debit card.

8 B S P A n n u a l R e p o r t 2 0 1 3
Kostas Constantinou, oBE | Chairman |Director since April 2009. Appointed Chairman February 2011. Kostas Constantinou is a prominent business figure in Papua New Guinea, holding a number of high level public and private sector appointments. He is a Chairman of various companies, including Airways Hotel Limited & Airways Residences Limited, Lamana Hotel Limited, Lamana Development Limited, Hebou Constructions, Alotau International Hotel and Gazelle International Hotel. He is a Director of Heritage Park Hotel, Honiara, and Grand Pacific Hotel, Fiji. Kostas is a Director of two other listed companies: Oil Search Limited and Airlines PNG Limited. He is Chairman of 2015 Pacific Games Authority since 2011, Deputy President of Employers Federation of Papua New Guinea, Honorary Consul for Greece in Papua New Guinea and Trade Commissioner of Solomon Islands to Papua New Guinea.
Dr ila tEmu, PhD, mEc | Non - Executive Director | Director since 2003. Dr Ila Temu was appointed to his current role as Country Manager Barrick PNG in June 2011. Prior to this, he held senior executive roles in Placer Dome Niugini both overseas and in PNG. He has also held senior positions in a number of other public organisations including Senior Lecturer in Economics at UPNG, Director of the National Research Institute and Managing Director of Mineral Resources Development Company (MRDC). Dr Temu held director and membership roles in Dome Resources, Kina Finance Ltd, PNG Chamber of Mines and Petroleum, IPBC, PNG Employers Federation and was Chairman of PNG Ports Corporation Ltd for 5 years. He is currently a Director of National Petroleum Company of PNG Ltd, Kina Petroleum Ltd and a member of the Governing body of the Divine Word University. Dr Temu holds a Bachelor of Economics (Hons) from the University of Papua New Guinea, a Masters in Agricultural Development Economics from the Australian National University, Canberra, Australia and a Ph.D in Agrcicultural Economics from the University of California, Davis, USA.
roBin FlEming | Group CEO | Director since June 2013. Robin Fleming was appointed Group CEO of Bank of South Pacific Limited in June 2013. Before his appointment as Group CEO, he had been Deputy CEO and Chief Risk Officer since 2009. Prior to that, Mr Fleming held senior executive roles as Chief Risk Officer, General Manager Corporate & International, and Head of Risk Management with BSP. Prior to the merger of Bank of South Pacific Limited and PNGBC Limited, Robin held senior management roles with PNGBC. He has worked in PNG for over 30 years and holds a MBA and a Master of Management from Charles Sturt University.
tom Fox, oBE, BEc | Deputy Chairman, Non - Executive Director | Director since June 1993. Thomas Fox holds a Bachelor of Economics degree from the University of Papua New Guinea. He commenced his career with the Reserve Bank of Australia, and gained experience in senior management roles within semi-government institutions, and private sector companies, including serving as the Managing Director of the Investment Corporation of Papua New Guinea for eight years. His other current directorships include, BSP Capital Limited, Teyo No. 1 Limited and Akura Limited. Mr Fox is also a trustee for the Institute of National Affairs, and a foundation member and Fellow of the PNG Institute of Directors.
gErEa aoPi, CBE, mBa |Non - Executive Director | Director since April 2002. Gerea Aopi has achieved several tertiary degrees in Papua New Guinea, and a Masters of Business Administration from the University of Queensland. Mr Aopi has substantial public service and business experience in Papua New Guinea, including Secretary of Finance & Planning and Managing Director of Telikom PNG Limited. He presently holds the position of Executive General Manager, External & Government Affairs and Sustainability at Oil Search Limited. He was previously the Chairman of Telikom PNG Limited and Independent Public Business Corporation (IPBC). Mr Aopi is a Director of Oil Search Limited, Steamships Trading Company Limited and is involved in a number of other private sector and charitable organisations in Papua New Guinea.
BoarD of DireCTors

9B S P A n n u a l R e p o r t 2 0 1 3
sir nagora Bogan, KBE, llB | Non - Executive Director | Director since 2003. Sir Nagora Bogan graduated with a Bachelor of Law from the University of Papua New Guinea in 1978. In 1992, Sir Nagora was appointed Commissioner General of the PNG Internal Revenue Commission. In 1996, he was appointed as PNG’s Ambassador to the United States with accreditation as Ambassador to Mexico and High Commissioner to Canada. In 2002, Sir Nagora became a private business entrepreneur. He is Chairman and CEO of In Touch Media Limited, a multimedia/record label company, Chairman of Nambawan Super Limited and Director on several private company boards. Sir Nagora received his knighthood during 1997 in recognition of his distinguished public service.
lylE ProCtEr, mEc, FFin| Non - Executive Director | Director since July 2004. Lyle Procter has been a career central banker, having spent 36 years with the Reserve Bank of Australia. He also spent several years with the Australian Department of Foreign Affairs. Since retiring from the Reserve Bank, Mr Procter has worked as a consultant to the International Monetary Fund, Washington and the Asian Development Bank, Manila. He has also worked privately as a consultant to the Australian banking industry, and in several South-East Asian countries. Other current directorships include Sun Hung Kai and Co. Ltd, Allied Overseas Ltd, Tanami Gold NL and Eurogold Ltd.
FrEDa talao| Non - Executive Director | Director since April 2012. Freda Talao being a lawyer by profession holds a Law Degree from University of Papua New Guinea, a Masters Degree from Bond University, Queensland and is currently undertaking Doctoral Studies at TC Beirne School of Law, University of Queensland. Freda has extensive work experience in the government, private, NGO and development sectors in PNG. Ms Talao has previously been on several Boards, including the Mama Graun Conservation Trust Fund, Liklik Dinau Trust Fund, Individual and Community Advocacy Forum (ICRAF), Civil Aviation Authority (CAA), National Airports Corporation Board (NAC) and Airport City Development Limited (ACDL). She is also currently a member of the External Stakeholders Advisory Panel (ESAP) to the Morobe Mining Joint Venture (MMJV) which owns the Hidden Valley Gold Mine in Morobe Province and Australian Institute of Company Directors.
gEoFFrEy J. roBB, mBa| Non - Executive Director | Director since April 2012. Geoffrey Robb is a highly qualified and experienced banker having occupied several senior Executive positions including Head of Resource Finance at Bank of America, and Global Head of Acquisition Finance and Head of Complex and Strategic Transactions with ANZ Banking Group. As Head of Bank of America in Melbourne, he led resource financings with BHP, CRA, Elders Resources, Bougainville Copper, Ok Tedi and Porgera. He holds MBAs from the International Management Institute Geneva and Macquarie University. Mr. Robb has travelled extensively in emerging markets and has received the Medal of the Order of Australia for his services to mountaineering and charity. He is Chairman of the Board Audit, Risk and Compliance Committee and is also on the Board of BSP Capital Ltd.
ErnEst Brian gangloFF | Non - Executive Director | Director since November 2013. Ernest Gangloff Ernie is an Accountant and registered with CPA PNG and the Accountants’ Registration Board. Ernie has extensive experience in the areas of risk management, internal audit and corporate governance. Ernie has over 30 years professional experience with over 15 years in Senior Management positions. Ernie retired as Partner with Deloitte in May 2013 and established Gangloff Consulting in June 2013. He is also a director of Gangloff Consulting Ltd, Laurabada Investments Ltd and New Britain Palm Oil Ltd. Ernie is a Council Member of the of the Institute of National Affairs and the Vice President of the Business Council of PNG.

1 0 B S P A n n u a l R e p o r t 2 0 1 3
I take great pleasure and pride in reporting to shareholders another record financial result for BSP in 2013. The net profit after tax of K436.828 million represented an increase of 7.1% on our 2012 results.
Our Chairman, Kostas Constantinou, provided details of our strong financial performance and the underlying economic fundamentals which the BSP team optimised to the benefit of our shareholders.
Papua New Guinea continues to be the predominant driver of BSP’s performance. Economic growth was maintained in our home market for the 14th consecutive year. GDP growth for 2013 was estimated at 5.1% with strong contributions from sectors benefitting from PNG LNG construction related activity.
The US$20 billion PNG LNG project has proved to be a watershed for the PNG economy. Its completion in 2014 with first gas in the second half of 2014 represents a significant achievement for the project sponsors and the PNG Government. The multiplier effect of the project across numerous business sectors has been substantial and in many ways transformational.
Whilst the construction phase of the PNG LNG project may be nearing completion the revenues associated with export of the LNG will provide support for Government infrastructure developments and spending in areas such as health and education.
Business confidence remains buoyant on the back of a PGK15 billion budget for 2014 and announcements in late 2013 by Interoil and Total which could result in another LNG construction project for PNG in the next 2 to 3 years.
BSP’s 2013 results reflect strong income growth in our international services product lines which our Corporate and Treasury sales teams actively promoted. There was also continued growth in our net interest income where increased loan assets have partially offset some margin compression in response to a more competitive lending market.
Equally pleasing was the income contribution emerging from BSP’s Mobile Banking suite of products. Enhancements to telephone banking functionality permitted more Retail clients to access banking facilities by way of our electronic channels efficiently in a lower cost and more convenient manner.
Strategically BSP has over the past 5 years positioned itself to optimise its capacity to meet the growing demands of a broad client base across a diverse geography. This transformation has involved significant capital expenditure in our properties, information technology systems and infrastructure, as well as our products and channels.
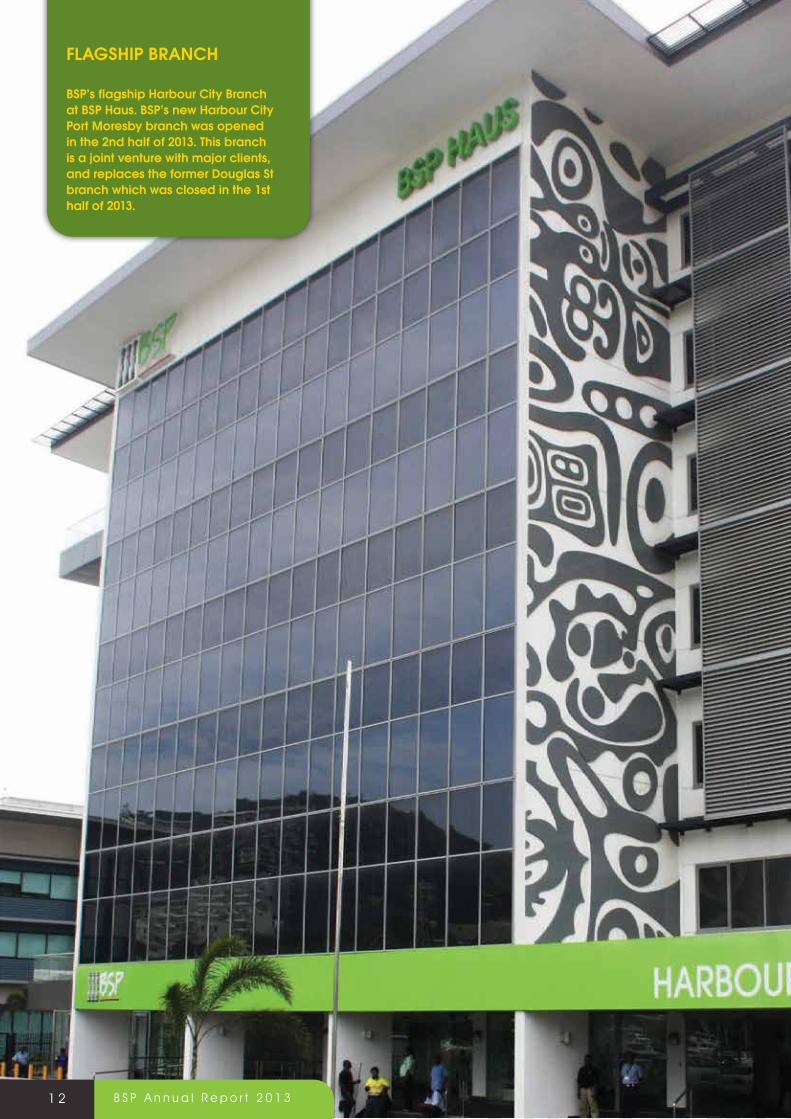
The majority of the large projects involving our properties are completed or drawing to a close. BSP’s new Harbour City Port Moresby branch was opened in the 2nd half of 2013. This branch is located in BSP Haus at Harbour City Port Moresby, a joint venture with major clients, and replaces the former Douglas St Port Moresby branch which was closed in the 1st half of 2013.
A new branch was opened in Tari and the new BSP Rural at Maprik is expected to open in the 1st quarter of 2014. The new Pacific Operations Centre and Gordons Operations and Data Processing Centre, both in Port Moresby, and the new Commercial Centre in Lae, will all be complete and operational in the 2nd half of 2014.
Branches such as Mt Hagen and Buka had upgrades completed with Waigani Banking Centre nearing completion in early 2014. During 2014 there are upgrades planned for Tabubil and Lihir branches.
Improvements in, and refinements to, the physical branch infrastructure have been complemented by the introduction of queuing systems in branches in Port Moresby. This has resulted in reduced waiting times for our customers and is a tangible illustration that BSP is acting to improve the service experience for our customers. These learning’s are shared with branches outside of Port Moresby and waiting and service times have improved in those branches as well. What has been recognised during this process is the largely untapped sales potential of the BSP branch network and this will be a key component of BSP’s strategy in 2014.
The substantive investments in critical information technology infrastructure is all but complete with the major project in 2014 being the relocation of core systems from the current location at Waigani in Port Moresby to Gordons in Port Moresby once the Gordons Operations and Data Processing Centre is complete. This project will be accorded the importance and resource allocation deserving of one which involves core systems.
ROBIn FLEMInG Group Chief exeCutive offiCer
GROUP CEO’S REPORT

1 1B S P A n n u a l R e p o r t 2 0 1 3
New systems brought in to production in 2013 included phase 1 of the trade finance platform under licence with Wells Fargo, an automated loan origination system for unsecured personal loans and the first phases of the automated cheque processing project which involves Real Time Gross Settlement, the Central Bank’s new Kina Automated Transfer System, and by mid-2014 cheque imaging and truncation.
There were further refinements to our internet banking online offerings and our mobile banking suite. Human Resource’s new Human Capital Management system was implemented with the payroll function to be put into production in the 1st payroll of 2014 after an exhausting dual payroll processing programme that was undertaken over an extended period.
Our overseas operations have also commenced major IT upgrade projects with BSP Fiji and BSP Life Fiji initiating core system replacements for their respective operations.These system upgrades will not only provide our banking and Life businesses with up to date operating systems, but also improved productivity and increased customer sales and service capabilities.
In the Solomon Islands a “lift and shift” project was successfully implemented whereby BSP PNG’s suite of mobile banking products and channels were migrated and rolled out in Solomon Islands.
As indicated earlier the costs of investments of this magnitude are not insubstantial and the multi-year nature of the transformation has been such that the full deprecation costs associated with the capital expenditure programme are now being captured in our expense base. Understanding that much of the transformational costs have been related to more aggressively amortised IT infrastructure, IT software and systems, product development and enhancement, the higher depreciation expense is expected to normalise by the end of 2016.
Having invested heavily in physical assets, information technology infrastructure, systems, products, in addition to new and improved channels, strategically the focus for BSP is realigned from project work to benefit realisation. These investments are seen as enablers that provide our staff with the tools to improve productivity and increase our sales capability.
A key component of the strategic related effort in 2014 therefore will be an organisation wide sales and service
program integrated with our vision, our values, our culture. The linkage of our vision and values of integrity, professionalism, leadership, quality, people, teamwork is intrinsic to embedding a true service and sales culture within BSP.
BSP’s optimum sales and service culture is to place customer satisfaction at the forefront of our planning process and our operational activities. Customer satisfaction should then translate to improved returns for our shareholders.
Equally important will be renewed emphasis on training and career development of our staff. This will involve product knowledge to provide staff with the confidence to sell our products to our customers, specialist skills training, leadership development, and tailored multi year programmes for our future leaders.
During 2013 three of our middle management staff participated in a 3 month secondment to Barclays Africa Bank Limited in South Africa. This was an outstanding success thanks to Management at Barclays Africa Bank Limited and our team in Port Moresby. The intent is to continue the secondment programme in 2014 and build up a cadre of staff who will have had real work exposure in international banks.
Financial inclusion remains a key objective of our Retail banks’ strategy. Our BSP Rural sub branch network and our agency network which complements our main branch network, provide BSP with the capability to add new customers using our world class tablet technology. The emerging SME market is also an area where Retail has developed Smart Business Products to meet the needs of this customer group and which will be rolled out more aggressively in 2014. I thank all staff for their contributions and efforts in 2013 and look forward to their ongoing support in 2014. I am confident that with the support of the board, the management team and the committed and dedicated staff throughout the bank, BSP will achieve the goals that have been set.
ROBIN FLEMINGgrouP ChiEF ExECutivE oFFiCEr
1 2 B S P A n n u a l R e p o r t 2 0 1 3
flaGsHiP BraNCH
BsP’s flagship Harbour City Branch at BsP Haus. BsP’s new Harbour City Port Moresby branch was opened in the 2nd half of 2013. This branch is a joint venture with major clients, and replaces the former Douglas st branch which was closed in the 1st half of 2013.
The daily execution of the bank’s business operations is the responsibility of the strategic business units (SBUs), Retail Banking, Corporate, Treasury, Paramount Banking, Group Risk Management, Human Resources, Operations and Finance & Planning.
Highlights of each SBU performance in 2013 include:
reTail BanKing
2013 marked another year where BSP extended the outreach of banking services across Papua New Guinea. The Branch network saw the opening of a new branch at Tari in Hela Province and the relocation of the former Douglas Street branch to new premises at BSP Haus, Harbour City. Our sub-branch (BSP Rural) network was increased to 39 locations. A concerted push was also made to increase the number of bank agencies operating across PNG and by the end of 2013, over 226 agents were in place. This included 7 agents operating under the SVS retail chain’s Supa Village Stoas. The expansion of branches, sub-branches and agencies into rural areas of PNG was supplemented by the continued roll-out of EFTPoS merchant facilities and this greatly increased people’s access to banking.
Work continued to provide customers with a choice of products to meet their needs and life cycle; this included the new Kids Saving Account which was designed to help parents teach their children to develop a savings habit for the future. A new Kundu transaction account was also introduced with a packaged service charge structure to provide customers with further choice to meet their specific banking needs and habits. A new lending product, the Savings Secured Loan, was introduced to provide customers with an alternative to the standard personal loan product offered by financial institutions in PNG.
BSP continued in its efforts to support and develop the nascent SME (Small & Medium Business) sector. Emphasis was placed on providing SME customers with a pathway for growth through the adoption of electronic payment systems such as EFTPoS to help them develop a financial footprint to support requests for credit finance. These activities were supported by BSP’s Banking Education Unit which offered tailored training to different market segments serviced by BSP.
The introduction of a loan origination and processing system helped BSP reduce the average personal loan approval and funding timeframe from 48 hours to less than 2 hours on
average and customer wait-times in branches were dramatically reduced as learning gleaned from an automated ticketing/queuing system were applied in branches across the network.
BSP continued to pilot new technology during 2013 including deposit taking ATMs. At present 4 ATMs are used to accept cash deposits and the functionality to accept cheque deposits is scheduled to be rolled out in 2014.
New features were also introduced to BSP’s Mobile Banking channel in 2013 including a domestic remittance product. The service known as Wantok Moni facilitates the remittance of money from BSP customers to non-banked relatives and friends and the receiver of the remittance is able to transact using these funds at any BSP EFTPoS terminal or withdraw from a BSP ATM without the need for a debit card. This is an attractive product in Papua New Guinea which has a large unbanked population but significant numbers have a mobile phone.
Overall growth in Mobile Banking transactions was exceptionally strong in 2013 and the use of this channel is reducing the pressure on branches in the provision of over-the-counter transactions.
On the Sales and Service front, perhaps the most significant change in the Retail space has been the merger of the Retail and Network Strategic Business Units. This has introduced much efficiency in the provision and sale of retail financial services and this is set to continue during 2014 through the restructuring of Sales and Service structures in branches to take advantage of the many technological and process changes that have been introduced in BSP over the past few years.
CorPoraTe
Corporate Banking contributed significantly to BSP’s improved performance in 2013. The major driver was improved cross sell of non-lending solutions. The result was further strengthened by disciplined expense management with direct costs reducing by 7%.
Net interest Income increased by 10% compared to the prior year, driven by slower growth due to a slowing economy and intense competition for loans.
Other income increased by 60%. Strong growth in the sale of foreign exchange products and hedging solutions contributed to this result.
1 3B S P A n n u a l R e p o r t 2 0 1 3
2013 STRATEGIC BuSInESS unIT REVIEW

In 2013, the Corporate lending book increased by 5.3% and deposits increased by 7.8% . This includes BSP’s diversification into USD lending for our local and international customers. Other factors impacting loan growth included prudent credit risk management and exit from identified “watch list” facilities.
Service and sales programs continue to be the key focus and continued focus to uplift non-lending fees and cross-sell of our “whole of Bank” solutions.
The Corporate vision remains unchanged “to be the leading financial services team excelling in customer service; through customer first, best people, innovation & communication”.
The corporate team remains focused on our Customer First program, which involves putting customers at the top of our priorities – establishing a “customer first – I care” culture.
To better understand customer expectations, during 2013 we appointed an independent market research firm to conduct our Benchmark Corporate Customers satisfaction survey across 400 of our customers.
The survey highlighted a number of key strengths, including BSP relationship managers, extensive product range; and the convenience and safety of our branch network. However there are areas for improvement; including adding value, responsiveness, branch waiting times, clear and timely communication; and lifting our capacity in Asset and Trade Finance.
At Corporate we intend to act on this feedback.The next Corporate Customers Satisfaction survey will be undertaken mid-2014.
The key product initiative completed in 2013 was our new trade finance solution, developed in conjunction with Wells Fargo, one of the world’s largest financial institutions. Through this collaboration we will be able to provide world class solutions covering letters of credit, document collections, etc.
We continue to focus on credit and operational risk based on our proven strategic and responsible approach. In partnership with the Risk Management team we vigilantly monitor and control the quality of the loan book especially during the current period of slower economic activity.
The focus for Corporate after the Transformation initiatives is “benefits realisation” for all BSP stakeholders. During 2013 we focused on continued enhancements of our products, such as online business banking, business MasterCard Corporate Debit Card, Asset Finance and Trade. We continue to leverage the capabilities of BSP Capital Limited for our customers with an extensive joint calling program.
As outlined throughout this annual report, what truly makes Corporate an outstanding business partner is our dedicated relationship management team, extensive product suite and most importantly BSP’s “whole of bank” solution incorporating electronic channels and access to the largest retail branch network in the country.
We continue to strive for excellence in customer service and across all aspects of our business including reputation, asset quality, profitability, customer satisfaction, innovation, governance and community engagement.
owners of supa V stoas are also BsP agents.
1 4 B S P A n n u a l R e p o r t 2 0 1 3
Treasury
The BSP Group operates across PNG, Fiji and Solomon Islands. These three different jurisdictions each have particular characteristics but share being small in the international context with each having their own discrete foreign exchange regulations, few market participants and incomplete, illiquid financial markets.
The role of BSP Treasury remains to:
• foster relationships with clients to provide Financial Markets services; and
• act as “Banker” to the bank managing market risks, funding, liquidity, capital and capital planning. This includes managing the Bank’s exposures and liquidity levels in line with prudential requirements, ALCO directives and delegated authorities.
In PNG foreign currency capital inflows relating to the PNG Liquefied Natural Gas project construction phase reduced during 2013, relative to ongoing imports. This, combined with lower commodity prices, produced a lagged move in PNG’s Balance of Payments from surplus into deficit with the demand for scarcer foreign currency also inducing a lagged Kina depreciation. As part of its mandated policy function of maintaining price stability the Bank of Papua New Guinea sought to stabilise the Kina’s decline by selling about PGK2.5 billion worth of USD into the market (compared to sales of about PGK1.8 billion worth of USD in 2012). Over 2013 the BPNG rate to sell USD for Kina fell by about 13% from 0.4755 to 0.4130.
PNG system foreign exchange turnover fell by about 1.5% in 2013. With a greater sales and service focus compared to 2012, volume intermediated by BSP Treasury rose about PGK1.4 billion equating to a market share of about 30% (compared to 26% in 2012). Excluding the BPNG sales of USD, customer turnover fell by about 2.5% vs 2012 even after factoring in the Kina’s depreciation. Across the Group we managed to achieve higher volumes and spreads. This also related partly to the need to manage larger and more frequent mismatches of currency inflows due to higher relative foreign currency demand.
BSP’s credit rating is constrained by PNG’s country credit rating. Notwithstanding this S&P raised BSP’s long term issuer credit rating to B+. We continued to grow and diversify our funding base over 2013 with depositors and fund providers recognising our strong business position, entrenched importance to the financial systems of the countries in which we operate as well as our fundamental financial strength and security. This helped fulfil part of our strategy to increase USD funding to customers who use our whole-of-bank solutions, compared with those solely transactional relationships.
Once again high levels of domestic financial system liquidity contributed to a low domestic nominal and negative real interest rate regime. Low monetary policy rates risk implicitly
taxing savers, disrupting the signalling function of interest rates for efficient capital allocation and increases the value of any unfunded pension liabilities. In PNG the yield curve flattened and fell by more than planned, from 1.98% for 28 days and 2.32% for 182 days towards the end of 2012 to 1.65% and 2.00% respectively over the first half of 2013. Treasury Bill and Inscribed stock yields also fell around July 2013.
Aiming to enhance monetary policy effectiveness, the BPNG Cash Reserve Requirement was increased in 2013, reducing bank funds available for investment, with a consequent impact on earnings potential. By the end of 2013 28 day and 182 day Kina yields had climbed back to about 1.84% & 2.51% respectively. Short term offshore yields also fell over most of the year which, along with the depreciating Kina, reduced earning rates on offshore deposits. This has led to earnings on PNG Bank kina liquids and investments to be reduced by 9.1% in 2013 compared to 2012 at an average yield of 4.52% on an average balance of about K4.7 billion for 2013. Across the Group earnings from liquids and other similar investments reduced by a similar amount.
ParaMounT
Paramount Banking is the Strategic Business Unit entrusted with management of the Bank’s liability portfolio which stood at K5 billion in 2013. This is a result of the continued high liquidity experienced within the Banking system. Paramount Banking continued to perform well above budget forecast in spite of operational challenges in 2013.
BSP is not only seen as the Nation’s Bank but a Strategic Partner with the National and Provincial Governments in providing Banking and Financial services to the people of this Nation. The extensive Branch and Rural banking network together with Electronic Banking services throughout the Country are the Bank’s strength.
Paramount Banking’s Vision is to be the Bank of Choice for all High Value net worth clients. The business unit focuses on professional and personal relationship with its high valued clients including the National Government’s and its agencies.
The Community Affairs Officer continued to establish contacts with various Resources Developers and co-ordinate training on Banking and Financial services with Landowner groups including opening new accounts in anticipation of future compensation payments and royalty flows.
The slow growth in non-mining sectors including low commodity prices have contributed to the restraining of economic growth in 2013 and that is expected to continue into 2014, also subject to unexpected disruptions due to regional and global economic conditions.
grouP risK ManageMenT
Risk management at BSP is independently overseen by various
1 5B S P A n n u a l R e p o r t 2 0 1 3
2013 STRATEGIC BUSINESS UNIT REVIEW
business units within the Group Risk Management strategic business unit. The specific business units are: (a) Credit – has underwriting and portfolio management responsibilities; (b) Operational Risk – has broad operational risk involvement across the network; (c) Asset Management – manages the distressed asset portfolio; and (d) Credit Inspection – provides an independent assessment of credit policy compliance. In the second half of the year, the operational reporting lines for Audit and Legal Services were transferred to Group Risk Management while Audit retains an independent and direct reporting line to Board Audit Risk & Compliance Committee (BARCC). This change was implemented to allow a clear oversight of all the three risk lines of defence including Audit as the third and last defence in the risk management framework.
Credit
Credit risk is defined as the potential failure of a Borrower or Counterparty to meet its contractual obligations. Within BSP, credit risk is managed by developing and undertaking an ongoing review of a credit risk strategy that identifies our target market acceptance providing a platform to grow the business within defined parameters to build a quality loan portfolio across a broad range of sectors. Senior BSP Management has the responsibility to implement credit risk strategy including developing policies and procedures for identifying, measuring, mitigating, monitoring, controlling and on a continuous basis reviewing the effectiveness of the credit risk strategy and inherent credit culture. Completion of the construction and development phase of the PNG LNG project resulted in a return to more normal business activities with a lower demand for borrowing with a period of consolidation being experienced with this expected to continue in 2014. Consequently lending growth across all sectors of the PNG economy was relatively stable. Diversification of the loan portfolio across key economic sectors continues to be closely monitored, providing a mitigant to the overall loan portfolio exposures, to ensure that no significant concentration risk develops that may impact the stability of the asset portfolio performance.
GDP growth of 6.2% is forecast for PNG over 2014 with a focus on the agriculture, forestry and the fisheries sector and a sharp increase in the oil and gas sector with the commencement of the gas production in 2014. Total non-mining GDP is forecasting moderate growth of 1.6 per cent in 2014 which is lower than 2013 growth of 4.7 per cent. The slowdown in the non-mining sectors reflects the contraction in the construction sector coming mainly from the completion of the PNG LNG project. The property market continues to be a sector undergoing reform with supply outweighing demand leading to lower rental yields and capital growth. BSP continues to monitor the exposure to the property sector undertaking appropriate stress testing of the property loan portfolio. Overall performance of the loan portfolio remains sound with moderate growth achieved in both the corporate and retail
sectors in a subdued market. However despite the overall increase in asset balances the Bank’s market share has declined in a competitive market. During the course of 2013, overall delinquency rates remained relatively stable with some marginal improvement in both the Corporate and Retail portfolios. The Retail portfolio experienced some delinquency volatility during 2013 due in part to a change in the collection process which has been addressed with an immediate improvement noted. The loan portfolio weighted average risk rating has remained stable with the loan portfolio overall risk profile considered to be sound. Significant changes to the Retail loan application processing was achieved with the implementation of the automated loan origination system for unsecured personal loans resulting in a more consistent origination process and improved turnaround times for approval and funding. In 2014 it is proposed to expand the loan origination process to all retail loan products including secured personal loans, housing loans, small to medium business sector loans incorporating a credit scorecard that will provide a consistent loan decision and automated origination process providing improved turnaround times for our retail and small business customers. Lending policies and procedures continue to be reviewed on an ongoing basis with further policy changes made in 2013. These changes are due to continuing changing market and product trends focussing on improving controls and reporting in order to move the Bank towards compliance with industry best practice for credit risk management standards. We continued to implement our social and environmental policies and processes which strive to be consistent with market adopted practices.
Training remained a key focus in 2013 and will continue into 2014. The Moody’s online training introduced in 2012 has been completed with the majority of staff, predominantly in Credit and Corporate, successfully completing the program. The online training was complimented with Moody’s conducting classroom training sessions specifically focussed on identifying potential early warning signals and implementing appropriate strategies.
operational risk
The Bank has independent Operational Risk functions in PNG, Fiji (both the Bank and Life Insurance operations) and Solomon Islands. The Head of Group Operational Risk functionally reports to the Board Audit Risk & Compliance Committee (BARCC) in PNG and administratively to the Group Chief Risk Officer.The key focus for the operational risk unit continues to be the embedding and refinement of the Operational Risk Management Framework across the BSP Group and the strengthening and enhancement of Operational Risk Management tools to support this Framework. Some of the risk initiatives undertaken during 2013 have included:
• Continuation of the process mapping, risk & control analysis
1 6 B S P A n n u a l R e p o r t 2 0 1 3
2013 STRATEGIC BUSINESS UNIT REVIEW

and where required risk mitigation plans for key BSP processes;• Improved monitoring and analysis of non-lending related
losses across the Bank;• Assist Executives and Senior Management with analysis and
regular reporting of operational risk issues;• Identification of the Top 20 enterprise wide risks across
the Bank;• Enhanced the process in investigating fraudulent transactions; • Conducted regular operational risk, anti-money laundering
and fraud awareness workshops across the Bank. It is expected that a number of these activities will continue in 2014 with a renewed focus on further staff development and empowerment to continue proactively driving Operational Risk objectives.
internal audit
BSP has independent internal audit functions in PNG, Fiji (both the Bank and Life Insurance operations) and Solomon Islands with these various teams reporting, through the Head of Group Internal Audit, functionally to the Board Audit Risk & Compliance Committee (BARCC) in Port Moresby and administratively to the Group Chief Risk Officer. Major highlights during 2013 were the combined Central Banks’ (Bank of PNG, Reserve Bank of Fiji and Central Bank of the Solomon islands) supervisory examination of the BSP Group during May - July and the internal audit of the Bank’s Treasury & International Operations in PNG, with assistance from accountants, PricewaterhouseCoopers during November - December.
One of the key focus areas during 2013 was also the continued strengthening of the Bank’s IT Audit capabilities.
legal services & Company secretary
Legal Services provides an in-house legal counsel and advisory function for BSP. It is involved in legal advice on a range of matters to staff, many of which are time critical, with prompt and accurate advice being vital. The Head of Legal is also responsible for legal advice to the Executive. All contracts, leases and agreements are reviewed by Legal prior to execution. Legal Services also manage litigation matters involving the Bank. Company Secretary has responsibility for compliance with PomSoX reporting requirements, BPNG regulatory requirements, corporate compliance requirements, investor relations and also Board secretarial functions within the Bank.
huMan resourCes
The Human Resources SBU is a key strategic partner in the Bank supporting the operations of the Bank through its core HR Management functions.
In 2013, the HR SBU implemented the following key initiatives:
recruitment & selection
• Facilitated the identification of a number of senior national staff to replace outgoing expatriate contract workers;
• Strengthened our partnership with university and tertiary level institutions through career choice workshops and recruitment fairs;
• Utilised the psychometric testing tools and interviewing guides available in the Assessment Centre methodology for Graduate and High Potential recruitment;
• Facilitated the integration of BSP Rural staff into the parent Retail SBU and together with the Remuneration team aligned all salaries and benefits.
learning & development
As part of the Bank’s career development and succession planning program we initiated and facilitated the first three BSP staff for an ongoing three-month secondment in partnership with Barclays Africa Group Limited in Johannesburg, South Africa.
As part of the Bank’s Senior Managers leadership development initiative facilitated the attendance of a number of senior managers in externally provided Leadership programs.
Training focused on the development and bank-wide roll out of two key Bank initiatives – LendFast for loan origination and Cheque Processing which provides significant changes to the way the Bank process cheques.
Ongoing training initiatives for 2013 included:
• Conducted a number of leadership development courses for junior and middle management employees;
• Conducted a number of team leadership for change manage-ment courses for junior and middle management employees;
• In response to a training needs analysis (TNA) survey, delivered a variety of soft skills and technical skills courses;
• Facilitated Moody’s training in credit skills and business finance for Credit and Risk, Corporate Banking and Finance employees.
remuneration Management/succession Planning
• Aligned critical roles, key persons and assigned benefits and identified potential successors for critical roles to mitigate operational risks;
• in conjunction with SBU restructuring initiatives within the Bank, undertook Hay job evaluations, revised job grades and aligned salary levels to attract and / or retain specialist employees;
1 7B S P A n n u a l R e p o r t 2 0 1 3
2013 STRATEGIC BUSINESS UNIT REVIEW

• Conducted a market survey on total salary and benefits, aligned salaries in a number of key business units to maintain market competitiveness;
• Implemented automated Human Capital Management (HCM) payroll leave capture modules which eliminated manual processes and improved operational efficiencies;
• Continued to identify eligible national employees for partici-pation in the Bank’s First Home Owners Home Ownership Scheme and expanded the Bank’s assistance to staff building on traditional land through the Informal Housing Scheme.
hr operations
Development and implementation of the HCM system continued with the following milestones being realised:
• The Employee Self Service (ESS) and Manager Self Service (MSS) modules of HCM were implemented as the functional tools for all payroll leave captures;
• Operational efficiencies were realised through ESS and MSS automating of a number of staff payroll processes;
• Testing and validating of the HCM payroll system was completed through parallel runs with our CHRIS payroll system;
• HCM payroll was commissioned as the primary payroll system following the last pay period processing in December 2013;
• HCM became the source of truth of all management infor-mation and decision making reports.
HR Operations relaunched an updated Human Resource manual in an interactive, user friendly web based format.
Total head count was 2,947 (BSP PNG) and 3,951 (BSP Group). Staff turnover in 2013 was 10.0 percent compared to 17.0 percent in 2012.
Total training mandays for 2013 was 10,189 equating to almost 3.0 mandays per employee.
oPeraTions & inForMaTion TeChnology
The role of the Operations & Information Technology SBU is to provide support to both external customers of the Bank across the multiple channels which BSP has made available as well as internal clients (i.e. other SBUs within BSP) in developing the infrastructure to enable reliable and efficiently executed external customer transactions.
A key driver is the need to ensure that our technology is always on, always available. Whilst planned outages for implementa-tion of upgrades and certain other incidents related mostly to external service providers prevent the 100% threshold from being achieved, we achieved an availability level of 99.6% or more for our key systems which compares favourably to the banking industry regionally and, closer to home, has demonstrated greater reliability than that offered by peer banking institutions and other major service providers within Papua New Guinea. The critical front end processing system used to authorise card based transactions achieved 99.98% availability in 2013.
In addition to ensuring that all our critical systems had redun-dancy in terms of a secondary data centre location as well as contingency for potential individual equipment faults, significant
sandra fore, stanerd Wai and Joyce Narakobi were attached with Barclays africa Group limited in Johannesburg, south africa on a three month secondment.
1 8 B S P A n n u a l R e p o r t 2 0 1 3

effort was expended to identifying root causes for system outages and improving the IT infrastructure such that the number of these incidents be reduced. We can report that in overall terms such incidents reduced by more than 60% from 2012 making the exercise a highly successful one.
The SBU continues to contribute significantly to the expansion of the Bank’s new channel and automated processing capabili-ties. This past year saw the culmination of numerous technology projects resulting in the introduction of:
• Wantok Moni;• Mobile Banking for Solomon Islands;• Internet Banking for Solomon Islands;• Internet Payment Gateway;• KATS Phase 1: RTGS;• Automated Receipt Printing at Teller;• Retail Lending Origination System;• Customer Queuing; • EFTPoS Integration;• Infinium (HCM) Payroll Processing;• Management Information System (MARS);• Sun GL System Upgrade;• Internet Banking Phase 2;• Trade Finance Front Office portal;
In terms of the Bank’s Facilities Management, much work was undertaken towards the delivery of:
• Fit-out and activation of BSP Haus, NCD;• New BSP Tari Branch;• Six BSP Premium Centres;• 18 BSP Rural branches;• 34 new ATM locations;
• Major branch refurbishments in Mt.Hagen, Buka and Kavieng; • Ongoing activity towards development of new facilities
including the Pacific Operations Centre, Gordons Security Base, new Data Centre and the Lae Corporate Banking Centre.
Within the processing teams, there has been increased automation and reduced headcount within Channel Operations, International Operations and Lending Support/Collections. The introduction of the new Loan Origination System is enabling automatic funding of loan approvals as opposed to previous practice where manual postings were necessary resulting in headcount requirements for reconciliations and day 2 verifications. In the International Operations BU, a business as usual project was undertaken to increase the utilisation of the automated Reconciliation tool such that the number of accounts automatically reconciled is now greater than 800 as compared to the previous 300. This has resulted in the flexibility to both reduce headcount as well as redeploy staff to areas providing a greater added value to the organisation.
Channel Operations historically encompassed Cash Distribution Centre, ATM & EFTPoS Support, Kundupei Processing and Card Management including all corresponding transactional and settlement activities. In order to better streamline the organisation and focus operational activities within Operations and IT, this BU now also has responsibility for the National and Lae Operational Centres which handle the centralised processing activities for NCD and Lae branches. As part of the KATS Project, these areas will be transformed into processing, checking and control functions to take advantage of economies of scale thereby reducing headcount requirements both within the BU as well as in the Network. Within Channel Operations the number of changes implemented on an annual basis to improve controls and efficiency are too numerous to mention.
a customer using using the optiQ system to get a ticket.
1 9B S P A n n u a l R e p o r t 2 0 1 3
2013 STRATEGIC BUSINESS UNIT REVIEW
The largest headcount component within the SBU continues to be the Security BU which had 440 people. Given the country’s geographical spread and limited transport & security infrastructure, BSP’s assets require 24/7 protection which can only be provided by having an ample in-house security capability complemented by outsourcing in certain locations where security capacity is best provided by local firms. Efforts during the year focussed on placing decreased reliance on human elements and increasing the capacity of systems. This included risk rating of improved vehicle tracking, upgraded utilisation of security access systems, improved monitoring using CCTV systems and improved investigatory techniques for internal and external incidents.
Lastly, the BSP Customer Call Centre has now also been integrated within the Operations and IT SBU given the need to more closely integrate their largely in bound calling capabilities with the technology required to provide customer support in an integrated and standardised level.
Plans for 2014
In terms of premises, the completion of the Pacific Operations Centre, new Security Base, new Data Centre and the new Lae Corporate Banking Centre are all expected to be completed between Q3 and Q4 2014, with relocations taking place in Q4 and Q1 2015. The POC will result in almost 900 staff from different buildings within NCD consolidating within the new site in Waigani. In Lae, all Corporate Banking activity, BSP First as well as regional functions will be headquartered within the new building on the old airport road.
Branch improvement work will also be prominent in 2014. Expected refurbishments include Waigani Banking Centre (commenced in December 2013) and Tabubil being the most prominent and new branch fit-outs for Mendi and Lihir.
Other strategic objectives of the SBU include the continued improvement of the robustness of the infrastructure (technology, people, processes) given the need for continuous development in line with increasing business needs and changing technology.
FinanCe & Planning
a year of consolidation
In 2013, the Finance and Planning team has built on developmental work that had been outsourced in previous years, and has taken on the ongoing production and development of these initiatives, in Business Planning and Analysis, and in Middle Office.
In 2013 the Business Planning and Analysis (BPA) team facilitated Strategic Planning exercises at SBU level, and this fed directly into the budgeting process in the latter half of the year. The team also took over and delivered the ongoing production and development of BSP’s detailed Branch Profitability Analyses
and 3-year Models.
Improvements have also been made by Middle Office (for Treasury services) in 2013. The team resources have settled, and are continuing to develop a more detailed understanding of the underlying workings of the new system, leading to better improvement over reporting, control and monitoring activities between the system’s front desk customer interface and the back office control functions. Middle Office ends 2013 well positioned and looking forward to working with Treasury to facilitate the introduction of more sophisticated products into the market in 2014.
A reduced reliance on consulting accompanied the Group’s 2013 focus on cost reduction. Finance played a significant part in facilitating and driving cost reduction initiatives for the group, a major strategic focus in 2013. We envisage this focus will continue in 2014 and the Finance team will play an important role in ongoing exercises to achieve operating cost reduction and benefits realisation of capital investments.
Finance made progress towards its stated objectives for 2013. The team continued to develop and standardise reporting formats for the Group, Bank, and Strategic Business Units. Significant efforts were directed towards, and improvements were achieved, on the quality, accuracy, and timeliness of management information to stakeholders.
In 2013, the first phase of a project of key strategic importance was completed – Management Automated Reporting System (MARS) Phase 1. A Data Warehouse (DW) was built which draws data from the bank’s core banking systems. The DW included powerful interface capabilities allowing MARS to link with the bank’s other systems, with a Business Intelligence (BI) front end for queries and analytics. MARS will serve as a central repository of information and will be a core application of the bank’s Analytics function.
By the end of 2013, the bank had migrated some of its existing reporting and analysis functions into the DW, and this will continue through to 2014. During 2014, MARS Phase 2 will further streamline the MIS function and will allow bank users and stakeholders to generate broader insights into its customers, its products, its distribution channels, and its processes and operations.
Team
Finance was able to successfully recruit at a higher level in 2013 and retain its high performing staff. The Analytics team formerly sited within the Retail SBU was merged with the financial analytics team within Finance and Planning, a timely and more cohesive structure given the implementation of MARS. Skills and knowledge were improved as a result of meeting greater and more sophisticated reporting challenges, both internally and externally.
2 0 B S P A n n u a l R e p o r t 2 0 1 3

2013 STRATEGIC BUSINESS UNIT REVIEW
2 1B S P A n n u a l R e p o r t 2 0 1 3
lae CoMMerCial CeNTre
an artist’s impression of the new Commercial Centre in lae.
The centre will be complete and operational in the 2nd half of 2014.

2 2 B S P A n n u a l R e p o r t 2 0 1 3
KoMo BraNCH
Traditional dancers celebrate the opening of BsP’s Komo sub-Branch in June 2013. The branch serves both the local landowners and workers of the PNG lNG Project.

BSP has adopted an approach to Corporate Governance that is underpinned by its core values of Integrity, Leadership, People, Professionalism, Quality and Teamwork. This approach is supported by a comprehensive framework of Corporate Governance principles and policies. The BSP Board has demonstrated its commitment to developing and maintaining a standard of corporate governance that seeks to match global practice.
The Board ensures that it complies with the requirements of BSP’s home exchange, Port Moresby Stock Exchange (“POMSOX”). It also closely monitors developments in corporate governance principles and practice within Australia and has benchmarked itself against:
1. ASX Corporate Governance Council ‘Corporate Governance and Best Practice Recommendations’;
2. Australian Prudential Regulatory Authority Prudential Standard APS 510;
3. Standard Australia AS 8000-2003 Good Governance Principles
BSP is mindful of the advantages of demonstrating to investors that its corporate governance standards meet the requirements expected of companies listed in countries such as Australia. This Corporate Governance Statement therefore compares BSP’s corporate governance practices to the ASX Corporate Govern-ance Council and Best Practice Recommendations. BSP manages in excess of half the banking market in Papua New Guinea, and is predominantly owned by institutions and individuals in Papua New Guinea. The Board, management and staff of BSP are very much aware of their responsibilities to the people of Papua New Guinea. The set of Corporate Governance principles developed by BSP is intended to provide a framework that will help to ensure that BSP deals fairly and openly with all its stakeholders – share-holders, customers and staff alike.
BSP publishes its corporate governance practices on its website. This is available at www.bsp.com.pg in the shareholders section.
1. The Board oF direCTors
a) role and responsibility of the Board
The roles and responsibilities of the Board are defined in the Board Charter. This document also details the matters reserved for the Board and matters that have been delegated to manage-ment. The Board, with the support of its committees, is respon-
sible to the shareholders for the overall performance of the company including its strategic direction; establishing goals for management; and monitoring the achievement of those goals with a view to optimising company performance and increasing shareholder value.
Key functions of the Board include:
• overall strategy of the company, including operating, financing, dividends, and risk management;
• appointing the Group Chief Executive Officer and setting an appropriate remuneration package;
• appointing General Managers and setting appropriate remuneration packages;
• appointing the Company Secretary and setting an appropriate remuneration package;
• endorsing appropriate policy settings for management;
• reviewing Board composition and performance;
• reviewing the performance of management;
• approving an annual strategic plan and an annual budget for the company and monitoring results on a regular basis;
• ensuring that appropriate risk management systems are in place, and are operating to protect the company’s financial position and assets;
• ensuring that the company complies with the law and relevant regulations, and conforms with the highest standards of financial and ethical behaviour;
• acquisitions and disposals material to the business;
• establishing authority levels;
• Directors’ remuneration via the Remuneration & Nomina-tion Committee;
• selecting, with the assistance of the Audit, Risk and Compli-ance Committee, and recommending to shareholders, the appointment of external auditors;
• approving financial statements.
2 3B S P A n n u a l R e p o r t 2 0 1 3
CORPORATEGOVERnAnCE

The BsP Board of Directors
A number of these responsibilities have been delegated by the Board to various committees. The committees and their respon-sibilities are detailed in Section 2, Board Committees.
The Board has delegated to management responsibility for:
• developing the annual operating and capital expenditure budgets for Board approval, and monitoring performance against these budgets;
• developing and implementing strategies within the frame-work approved by the Board, and providing the Board with recommendations on key strategic issues;
• appointing management below the level of General Manager and preparing and maintaining succession plans for these senior roles;
• developing and maintaining effective risk management policies and procedures;
• keeping the Board and the market fully informed of material developments.
b) Membership, expertise, size and composition of the Board
The Corporate Governance Principles affirm that the majority of the Board should be independent. As is typical of small financial markets generally in Papua New Guinea, there are very consider-able demands on the relatively small numbers of people with the
skills and experience to fill the demanding role of Non-executive Director on the Boards of the Nation’s larger corporate institutions. In these circumstances it is inevitable that a number of the Non-Executive Directors of BSP will also have roles on the Boards, or in Senior Management, of institutions that may be significant shareholders in, or substantial customers of, the Bank. Directors of BSP are meticulous in handling situations where there could potentially be conflicts of interest, by declaring their interests in advance, and absenting themselves from any consideration of matters where a conflict might arise. The Bank’s Corporate Governance Principles require Directors to disclose any new Directorships and equity interests at each Board meeting.
The maximum number of Directors, as prescribed by the Constitu-tion approved by shareholders, is ten. At the date of this report there are ten Directors, with nine Non-executives designated as independent, plus the Group Chief Executive Officer. Under the Constitution, at each annual general meeting one-third of the company’s Directors, in addition to any Director appointed during the year, excluding the Group Chief Executive Officer, must offer themselves for re-election by the shareholders. Normally, Non-executive Directors are expected to serve a maximum of four three-year terms, dating from the AGM at which the newly elected Director is first confirmed by shareholders. This provision has effect from the date the Bank took its present form, following the merger of BSP with the Papua New Guinea Banking Corpora-tion in April 2002. In certain instances it may be considered that a director may bring valuable expertise, independent judgement and an ability to act which may determine that it is in the best interests of the Company for a director to serve beyond a fixed term.
The Board has a broad range of skills, experience and expertise that enables it to meet its objectives. Details of the Directors’
2 4 B S P A n n u a l R e p o r t 2 0 1 3

business backgrounds and experience are provided on pages 8 and 9.
The Board accepts that it has a responsibility to shareholders to ensure that it maintains an appropriate mix of skills and experience (without gender bias) within its membership, and consequently gives careful consideration to setting criteria for new appoint-ments it may recommend to shareholders in accordance with the BSP Constitution. It has delegated the initial screening process involved to its Remuneration and Nomination Committee which, in accordance with its Charter, may seek independent advice on possible new candidates for Directorships. All Directors must be satisfied that the best candidate has been selected.
Nominees of the Board and/or shareholders must meet the ‘fit and proper person’ criteria established by the Bank of Papua New Guinea before they can take their place on the Board. The Board does not accept that any office bearer and/or employee of an institutional shareholder, by virtue only of his/her position within that organisation, have an automatic right to be appointed to the Board.
On joining the Board, new Directors will be provided with a comprehensive orientation programme.
c) role and selection of the Chairman
The Chairman is elected by the Directors every two years and holds the position for a maximum of three terms. His role includes:
• ensuring all new Board members are fully aware of their duties and responsibilities;
• providing effective leadership on the company’s strategy;
• presenting the views of the Board to the public;
• ensuring the Board meets regularly throughout the year, and that minutes are taken and recorded accurately;
• setting the agenda of meetings and maintaining proper conduct during meetings;
• reviewing the performance of Non-executive Directors;
The Chairman is not permitted to occupy the role of Chief Execu-tive Officer.
Kostas Constantinou, OBE, who sits on the Board as an independent Non-executive Director, is the current Chairman.
d) director independence and Conflict of interest
Directors are determined to be independent if they are judged to be free from any material or other business relationship with the Bank that would compromise their independence. Prior to appointment Directors designated are required to provide infor-mation to the Board for it to assess their independence.
In assessing the independence of Directors, the Board will consider a number of criteria including:
• the Director is not an executive of the bank;
• the Director is not a substantial shareholder of the bank or otherwise associated directly with a substantial shareholder of the bank;
• the Director has not within the last three years been a material consultant or a principal of a material professional adviser to the Bank or a group member, or an employee materially associated with a service provided;
• the Director is not a material supplier to, or customer of the Bank or other group member, or a material consultant to the Bank or other group member, or an employee materially associated with a material supplier or customer;
• the Director has no material contractual relationship with the Bank or other group member other than as a Director of the bank;
• the Director is free from any interest and any business or other relationship which could, or could reasonably be perceived to, materially interfere with the Director’s ability to act in the best interests of the Bank.
This information is assessed by the Board to determine whether on balance the relationship could, or could reasonably be perceived to, materially interfere with the exercise of the Director’s respon-sibilities. Materiality is assessed on a case-by-case basis.
As noted earlier, the Board is cognisant of the need to avoid conflicts of interest and it has in place policies and procedures for the reporting of any matter, which may give rise to a conflict between the interests of a Director and those of the Group. These arrangements are designed to ensure that the independence and integrity of the Board are maintained.
The Bank of Papua New Guinea sets prudential limits on loans to ‘associated persons’: Bank South Pacific fully complies with these requirements.
Financial Note 30, Related party transactions, on pages 76- 78, provides details of Directors’ interests.
e) Meetings of the Board and attendance
Scheduled meetings of the Board are held six times a year, and the Board meets on other occasions as necessary to deal with matters requiring attention. Meetings of Board Committees are scheduled regularly during the year. The Board has a policy of rotating its meetings between locations where the Group has a significant presence. On these occasions the Board also visits company operations and meets with local management and key customers.
The Chairman, in consultation with the Chief Executive Officer,
CORPORATE GOVERNANCE
2 5B S P A n n u a l R e p o r t 2 0 1 3

determines meeting agendas. Meetings provide regular oppor-tunities for the Board to assess BSP’s management of financial, strategic and major risk areas. To help ensure that all Directors are able to contribute meaningfully, papers are provided to Board members one week in advance of the meeting. Broad ranging discussion on all agenda items is encouraged, with healthy debate seen as vital to the decision making process.
Financial Note 27, Directors’ and Executive remuneration, on pages 72 - 74, provides attendance details of Directors at Board meetings during 2013.
f) review of Board Performance
The Remuneration and Nomination Committee reviews the processes by which the Board regularly assesses its own perfor-mance in meeting its responsibilities. It is intended to extend the assessment of the Board as a whole to include an assessment of the contribution of each individual Director. The Board is cognisant of the need to continually identify areas for improvement; to ensure that it meets the highest standards of corporate govern-ance; and for the Board and each Director to make an appropriate contribution to the Group’s objective of providing value to all its stakeholders. The performance review is conducted annually, and may involve assistance from external consultants.
g) Board access to information and advice
All Directors have unrestricted access to company records and information and receive regular detailed financial and operational
reports to enable them to carry out their duties. The General Managers make regular presentations to the Board on their areas of responsibility. The Chairman and the other Non-executive Directors have the opportunity to meet with the Chief Executive Officer and the General Managers for further consultation, and to discuss issues associated with the fulfilment of their roles as Directors.
The Board recognises that in certain circumstances individual Directors may need to seek independent professional advice, at the expense of the company, on matters arising in the course of their duties. Any advice so received is made available to other Directors. Any Director seeking such advice is required to give prior notice to the Chairman of his or her intention to seek independent professional advice.
2. Board CoMMiTTees
a) Board Committees and Membership
The Board has established two committees whose functions and powers are governed by their respective charters. These committees are the Audit Risk and Compliance Committee, and the Remuneration and Nomination Committee.
Membership of the committees and a record of attendance at committee meetings during the year is detailed in table below. Remuneration details are provided in Financial Note 27 on page 72.
The Board, management and staff of BsP are very much aware of their responsibili-ties to the people of Papua New Guinea. The set of Corporate Governance principles developed by BsP is intended to provide a framework that will help to ensure that BsP deals fairly and openly with all its stakeholders – shareholders, customers and staff alike.
2 6 B S P A n n u a l R e p o r t 2 0 1 3
CORPORATE GOVERNANCE
Membership of Board Committees as at 31/12/2013: ------------------------------------------------------------------------------------- Board Audit Risk & Remuneration & Compliance Committee Nomination Committee-------------------------------------------------------------------------------------Geoff Robb 6/6 Chair Sir Nagora Bogan 4/6 Gerea Aopi 4/6 Arthur Sam1 6/6 Freda Talao2 5/6 Kostas Constantinou 2/2* Tom Fox 2/2* Chair 3/3Ila Temu 2/2* 3/3Lyle Procter 2/2* 3/3-------------------------------------------------------------------------------------1 Arthur Sam is a non-executive, non-director, appointed by the board for board development purposes. 2Freda Talao attends as an observer director. *Board members who attend the BARCC meeting to discuss the year end and half year accounts.
b) Committee Charters
The Committee Charters are available in the shareholders infor-mation section of the BSP website www.bsp.com.pg.
c) Committee structure
Committee members are chosen for the skills, experience and other qualities they bring to the committee. At the next Board meeting following each committee meeting, the Board is given a report by the Chairman of the respective committee and minutes of the meeting are tabled.
The Audit Risk and Compliance Committee is comprised of three Non-executive Directors, a majority of whom should be independent, and who are duly appointed by the Board. The Chairman of the Audit Risk and Compliance Committee must be one of the independent Directors, other than the Chairman of the Board. Each member should be capable of making a valuable contribution to the committee and membership is reviewed annually by the BSP Board.
The Remuneration and Nomination Committee comprises three Non-executive Directors, the majority of whom should be independent, and who are duly appointed by the Board. The Chairman of the Remuneration and Nomination Committee must be one of the independent Directors, other than the Chairman of the Board.
Each member should be capable of making a valuable contribu-tion to the committee, and membership is reviewed annually by the BSP Board.
A review of the performance of committee members will form part of the Board’s performance review.
d) Board audit risk & Compliance Committee
The Audit Risk and Compliance Committee is delegated by the Board with responsibility for reviewing and monitoring the:
• integrity of the financial statements and the financial reporting and audit process;
• external auditor’s qualifications, performance and independ-ence;
• performance of the internal audit function of the bank;
• performance of the operational risk function of the bank;
• systems of internal control and management of all risks;
• systems for ensuring operational efficiency and cost control;
• systems for approval and monitoring of expenditure including capital expenditure;
• processes for monitoring compliance with laws and regula-tions (both in Papua New Guinea and overseas);
• implementation of Board decisions by management and making recommendations to the Board for the appointment of the external auditor;
• annual internal audit plan and its ongoing review.
In the course of fulfilling its mandate, the committee meets with both the internal and external auditors without management present.
i. annual Financial statements
The Audit Risk and Compliance Committee reviews the annual financial statements to determine whether they are complete and consistent with the information known to committee members and to assess whether the financial statements reflect appropriate accounting principles. In particular it:
• pays attention to complex and/or unusual transactions;
• focuses on judgmental areas, for example those involving valuation of assets and liabilities; provisions; litigation reserves; and other commitments and contingencies;
• meets with management and the external auditors to review the financial statements and the results of the audit;
• reviews the other sections of the Annual Report before its release and considers whether the information is under-standable and consistent with members’ knowledge about the bank and its operations;
• satisfies itself as to the accuracy of the financial accounts,
2 7B S P A n n u a l R e p o r t 2 0 1 3

reconciles them with management accounts presented to the committee, and signs off on the financial accounts of the bank before they are submitted to the Board.
ii. external audit
The Audit Risk and Compliance Committee is responsible for making recommendations to the Board on appointment and terms of engagement of BSP external auditors. The selection is made from appropriately qualified companies in accordance with Board policy. The Board submits the name of the recommended appointee to shareholders for ratification. In line with the policy of the Bank of Papua New Guinea, the signing partner in the external audit firm must be rotated at least every three years.
The committee reviews annually the performance of the external auditors and makes recommendations to the Board regarding the continuation or otherwise of their appointment, consistent with the Bank of Papua New Guinea’s Prudential Standard No. 7/2005 - External Auditors, while ensuring their independence is in line with Board policy.
There is a review of the external auditor’s proposed audit scope and approach, to ensure there are no unjustified restrictions. Meetings are held separately with the external auditors to discuss any matters that the committee or the external auditors believe should be discussed privately. The external auditor attends meetings of the Audit Risk and Compliance Committee at which the external audit and half yearly review are agenda items.
The committee ensures that significant findings and recommenda-tions made by the external auditors are received and discussed promptly, and that management responds to recommendations by the external auditors in a timely manner.
The duly appointed external audit firm may not be engaged by the Group to provide specialist consultancy services relating to financial, strategic and/or taxation matters.
The external auditor is invited to the Annual General Meeting of shareholders and is available to answer relevant questions from shareholders.
The Bank of Papua New Guinea Prudential Standards provide for a tri-partite meeting between BPNG, the external auditors, and the Bank, if required.
iii. internal audit
The Audit Risk and Compliance Committee approves, on the recommendation of management, the appointment of Head of Internal Audit. The committee meets regularly with Head of Internal Audit.
Reviews are undertaken of the scope of the work of the internal audit function to ensure no unjustified restrictions or limitations have been placed upon Audit and Risk Departments. The Audit Risk and Compliance Committee also reviews the qualifications
of internal audit personnel and endorses the appointment, replacement, reassignment or dismissal of the internal auditors. An independent review by an expert consultant is made regularly as to the effectiveness of the internal audit and risk function. These reports are presented to the Audit Risk and Compliance Committee, and the Board.
The Audit Risk and Compliance Committee meets separately with the internal auditors to discuss any matters that the committee, or the internal auditors, believe should be discussed privately. The Internal Auditor has direct access to the Audit Risk and Compliance Committee and to the full Board. The committee ensures that significant findings and recommendations made by the internal auditors are received and discussed promptly, and that management responds to recommendations by the internal auditors on a timely basis.
Internal Audit meets with the external auditors half yearly, to review the scope and findings of internal audit’s annual audit plan, and the extent of the external audit plan, having regard to internal audit’s findings.
iv. Compliance
The Audit Risk and Compliance Committee reviews the effective-ness of the systems for monitoring compliance with all legal and regulatory obligations and the Constitution of BSP. It also reviews the results of management’s investigation and follow-up (including disciplinary action) of any fraudulent acts, or non-compliance.
The committee obtains regular updates from management and the bank’s legal officers regarding compliance matters, and satisfies itself that all regulatory compliance matters have been considered in the preparation of the financial statements.
Reviews of the findings of any examinations by regulatory agencies are undertaken and the Chairman of the Audit Risk and Compliance Committee has the right to approach a regulator directly in the event of a prudential issue arising.
v. risk Management
The committee’s role in the bank’s risk management processes are detailed in 3(b).
e) Board remuneration and nomination Committee
The Remuneration and Nomination Committee has been estab-lished to assist the Board in fulfilling its oversight responsibilities in respect of Board and Senior Executive Management selection, appointment, review and remuneration.The responsibilities of the Remuneration and Nomination Committee are:
• oversee the selection and appointment of a Chief Executive Officer and recommend an appropriate remuneration and benefits package to the full Board;
CORPORATE GOVERNANCE
2 8 B S P A n n u a l R e p o r t 2 0 1 3

• determine and review appropriate remuneration and benefits of Directors for recommendation to the full Board, and subsequently to the shareholders;
• identify and maintain a clear succession plan for the Execu-tive Management Team, ensuring an appropriate mix of skills and experience as well as appropriate remuneration and benefits packages are in place and reviewed regularly;
• ensure that the Board itself maintains an appropriate mix of skills and experience necessary to fulfil its responsibilities to shareholders while maintaining a world class Corporate Governance regime;
• receive and endorse positions/titles recommended by the Chief Executive Officer from time to time as applying to designated Senior Executive Management positions;
• review the procedures in place to ensure that all new Senior Executive appointees are adequately qualified and experi-enced, and that proper recruitment procedures are followed;
• review and make recommendations to the Board on the appointment and terms and conditions of employment to all Senior Executive Management positions;
• review and approve all termination arrangements for such Senior Executives;
• review transactions between the Group and any of the Direc-tors or relevant Senior Executives;
• review and make recommendations to the Board on employee remuneration and benefits policies and practices generally;
• engage external consultants as and when deemed appropriate to benchmark remuneration packages for Executives and Senior Management;
• review Board performance, tenure, and succession planning.
The Board has in place a review process, led by the Chairman, that involves a peer review of performance based on a broad range of criteria. A performance review has been performed every year since 2010.
3. risK ManageMenT
a) approach to risk Management
The Group’s Risk Management activities are aligned to the achievement of the Group’s Objectives, Goals and Strategy. The Board, in consultation with the Executive Committee, determines the Group’s risk appetite and risk tolerance. These benchmarks are used in the risk identification, analysis and risk evaluation processes.
BSP distinguishes the following major risks:
Credit risk: The potential for financial loss where a customer or counter party fails to meet their financial obligation to the Group.
market risk: The potential financial loss arising from the Group’s activities in financial, including foreign exchange, markets. More detailed commentary on financial risk management is provided in the Notes to the Financial Accounts.
2 9B S P A n n u a l R e p o r t 2 0 1 3
BsP has adopted an approach to Corporate Governance that is underpinned by its core values of integrity, leadership, People, Professionalism, Quality and Teamwork.
liquidity risk: The risk of failure to adequately meet cash demand in the short term.
interest risk: Risk to earnings from movement in interest rates.
Operational Risk: The risk of loss resulting from inadequate or failed internal processes, people, or from external events, including legal and compliance risk.
The Group’s Asset & Liability Committee monitors market risk, interest risk, and liquidity risk, and the Credit Committee monitors credit risk. Operational risk is monitored by the Operational Risk Committee, including the maintenance of a risk register system that has been implemented across the Group. The Executive Committee and the Board overview the highest tier of risks within these risk registers.
The Group’s risk management policy ensures that the Group has in place acceptable limits for the risks identified by the Group’s employees. The risk management approach encompasses the following:
• defining the types of risks that will be addressed by each functional or policy area (i.e. credit risk, interest rate risk, liquidity risk, operational risk, etc.);
• ensuring that mechanisms for managing (identifying, measuring, and controlling) risk are implemented and maintained to provide for organisation-wide risk management;
• developing information systems to provide early warning, or immediate alert, of events or situations that may occur, or already exist, that could create one or more types of risk for the Group;
• creating and maintaining risk management tools, including those requested by the Board, such as policies, procedures, risk registers, controls and independent testing, personnel management and training, and planning;
• instituting and reviewing risk measurement techniques that Directors and management may use to establish the Group’s risk tolerance, risk identification approaches, risk supervision or controls, and risk monitoring processes;
• developing processes for those areas that represent poten-tial risks;
• establishing appropriate management reporting systems regarding these risks so individual managers are provided with a sufficient level of detail to adequately manage and control the Group’s risk exposures.
b) risk Management roles & responsibilities
The Board accepts responsibility for ensuring it has a clear under-standing of the types of risks inherent in the Group’s activities. Therefore responsibility for overall risk management in BSP is
vested with the Board. However every employee from Execu-tive Management to the newest recruit has a responsibility and a part to play in the process.
There is a formal system of financial and operational delegations from the Board to the Chief Executive Officer, and from the Chief Executive Officer to the General Managers. These delegations reflect the Group’s risk appetite, and are cascaded down to managers who have skills and experience to exercise them judiciously.
The Board defines the accountabilities (including delegated approval/control authorities/limits) and reporting/monitoring requirements for the risk management process. The severity of risks identified in the risk identification, analysis and evaluation processes, and noted in the Strategic Business Unit Risk Registers, is used to determine the approval/control authorities/limits. The Board reviews these risk limits annually along with an annual review of the Group’s significant risks.
The Board has adopted guidelines, with the help of manage-ment analysis, covering the maximum loss exposure the Group is able and willing to assume. These guidelines are detailed in the Group’s Risk Policy and Procedures Manual which has been externally reviewed and approved by the Board.
The Board has also delegated to the Audit Risk and Compliance Committee responsibility for overview of loss control and for overseeing the risk management function.
The Audit Risk and Compliance Committee is responsible for providing regular reports and recommendations to the Board on the risk management activities of the Group, especially relating to risk issues that are outside of the authority of the Group’s Executive Committee to approve.
The Group’s Executive Committee is responsible for deliberating on risk management issues which are outside of the delegated authorities/ limits of the Credit Committee, Asset and Liability Committee (ALCO) and General Managers, with escalation of these issues to the Audit Risk and Compliance Committee, and the Board itself, in case of need.
c) Management assurance
The Board is provided with regular reports about BSP’s financial condition and its operating performance. Annually, the Chief Executive Officer and the Chief Financial Officer certify to the Board that:
• the financial records of the Group have been properly maintained and that they accurately record the true financial position of the Group;
• the financial statements and notes meet all appropriate accounting standards;
• there are sound systems of risk management and control that are operating effectively;
3 0 B S P A n n u a l R e p o r t 2 0 1 3
CORPORATE GOVERNANCE

Additionally all General Managers provide bi-annual statements attesting that;
• they have assessed and documented the risks and internal control procedures in their Strategic Business Unit;
• they have identified any changes in business, operations and computer systems and the risks that may arise from those changes;
• the risk management and internal compliance and control systems are appropriate and operating efficiently and effectively;
• any weaknesses in the risk management and internal compli-ance and control systems have been identified and remedial action taken.
4. eThiCal BehaViour
BSP acknowledges the need for Directors and employees at all levels to observe the highest standards of ethical behaviour when undertaking BSP business. To this end, the Board has adopted:
• a Code of Conduct for both Directors and members of the Executive Management team of the Group and stipulated that each Director, and relevant employees, acknowledge in writing having read, understood and agreed to abide by the Code; and
• a Corporate Mission, Objectives, and Core Values Statement which establishes principles to guide all employees in the day to day performance of their individual functions within the Group.
To ensure the maintenance of high standards of corporate behav-iour on an ongoing basis, the Board further stipulates that senior management periodically undertake an appropriate communi-cation programme to reinforce both the Code and Core Values Statements. All Directors are encouraged to maintain member-ship of an appropriate Directors’ Association to keep abreast of current trends in Directors’ duties, responsibilities and corporate governance issues.
BSP is committed to a culture in which it is safe and acceptable for employees, customers and suppliers to raise concerns about poor or unacceptable practices, irregularities, corruption, fraud and misconduct.
The Group has adopted a whistle-blowing policy that is designed to support and encourage staff to report in good faith matters such as:
• unacceptable practices;• irregularities or conduct which is an offence or a breach of
laws of the countries in which BSP operates in (actions and decisions against the laws of relevant countries including non-compliance);
• corruption;• fraud;
• misrepresentation of facts;• decisions made and actions taken outside established BSP
policies & procedures;• sexual harassment;• abuse of Delegated Authorities;• misuse of Group assets;• disclosures related to miscarriages of justice;• health and safety risks, including risks to the public as well
as other employees;• damage to the environment;• other unethical conduct;• failure to comply with appropriate professional standards;• abuse of power, or use of the Group’s powers and authority
for any unauthorised purpose or personal gain;• breach of statutory codes of practice.
Directors and management of the Group are subject to Securities Act 1997 restrictions for buying, selling or subscribing for securi-ties in the Group if they are in possession of inside information, i.e. information which is not generally available and, if it were generally available, a reasonable person would expect to have a material effect on the price or value of the securities of the Group.
Further, Directors and management may only trade in the securi-ties of the Group, subject to the foregoing insider trading restric-tions, during each of the eight weeks following the announce-ments of half yearly profit and yearly profit or the date of issue of a prospectus. Management should discuss proposed share trades with the Chief Executive Officer in advance, who in turn will keep the Chairman of the Board appraised of management activities. Directors should discuss proposed share trades with the Chairman in advance.
In addition Directors and management must not trade in any other entity if inside information on such entity comes to the attention of the Director or management by virtue of holding office as an Officer of the Group.
5. MarKeT disClosure
The Group’s continuous disclosure regime is fundamental to the rights of shareholders to receive information concerning their securities. The most important aspect of the Group’s shareholder communication policy is to comply with the continuous disclosure regime and to implement best practice disclosure policy.
Market announcements are posted to BSP’s website immediately after release to the market. All market announcements made by the bank since its listing in August 2003 are currently available on the website.
Where BSP provides financial results’ briefings to analysts or media, these briefings are published on the website as soon as possible after the event. In any event, no material information which has not been previously released to the market is covered in such briefings. The material upon which the briefing is based (such as slides or presentations) is released to the market prior to the briefing.
3 1B S P A n n u a l R e p o r t 2 0 1 3
CORPORATE GOVERNANCE

The Group’s insider trading rules are important adjuncts to the continuous disclosure regime in ensuring that shareholders are given fair access to material information regarding securities. BSP seeks to limit the opportunity for insider trading in its own securities through its continuous disclosure policies and the dealing rules applying to its employees and Directors.
6. shareholder CoMMuniCaTions
BSP’s Code of Conduct requires its employees to act with high standards of honesty, integrity, fairness and equity in all aspects of their employment with BSP.
With this in mind, BSP commits to dealing fairly, transparently and openly with both current and prospective shareholders using available channels and technologies to communicate widely and promptly. BSP commits to facilitating participation in shareholder meetings, and dealing promptly with shareholder enquiries.
Our shareholder communication policy is built around compliance with disclosure obligations and aspiring to be at the forefront of best practice in disclosure. Our framework for communicating with shareholders is to concisely and accurately communicate:
• our strategy;• how we implement that strategy; and• the financial results consequent upon our strategy and its
implementation.
The Group uses shareholder forums such as the Annual General Meeting, and group meetings with larger shareholders, within disclosure policies, to communicate financial performance and strategies.
7. reMuneraTion
BSP remuneration policy for senior management is comprised of a fixed component and an at risk component that is a combination of short term rewards and long term incentives. The remuneration packages of General Managers and the Chief Executive Officer are approved by the Remuneration and Nomination Committee, and details are provided by the committee to the Board.Fixed remuneration of senior management is reviewed at the time of contract renewal taking into account the nature of the role, the pay position relative to comparable market pay levels, and individual and business performance.
Non-executive Directors are remunerated on a fixed basis within an aggregate Directors’ fee pool approved periodically by share-holders. The shareholders in 2012 approved an increase in the pool to K2.00 million. During 2013 K1.43 million of the pool was utilised (2012: K1.42 million).
A table of fees paid to Directors during 2013 is produced on page 72. Non-executive Directors are not paid any retirement or superannuation benefits, nor do they participate in any share option programmes.
3 2 B S P A n n u a l R e p o r t 2 0 1 3
CORPORATE GOVERNANCE

3 3B S P A n n u a l R e p o r t 2 0 1 3
CusToMer serViCe
BsP will place emphasis on training and career development of our staff. This will involve product knowledge to provide staff with the confidence to sell our products to our customers, specialist skills training, leadership development, and tailored multi-year programmes for our future leaders.
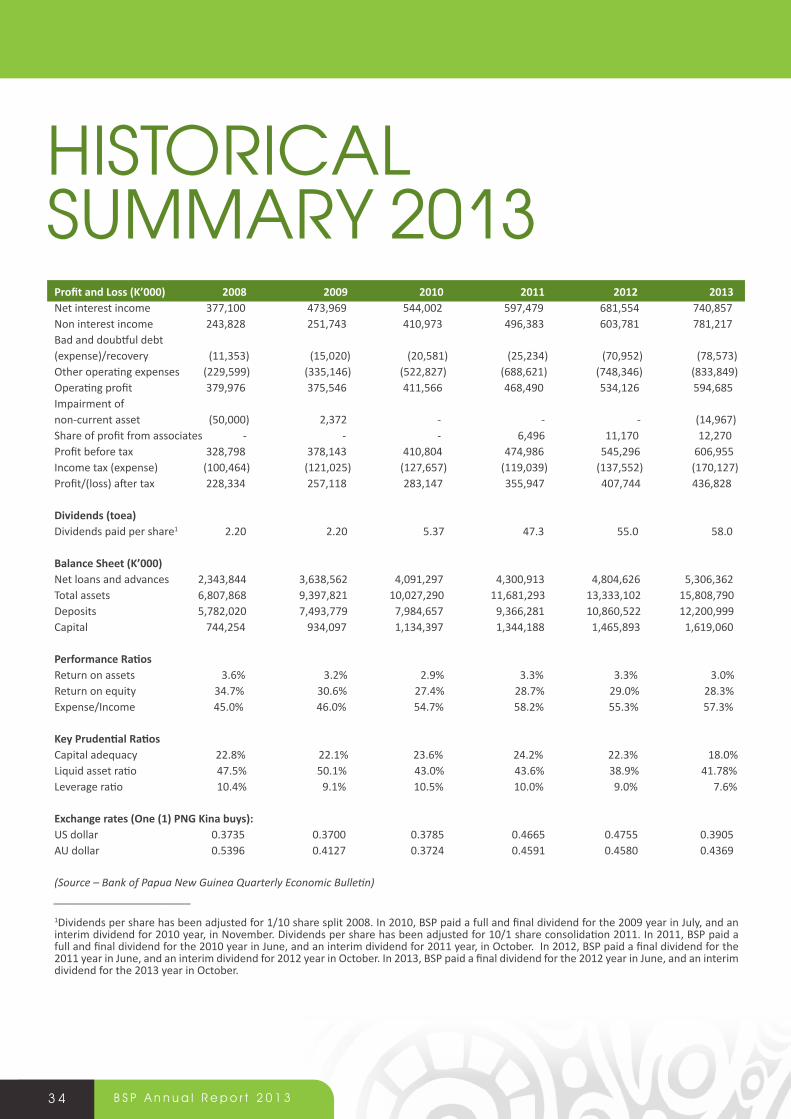
3 4 B S P A n n u a l R e p o r t 2 0 1 3
HISTORICAL SuMMARY 2013
Profit and Loss (K’000) 2008 2009 2010 2011 2012 2013Net interest income 377,100 473,969 544,002 597,479 681,554 740,857Non interest income 243,828 251,743 410,973 496,383 603,781 781,217Bad and doubtful debt(expense)/recovery (11,353) (15,020) (20,581) (25,234) (70,952) (78,573)Other operating expenses (229,599) (335,146) (522,827) (688,621) (748,346) (833,849)Operating profit 379,976 375,546 411,566 468,490 534,126 594,685Impairment of non-current asset (50,000) 2,372 - - - (14,967)Share of profit from associates - - - 6,496 11,170 12,270Profit before tax 328,798 378,143 410,804 474,986 545,296 606,955Income tax (expense) (100,464) (121,025) (127,657) (119,039) (137,552) (170,127)Profit/(loss) after tax 228,334 257,118 283,147 355,947 407,744 436,828
Dividends (toea) Dividends paid per share1 2.20 2.20 5.37 47.3 55.0 58.0
Balance Sheet (K’000) Net loans and advances 2,343,844 3,638,562 4,091,297 4,300,913 4,804,626 5,306,362Total assets 6,807,868 9,397,821 10,027,290 11,681,293 13,333,102 15,808,790Deposits 5,782,020 7,493,779 7,984,657 9,366,281 10,860,522 12,200,999Capital 744,254 934,097 1,134,397 1,344,188 1,465,893 1,619,060
Performance Ratios Return on assets 3.6% 3.2% 2.9% 3.3% 3.3% 3.0%Return on equity 34.7% 30.6% 27.4% 28.7% 29.0% 28.3%Expense/Income 45.0% 46.0% 54.7% 58.2% 55.3% 57.3%
Key Prudential Ratios Capital adequacy 22.8% 22.1% 23.6% 24.2% 22.3% 18.0%Liquid asset ratio 47.5% 50.1% 43.0% 43.6% 38.9% 41.78%Leverage ratio 10.4% 9.1% 10.5% 10.0% 9.0% 7.6%
Exchange rates (One (1) PNG Kina buys): US dollar 0.3735 0.3700 0.3785 0.4665 0.4755 0.3905AU dollar 0.5396 0.4127 0.3724 0.4591 0.4580 0.4369
(Source – Bank of Papua New Guinea Quarterly Economic Bulletin) _______________________
1Dividends per share has been adjusted for 1/10 share split 2008. In 2010, BSP paid a full and final dividend for the 2009 year in July, and an interim dividend for 2010 year, in November. Dividends per share has been adjusted for 10/1 share consolidation 2011. In 2011, BSP paid a full and final dividend for the 2010 year in June, and an interim dividend for 2011 year, in October. In 2012, BSP paid a final dividend for the 2011 year in June, and an interim dividend for 2012 year in October. In 2013, BSP paid a final dividend for the 2012 year in June, and an interim dividend for the 2013 year in October.
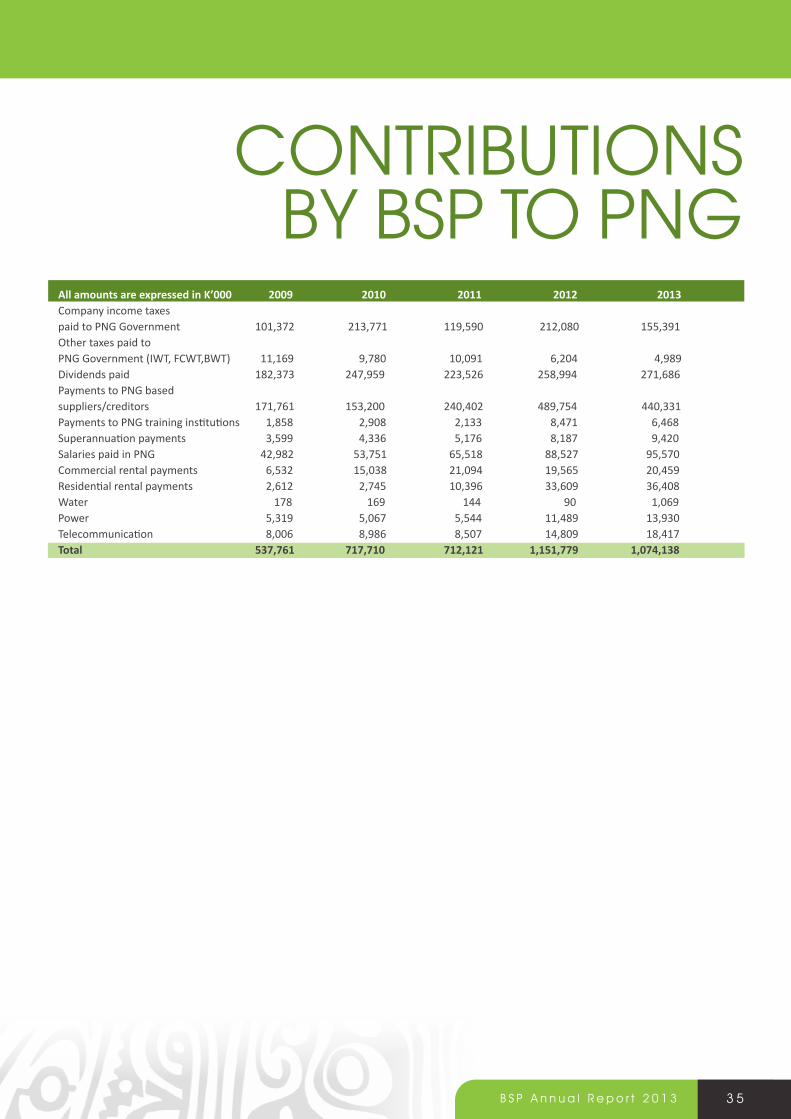
3 5B S P A n n u a l R e p o r t 2 0 1 3
COnTRIBuTIOnS BY BSP TO PnG
All amounts are expressed in K’000 2009 2010 2011 2012 2013Company income taxes paid to PNG Government 101,372 213,771 119,590 212,080 155,391Other taxes paid toPNG Government (IWT, FCWT,BWT) 11,169 9,780 10,091 6,204 4,989Dividends paid 182,373 247,959 223,526 258,994 271,686Payments to PNG based suppliers/creditors 171,761 153,200 240,402 489,754 440,331Payments to PNG training institutions 1,858 2,908 2,133 8,471 6,468Superannuation payments 3,599 4,336 5,176 8,187 9,420Salaries paid in PNG 42,982 53,751 65,518 88,527 95,570Commercial rental payments 6,532 15,038 21,094 19,565 20,459Residential rental payments 2,612 2,745 10,396 33,609 36,408Water 178 169 144 90 1,069Power 5,319 5,067 5,544 11,489 13,930Telecommunication 8,006 8,986 8,507 14,809 18,417total 537,761 717,710 712,121 1,151,779 1,074,138
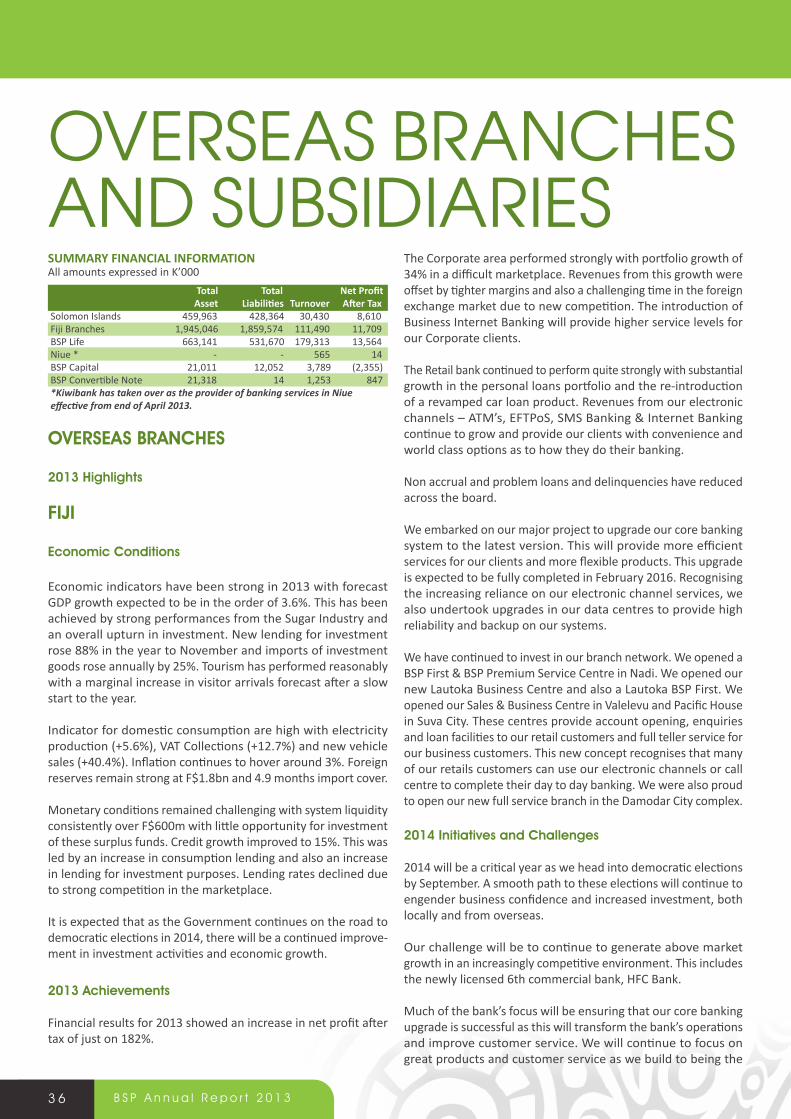
3 6 B S P A n n u a l R e p o r t 2 0 1 3
summary FinanCial inFormationAll amounts expressed in K’000 Total Total Net Profit Asset Liabilities Turnover After TaxSolomon Islands 459,963 428,364 30,430 8,610Fiji Branches 1,945,046 1,859,574 111,490 11,709BSP Life 663,141 531,670 179,313 13,564Niue * - - 565 14BSP Capital 21,011 12,052 3,789 (2,355)BSP Convertible Note 21,318 14 1,253 847*Kiwibank has taken over as the provider of banking services in Niue effective from end of April 2013.
oVerseas BranChes
2013 highlights
Fiji
economic Conditions
Economic indicators have been strong in 2013 with forecast GDP growth expected to be in the order of 3.6%. This has been achieved by strong performances from the Sugar Industry and an overall upturn in investment. New lending for investment rose 88% in the year to November and imports of investment goods rose annually by 25%. Tourism has performed reasonably with a marginal increase in visitor arrivals forecast after a slow start to the year.
Indicator for domestic consumption are high with electricity production (+5.6%), VAT Collections (+12.7%) and new vehicle sales (+40.4%). Inflation continues to hover around 3%. Foreign reserves remain strong at F$1.8bn and 4.9 months import cover.
Monetary conditions remained challenging with system liquidity consistently over F$600m with little opportunity for investment of these surplus funds. Credit growth improved to 15%. This was led by an increase in consumption lending and also an increase in lending for investment purposes. Lending rates declined due to strong competition in the marketplace.
It is expected that as the Government continues on the road to democratic elections in 2014, there will be a continued improve-ment in investment activities and economic growth.
2013 achievements
Financial results for 2013 showed an increase in net profit after tax of just on 182%.
The Corporate area performed strongly with portfolio growth of 34% in a difficult marketplace. Revenues from this growth were offset by tighter margins and also a challenging time in the foreign exchange market due to new competition. The introduction of Business Internet Banking will provide higher service levels for our Corporate clients.
The Retail bank continued to perform quite strongly with substantial growth in the personal loans portfolio and the re-introduction of a revamped car loan product. Revenues from our electronic channels – ATM’s, EFTPoS, SMS Banking & Internet Banking continue to grow and provide our clients with convenience and world class options as to how they do their banking.
Non accrual and problem loans and delinquencies have reduced across the board.
We embarked on our major project to upgrade our core banking system to the latest version. This will provide more efficient services for our clients and more flexible products. This upgrade is expected to be fully completed in February 2016. Recognising the increasing reliance on our electronic channel services, we also undertook upgrades in our data centres to provide high reliability and backup on our systems.
We have continued to invest in our branch network. We opened a BSP First & BSP Premium Service Centre in Nadi. We opened our new Lautoka Business Centre and also a Lautoka BSP First. We opened our Sales & Business Centre in Valelevu and Pacific House in Suva City. These centres provide account opening, enquiries and loan facilities to our retail customers and full teller service for our business customers. This new concept recognises that many of our retails customers can use our electronic channels or call centre to complete their day to day banking. We were also proud to open our new full service branch in the Damodar City complex.
2014 initiatives and Challenges
2014 will be a critical year as we head into democratic elections by September. A smooth path to these elections will continue to engender business confidence and increased investment, both locally and from overseas.
Our challenge will be to continue to generate above market growth in an increasingly competitive environment. This includes the newly licensed 6th commercial bank, HFC Bank.
Much of the bank’s focus will be ensuring that our core banking upgrade is successful as this will transform the bank’s operations and improve customer service. We will continue to focus on great products and customer service as we build to being the
OVERSEAS BRAnCHES AnD SuBSIDIARIES
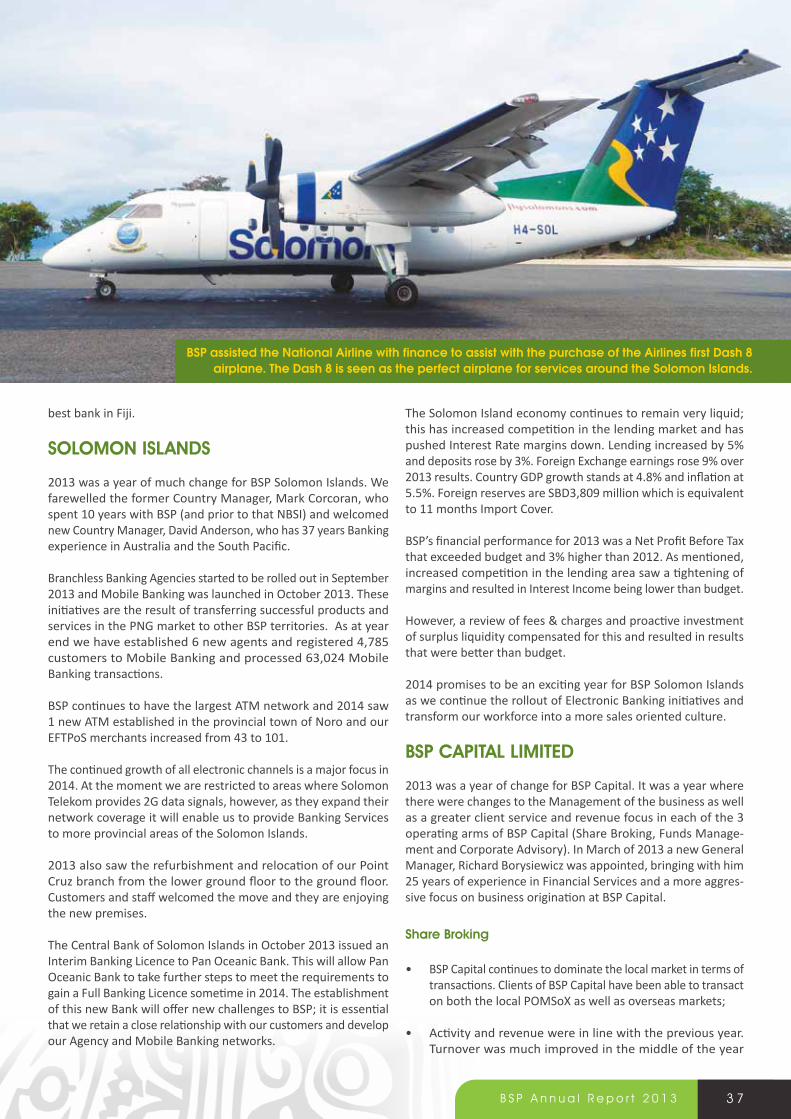
3 7B S P A n n u a l R e p o r t 2 0 1 3
best bank in Fiji.
soloMon islands
2013 was a year of much change for BSP Solomon Islands. We farewelled the former Country Manager, Mark Corcoran, who spent 10 years with BSP (and prior to that NBSI) and welcomed new Country Manager, David Anderson, who has 37 years Banking experience in Australia and the South Pacific.
Branchless Banking Agencies started to be rolled out in September 2013 and Mobile Banking was launched in October 2013. These initiatives are the result of transferring successful products and services in the PNG market to other BSP territories. As at year end we have established 6 new agents and registered 4,785 customers to Mobile Banking and processed 63,024 Mobile Banking transactions.
BSP continues to have the largest ATM network and 2014 saw 1 new ATM established in the provincial town of Noro and our EFTPoS merchants increased from 43 to 101.
The continued growth of all electronic channels is a major focus in 2014. At the moment we are restricted to areas where Solomon Telekom provides 2G data signals, however, as they expand their network coverage it will enable us to provide Banking Services to more provincial areas of the Solomon Islands.
2013 also saw the refurbishment and relocation of our Point Cruz branch from the lower ground floor to the ground floor. Customers and staff welcomed the move and they are enjoying the new premises.
The Central Bank of Solomon Islands in October 2013 issued an Interim Banking Licence to Pan Oceanic Bank. This will allow Pan Oceanic Bank to take further steps to meet the requirements to gain a Full Banking Licence sometime in 2014. The establishment of this new Bank will offer new challenges to BSP; it is essential that we retain a close relationship with our customers and develop our Agency and Mobile Banking networks.
The Solomon Island economy continues to remain very liquid; this has increased competition in the lending market and has pushed Interest Rate margins down. Lending increased by 5% and deposits rose by 3%. Foreign Exchange earnings rose 9% over 2013 results. Country GDP growth stands at 4.8% and inflation at 5.5%. Foreign reserves are SBD3,809 million which is equivalent to 11 months Import Cover.
BSP’s financial performance for 2013 was a Net Profit Before Tax that exceeded budget and 3% higher than 2012. As mentioned, increased competition in the lending area saw a tightening of margins and resulted in Interest Income being lower than budget.
However, a review of fees & charges and proactive investment of surplus liquidity compensated for this and resulted in results that were better than budget.
2014 promises to be an exciting year for BSP Solomon Islands as we continue the rollout of Electronic Banking initiatives and transform our workforce into a more sales oriented culture.
BsP CaPiTal liMiTed
2013 was a year of change for BSP Capital. It was a year where there were changes to the Management of the business as well as a greater client service and revenue focus in each of the 3 operating arms of BSP Capital (Share Broking, Funds Manage-ment and Corporate Advisory). In March of 2013 a new General Manager, Richard Borysiewicz was appointed, bringing with him 25 years of experience in Financial Services and a more aggres-sive focus on business origination at BSP Capital.
share Broking
• BSP Capital continues to dominate the local market in terms of transactions. Clients of BSP Capital have been able to transact on both the local POMSoX as well as overseas markets;
• Activity and revenue were in line with the previous year. Turnover was much improved in the middle of the year
BsP assisted the National airline with finance to assist with the purchase of the airlines first Dash 8 airplane. The Dash 8 is seen as the perfect airplane for services around the solomon islands.

3 8 B S P A n n u a l R e p o r t 2 0 1 3
OVERSEAS BRANCHES AND SUBSIDIARIES
however global market conditions during November and December saw a decline in market activity;
• We completed a Compliance Listing on POMSoX during the year and there is the potential for additional new listings during the year ahead;
• The strategy for Share Broking is to seek out a broader mix of clients with PNG High Net Worth clients as the most likely local investor segment with which we can work more. In addition, BSP Capital is seeking greater exposure to overseas investors into the local market.
Funds Management
• Total Funds under Management during the year grew by 53%. This substantial increase in Funds was a mix of new mandates and cash flow from existing clients. Total Funds Under Management (FUM) at the end of December 2013 was K644 million;
• A substantial increase in FUM is expected due to an agree-ment reached with one of our largest clients for further inflows during 2014;
• We are in the early stages of negotiation with several new prospects and expect that further additions to our client list will be made in 2014.
Corporate advisory
• BSP Capital was mandated during the year to work on several large transactions;
• BSP Capital is the premier Investment Bank in PNG and was appointed during 2013 by large corporates as well as govern-ment to act on their behalf in industries covering energy, telecommunications and real estate;
• The outlook for the year ahead is positive with numerous opportunities presenting themselves to work with clients in raising money, divesting or acquiring assets or providing strategic advice. BSP Capital is very well placed to work together with other parts of BSP (particularly Corporate Banking and Treasury) to offer complete and integrated solutions to clients.
BsP liFe liMiTed
overview
The 2013 year results in both financial and strategic actions that were undertaken were very pleasing. Our strong financial perfor-mances recorded in 2012 in both our Life and Health businesses continued into 2013 with profit results exceeding targets. Significant developments were also noted in our key strategic initiatives.
2013 saw the implementation and on-going execution of major initiatives planned for the year or which began in 2012:
• Returned the Health business to profitability through business growth, better underwriting and claims management practices;
• Development and launch of the new suite of Medical Products – Value, Premier and Premier Plus and the new endowment product - Bula Elite for the Life business;
• Substantial work was performed on the project being under-taken to change our core insurance systems. The new system was selected and implementation is underway;
• Completed feasibility assessment and received Board approval for the development of Denison/Duncan F$11.2m gated accommodation project;
• Continued focus on investments subsidiaries’ performances resulting in marked improvement in their values.
We had a strong 26% growth in Life new business which together with increased focus on conservation saw the Life inforce portfolio increasing by F$4.0m. The 13th month persistency rate was at an all-time high of 75%. Health business inforce grew by F$1.0m. Actual new business was below the significant growth experienced in 2012 due to a strong fight back by our competitors but the overall inforce book growth was pleasing.
Financial Performance
The Insurance Group NPAT for 2013 was F$9.9m, F$2.5m above budget. After adjustment for non-operating items NPAT is F$9.2m, F$1.8m above budget. The Life business NPAT was F$9.8m against a budget of F$7.4m while the Health business showed a profit of F$16k against a budget profit of F$15k.
insurance Market
The Life insurance market continues to be dominated by endow-ment products. There are two major players. BSP Life market share on inforce annual premium basis (excluding single premiums) was at 57% at the end of 2012. Competition remains strong from our Life competitor which has been successful in the sale of a guaranteed return single premium product. 2013 saw the development and launch of a new endowment product, Bula Elite, which has been well accepted in the market. The focus on our system change in 2014 means that we have to properly prioritise our product initiatives as we push to lead in product innovation.
The health insurance market remains very competitive with four active competitors. BSP Health Term Life market share on premium income was 49% while the Medical market share was 29% in 2012; both products experiencing growth over 2011. With the review of underwriting guidelines the focus during 2013 was getting quality business on our books. With new customer education campaigns, additional licensed Health agents and a refined Group quote process, further improvements in market share are expected in 2014.
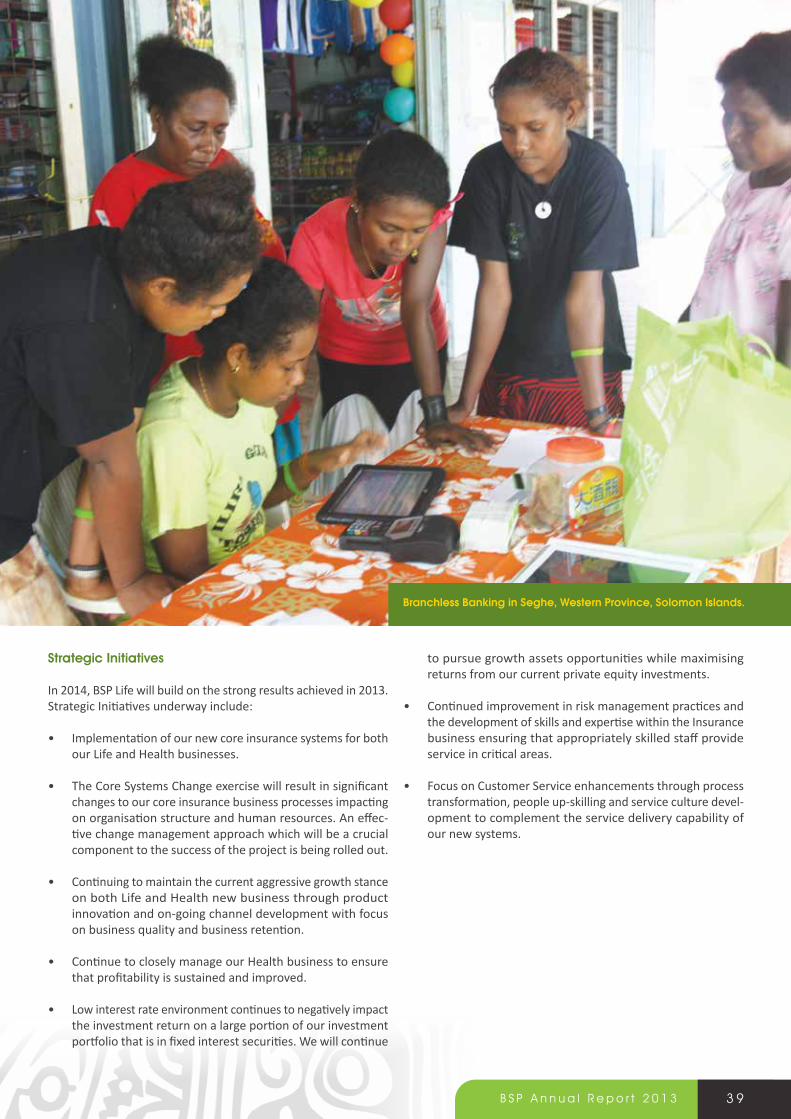
Branchless Banking in seghe, Western Province, solomon islands.
3 9B S P A n n u a l R e p o r t 2 0 1 3
strategic initiatives
In 2014, BSP Life will build on the strong results achieved in 2013. Strategic Initiatives underway include:
• Implementation of our new core insurance systems for both our Life and Health businesses.
• The Core Systems Change exercise will result in significant changes to our core insurance business processes impacting on organisation structure and human resources. An effec-tive change management approach which will be a crucial component to the success of the project is being rolled out.
• Continuing to maintain the current aggressive growth stance on both Life and Health new business through product innovation and on-going channel development with focus on business quality and business retention.
• Continue to closely manage our Health business to ensure that profitability is sustained and improved.
• Low interest rate environment continues to negatively impact the investment return on a large portion of our investment portfolio that is in fixed interest securities. We will continue
to pursue growth assets opportunities while maximising returns from our current private equity investments.
• Continued improvement in risk management practices and the development of skills and expertise within the Insurance business ensuring that appropriately skilled staff provide service in critical areas.
• Focus on Customer Service enhancements through process transformation, people up-skilling and service culture devel-opment to complement the service delivery capability of our new systems.

4 0 B S P A n n u a l R e p o r t 2 0 1 3
OVERSEAS BRANCHES AND SUBSIDIARIES
BsP soloMon island
ManageMenT TeaM
Seated (L - R): Genevieve Apusae, Financial Controller, David Anderson, Country Manager, Pricilla Maehau, Relieving Manager, Commercial Banking.
Standing (L-R): Robert Bochman, Relationship Manager, Joan Ramo, Manager International Operations, Alphonse Toati, Manager Agencies & Electronic Banking, Janet Marau, Manager Retail Banking Operations, Peter Lemon, Manager Corporate Services, Lyn Toati, Manager Credit Administration, Winterford Maehau, Manager Information Services.
BsP Fiji ManageMenT TeaM
Seated (L - R): Ravindra Singh, GM Retail Bank, Kevin McCarthy, Country Manager, Cecil Browne, GM Corporate & International and Alvina Ali, GM Legal.
Standing (L - R): Ronesh Dayal, Chief Financial Officer, Howard Politini, GM Human Resources, William Wakeham, Chief Operating Officer, Ashleigh Matheson, Chief Risk Officer and Omid Saberi, Chief Information Officer.
BsP liFe ManageMenT TeaM
seated: Malakai Naiyaga, Managing Director.
Standing (L-R): Michael Nacola, General Manager Distribution & Marketing, Munendra Naidu, Chief Financial Officer, Glenis Yee, GM Legal & Compliance, Pramesh Sharma, GM Investments.

4 1B S P A n n u a l R e p o r t 2 0 1 3
BaNKiNG eDuCaTioN iN fiJi
Customer Care Manager Mosese
Taga promotes electronic Banking to Military Personnel.

for the Year Ended 31 December 2013 The Directors take pleasure in presenting the Financial Statements of Bank of South Pacific Limited and its subsidiaries (Bank and the Group) for the year ended 31 December 2013. In order to comply with the provisions of the Companies Act 1997, the Directors Report as follows:
Principal activities
The principal activity of the Bank of South Pacific Limited (BSP) is the provision of commercial banking and finance services. The Group’s activities include the provision of commercial banking and finance services, stock broking and fund management and life business services throughout Papua New Guinea and the Pacific region. BSP is a Bank listed on the Port Moresby Stock Exchange (POMSoX), incorporated under the Companies Act of Papua New Guinea, and is an authorised Bank under the Banks and Financial Institutions Act of Papua New Guinea. The Bank and the Group are licensed to operate in the Solomon Islands, Fiji Islands and Niue. The registered office is at Douglas Street, Port Moresby.
review of operations
For the year ended 31 December 2013, the Bank’s profit after tax was K424.762 million (2012: K399.588 million profit). The Group’s profit after tax was K436.828 million (2012: K407.744 million).
dividends
Dividend payments totalling K271.686 million were paid in 2013 (2012: K258.994 million). A detailed breakup of this is provided in Note 23.
directors and officers
The following were Directors of the Bank of South Pacific Limited at the year ended 31 December 2013:
Mr K Constantinou, OBE Mr R Fleming Mr G Robb, OAM Mr G Aopi, CBE Mr T E Fox, OBE Ms F Talao Sir N Bogan Mr C C Procter Dr I Temu Mr E B Gangloff
Details of directors’ tenure and directors and executives’ remuneration during the year are provided in Note 27 of the Notes to the Consolidated Financial Statements. Mr Ernest B Gangloff was appointed to the board on 28 November 2013. The CEO Robin Fleming remains the only executive director in the composition of the board.
The company secretary is Mary Johns.
independent audit report
The financial statements have been audited and should be read in conjunction with the independent audit report on page 90. Details of amounts paid to the auditors for audit and other services are shown in Note 41 of the Notes to the Financial Statements.
4 2 B S P A n n u a l R e p o r t 2 0 1 3
DIRECTORS‘REPORT
ROBIn FLEMInG Group Ceo
KOSTAS COnSTAnTInOu, OBEChairman

donations & sponsorships
Donations and sponsorships by the Group during the year amounted to K9,267,141 (2012: K4,192,404).
interests register
Transactions recorded in the Interests Register are disclosed in Note 30 of the Notes to the Financial Statements.
Change in accounting Policies
No change in accounting policies occurred during this year.
For, and on behalf of, the Directors.
Dated and Signed in accordance with a resolution of the Directors in Port Moresby this 26th day of March 2014.
Kostas Constantinou, oBE roBin FlEming Chairman Group Chief Executive Officer/Director
4 3B S P A n n u a l R e p o r t 2 0 1 3
for the Year Ended 31 December 2013

The Directors declare that:
a) in the Directors’ opinion, there are reasonable grounds to believe that the Bank and the Group will be able to pay their debts as and when they become due and payable; and
b) in the Directors’ opinion, the attached financial statements and notes thereto are in accordance with the PNG Companies Act 1997, including compliance with accounting standards and give a true and fair view of the financial position and performance of the Bank and the Group.
additional statutory information
The results of the Bank and the Group’s operations during the financial year have, in the opinion of the Directors, not been materially affected by items of an abnormal nature, other than those disclosed in the financial statements.
In the opinion of the Directors, no circumstances have arisen that make adherence to the existing method of valuation of assets or liabilities of the Bank and the Group misleading or inappropriate.
At the date of this report the Directors are not aware of any circumstances that would render the values attributed to current assets in the financial statements misleading.
No contingent liability other than that disclosed in the notes to the attached financial statements has become enforceable, or is likely to become enforceable, within a period of twelve months from the date of this report, that will materially affect the Bank and the Group in its ability to meet obligations as and when they fall due. Dated and signed in accordance with a resolution of the Directors at Port Moresby this 26th day of March 2014.
Kostas Constantinou, oBE roBin FlEmingChairman Group Chief Executive Officer/Director
4 4 B S P A n n u a l R e p o r t 2 0 1 3
STATEMENT BY THE DIRECTORS
for the Year Ended 31 December 2013
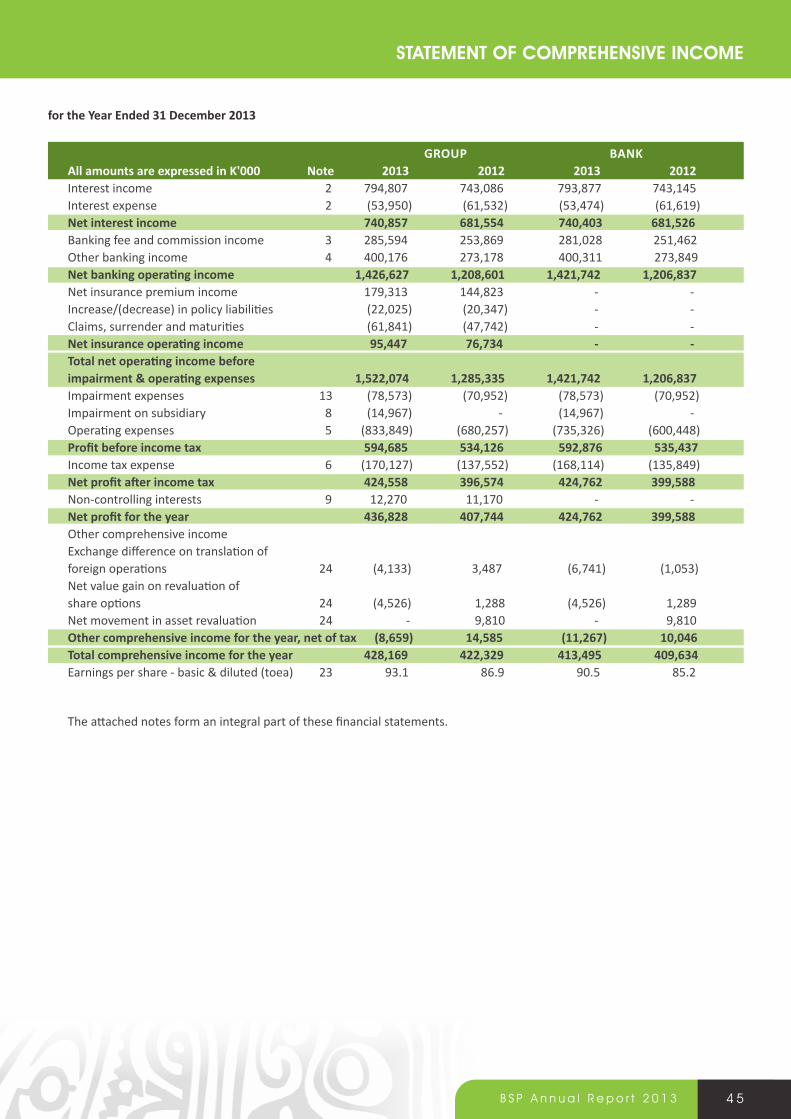
4 5B S P A n n u a l R e p o r t 2 0 1 3
sTaTeMenT oF CoMPrehensiVe inCoMe
grouP BanKall amounts are expressed in K'000 note 2013 2012 2013 2012Interest income 2 794,807 743,086 793,877 743,145 Interest expense 2 (53,950) (61,532) (53,474) (61,619) net interest income 740,857 681,554 740,403 681,526 Banking fee and commission income 3 285,594 253,869 281,028 251,462 Other banking income 4 400,176 273,178 400,311 273,849 Net banking operating income 1,426,627 1,208,601 1,421,742 1,206,837 Net insurance premium income 179,313 144,823 - -Increase/(decrease) in policy liabilities (22,025) (20,347) - -Claims, surrender and maturities (61,841) (47,742) - -Net insurance operating income 95,447 76,734 - -Total net operating income before impairment & operating expenses 1,522,074 1,285,335 1,421,742 1,206,837Impairment expenses 13 (78,573) (70,952) (78,573) (70,952)Impairment on subsidiary 8 (14,967) - (14,967) -Operating expenses 5 (833,849) (680,257) (735,326) (600,448)Profit before income tax 594,685 534,126 592,876 535,437Income tax expense 6 (170,127) (137,552) (168,114) (135,849)Net profit after income tax 424,558 396,574 424,762 399,588Non-controlling interests 9 12,270 11,170 - -Net profit for the year 436,828 407,744 424,762 399,588Other comprehensive income Exchange difference on translation of foreign operations 24 (4,133) 3,487 (6,741) (1,053) Net value gain on revaluation of share options 24 (4,526) 1,288 (4,526) 1,289Net movement in asset revaluation 24 - 9,810 - 9,810Other comprehensive income for the year, net of tax (8,659) 14,585 (11,267) 10,046total comprehensive income for the year 428,169 422,329 413,495 409,634Earnings per share - basic & diluted (toea) 23 93.1 86.9 90.5 85.2
The attached notes form an integral part of these financial statements.
for the Year Ended 31 December 2013
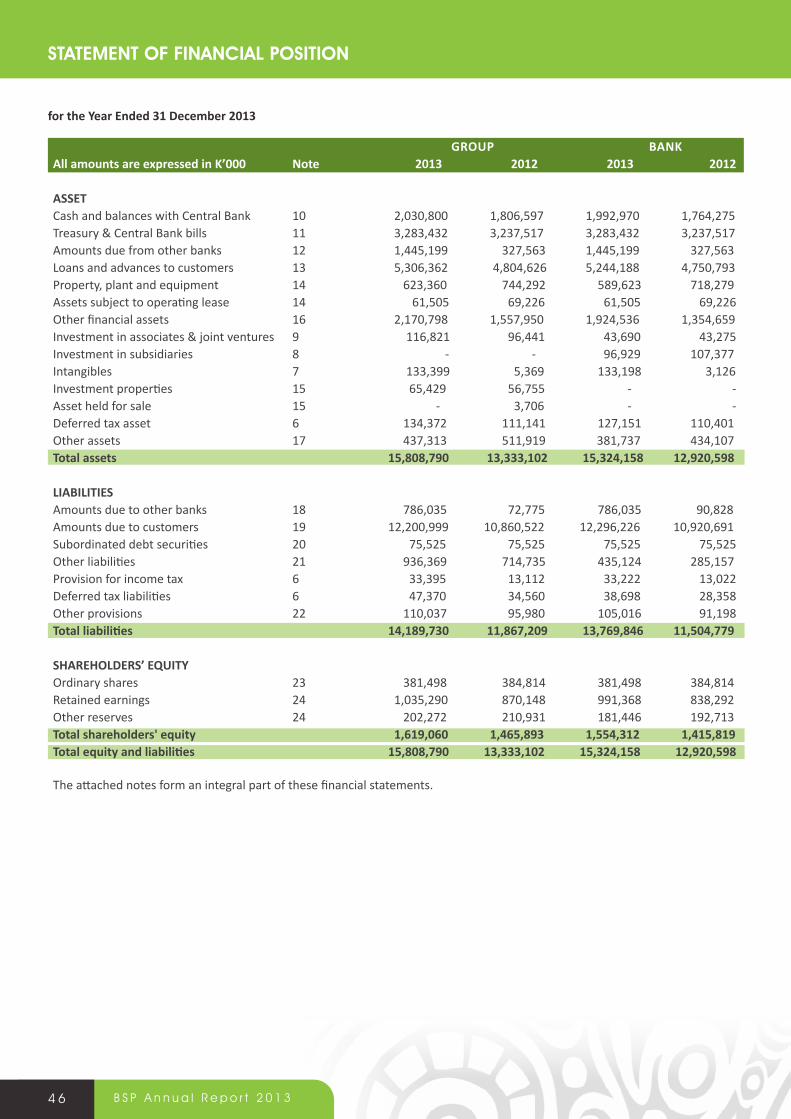
4 6 B S P A n n u a l R e p o r t 2 0 1 3
sTaTeMenT oF FinanCial PosiTion
grouP BanKAll amounts are expressed in K’000 Note 2013 2012 2013 2012
assEt Cash and balances with Central Bank 10 2,030,800 1,806,597 1,992,970 1,764,275Treasury & Central Bank bills 11 3,283,432 3,237,517 3,283,432 3,237,517Amounts due from other banks 12 1,445,199 327,563 1,445,199 327,563Loans and advances to customers 13 5,306,362 4,804,626 5,244,188 4,750,793Property, plant and equipment 14 623,360 744,292 589,623 718,279Assets subject to operating lease 14 61,505 69,226 61,505 69,226Other financial assets 16 2,170,798 1,557,950 1,924,536 1,354,659Investment in associates & joint ventures 9 116,821 96,441 43,690 43,275Investment in subsidiaries 8 - - 96,929 107,377Intangibles 7 133,399 5,369 133,198 3,126Investment properties 15 65,429 56,755 - -Asset held for sale 15 - 3,706 - -Deferred tax asset 6 134,372 111,141 127,151 110,401Other assets 17 437,313 511,919 381,737 434,107total assets 15,808,790 13,333,102 15,324,158 12,920,598
liaBilitiEs Amounts due to other banks 18 786,035 72,775 786,035 90,828Amounts due to customers 19 12,200,999 10,860,522 12,296,226 10,920,691Subordinated debt securities 20 75,525 75,525 75,525 75,525Other liabilities 21 936,369 714,735 435,124 285,157Provision for income tax 6 33,395 13,112 33,222 13,022Deferred tax liabilities 6 47,370 34,560 38,698 28,358Other provisions 22 110,037 95,980 105,016 91,198Total liabilities 14,189,730 11,867,209 13,769,846 11,504,779
SHAREHOLDERS’ EQUITY Ordinary shares 23 381,498 384,814 381,498 384,814Retained earnings 24 1,035,290 870,148 991,368 838,292Other reserves 24 202,272 210,931 181,446 192,713total shareholders' equity 1,619,060 1,465,893 1,554,312 1,415,819Total equity and liabilities 15,808,790 13,333,102 15,324,158 12,920,598
The attached notes form an integral part of these financial statements.
for the Year Ended 31 December 2013
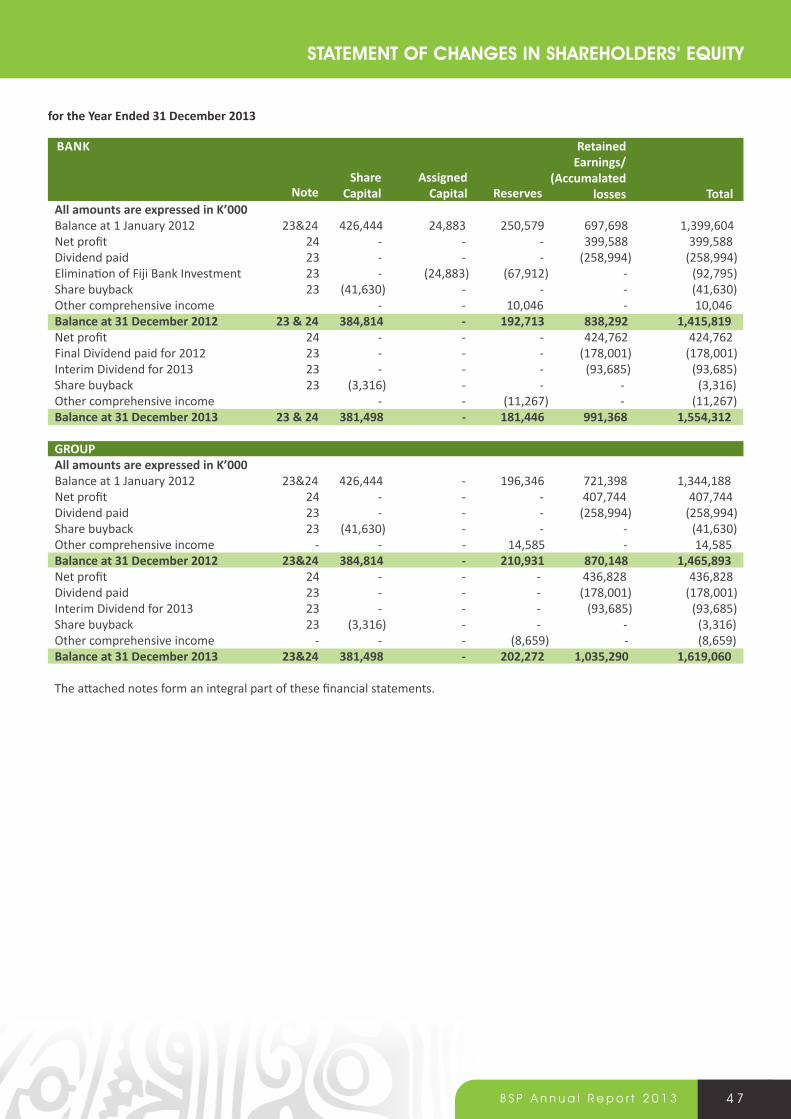
4 7B S P A n n u a l R e p o r t 2 0 1 3
sTaTeMenT oF Changes in shareholders’ eQuiTy
All amounts are expressed in K’000Balance at 1 January 2012 23&24 426,444 24,883 250,579 697,698 1,399,604Net profit 24 - - - 399,588 399,588Dividend paid 23 - - - (258,994) (258,994)Elimination of Fiji Bank Investment 23 - (24,883) (67,912) - (92,795)Share buyback 23 (41,630) - - - (41,630)Other comprehensive income - - 10,046 - 10,046Balance at 31 December 2012 23 & 24 384,814 - 192,713 838,292 1,415,819Net profit 24 - - - 424,762 424,762Final Dividend paid for 2012 23 - - - (178,001) (178,001)Interim Dividend for 2013 23 - - - (93,685) (93,685)Share buyback 23 (3,316) - - - (3,316)Other comprehensive income - - (11,267) - (11,267)Balance at 31 December 2013 23 & 24 381,498 - 181,446 991,368 1,554,312
grouP All amounts are expressed in K’000 Balance at 1 January 2012 23&24 426,444 - 196,346 721,398 1,344,188Net profit 24 - - - 407,744 407,744Dividend paid 23 - - - (258,994) (258,994)Share buyback 23 (41,630) - - - (41,630)Other comprehensive income - - - 14,585 - 14,585Balance at 31 December 2012 23&24 384,814 - 210,931 870,148 1,465,893Net profit 24 - - - 436,828 436,828Dividend paid 23 - - - (178,001) (178,001)Interim Dividend for 2013 23 - - - (93,685) (93,685)Share buyback 23 (3,316) - - - (3,316)Other comprehensive income - - - (8,659) - (8,659)Balance at 31 December 2013 23&24 381,498 - 202,272 1,035,290 1,619,060
The attached notes form an integral part of these financial statements.
noteshare
Capitalassigned
Capital reserves
retained Earnings/
(Accumalatedlosses total
BanK
for the Year Ended 31 December 2013
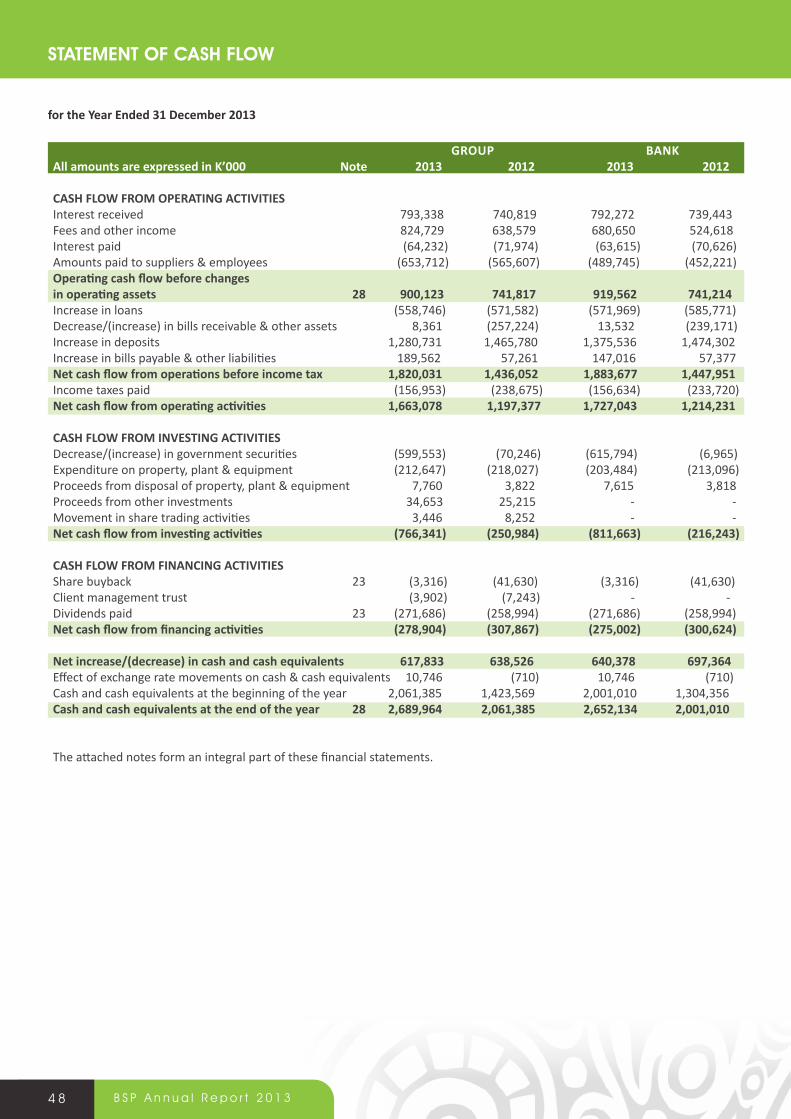
4 8 B S P A n n u a l R e p o r t 2 0 1 3
for the Year Ended 31 December 2013
grouP BanKAll amounts are expressed in K’000 Note 2013 2012 2013 2012
Cash FloW From oPErating aCtivitiEs Interest received 793,338 740,819 792,272 739,443Fees and other income 824,729 638,579 680,650 524,618Interest paid (64,232) (71,974) (63,615) (70,626)Amounts paid to suppliers & employees (653,712) (565,607) (489,745) (452,221)Operating cash flow before changes in operating assets 28 900,123 741,817 919,562 741,214Increase in loans (558,746) (571,582) (571,969) (585,771)Decrease/(increase) in bills receivable & other assets 8,361 (257,224) 13,532 (239,171)Increase in deposits 1,280,731 1,465,780 1,375,536 1,474,302Increase in bills payable & other liabilities 189,562 57,261 147,016 57,377Net cash flow from operations before income tax 1,820,031 1,436,052 1,883,677 1,447,951Income taxes paid (156,953) (238,675) (156,634) (233,720)Net cash flow from operating activities 1,663,078 1,197,377 1,727,043 1,214,231
Cash FloW From invEsting aCtivitiEs Decrease/(increase) in government securities (599,553) (70,246) (615,794) (6,965)Expenditure on property, plant & equipment (212,647) (218,027) (203,484) (213,096)Proceeds from disposal of property, plant & equipment 7,760 3,822 7,615 3,818Proceeds from other investments 34,653 25,215 - -Movement in share trading activities 3,446 8,252 - -Net cash flow from investing activities (766,341) (250,984) (811,663) (216,243)
Cash FloW From FinanCing aCtivitiEs Share buyback 23 (3,316) (41,630) (3,316) (41,630)Client management trust (3,902) (7,243) - -Dividends paid 23 (271,686) (258,994) (271,686) (258,994)Net cash flow from financing activities (278,904) (307,867) (275,002) (300,624)
Net increase/(decrease) in cash and cash equivalents 617,833 638,526 640,378 697,364Effect of exchange rate movements on cash & cash equivalents 10,746 (710) 10,746 (710)Cash and cash equivalents at the beginning of the year 2,061,385 1,423,569 2,001,010 1,304,356Cash and cash equivalents at the end of the year 28 2,689,964 2,061,385 2,652,134 2,001,010
The attached notes form an integral part of these financial statements.
sTaTeMenT oF Cash Flow
4 9B S P A n n u a l R e p o r t 2 0 1 3
1. aCCounTing PoliCies
The principal accounting policies adopted in the preparation of these consolidated financial statements are set out below:
a Basis of Presentation & general accounting Policies
The consolidated financial statements of the Bank of South Pacific Limited (the Bank) and the Group are prepared in accordance with International Financial Reporting Standards and interpretations of these standards issued by the International Financial Reporting Interpretations Committee. They are prepared on the basis of the historical cost convention, as modified by the revaluation of certain non-current assets and financial instruments.
Estimates and assumptions have been used to achieve conformity with generally accepted accounting principles in the preparation of these financial statements. These assumptions and estimates affect balances of assets and liabilities, contingent liabilities and commitments at the end of the reporting period, and amounts of revenues and expenses during the reporting period. Whilst the estimates are based on management's best knowledge of current events and conditions, actual results may ultimately differ from those estimates.
There are no new standards and interpretations being adopted in these financial statements.
The financial statements are presented in Papua New Guinea Kina, expressed in thousands of Kina, as permitted by Papua New Guinea Accounting Standards.
B Consolidation
The consolidated financial statements incorporate the assets and liabilities of all controlled entities of the Bank and the Group as at 31 December 2013, and their results for the year then ended. Controlled entities are those over which the Group has the power to govern financial and operating policies, generally accompanied by a shareholding that commands the majority of voting rights, and are commonly referred to as subsidiaries.
Subsidiaries are accounted for at acquisition under the acquisition method of accounting, where:
• acquisition cost is measured at fair value of assets transferred, equity issued, liabilities assumed and any directly attributable costs of the transaction;
• identifiable net assets are recorded initially at acquisition, at their fair values;
• any excess of the acquisition cost over the relevant share
of identifiable net assets acquired is treated as goodwill, and any deficiency is recognised directly in the statement of comprehensive income;
• All intercompany transactions and balances are eliminated.
C investment in associates & joint Ventures
investments in associates
Associates are entities over which the Group has significant, but not controlling influence, generally accompanied by a shareholding conferring between 20 percent - 50 percent of voting rights.
In the consolidated financial statements, these investments are accounted for under the equity method, where:
• The investment is initially recognised at cost;• The Group’s share of profits or losses are recognised in the
statement of comprehensive income.
interests in joint Ventures
A joint venture is a contractual arrangement whereby the Bank together with other parties undertake an economic activity that is subject to joint control that is when the strategic financial and operating policy decisions relating to the activities require the unanimous consent of the parties sharing control. Joint venture arrangements that involve the establishment of a separate entity in which each venturer has an interest are referred to as jointly controlled entities.
When the Group undertakes its activities under joint venture arrangements directly, the Group’s share of jointly controlled assets and any liabilities incurred jointly with other venturers are recognised in the financial statements of the jointly controlled entity. The Group reports its interests in jointly controlled entities at cost, except when the investment is classified as held for sale, in which case it is accounted for under IFRS 5 Non-current Assets Held for Sale and Discontinued Operations.
d revenue
interest income and expense
Interest income and expense are recognised in the Statement of Comprehensive Income on an accrual basis using the effective yield method. The income arising from the various forms of instalment credit has been determined using the effective interest method.
Interest income includes coupons earned on inscribed stock, accrued discount and premium on Treasury and Central Bank bills.
for the Year Ended 31 December 2013
noTes To The FinanCial sTaTeMenTs
5 0 B S P A n n u a l R e p o r t 2 0 1 3
short term insurance contracts
These contracts are the Term Life, Medical and Travel policies sold and underwritten by BSP Health Care (Fiji) Limited.
These contracts protect the Group’s customers from the consequences of events such as death, medical emergency or loss on travel. Guaranteed benefits paid on occurrence of the specified insurance event are either fixed or linked to the extent of the economic loss suffered by the policy holder. There are no maturity or surrender benefits.
For all these contracts, premiums are recognised as revenue (earned premiums) proportionally over the period of coverage. The portion of premium received on in-force contracts that relates to unexpired risks at the balance sheet date is reported as the unearned premium liability. Premiums are shown before deduction of commission.
Claims and loss adjustment expenses are charged to income as incurred based on the estimated liability for compensation owed to contract holders or beneficiaries. They include direct and indirect claims settlement costs and arise from events that have occurred up to the balance sheet date even if they have not yet been reported to the Group. The Group does not discount its liabilities for unpaid claims.
Liabilities for unpaid claims are estimated using the input of assessments for individual cases reported to the Group and statistical analyses for the claims incurred but not reported, and to estimate the expected ultimate cost of more complex claims that may be affected by external factors (such as court decisions).
long term insurance contracts
These contracts insure human life events (for example death or survival) over a long duration. They protect the Group’s customers from the consequences of events such as death, disability or critical illness. Guaranteed benefits paid on occurrence of the specified insurance event are fixed or linked to the level of bonus declared to the contract holder. Most of the policies have maturity and surrender benefits.
For all these contracts, premiums are recognised as revenue when they become payable by the contract holder. Premiums are shown before deduction of commission.
Approximately 90 percent of the above contracts in the Group’s portfolio contain a Discretionary Participation Feature (DPF). This feature entitles the holder to receive, as a supplement to generated benefits, additional benefits or bonuses.
The liability for long term insurance contracts (principally Life Insurance) has been determined in accordance with LPS 1.04 Valuation of Policy Liabilities, issued by the Australian Prudential Regulation Authority.
The policy liability is calculated in a way that allows for the systematic release of planned profit margins as services are provided to policy owners and the revenues relating to those services are received (Margin on Service methodology). Services used to determine profit recognition include the cost of expected insurance claims and the allocation of future bonuses.
The liability is generally determined as the present value of all future expected payments, expenses, taxes and profit margins reduced by the present value of all future expected premiums and take into consideration projected future bonuses. The liabilities are recalculated at each balance date using best estimate assumptions. These assumptions are revisited regularly and adjusted for actual experience on claims, expense, mortality and investment returns.
e Fee & Commission income
Fees and commissions are generally recognised on an accrual basis when the service has been provided. All other risk related fees that constitute cost recovery are taken to income when levied. Non-refundable front-end loan fees are capitalised and deferred over the expected term of the financial instrument.
F Borrowing expenses Expenses associated with the borrowing of funds are charged to the Statement of Comprehensive Income in the period in which they are incurred.
g loans and Provisions for loan impairment
Loans are originated by providing funds directly to the borrower and are recognised when cash is advanced to borrowers.
All loans and advances receivable are subject to continuous management review. A specific provision for loan impairment is established if there is objective evidence that the Bank and the Group will not be able to collect all amounts due under the terms of loans. The amount of the provision approximates the difference between the carrying amount and the recoverable amount, which is the current best estimate of the present value of expected future cash flows arising from the asset. All bad debts are written off against the specific provision for loan impairment in the period in which they are classified as irrecoverable. Subsequent recoveries are credited to the provision for loan losses in the Statement of Comprehensive Income.
General provisions for impairment are maintained to cover incurred losses unidentified at balance date in the overall portfolio of loans and advances. The provisions are determined having regard to the level of risk weighted assets, economic conditions, the general risk profile of the credit portfolio, past loss experience and a range of other criteria. The amount necessary to bring the provisions to their assessed levels, after
for the Year Ended 31 December 2013
NOTES TO THE FINANCIAL STATEMENTS
5 1B S P A n n u a l R e p o r t 2 0 1 3
write-offs, is charged to the Statement of Comprehensive Income.
h goodwill Goodwill represents the excess of the cost of any acquisition over the acquirer’s interest in the fair value of the identifiable assets and liabilities acquired as at the exchange transaction. Goodwill is reported in the statement of financial position as an intangible asset.
In determining the estimated useful life of goodwill, management considers various factors including net selling price of the acquired business, existing market share, potential growth opportunities, and other factors inherent in the acquired business. This assessment is reviewed at each balance date, so that any indication of impairment with implications for the recoverability of goodwill can be tested, and adjustments to the carrying value of goodwill made if necessary.
i Computer systems development Costs Costs incurred to develop and enhance the Bank and the Group’s computer systems are capitalised to the extent that benefits do not relate solely to revenue that has already been brought to account and will contribute to the future earning capacity of the economic entity. These costs are amortised over the estimated economic life of four years using the straight-line method. Costs associated with maintaining computer software programmes are recognised as an expense when incurred.
j Property, Plant and equipment Land and buildings are measured at fair value. Fair value is determined on the basis of regular independent valuation prepared by external valuation experts, based on discounted cash flows or capitalisation of net income (as appropriate). The fair values are recognised in the financial statements of the consolidated entity, and are reviewed at the end of each reporting period to ensure that the carrying value of land and buildings is not materially different from their fair values.
Any revaluation increase arising on the revaluation of land and buildings is credited to the asset revaluation reserve, except to the extent that it reverses a revaluation decrease for the same asset previously recognised as an expense in profit or loss, in which case the increase is credited to the Statement of Comprehensive Income to the extent of the decrease previously charged. A decrease in carrying amount arising on the revaluation of land and buildings is charged as an expense in statement of comprehensive income to the extent that it exceeds the balance, if any, held in the asset revaluation reserve relating to a previous revaluation of that asset.
Depreciation on revalued buildings is charged to profit or loss. On the subsequent sale or retirement of a revalued property, the attributable revaluation surplus remaining in the asset revaluation reserve, net of any related deferred taxes, is transferred directly to retained earnings.
Depreciation is provided on property, plant and equipment, including freehold buildings but excluding land. Depreciation is calculated on a straight line basis so as to write off the net cost or other revalued amount of each asset over its expected useful life to its estimated residual value. Leasehold improvements are depreciated over the period of the lease or estimated useful life, whichever is the shorter, using the straight- line method. The estimated useful life, residual values and depreciation method is reviewed at the end of each annual reporting period.
The following basis and method of depreciation is used: Class of asset method rate-----------------------------------------------------------------------------------Property (excluding land) Straight-line basis 2 - 3% pa -----------------------------------------------------------------------------------Plant & equipment Straight-line basis 10 -25% pa-----------------------------------------------------------------------------------Equipment under operating lease Straight-line basis 6 - 20% pa-----------------------------------------------------------------------------------
Gains or losses on disposals (being the difference between the carrying value at the time of sale or disposal and the proceeds received) are taken into account in determining operating profit for the year. Where the carrying value of an asset is greater than its estimated recoverable amount, it is written down immediately to its recoverable amount. Repairs and maintenance are taken into account in determining operating profit when the expenditure is incurred.
K leases
Bank is lessee
All leases entered into by the Bank and the Group are operating leases. Total payments made are charged to the Statement of Comprehensive Income reflecting the pattern of benefits derived from the leased assets.
Bank is lessor
Finance leases are included in Loans and Advances to Customers (Note 13) and are accounted for under the finance method whereby income is taken to account over the life of the lease in proportion to the outstanding investment balance.
for the Year Ended 31 December 2013
NOTES TO THE FINANCIAL STATEMENTS
5 2 B S P A n n u a l R e p o r t 2 0 1 3
Assets subject to operating leases are separately disclosed in the statement of financial position, according to the nature of the asset. These assets are stated at cost less accumulated depreciation. The assets are depreciated on a straight-line basis over the life of the operating lease. Lease income is recognised on a straight-line basis over the term of the lease.
l Cash & Cash equivalents
For the purpose of the Cash Flow Statement, cash and cash equivalents comprise notes and coins, and balances due to and from other banks.
M Provisions
Provisions are recognised when the Company has a present obligation (legal or constructive) as a result of a past event, it is probable that the Company will be required to settle the obligation, and a reliable estimate can be made of the amount of the obligation. The amount recognised as a provision is the best estimate of the consideration required to settle the present obligation at reporting date, taking into account the risks and uncertainties surrounding the obligation. Where a provision is measured using the cash flows estimated to settle the present obligation, its carrying amount is the present value of those cash flows.
When some or all of the economic benefits required to settle a provision are expected to be recovered from a third party, the receivable is recognised as an asset if it is virtually certain that reimbursement will be received and the amount of the receivable can be measured reliably.
n employee Benefits
A liability is required for benefits accruing to employees in respect of wages and salaries, annual leave, long service leave when it is probable that settlement will be required and they are capable of being measured reliably.
Liabilities recognised in respect of employee benefits expected to be settled within 12 months, are measured at their nominal values using the remuneration rate expected to apply at the time of settlement.
Liabilities recognised in respect of employee benefits which are not expected to be settled within 12 months are measured as the present value of the estimated future cash outflows to be made by the consolidated entity in respect of services provided by employees up to reporting date.
employment Benefits - defined contribution plans
A defined contribution plan is a pension plan under which the Bank and the Group pays fixed contributions into a separate fund, and there is no recourse to the Bank and the Group for employees if the fund has insufficient assets to pay employee
benefits relating to service up to the balance sheet date.
The Bank and the Group pays contributions to publicly or privately administered superannuation plans on a mandatory, contractual or voluntary basis in respect of services rendered up to balance sheet date by all Papua New Guinean staff members. The contributions are at the current rate of employees' gross salary. Once the contributions have been paid, the Bank and the Group have no further payment obligations for post-employment benefits from the date an employee ceases employment with the Bank and the Group.
o income Tax
Current tax
Current tax is calculated by reference to the amount of income taxes payable or recoverable in respect of the taxable profit or tax loss for the period. It is calculated using tax rates and tax laws that have been enacted or substantively enacted by reporting date. Current tax for current and prior periods is recognised as a liability (or asset) to the extent that it is unpaid (or refundable).
deferred tax
Deferred tax is accounted for using the balance sheet liability method. Temporary differences are differences between the tax base of an asset or liability and its carrying amount in the statement of financial position. The tax base of an asset or liability is the amount attributed to that asset or liability for tax purposes.
In principle, deferred tax liabilities are recognised for all taxable temporary differences. Deferred tax assets are recognised to the extent that it is probable that sufficient taxable amounts will be available against which deductible temporary differences or unused tax losses and tax offsets can be utilised. However, deferred tax assets and liabilities are not recognised if the temporary differences giving rise to them arise from the initial recognition of assets and liabilities which affects neither taxable income nor accounting profit.
Deferred tax assets and liabilities are measured at the tax rates that are expected to apply to the period(s) when the asset and liability giving rise to them are realised or settled, based on tax rates (and tax laws) that have been enacted or substantively enacted by reporting date. The measurement of deferred tax liabilities and assets reflects the tax consequences that would follow from the manner in which the Bank expects, at the reporting date, to recover or settle the carrying amount of its assets and liabilities.
Deferred tax assets and liabilities are offset when they relate to income taxes levied by the same taxation authority and the Bank intends to settle its current tax assets and liabilities on a net basis.
for the Year Ended 31 December 2013
NOTES TO THE FINANCIAL STATEMENTS
5 3B S P A n n u a l R e p o r t 2 0 1 3
Current & deferred Tax for the period
Current and deferred tax is recognised as an expense or income in the statement of comprehensive income, except when it relates to items credited or debited directly to equity, in which case the deferred tax is also recognised directly in equity.
P investments
Investments are classified into the following categories: held for trading, held-to-maturity and available-for-sale. Trading reflects active and frequent buying and selling, and financial instruments held for trading generally are used with the objective of generating a profit from short-term fluctuations in price or dealers margin. Investments with fixed maturity that the management has the intent and ability to hold to maturity are classified as held-to-maturity. Investments intended to be held for an indefinite period of time, which may be sold in response to needs for liquidity or changes in interest rates, are classified as available-for-sale; Management determines the appropriate classification of its investments at the time of the purchase.
All purchases and sales of investments are recognised on the trade date, which is the date that the Bank and the Group commits to purchase or sell the asset. Cost of purchase includes transaction costs. Trading and available-for-sale investments are subsequently carried at fair value, whilst held-to-maturity investments are carried at amortised cost using the effective yield method. Realised and unrealised gains and losses arising from changes in the fair value of trading investments are included in the income statement in the period in which they arise.
Q Foreign currency
The financial statements of the Bank are presented in the currency of the primary economic environment in which the entity operates (its functional currency). For the purpose of these financial statements, the results and financial position of the Bank are expressed in Papua New Guinea kina, which is the bank’s functional and presentation currency.
In preparing the financial statements, transactions in currencies other than the entity’s functional currency (foreign currencies) are recorded at the rate of exchange prevailing on the dates of the transactions. At each balance sheet date, monetary items denominated in foreign currencies are retranslated at the rates prevailing at the balance sheet date. Non-monetary items carried at fair value that are denominated in foreign currencies are retranslated at the rates prevailing on the date when the fair value was determined. Non-monetary items that are measured in terms of historical cost in a foreign currency are not retranslated.
Foreign operations
On consolidation, the asset and liabilities of the consolidated
entity’s overseas operations are translated at exchange rates prevailing at the reporting date. Income and expense items are translated at the average exchange rates for the period unless exchange rates fluctuate significantly. Exchange differences arising, if any, are recognised in the foreign currency translation reserve, and recognised in profit or loss on disposal of the foreign operation.
r share capital
share issue costs
External costs directly attributable to the issue of new shares are deducted from equity net of any related income taxes.
dividends on ordinary shares
Dividends on ordinary shares are recognised in equity in the period in which they are declared. Dividends for the year, declared after the balance sheet date, are dealt with in the subsequent events note.
share options
The fair value of the employee services received in exchange for the grant of options is recognised as an expense. The total amount to be expected rateably over the vesting period is determined by reference to the fair value of the options determined at the grant date, excluding the impact of any non-market vesting conditions (for example profitability). Non-market conditions are included in assumptions about the number of options expected to become exercisable or the number of shares that the employee will ultimately receive.
This estimate is revised at each balance sheet date and the difference is charged or credited to the statement of comprehensive income, with a corresponding adjustment to equity. The proceeds received on exercise of the options net of any directly attributable transactions costs are credited to equity.
s asset impairment
At each reporting date, the Bank and the Group reviews the carrying amounts of its tangible and intangible assets to determine whether there is any indication that those assets have suffered an impairment loss. If any such indication exists, the recoverable amount of the asset is estimated in order to determine the extent of the impairment loss (if any). Where the asset does not generate cash flows that are independent from other assets, the Bank and the Group estimates the recoverable amount of the cash-generating unit to which the asset belongs.
Goodwill, intangible assets with indefinite useful lives and intangible assets not yet available for use are tested for impairment annually and whenever there is an indication that
for the Year Ended 31 December 2013
NOTES TO THE FINANCIAL STATEMENTS

5 4 B S P A n n u a l R e p o r t 2 0 1 3
NOTES TO THE FINANCIAL STATEMENTS
the asset may be impaired. An impairment of goodwill is not subsequently reversed.
Recoverable amount is the higher of fair value less costs to sell and value in use. In assessing value in use, the estimated future cash flows are discounted to their present value using a pre-tax discount rate that reflects current market assessments of the time value of money and the risks specific to the asset for which the estimates of future cash flows have not been adjusted.
If the recoverable amount of an asset (or cash-generating unit) is estimated to be less than its carrying amount, the carrying amount of the asset (cash-generating unit) is reduced to its recoverable amount. An impairment loss is recognised in profit or loss immediately, unless the relevant asset is carried at fair value, in which case the impairment loss is treated as a revaluation decrease.
Where an impairment loss subsequently reverses, the carrying amount of the asset (cash-generating unit) is increased to the revised estimate of its recoverable amount, but only to the extent that the increased carrying amount does not exceed the carrying amount that would have been determined had no impairment loss been recognised for the asset (cash-generating unit) in prior years. A reversal of an impairment loss is recognised in profit or loss immediately, unless the relevant asset is carried at fair value, in which case the reversal of the impairment loss is treated as a revaluation increase.
T non-current assets held for sale
Non-current assets (and disposal groups) classified as held for sale are measured, with certain exceptions, at the lower of carrying amount and fair value less costs to sell.
Non-current assets and disposal groups are classified as held for sale if their carrying amount will be recovered principally through a sale transaction rather than through continuing use. This condition is regarded as met only when the asset (or disposal group) is available for immediate sale in its present condition subject only to terms that are usual and customary for such a sale and the sale is highly probable.
The sale of the asset (or disposal group) must be expected to be completed within one year from the date of classification, except in the circumstances where sale is delayed by events or circumstances outside the company’s control and the company remains committed to a sale.
u Convertible notes
Convertible notes issued by the company are regarded as compound instruments, consisting of a liability component equivalent to the three year fixed coupon amount and an equity component equivalent to the balance. At the date of issue, the fair value of the liability component is estimated using the prevailing market interest rate for similar non-convertible debt.
The difference between the proceeds of issue of the convertible loan notes and the fair value assigned to the liability component, representing the embedded option to convert the liability into equity of the company, is included in equity.
The interest expense on the liability component is calculated by applying the coupon rate of 7 percent to the liability component of the instrument. The difference between this amount and the interest paid is added to the carrying amount of the convertible notes.
V derivative financial instruments & acceptances
Forward foreign exchange contracts entered into for trading purposes are initially recognised at cost and subsequently re-measured at fair value based upon the forward rate. Gains and losses on such contracts are taken to the statement of comprehensive income.
Acceptances comprise undertakings by the Bank and the Group to pay bills of exchange drawn on customers. The Bank and the Group expects most acceptances to be settled simultaneously with the reimbursement from the customers. Customer acceptances are accounted for as off-balance sheet transactions and are disclosed as contingent liabilities and commitments.
The Bank and the Group does not actively enter into or trade in complex forms of derivative financial instruments such as currency and interest rate swaps and options.
w Comparatives
Comparative figures have been adjusted to conform to changes in presentation in the current year, including:
• Computer development costs have been moved to Intangibles category from Other Assets category. Refer to note 7 (b).
• Elimination of the Fiji bank investment and the related assigned capital and capital adequacy reserve.
.....................................................................................................Investment in Subsidiary 2012 215,517.....................................................................................................Eliminattion of Fiji Bank Branch investment entries - Assigned capital (24,883)- Capital adequacy reserve (67,912)- Colonial Bank assigned capital (21,456) 101,266Transfer projects costs from other assets to investment 6,111.....................................................................................................Adjusted balance for investment in subsidiary in 2012 107,377.....................................................................................................
for the Year Ended 31 December 2013
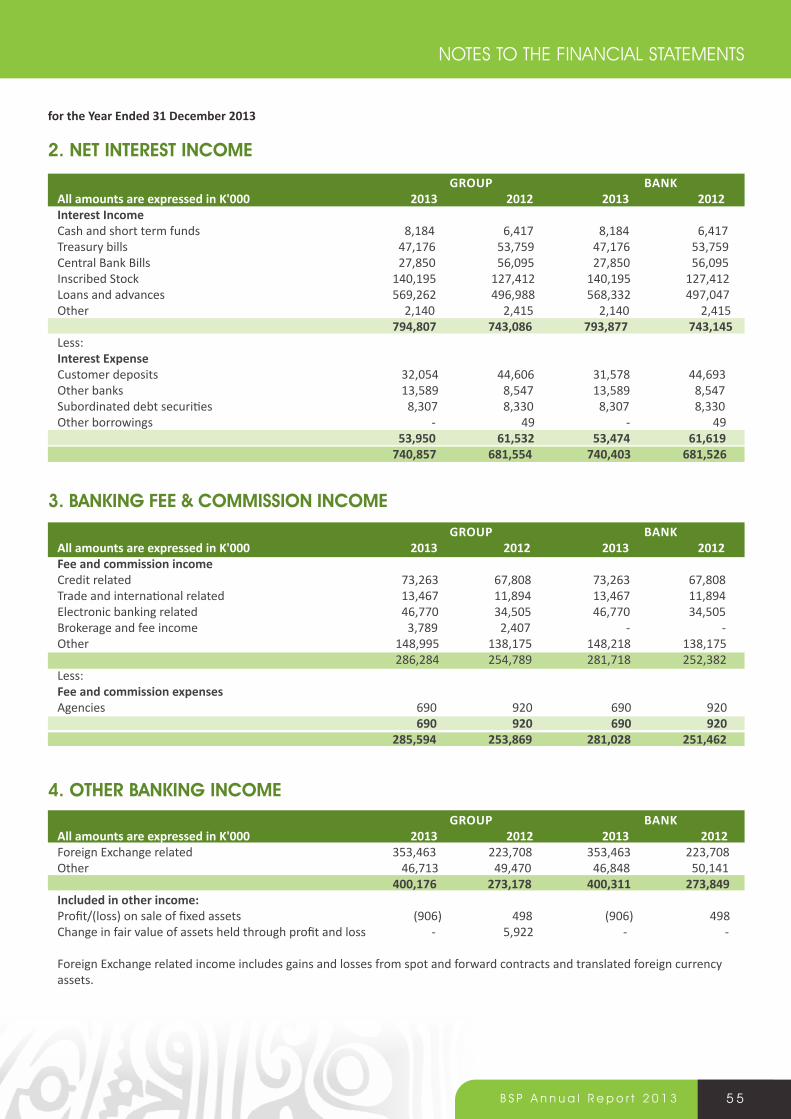
5 5B S P A n n u a l R e p o r t 2 0 1 3
for the Year Ended 31 December 2013
grouP BanK all amounts are expressed in K'000 2013 2012 2013 2012interest income Cash and short term funds 8,184 6,417 8,184 6,417Treasury bills 47,176 53,759 47,176 53,759Central Bank Bills 27,850 56,095 27,850 56,095Inscribed Stock 140,195 127,412 140,195 127,412Loans and advances 569,262 496,988 568,332 497,047Other 2,140 2,415 2,140 2,415 794,807 743,086 793,877 743,145Less: interest Expense Customer deposits 32,054 44,606 31,578 44,693Other banks 13,589 8,547 13,589 8,547Subordinated debt securities 8,307 8,330 8,307 8,330Other borrowings - 49 - 49 53,950 61,532 53,474 61,619 740,857 681,554 740,403 681,526
2. neT inTeresT inCoMe
grouP BanK all amounts are expressed in K'000 2013 2012 2013 2012Fee and commission income Credit related 73,263 67,808 73,263 67,808Trade and international related 13,467 11,894 13,467 11,894Electronic banking related 46,770 34,505 46,770 34,505Brokerage and fee income 3,789 2,407 - -Other 148,995 138,175 148,218 138,175 286,284 254,789 281,718 252,382Less: Fee and commission expenses Agencies 690 920 690 920 690 920 690 920 285,594 253,869 281,028 251,462
3. BanKing Fee & CoMMission inCoMe
grouP BanK all amounts are expressed in K'000 2013 2012 2013 2012Foreign Exchange related 353,463 223,708 353,463 223,708Other 46,713 49,470 46,848 50,141 400,176 273,178 400,311 273,849included in other income: Profit/(loss) on sale of fixed assets (906) 498 (906) 498Change in fair value of assets held through profit and loss - 5,922 - -
Foreign Exchange related income includes gains and losses from spot and forward contracts and translated foreign currency assets.
4. oTher BanKing inCoMe
NOTES TO THE FINANCIAL STATEMENTS
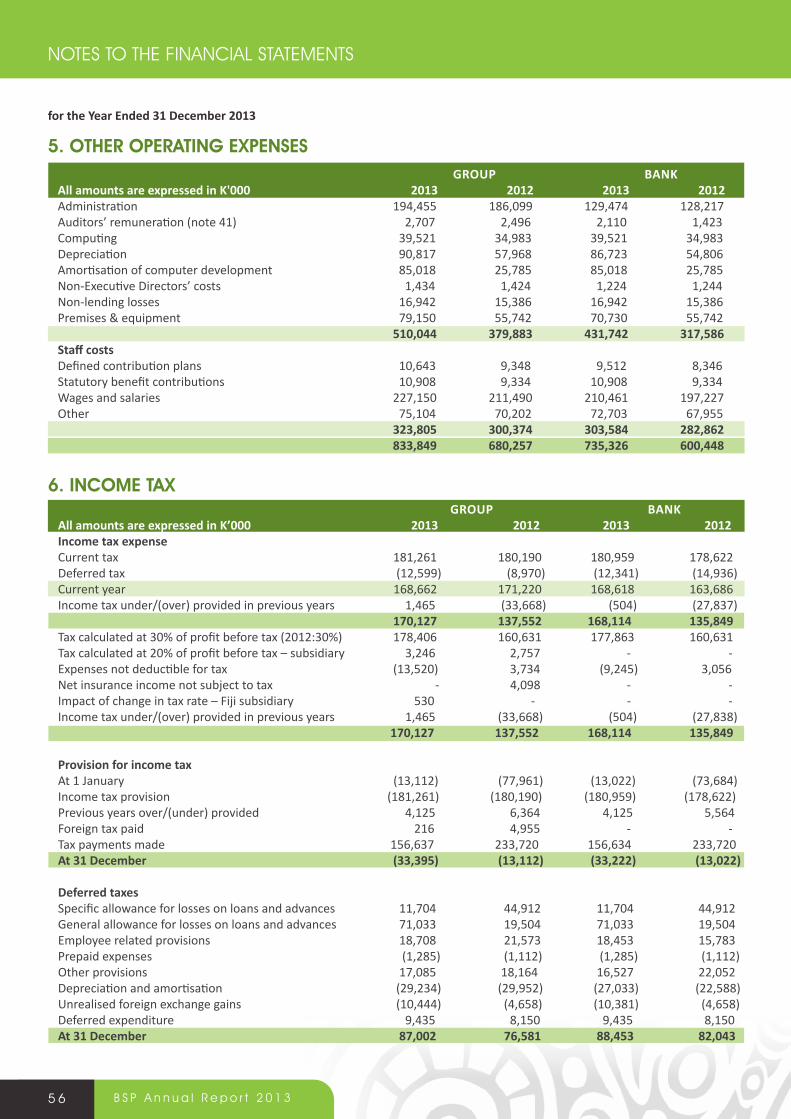
5 6 B S P A n n u a l R e p o r t 2 0 1 3
NOTES TO THE FINANCIAL STATEMENTS
grouP BanK all amounts are expressed in K'000 2013 2012 2013 2012Administration 194,455 186,099 129,474 128,217Auditors’ remuneration (note 41) 2,707 2,496 2,110 1,423Computing 39,521 34,983 39,521 34,983Depreciation 90,817 57,968 86,723 54,806Amortisation of computer development 85,018 25,785 85,018 25,785 Non-Executive Directors’ costs 1,434 1,424 1,224 1,244Non-lending losses 16,942 15,386 16,942 15,386Premises & equipment 79,150 55,742 70,730 55,742 510,044 379,883 431,742 317,586Staff costs Defined contribution plans 10,643 9,348 9,512 8,346Statutory benefit contributions 10,908 9,334 10,908 9,334Wages and salaries 227,150 211,490 210,461 197,227Other 75,104 70,202 72,703 67,955 323,805 300,374 303,584 282,862 833,849 680,257 735,326 600,448
5. oTher oPeraTing eXPenses
6. inCoMe TaX grouP BanK All amounts are expressed in K’000 2013 2012 2013 2012income tax expense Current tax 181,261 180,190 180,959 178,622Deferred tax (12,599) (8,970) (12,341) (14,936)Current year 168,662 171,220 168,618 163,686Income tax under/(over) provided in previous years 1,465 (33,668) (504) (27,837) 170,127 137,552 168,114 135,849 Tax calculated at 30% of profit before tax (2012:30%) 178,406 160,631 177,863 160,631Tax calculated at 20% of profit before tax – subsidiary 3,246 2,757 - -Expenses not deductible for tax (13,520) 3,734 (9,245) 3,056Net insurance income not subject to tax - 4,098 - -Impact of change in tax rate – Fiji subsidiary 530 - - -Income tax under/(over) provided in previous years 1,465 (33,668) (504) (27,838) 170,127 137,552 168,114 135,849
Provision for income tax At 1 January (13,112) (77,961) (13,022) (73,684)Income tax provision (181,261) (180,190) (180,959) (178,622)Previous years over/(under) provided 4,125 6,364 4,125 5,564Foreign tax paid 216 4,955 - -Tax payments made 156,637 233,720 156,634 233,720At 31 December (33,395) (13,112) (33,222) (13,022)
Deferred taxes Specific allowance for losses on loans and advances 11,704 44,912 11,704 44,912General allowance for losses on loans and advances 71,033 19,504 71,033 19,504Employee related provisions 18,708 21,573 18,453 15,783Prepaid expenses (1,285) (1,112) (1,285) (1,112)Other provisions 17,085 18,164 16,527 22,052Depreciation and amortisation (29,234) (29,952) (27,033) (22,588)Unrealised foreign exchange gains (10,444) (4,658) (10,381) (4,658)Deferred expenditure 9,435 8,150 9,435 8,150At 31 December 87,002 76,581 88,453 82,043
for the Year Ended 31 December 2013
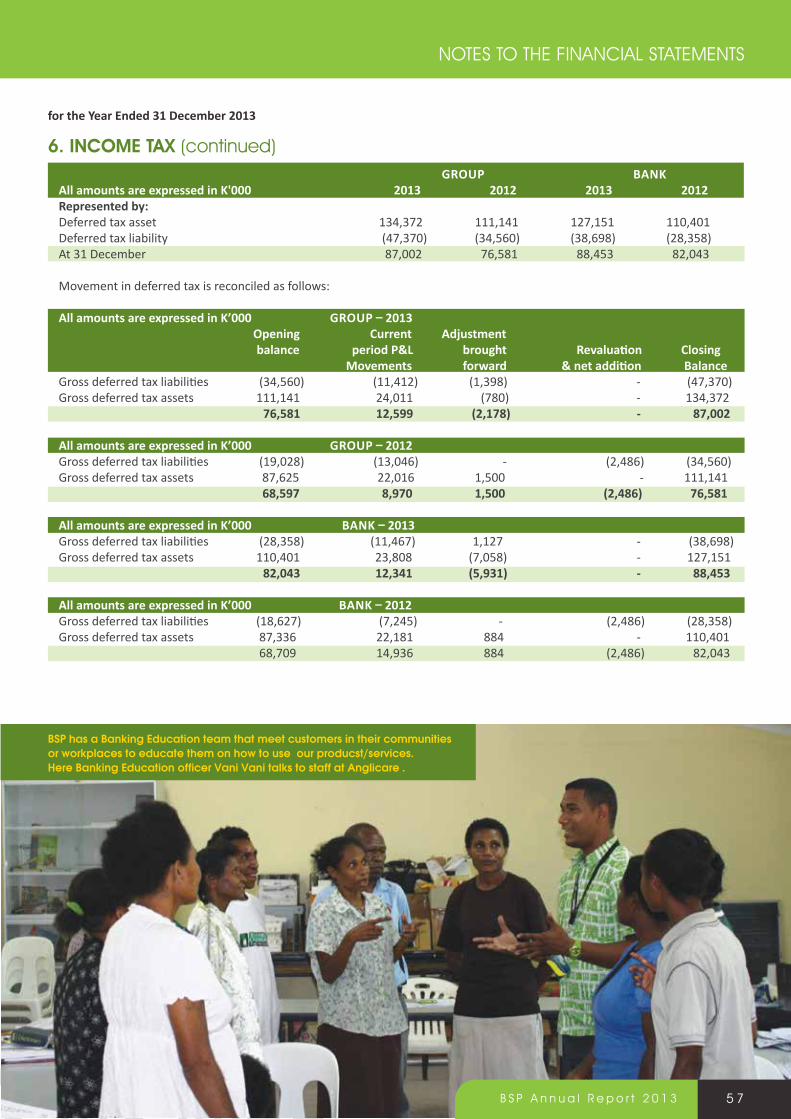
BsP has a Banking education team that meet customers in their communities or workplaces to educate them on how to use our producst/services. Here Banking education officer Vani Vani talks to staff at anglicare .
5 7B S P A n n u a l R e p o r t 2 0 1 3
for the Year Ended 31 December 2013
6. inCoMe TaX (continued) grouP BanKall amounts are expressed in K'000 2013 2012 2013 2012Represented by: Deferred tax asset 134,372 111,141 127,151 110,401Deferred tax liability (47,370) (34,560) (38,698) (28,358)At 31 December 87,002 76,581 88,453 82,043
Movement in deferred tax is reconciled as follows:
All amounts are expressed in K’000 GROUP – 2013 opening Current adjustment balance period P&L brought Revaluation Closing Movements forward & net addition BalanceGross deferred tax liabilities (34,560) (11,412) (1,398) - (47,370)Gross deferred tax assets 111,141 24,011 (780) - 134,372 76,581 12,599 (2,178) - 87,002
All amounts are expressed in K’000 GROUP – 2012Gross deferred tax liabilities (19,028) (13,046) - (2,486) (34,560)Gross deferred tax assets 87,625 22,016 1,500 - 111,141 68,597 8,970 1,500 (2,486) 76,581
All amounts are expressed in K’000 BANK – 2013Gross deferred tax liabilities (28,358) (11,467) 1,127 - (38,698)Gross deferred tax assets 110,401 23,808 (7,058) - 127,151 82,043 12,341 (5,931) - 88,453
All amounts are expressed in K’000 BANK – 2012Gross deferred tax liabilities (18,627) (7,245) - (2,486) (28,358)Gross deferred tax assets 87,336 22,181 884 - 110,401 68,709 14,936 884 (2,486) 82,043
NOTES TO THE FINANCIAL STATEMENTS
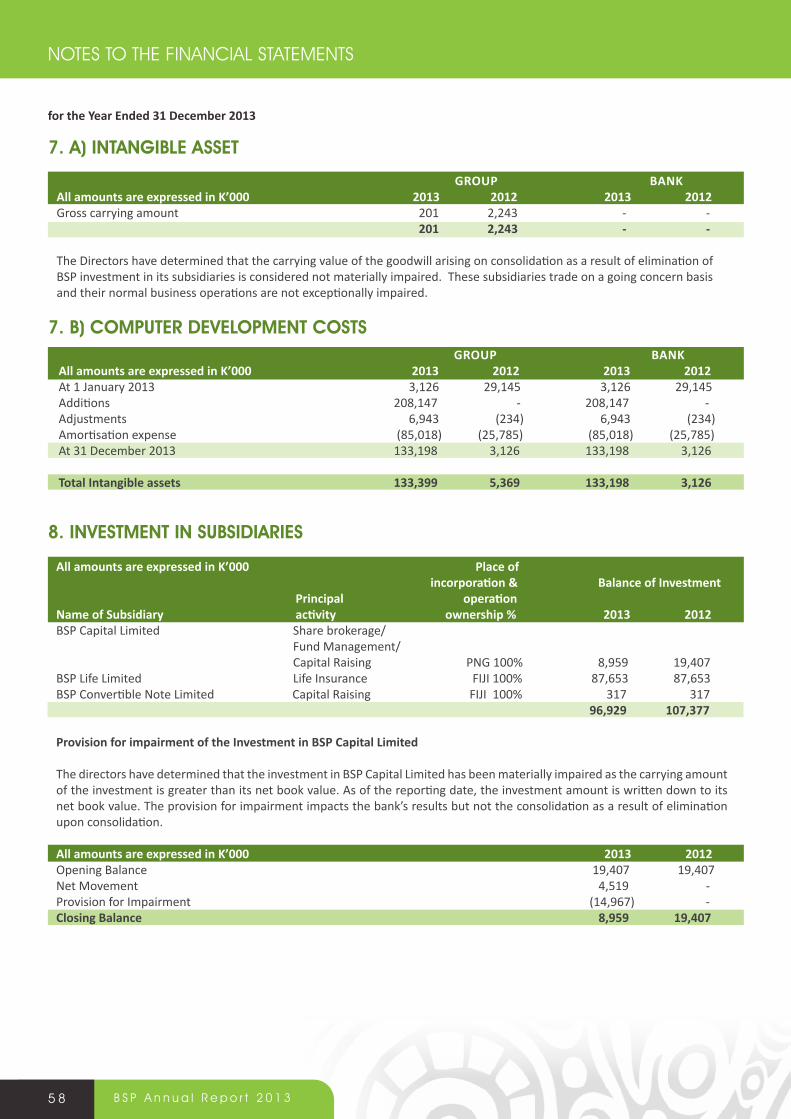
5 8 B S P A n n u a l R e p o r t 2 0 1 3
NOTES TO THE FINANCIAL STATEMENTS
7. a) inTangiBle asseT
grouP BanK All amounts are expressed in K’000 2013 2012 2013 2012Gross carrying amount 201 2,243 - - 201 2,243 - -
The Directors have determined that the carrying value of the goodwill arising on consolidation as a result of elimination of BSP investment in its subsidiaries is considered not materially impaired. These subsidiaries trade on a going concern basis and their normal business operations are not exceptionally impaired.
8. inVesTMenT in suBsidiaries
for the Year Ended 31 December 2013
7. B) CoMPuTer deVeloPMenT CosTs grouP BanK All amounts are expressed in K’000 2013 2012 2013 2012At 1 January 2013 3,126 29,145 3,126 29,145Additions 208,147 - 208,147 -Adjustments 6,943 (234) 6,943 (234)Amortisation expense (85,018) (25,785) (85,018) (25,785)At 31 December 2013 133,198 3,126 133,198 3,126
Total Intangible assets 133,399 5,369 133,198 3,126
All amounts are expressed in K’000 Place of incorporation & Balance of Investment Principal operation Name of Subsidiary activity ownership % 2013 2012BSP Capital Limited Share brokerage/ Fund Management/ Capital Raising PNG 100% 8,959 19,407BSP Life Limited Life Insurance FIJI 100% 87,653 87,653BSP Convertible Note Limited Capital Raising FIJI 100% 317 317 96,929 107,377
Provision for impairment of the investment in BsP Capital limited
The directors have determined that the investment in BSP Capital Limited has been materially impaired as the carrying amount of the investment is greater than its net book value. As of the reporting date, the investment amount is written down to its net book value. The provision for impairment impacts the bank’s results but not the consolidation as a result of elimination upon consolidation.
All amounts are expressed in K’000 2013 2012Opening Balance 19,407 19,407Net Movement 4,519 - Provision for Impairment (14,967) - Closing Balance 8,959 19,407
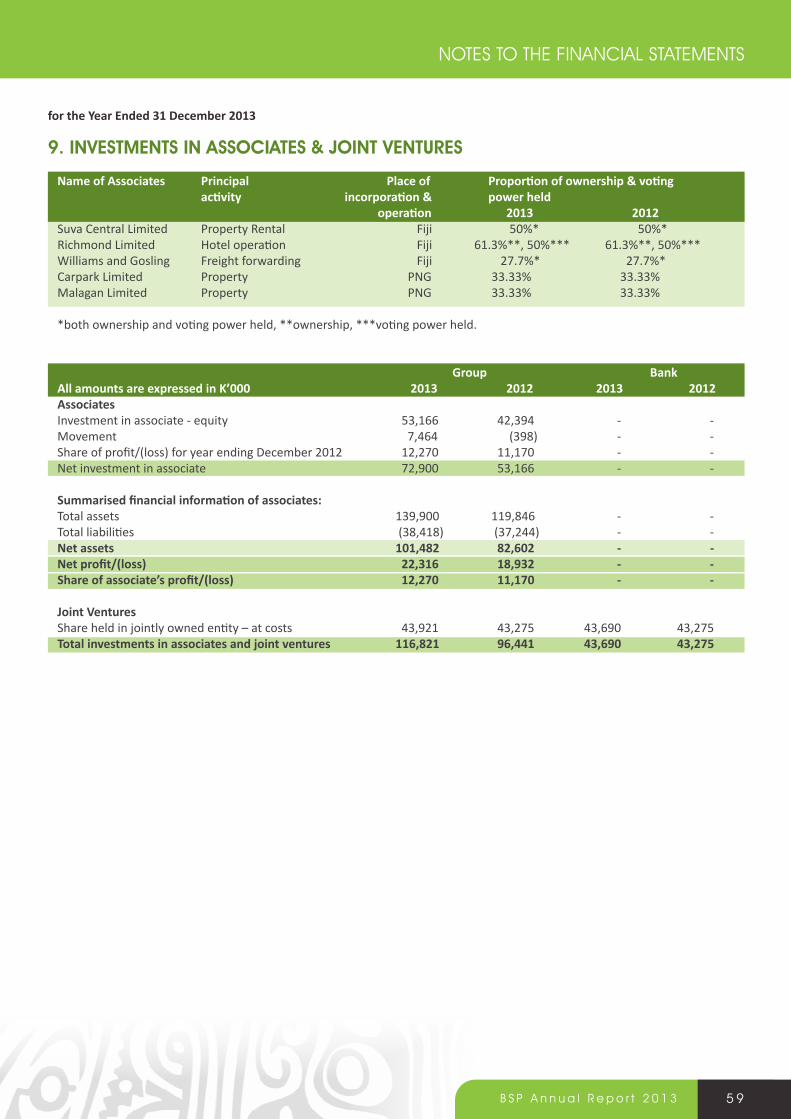
5 9B S P A n n u a l R e p o r t 2 0 1 3
Name of Associates Principal Place of Proportion of ownership & voting activity incorporation & power held operation 2013 2012Suva Central Limited Property Rental Fiji 50%* 50%*Richmond Limited Hotel operation Fiji 61.3%**, 50%*** 61.3%**, 50%***Williams and Gosling Freight forwarding Fiji 27.7%* 27.7%*Carpark Limited Property PNG 33.33% 33.33%Malagan Limited Property PNG 33.33% 33.33%
*both ownership and voting power held, **ownership, ***voting power held.
group BankAll amounts are expressed in K’000 2013 2012 2013 2012associates Investment in associate - equity 53,166 42,394 - -Movement 7,464 (398) - -Share of profit/(loss) for year ending December 2012 12,270 11,170 - -Net investment in associate 72,900 53,166 - -
Summarised financial information of associates: Total assets 139,900 119,846 - -Total liabilities (38,418) (37,244) - -net assets 101,482 82,602 - -Net profit/(loss) 22,316 18,932 - -Share of associate’s profit/(loss) 12,270 11,170 - -
Joint ventures Share held in jointly owned entity – at costs 43,921 43,275 43,690 43,275total investments in associates and joint ventures 116,821 96,441 43,690 43,275
9. inVesTMenTs in assoCiaTes & joinT VenTures
for the Year Ended 31 December 2013
NOTES TO THE FINANCIAL STATEMENTS
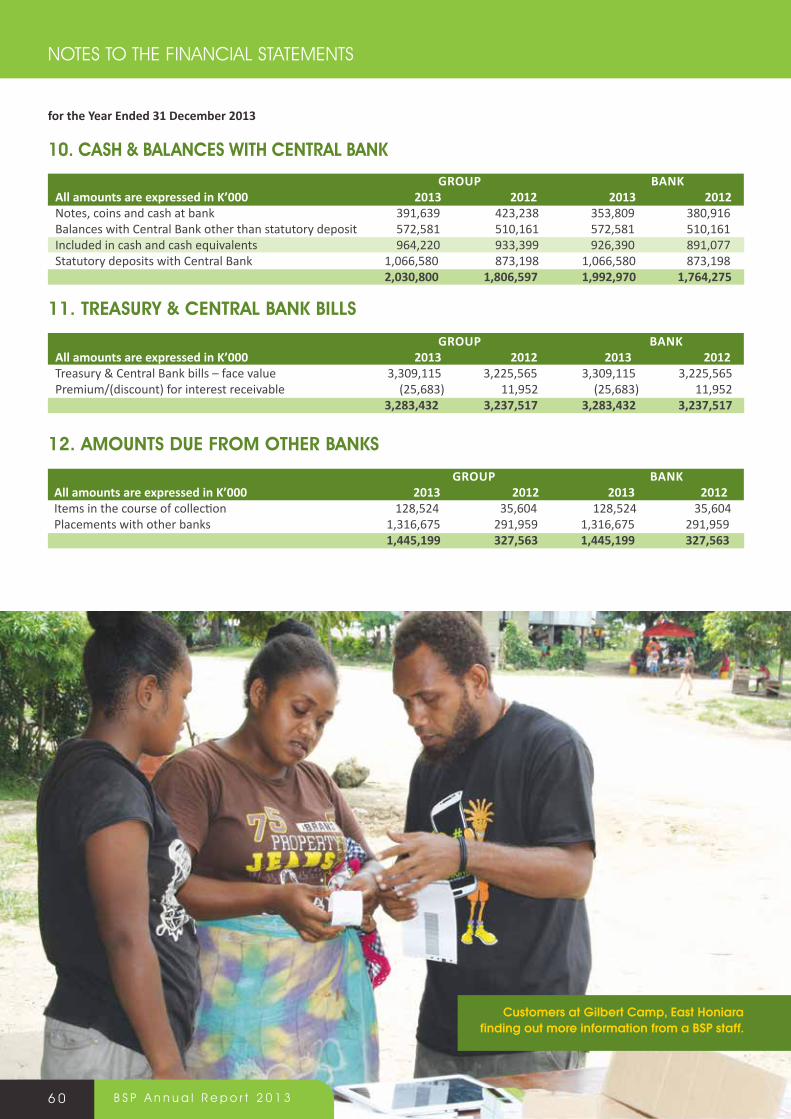
Customers at Gilbert Camp, east Honiarafinding out more information from a BsP staff.
6 0 B S P A n n u a l R e p o r t 2 0 1 3
NOTES TO THE FINANCIAL STATEMENTS
grouP BanK All amounts are expressed in K’000 2013 2012 2013 2012Notes, coins and cash at bank 391,639 423,238 353,809 380,916Balances with Central Bank other than statutory deposit 572,581 510,161 572,581 510,161Included in cash and cash equivalents 964,220 933,399 926,390 891,077Statutory deposits with Central Bank 1,066,580 873,198 1,066,580 873,198 2,030,800 1,806,597 1,992,970 1,764,275
10. Cash & BalanCes wiTh CenTral BanK
grouP BanK All amounts are expressed in K’000 2013 2012 2013 2012Treasury & Central Bank bills – face value 3,309,115 3,225,565 3,309,115 3,225,565Premium/(discount) for interest receivable (25,683) 11,952 (25,683) 11,952 3,283,432 3,237,517 3,283,432 3,237,517
11. Treasury & CenTral BanK Bills
grouP BanK All amounts are expressed in K’000 2013 2012 2013 2012Items in the course of collection 128,524 35,604 128,524 35,604Placements with other banks 1,316,675 291,959 1,316,675 291,959 1,445,199 327,563 1,445,199 327,563
12. aMounTs due FroM oTher BanKs
for the Year Ended 31 December 2013
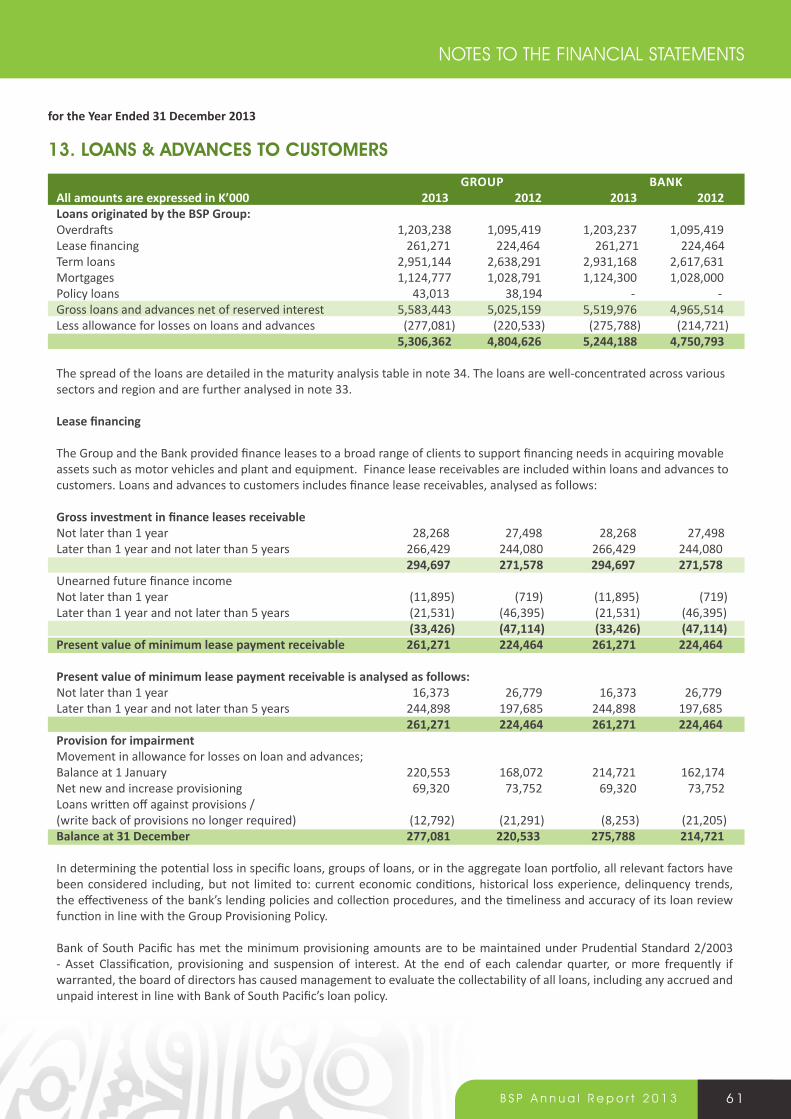
6 1B S P A n n u a l R e p o r t 2 0 1 3
13. loans & adVanCes To CusToMers
grouP BanK All amounts are expressed in K’000 2013 2012 2013 2012Loans originated by the BSP Group: Overdrafts 1,203,238 1,095,419 1,203,237 1,095,419Lease financing 261,271 224,464 261,271 224,464Term loans 2,951,144 2,638,291 2,931,168 2,617,631Mortgages 1,124,777 1,028,791 1,124,300 1,028,000Policy loans 43,013 38,194 - -Gross loans and advances net of reserved interest 5,583,443 5,025,159 5,519,976 4,965,514Less allowance for losses on loans and advances (277,081) (220,533) (275,788) (214,721) 5,306,362 4,804,626 5,244,188 4,750,793
The spread of the loans are detailed in the maturity analysis table in note 34. The loans are well-concentrated across various sectors and region and are further analysed in note 33.
Lease financing The Group and the Bank provided finance leases to a broad range of clients to support financing needs in acquiring movable assets such as motor vehicles and plant and equipment. Finance lease receivables are included within loans and advances to customers. Loans and advances to customers includes finance lease receivables, analysed as follows:
Gross investment in finance leases receivable Not later than 1 year 28,268 27,498 28,268 27,498Later than 1 year and not later than 5 years 266,429 244,080 266,429 244,080 294,697 271,578 294,697 271,578Unearned future finance incomeNot later than 1 year (11,895) (719) (11,895) (719)Later than 1 year and not later than 5 years (21,531) (46,395) (21,531) (46,395) (33,426) (47,114) (33,426) (47,114)Present value of minimum lease payment receivable 261,271 224,464 261,271 224,464
Present value of minimum lease payment receivable is analysed as follows:Not later than 1 year 16,373 26,779 16,373 26,779Later than 1 year and not later than 5 years 244,898 197,685 244,898 197,685 261,271 224,464 261,271 224,464Provision for impairment Movement in allowance for losses on loan and advances; Balance at 1 January 220,553 168,072 214,721 162,174Net new and increase provisioning 69,320 73,752 69,320 73,752Loans written off against provisions / (write back of provisions no longer required) (12,792) (21,291) (8,253) (21,205)Balance at 31 December 277,081 220,533 275,788 214,721
In determining the potential loss in specific loans, groups of loans, or in the aggregate loan portfolio, all relevant factors have been considered including, but not limited to: current economic conditions, historical loss experience, delinquency trends, the effectiveness of the bank’s lending policies and collection procedures, and the timeliness and accuracy of its loan review function in line with the Group Provisioning Policy.
Bank of South Pacific has met the minimum provisioning amounts are to be maintained under Prudential Standard 2/2003 - Asset Classification, provisioning and suspension of interest. At the end of each calendar quarter, or more frequently if warranted, the board of directors has caused management to evaluate the collectability of all loans, including any accrued and unpaid interest in line with Bank of South Pacific’s loan policy.
for the Year Ended 31 December 2013
NOTES TO THE FINANCIAL STATEMENTS
BsP staff at the Telefomin sub-branch during the opening in february 2013. Telefomin, West sepik Province, is only accessible by air and is one of the most remote places
in PNG. Previously locals either travelled by air into provincial capital Vanimo or into Kiunga and Tabubil in
Western Province to do banking.
6 2 B S P A n n u a l R e p o r t 2 0 1 3
NOTES TO THE FINANCIAL STATEMENTS
13. loans & adVanCes To CusToMers (continued)
grouP BanK All amounts are expressed in K’000 2013 2012 2013 2012Provision for impairment is represented by: Collective provision 237,400 174,220 236,776 173,635Individually assessed or specific provision 39,681 46,313 39,012 41,086Balance at 31 December 277,081 220,533 275,788 214,721
loan impairment expense Net collective provision funding (57,449) (65,013) (57,449) (65,013)Net new and increase individually assessed provisioning (11,871) (8,739) (11,871) (8,739)Total new and increase provisioning (69,320) (73,752) (69,320) (73,752)Recoveries during the year 26,239 21,133 26,239 21,133Net write back/(write off) (35,492) (18,333) (35,492) (18,333)Balance at 31 December (78,573) (70,952) (78,573) (70,952)
for the Year Ended 31 December 2013
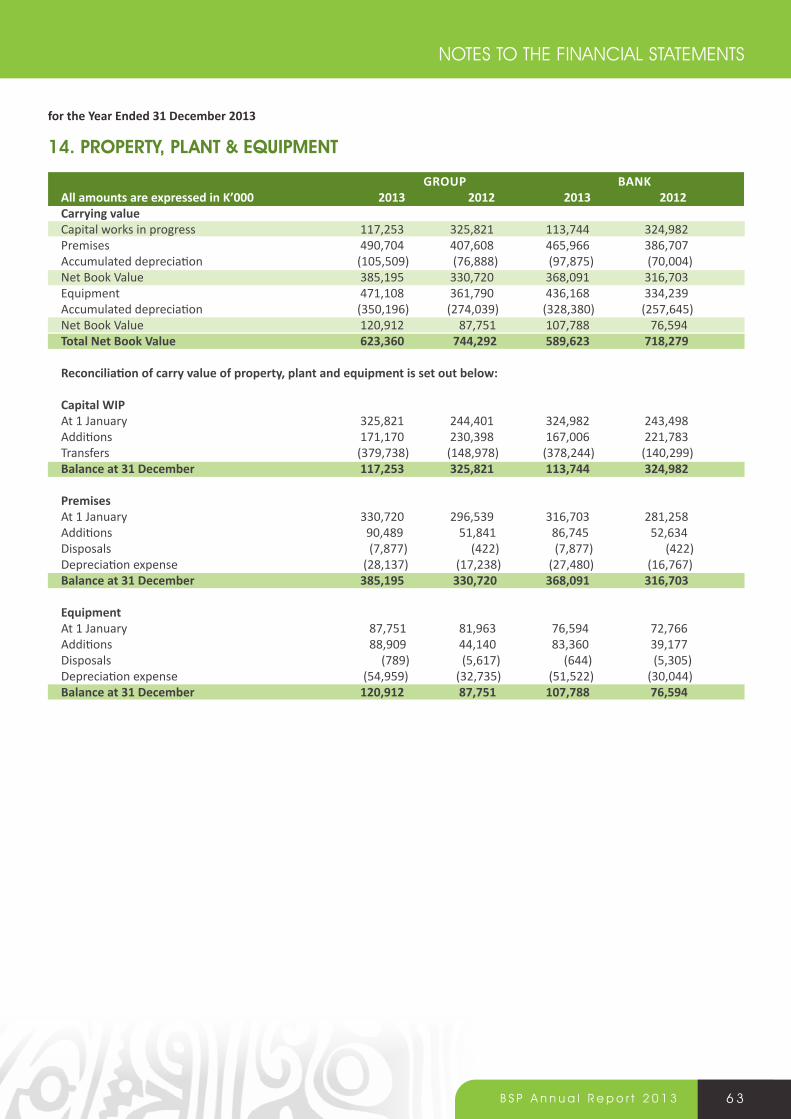
6 3B S P A n n u a l R e p o r t 2 0 1 3
14. ProPerTy, PlanT & eQuiPMenT
grouP BanK All amounts are expressed in K’000 2013 2012 2013 2012Carrying value Capital works in progress 117,253 325,821 113,744 324,982Premises 490,704 407,608 465,966 386,707Accumulated depreciation (105,509) (76,888) (97,875) (70,004)Net Book Value 385,195 330,720 368,091 316,703Equipment 471,108 361,790 436,168 334,239Accumulated depreciation (350,196) (274,039) (328,380) (257,645)Net Book Value 120,912 87,751 107,788 76,594total net Book value 623,360 744,292 589,623 718,279
Reconciliation of carry value of property, plant and equipment is set out below:
Capital WiP At 1 January 325,821 244,401 324,982 243,498Additions 171,170 230,398 167,006 221,783Transfers (379,738) (148,978) (378,244) (140,299)Balance at 31 December 117,253 325,821 113,744 324,982
Premises At 1 January 330,720 296,539 316,703 281,258Additions 90,489 51,841 86,745 52,634Disposals (7,877) (422) (7,877) (422)Depreciation expense (28,137) (17,238) (27,480) (16,767)Balance at 31 December 385,195 330,720 368,091 316,703
Equipment At 1 January 87,751 81,963 76,594 72,766Additions 88,909 44,140 83,360 39,177Disposals (789) (5,617) (644) (5,305)Depreciation expense (54,959) (32,735) (51,522) (30,044)Balance at 31 December 120,912 87,751 107,788 76,594
for the Year Ended 31 December 2013
NOTES TO THE FINANCIAL STATEMENTS
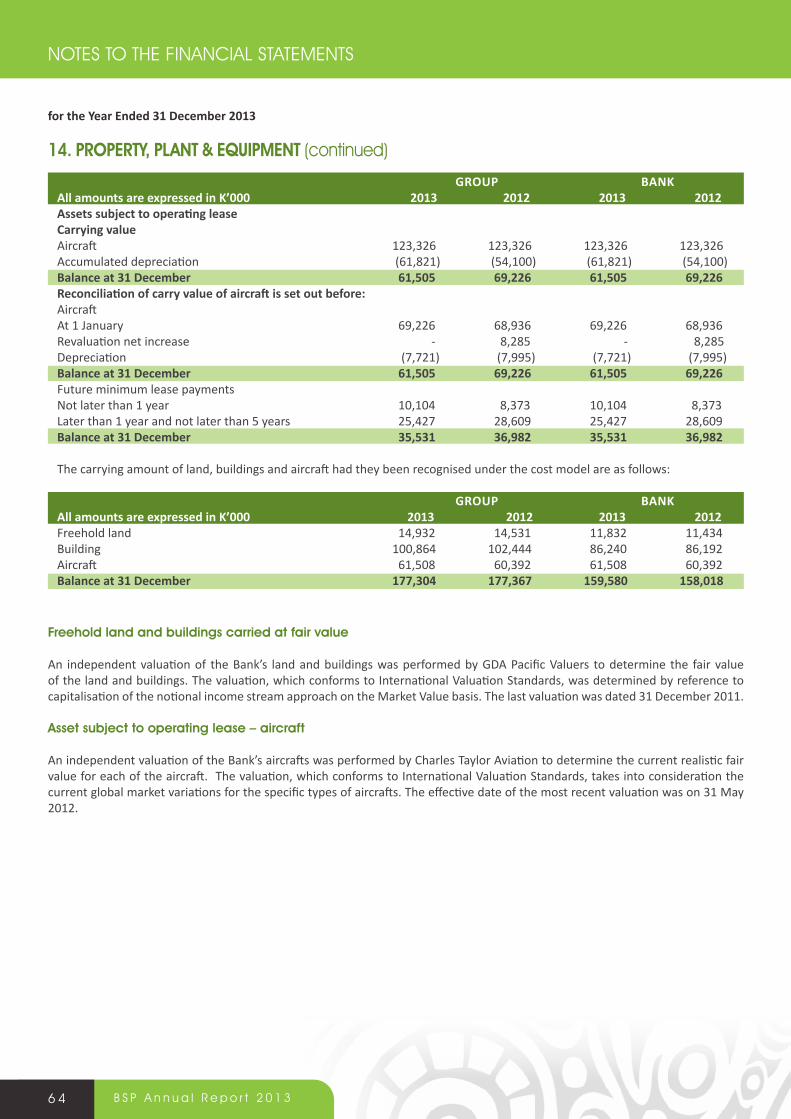
6 4 B S P A n n u a l R e p o r t 2 0 1 3
NOTES TO THE FINANCIAL STATEMENTS
14. ProPerTy, PlanT & eQuiPMenT (continued)
grouP BanK All amounts are expressed in K’000 2013 2012 2013 2012Assets subject to operating leaseCarrying valueAircraft 123,326 123,326 123,326 123,326Accumulated depreciation (61,821) (54,100) (61,821) (54,100)Balance at 31 December 61,505 69,226 61,505 69,226Reconciliation of carry value of aircraft is set out before: Aircraft At 1 January 69,226 68,936 69,226 68,936Revaluation net increase - 8,285 - 8,285Depreciation (7,721) (7,995) (7,721) (7,995)Balance at 31 December 61,505 69,226 61,505 69,226Future minimum lease paymentsNot later than 1 year 10,104 8,373 10,104 8,373Later than 1 year and not later than 5 years 25,427 28,609 25,427 28,609Balance at 31 December 35,531 36,982 35,531 36,982
The carrying amount of land, buildings and aircraft had they been recognised under the cost model are as follows:
grouP BanK All amounts are expressed in K’000 2013 2012 2013 2012Freehold land 14,932 14,531 11,832 11,434Building 100,864 102,444 86,240 86,192Aircraft 61,508 60,392 61,508 60,392Balance at 31 December 177,304 177,367 159,580 158,018
for the Year Ended 31 December 2013
Freehold land and buildings carried at fair value
An independent valuation of the Bank’s land and buildings was performed by GDA Pacific Valuers to determine the fair value of the land and buildings. The valuation, which conforms to International Valuation Standards, was determined by reference to capitalisation of the notional income stream approach on the Market Value basis. The last valuation was dated 31 December 2011.
asset subject to operating lease – aircraft
An independent valuation of the Bank’s aircrafts was performed by Charles Taylor Aviation to determine the current realistic fair value for each of the aircraft. The valuation, which conforms to International Valuation Standards, takes into consideration the current global market variations for the specific types of aircrafts. The effective date of the most recent valuation was on 31 May 2012.
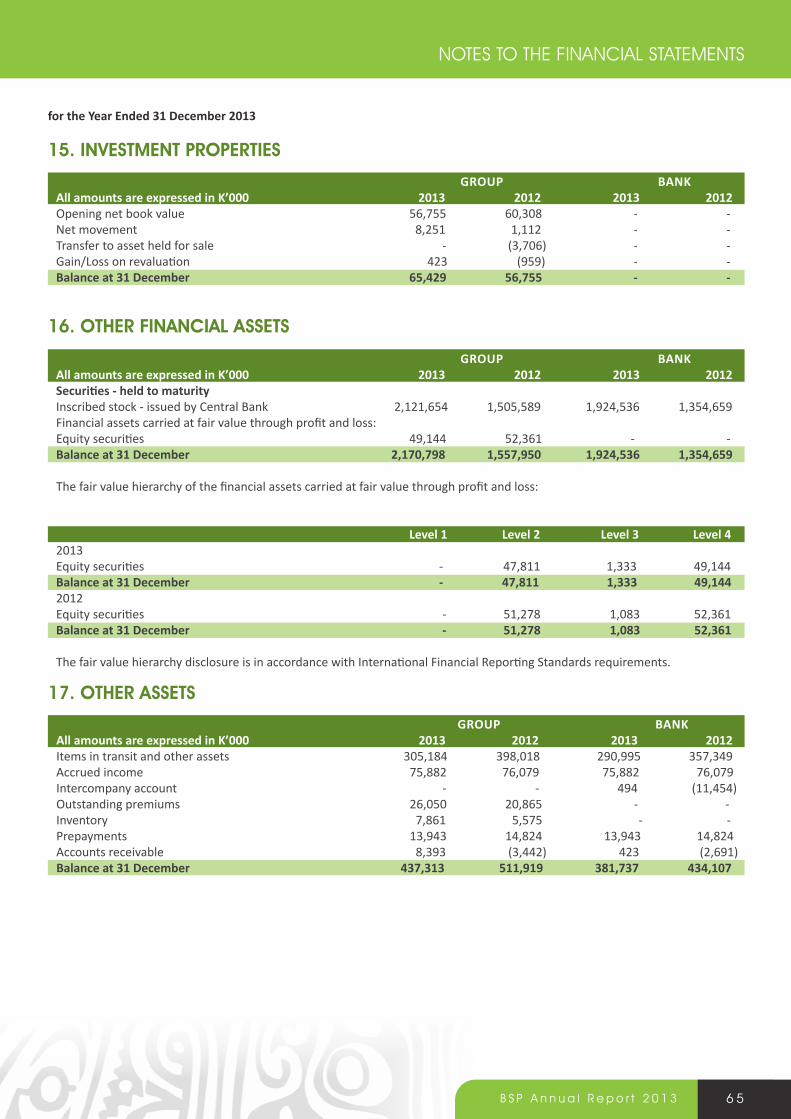
6 5B S P A n n u a l R e p o r t 2 0 1 3
15. inVesTMenT ProPerTies
grouP BanK All amounts are expressed in K’000 2013 2012 2013 2012Opening net book value 56,755 60,308 - -Net movement 8,251 1,112 - -Transfer to asset held for sale - (3,706) - -Gain/Loss on revaluation 423 (959) - -Balance at 31 December 65,429 56,755 - -
16. oTher FinanCial asseTs
grouP BanK All amounts are expressed in K’000 2013 2012 2013 2012Securities - held to maturity Inscribed stock - issued by Central Bank 2,121,654 1,505,589 1,924,536 1,354,659 Financial assets carried at fair value through profit and loss:Equity securities 49,144 52,361 - -Balance at 31 December 2,170,798 1,557,950 1,924,536 1,354,659
The fair value hierarchy of the financial assets carried at fair value through profit and loss:
level 1 level 2 level 3 level 4 2013 Equity securities - 47,811 1,333 49,144Balance at 31 December - 47,811 1,333 49,1442012 Equity securities - 51,278 1,083 52,361Balance at 31 December - 51,278 1,083 52,361
The fair value hierarchy disclosure is in accordance with International Financial Reporting Standards requirements.
17. oTher asseTs
grouP BanK All amounts are expressed in K’000 2013 2012 2013 2012Items in transit and other assets 305,184 398,018 290,995 357,349Accrued income 75,882 76,079 75,882 76,079Intercompany account - - 494 (11,454)Outstanding premiums 26,050 20,865 - -Inventory 7,861 5,575 - -Prepayments 13,943 14,824 13,943 14,824Accounts receivable 8,393 (3,442) 423 (2,691)Balance at 31 December 437,313 511,919 381,737 434,107
NOTES TO THE FINANCIAL STATEMENTS
for the Year Ended 31 December 2013
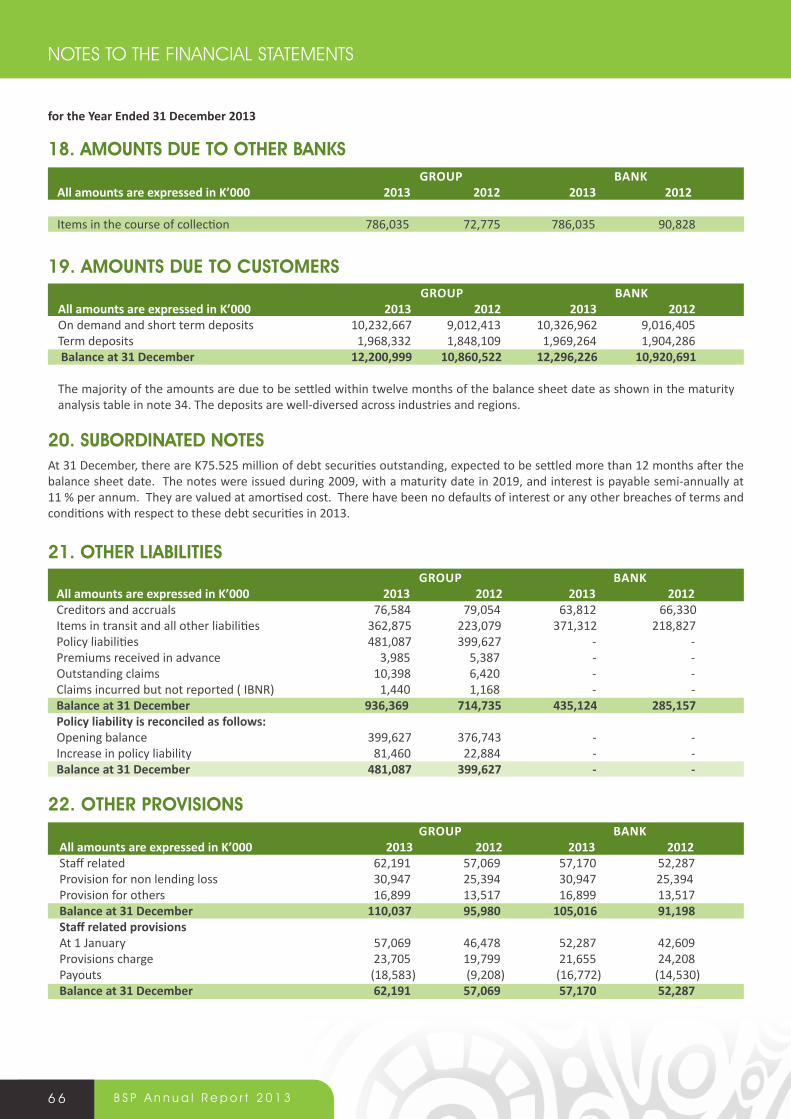
6 6 B S P A n n u a l R e p o r t 2 0 1 3
NOTES TO THE FINANCIAL STATEMENTS
18. aMounTs due To oTher BanKs grouP BanK All amounts are expressed in K’000 2013 2012 2013 2012
Items in the course of collection 786,035 72,775 786,035 90,828
19. aMounTs due To CusToMers grouP BanK All amounts are expressed in K’000 2013 2012 2013 2012On demand and short term deposits 10,232,667 9,012,413 10,326,962 9,016,405Term deposits 1,968,332 1,848,109 1,969,264 1,904,286 Balance at 31 December 12,200,999 10,860,522 12,296,226 10,920,691
The majority of the amounts are due to be settled within twelve months of the balance sheet date as shown in the maturity analysis table in note 34. The deposits are well-diversed across industries and regions.
20. suBordinaTed noTesAt 31 December, there are K75.525 million of debt securities outstanding, expected to be settled more than 12 months after the balance sheet date. The notes were issued during 2009, with a maturity date in 2019, and interest is payable semi-annually at 11 % per annum. They are valued at amortised cost. There have been no defaults of interest or any other breaches of terms and conditions with respect to these debt securities in 2013.
grouP BanK All amounts are expressed in K’000 2013 2012 2013 2012Creditors and accruals 76,584 79,054 63,812 66,330Items in transit and all other liabilities 362,875 223,079 371,312 218,827Policy liabilities 481,087 399,627 - -Premiums received in advance 3,985 5,387 - -Outstanding claims 10,398 6,420 - -Claims incurred but not reported ( IBNR) 1,440 1,168 - - Balance at 31 December 936,369 714,735 435,124 285,157Policy liability is reconciled as follows: Opening balance 399,627 376,743 - -Increase in policy liability 81,460 22,884 - -Balance at 31 December 481,087 399,627 - -
21. oTher liaBiliTies
22. oTher ProVisions grouP BanK All amounts are expressed in K’000 2013 2012 2013 2012Staff related 62,191 57,069 57,170 52,287Provision for non lending loss 30,947 25,394 30,947 25,394Provision for others 16,899 13,517 16,899 13,517Balance at 31 December 110,037 95,980 105,016 91,198Staff related provisions At 1 January 57,069 46,478 52,287 42,609Provisions charge 23,705 19,799 21,655 24,208Payouts (18,583) (9,208) (16,772) (14,530)Balance at 31 December 62,191 57,069 57,170 52,287
for the Year Ended 31 December 2013
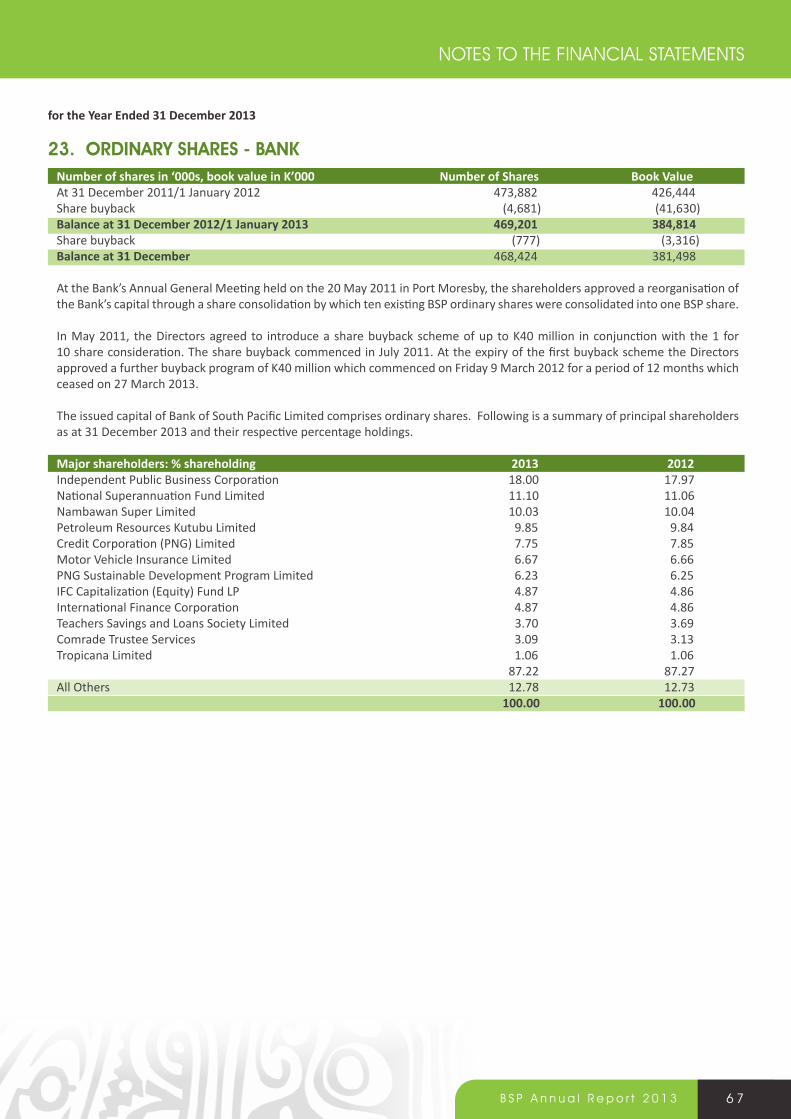
6 7B S P A n n u a l R e p o r t 2 0 1 3
23. ordinary shares - BanK Number of shares in ‘000s, book value in K’000 Number of Shares Book ValueAt 31 December 2011/1 January 2012 473,882 426,444Share buyback (4,681) (41,630)Balance at 31 December 2012/1 January 2013 469,201 384,814Share buyback (777) (3,316)Balance at 31 December 468,424 381,498
At the Bank’s Annual General Meeting held on the 20 May 2011 in Port Moresby, the shareholders approved a reorganisation of the Bank’s capital through a share consolidation by which ten existing BSP ordinary shares were consolidated into one BSP share.
In May 2011, the Directors agreed to introduce a share buyback scheme of up to K40 million in conjunction with the 1 for 10 share consideration. The share buyback commenced in July 2011. At the expiry of the first buyback scheme the Directors approved a further buyback program of K40 million which commenced on Friday 9 March 2012 for a period of 12 months which ceased on 27 March 2013.
The issued capital of Bank of South Pacific Limited comprises ordinary shares. Following is a summary of principal shareholders as at 31 December 2013 and their respective percentage holdings.
Major shareholders: % shareholding 2013 2012Independent Public Business Corporation 18.00 17.97National Superannuation Fund Limited 11.10 11.06Nambawan Super Limited 10.03 10.04Petroleum Resources Kutubu Limited 9.85 9.84Credit Corporation (PNG) Limited 7.75 7.85Motor Vehicle Insurance Limited 6.67 6.66PNG Sustainable Development Program Limited 6.23 6.25IFC Capitalization (Equity) Fund LP 4.87 4.86International Finance Corporation 4.87 4.86Teachers Savings and Loans Society Limited 3.70 3.69Comrade Trustee Services 3.09 3.13Tropicana Limited 1.06 1.06 87.22 87.27All Others 12.78 12.73 100.00 100.00
for the Year Ended 31 December 2013
NOTES TO THE FINANCIAL STATEMENTS
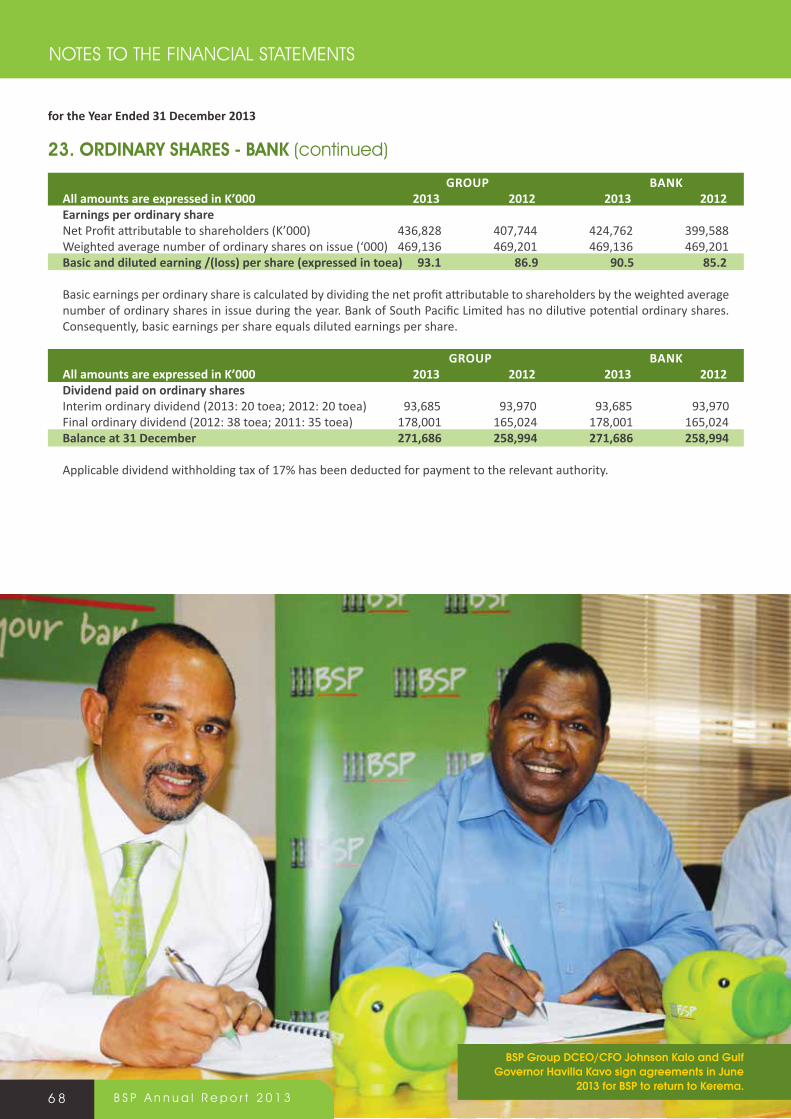
BsP Group DCeo/Cfo Johnson Kalo and Gulf Governor Havilla Kavo sign agreements in June
2013 for BsP to return to Kerema. 6 8 B S P A n n u a l R e p o r t 2 0 1 3
NOTES TO THE FINANCIAL STATEMENTS
grouP BanK All amounts are expressed in K’000 2013 2012 2013 2012Earnings per ordinary share Net Profit attributable to shareholders (K’000) 436,828 407,744 424,762 399,588Weighted average number of ordinary shares on issue (‘000) 469,136 469,201 469,136 469,201Basic and diluted earning /(loss) per share (expressed in toea) 93.1 86.9 90.5 85.2
Basic earnings per ordinary share is calculated by dividing the net profit attributable to shareholders by the weighted average number of ordinary shares in issue during the year. Bank of South Pacific Limited has no dilutive potential ordinary shares. Consequently, basic earnings per share equals diluted earnings per share.
grouP BanK All amounts are expressed in K’000 2013 2012 2013 2012Dividend paid on ordinary sharesInterim ordinary dividend (2013: 20 toea; 2012: 20 toea) 93,685 93,970 93,685 93,970Final ordinary dividend (2012: 38 toea; 2011: 35 toea) 178,001 165,024 178,001 165,024Balance at 31 December 271,686 258,994 271,686 258,994
Applicable dividend withholding tax of 17% has been deducted for payment to the relevant authority.
23. ordinary shares - BanK (continued)
for the Year Ended 31 December 2013
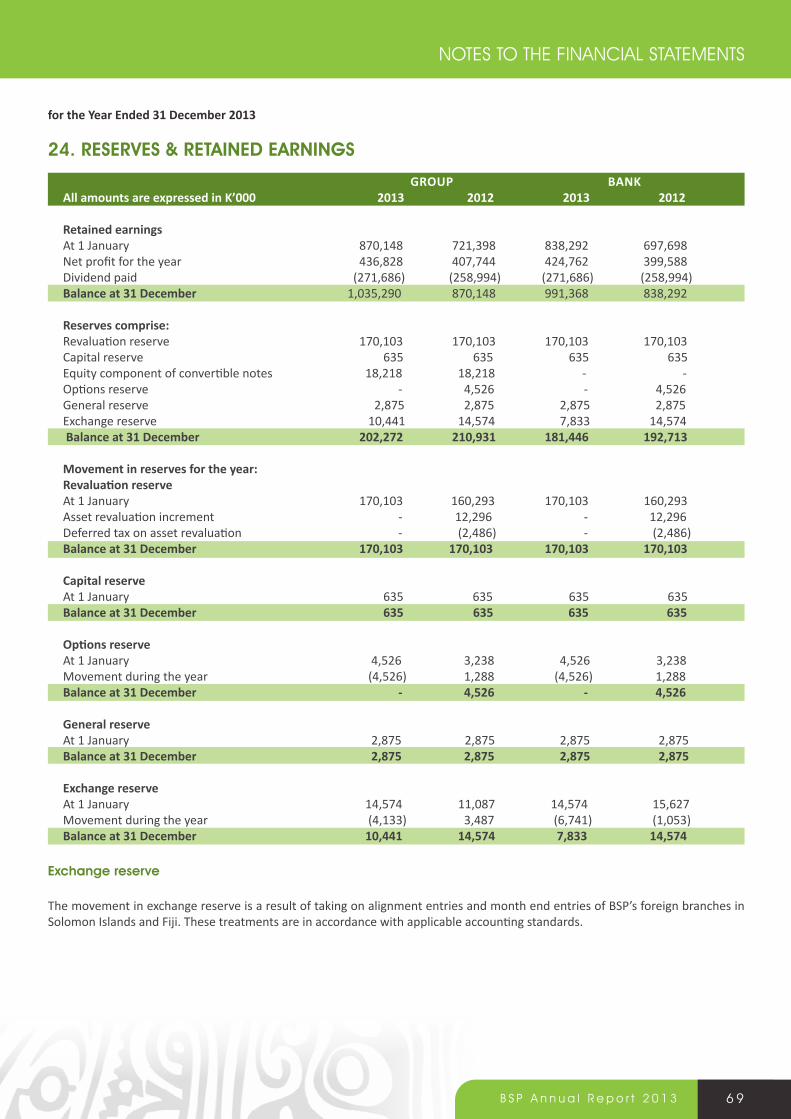
6 9B S P A n n u a l R e p o r t 2 0 1 3
grouP BanK All amounts are expressed in K’000 2013 2012 2013 2012
retained earnings At 1 January 870,148 721,398 838,292 697,698Net profit for the year 436,828 407,744 424,762 399,588Dividend paid (271,686) (258,994) (271,686) (258,994)Balance at 31 December 1,035,290 870,148 991,368 838,292
reserves comprise:Revaluation reserve 170,103 170,103 170,103 170,103Capital reserve 635 635 635 635Equity component of convertible notes 18,218 18,218 - -Options reserve - 4,526 - 4,526General reserve 2,875 2,875 2,875 2,875Exchange reserve 10,441 14,574 7,833 14,574 Balance at 31 December 202,272 210,931 181,446 192,713
movement in reserves for the year:Revaluation reserve At 1 January 170,103 160,293 170,103 160,293Asset revaluation increment - 12,296 - 12,296Deferred tax on asset revaluation - (2,486) - (2,486)Balance at 31 December 170,103 170,103 170,103 170,103
Capital reserve At 1 January 635 635 635 635Balance at 31 December 635 635 635 635
Options reserve At 1 January 4,526 3,238 4,526 3,238Movement during the year (4,526) 1,288 (4,526) 1,288Balance at 31 December - 4,526 - 4,526
general reserve At 1 January 2,875 2,875 2,875 2,875Balance at 31 December 2,875 2,875 2,875 2,875
Exchange reserve At 1 January 14,574 11,087 14,574 15,627Movement during the year (4,133) 3,487 (6,741) (1,053)Balance at 31 December 10,441 14,574 7,833 14,574
24. reserVes & reTained earnings
for the Year Ended 31 December 2013
exchange reserve
The movement in exchange reserve is a result of taking on alignment entries and month end entries of BSP’s foreign branches in Solomon Islands and Fiji. These treatments are in accordance with applicable accounting standards.
NOTES TO THE FINANCIAL STATEMENTS

Branchless Banking in Malu’u, North Malaita,solomon islands
7 0 B S P A n n u a l R e p o r t 2 0 1 3
NOTES TO THE FINANCIAL STATEMENTS
equity component of convertible notes
On 20 April 2010, the Group issued 3,064,967 Fiji Dollars (FJD) denominated mandatory convertible notes through its wholly owned subsidiary BSP Convertible Notes Limited (BSP CN) at an issue price of FJD5.25 (K7.30) per note. Each note entitles the holder to convert to ten (10) Fiji Class shares. On conversion all notes are redeemed for their face value and the proceeds of that redemption are applied as the subscription price for Fiji Class shares. Notes can only be redeemed in cash at the election of BSP CN Fiji with regulatory approval. The amount payable at redemption will be the greater of the market value or face value of the note plus accrued interest. The notes have mandatorily converted to Fiji Class Shares on 20 April 2013.
The net proceeds received from the issue of the convertible notes have been split between the financial liability element and the equity component, representing the residual attributable to the option to convert the financial liability into equity of BSP CN.
The equity component of K18.218 million has been credited to equity (option premium on convertible notes).
Note holders have no right to vote at meetings of BSP Convertible Notes Limited.
statutory capital requirements in Fiji
As a requirement of the Reserve Bank of Fiji, BSP Fiji operations are required to maintain assigned capital of K24.833m (2012: K24.833m) and capital adequacy reserve of K68.547m (2012: K68.547m).
24. reserVes & reTained earnings (continued)
for the Year Ended 31 December 2013
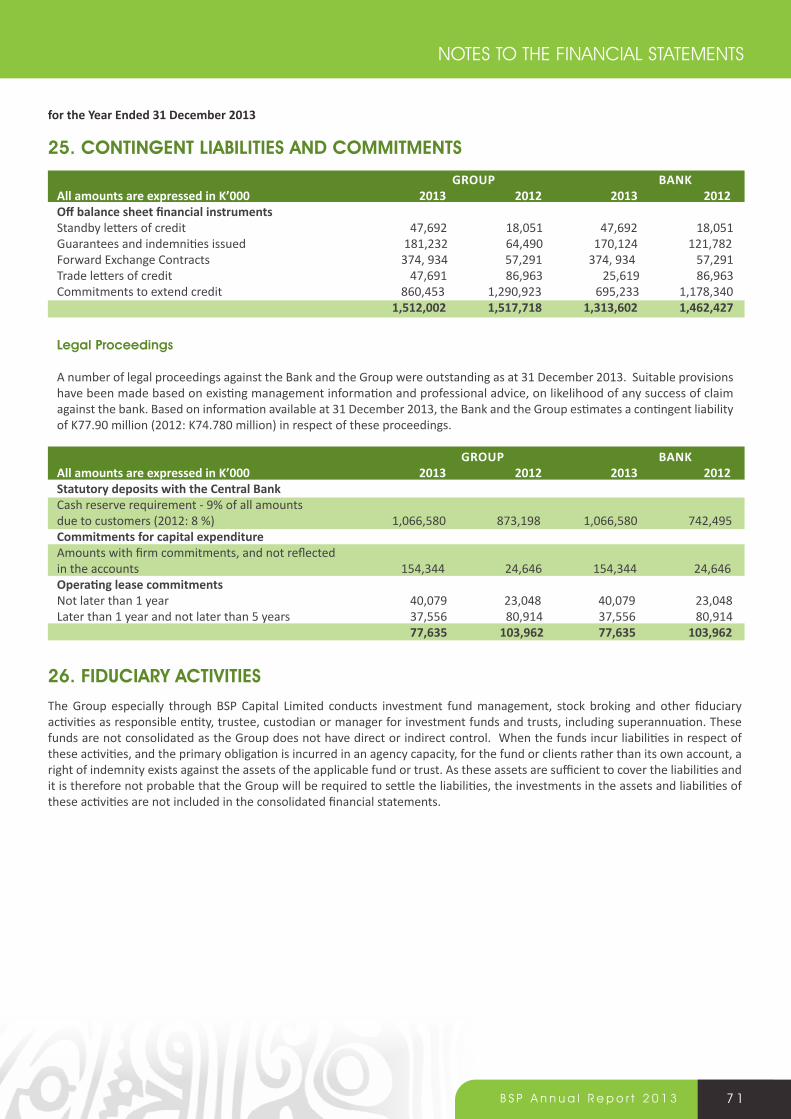
7 1B S P A n n u a l R e p o r t 2 0 1 3
25. ConTingenT liaBiliTies and CoMMiTMenTs
grouP BanK All amounts are expressed in K’000 2013 2012 2013 2012Off balance sheet financial instruments Standby letters of credit 47,692 18,051 47,692 18,051Guarantees and indemnities issued 181,232 64,490 170,124 121,782Forward Exchange Contracts 374, 934 57,291 374, 934 57,291 Trade letters of credit 47,691 86,963 25,619 86,963Commitments to extend credit 860,453 1,290,923 695,233 1,178,340 1,512,002 1,517,718 1,313,602 1,462,427
legal Proceedings
A number of legal proceedings against the Bank and the Group were outstanding as at 31 December 2013. Suitable provisions have been made based on existing management information and professional advice, on likelihood of any success of claim against the bank. Based on information available at 31 December 2013, the Bank and the Group estimates a contingent liability of K77.90 million (2012: K74.780 million) in respect of these proceedings. grouP BanK All amounts are expressed in K’000 2013 2012 2013 2012Statutory deposits with the Central Bank Cash reserve requirement - 9% of all amounts due to customers (2012: 8 %) 1,066,580 873,198 1,066,580 742,495 Commitments for capital expenditure Amounts with firm commitments, and not reflectedin the accounts 154,344 24,646 154,344 24,646Operating lease commitments Not later than 1 year 40,079 23,048 40,079 23,048Later than 1 year and not later than 5 years 37,556 80,914 37,556 80,914 77,635 103,962 77,635 103,962
26. FiduCiary aCTiViTies
The Group especially through BSP Capital Limited conducts investment fund management, stock broking and other fiduciary activities as responsible entity, trustee, custodian or manager for investment funds and trusts, including superannuation. These funds are not consolidated as the Group does not have direct or indirect control. When the funds incur liabilities in respect of these activities, and the primary obligation is incurred in an agency capacity, for the fund or clients rather than its own account, a right of indemnity exists against the assets of the applicable fund or trust. As these assets are sufficient to cover the liabilities and it is therefore not probable that the Group will be required to settle the liabilities, the investments in the assets and liabilities of these activities are not included in the consolidated financial statements.
for the Year Ended 31 December 2013
NOTES TO THE FINANCIAL STATEMENTS
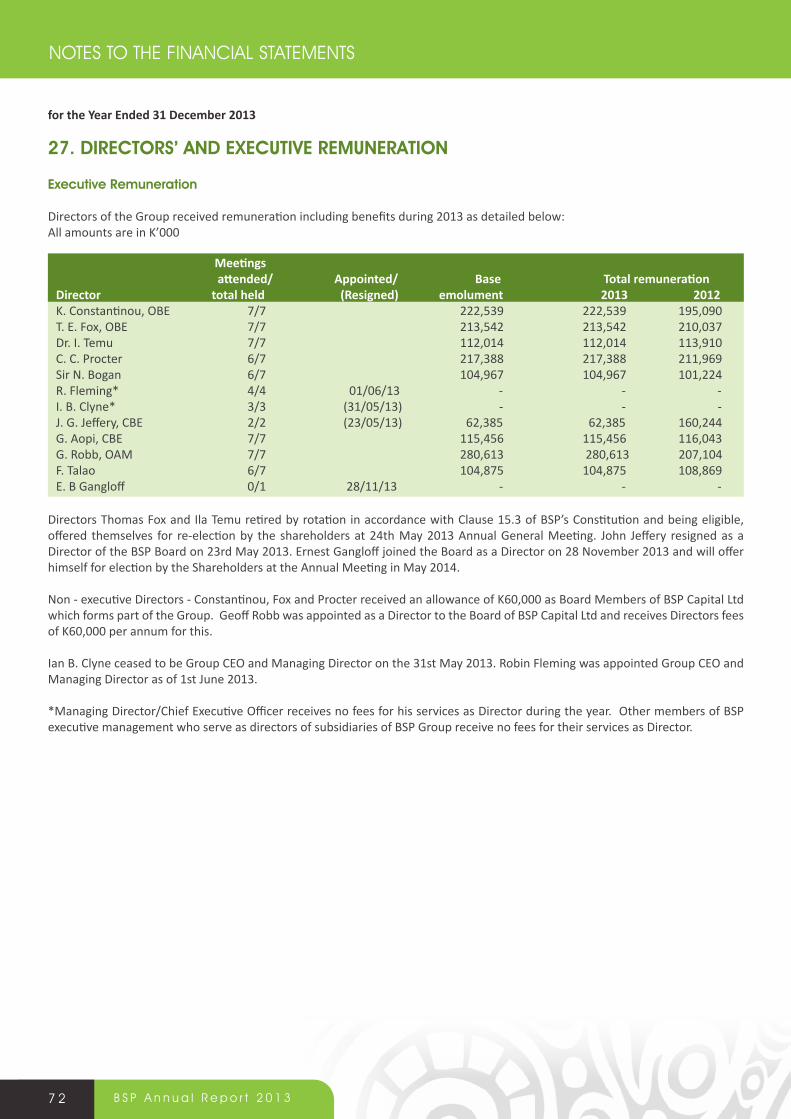
7 2 B S P A n n u a l R e p o r t 2 0 1 3
NOTES TO THE FINANCIAL STATEMENTS
27. direCTors’ and eXeCuTiVe reMuneraTion
executive remuneration Directors of the Group received remuneration including benefits during 2013 as detailed below:All amounts are in K’000
Meetings attended/ Appointed/ Base Total remunerationDirector total held (Resigned) emolument 2013 2012K. Constantinou, OBE 7/7 222,539 222,539 195,090T. E. Fox, OBE 7/7 213,542 213,542 210,037Dr. I. Temu 7/7 112,014 112,014 113,910C. C. Procter 6/7 217,388 217,388 211,969Sir N. Bogan 6/7 104,967 104,967 101,224R. Fleming* 4/4 01/06/13 - - -I. B. Clyne* 3/3 (31/05/13) - - -J. G. Jeffery, CBE 2/2 (23/05/13) 62,385 62,385 160,244G. Aopi, CBE 7/7 115,456 115,456 116,043G. Robb, OAM 7/7 280,613 280,613 207,104F. Talao 6/7 104,875 104,875 108,869E. B Gangloff 0/1 28/11/13 - - -
Directors Thomas Fox and Ila Temu retired by rotation in accordance with Clause 15.3 of BSP’s Constitution and being eligible, offered themselves for re-election by the shareholders at 24th May 2013 Annual General Meeting. John Jeffery resigned as a Director of the BSP Board on 23rd May 2013. Ernest Gangloff joined the Board as a Director on 28 November 2013 and will offer himself for election by the Shareholders at the Annual Meeting in May 2014. Non - executive Directors - Constantinou, Fox and Procter received an allowance of K60,000 as Board Members of BSP Capital Ltd which forms part of the Group. Geoff Robb was appointed as a Director to the Board of BSP Capital Ltd and receives Directors fees of K60,000 per annum for this.
Ian B. Clyne ceased to be Group CEO and Managing Director on the 31st May 2013. Robin Fleming was appointed Group CEO and Managing Director as of 1st June 2013.
*Managing Director/Chief Executive Officer receives no fees for his services as Director during the year. Other members of BSP executive management who serve as directors of subsidiaries of BSP Group receive no fees for their services as Director.
for the Year Ended 31 December 2013
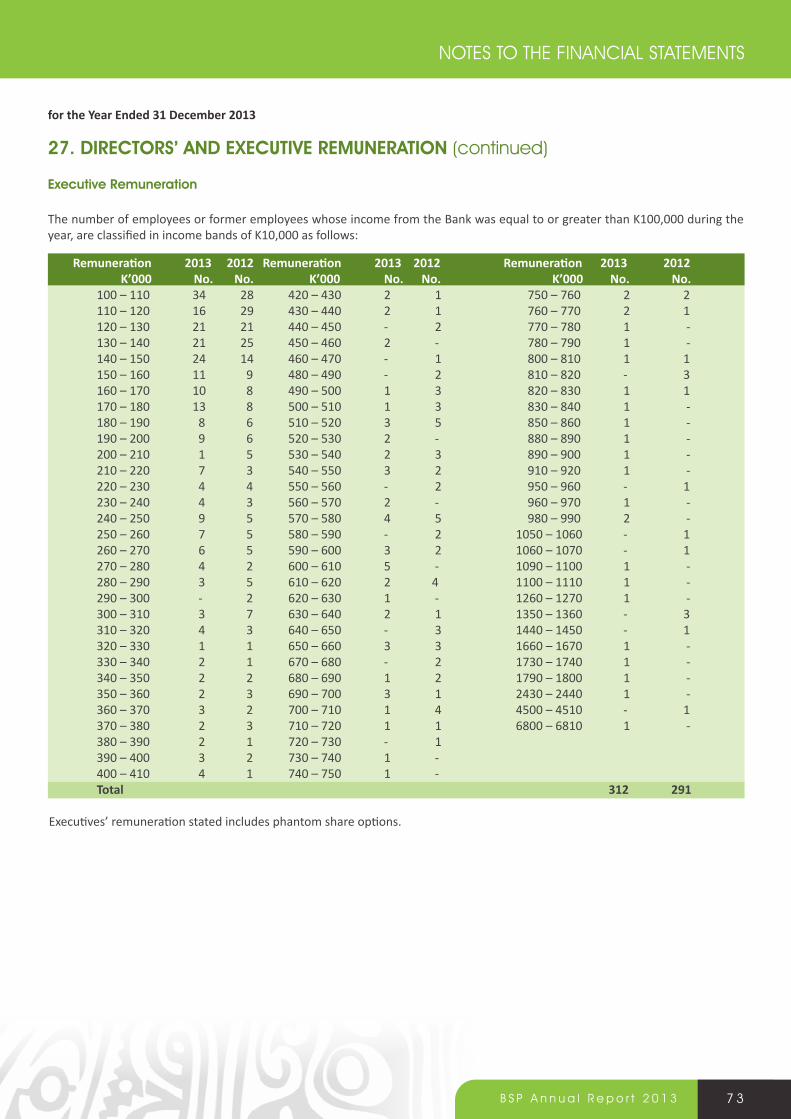
7 3B S P A n n u a l R e p o r t 2 0 1 3
Remuneration 2013 2012 Remuneration 2013 2012 Remuneration 2013 2012 K’000 No. No. K’000 No. No. K’000 No. No. 100 – 110 34 28 420 – 430 2 1 750 – 760 2 2 110 – 120 16 29 430 – 440 2 1 760 – 770 2 1 120 – 130 21 21 440 – 450 - 2 770 – 780 1 - 130 – 140 21 25 450 – 460 2 - 780 – 790 1 - 140 – 150 24 14 460 – 470 - 1 800 – 810 1 1 150 – 160 11 9 480 – 490 - 2 810 – 820 - 3 160 – 170 10 8 490 – 500 1 3 820 – 830 1 1 170 – 180 13 8 500 – 510 1 3 830 – 840 1 - 180 – 190 8 6 510 – 520 3 5 850 – 860 1 - 190 – 200 9 6 520 – 530 2 - 880 – 890 1 - 200 – 210 1 5 530 – 540 2 3 890 – 900 1 - 210 – 220 7 3 540 – 550 3 2 910 – 920 1 - 220 – 230 4 4 550 – 560 - 2 950 – 960 - 1 230 – 240 4 3 560 – 570 2 - 960 – 970 1 - 240 – 250 9 5 570 – 580 4 5 980 – 990 2 - 250 – 260 7 5 580 – 590 - 2 1050 – 1060 - 1 260 – 270 6 5 590 – 600 3 2 1060 – 1070 - 1 270 – 280 4 2 600 – 610 5 - 1090 – 1100 1 - 280 – 290 3 5 610 – 620 2 4 1100 – 1110 1 - 290 – 300 - 2 620 – 630 1 - 1260 – 1270 1 - 300 – 310 3 7 630 – 640 2 1 1350 – 1360 - 3 310 – 320 4 3 640 – 650 - 3 1440 – 1450 - 1 320 – 330 1 1 650 – 660 3 3 1660 – 1670 1 - 330 – 340 2 1 670 – 680 - 2 1730 – 1740 1 - 340 – 350 2 2 680 – 690 1 2 1790 – 1800 1 - 350 – 360 2 3 690 – 700 3 1 2430 – 2440 1 - 360 – 370 3 2 700 – 710 1 4 4500 – 4510 - 1 370 – 380 2 3 710 – 720 1 1 6800 – 6810 1 - 380 – 390 2 1 720 – 730 - 1 390 – 400 3 2 730 – 740 1 - 400 – 410 4 1 740 – 750 1 - total 312 291
Executives’ remuneration stated includes phantom share options.
27. direCTors’ and eXeCuTiVe reMuneraTion (continued)
executive remuneration The number of employees or former employees whose income from the Bank was equal to or greater than K100,000 during the year, are classified in income bands of K10,000 as follows:
for the Year Ended 31 December 2013
NOTES TO THE FINANCIAL STATEMENTS
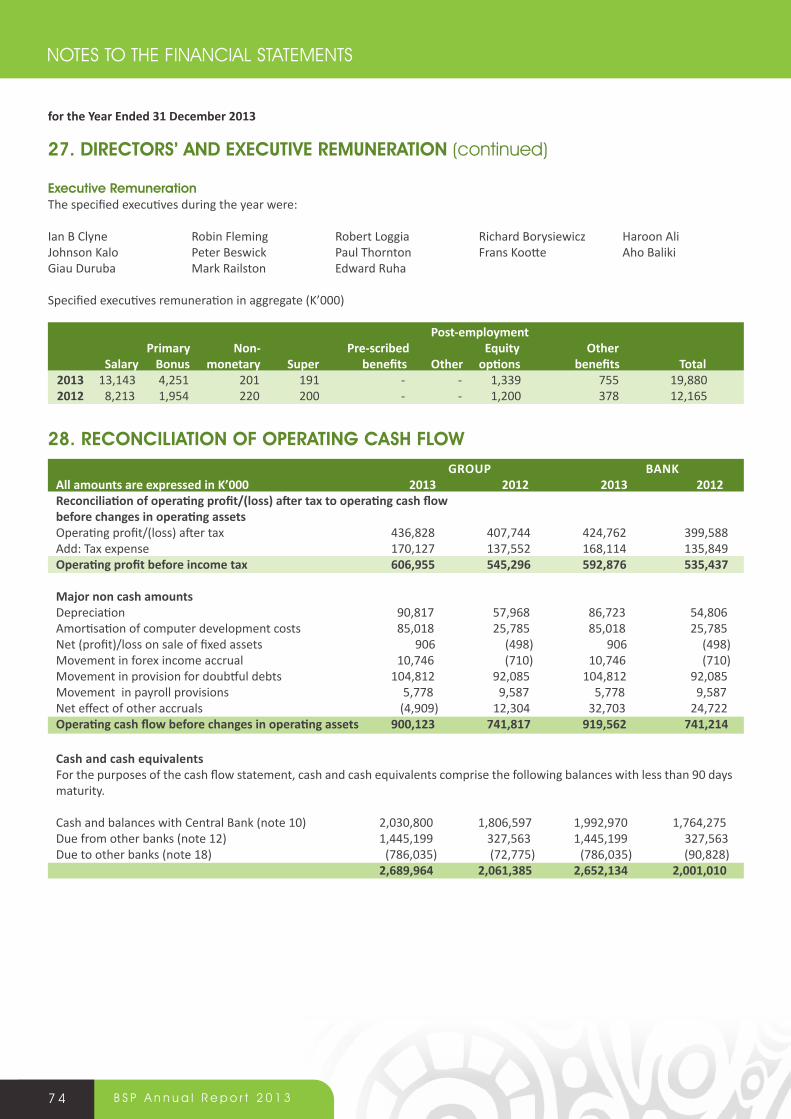
7 4 B S P A n n u a l R e p o r t 2 0 1 3
27. direCTors’ and eXeCuTiVe reMuneraTion (continued)
executive remuneration The specified executives during the year were:
Ian B Clyne Robin Fleming Robert Loggia Richard Borysiewicz Haroon AliJohnson Kalo Peter Beswick Paul Thornton Frans Kootte Aho Baliki Giau Duruba Mark Railston Edward Ruha
Specified executives remuneration in aggregate (K’000) Post-employment Primary Non- Pre-scribed Equity Other Salary Bonus monetary Super benefits Other options benefits Total 2013 13,143 4,251 201 191 - - 1,339 755 19,880 2012 8,213 1,954 220 200 - - 1,200 378 12,165
28. reConCiliaTion oF oPeraTing Cash Flow
grouP BanK All amounts are expressed in K’000 2013 2012 2013 2012Reconciliation of operating profit/(loss) after tax to operating cash flow before changes in operating assetsOperating profit/(loss) after tax 436,828 407,744 424,762 399,588Add: Tax expense 170,127 137,552 168,114 135,849Operating profit before income tax 606,955 545,296 592,876 535,437
major non cash amounts Depreciation 90,817 57,968 86,723 54,806Amortisation of computer development costs 85,018 25,785 85,018 25,785Net (profit)/loss on sale of fixed assets 906 (498) 906 (498)Movement in forex income accrual 10,746 (710) 10,746 (710)Movement in provision for doubtful debts 104,812 92,085 104,812 92,085Movement in payroll provisions 5,778 9,587 5,778 9,587Net effect of other accruals (4,909) 12,304 32,703 24,722Operating cash flow before changes in operating assets 900,123 741,817 919,562 741,214
Cash and cash equivalents For the purposes of the cash flow statement, cash and cash equivalents comprise the following balances with less than 90 days maturity.
Cash and balances with Central Bank (note 10) 2,030,800 1,806,597 1,992,970 1,764,275Due from other banks (note 12) 1,445,199 327,563 1,445,199 327,563Due to other banks (note 18) (786,035) (72,775) (786,035) (90,828) 2,689,964 2,061,385 2,652,134 2,001,010
for the Year Ended 31 December 2013
NOTES TO THE FINANCIAL STATEMENTS
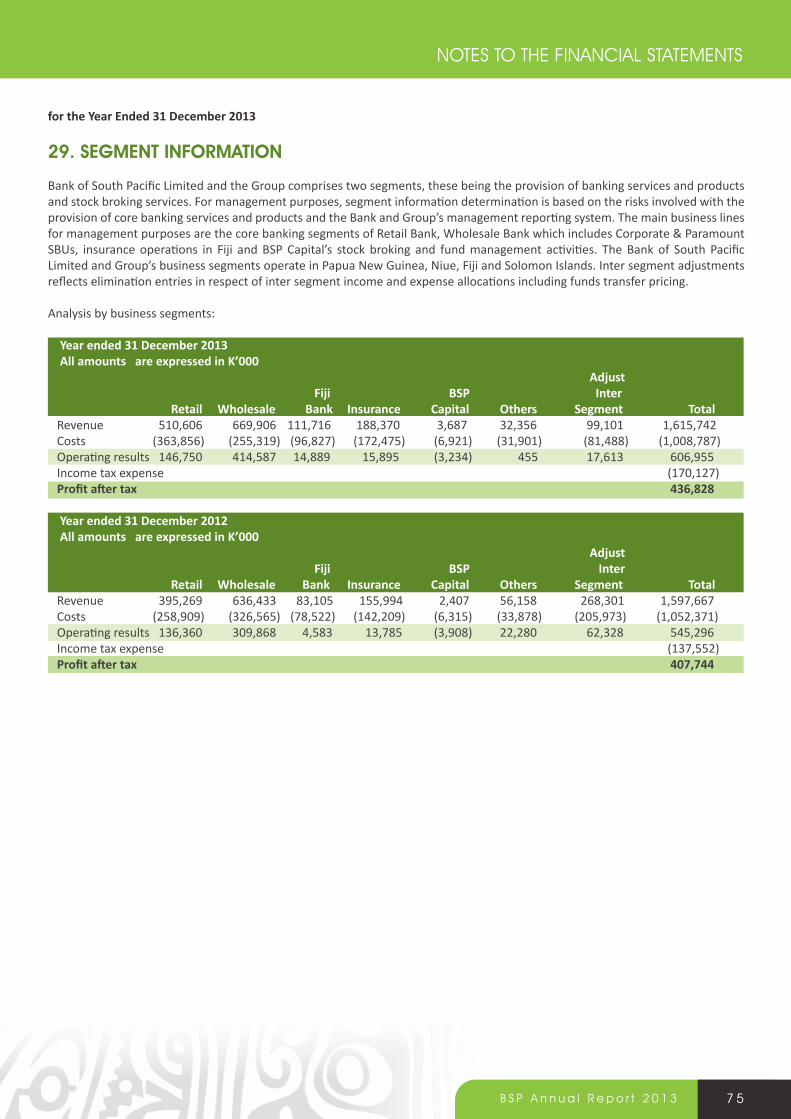
7 5B S P A n n u a l R e p o r t 2 0 1 3
for the Year Ended 31 December 2013
29. segMenT inForMaTion
Bank of South Pacific Limited and the Group comprises two segments, these being the provision of banking services and products and stock broking services. For management purposes, segment information determination is based on the risks involved with the provision of core banking services and products and the Bank and Group’s management reporting system. The main business lines for management purposes are the core banking segments of Retail Bank, Wholesale Bank which includes Corporate & Paramount SBUs, insurance operations in Fiji and BSP Capital’s stock broking and fund management activities. The Bank of South Pacific Limited and Group’s business segments operate in Papua New Guinea, Niue, Fiji and Solomon Islands. Inter segment adjustments reflects elimination entries in respect of inter segment income and expense allocations including funds transfer pricing.
Analysis by business segments:
Year ended 31 December 2013 All amounts are expressed in K’000 adjust Fiji BsP inter retail Wholesale Bank insurance Capital others segment total Revenue 510,606 669,906 111,716 188,370 3,687 32,356 99,101 1,615,742 Costs (363,856) (255,319) (96,827) (172,475) (6,921) (31,901) (81,488) (1,008,787) Operating results 146,750 414,587 14,889 15,895 (3,234) 455 17,613 606,955 Income tax expense (170,127) Profit after tax 436,828 Year ended 31 December 2012 All amounts are expressed in K’000 adjust Fiji BsP inter retail Wholesale Bank insurance Capital others segment total Revenue 395,269 636,433 83,105 155,994 2,407 56,158 268,301 1,597,667 Costs (258,909) (326,565) (78,522) (142,209) (6,315) (33,878) (205,973) (1,052,371) Operating results 136,360 309,868 4,583 13,785 (3,908) 22,280 62,328 545,296 Income tax expense (137,552) Profit after tax 407,744
NOTES TO THE FINANCIAL STATEMENTS
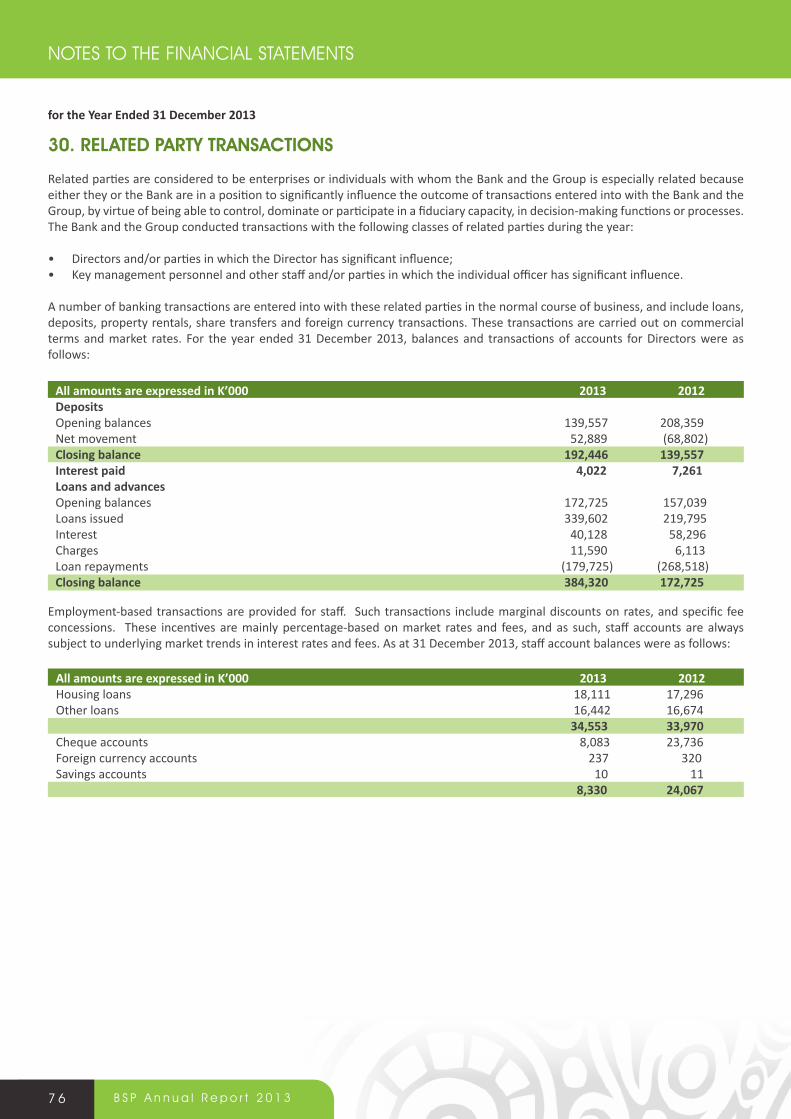
7 6 B S P A n n u a l R e p o r t 2 0 1 3
NOTES TO THE FINANCIAL STATEMENTS
30. relaTed ParTy TransaCTions
Related parties are considered to be enterprises or individuals with whom the Bank and the Group is especially related because either they or the Bank are in a position to significantly influence the outcome of transactions entered into with the Bank and the Group, by virtue of being able to control, dominate or participate in a fiduciary capacity, in decision-making functions or processes. The Bank and the Group conducted transactions with the following classes of related parties during the year:
• Directors and/or parties in which the Director has significant influence;• Key management personnel and other staff and/or parties in which the individual officer has significant influence.
A number of banking transactions are entered into with these related parties in the normal course of business, and include loans, deposits, property rentals, share transfers and foreign currency transactions. These transactions are carried out on commercial terms and market rates. For the year ended 31 December 2013, balances and transactions of accounts for Directors were as follows:
All amounts are expressed in K’000 2013 2012Deposits Opening balances 139,557 208,359Net movement 52,889 (68,802)Closing balance 192,446 139,557interest paid 4,022 7,261loans and advances Opening balances 172,725 157,039Loans issued 339,602 219,795Interest 40,128 58,296Charges 11,590 6,113Loan repayments (179,725) (268,518)Closing balance 384,320 172,725
Employment-based transactions are provided for staff. Such transactions include marginal discounts on rates, and specific fee concessions. These incentives are mainly percentage-based on market rates and fees, and as such, staff accounts are always subject to underlying market trends in interest rates and fees. As at 31 December 2013, staff account balances were as follows:
All amounts are expressed in K’000 2013 2012Housing loans 18,111 17,296Other loans 16,442 16,674 34,553 33,970Cheque accounts 8,083 23,736Foreign currency accounts 237 320Savings accounts 10 11 8,330 24,067
for the Year Ended 31 December 2013
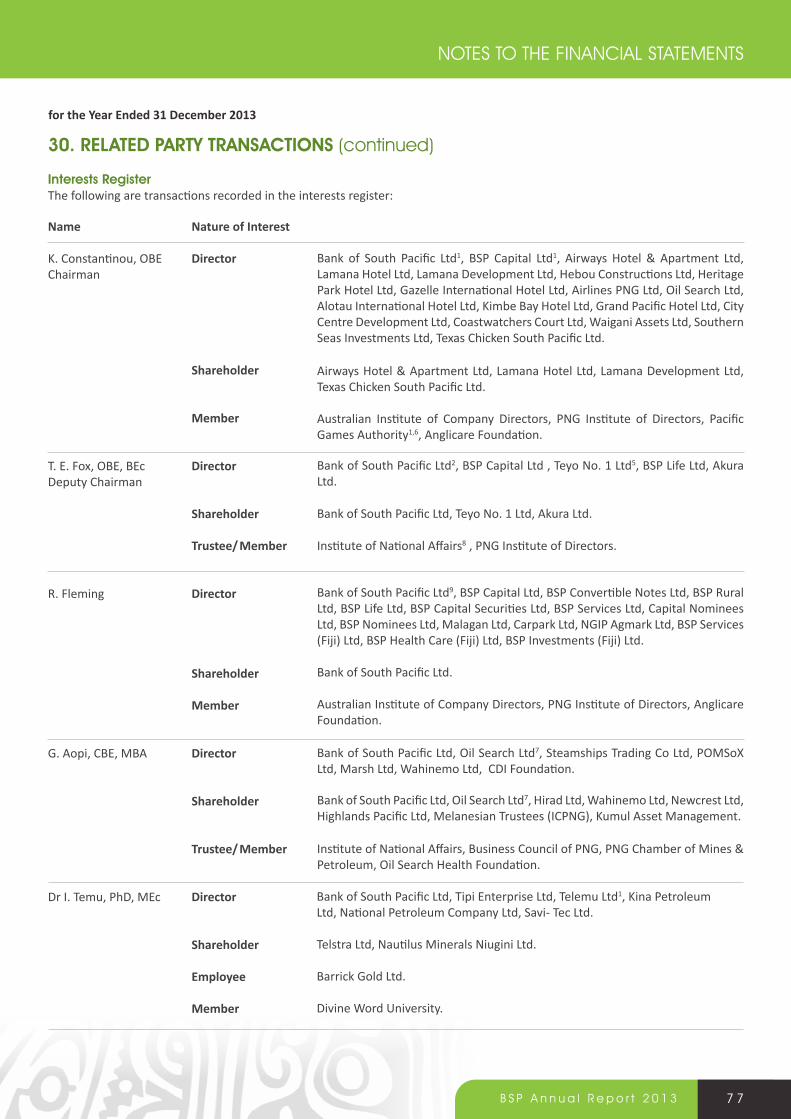
7 7B S P A n n u a l R e p o r t 2 0 1 3
name nature of interest
K. Constantinou, OBE Director Chairman
shareholder
Member
T. E. Fox, OBE, BEc Director Deputy Chairman shareholder
Trustee/ Member
R. Fleming Director
shareholder
Member
G. Aopi, CBE, MBA Director
shareholder
Trustee/ Member
Dr I. Temu, PhD, MEc Director shareholder Employee Member
Bank of South Pacific Ltd1, BSP Capital Ltd1, Airways Hotel & Apartment Ltd, Lamana Hotel Ltd, Lamana Development Ltd, Hebou Constructions Ltd, Heritage Park Hotel Ltd, Gazelle International Hotel Ltd, Airlines PNG Ltd, Oil Search Ltd, Alotau International Hotel Ltd, Kimbe Bay Hotel Ltd, Grand Pacific Hotel Ltd, City Centre Development Ltd, Coastwatchers Court Ltd, Waigani Assets Ltd, Southern Seas Investments Ltd, Texas Chicken South Pacific Ltd.
Airways Hotel & Apartment Ltd, Lamana Hotel Ltd, Lamana Development Ltd, Texas Chicken South Pacific Ltd.
Australian Institute of Company Directors, PNG Institute of Directors, Pacific Games Authority1,6, Anglicare Foundation.
Bank of South Pacific Ltd2, BSP Capital Ltd , Teyo No. 1 Ltd5, BSP Life Ltd, Akura Ltd.
Bank of South Pacific Ltd, Teyo No. 1 Ltd, Akura Ltd.
Institute of National Affairs8 , PNG Institute of Directors.
Bank of South Pacific Ltd9, BSP Capital Ltd, BSP Convertible Notes Ltd, BSP Rural Ltd, BSP Life Ltd, BSP Capital Securities Ltd, BSP Services Ltd, Capital Nominees Ltd, BSP Nominees Ltd, Malagan Ltd, Carpark Ltd, NGIP Agmark Ltd, BSP Services (Fiji) Ltd, BSP Health Care (Fiji) Ltd, BSP Investments (Fiji) Ltd.
Bank of South Pacific Ltd.
Australian Institute of Company Directors, PNG Institute of Directors, Anglicare Foundation.
Bank of South Pacific Ltd, Oil Search Ltd7, Steamships Trading Co Ltd, POMSoX Ltd, Marsh Ltd, Wahinemo Ltd, CDI Foundation.
Bank of South Pacific Ltd, Oil Search Ltd7, Hirad Ltd, Wahinemo Ltd, Newcrest Ltd, Highlands Pacific Ltd, Melanesian Trustees (ICPNG), Kumul Asset Management.
Institute of National Affairs, Business Council of PNG, PNG Chamber of Mines & Petroleum, Oil Search Health Foundation.
30. relaTed ParTy TransaCTions (continued)
interests register The following are transactions recorded in the interests register:
NOTES TO THE FINANCIAL STATEMENTS
Bank of South Pacific Ltd, Tipi Enterprise Ltd, Telemu Ltd1, Kina Petroleum Ltd, National Petroleum Company Ltd, Savi- Tec Ltd.
Telstra Ltd, Nautilus Minerals Niugini Ltd.
Barrick Gold Ltd.
Divine Word University.
for the Year Ended 31 December 2013
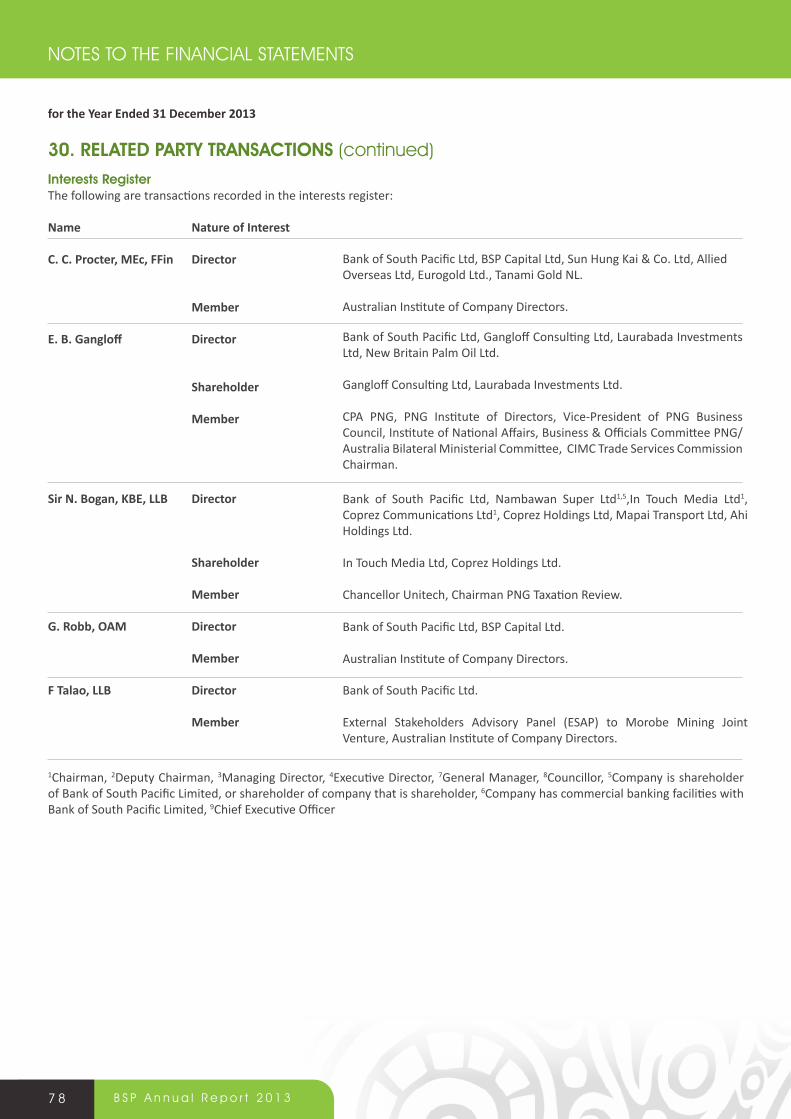
7 8 B S P A n n u a l R e p o r t 2 0 1 3
name nature of interest
C. C. Procter, mEc, FFin Director Member
E. B. Gangloff Director shareholder Member
sir n. Bogan, KBE, llB Director
shareholder
Member
G. Robb, OAM Director Member
F talao, llB Director Member
for the Year Ended 31 December 2013
Bank of South Pacific Ltd, BSP Capital Ltd, Sun Hung Kai & Co. Ltd, Allied Overseas Ltd, Eurogold Ltd., Tanami Gold NL.
Australian Institute of Company Directors.
Bank of South Pacific Ltd, Gangloff Consulting Ltd, Laurabada Investments Ltd, New Britain Palm Oil Ltd.
Gangloff Consulting Ltd, Laurabada Investments Ltd.
CPA PNG, PNG Institute of Directors, Vice-President of PNG Business Council, Institute of National Affairs, Business & Officials Committee PNG/Australia Bilateral Ministerial Committee, CIMC Trade Services Commission Chairman.
30. relaTed ParTy TransaCTions (continued)
Bank of South Pacific Ltd, Nambawan Super Ltd1,5,In Touch Media Ltd1, Coprez Communications Ltd1, Coprez Holdings Ltd, Mapai Transport Ltd, Ahi Holdings Ltd.
In Touch Media Ltd, Coprez Holdings Ltd.
Chancellor Unitech, Chairman PNG Taxation Review.
1Chairman, 2Deputy Chairman, 3Managing Director, 4Executive Director, 7General Manager, 8Councillor, 5Company is shareholder of Bank of South Pacific Limited, or shareholder of company that is shareholder, 6Company has commercial banking facilities with Bank of South Pacific Limited, 9Chief Executive Officer
Bank of South Pacific Ltd, BSP Capital Ltd.
Australian Institute of Company Directors.
Bank of South Pacific Ltd.
External Stakeholders Advisory Panel (ESAP) to Morobe Mining Joint Venture, Australian Institute of Company Directors.
interests registerThe following are transactions recorded in the interests register:
NOTES TO THE FINANCIAL STATEMENTS
7 9B S P A n n u a l R e p o r t 2 0 1 3
31. BanK oPeraTions, risKs & sTraTegies in using FinanCial insTruMenTs
All business operations must deal with a variety of operational and financial risks. The business activities of a bank expose it to very critical and specific risks, which are principally related to the Bank and the Group’s primary financial intermediary role in the financial markets, including the use of financial instruments such as derivatives. These market risks (risk of an adverse event in the financial markets that may result in loss of earnings) include liquidity risk, foreign exchange risk, interest rate risk and credit risk.
The Bank and the Group accepts deposits from customers at both fixed and floating rates and for various periods and seeks to earn above average interest margins by investing these funds in high quality assets. These margins are achieved and increased by consolidating short-term funds and lending for longer periods at higher rates whilst maintaining sufficient liquidity to meet all claims that might fall due.
The Bank and the Group also seeks to optimise its interest margins by obtaining above average returns, net of provisions, through lending to commercial and retail borrowers with a range of credit standings. In addition to directly advancing funds to borrowers, the Bank and the Group also enters into guarantees and other commitments such as letters of credit, performance bonds, and other bonds.
The Bank and the Group also enters into transactions denominated in foreign currencies. This activity generally requires the Bank and the Group to take foreign currency positions in order to exploit short term movements in the foreign currency market. The Board places limits on the size of these positions. The Bank and the Group also has a policy of using offsetting commitments for foreign exchange contracts, effectively minimising the risk of loss due to adverse movements in foreign currencies.
Risk in the Bank and the Group is managed through a system of delegated limits. These limits set the maximum level of risk that can be assumed by each operational unit and the Bank and the Group as a whole. The limits are delegated from the Board of Directors to executive management and hence to the respective operational managers. The risk management framework establishes roles, responsibilities and accountabilities of the Asset and Liability Committee, the Credit Committee, the Operational Risk Committee and the Executive Committee, the specific management committees charged with the responsibility for ensuring the Bank and the Group has appropriate systems, policies and procedures to measure, monitor and report on risk management. The framework also includes policies and procedures which detail formal feedback processes to these management committees, to the Audit, Risk and Compliance Committee of the Board, and ultimately to the Board of Directors.
32. CaPiTal adeQuaCy The Bank and the Group is required to comply with various prudential standards issued by the Bank of Papua New Guinea (BPNG), the official authority for the prudential supervision of banks and similar financial institutions in Papua New Guinea. One of the most critical prudential standards is the capital adequacy requirement. All banks are required to maintain at least the minimum acceptable measure of capital to risk-weighted assets to absorb potential losses. The BPNG follows the prudential guidelines set by the Bank of International Settlements under the terms of the Basel Accord. The BPNG revised prudential standard 1/2003, Capital Adequacy, prescribes ranges of overall capital ratios to measure whether a bank is under, adequately, or well capitalised, and also applies the leverage capital ratio. The Bank and the Group complies with the prevailing prudential requirements for total capital and leverage capital. As at 31 December 2013, the Bank and the Group’s total capital adequacy ratio and leverage capital ratio satisfied the capital adequacy criteria for well-capitalised. The minimum capital adequacy requirements as set out under the standard are: Tier 1 8 percent, total risk based capital ratio 12 percent and the leverage ratio 6 percent.
The measure of capital used for the purposes of prudential supervision is referred to as base capital. Total base capital varies from the balance of capital shown on the statement of financial position and is made up of tier 1 capital (core) and tier 2 capital (supplementary). Tier 1 capital is obtained by deducting from equity capital and audited retained earnings (or losses), intangible assets including deferred tax assets.
for the Year Ended 31 December 2013
30. relaTed ParTy TransaCTions (continued)
NOTES TO THE FINANCIAL STATEMENTS
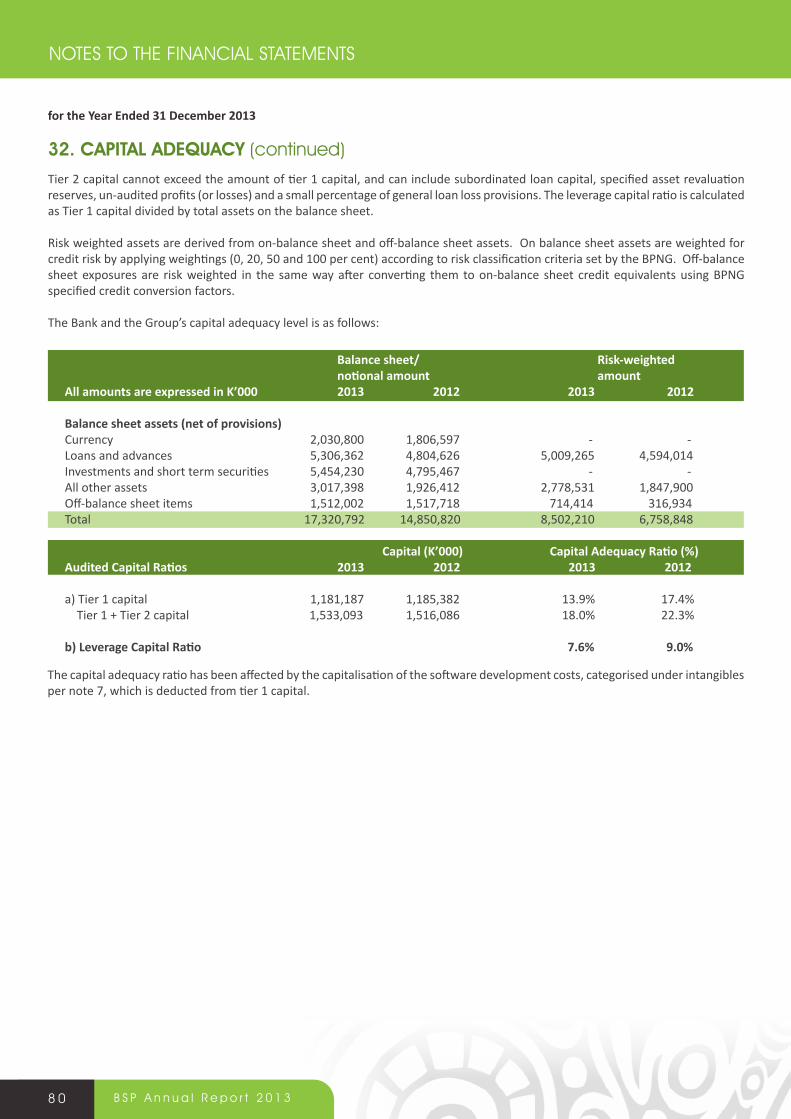
8 0 B S P A n n u a l R e p o r t 2 0 1 3
NOTES TO THE FINANCIAL STATEMENTS
Tier 2 capital cannot exceed the amount of tier 1 capital, and can include subordinated loan capital, specified asset revaluation reserves, un-audited profits (or losses) and a small percentage of general loan loss provisions. The leverage capital ratio is calculated as Tier 1 capital divided by total assets on the balance sheet.
Risk weighted assets are derived from on-balance sheet and off-balance sheet assets. On balance sheet assets are weighted for credit risk by applying weightings (0, 20, 50 and 100 per cent) according to risk classification criteria set by the BPNG. Off-balance sheet exposures are risk weighted in the same way after converting them to on-balance sheet credit equivalents using BPNG specified credit conversion factors.
The Bank and the Group’s capital adequacy level is as follows:
32. CaPiTal adeQuaCy (continued)
Balance sheet/ Risk-weighted notional amount amountAll amounts are expressed in K’000 2013 2012 2013 2012
Balance sheet assets (net of provisions) Currency 2,030,800 1,806,597 - -Loans and advances 5,306,362 4,804,626 5,009,265 4,594,014Investments and short term securities 5,454,230 4,795,467 - -All other assets 3,017,398 1,926,412 2,778,531 1,847,900Off-balance sheet items 1,512,002 1,517,718 714,414 316,934Total 17,320,792 14,850,820 8,502,210 6,758,848
Capital (K’000) Capital Adequacy Ratio (%)Audited Capital Ratios 2013 2012 2013 2012
a) Tier 1 capital 1,181,187 1,185,382 13.9% 17.4% Tier 1 + Tier 2 capital 1,533,093 1,516,086 18.0% 22.3%
b) Leverage Capital Ratio 7.6% 9.0%
for the Year Ended 31 December 2013
The capital adequacy ratio has been affected by the capitalisation of the software development costs, categorised under intangibles per note 7, which is deducted from tier 1 capital.

8 1B S P A n n u a l R e p o r t 2 0 1 3
33. CrediT risK and asseT QualiTy
for the Year Ended 31 December 2013
NOTES TO THE FINANCIAL STATEMENTS
The Bank incurs risk with regards to loans and advances made to customers and other monies or investments held with financial institutions. Credit risk is the likelihood of future financial loss resulting from the failure of clients or counter-parties to meet contractual obligations to the Bank and the Group as they fall due.
Credit risk is managed by analysing the risk spread across various sectors of the economy and by ensuring risk is diversely spread by personal and commercial customer. Individual exposures are measured using repayment performance, reviews and statistical techniques. Comprehensive credit standards and approval limits have been formulated and approved by the Credit Committee. The Credit Committee (which reports to the Board through the Executive and Chief Executive Officer) is responsible for the development and implementation of credit policy and loan portfolio review methodology. The Credit Committee is the final arbiter of risk management and loan risk concentration.
As indicated in Accounting Policy G – Loans and provision for loan impairment, the Bank and the Group has in place processes that identify, assess and control credit risk in relation to the loan portfolio, to assist in determining the appropriateness of provisions for loan impairment. These processes also enable assessments to be made of other classes of assets that may carry an element of credit risk. The Bank and the Group assigns quality indicators to its credit exposures to determine the asset quality profile.
Large credit exposures are also monitored as part of credit risk management. These are classified as the largest 25 individual accounts or groups of related counter-parties. As at 31 December 2013, the 25 largest exposures totalled K3.2 billion, accounting for over 60 percent of the Bank and 60 percent of the Group’s total loan portfolio (2012: K2.815 billion, accounting for over 56 percent and 56 percent respectively).
The Bank of Papua New Guinea has maintained a revised prudential standard for asset quality since October 2003. The revised standard specifies more detailed criteria for the classification of loans into various grades of default risk and corresponding loss provision levels as a consequence of those gradings. Since its introduction, the Bank and the Group has complied with the requirement at all times.
Credit related commitments
These instruments are used to ensure that funds are available to a customer as required. The Bank and the Group deals principally in the credit related commitments set out below.
Guarantees and standby letters of credit, which represent irrevocable assurances that the Bank and the Group will make payments in the event that a customer cannot meet its obligations to third parties, carry the same risk as loans. Documentary and trade letters of credit are written undertakings by the Bank and the Group on behalf of a customer, authorising a third party to draw drafts on the Bank and the Group for specified amounts under specified terms and conditions. They are collateralised by the underlying shipments of goods to which they relate and therefore carry less risk than a conventional loan.
Commitments to extend credit represent undrawn portions of authorisations to extend credit in the form of loans, guarantees or letters of credit. Whilst the potential exposure to loss equates to the total undrawn commitments, the likely amount of loss is less than the total commitment since the commitments to extend credit are contingent upon customers maintaining specific credit standards. The Bank and the Group monitors the term to maturity of these commitments because longer term commitments generally carry a greater degree of credit risk than shorter term commitments.
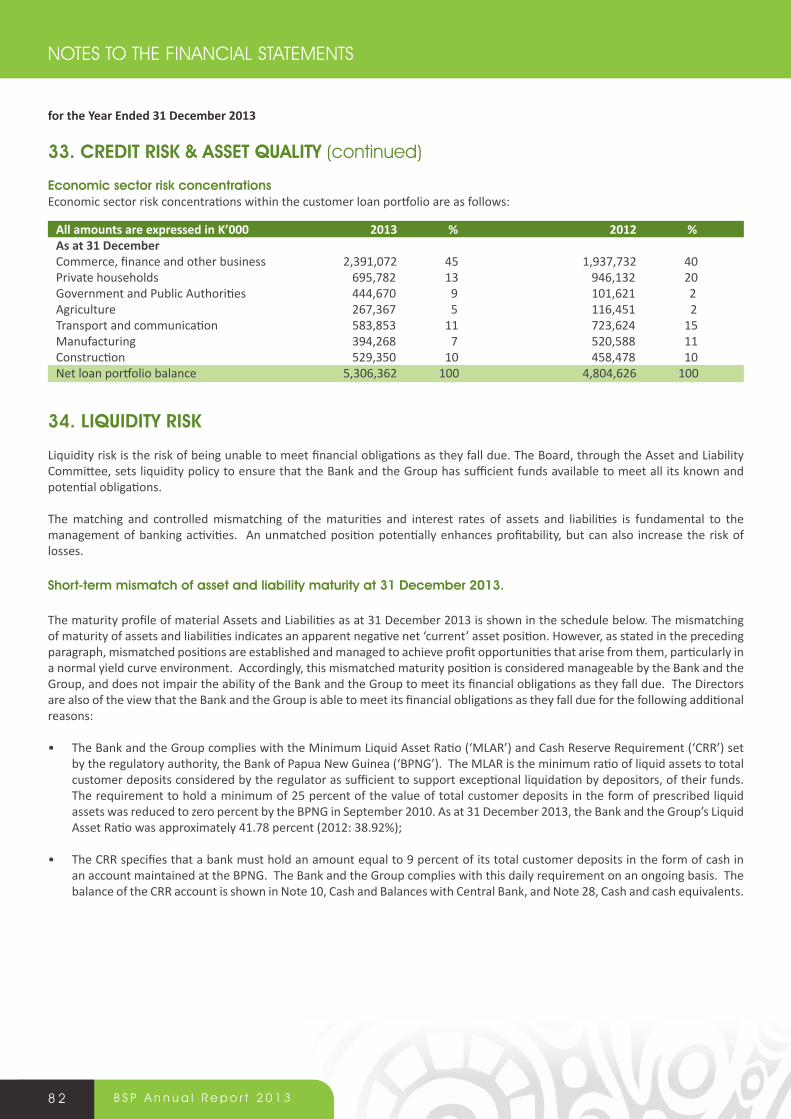
8 2 B S P A n n u a l R e p o r t 2 0 1 3
for the Year Ended 31 December 2013
33. CrediT risK & asseT QualiTy (continued)
economic sector risk concentrationsEconomic sector risk concentrations within the customer loan portfolio are as follows:
All amounts are expressed in K’000 2013 % 2012 %As at 31 December Commerce, finance and other business 2,391,072 45 1,937,732 40Private households 695,782 13 946,132 20Government and Public Authorities 444,670 9 101,621 2Agriculture 267,367 5 116,451 2Transport and communication 583,853 11 723,624 15Manufacturing 394,268 7 520,588 11Construction 529,350 10 458,478 10Net loan portfolio balance 5,306,362 100 4,804,626 100
34. liQuidiTy risK
Liquidity risk is the risk of being unable to meet financial obligations as they fall due. The Board, through the Asset and Liability Committee, sets liquidity policy to ensure that the Bank and the Group has sufficient funds available to meet all its known and potential obligations.
The matching and controlled mismatching of the maturities and interest rates of assets and liabilities is fundamental to the management of banking activities. An unmatched position potentially enhances profitability, but can also increase the risk of losses.
short-term mismatch of asset and liability maturity at 31 december 2013.
The maturity profile of material Assets and Liabilities as at 31 December 2013 is shown in the schedule below. The mismatching of maturity of assets and liabilities indicates an apparent negative net ‘current’ asset position. However, as stated in the preceding paragraph, mismatched positions are established and managed to achieve profit opportunities that arise from them, particularly in a normal yield curve environment. Accordingly, this mismatched maturity position is considered manageable by the Bank and the Group, and does not impair the ability of the Bank and the Group to meet its financial obligations as they fall due. The Directors are also of the view that the Bank and the Group is able to meet its financial obligations as they fall due for the following additional reasons:
• The Bank and the Group complies with the Minimum Liquid Asset Ratio (‘MLAR’) and Cash Reserve Requirement (‘CRR’) set by the regulatory authority, the Bank of Papua New Guinea (‘BPNG’). The MLAR is the minimum ratio of liquid assets to total customer deposits considered by the regulator as sufficient to support exceptional liquidation by depositors, of their funds. The requirement to hold a minimum of 25 percent of the value of total customer deposits in the form of prescribed liquid assets was reduced to zero percent by the BPNG in September 2010. As at 31 December 2013, the Bank and the Group’s Liquid Asset Ratio was approximately 41.78 percent (2012: 38.92%);
• The CRR specifies that a bank must hold an amount equal to 9 percent of its total customer deposits in the form of cash in an account maintained at the BPNG. The Bank and the Group complies with this daily requirement on an ongoing basis. The balance of the CRR account is shown in Note 10, Cash and Balances with Central Bank, and Note 28, Cash and cash equivalents.
NOTES TO THE FINANCIAL STATEMENTS
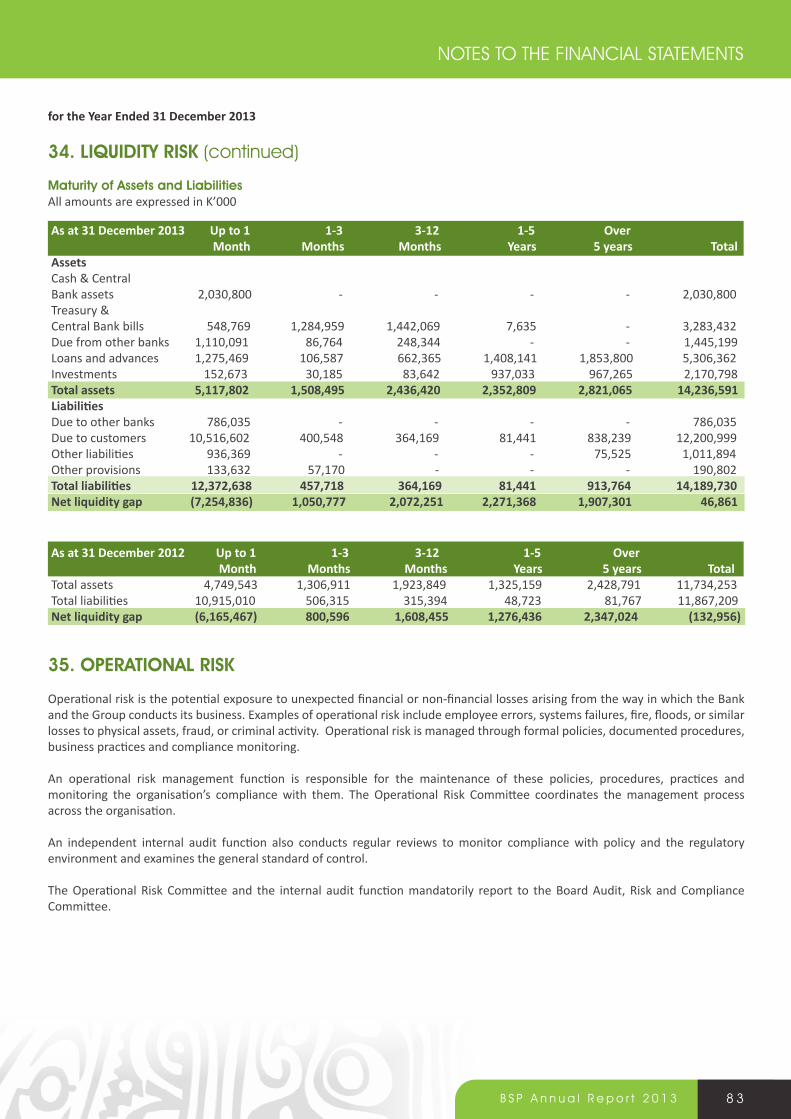
8 3B S P A n n u a l R e p o r t 2 0 1 3
for the Year Ended 31 December 2013
34. liQuidiTy risK (continued)
Maturity of assets and liabilities All amounts are expressed in K’000
As at 31 December 2013 Up to 1 1-3 3-12 1-5 Over month months months years 5 years totalassets Cash & Central Bank assets 2,030,800 - - - - 2,030,800Treasury & Central Bank bills 548,769 1,284,959 1,442,069 7,635 - 3,283,432Due from other banks 1,110,091 86,764 248,344 - - 1,445,199Loans and advances 1,275,469 106,587 662,365 1,408,141 1,853,800 5,306,362Investments 152,673 30,185 83,642 937,033 967,265 2,170,798total assets 5,117,802 1,508,495 2,436,420 2,352,809 2,821,065 14,236,591Liabilities Due to other banks 786,035 - - - - 786,035Due to customers 10,516,602 400,548 364,169 81,441 838,239 12,200,999Other liabilities 936,369 - - - 75,525 1,011,894Other provisions 133,632 57,170 - - - 190,802Total liabilities 12,372,638 457,718 364,169 81,441 913,764 14,189,730Net liquidity gap (7,254,836) 1,050,777 2,072,251 2,271,368 1,907,301 46,861
As at 31 December 2012 Up to 1 1-3 3-12 1-5 Over month months months years 5 years totalTotal assets 4,749,543 1,306,911 1,923,849 1,325,159 2,428,791 11,734,253Total liabilities 10,915,010 506,315 315,394 48,723 81,767 11,867,209Net liquidity gap (6,165,467) 800,596 1,608,455 1,276,436 2,347,024 (132,956)
35. oPeraTional risK Operational risk is the potential exposure to unexpected financial or non-financial losses arising from the way in which the Bank and the Group conducts its business. Examples of operational risk include employee errors, systems failures, fire, floods, or similar losses to physical assets, fraud, or criminal activity. Operational risk is managed through formal policies, documented procedures, business practices and compliance monitoring. An operational risk management function is responsible for the maintenance of these policies, procedures, practices and monitoring the organisation’s compliance with them. The Operational Risk Committee coordinates the management process across the organisation.
An independent internal audit function also conducts regular reviews to monitor compliance with policy and the regulatory environment and examines the general standard of control.
The Operational Risk Committee and the internal audit function mandatorily report to the Board Audit, Risk and Compliance Committee.
NOTES TO THE FINANCIAL STATEMENTS
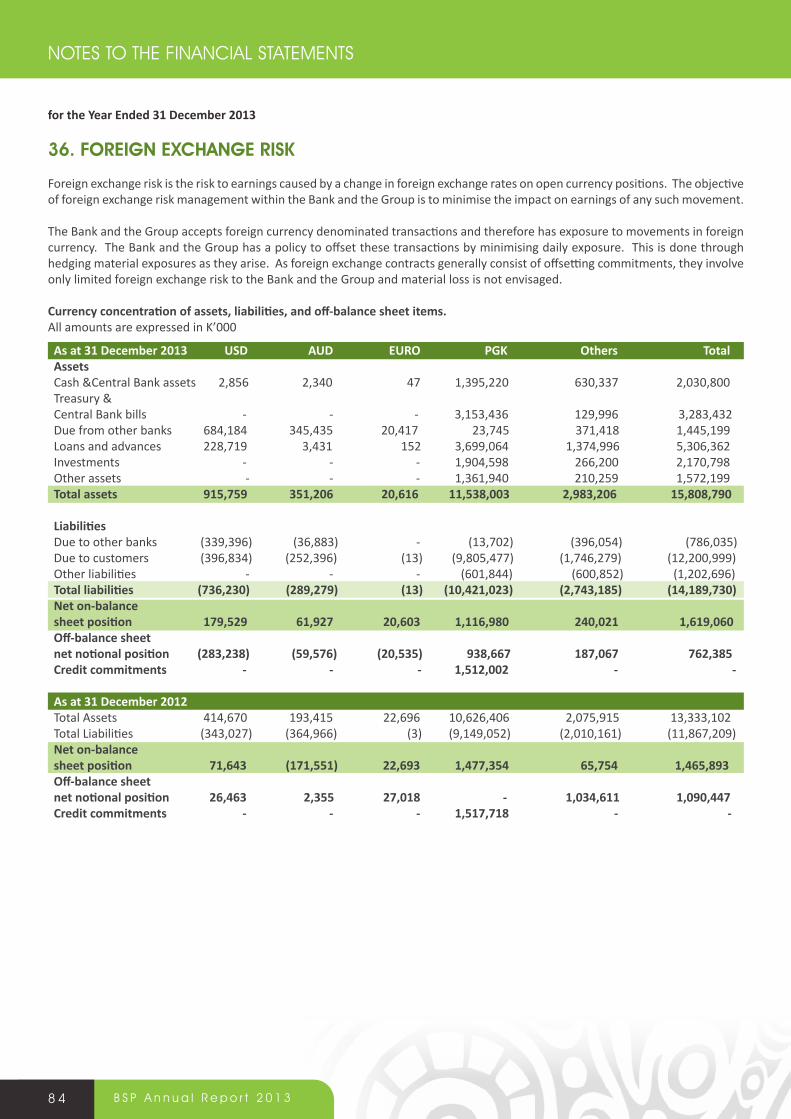
8 4 B S P A n n u a l R e p o r t 2 0 1 3
36. Foreign eXChange risK Foreign exchange risk is the risk to earnings caused by a change in foreign exchange rates on open currency positions. The objective of foreign exchange risk management within the Bank and the Group is to minimise the impact on earnings of any such movement.
The Bank and the Group accepts foreign currency denominated transactions and therefore has exposure to movements in foreign currency. The Bank and the Group has a policy to offset these transactions by minimising daily exposure. This is done through hedging material exposures as they arise. As foreign exchange contracts generally consist of offsetting commitments, they involve only limited foreign exchange risk to the Bank and the Group and material loss is not envisaged.
Currency concentration of assets, liabilities, and off-balance sheet items. All amounts are expressed in K’000
As at 31 December 2013 USD AUD EURO PGK Others Totalassets Cash &Central Bank assets 2,856 2,340 47 1,395,220 630,337 2,030,800Treasury & Central Bank bills - - - 3,153,436 129,996 3,283,432Due from other banks 684,184 345,435 20,417 23,745 371,418 1,445,199Loans and advances 228,719 3,431 152 3,699,064 1,374,996 5,306,362Investments - - - 1,904,598 266,200 2,170,798Other assets - - - 1,361,940 210,259 1,572,199total assets 915,759 351,206 20,616 11,538,003 2,983,206 15,808,790
Liabilities Due to other banks (339,396) (36,883) - (13,702) (396,054) (786,035)Due to customers (396,834) (252,396) (13) (9,805,477) (1,746,279) (12,200,999)Other liabilities - - - (601,844) (600,852) (1,202,696)Total liabilities (736,230) (289,279) (13) (10,421,023) (2,743,185) (14,189,730)Net on-balance sheet position 179,529 61,927 20,603 1,116,980 240,021 1,619,060Off-balance sheet net notional position (283,238) (59,576) (20,535) 938,667 187,067 762,385Credit commitments - - - 1,512,002 - -
As at 31 December 2012Total Assets 414,670 193,415 22,696 10,626,406 2,075,915 13,333,102Total Liabilities (343,027) (364,966) (3) (9,149,052) (2,010,161) (11,867,209)Net on-balance sheet position 71,643 (171,551) 22,693 1,477,354 65,754 1,465,893Off-balance sheet net notional position 26,463 2,355 27,018 - 1,034,611 1,090,447Credit commitments - - - 1,517,718 - -
for the Year Ended 31 December 2013
NOTES TO THE FINANCIAL STATEMENTS

BsP Group Ceo robin fleming (third from left), the BsP team and sVs during the signing of the agreement for the supa V stoa.
8 5B S P A n n u a l R e p o r t 2 0 1 3
37. inTeresT raTe risK Interest rate risk in the balance sheet arises from the potential for a change in interest rate to have an adverse effect on the revenue earnings in the current reporting period and future years. As interest rates and yield curves change over time the Bank and the Group may be exposed to a loss in earnings due to the effects of interest rates on the structure of the balance sheet. Sensitivity to interest rates arises from mismatches in the re-pricing dates, cash flows and other characteristics of the assets and their corresponding liability funding. These mismatches are actively managed as part of the overall interest rate risk management process governed by the Assets and Liabilities Committee (ALCO), which meets regularly to review the effects of fluctuations in the prevailing levels of market interest rates on the financial position and cash flows of the Bank and the Group. The objective of interest rate risk control is to minimise these fluctuations in value and net interest income over time, providing secure and stable sustainable net interest earnings in the long term. The table below illustrates the interest sensitivity of assets and liabilities at the balance date. Given the profile of assets and liabilities as at 31 December 2013 and prevailing rates of interest, a 1% increase in rates will result in a K15.3 million increase in net interest income, whilst a 1% decrease in rates will result in a K45.2 million decrease in net interest income.
for the Year Ended 31 December 2013
NOTES TO THE FINANCIAL STATEMENTS
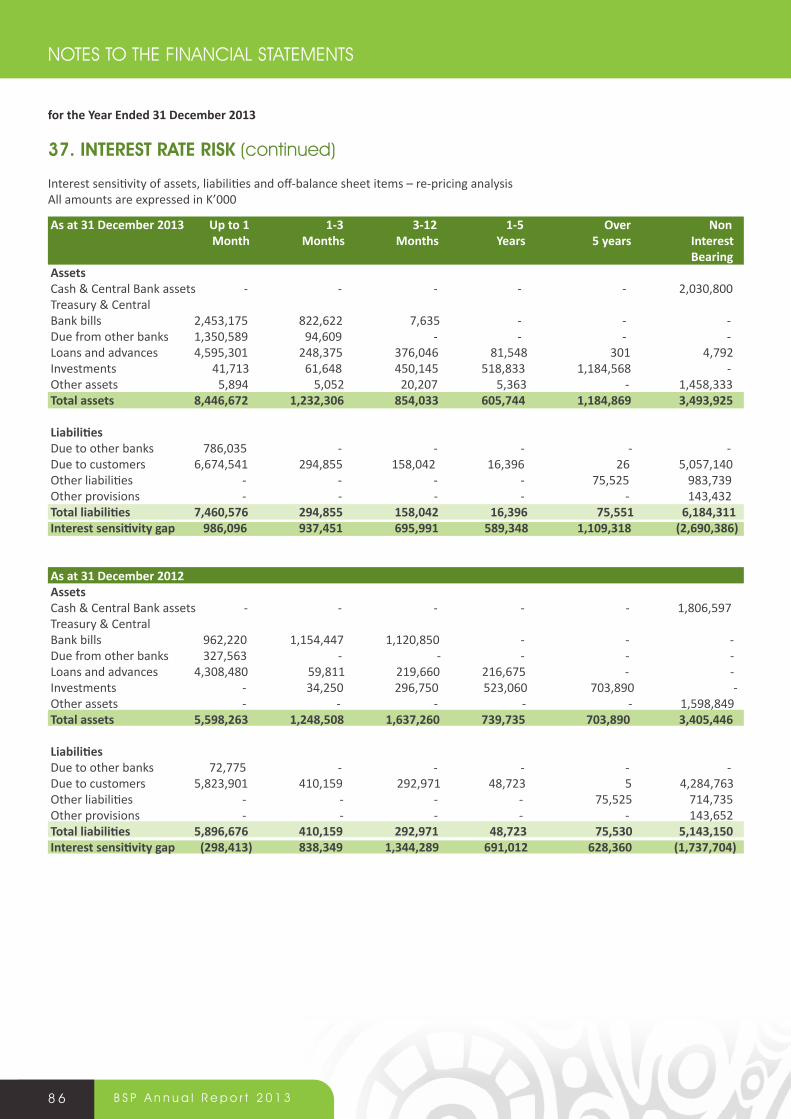
8 6 B S P A n n u a l R e p o r t 2 0 1 3
37. inTeresT raTe risK (continued) Interest sensitivity of assets, liabilities and off-balance sheet items – re-pricing analysisAll amounts are expressed in K’000
for the Year Ended 31 December 2013
NOTES TO THE FINANCIAL STATEMENTS
As at 31 December 2013 Up to 1 1-3 3-12 1-5 Over Non month months months years 5 years interest Bearingassets Cash & Central Bank assets - - - - - 2,030,800Treasury & Central Bank bills 2,453,175 822,622 7,635 - - -Due from other banks 1,350,589 94,609 - - - -Loans and advances 4,595,301 248,375 376,046 81,548 301 4,792Investments 41,713 61,648 450,145 518,833 1,184,568 -Other assets 5,894 5,052 20,207 5,363 - 1,458,333total assets 8,446,672 1,232,306 854,033 605,744 1,184,869 3,493,925
Liabilities Due to other banks 786,035 - - - - -Due to customers 6,674,541 294,855 158,042 16,396 26 5,057,140Other liabilities - - - - 75,525 983,739Other provisions - - - - - 143,432Total liabilities 7,460,576 294,855 158,042 16,396 75,551 6,184,311Interest sensitivity gap 986,096 937,451 695,991 589,348 1,109,318 (2,690,386)
As at 31 December 2012assets Cash & Central Bank assets - - - - - 1,806,597Treasury & Central Bank bills 962,220 1,154,447 1,120,850 - - -Due from other banks 327,563 - - - - -Loans and advances 4,308,480 59,811 219,660 216,675 - -Investments - 34,250 296,750 523,060 703,890 -Other assets - - - - - 1,598,849total assets 5,598,263 1,248,508 1,637,260 739,735 703,890 3,405,446
Liabilities Due to other banks 72,775 - - - - -Due to customers 5,823,901 410,159 292,971 48,723 5 4,284,763Other liabilities - - - - 75,525 714,735Other provisions - - - - - 143,652Total liabilities 5,896,676 410,159 292,971 48,723 75,530 5,143,150 Interest sensitivity gap (298,413) 838,349 1,344,289 691,012 628,360 (1,737,704)
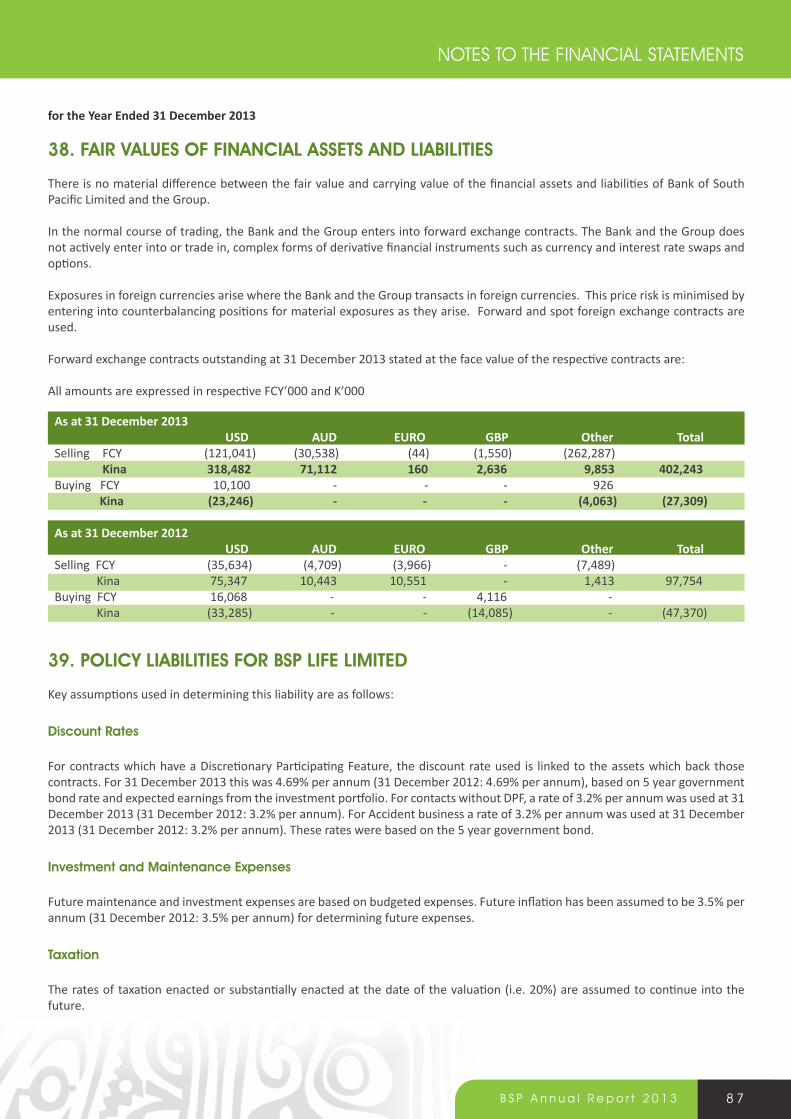
8 7B S P A n n u a l R e p o r t 2 0 1 3
for the Year Ended 31 December 2013
38. Fair Values oF FinanCial asseTs and liaBiliTies
There is no material difference between the fair value and carrying value of the financial assets and liabilities of Bank of South Pacific Limited and the Group.
In the normal course of trading, the Bank and the Group enters into forward exchange contracts. The Bank and the Group does not actively enter into or trade in, complex forms of derivative financial instruments such as currency and interest rate swaps and options.
Exposures in foreign currencies arise where the Bank and the Group transacts in foreign currencies. This price risk is minimised by entering into counterbalancing positions for material exposures as they arise. Forward and spot foreign exchange contracts are used.
Forward exchange contracts outstanding at 31 December 2013 stated at the face value of the respective contracts are:
All amounts are expressed in respective FCY’000 and K’000
39. PoliCy liaBiliTies For BsP liFe liMiTed
Key assumptions used in determining this liability are as follows:
discount rates
For contracts which have a Discretionary Participating Feature, the discount rate used is linked to the assets which back those contracts. For 31 December 2013 this was 4.69% per annum (31 December 2012: 4.69% per annum), based on 5 year government bond rate and expected earnings from the investment portfolio. For contacts without DPF, a rate of 3.2% per annum was used at 31 December 2013 (31 December 2012: 3.2% per annum). For Accident business a rate of 3.2% per annum was used at 31 December 2013 (31 December 2012: 3.2% per annum). These rates were based on the 5 year government bond.
investment and Maintenance expenses
Future maintenance and investment expenses are based on budgeted expenses. Future inflation has been assumed to be 3.5% per annum (31 December 2012: 3.5% per annum) for determining future expenses.
Taxation
The rates of taxation enacted or substantially enacted at the date of the valuation (i.e. 20%) are assumed to continue into the future.
As at 31 December 2013 usD auD Euro gBP other totalSelling FCY (121,041) (30,538) (44) (1,550) (262,287) Kina 318,482 71,112 160 2,636 9,853 402,243Buying FCY 10,100 - - - 926 Kina (23,246) - - - (4,063) (27,309)
As at 31 December 2012 usD auD Euro gBP other totalSelling FCY (35,634) (4,709) (3,966) - (7,489) Kina 75,347 10,443 10,551 - 1,413 97,754Buying FCY 16,068 - - 4,116 - Kina (33,285) - - (14,085) - (47,370)
NOTES TO THE FINANCIAL STATEMENTS
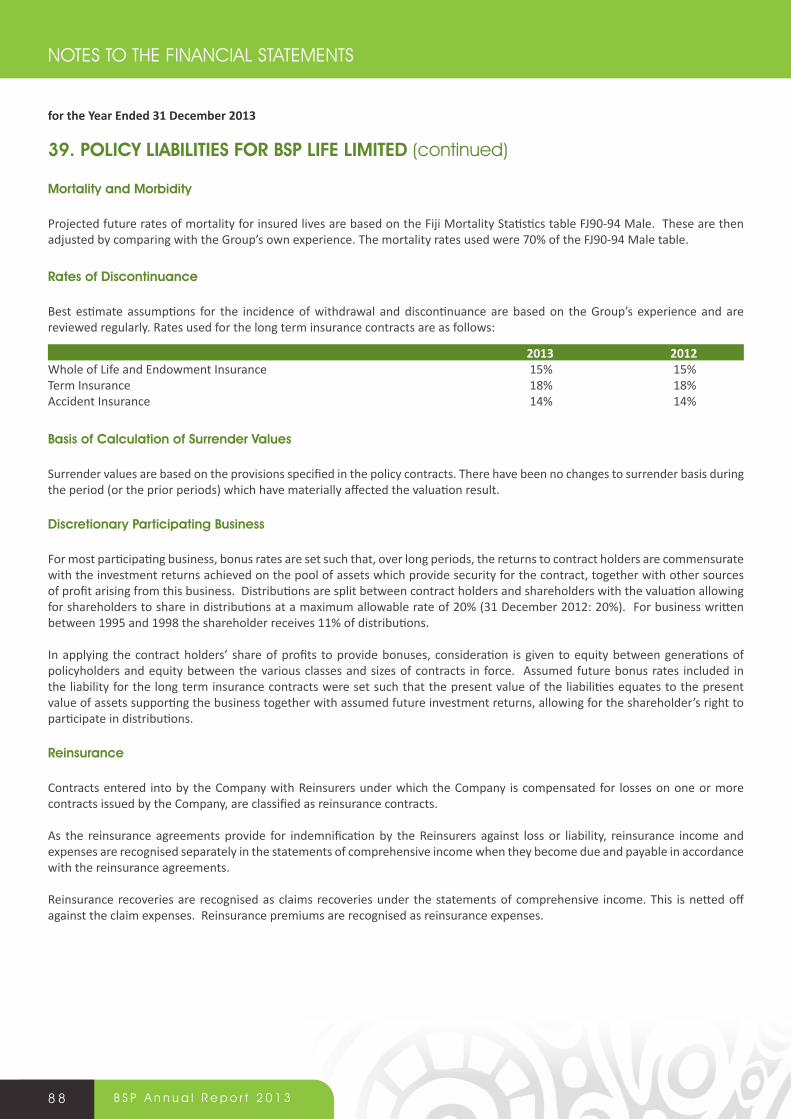
8 8 B S P A n n u a l R e p o r t 2 0 1 3
for the Year Ended 31 December 2013
39. PoliCy liaBiliTies For BsP liFe liMiTed (continued)
Mortality and Morbidity
Projected future rates of mortality for insured lives are based on the Fiji Mortality Statistics table FJ90-94 Male. These are then adjusted by comparing with the Group’s own experience. The mortality rates used were 70% of the FJ90-94 Male table.
rates of discontinuance
Best estimate assumptions for the incidence of withdrawal and discontinuance are based on the Group’s experience and are reviewed regularly. Rates used for the long term insurance contracts are as follows:
Basis of Calculation of surrender Values
Surrender values are based on the provisions specified in the policy contracts. There have been no changes to surrender basis during the period (or the prior periods) which have materially affected the valuation result.
discretionary Participating Business
For most participating business, bonus rates are set such that, over long periods, the returns to contract holders are commensurate with the investment returns achieved on the pool of assets which provide security for the contract, together with other sources of profit arising from this business. Distributions are split between contract holders and shareholders with the valuation allowing for shareholders to share in distributions at a maximum allowable rate of 20% (31 December 2012: 20%). For business written between 1995 and 1998 the shareholder receives 11% of distributions.
In applying the contract holders’ share of profits to provide bonuses, consideration is given to equity between generations of policyholders and equity between the various classes and sizes of contracts in force. Assumed future bonus rates included in the liability for the long term insurance contracts were set such that the present value of the liabilities equates to the present value of assets supporting the business together with assumed future investment returns, allowing for the shareholder’s right to participate in distributions.
reinsurance
Contracts entered into by the Company with Reinsurers under which the Company is compensated for losses on one or more contracts issued by the Company, are classified as reinsurance contracts.
As the reinsurance agreements provide for indemnification by the Reinsurers against loss or liability, reinsurance income and expenses are recognised separately in the statements of comprehensive income when they become due and payable in accordance with the reinsurance agreements.
Reinsurance recoveries are recognised as claims recoveries under the statements of comprehensive income. This is netted off against the claim expenses. Reinsurance premiums are recognised as reinsurance expenses.
2013 2012Whole of Life and Endowment Insurance 15% 15%Term Insurance 18% 18%Accident Insurance 14% 14%
NOTES TO THE FINANCIAL STATEMENTS

official opening of the BsP sub Branch in Komo.
8 9B S P A n n u a l R e p o r t 2 0 1 3
41. reMuneraTion oF audiTors
grouP BanKAll amounts are expressed in K’000 2013 2012 2013 2012Financial Statements audits 2,707 2,496 2,110 1,423Other Services 4,413 8,731 4,413 8,731Balance at 31 December 7,120 11,227 6,523 10,154
The external auditor Deloitte Touche Tohmatsu is also engaged in providing other services to the Bank and Group as required. The provision of other services included secondment of staff to BSP Capital Limited, due diligence and board strategy planning.
for the Year Ended 31 December 2013
40. eVenTs oCCurring aFTer BalanCe sheeT daTe
No matters or circumstances have arisen since the end of the financial year which significantly affected or may significantly affect the operations of the Bank and the Group, the results of these operations, or the state of affairs of the Bank and the Group in future financial years.
NOTES TO THE FINANCIAL STATEMENTS

9 0 B S P A n n u a l R e p o r t 2 0 1 3
independent audit opinion to the members of Bank of south Pacific limited and subsidiaries
We have audited the accompanying consolidated financial report of Bank of South Pacific Limited and subsidiaries which comprise the consolidated statement of financial position as at 31 December 2013, the consolidated statement of comprehensive income, consolidated statement of changes in equity and the consolidated statement of cash flow for the year then ended, and a summary of significant accounting policies, other explanatory information and the directors’ declaration.
director’s responsibility for the Consolidated Financial statements
Directors are responsible for the preparation of the consolidated financial statements that give a true and fair view in accordance with the Companies Act 1997 and International Financial Reporting Standards, and for such internal control as management determines is necessary to enable the preparation of consolidated financial statements that are free from material misstatement, whether due to fraud or error.
auditor’s responsibility
Our responsibility is to express an opinion on these consolidated financial statements based on our audit. We conducted our audit in accordance with International Standards on Auditing. Those standards require that we comply with ethical requirements and plan and perform the audit to obtain reasonable assurance about whether the consolidated financial statements are free from material misstatement.
An audit involves performing procedures to obtain audit evidence about the amounts and disclosures in the consolidated financial statements. The procedures selected depend on the auditor’s judgment, including the assessment of the risks of material misstatement of the consolidated financial statements, whether due to fraud or error. In making those risk assessments, the auditor considers internal control relevant to the entity’s preparation of consolidated financial statements that give a true and fair view in order to design audit procedures that are appropriate in the circumstances, but not for the purpose of expressing an opinion on the effectiveness of the entity’s internal control. An audit also includes evaluating the appropriateness of accounting policies used and the reasonableness of accounting estimates made by management, as well as evaluating the overall presentation of the consolidated financial statements.
We believe that the audit evidence we have obtained is sufficient and appropriate to provide a basis for our audit opinion.
audit opinion
opinion
In our opinion, the financial statements give a true and fair view of the financial position of Bank of South Pacific Limited and subsidiaries as at 31 December 2013, and of its financial performance and its cash flows for the year then ended in accordance with International Financial Reporting Standards.
report on other legal and regulatory requirements
The financial report of the Bank of South Pacific Limited and subsidiaries is in accordance with the Companies Act 1997 and proper accounting records have been kept. Bank of South Pacific Limited and subsidiaries are in compliance with the Banking and Financial Institutions Act 2000 and other applicable acts and regulations.
During the year ended 31 December 2013 we also provided Bank of South Pacific Limited with tax and consulting services.
DEloittE touChE tohmatsu
Suzaan TheronRegistered under the Accountants Act 1996Partner, Chartered Accountants Port Moresby, 21st day of March 2014.
Deloitte Touche Tohmatsu
Deloitte Tower, Level 12Douglas Street, Port MoresbyPO Box 1275 Port MoresbyNational Capital DistrictPapua New Guinea
Tel: +675 308 7000Fax: +675 308 7001www.deloitte.com/pg

9 1B S P A n n u a l R e p o r t 2 0 1 3
reaCHiNG THe uNreaCHeD
strategically BsP has over the past 5 years
positioned itself to optimise its capacity to meet the growing
demands of a broad client base across a diverse geography.
This transformation has involved significant capital expenditure in our
properties, information technology systems and infrastructure, as well as our
products and channels.

9 2 B S P A n n u a l R e p o r t 2 0 1 3
The following is a summary of pertinent issues relating to a shareholding in the Group. The Constitution of BSP may be inspected during normal business at the Registered Office.
righTs aTTaChing To ordinary shares
The rights attaching to shares are set out in Bank of South Pacific Limited’s Constitution and in certain circumstances, are regulated by the Companies Act 1997, the POMSoX Listing Rules and general law. There is only one class of share. All shares have equal rights. Other rights attached to ordinary shares include:
(a) general meeting and notices
Each member is entitled to receive notice of, and to attend and vote at, general meetings of BSP and to receive all notices, accounts and other documents required to be sent to members under BSP’s constitution, the Companies Act or the Listing Rules.
(b) Voting rights
At a general meeting of shareholders, every holder of fully paid ordinary shares present in person or by an attorney, representative or proxy has one vote on a show of hands (unless a member has appointed two proxies) and one vote per share on a poll. A person who holds a share which is not fully paid is entitled, on a poll, to a fraction of a vote equal to the proportion which the amount paid bears to the total issue price of the share. Where there are two or more joint holders of a share and more than one of them is present at a meeting and tenders a vote in respect of the share, the Company will count only the vote cast by the member whose name appears first in BSP’s register of members.
(c) issues of further shares
The Directors may, on behalf of BSP, issue, grant options over, or otherwise dispose of unissued shares to any person on the terms, with the rights, and at the times that the Directors decide. However, the Directors must act in accordance with the restrictions imposed by BSP’s constitution, the POMSoX Listing Rules, the Companies Act and any rights for the time being attached to the shares in any special class of those shares.
SHAREHOLDERSInFORMATIOn
(d) Variation of rights
Unless otherwise provided by BSP’s constitution or by the terms of issue of a class of shares, the rights attached to the shares in any class of shares may be varied or cancelled only with the written consent of the holders of at least three-quarters of the issued shares of that class, or by special resolution passed at a separate meeting of the holders of the issued shares of the affected class.
(e) Transfer of shares
Subject to BSP’s constitution, the Companies Act and the POMSoX Listing Rules, ordinary shares are freely transferable.
The shares may be transferred by a proper transfer effected in accordance with the POMSoX Business Rules, by any other method of transferring or dealing with shares introduced by POMSoX and as otherwise permitted by the Companies Act or by a written instrument of transfer in any usual form or in any other form approved by either the Directors or POMSoX that is permitted by the Companies Act.
The Directors may decline to register a transfer of shares (other than a proper transfer in accordance with the POMSoX Business Rules) where permitted to do so under the POMSoX Listing Rules or the transfer would be in contravention of the law. If the Directors decline to register a transfer, BSP must give notice in accordance with the Companies Act and the POMSoX Listing rules, give the party lodging the transfer written notice of the refusal and the reason for refusal. The Directors must decline to register a transfer of shares when required by law, by the POMSoX Listing Rules or by the POMSoX Business Rules.
(f) Partly paid shares
The Directors may, subject to compliance with BSP’s constitution, the Companies Act and the POMSoX Listing Rules, issue partly paid shares upon which there are outstanding amounts payable. These shares will have limited rights to vote and to receive dividends.
(g) dividends
The Directors may from time to time determine dividends to be distributed to members according to their rights and interests. The Directors may fix the time for distribution and the methods of distribution. Subject to the terms of issue of shares, each share in a class of shares in respect of which a dividend has been declared will share in the dividend equally.
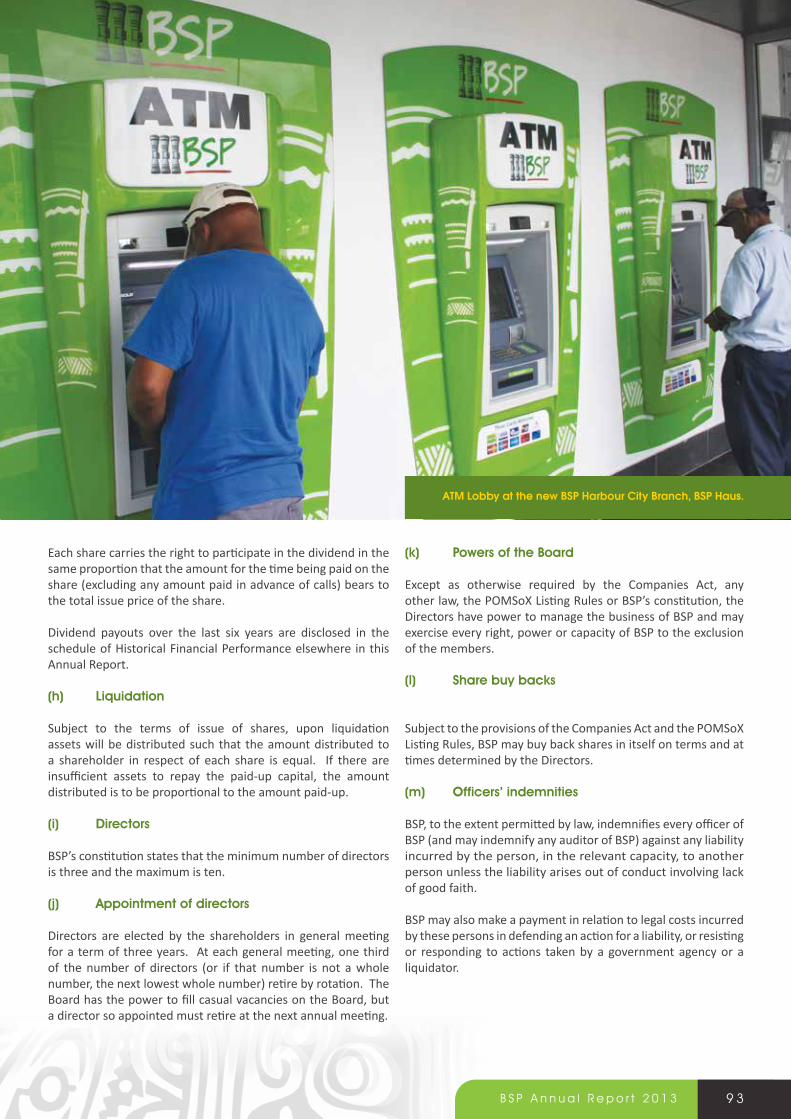
9 3B S P A n n u a l R e p o r t 2 0 1 3
aTM lobby at the new BsP Harbour City Branch, BsP Haus.
Each share carries the right to participate in the dividend in the same proportion that the amount for the time being paid on the share (excluding any amount paid in advance of calls) bears to the total issue price of the share. Dividend payouts over the last six years are disclosed in the schedule of Historical Financial Performance elsewhere in this Annual Report.
(h) liquidation
Subject to the terms of issue of shares, upon liquidation assets will be distributed such that the amount distributed to a shareholder in respect of each share is equal. If there are insufficient assets to repay the paid-up capital, the amount distributed is to be proportional to the amount paid-up.
(i) directors
BSP’s constitution states that the minimum number of directors is three and the maximum is ten.
(j) appointment of directors
Directors are elected by the shareholders in general meeting for a term of three years. At each general meeting, one third of the number of directors (or if that number is not a whole number, the next lowest whole number) retire by rotation. The Board has the power to fill casual vacancies on the Board, but a director so appointed must retire at the next annual meeting.
(k) Powers of the Board
Except as otherwise required by the Companies Act, any other law, the POMSoX Listing Rules or BSP’s constitution, the Directors have power to manage the business of BSP and may exercise every right, power or capacity of BSP to the exclusion of the members.
(l) share buy backs
Subject to the provisions of the Companies Act and the POMSoX Listing Rules, BSP may buy back shares in itself on terms and at times determined by the Directors.
(m) officers’ indemnities
BSP, to the extent permitted by law, indemnifies every officer of BSP (and may indemnify any auditor of BSP) against any liability incurred by the person, in the relevant capacity, to another person unless the liability arises out of conduct involving lack of good faith. BSP may also make a payment in relation to legal costs incurred by these persons in defending an action for a liability, or resisting or responding to actions taken by a government agency or a liquidator.
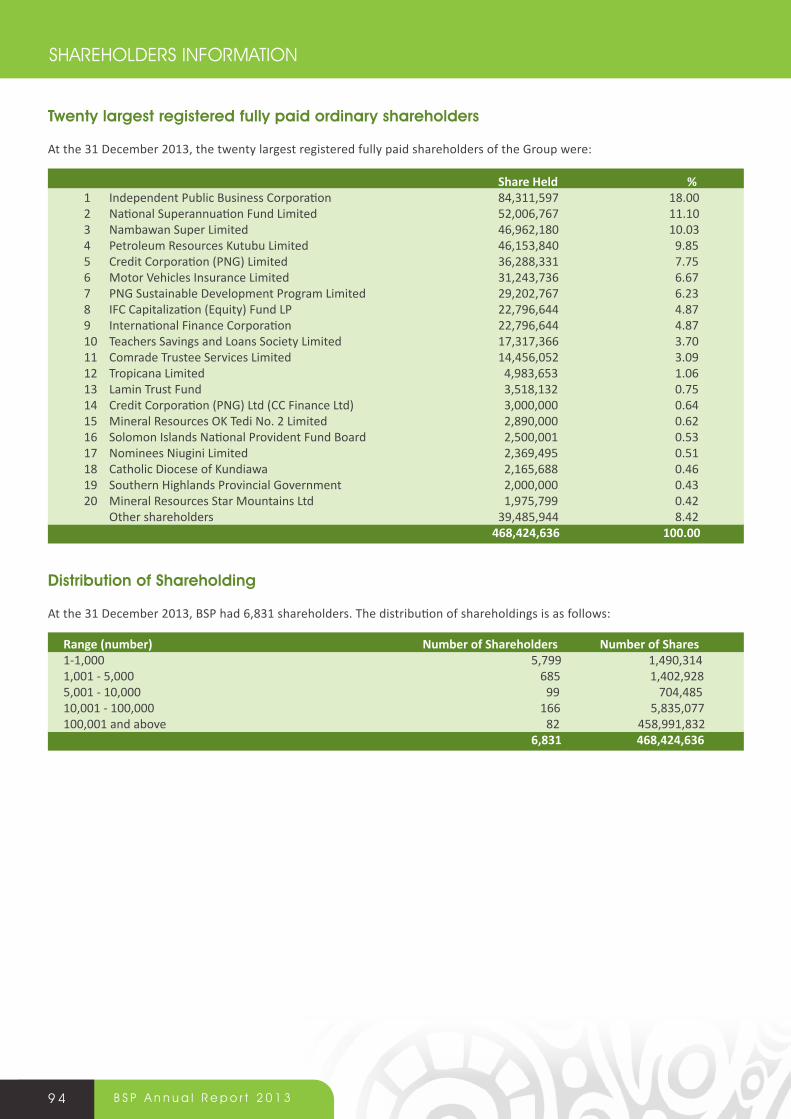
9 4 B S P A n n u a l R e p o r t 2 0 1 3
SHAREHOLDERS INFORMATION
Range (number) Number of Shareholders Number of Shares1-1,000 5,799 1,490,3141,001 - 5,000 685 1,402,9285,001 - 10,000 99 704,48510,001 - 100,000 166 5,835,077100,001 and above 82 458,991,832 6,831 468,424,636
distribution of shareholding
At the 31 December 2013, BSP had 6,831 shareholders. The distribution of shareholdings is as follows:
Share Held %1 Independent Public Business Corporation 84,311,597 18.002 National Superannuation Fund Limited 52,006,767 11.103 Nambawan Super Limited 46,962,180 10.034 Petroleum Resources Kutubu Limited 46,153,840 9.855 Credit Corporation (PNG) Limited 36,288,331 7.756 Motor Vehicles Insurance Limited 31,243,736 6.677 PNG Sustainable Development Program Limited 29,202,767 6.238 IFC Capitalization (Equity) Fund LP 22,796,644 4.879 International Finance Corporation 22,796,644 4.8710 Teachers Savings and Loans Society Limited 17,317,366 3.7011 Comrade Trustee Services Limited 14,456,052 3.0912 Tropicana Limited 4,983,653 1.0613 Lamin Trust Fund 3,518,132 0.7514 Credit Corporation (PNG) Ltd (CC Finance Ltd) 3,000,000 0.6415 Mineral Resources OK Tedi No. 2 Limited 2,890,000 0.6216 Solomon Islands National Provident Fund Board 2,500,001 0.5317 Nominees Niugini Limited 2,369,495 0.5118 Catholic Diocese of Kundiawa 2,165,688 0.4619 Southern Highlands Provincial Government 2,000,000 0.4320 Mineral Resources Star Mountains Ltd 1,975,799 0.42 Other shareholders 39,485,944 8.42 468,424,636 100.00
Twenty largest registered fully paid ordinary shareholders
At the 31 December 2013, the twenty largest registered fully paid shareholders of the Group were:
9 5B S P A n n u a l R e p o r t 2 0 1 3
employee share scheme
BSP resolved on 27 May 2004 that a maximum of 1% of the total number of shares held in BSP may be allocated to employees each year at the discretion of the Board.
interest in shares in the Bank
Directors hold the following shares in the Bank:
director shares held %
T. E. Fox 160,013 0.00G Aopi 10,000 0.00R Fleming 93,000 0.00
registered office share registry website
Bank of South Pacific Limited PNG Registries Limited www.bsp.com.pg PO Box 78, PO Box 1265, PORT MORESBY PORT MORESBY National Capital District National Capital District PAPUA NEW GUINEA PAPUA NEW GUINEATelephone: +675 305 7700 Telephone: +675 321 6377
home exchange for BsP shares home exchange for BsP Convertible notes
Port Moresby Stock Exchange Ltd (POMSOX) South Pacific Stock ExchangePO Box 1531 GPO Box 11689PORT MORESBY SUVANational Capital District FIJI PAPUA NEW GUINEA Telephone: +679 330 4130 Telephone: +675 320 1980
SHAREHOLDERS INFORMATION
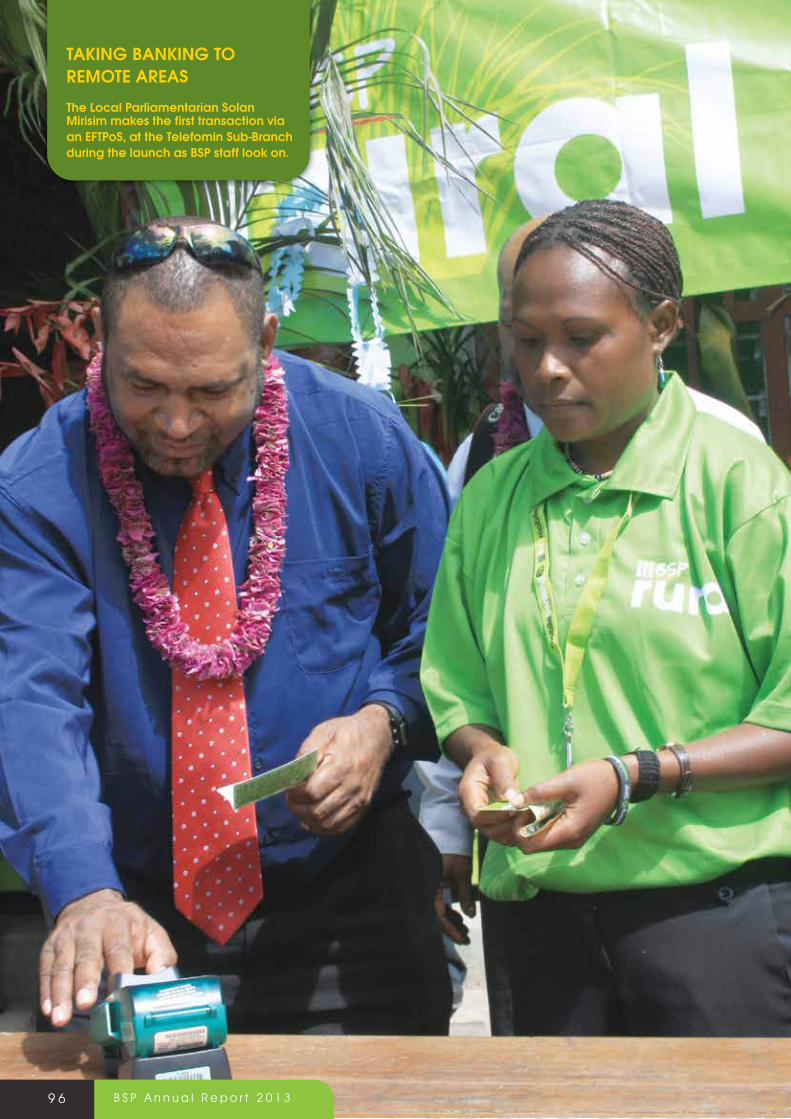
9 6 B S P A n n u a l R e p o r t 2 0 1 3
TaKiNG BaNKiNG To reMoTe areas
The local Parliamentarian solan Mirisim makes the first transaction via an efTPos, at the Telefomin sub-Branch during the launch as BsP staff look on.

9 7B S P A n n u a l R e p o r t 2 0 1 3
standing (L-R): Paul Thornton, GM Retail Banking, Giau Duruba, GM Human Resources, Peter Beswick, GM Corporate Banking, Haroon Ali, Group Chief Risk Officer, Richard Borysiewicz, GM BSP Capital , Edward Ruha, Chief Financial Officer - PNG.
Seated (L - R): Aho Baliki, OBE, GM Paramount, Robert Loggia, Group Chief Operating Officer, Robin Fleming, Group CEO, Johnson Kalo, Group DCEO/Group Chief Financial Officer, Mark Railston, GM Treasury.
senior ManageMenT

9 8 B S P A n n u a l R e p o r t 2 0 1 3
aitaPE 457 2042Branch Manager Alex Wafimbi--------------------------------------------------------------------------------------------alotau 641 1284Branch Manager Ben Umba--------------------------------------------------------------------------------------------araWa 276 9244Branch Manager Patrick Buibui--------------------------------------------------------------------------------------------Bialla 983 1095Branch Manager Mary Koi--------------------------------------------------------------------------------------------BoroKo 323 2288Branch Manager Anne BaniyamaiPremium Centre 303 4354 Sheila John --------------------------------------------------------------------------------------------BSP Harbour City 305 6151Branch Manager Alex KunaPremium Centre 305 6189 Bau Kiso--------------------------------------------------------------------------------------------BSP FIRST, Harbour City 305 6503Branch Manager Lama Orea--------------------------------------------------------------------------------------------BuKa 973 9042Branch Manager Julie WarrenPremium Centre 973 9087--------------------------------------------------------------------------------------------Bulolo 474 5366Branch Manager Joe Makinta--------------------------------------------------------------------------------------------gorDons PrEmium CEntrE 325 5999Branch Manager Maureen Wanu
BsP First, gordons 302 5245Branch Manager Barry Namongo--------------------------------------------------------------------------------------------Daru 645 9062Branch Manager Ivy David--------------------------------------------------------------------------------------------goroKa 532 1633Branch Manager Livikonimo Koki--------------------------------------------------------------------------------------------Kainantu 537 1065Branch Manager Marco Hamen--------------------------------------------------------------------------------------------KaviEng 984 2066Branch Manager Madeleine LekaPremium Centre 984 2100--------------------------------------------------------------------------------------------KimBE 983 5166Branch Manager Misbil Alfred--------------------------------------------------------------------------------------------Kiunga 649 1073Branch Manager Suya Yopahafo--------------------------------------------------------------------------------------------KoKoPo 982 9088Branch Manager Robinson PanakoPremium Centre 982 9068 Jennifer Tiolam--------------------------------------------------------------------------------------------
KunDiaWa 535 1025Branch Manager Rita Singut--------------------------------------------------------------------------------------------laE toP toWn 473 9801Branch Manager Joseph WasPremium Centre 473 4814 Mona Teloti --------------------------------------------------------------------------------------------laE CommErCial 473 9800Branch Manager Agnes Mark--------------------------------------------------------------------------------------------laE marKEt 473 9606Branch Manager Josephine Komoru--------------------------------------------------------------------------------------------lihir 986 4052Branch Manager Kalat Tiriman--------------------------------------------------------------------------------------------lorEngau 970 9050Branch Manager Quillan Nongi--------------------------------------------------------------------------------------------maDang 422 2477Branch Manager Cecilia PasumPremium Centre 422 2621 Christine Mes--------------------------------------------------------------------------------------------mEnDi 549 1070Branch Manager Billy Veveloga--------------------------------------------------------------------------------------------moro 276 1566Branch Manager Meck Kaum--------------------------------------------------------------------------------------------motuKEa 321 7701Branch Manager Jenny Joel --------------------------------------------------------------------------------------------mount hagEn 542 1877Branch Manager Mary KundiPremium Centre Ruth Kagl--------------------------------------------------------------------------------------------PoPonDEtta 629 7171Branch Manager Anthonia Dru--------------------------------------------------------------------------------------------PorgEra 547 6900Branch Manager John Basanu--------------------------------------------------------------------------------------------Port morEsBy 322 9790Branch Manager Rarua KemaPremium Centre 305 7943
Lina PopalBsP First Port morEsBy 305 7731Branch Manager Emily Basil--------------------------------------------------------------------------------------------raBaul 982 1744Branch Manager Bevilon Homuo--------------------------------------------------------------------------------------------taBuBil 649 9179Branch Manager Tony Waningu--------------------------------------------------------------------------------------------tari 276 1650Branch Manager Gabriel Ak--------------------------------------------------------------------------------------------
Png BranCh direCTory

9 9B S P A n n u a l R e p o r t 2 0 1 3
vanimo 457 1209Branch Manager Karen George--------------------------------------------------------------------------------------------vision City 310 0008Branch Manager Sibona KemaPremium Centre 300 9103 Damaris ToranBsP First 310 0008 Dianne Sawala--------------------------------------------------------------------------------------------WaBag 547 1176Branch Manager Jerry Marie--------------------------------------------------------------------------------------------Waigani BanKing CEntrE 300 9600Branch Manager Jeffery SingerPremium Centre 300 9645 Lorraine Siaoa--------------------------------------------------------------------------------------------
Waigani DrivE 302 5301Branch Manager Mathias Manowo--------------------------------------------------------------------------------------------WatErFront PlaCE 305 6408Team Leader Eric Tasman--------------------------------------------------------------------------------------------WEWaK 456 2344Branch Manager Albert Seri--------------------------------------------------------------------------------------------
PNG BRANCH DIRECTORY
PNG BRANCH MANAGEMENT
aGNes MarKlae Commercial
aNNe BaNiyaMaBoroko
aNToNia DruPopondetta
Billy VeVeloGaMendi
CeCilia PasuMMadang
alBerT BuruaNGi area Manager
alex KuNaHarbour City
alex WafiMBiaitape
alBerT seriWewak
BeN uMBaalotau
BeViloN HoMuorabaul
Barry NaMoNGoBsP first, Gordons
DaMaris ToraNVision City Premium
DeNNis laMusarea Manager Momase
eriC TasMaNWaterfront Premium
eMily BasilBsP first, Port Moresby
DiaNNe saWalaBsP first, Vision City
GaBriel aK GreGTari

1 0 0 B S P A n n u a l R e p o r t 2 0 1 3
BRANCH MANAGEMENT
JoHN BasaNuPorgera
JosePH Waslae Top Town
JosePHiNe KoMorulae Market
Julie WarreNBuka
KalaT TiriMaNlihir
KareN GeorGeVanimo
liViKoNiMo KoKiGoroka
MaDeleiNe leKaKavieng
MarCo HarMeNKainantu
Mary Dale KuNDiMt Hagen
Mary KoiBialla
MaTHias MaNoWoWaigani Drive
MaureeN WaNuGordons Premium
MeCK KauMMoro
MisBil alfreDKimbe
NuNi Kuluarea Manager southern
PaTriCK BuiBuiarawa
QuilaN NoNGilorengau
rarua KeMa Port Moresby
ruBeN elizaHarea Manager Highlands
riTa siNGuTKundiawa
roBiNsoN PaNaKoKokopo
siBoNa KeMa Vision City
suya yoPaHafoKiunga
ToNy WaNiNGuTabubil
Jeffrey siNGer Waigani BC
JeNNy JoelMotukea service Centre
Jerry MarieWabag
Joe MaKiNTaBulolo
iVy DaViDDaru
sTaNerD Waiarea Manager NCD
laMa oreaBsP firsT Harbour City

1 0 1B S P A n n u a l R e p o r t 2 0 1 3
aiyura 7230 8313Cribia Albert
-----------------------------------------------------------------------------------BanZ 7100 9078
Kessy Elly Sammy-----------------------------------------------------------------------------------
Buin 7100 7855Melchior Tania
-----------------------------------------------------------------------------------ChuavE 7197 6001
Maxie Joe-----------------------------------------------------------------------------------
Daulo 7100 6763Delilah Gahale
-----------------------------------------------------------------------------------gEmBogl 7313 4177
William Koima-----------------------------------------------------------------------------------
guminE 7100 7860John Sii
-----------------------------------------------------------------------------------hEnganoFi 7100 7859
Amos James-----------------------------------------------------------------------------------
hosKins 7031 2627Ruddy Samson
-----------------------------------------------------------------------------------ialiBu 7197 6004
Mathew Garu-----------------------------------------------------------------------------------
KaBWum 7346 1426 Rachael Watu
-----------------------------------------------------------------------------------Kamtai 7243 4695
Robert Kom-----------------------------------------------------------------------------------
KErEvat 7190 8231Kilala Kindau
-----------------------------------------------------------------------------------KEroWagi 7100 9077
Leah Taia -----------------------------------------------------------------------------------
Kinim 7100 7861Malapun Bannick
-----------------------------------------------------------------------------------Komo 7362 0760
Lobe Arawi-----------------------------------------------------------------------------------
Konos 7197 6006Maureen Nick
-----------------------------------------------------------------------------------KuPiano 7288 4140
Andrew Baine Jnr-----------------------------------------------------------------------------------
laBa 7197 6008Auda Morea
-----------------------------------------------------------------------------------laiagam 7196 6002
Roselyn Joel-----------------------------------------------------------------------------------
laKurumau 7197 6005Christine Gawi Frank
-----------------------------------------------------------------------------------lousia 7031 2617
Lorna Solomon-----------------------------------------------------------------------------------luFa 7100 6761
Vida Kemati-----------------------------------------------------------------------------------maPriK 7168 7815
Christian Tatu-----------------------------------------------------------------------------------minJ 7100 9076
Pauline Kapal-----------------------------------------------------------------------------------mutZing 7100 2488
Frank Godfrey-----------------------------------------------------------------------------------namatanai 7197 6007
Mathew Tabakas-----------------------------------------------------------------------------------ningErum 7031 8497
Mathew Tware-----------------------------------------------------------------------------------oKaPa 7374 5623
Mele Aron-----------------------------------------------------------------------------------Palmalmal 7323 9181
Freda Nablup-----------------------------------------------------------------------------------Pangia 7197 6003
Philemon Kambu -----------------------------------------------------------------------------------tamBul 7100 7863
Joseph Wanjil-----------------------------------------------------------------------------------tElEFomin 7255 8421
Donna Yarkin-----------------------------------------------------------------------------------WaKunai 7100 7856
Melvin Kusa-----------------------------------------------------------------------------------Walium 7106 8357
Brenda Igusam-----------------------------------------------------------------------------------WaPEnamanDa 7100 7862
Grace Reto-----------------------------------------------------------------------------------yangoru 7127 0000
Michael Paul Java-----------------------------------------------------------------------------------yonKi 7185 5768
Usick Asino-----------------------------------------------------------------------------------ZEnag 7318 5855
Nicko Morris-----------------------------------------------------------------------------------
SUB BRANCH NETWORK - PNG

1 0 2 B S P A n n u a l R e p o r t 2 0 1 3
FiJi -----------------------------------------------------------------------------------FiJi (679) 330 4011Country Head Kevin McCarthy-----------------------------------------------------------------------------------Ba (679) 662 7335Branch Manager Anupa Kumar-----------------------------------------------------------------------------------DamoDar (679) 321 4311Branch Manager Manjila Goundar-----------------------------------------------------------------------------------laBasa (679) 881 1360Branch Manager Eka Seduadua-----------------------------------------------------------------------------------lautoKa (679) 666 2466Branch Manager Josefa Tuitubou-----------------------------------------------------------------------------------naDi (679) 662 7310Branch Manager Davendran Pillay-----------------------------------------------------------------------------------namaKa (679) 662 7320Branch Manager Madhur Lata Kumar-----------------------------------------------------------------------------------nausori (679) 347 8499Branch Manager Shailendra Roy-----------------------------------------------------------------------------------PaCiFiC harBour (679) 345 2030Officer in Charge Naomi Waqa-----------------------------------------------------------------------------------PaCiFiC housE (679) 321 4580Officer in Charge Shalit Kumar-----------------------------------------------------------------------------------raKiraKi (679) 662 7341Officer in Charge Ronika Prakash-----------------------------------------------------------------------------------samaBula (679) 338 7999Branch Manager Anand Nair-----------------------------------------------------------------------------------savusavu (679) 885 0221Officer in Charge Vineeta Prasad-----------------------------------------------------------------------------------sigatoKa (679) 662 7332Branch Manager Reginald Kumar-----------------------------------------------------------------------------------suva – CEntral (679) 321 4455Branch Manager Arif Mohammed-----------------------------------------------------------------------------------tavEuni (679) 888 0433Branch Manager Marica Mara-----------------------------------------------------------------------------------tavua (679) 662 7338Officer in Charge Sanjeev Sumer-----------------------------------------------------------------------------------thomson st (679) 321 4671Branch Manager Rajesh Chand-----------------------------------------------------------------------------------valElEvu (679) 334 2333Officer in Charge Sera Petueli-----------------------------------------------------------------------------------
BsP First suva (679) 323 4232Premium Centre suva Manager Mereani Peters---------------------------------------------------------------------------------- BsP First naDi (679) 6705101Premium Centre naDi Lice TogaManager Albertina Lilo---------------------------------------------------------------------------------- BsP First lautoKa (679) 6660180Premium Centre lautoKa Meri QuminakeloManager Albertina Lilo-----------------------------------------------------------------------------------
soloMon islands ----------------------------------------------------------------------------------solomon islanDs (677) 21874Country Head David Anderson----------------------------------------------------------------------------------auKi (677) 40484Branch Manager Samuel Misi----------------------------------------------------------------------------------CommErCial BanKing (677) 23620Branch Manager Rose Murray----------------------------------------------------------------------------------giZo (677) 60539Relieving Branch Manager Clotilda Londeka----------------------------------------------------------------------------------honiara (677) 21814Branch Manager Michael Kahamana----------------------------------------------------------------------------------
munDa (677) 62177Branch Manager Rebecca Hickie----------------------------------------------------------------------------------noro (677) 61222Branch Manager Tewia Laore----------------------------------------------------------------------------------Point CruZ (677) 21874Branch Manager Rose Funa----------------------------------------------------------------------------------ranaDi (677) 39403Branch Manager Joy Vave----------------------------------------------------------------------------------
Fiji & soloMon island direCTory

1 0 3B S P A n n u a l R e p o r t 2 0 1 3
BeyoND BaNKiNG
our people, devoted their own time during weekends to paint, plant, plumb
and perform other manual work to deliver these wonderful projects.
our people also take time to visit the sick at the hospital.

1 0 4 B S P A n n u a l R e p o r t 2 0 1 3
BSP is a brand that has become a household name. When you think BSP, you think Mobile Banking, EFTPoS, ATMs, Bank branches, you think lime green. And as a bank, we take pride in our innovative and determined approach to banking.
In 2013, BSP delivered new branches, took banking to new heights with the introduction of Wantok Moni, a mobile banking service that enables BSP customers to transfer funds to anyone, anytime and anywhere. In 2013, we delivered a Kids Savings Account and a Sumatin Account.
Our teams have braved unforgiving weather, rugged terrain and many odds to educate people in rural communities, schools and villages on basic financial literacy. The feedback and appreciation from many of these far flung areas is simply amazing. Some of these areas, don’t have roads. Take Telefomin for instance. No roads. But they have a rural branch. When we talk banking in your world, we mean what we say and we walk the talk.
And beyond banking, our people, devoted their own time during weekends to paint, plant, plumb and perform other manual work to deliver many wonderful projects. They do this, because they are not just bankers, they are a part of the community.
BSP has also supported many worthy causes, that we believe will ensure the people in the communities in which we operate, particularly children and youth have health, hope and opportunity for a brighter future.
Here is a brief look at what we did in 2013. In 2013, we delivered 33 Community Projects in Communities in which we operate. 16 in Education, 10 in Health and 6 in Environment/Community.
We installed water tanks in schools, constructed new town markets, and provided rubbish bins and bus shelters. We rebuilt Hospital Wards and provided much needed medical equipment and supplies. The list is endless. Our commitment is on-going.
BSP’s “Go Green” year round environmental program now attracts hundreds of children and adults from all levels of society to help “Clean up our World”. We sponsor able and disabled athletes, men and women from grassroots local events to high performance athletes.
By supporting local communities and people we encourage active participation and social responsibility in our community.
CORPORATE SOCIAL RESPOnSIBILITY
BsP ambassador ryan Pini leads children during the Go Green Clean up in september 2013.

1 0 5B S P A n n u a l R e p o r t 2 0 1 3
CoMMuniTy ProjeCTs
At BSP we understand every customer belongs to a community, and that the relationships we build with each and everyone brings us opportunities to help their communities.
Thousands of conversations happen each year with our customers, their communities and BSP men and women, to determine the area of greatest need for a community.
Once the need has been identified, BSP formulates an action plan - a plan to implement positive change and make a real difference to the lives of men, women and children throughout the South Pacific region.
We are proud that every Branch Manager and their teams make a personal commitment to this programme, devoting their own time, backed by all the resources of BSP. Our community projects typically include:
• refurbishing health facilities• renovating schools• bringing healthcare to communities• installing water supply to schools and• constructing new market buildings.
enVironMenT & susTainaBiliTy
Growing our responsibility and sustainability. We are the ‘Greenest bank in the South Pacific’. As one of the South Pacific’s largest organisations, BSP recognises the effect it has on environment and is committed to finding ways to reduce any negative impact and enhance the environment we live in.
As part of our environment strategy, we support organisations and initiatives that foster an understanding of environmental issues and provide practical support to building sustainable communities. We’re continually seeking innovative new ways to decrease our environmental impact in the operation of our branches by reduction of resources and materials used wherever possible.
BSP Go Green Clean up 2013 Day had approximately 19,400 participants across the 39 branches where the clean up took place in PNG. There were around 970 groups registered. This is almost double the number of groups who took part at the 2012 Community Clean up Day. The majority of participants were community groups made up of friends, families, neighbourhoods and villages.
2013 Go Green Clean up Day was the most successful so far; we doubled the participation from last year. The theme for BSP’s Go Green in 2013 was ‘Recycle, Reuse, Respect’:
• recycle: Collect and deposit discarded items at an operation, where these materials can be recycled into new products, e.g. scrap metal/plastic buyers.
• reuse: Remove wastes or ‘patch up’ damaged areas on an item or its components, to use again for the same purpose.
• respect: Dispose your unwanted items properly- tied up in bags & put in a rubbish bin. Respect the environment.
These are the simple messages we as an organisation want to impart through events such as our Annual Clean Up Day, and we encourage everyone to do the same, every day.
sPorTs For liFe
Promoting Sport and Choices for Life. “Never stop playing”. It’s the healthy lifestyle message at the heart of a huge and diverse set of lifestyle initiatives and programmes BSP has committed to do.
With a focus on children and youth programmes, BSP has invested significantly in children’s sporting partnerships. We are proud that the number of children we have encouraged to lead active lifestyles since the programmes were commenced in 2009 have swelled to in excess of 800,000 children throughout the South Pacific region.
Go Green fiji. Kid’s Tennis. supporting Buk Bilong Pikinini.

1 0 6 B S P A n n u a l R e p o r t 2 0 1 3
BSP’s association with a huge range of sports includes cricket, tennis, the Paralympics, football, game fishing, AFL, Sailing, PGA and youth golf.
BsP regional Tennis
The BSP Regional Tennis program was the first school program supported by BSP in 2009 to identify and develop children in the sport of Tennis in the country. To date a total of over 50,000 participants took on this program around the country. In 2013, with the support of K50,000, 1266 participants took part from 33 schools around the country.
The 2013 program was more defined and targeted to identify prospective players for the 2015 Pacific Games. Apart from financial assistance, our branch network around the country played a pivotal role in coordinating with the PNG Tennis Association to ensure the program was delivered as planned.
PNG Paralympics
BSP is the major sponsor of the PNG Paralympic Team, committing not only funds (K100,000pa), but merchandise and people. BSP aims to give athletes living with disabilities the opportunity to achieve their dreams. Rosemary Mawe, Manager Corporate Sponsorships has been an integral team member of the PNG Paralympic support team and in 2012 was appointed the Team Manager for the 2012 London Paralympic Games.
swimming
BSP has supported PNG Swimming Inc (PNGSI) for over 10 years and was an integral part of supporting the development of Ryan Pini and Judith Meauri who competed in the 2012 London Olympics. BSP sponsors directly the two target squads known as BSP Kundu Gold and Kundu Silver Target Aquatic Excellence Squads.
The PNGSI/BSP National Aquatic Excellence Program is a
program to recognise swimming excellence in our PNG Swimmers. The program covers swimmers from age 9 through to Open. Swimmers who achieve a qualifying standard are awarded a Silver or Gold standard level in the Junior (9-11 years), Intermediate (12-14 years) or Open levels (Kundu Target Squads).
With our support of K80,000, PNGSI works closely with Swimming NZ (SNZ), Swimming Australia Limited (SAL) and Australian Swim Coaches and Teachers Association (ASCTA) and regularly brings representatives to PNG for coaching clinics and courses and Technical official courses. In conjunction with these experienced partners the BSP Learn to Swim Program will be prioritised in other centres outside the National Capital District with Alotau and Lae community schools being targeted in the first instance.
BsP school Kriket
The global award winning children’s cricket programme, BSP School Kriket, achieved the ambitious target of reaching more than 130,000 school children in 2013. The most successful initiative in the Asia Pacific region, the BSP School Kriket programme is expanding further nationwide. The programme has been awarded the Best Junior Development Programme with the International Cricket Council’s (ICC) East Asia Pacific Award for three years running. From the regional award, the programme has also been awarded the ICC Global Award of Best Junior Participation initiative for 2010, 2011, and was a finalist in 2012. In 2013, the program saw record participation with 171,578 students and children participating in 10 regions, 297 schools and 136 clinics across the country.
junior golf development Program
The Papua New Guinea Golf Association (PNGGA) has an ambitious objective to deliver gold medals in the 2015 Pacific Games and BSP will help drive these aspirations forward with a sponsorship package worth K600,000. BSP’s sponsorship will support PNGGA’s Junior Golf Development Program over
CORPORATE RESPONSIBILITY
supporting PNG swimming inc for more that 10 years.supporting operation open Heart.

1 0 7B S P A n n u a l R e p o r t 2 0 1 3
the next three years at K200,000 per annum. As part of this program, talented young golfers nationwide will be identified and given the opportunity to progress from the amateur to professional level, to ensure a high competitive environment is maintained.
Brand ambassadors
BSP has two brand ambassadors who support our ‘Sports for Life’ initiatives. Ryan Pini has been a BSP Brand Ambassador for 3 years. As PNG’s most celebrated athlete, Ryan represents dedication and commitment to his sport and his country and is a valued strategic partner in promoting healthy, active lifestyles - Sports for Life. Ryan promoted BSP and PNG throughout his challenge at the 2012 London Olympics. Ryan is now preparing to represent PNG at his last competition, the 2015 XV Pacific Games. Known as the Sprint Queen of the Pacific, Toea Wisil has certainly made her mark in the Papua New Guinean sports scene, inspiring young athletes all across Oceania. She was signed as the second BSP Ambassador in 2013. The arrangement will see the 25-year-old associate with BSP’s team and use her experience and success to promote and encourage healthy, active lifestyles through various sports, environment and community initiatives supported by the bank.
official sponsor Pacific games
Sports and Pacific Games Minister Justin Tkachenko made the official announcement in Port Moresby 7 February 2013, in front of Pacific Games CEO Peter Stewart, board members from the Pacific Games Committee, the Pacific Games Authority and the Venue, Infrastructure and Equipment Committee and Sports
Federation and Sports Foundation.
“I thank BSP not only for the sponsorship of the games, but also for their part in nation building and what these games will make for us,” he added.
“BSP’s choice to back the Games is a wise choice, for the exposure it will get and the contribution it will make. I encourage other Corporate Entities and big industries to support Pacific Games 2015. It is a huge task that I cannot do myself, and we have to work together,” he stressed.
“It is with great pleasure that I now welcome on board BSP as the official sponsor for the PNG 2015 Pacific Games, I say with much confidence that we now have the capacity to dream big about the range of possibilities for engagement, participation and for delivering the best ever Pacific Games,” said Games Chairperson Emmah Waiwai.
Toea Wisil, BsP Brand ambdassador with a customer.award winning BsP school Kriket Programme.

1 0 8 B S P A n n u a l R e p o r t 2 0 1 3
CORPORATE SOCIAL RESPONSIBILITY
some of the Major sponsorships by BsP in 2013
ConFerenCes• PNG Business Advantage • Certified Practicing Accountants• Madang SME Summit• BPNG Financial Inclusion Expo • Institute of Internal Auditors• PNG Australia Business Council• Fiji Trade & Investment Mission to PNG• Australia & PNG Mining Resource Expo• PNG Human Resource Institute• PNG Safety Expo
CulTural FesTiVals• Kenu & Kundu Festival • Goroka Show • Morobe Agricultural Show • 6th Sepik Crocodile Festival • Wawagira & Mask Festival• Bulolo Show• Rabaul Frangipani Show
sPorT• PNG Cricket • PNG Junior Golf Development Program• Ryan Pini, Brand Ambassador • PNG Paralympic Committee• PNG Swimming Inc• PNG Tennis Association • Toea Wisil, Brand Ambassador • AFL Premiership • BSP Pennants• Port Moresby Golf Open• Game Fishing Club • Kone Kanu Klub BsP Mascot
ChariTies/organisaTions• Buk Bilong Pikinini (Lae, Goroka, Manus & NCD)• Operation Open Heart Program• Theophilus Foundation• Anglicare• Susu Mamas Ball• Indigenous Business Council • City Mission • Salvation Army • Filipino Association• Indian Association• Port Moresby Cancer Society
some of the organisations supported by BsP in 2013
The Institute ofInternal AuditorsPNG Chapter
COPYRIGHT MEDIA PLAYGROUND LTD © 2014
Morobe Province agricultural society inc

1 0 9B S P A n n u a l R e p o r t 2 0 1 3
some of the Major sponsorships by BsP in 2013
some of the organisations supported by BsP in 2013
suPPorTiNG WorTHy Causes
a BsP staff member at the Head office giving blood during the 2013 Corporate Blood Drive. BsP’s Port Moresby branches participated in this worthy event to help save lives.

1 1 0 B S P A n n u a l R e p o r t 2 0 1 3
aiTaPe New water tanks to St Anna Primary School.aloTau New medical equipment & renovation of Golanai Urban Health Clinic. arawa New beds, mattresses, pillows & clean up at local hospital.BoroKo Refurbishment St Johns for the Blind Centre and new office equipmentBialla Renovation of ablution at Bialla Health Centre.BuKa Set up rubbish drums around township.Bulolo New 9000 ltr water tank and maintenance of ablution at Hompiri Primary Schooldaru Renovation of local Police Station, including new office furniture. douglas sT Building of library at Hohola Demonstration Elementary School.gordons PreMiuM Renovation of Ororo Primary School library.goroKa Refurbishment of Goroka Base Hospital outpatient ward.KainanTu Renovation of classroom, new Tuffa tank at Rapinka Primary School.KaVieng Built a children’s playground at local Hospital.KiMBe New mattresses to the surgical/children’s ward at local hospital.Kiunga Renovation of town basketball court & presentation of sport equipment. KoKoPo & raBaul New mattresses, pillow cases and medical equipment to Tapipi Rural Health Centre. Kundiawa Reconstruction of Chemotherapy preparation room at the local hospital. lae 3 BranChes Renovation of Buimo Correctional Services Clinic. lihir Built a new bus stop at Lihir Destiny School. lorengau New wheelie bins around township. Madang Renovation of mental ward at local hospital. Mendi New toilets Magani Elementary School. Moro Renovation of classroom and library books to Kutubu High School. MT hagen New rubbish drums around township. PorT MoresBy Renovation of Classroom at Bavaroko Primary School. PoPondeTTa New water tank and painting of classroom at Resurrection Primary School. Porgera New water tanks at Sirunki Lutheran High School. TaBuBil Clean up & presentation of sporting equipment to Tabubil Primary & other schools in township. VaniMo New rubbish drums around township. waBag Renovation of carpentry workshop at Holy Cross TVET Centre. waigani New water taps, pipes, hand basins and a mini shelter at Waigani Elementary School. waigani dr Renovation of classroom at Ted Diro Primary School.wewaK Repainting workshop and new water tank at Callan Services Disabled Centre.
a new children’s playground at local hospital built by the Kavieng branch team
COMMunITY PROJECTS In 2013

1 1 1B S P A n n u a l R e p o r t 2 0 1 3
araWa BoroKoaiTaPe aloTau
Bulolo Daru
DouGlas sT GoroKa KaiNaNTu
KuNDiaWa
KaVieNG KiMBe KiuNGa KoKoPo & raBaul
loreNGau liHirlae 3 BraNCHes
Bialla BuKa
GorDoNs
CORPORATE SOCIAL RESPONSIBILITY

1 1 2 B S P A n n u a l R e p o r t 2 0 1 3
MaDaNG MeNDi Moro MT HaGeN
PorT MoresBy PoPoNDeTTa PorGera TaBuBil
VaNiMo WaBaG WaiGaNi WaiGaNi Dr
WeWaK
CORPORATE SOCIAL RESPONSIBILITY
reNoVaTeD liBraryGordons Premium Centre helped renovare the
ororo Primary school library
QuiCK FaCTs aBouT BsP CoMMuniTy ProjeCTs
• 33: The number of projects delivered in PNG in 2013 • 32 Community Projects in 2009, 34 in 2010, 35 in 2011 and 31 in 2012. • 165: The number of individual projects in PNG from 2009 – 2013• since 2009: 78 Projects focused in Education, 54 in Health and 27 centred
around Environment/Community activities and 6 in Sports. • K3.6 million: Amount BSP has invested in communities in PNG from 2009 – 2013

www.bsp.com.pg
Related Documents