2009 ANNUAL REPORT

Welcome message from author
This document is posted to help you gain knowledge. Please leave a comment to let me know what you think about it! Share it to your friends and learn new things together.
Transcript
2009 ANNUAL REPORT

Table of Contents To Our Shareholders ..............................................................................................................................1 Five-Year Overview...............................................................................................................................5 Regional Review ....................................................................................................................................7 Selected Financial Highlights ..............................................................................................................13 Quarterly Financial Summary ..............................................................................................................14 Report of Independent Registered Public Accounting Firm ................................................................15 Consolidated Balance Sheets ...............................................................................................................16 Consolidated Statements of Operations ...............................................................................................17 Consolidated Statements of Changes in Shareholders’ Equity ............................................................18 Consolidated Statements of Cash Flows ..............................................................................................19 Notes to Consolidated Financial Statements........................................................................................20 Selected Financial Data........................................................................................................................45 Summary Quarterly Financial Information ..........................................................................................46 Market Information ..............................................................................................................................48 Shareholder Return Performance Graph ..............................................................................................49 Forward-Looking Statements...............................................................................................................50 Management’s Discussion and Analysis of Financial Condition and Results of Operations ................................................................................................51 Directors and Officers ..........................................................................................................................72 ______________________________________________________________________________________ BUSINESS OF THE CORPORATION
Mackinac Financial Corporation is a registered bank holding company formed under the Bank Holding Company Act of 1956 with assets in excess of $500 million and whose common stock is traded on the NASDAQ stock market as ―MFNC.‖ The principal subsidiary of the Corporation is mBank. Headquartered in Manistique, Michigan, mBank has 10 branch locations; six in the Upper Peninsula, three in the Northern Lower Peninsula and one in Oakland County, Michigan. The newest branch, located in Escanaba, opened on March 24, 2009. The Company’s banking services include commercial lending and treasury management products and services geared toward small to mid-sized businesses, as well as a full array of personal and business deposit products and consumer loans.
FORM 10-K
A copy of the Annual Report to the Securities and Exchange Commission on Form 10-K is available without charge by writing the Shareholders’ Relations Department, Mackinac Financial Corporation, 130 South Cedar Street, Manistique, Michigan, 49854. MARKET SUMMARY
The Corporation’s common stock is traded on the Nasdaq Capital Market under the symbol MFNC. The Corporation had 1,228 shareholders of record as of March 30, 2010.

To Our Shareholders
1
March 30, 2010 Dear Fellow Shareholders: This letter will provide you with a review of the performance of Mackinac Financial Corporation through the end of 2009 and our thoughts about business strategy as we move through 2010. In addition, we have included an overview of our five year performance since the recapitalization of the company in December of 2004, and a regional market performance review to better detail the progress of the company during this period of economic turmoil in the State of Michigan and national markets. The company reported net income of $1.907 million, or $.56 per share, for the year ended December 31, 2009, compared to a net income of $1.872 million, or $.55 per share, for 2008. The 2009 results include $1.208 million of gains related to the sale of two branch offices and $1.471 million of security gains. The 2008 results include the positive effect, $3.475 million, of a lawsuit settlement and the negative effect, $.425 million, of a severance agreement. Shareholders’ equity totaled $55.299 million at December 31, 2009, compared to $41.552 million at the end of 2008, an increase of $13.747 million. This increase includes $10.5 million of preferred stock that was issued by MFNC as a TARP recipient, consolidated net income of $1.907 million noted above, the capital contribution impact of stock options and also the increase in equity due to the increase in the market value of held-for-sale investments, which amounted to $.648 million. In 2009, we continued to focus our efforts to improve the overall operation and value of the company. These included core deposit generation through our branch network to offset reliance on wholesale funding sources, originating new loans through various government guaranteed loan programs with good risk / return pricing, and noninterest expense management and proper allocation of personnel and capital resources to make the company more efficient. Noted below are some highlighted 2009 achievements as they relate to these initiatives;
The increase in new core deposits of approximately $55 million net of the sale of the two noted branches above with approximately $29 million in deposits. We experienced deposit growth in all of our markets, with $26 million in Northern Lower Michigan, $20 million in Southeast Michigan and $10 million in the Upper Peninsula. Most of our 2009 deposit growth occurred in low cost transactional accounts which grew by $41 million.
In April of 2009, the Corporation, in an abundance of caution, decided to participate in the TARP program and issued $11 million of preferred stock. In order to offset the cost of the preferred, we infused a portion of the TARP proceeds, $3 million, into the Bank and leveraged this excess capital by purchasing approximately $40 million of investment securities. We funded the purchase of these investments by issuing brokered deposits. In December, we began the process of deleveraging this position in anticipation of narrowing spreads and recognized a fourth quarter security gain of $.827 million. This strategy has resulted in overall security gains in excess of $1 million.
Steady loan demand with approximately $88 million of new loan production with a $14 million increase in loans outstanding, after reductions for amortization and payoffs. After the receipt of the TARP funds in April of 2009, we originated over $74 million of new loans and through February of 2010 that number is approximately $85 million. We were successful in producing loans in all of our markets in 2009, but were less aggressive in Southeast Michigan where the recession remains severe. Loan production for 2009 totaled $44 million in the Upper Peninsula, $35 million in Northern Lower Michigan and $9 million in Southeast Michigan.
Continued development of our government SBA/USDA lending programs to become a leader state wide in these
initiatives to mitigate credit risk substantially when new loans are originated, along with positively augmenting non-interest income though the sale of the guaranteed portion of the loan for a premium gain.
To Our Shareholders
2
Divesting of two outlier branches with a pretax gain to the company of approximately $1.2 million which also
decreases operating expenses and results in a more manageable footprint for the company.
Enhancing our core earnings by controlling noninterest expense, increasing noninterest income and net interest margin improvement. The combination of these three factors resulted in an improved efficiency ratio from 86% in 2008 to 73% in 2009. In addition for future margin improvement in this low interest rate environment, we continued to use interest rate floors for the majority of all new and renewed variable rate loans.
Prudent and proactive credit administration practices to quickly identify any potential problem assets to better
monitor our portfolio given the recession which continues to put substantial pressure on many businesses’ cash flow and overall operations.
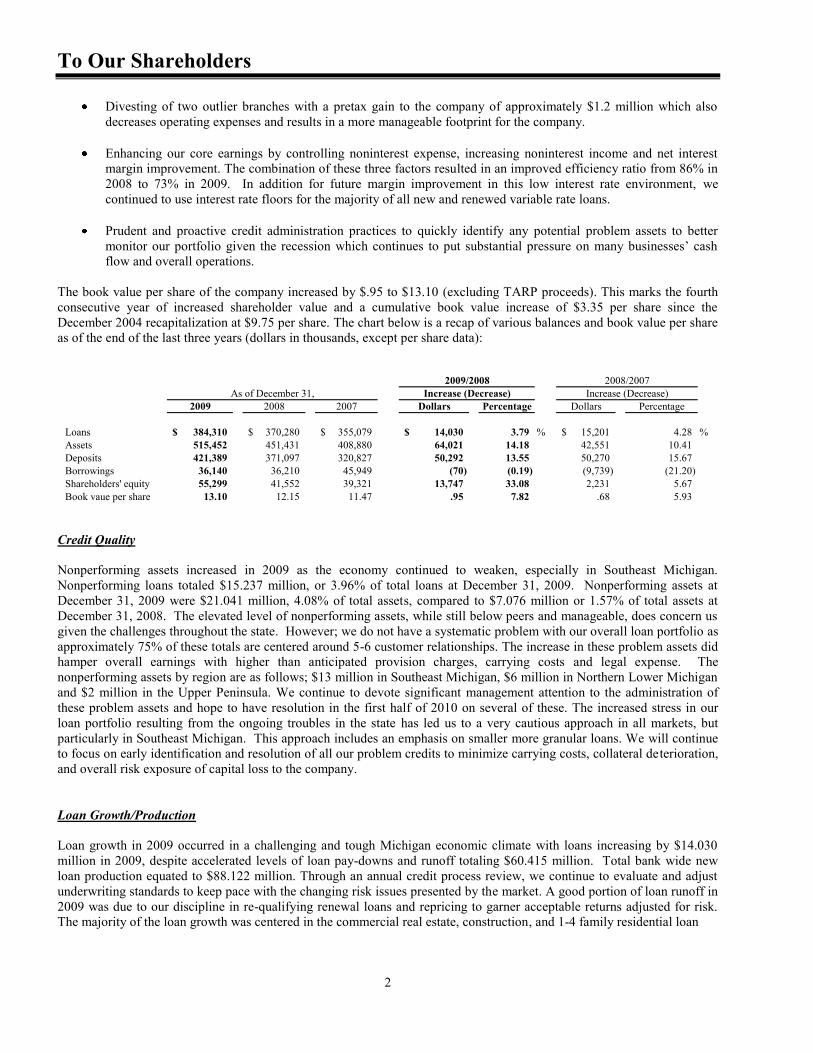
The book value per share of the company increased by $.95 to $13.10 (excluding TARP proceeds). This marks the fourth consecutive year of increased shareholder value and a cumulative book value increase of $3.35 per share since the December 2004 recapitalization at $9.75 per share. The chart below is a recap of various balances and book value per share as of the end of the last three years (dollars in thousands, except per share data):
2009 2008 2007 Dollars Percentage Dollars Percentage
Loans 384,310$ 370,280$ 355,079$ 14,030$ 3.79 % 15,201$ 4.28 %Assets 515,452 451,431 408,880 64,021 14.18 42,551 10.41 Deposits 421,389 371,097 320,827 50,292 13.55 50,270 15.67 Borrowings 36,140 36,210 45,949 (70) (0.19) (9,739) (21.20) Shareholders' equity 55,299 41,552 39,321 13,747 33.08 2,231 5.67 Book vaue per share 13.10 12.15 11.47 .95 7.82 .68 5.93
As of December 31, Increase (Decrease) Increase (Decrease)2009/2008 2008/2007
Credit Quality Nonperforming assets increased in 2009 as the economy continued to weaken, especially in Southeast Michigan. Nonperforming loans totaled $15.237 million, or 3.96% of total loans at December 31, 2009. Nonperforming assets at December 31, 2009 were $21.041 million, 4.08% of total assets, compared to $7.076 million or 1.57% of total assets at December 31, 2008. The elevated level of nonperforming assets, while still below peers and manageable, does concern us given the challenges throughout the state. However; we do not have a systematic problem with our overall loan portfolio as approximately 75% of these totals are centered around 5-6 customer relationships. The increase in these problem assets did hamper overall earnings with higher than anticipated provision charges, carrying costs and legal expense. The nonperforming assets by region are as follows; $13 million in Southeast Michigan, $6 million in Northern Lower Michigan and $2 million in the Upper Peninsula. We continue to devote significant management attention to the administration of these problem assets and hope to have resolution in the first half of 2010 on several of these. The increased stress in our loan portfolio resulting from the ongoing troubles in the state has led us to a very cautious approach in all markets, but particularly in Southeast Michigan. This approach includes an emphasis on smaller more granular loans. We will continue to focus on early identification and resolution of all our problem credits to minimize carrying costs, collateral deterioration, and overall risk exposure of capital loss to the company. Loan Growth/Production
Loan growth in 2009 occurred in a challenging and tough Michigan economic climate with loans increasing by $14.030 million in 2009, despite accelerated levels of loan pay-downs and runoff totaling $60.415 million. Total bank wide new loan production equated to $88.122 million. Through an annual credit process review, we continue to evaluate and adjust underwriting standards to keep pace with the changing risk issues presented by the market. A good portion of loan runoff in 2009 was due to our discipline in re-qualifying renewal loans and repricing to garner acceptable returns adjusted for risk. The majority of the loan growth was centered in the commercial real estate, construction, and 1-4 family residential loan
To Our Shareholders
3
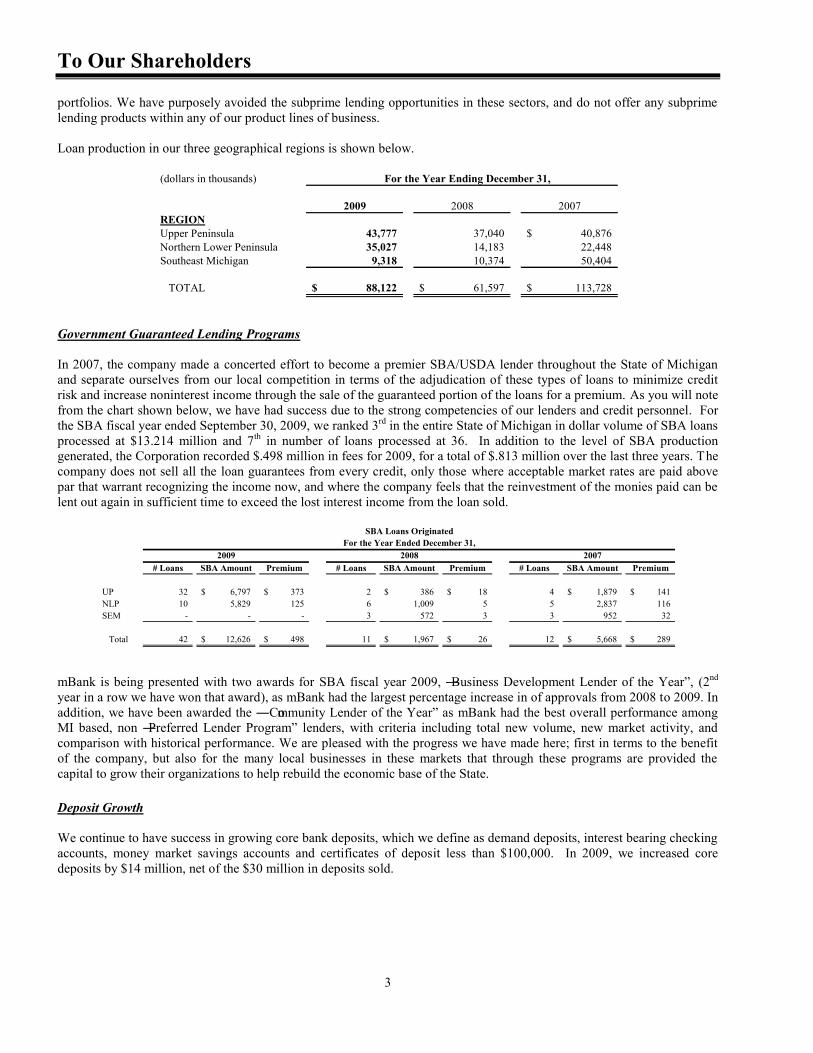
portfolios. We have purposely avoided the subprime lending opportunities in these sectors, and do not offer any subprime lending products within any of our product lines of business. Loan production in our three geographical regions is shown below.
(dollars in thousands)
2009 2008 2007REGIONUpper Peninsula 43,777 37,040 40,876$ Northern Lower Peninsula 35,027 14,183 22,448 Southeast Michigan 9,318 10,374 50,404
TOTAL 88,122$ 61,597$ 113,728$
For the Year Ending December 31,
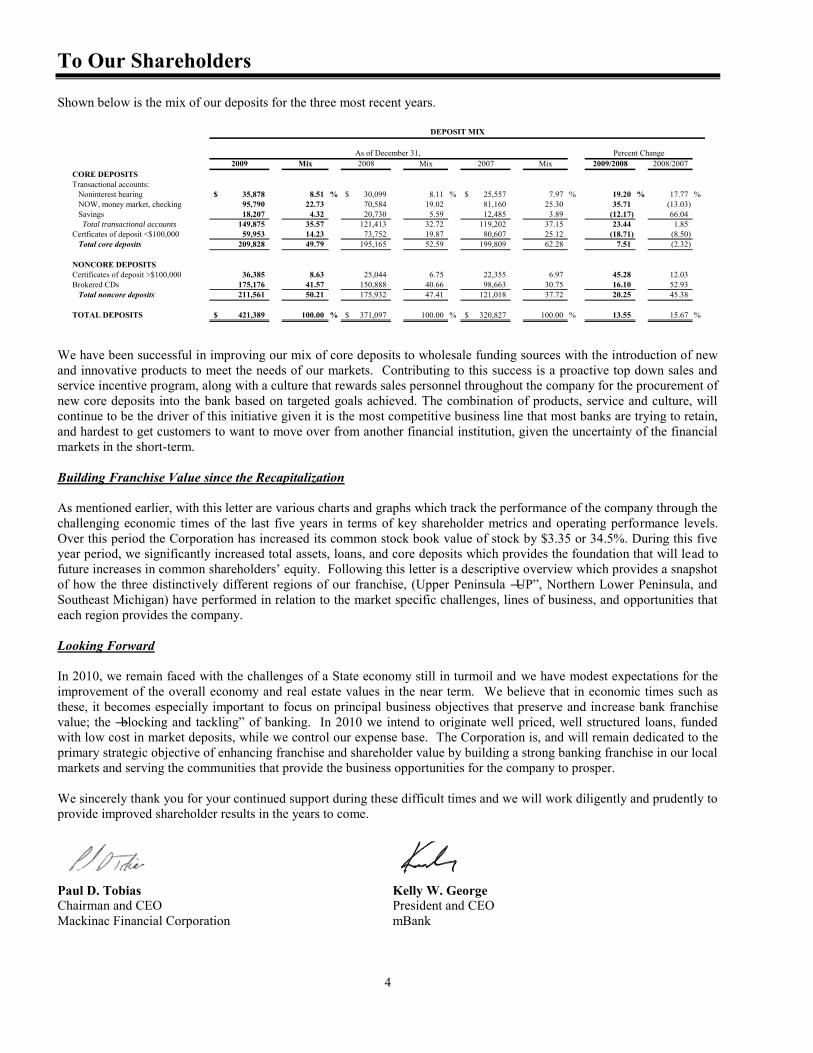
Government Guaranteed Lending Programs In 2007, the company made a concerted effort to become a premier SBA/USDA lender throughout the State of Michigan and separate ourselves from our local competition in terms of the adjudication of these types of loans to minimize credit risk and increase noninterest income through the sale of the guaranteed portion of the loans for a premium. As you will note from the chart shown below, we have had success due to the strong competencies of our lenders and credit personnel. For the SBA fiscal year ended September 30, 2009, we ranked 3rd in the entire State of Michigan in dollar volume of SBA loans processed at $13.214 million and 7th in number of loans processed at 36. In addition to the level of SBA production generated, the Corporation recorded $.498 million in fees for 2009, for a total of $.813 million over the last three years. The company does not sell all the loan guarantees from every credit, only those where acceptable market rates are paid above par that warrant recognizing the income now, and where the company feels that the reinvestment of the monies paid can be lent out again in sufficient time to exceed the lost interest income from the loan sold.
SBA Loans OriginatedFor the Year Ended December 31,
2009 2008 2007# Loans SBA Amount Premium # Loans SBA Amount Premium # Loans SBA Amount Premium
UP 32 6,797$ 373$ 2 386$ 18$ 4 1,879$ 141$ NLP 10 5,829 125 6 1,009 5 5 2,837 116 SEM - - - 3 572 3 3 952 32
Total 42 12,626$ 498$ 11 1,967$ 26$ 12 5,668$ 289$
mBank is being presented with two awards for SBA fiscal year 2009, ―Business Development Lender of the Year‖, (2nd year in a row we have won that award), as mBank had the largest percentage increase in of approvals from 2008 to 2009. In addition, we have been awarded the ―Community Lender of the Year‖ as mBank had the best overall performance among MI based, non ―Preferred Lender Program‖ lenders, with criteria including total new volume, new market activity, and comparison with historical performance. We are pleased with the progress we have made here; first in terms to the benefit of the company, but also for the many local businesses in these markets that through these programs are provided the capital to grow their organizations to help rebuild the economic base of the State. Deposit Growth We continue to have success in growing core bank deposits, which we define as demand deposits, interest bearing checking accounts, money market savings accounts and certificates of deposit less than $100,000. In 2009, we increased core deposits by $14 million, net of the $30 million in deposits sold.
To Our Shareholders
4
Shown below is the mix of our deposits for the three most recent years.
As of December 31, Percent Change2009 Mix 2008 Mix 2007 Mix 2009/2008 2008/2007
CORE DEPOSITSTransactional accounts: Noninterest bearing 35,878$ 8.51 % 30,099$ 8.11 % 25,557$ 7.97 % 19.20 % 17.77 % NOW, money market, checking 95,790 22.73 70,584 19.02 81,160 25.30 35.71 (13.03) Savings 18,207 4.32 20,730 5.59 12,485 3.89 (12.17) 66.04 Total transactional accounts 149,875 35.57 121,413 32.72 119,202 37.15 23.44 1.85 Certficates of deposit <$100,000 59,953 14.23 73,752 19.87 80,607 25.12 (18.71) (8.50) Total core deposits 209,828 49.79 195,165 52.59 199,809 62.28 7.51 (2.32)
NONCORE DEPOSITSCertificates of deposit >$100,000 36,385 8.63 25,044 6.75 22,355 6.97 45.28 12.03 Brokered CDs 175,176 41.57 150,888 40.66 98,663 30.75 16.10 52.93 Total noncore deposits 211,561 50.21 175,932 47.41 121,018 37.72 20.25 45.38
TOTAL DEPOSITS 421,389$ 100.00 % 371,097$ 100.00 % 320,827$ 100.00 % 13.55 15.67 %
DEPOSIT MIX
We have been successful in improving our mix of core deposits to wholesale funding sources with the introduction of new and innovative products to meet the needs of our markets. Contributing to this success is a proactive top down sales and service incentive program, along with a culture that rewards sales personnel throughout the company for the procurement of new core deposits into the bank based on targeted goals achieved. The combination of products, service and culture, will continue to be the driver of this initiative given it is the most competitive business line that most banks are trying to retain, and hardest to get customers to want to move over from another financial institution, given the uncertainty of the financial markets in the short-term. Building Franchise Value since the Recapitalization As mentioned earlier, with this letter are various charts and graphs which track the performance of the company through the challenging economic times of the last five years in terms of key shareholder metrics and operating performance levels. Over this period the Corporation has increased its common stock book value of stock by $3.35 or 34.5%. During this five year period, we significantly increased total assets, loans, and core deposits which provides the foundation that will lead to future increases in common shareholders’ equity. Following this letter is a descriptive overview which provides a snapshot of how the three distinctively different regions of our franchise, (Upper Peninsula ―UP‖, Northern Lower Peninsula, and Southeast Michigan) have performed in relation to the market specific challenges, lines of business, and opportunities that each region provides the company. Looking Forward In 2010, we remain faced with the challenges of a State economy still in turmoil and we have modest expectations for the improvement of the overall economy and real estate values in the near term. We believe that in economic times such as these, it becomes especially important to focus on principal business objectives that preserve and increase bank franchise value; the ―blocking and tackling‖ of banking. In 2010 we intend to originate well priced, well structured loans, funded with low cost in market deposits, while we control our expense base. The Corporation is, and will remain dedicated to the primary strategic objective of enhancing franchise and shareholder value by building a strong banking franchise in our local markets and serving the communities that provide the business opportunities for the company to prosper. We sincerely thank you for your continued support during these difficult times and we will work diligently and prudently to provide improved shareholder results in the years to come. Paul D. Tobias Kelly W. George Chairman and CEO President and CEO Mackinac Financial Corporation mBank
Five Year Overview
5
$-
$2.00
$4.00
$6.00
$8.00
$10.00
$12.00
$14.00
12/14/04 12/31/05 12/31/06 12/31/07 12/31/08 12/31/09
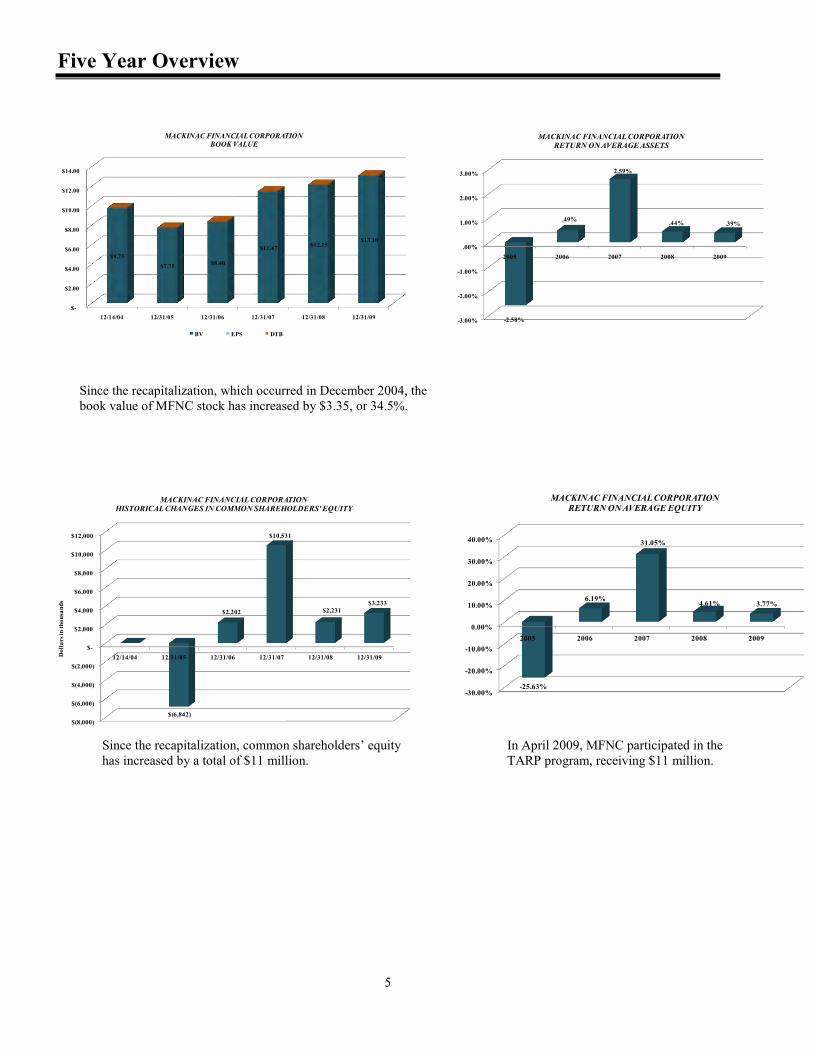
$9.75 $7.75 $8.40
$11.47 $12.15 $13.10
MACKINAC FINANCIAL CORPORATIONBOOK VALUE
BV EPS DTB
-3.00%
-2.00%
-1.00%
.00%
1.00%
2.00%
3.00%
2005 2006 2007 2008 2009
-2.58%
.49%
2.59%
.44% .39%
MACKINAC FINANCIAL CORPORATIONRETURN ON AVERAGE ASSETS
$(8,000)
$(6,000)
$(4,000)
$(2,000)
$-
$2,000
$4,000
$6,000
$8,000
$10,000
$12,000
12/14/04 12/31/05 12/31/06 12/31/07 12/31/08 12/31/09
$(6,842)
$2,202
$10,531
$2,231 $3,233
Dol
lars
in th
ousa
nds
MACKINAC FINANCIAL CORPORATIONHISTORICAL CHANGES IN COMMON SHAREHOLDERS' EQUITY
-30.00%
-20.00%
-10.00%
0.00%
10.00%
20.00%
30.00%
40.00%
2005 2006 2007 2008 2009
-25.63%
6.19%
31.05%
4.61% 3.77%
MACKINAC FINANCIAL CORPORATIONRETURN ON AVERAGE EQUITY
Since the recapitalization, which occurred in December 2004, the book value of MFNC stock has increased by $3.35, or 34.5%.
Since the recapitalization, common shareholders’ equity has increased by a total of $11 million.
In April 2009, MFNC participated in the TARP program, receiving $11 million.
Five Year Overview
6
$(3.00)
$(2.00)
$(1.00)
$-
$1.00
$2.00
$3.00
2005 2006 2007 2008 2009
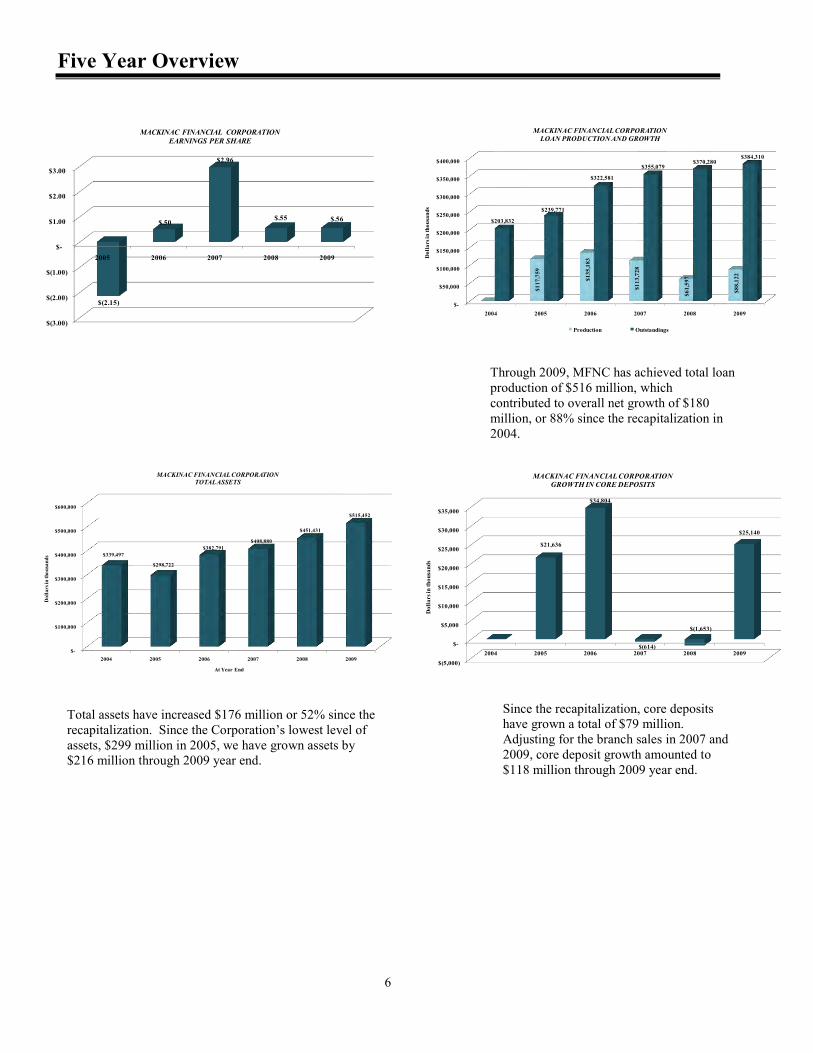
$(2.15)
$.50
$2.96
$.55 $.56
MACKINAC FINANCIAL CORPORATIONEARNINGS PER SHARE
$-
$50,000
$100,000
$150,000
$200,000
$250,000
$300,000
$350,000
$400,000
2004 2005 2006 2007 2008 2009
$117
,759
$135
,183
$113
,728
$61,
597
$88,
122
$203,832
$239,771
$322,581
$355,079 $370,280
$384,310
Dol
lars
in th
ousa
nds
MACKINAC FINANCIAL CORPORATIONLOAN PRODUCTION AND GROWTH
Production Outstandings
$-
$100,000
$200,000
$300,000
$400,000
$500,000
$600,000
2004 2005 2006 2007 2008 2009
$339,497
$298,722
$382,791 $408,880
$451,431
$515,452
Dol
lars
in th
ousa
nds
At Year End
MACKINAC FINANCIAL CORPORATIONTOTAL ASSETS
$(5,000)
$-
$5,000
$10,000
$15,000
$20,000
$25,000
$30,000
$35,000
2004 2005 2006 2007 2008 2009
$21,636
$34,804
$(614)
$(1,653)
$25,140
Dol
lars
in th
ousa
nds
MACKINAC FINANCIAL CORPORATIONGROWTH IN CORE DEPOSITS
Through 2009, MFNC has achieved total loan production of $516 million, which contributed to overall net growth of $180 million, or 88% since the recapitalization in 2004.
Total assets have increased $176 million or 52% since the recapitalization. Since the Corporation’s lowest level of assets, $299 million in 2005, we have grown assets by $216 million through 2009 year end.
Since the recapitalization, core deposits have grown a total of $79 million. Adjusting for the branch sales in 2007 and 2009, core deposit growth amounted to $118 million through 2009 year end.
Regional Review – Upper Peninsula
7
Jack C. Frost – Regional President, UP
BRANCH LOCATIONS
ESCANABA NEWBERRY
Located at Menards 414 Newberry Avenue
3300 Ludington Street Newberry, MI 49868
Escanaba, MI 49829 (906) 293-5165
(906) 233-9443 Manager: Michael A. Slaght
Manager: Scott A. Ravet
MANISTIQUE SAULT STE. MARIE
130 South Cedar Street 138 Ridge Street
Manistique, MI 49854 Sault Ste. Marie, MI 49783
(906) 341-2413 (906) 635-3992
Manager: Gregory D. Schuetter Manager: Herbert C. Maloney
MARQUETTE STEPHENSON
300 North McClellan S216 Menominee Street
Marquette, MI 49855 Stephenson, MI 49887
(906) 226-5000 (906) 753-2225
Manager: Teresa M. Same Manager: Barbara A. Parrett
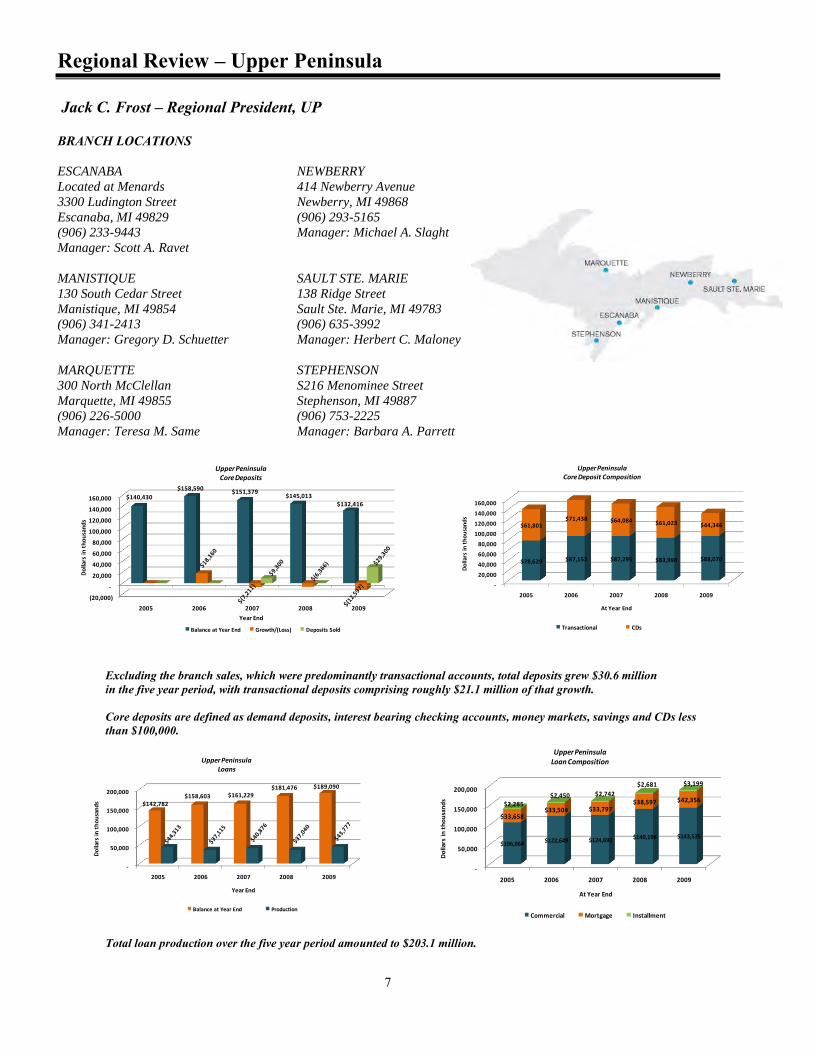
Excluding the branch sales, which were predominantly transactional accounts, total deposits grew $30.6 million in the five year period, with transactional deposits comprising roughly $21.1 million of that growth.
Core deposits are defined as demand deposits, interest bearing checking accounts, money markets, savings and CDs less than $100,000.
Total loan production over the five year period amounted to $203.1 million.
(20,000)
-
20,000
40,000
60,000
80,000
100,000
120,000
140,000
160,000
2005 2006 2007 2008 2009
$140,430
$158,590 $151,379
$145,013 $132,416
Do
llars
in
th
ou
san
ds
Year End
Upper PeninsulaCore Deposits
Balance at Year End Growth/(Loss) Deposits Sold
-
20,000
40,000
60,000
80,000
100,000
120,000
140,000
160,000
2005 2006 2007 2008 2009
$78,629 $87,152 $87,295 $83,990 $88,070
$61,801 $71,438 $64,084 $61,023 $44,346
Do
llars
in
th
ou
san
ds
At Year End
Upper PeninsulaCore Deposit Composition
Transactional CDs
-
50,000
100,000
150,000
200,000
2005 2006 2007 2008 2009
$142,782 $158,603 $161,229
$181,476 $189,090
Do
llars
in
th
ou
san
ds
Year End
Upper PeninsulaLoans
Balance at Year End Production
-
50,000
100,000
150,000
200,000
2005 2006 2007 2008 2009
$106,064 $122,649 $124,690 $140,198 $143,535
$33,658 $33,504 $33,797
$38,597 $42,356 $2,285
$2,450 $2,742
$2,681 $3,199
Do
llars
in
th
ou
san
ds
At Year End
Upper PeninsulaLoan Composition
Commercial Mortgage Installment
Regional Review – Upper Peninsula
8
MARKET COMMENTARY
In the five years since the recapitalization of mBank in December of 2004, the Bank’s Upper Peninsula (UP) has made steady progress, both in terms of growing its loan and deposit base and maneuvering through very difficult previous reputational issues as a result of the former company’s troubles. This negative publicity made it difficult to both attract new business as well as talent to the bank. However, the tarnished past is now just that, and the UP region continues to be the largest market footprint of the institution in terms of geography, branches, and loan and deposit footings. Similar to the other regions, we have implemented various new deposit and treasury management products which continue to set us ahead of our competition in terms of delivery of cutting edge technology and convenience to our customers. We have also been able to procure some talented local bankers that are deep rooted into their communities that have spurred the consistent growth of core loans and deposit accounts.
In recent years, we formulated a plan to strategically realign our branch footprint to better match our business model in the region. This has been accomplished by reallocating our personnel and capital resources into targeted ―commerce center hub‖ markets of the UP and divesting of outlier branches located in small markets with declining populations. Specifically in 2007, we sold our Ripley location which allowed the bank to divest of a longer term fixed asset issue and in 2009 we sold two additional locations in South Range and Ontonagon. The sale of the latter two locations provided a gain of approximately $1.2M to the bank. These divestitures also provided significant cost savings throughout the company and enabled management to focus on the growth and development of our remaining network. mBank also strategically reentered the Delta County Market by opening a small full service branch in the new Menards store located in Escanaba in 2009 which is the second largest business center in the UP footprint. Lastly, in 2009 we converted our banking center in Marquette Presque Isle from a full service branch operation to a Mortgage and Consumer Lending Division to provide a more centralized approach to operating this portion of the company. In doing this we were able to procure a highly talented veteran banker who had been the top residential mortgage producer in the UP for many years to oversee and grow this line of business.
Our commercial loan portfolio includes a diverse mix of industries that represents an inclusive sampling of the economic platform of the UP. These business sectors include various retail and office space in addition to professional, medical and hospitality entities which are similar to those found in the other regions of mBank. However, it is the industries that are more indigenous to the UP that add even further variety and stability to the overall risk matrix of the portfolio. Bank clients in the timber, light non-auto manufacturing and service industries have both alleviated some of the general downward fiscal pressure of the state and lessened the indirect impact of the auto industry on the overall loan portfolio. We also continue to add value to our clients with our knowledge and understanding of government guaranteed loans from the Small Business Administration (SBA) and United States Department of Agriculture. This core competency was very evident in 2009 when mBank not only led all UP institutions in number of SBA loans closed – 27 – but also in total dollar amount of SBA loans originated – $7.4 million. We are very proud of this achievement not only for the success of the organization, but also for being a catalyst for promoting economic stimulus through helping small businesses get the capital that is essential to their success, as well as the communities they operate in, within these under developed areas of the state.
Given some of the aforementioned industrial diversity, the UP economy continues to perform better than the state as a whole. Although unemployment is somewhat elevated on a normalized scale and pockets of comparatively high jobless claims remain, many of our markets are trending near historical levels. Given that it is not atypical for the unemployment rate in the UP to be higher than the remainder of the state, the experience of operating in this environment provides for a more stable economic base which seldom experiences the severe highs or lows in times of changing economic conditions. Furthermore, real estate values have experienced a very modest decrease on average in the UP markets compared to much larger decreases in the Southern part of the state. Our markets continue to see growth opportunities with the development of several successful large projects throughout the UP over the past several years including new construction as well as expansions of existing hospitals, hotels, schools, and retail centers. This steady and methodical economic progress and the ability to successfully function in a difficult national financial environment has allowed the UP region of mBank continued growth through prudent banking activities and our proactive sales and serviced based culture. We thank you for your business and for supporting mBank endeavors and look forward to continuing to serve our clients and communities in 2010.

Regional Review – Northern Lower Peninsula
9
Andrew P. Sabatine, Regional President – NLP
BRANCH LOCATIONS
GAYLORD KALEVA
1955 South Otsego Avenue 14429 Wuoksi Avenue
Gaylord, MI 49735 Kaleva, MI
(989) 732-3750 (231)362-3223
Manager: Nicole Shelters Manager: Barb J. Miller
TRAVERSE CITY
3530 North Country Drive
Traverse City, MI 49684
(231) 929-5600
Manager: Andrea Pease
Total deposit growth amounted to $24.8 million over the five year period, largely in transactional accounts.
Core deposits are defined as demand deposits, interest bearing checking accounts, money markets, savings and CDs less than $100,000.
Total loan production over the five year period amounted to $134.2 million.
(10,000)
-
10,000
20,000
30,000
40,000
50,000
60,000
70,000
2005 2006 2007 2008 2009
$37,182 $34,191 $35,160 $39,265
$62,008
Do
lla
rs i
n t
ho
usa
nd
s
Year End
Northern Lower PeninsulaCore Deposits
Balance at Year End Growth/(Loss)
-
10,000
20,000
30,000
40,000
50,000
60,000
70,000
2005 2006 2007 2008 2009
$18,144 $17,737 $21,606 $27,919
$48,003 $19,038 $16,454
$13,554 $11,346
$14,005
Do
llars
in
th
ou
san
ds
Northern Lower PeninsulaCore Deposit Composition
Transactional CDs
-
20,000
40,000
60,000
80,000
100,000
2005 2006 2007 2008 2009
$69,276 $78,371 $76,881 $78,482
$93,280
Do
lla
rs i
n t
ho
usa
nd
s
Year End
Northern Lower PeninsulaLoans
Balance at Year End Production
-
10,000
20,000
30,000
40,000
50,000
60,000
70,000
80,000
90,000
100,000
2005 2006 2007 2008 2009
$66,568 $72,869 $71,143 $70,415 $82,508
$2,609 $5,266 $5,289 $7,497
$10,041
$99
$236 $449 $570
$731
Do
llars
in
th
ou
san
ds
At Year End
Northern Lower PeninsulaLoan Composition
Commercial Mortgage Installment
Regional Review – Northern Lower Peninsula
10
MARKET COMMENTARY
Since the late 2004 recapitalization and subsequent conversion to mBank, the Northern Lower Peninsula region has experienced positive trends in both core depository and loan portfolio growth. The positive growth in both loans and deposits is a direct result of mBank refining and augmenting its products, services and staff within this region to better position itself to grow market share. As demonstrated by our historical totals, core deposit generation in the Northern Lower Peninsula region initially proved challenging due to having single, non-prime locations in the two largest and most competitive markets (Traverse City & Gaylord). However, the poorly positioned Gaylord branch was relocated in the summer of 2006 to a more visible and convenient placed bank branch through the redesign of a piece of bank owned property (REO), which has proved to be a more effective location to drive market growth. Additionally, courier service and remote deposit capabilities were added to the Traverse City & Gaylord locations in mid 2007 providing customers with convenient and electronic access to their accounts. Total deposit growth during this period for the Gaylord branch was approximately $22.7 million ($10.3 to $33 million) and approximately $19.4 million ($12.1 to $31.5 million) for the Traverse City branch, with the majority of the growth for both branches in transactional core deposit accounts. As a result of offering clients this option, it negated the need for the additional and expensive capital outlay of adding more branches while neutralizing many logistical obstacles caused by location. With regard to the aforementioned depository growth, the Smart Money Market Account was also introduced to the Northern Lower Peninsula markets in early 2009 and was a main driver of the core deposit success over the past 12 months. This account was designed as a market specific deposit alternative to enhance mBank’s existing deposit product line and better service the needs of the high balance consumer and business depositor. The resulting increase in core deposit base has been very beneficial in providing a cost effective funding source to support loan portfolio growth.
The overall increase in the loan portfolio for the Northern Lower Peninsula region is represented by steady new commercial and residential loan origination over the last five years. The industry mix in the commercial area is well diversified among business sectors ranging from tourism & hospitality to small business and various types of real estate. While the composition of the portfolio mitigates some risk, the current economic downturn and the related decline in the housing market has prompted a focus on lower risk loan structures. As a result of the challenging business environment, new commercial loan production is centered on origination of loans guaranteed under United States Small Business Administration (SBA) and United States Department of Agricultural (USDA) loan programs. These guarantees, allow us to meet our client’s needs and also provide the market with capital for economic stimulus while still significantly reducing portfolio risk.
Overall, we are satisfied with the performance of the Northern Lower Peninsula region given the general condition of the Michigan economy over the past eighteen months, and we see signs of gradual economic improvement and development throughout the region. Fortunately, the waterfront housing market and tourism related businesses in the region have not experienced as severe of a decline as other areas of the state. This is undoubtedly due to the popularity and relative affordability of the region compared to other coastal markets in the U.S. This makes the region a very competitive growth market and as a result it is anticipated that it will recover faster than others as population and industry continue to migrate from other parts of Michigan and other contiguous states. We are looking forward to another successful year with the general focus going into 2010 being on continued core deposit growth, controlled opportunistic loan growth and proactive portfolio management. If you are in the region, please stop by one of our locations and experience the mBank difference!

Regional Review – Southeast Michigan
11
Jesse A. Deering, First VP/Southeast Michigan Executive
BRANCH LOCATION
BIRMINGHAM
260 East Brown Street, Suite 300
Birmingham, MI 48009
(248) 290-5900
Manager: Elena Dritsas
Total deposit growth amounted to $22.0 million over the five year period, almost solely in transactional accounts.
Core deposits are defined as demand deposits, interest bearing checking accounts, money markets, savings and CDs less than $100,000.
Total loan production over the five year period amounted to $179.1 million.
(5,000)
-
5,000
10,000
15,000
20,000
25,000
2005 2006 2007 2008 2009
$26
$6,236
$11,904 $11,424
$22,004
Do
lla
rs i
n t
ho
usa
nd
s
Year End
Southeast MichiganCore Deposits
Balance at Year End Growth/(Loss)
-
20,000
40,000
60,000
80,000
100,000
120,000
2005 2006 2007 2008 2009
$27,713
$85,607
$116,969 $110,322 $101,940
Do
lla
rs i
n t
ho
usa
nd
s
Year End
Southeast MichiganLoans
Balance at Year End Production
-
20,000
40,000
60,000
80,000
100,000
120,000
2005 2006 2007 2008 2009
$26,083
$79,363
$110,668 $100,683 $94,072
$1,630
$6,214
$6,255 $9,587
$7,862 $30
$46 $52 $6
Do
lla
rs i
n t
ho
usa
nd
s
At Year End
Southeast MichiganLoan Composition
Commercial Mortgage Installment
-
5,000
10,000
15,000
20,000
25,000
2005 2006 2007 2008 2009
$26 $5,806
$11,665 $11,091
$21,472
$430
$239 $333
$532
Do
llars
in
th
ou
san
ds
At Year End
Southeast MichiganCore Deposit Composition
Transactional CDs
Regional Review – Southeast Michigan
12
MARKET COMMENTARY
The Southeast Michigan region of mBank opened in early 2005 and has grown to its current size through two distinctly different phases of business initiatives. With the main initial focus being asset growth through the origination of new credit facilities, the loan portfolio successfully grew to roughly $117 million over the first three years of operation. Soon after the inaugural year of existence, Oakland County added full service branch capabilities and a complete depository product line to offer our clientele. This not only allowed Southeast Michigan to provide a full banking experience, including treasury management options, to our growing portfolio of loan customers, but also allowed us to focus on providing similar personalized products and services to deposit only customers. This resulted in steady core deposit growth over the past three years with totals nearly doubling from $11 million at year end 2008 to just over $22 million at year end 2009.
However, The Southeast Michigan region of mBank also experienced challenges resulting from the inherent effects of the global economic downturn of late 2008. As a result of issues within the automotive industry and the prolonged fiscal impact of the recent recession, the financial condition of this region has negatively affected nearly all business sectors. In addition to manufacturing and other operating entities, the market for commercial real estate is seeing drastic downward pressure on lease rates caused by an increase in available space within the market. Further, with the population of this region trending downward as residents relocate in search of employment, the housing and residential development markets continue to be fundamentally weak. As a result, mBank has taken a careful credit posture in Southeast Michigan over the past eighteen months. This has allowed us to increase our level of monitoring and administration of the current loan portfolio. Given the aforementioned market trends, this is deemed as a necessary and prudent governance move at this time.
While the overall economic condition of Southeast Michigan poses challenges for us, it presents opportunities as well. Specifically, the general change in lending posture by some regional banks and their lack of desire to grow business in this particular region has allowed mBank to offer competitive loan and deposit options to strong potential customers. These customers may no longer fit their current bank’s ideal profile from an industry, geographic or relationship size standpoint. Additionally, by utilizing the programs offered through the Small Business Administration and the State of Michigan, the Southeast Michigan region has the opportunity and desire to promote loans for qualified small businesses. The involvement of the SBA and other government resources will increase the granularity of our loan portfolio. These small to midsized loans will both mitigate risk and allow controlled and systematic loan production in this Region.
While evidence of economic recovery may begin to show throughout the next twelve months, it is anticipated that 2010 will continue to be another challenging year for Metropolitan Detroit. As a result, the direction of mBank’s business activities in this region will remain focused on continued growth of core depository relationships and also the prudent underwriting and administration of new and existing loan relationships. While the internal focus will center on these initiatives, it remains the utmost importance to us to continue to provide the highest level of customer service to our clientele and do everything within our ability to meet their banking needs and expectations.
Selected Financial Highlights
13
(Dollars in Thousands, Except Per Share Data)
2009 2008(Unaudited) (Unaudited)
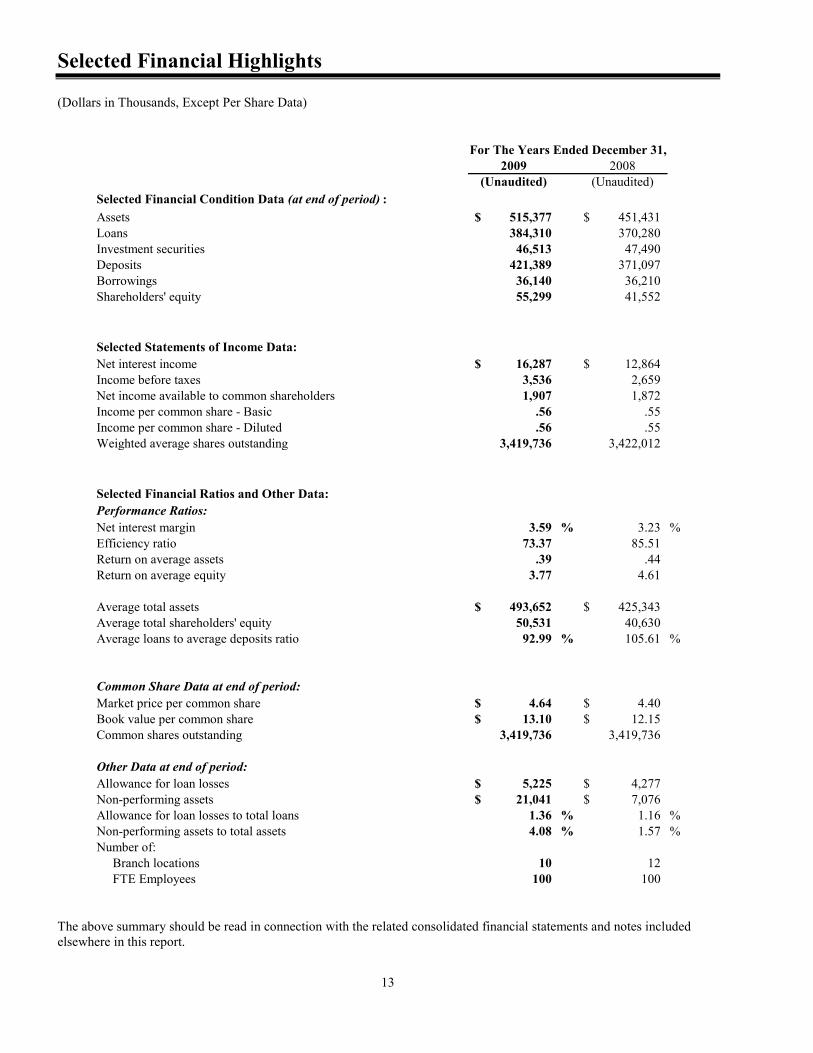
Selected Financial Condition Data (at end of period) :Assets 515,377$ 451,431$ Loans 384,310 370,280 Investment securities 46,513 47,490 Deposits 421,389 371,097 Borrowings 36,140 36,210 Shareholders' equity 55,299 41,552
Selected Statements of Income Data:Net interest income 16,287$ 12,864$ Income before taxes 3,536 2,659 Net income available to common shareholders 1,907 1,872 Income per common share - Basic .56 .55 Income per common share - Diluted .56 .55 Weighted average shares outstanding 3,419,736 3,422,012
Selected Financial Ratios and Other Data:Performance Ratios: Net interest margin 3.59 % 3.23 %Efficiency ratio 73.37 85.51 Return on average assets .39 .44 Return on average equity 3.77 4.61
Average total assets 493,652$ 425,343$ Average total shareholders' equity 50,531 40,630 Average loans to average deposits ratio 92.99 % 105.61 %
Common Share Data at end of period:Market price per common share 4.64$ 4.40$ Book value per common share 13.10$ 12.15$ Common shares outstanding 3,419,736 3,419,736
Other Data at end of period:Allowance for loan losses 5,225$ 4,277$ Non-performing assets 21,041$ 7,076$ Allowance for loan losses to total loans 1.36 % 1.16 %Non-performing assets to total assets 4.08 % 1.57 %Number of: Branch locations 10 12 FTE Employees 100 100
For The Years Ended December 31,
The above summary should be read in connection with the related consolidated financial statements and notes included elsewhere in this report.
Quarterly Financial Summary
14
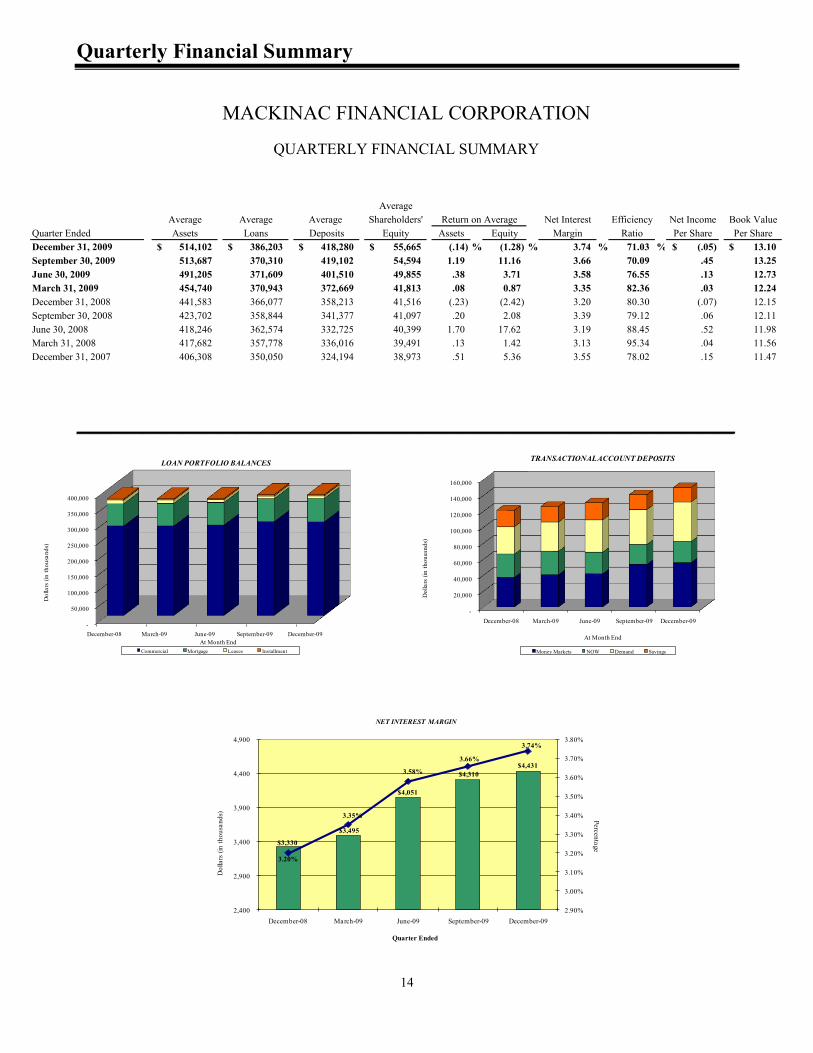
AverageAverage Average Average Shareholders' Net Interest Efficiency Net Income Book Value
Quarter Ended Assets Loans Deposits Equity Assets Equity Margin Ratio Per Share Per ShareDecember 31, 2009 514,102$ 386,203$ 418,280$ 55,665$ (.14) % (1.28) % 3.74 % 71.03 % (.05)$ 13.10$ September 30, 2009 513,687 370,310 419,102 54,594 1.19 11.16 3.66 70.09 .45 13.25 June 30, 2009 491,205 371,609 401,510 49,855 .38 3.71 3.58 76.55 .13 12.73 March 31, 2009 454,740 370,943 372,669 41,813 .08 0.87 3.35 82.36 .03 12.24 December 31, 2008 441,583 366,077 358,213 41,516 (.23) (2.42) 3.20 80.30 (.07) 12.15 September 30, 2008 423,702 358,844 341,377 41,097 .20 2.08 3.39 79.12 .06 12.11 June 30, 2008 418,246 362,574 332,725 40,399 1.70 17.62 3.19 88.45 .52 11.98 March 31, 2008 417,682 357,778 336,016 39,491 .13 1.42 3.13 95.34 .04 11.56 December 31, 2007 406,308 350,050 324,194 38,973 .51 5.36 3.55 78.02 .15 11.47
Return on Average
MACKINAC FINANCIAL CORPORATION
QUARTERLY FINANCIAL SUMMARY
___________________________________________________________________________________________________
-
50,000
100,000
150,000
200,000
250,000
300,000
350,000
400,000
December-08 March-09 June-09 September-09 December-09
Dol
lars
(in
thou
sand
s)
At Month End
LOAN PORTFOLIO BALANCES
Commercial Mortgage Leases Installment
-
20,000
40,000
60,000
80,000
100,000
120,000
140,000
160,000
December-08 March-09 June-09 September-09 December-09
Dol
lars
(in
thou
sand
s)
At Month End
TRANSACTIONAL ACCOUNT DEPOSITS
Money Markets NOW Demand Savings
$3,330
$3,495
$4,051
$4,310 $4,431
3.20%
3.35%
3.58%
3.66%
3.74%
2.90%
3.00%
3.10%
3.20%
3.30%
3.40%
3.50%
3.60%
3.70%
3.80%
2,400
2,900
3,400
3,900
4,400
4,900
December-08 March-09 June-09 September-09 December-09
PercentageD
olla
rs (i
n th
ousa
nds)
Quarter Ended
NET INTEREST MARGIN
Report of Independent Registered Public Accounting Firm
15
Report of Independent Registered Public Accounting Firm
Board of Directors
Mackinac Financial Corporation, Inc.
We have audited the consolidated statement of financial condition of Mackinac Financial Corporation,
Inc. as of December 31, 2009 and 2008 and the related consolidated statements of income, changes
in stockholders’ equity, and cash flows for each year in the three-year period ended December 31,
2009. These consolidated financial statements are the responsibility of the Company’s management.
Our responsibility is to express an opinion on these consolidated financial statements based on our
audits.
We conducted our audits in accordance with the standards of the Public Company Accounting
Oversight Board (United States). Those standards require that we plan and perform the audit to obtain
reasonable assurance about whether the financial statements are free of material misstatement. The
Company is not required to have, nor were we engaged to perform, an audit of its internal control
over financial reporting. Our audits included consideration of internal control over financial reporting
as a basis for designing audit procedures that are appropriate in the circumstances, but not for the
purpose of expressing an opinion on the effectiveness of the Company’s internal control over
financial reporting. Accordingly, we express no such opinion. An audit also includes examining, on a
test basis, evidence supporting the amounts and disclosures in the financial statements, assessing
the accounting principles used and significant estimates made by management, as well as evaluating
the overall financial statement presentation. We believe that our audits provide a reasonable basis for
our opinion.
In our opinion, the consolidated financial statements referred to above present fairly, in all material
respects, the consolidated financial position of Mackinac Financial Corporation, Inc. as of December
31, 2009 and 2008 and the consolidated results of their operations and their cash flows for each year
in the three-year period ended December 31, 2009, in conformity with accounting principles
generally accepted in the United States of America.
Auburn Hills, Michigan
March 30, 2010

Consolidated Balance Sheets
See accompanying notes to consolidated financial statements.
16
MACKINAC FINANCIAL CORPORATION AND SUBSIDIARIES
December 31, 2009 and 2008 (Dollars in Thousands)
_____________________________________________________________________________________________
December 31, December 31,2009 2008
ASSETS
Cash and due from banks 18,433$ 10,112$ Federal funds sold 27,000 - Cash and cash equivalents 45,433 10,112
Interest-bearing deposits in other financial institutions 678 582 Securities available for sale 46,513 47,490 Federal Home Loan Bank stock 3,794 3,794
Loans: Commercial 305,670 296,088 Mortgage 74,350 70,447 Installment 4,290 3,745 Total Loans 384,310 370,280 Allowance for loan losses (5,225) (4,277) Net loans 379,085 366,003
Premises and equipment 10,165 11,189 Other real estate held for sale 5,804 2,189 Other assets 23,905 10,072
TOTAL ASSETS 515,377$ 451,431$
LIABILITIES AND SHAREHOLDERS' EQUITYLiabilities: Non-interest-bearing deposits 35,878$ 30,099$ Interest-bearing deposits: NOW, Money Market, Checking 95,790 70,584 Savings 18,207 20,730 CDs<$100,000 59,953 73,752 CDs>$100,000 36,385 25,044 Brokered 175,176 150,888 Total deposits 421,389 371,097
Borrowings: Federal Home Loan Bank 35,000 35,000 Other 1,140 1,210 Total borrowings 36,140 36,210 Other liabilities 2,549 2,572 Total liabilities 460,078 409,879
Shareholders' equity: Preferred stock - No par value: Authorized 500,000 shares, 11,000 shares issued and outstanding 10,514 - Common stock and additional paid in capital - No par value Authorized - 18,000,000 shares Issued and outstanding - 3,419,736 shares 43,493 42,815 Accumulated earnings (deficit) 199 (1,708) Accumulated other comprehensive income 1,093 445
Total shareholders' equity 55,299 41,552
TOTAL LIABILITIES AND SHAREHOLDERS' EQUITY 515,377$ 451,431$

Consolidated Statements of Operations
See accompanying notes to consolidated financial statements.
17
MACKINAC FINANCIAL CORPORATION AND SUBSIDIARIES
Years Ended December 31, 2009, 2008, and 2007 (Dollars in Thousands, Except Per Share Data)
___________________________________________________________________________________________________
2009 2008 2007INTEREST INCOME: Interest and fees on loans: Taxable 20,521$ 22,555$ 26,340$ Tax-exempt 292 404 533 Interest on securities: Taxable 2,783 1,293 1,100 Tax-exempt 19 5 - Other interest income 93 305 722 Total interest income 23,708 24,562 28,695
INTEREST EXPENSE: Deposits 6,431 10,115 13,224 Borrowings 990 1,583 2,054 Total interest expense 7,421 11,698 15,278
Net interest income 16,287 12,864 13,417 Provision for loan losses 3,700 2,300 400 Net interest income after provision for loan losses 12,587 10,564 13,017
OTHER INCOME: Service fees 1,023 838 688 Net security gains 1,471 64 (1) Net gains on sale of secondary market loans 830 120 498 Proceeds from settlement of lawsuits - 3,475 470 Gain on sales of branch offices 1,208 - 5 Other 219 156 346 Total other income 4,751 4,653 2,006
OTHER EXPENSES: Salaries and employee benefits 6,583 6,886 6,757 Occupancy 1,385 1,374 1,272 Furniture and equipment 805 771 678 Data processing 862 844 785 Professional service fees 603 508 532 Loan and deposit 933 488 250 FDIC insurance premiums 839 81 35 Other 1,792 1,606 1,791 Total other expenses 13,802 12,558 12,100
Income before provision for income taxes 3,536 2,659 2,923 Provision for (benefit of) income taxes 1,120 787 (7,240) NET INCOME 2,416 1,872 10,163
Preferred dividend and accretion of discount 509 - -
NET INCOME AVAILABLE TO COMMON SHAREHOLDERS 1,907$ 1,872$ 10,163$
INCOME PER COMMON SHARE Basic .56$ .55$ 2.96$ Diluted .56$ .55$ 2.96$
For The Years Ended December 31,
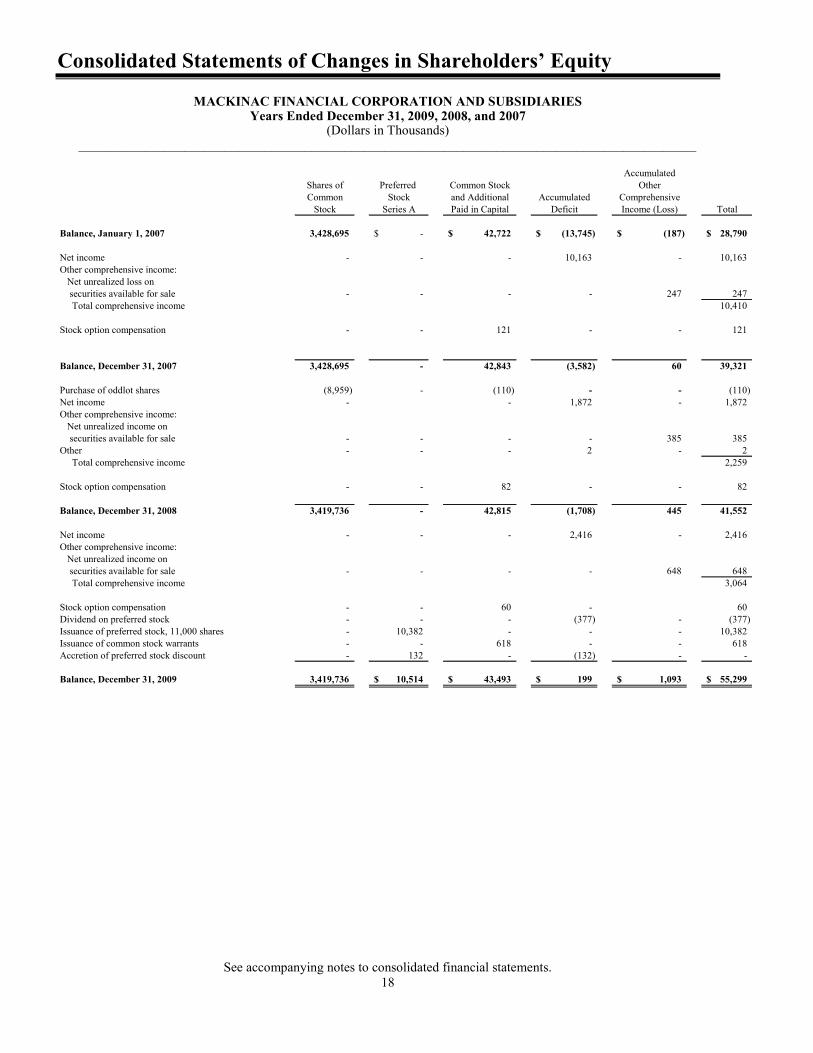
Consolidated Statements of Changes in Shareholders’ Equity
See accompanying notes to consolidated financial statements.
18
MACKINAC FINANCIAL CORPORATION AND SUBSIDIARIES
Years Ended December 31, 2009, 2008, and 2007 (Dollars in Thousands)
_____________________________________________________________________________________________
AccumulatedShares of Preferred Common Stock OtherCommon Stock and Additional Accumulated Comprehensive
Stock Series A Paid in Capital Deficit Income (Loss) Total
Balance, January 1, 2007 3,428,695 -$ 42,722$ (13,745)$ (187)$ 28,790$
Net income - - - 10,163 - 10,163 Other comprehensive income: Net unrealized loss on securities available for sale - - - - 247 247 Total comprehensive income 10,410
Stock option compensation - - 121 - - 121
Balance, December 31, 2007 3,428,695 - 42,843 (3,582) 60 39,321
Purchase of oddlot shares (8,959) - (110) - - (110) Net income - - 1,872 - 1,872 Other comprehensive income: Net unrealized income on securities available for sale - - - - 385 385 Other - - - 2 - 2 Total comprehensive income 2,259
Stock option compensation - - 82 - - 82
Balance, December 31, 2008 3,419,736 - 42,815 (1,708) 445 41,552
Net income - - - 2,416 - 2,416 Other comprehensive income: Net unrealized income on securities available for sale - - - - 648 648 Total comprehensive income 3,064
Stock option compensation - - 60 - 60 Dividend on preferred stock - - - (377) - (377) Issuance of preferred stock, 11,000 shares - 10,382 - - - 10,382 Issuance of common stock warrants - - 618 - - 618 Accretion of preferred stock discount - 132 - (132) - -
Balance, December 31, 2009 3,419,736 10,514$ 43,493$ 199$ 1,093$ 55,299$
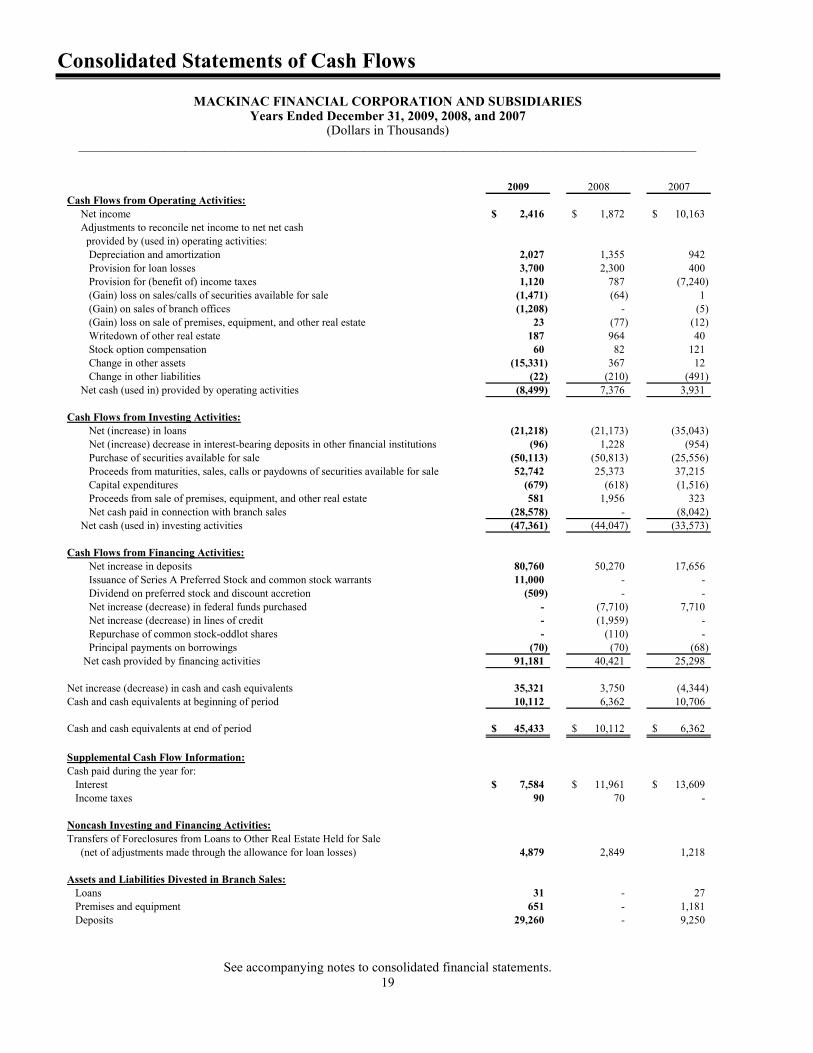
Consolidated Statements of Cash Flows
See accompanying notes to consolidated financial statements.
19
MACKINAC FINANCIAL CORPORATION AND SUBSIDIARIES
Years Ended December 31, 2009, 2008, and 2007 (Dollars in Thousands)
_____________________________________________________________________________________________
2009 2008 2007Cash Flows from Operating Activities: Net income 2,416$ 1,872$ 10,163$ Adjustments to reconcile net income to net net cash provided by (used in) operating activities: Depreciation and amortization 2,027 1,355 942 Provision for loan losses 3,700 2,300 400 Provision for (benefit of) income taxes 1,120 787 (7,240) (Gain) loss on sales/calls of securities available for sale (1,471) (64) 1 (Gain) on sales of branch offices (1,208) - (5) (Gain) loss on sale of premises, equipment, and other real estate 23 (77) (12) Writedown of other real estate 187 964 40 Stock option compensation 60 82 121 Change in other assets (15,331) 367 12 Change in other liabilities (22) (210) (491) Net cash (used in) provided by operating activities (8,499) 7,376 3,931
Cash Flows from Investing Activities: Net (increase) in loans (21,218) (21,173) (35,043) Net (increase) decrease in interest-bearing deposits in other financial institutions (96) 1,228 (954) Purchase of securities available for sale (50,113) (50,813) (25,556) Proceeds from maturities, sales, calls or paydowns of securities available for sale 52,742 25,373 37,215 Capital expenditures (679) (618) (1,516) Proceeds from sale of premises, equipment, and other real estate 581 1,956 323 Net cash paid in connection with branch sales (28,578) - (8,042) Net cash (used in) investing activities (47,361) (44,047) (33,573)
Cash Flows from Financing Activities: Net increase in deposits 80,760 50,270 17,656 Issuance of Series A Preferred Stock and common stock warrants 11,000 - - Dividend on preferred stock and discount accretion (509) - - Net increase (decrease) in federal funds purchased - (7,710) 7,710 Net increase (decrease) in lines of credit - (1,959) - Repurchase of common stock-oddlot shares - (110) - Principal payments on borrowings (70) (70) (68) Net cash provided by financing activities 91,181 40,421 25,298
Net increase (decrease) in cash and cash equivalents 35,321 3,750 (4,344) Cash and cash equivalents at beginning of period 10,112 6,362 10,706
Cash and cash equivalents at end of period 45,433$ 10,112$ 6,362$
Supplemental Cash Flow Information:Cash paid during the year for: Interest 7,584$ 11,961$ 13,609$ Income taxes 90 70 -
Noncash Investing and Financing Activities:Transfers of Foreclosures from Loans to Other Real Estate Held for Sale (net of adjustments made through the allowance for loan losses) 4,879 2,849 1,218
Assets and Liabilities Divested in Branch Sales: Loans 31 - 27 Premises and equipment 651 - 1,181 Deposits 29,260 - 9,250
Notes to the Consolidated Financial Statements
MACKINAC FINANCIAL CORPORATION AND SUBSIDIARIES
20
NOTE 1 – SUMMARY OF SIGNIFICANT ACCOUNTING POLICIES The accounting policies of Mackinac Financial Corporation (the ―Corporation‖) and Subsidiaries conform to accounting principles generally accepted in the United States and prevailing practices within the banking industry. Significant accounting policies are summarized below. Principles of Consolidation The consolidated financial statements include the accounts of the Corporation and its wholly owned subsidiaries, mBank (the ―Bank‖) and other minor subsidiaries, after elimination of intercompany transactions and accounts. Nature of Operations The Corporation’s and the Bank’s revenues and assets are derived primarily from banking activities. The Bank’s primary market area is the Upper Peninsula, the northern portion of the Lower Peninsula of Michigan, and Oakland County in Lower Michigan. The Bank provides to its customers commercial, real estate, agricultural, and consumer loans, as well as a variety of traditional deposit products. A portion, approximately 2.0%, of the Bank’s commercial loan portfolio consists of leases to commercial and governmental entities, which are secured by various types of equipment. These leases are dispersed geographically throughout the country. Less than 1.0% of the Corporation’s business activity is with Canadian customers and denominated in Canadian dollars. While the Corporation’s chief decision makers monitor the revenue streams of the various Corporation products and services, operations are managed and financial performance is evaluated on a Corporation-wide basis. Accordingly, all of the Corporation’s banking operations are considered by management to be aggregated in one reportable operating segment. Use of Estimates in Preparation of Financial Statements The preparation of financial statements in conformity with accounting principles generally accepted in the United States requires management to make estimates and assumptions that affect the reported amounts of assets and liabilities and disclosure of contingent assets and liabilities at the date of the financial statements, and the reported amounts of revenue and expenses during the period. Actual results could differ from those estimates. Material estimates that are particularly susceptible to significant change in the near term relate to the determination of the allowance for loan losses, the valuation of investment securities, the valuation of foreclosed real estate, deferred tax assets, and impairment of intangible assets. Cash and Cash Equivalents For purposes of reporting cash flows, cash and cash equivalents include cash on hand, noninterest-bearing deposits in correspondent banks, and federal funds sold. Generally, federal funds are purchased and sold for one-day periods. Securities The Corporation’s securities are classified and accounted for as securities available for sale. These securities are stated at fair value. Premiums and discounts are recognized in interest income using the interest method over the period to maturity. Unrealized holding gains and losses on securities available for sale are reported as accumulated other comprehensive income within shareholders’ equity until realized. When it is determined that securities or other investments are impaired and the impairment is other than temporary, an impairment loss is recognized in earnings and a new basis in the affected security is established. Gains and losses on the sale of securities are recorded on the trade date and determined using the specific-identification method.
Notes to the Consolidated Financial Statements
MACKINAC FINANCIAL CORPORATION AND SUBSIDIARIES
21
NOTE 1 – SUMMARY OF SIGNIFICANT ACCOUNTING POLICIES (CONTINUED) Federal Home Loan Bank Stock As a member of the Federal Home Loan Bank (FHLB) system, the Bank is required to hold stock in the FHLB based on the anticipated level of borrowings to be advanced. This stock is recorded at cost, which approximates fair value. Transfer of the stock is substantially restricted. Interest Income and Fees on Loans Interest on loans is accrued and credited to income based on the principal amount outstanding. The accrual of interest on loans is discontinued when, in the opinion of management, it is probable that the borrower may be unable to meet payments as they become due. Upon such discontinuance, all unpaid accrued interest is reversed. Loans are returned to accrual status when all principal and interest amounts contractually due are brought current and future payments are reasonably assured. Interest income on impaired and nonaccrual loans is recorded on a cash basis. Loan-origination fees and allocated costs of originating loans are deferred and recognized over the term of the loan as an adjustment to yield. Allowance for Loan Losses The allowance for loan losses includes specific allowances related to commercial loans, when they have been judged to be impaired. A loan is impaired when, based on current information, it is probable that the Corporation will not collect all amounts due in accordance with the contractual terms of the loan agreement. These specific allowances are based on discounted cash flows of expected future payments using the loan’s initial effective interest rate or the fair value of the collateral if the loan is collateral dependent. The Corporation continues to maintain a general allowance for loan losses for loans not considered impaired. The allowance for loan losses is maintained at a level which management believes is adequate to provide for possible loan losses. Management periodically evaluates the adequacy of the allowance using the Corporation’s past loan loss experience, known and inherent risks in the portfolio, composition of the portfolio, current economic conditions, and other factors. The allowance does not include the effects of expected losses related to future events or future changes in economic conditions. This evaluation is inherently subjective since it requires material estimates that may be susceptible to significant change. Loans are charged against the allowance for loan losses when management believes the collectability of the principal is unlikely. In addition, various regulatory agencies periodically review the allowance for loan losses. These agencies may require additions to the allowance for loan losses based on their judgments of collectability. In management’s opinion, the allowance for loan losses is adequate to cover probable losses relating to specifically identified loans, as well as probable losses inherent in the balance of the loan portfolio as of the balance sheet date. Other Real Estate Held for Sale Other real estate held for sale consists of assets acquired through, or in lieu of, foreclosure and other long-lived assets to be disposed of by sale, whether previously held and used or newly acquired. Other real estate held for sale is initially recorded at the lower of cost or fair value, less costs to sell, establishing a new cost basis. Valuations are periodically performed by management, and the assets’ carrying values are adjusted to the lower of cost basis or fair value less costs to sell. Impairment losses are recognized for any initial or subsequent write-downs. Net revenue and expenses from operations of other real estate held for sale are included in other expense.
Notes to the Consolidated Financial Statements
MACKINAC FINANCIAL CORPORATION AND SUBSIDIARIES
22
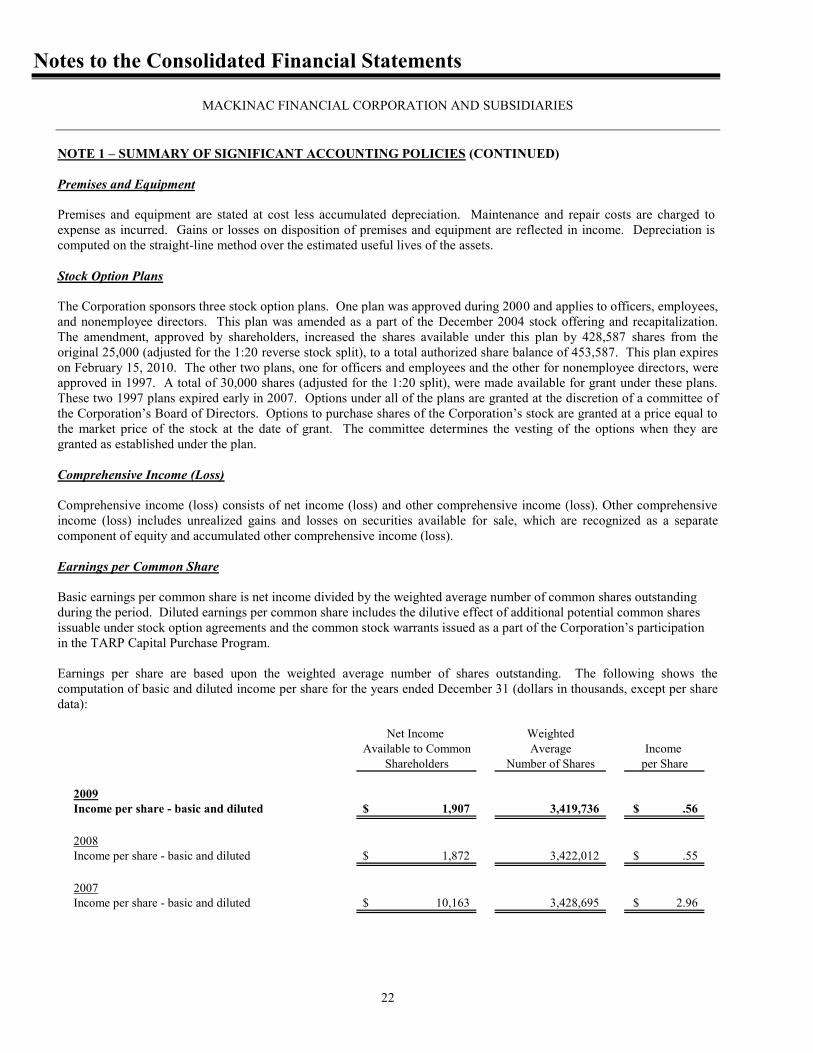
NOTE 1 – SUMMARY OF SIGNIFICANT ACCOUNTING POLICIES (CONTINUED) Premises and Equipment Premises and equipment are stated at cost less accumulated depreciation. Maintenance and repair costs are charged to expense as incurred. Gains or losses on disposition of premises and equipment are reflected in income. Depreciation is computed on the straight-line method over the estimated useful lives of the assets. Stock Option Plans The Corporation sponsors three stock option plans. One plan was approved during 2000 and applies to officers, employees, and nonemployee directors. This plan was amended as a part of the December 2004 stock offering and recapitalization. The amendment, approved by shareholders, increased the shares available under this plan by 428,587 shares from the original 25,000 (adjusted for the 1:20 reverse stock split), to a total authorized share balance of 453,587. This plan expires on February 15, 2010. The other two plans, one for officers and employees and the other for nonemployee directors, were approved in 1997. A total of 30,000 shares (adjusted for the 1:20 split), were made available for grant under these plans. These two 1997 plans expired early in 2007. Options under all of the plans are granted at the discretion of a committee of the Corporation’s Board of Directors. Options to purchase shares of the Corporation’s stock are granted at a price equal to the market price of the stock at the date of grant. The committee determines the vesting of the options when they are granted as established under the plan. Comprehensive Income (Loss) Comprehensive income (loss) consists of net income (loss) and other comprehensive income (loss). Other comprehensive income (loss) includes unrealized gains and losses on securities available for sale, which are recognized as a separate component of equity and accumulated other comprehensive income (loss). Earnings per Common Share Basic earnings per common share is net income divided by the weighted average number of common shares outstanding during the period. Diluted earnings per common share includes the dilutive effect of additional potential common shares issuable under stock option agreements and the common stock warrants issued as a part of the Corporation’s participation in the TARP Capital Purchase Program. Earnings per share are based upon the weighted average number of shares outstanding. The following shows the computation of basic and diluted income per share for the years ended December 31 (dollars in thousands, except per share data):
Net Income WeightedAvailable to Common Average Income
Shareholders Number of Shares per Share
2009Income per share - basic and diluted 1,907$ 3,419,736 .56$
2008Income per share - basic and diluted 1,872$ 3,422,012 .55$
2007Income per share - basic and diluted 10,163$ 3,428,695 2.96$
Notes to the Consolidated Financial Statements
MACKINAC FINANCIAL CORPORATION AND SUBSIDIARIES
23
NOTE 1- SUMMARY OF SIGNIFICANT ACCOUNTING POLICIES (CONTINUED) In the above disclosure the dilutive effect of additional shares outstanding, as a result of stock options and warrants exercisable, was not taken into account since the additional shares issued as a result of vested options under the Company’s option plans and common stock warrants issued under the TARP Capital Purchase Program would not have a dilutive effect on the earnings calculated per share. Income Taxes Deferred income taxes have been provided under the liability method. Deferred tax assets and liabilities are determined based upon the difference between the financial statement and tax bases of assets and liabilities as measured by the enacted tax rates which will be in effect when these differences are expected to reverse. Deferred tax expense (credit) is the result of changes in the deferred tax asset and liability. A valuation allowance is provided against deferred tax assets when it is more likely than not that some or all of the deferred asset will not be realized. In 2009, the Corporation recorded a current tax provision of $1.120 million and a current tax provision of $.787 million in 2008. The Corporation recorded a $.260 million current tax provision in the fourth quarter of 2007. In the third quarter of 2007, the Corporation reversed a portion of the valuation allowance that pertained to the deferred tax benefit of NOL and tax credit carryforwards. This valuation adjustment, $7.500 million, was recorded as a current period income tax benefit. The recognition of the deferred tax benefit in 2007 and was in accordance with generally accepted accounting principles, and considered, among other things, the probability of utilizing the NOL and credit carryforwards. Further discussion on the NOL carryforward and future benefits is presented in the ―Management’s Discussion and Analysis‖ section of this report. Off-Balance-Sheet Financial Instruments In the ordinary course of business, the Corporation has entered into off-balance-sheet financial instruments consisting of commitments to extend credit, commitments under credit card arrangements, commercial letters of credit, and standby letters of credit. For letters of credit, the Corporation recognizes a liability for the fair market value of the obligations it assumes under that guarantee. Reclassifications Certain amounts in the 2008 and 2007 consolidated financial statements have been reclassified to conform to the 2009 presentation.
NOTE 2 – RESTRICTIONS ON CASH AND CASH EQUIVALENTS
Cash and cash equivalents in the amount of $1.372 million were restricted on December 31, 2009 to meet the reserve requirements of the Federal Reserve System.
In the normal course of business, the Corporation maintains cash and due from bank balances with correspondent banks. Balances in these accounts may exceed the Federal Deposit Insurance Corporation’s insured limit of $250,000, which was increased from $100,000 under certain provisions of the Troubled Asset Relief Program (―TARP‖).
Management believes that these financial institutions have strong credit ratings and the credit risk related to these deposits is minimal.
Notes to the Consolidated Financial Statements
MACKINAC FINANCIAL CORPORATION AND SUBSIDIARIES
24
NOTE 3 – SECURITIES AVAILABLE FOR SALE
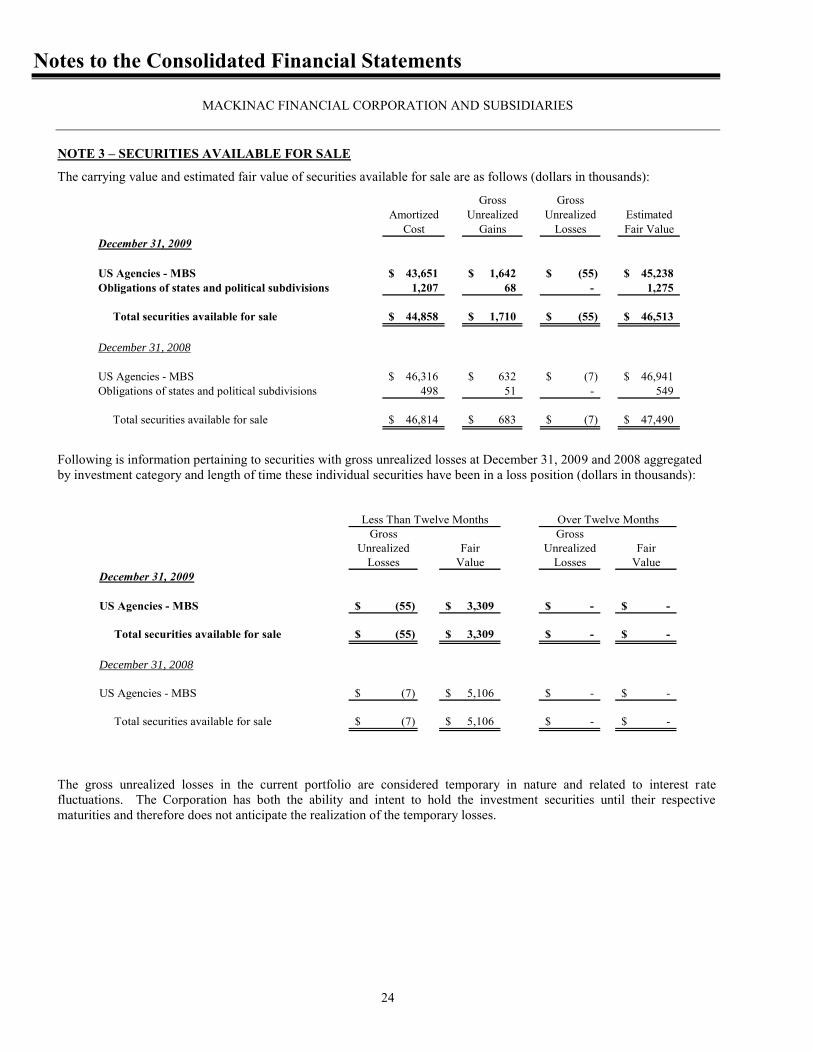
The carrying value and estimated fair value of securities available for sale are as follows (dollars in thousands):
Gross GrossAmortized Unrealized Unrealized Estimated
Cost Gains Losses Fair ValueDecember 31, 2009
US Agencies - MBS 43,651$ 1,642$ (55)$ 45,238$ Obligations of states and political subdivisions 1,207 68 - 1,275
Total securities available for sale 44,858$ 1,710$ (55)$ 46,513$
December 31, 2008
US Agencies - MBS 46,316$ 632$ (7)$ 46,941$ Obligations of states and political subdivisions 498 51 - 549
Total securities available for sale 46,814$ 683$ (7)$ 47,490$
Following is information pertaining to securities with gross unrealized losses at December 31, 2009 and 2008 aggregated by investment category and length of time these individual securities have been in a loss position (dollars in thousands):
Gross GrossUnrealized Fair Unrealized Fair
Losses Value Losses ValueDecember 31, 2009
US Agencies - MBS (55)$ 3,309$ -$ -$
Total securities available for sale (55)$ 3,309$ -$ -$
December 31, 2008
US Agencies - MBS (7)$ 5,106$ -$ -$
Total securities available for sale (7)$ 5,106$ -$ -$
Less Than Twelve Months Over Twelve Months
The gross unrealized losses in the current portfolio are considered temporary in nature and related to interest rate fluctuations. The Corporation has both the ability and intent to hold the investment securities until their respective maturities and therefore does not anticipate the realization of the temporary losses.
Notes to the Consolidated Financial Statements
MACKINAC FINANCIAL CORPORATION AND SUBSIDIARIES
25
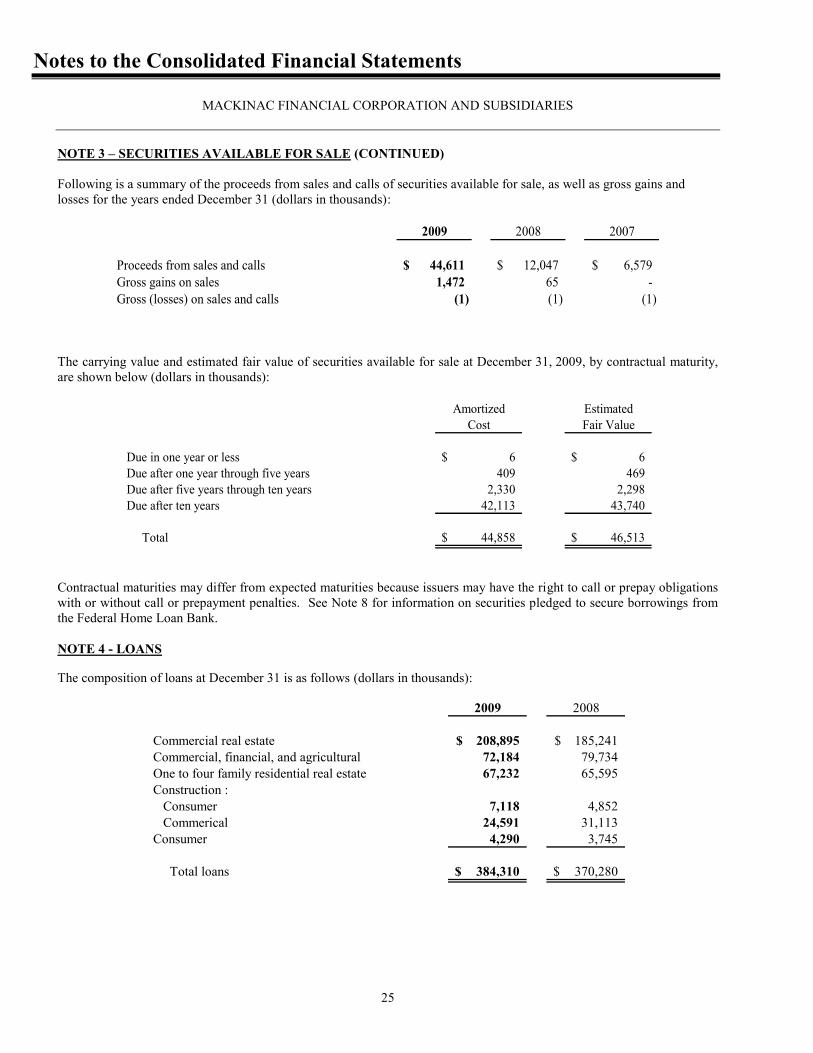
NOTE 3 – SECURITIES AVAILABLE FOR SALE (CONTINUED) Following is a summary of the proceeds from sales and calls of securities available for sale, as well as gross gains and losses for the years ended December 31 (dollars in thousands):
2009 2008 2007
Proceeds from sales and calls 44,611$ 12,047$ 6,579$ Gross gains on sales 1,472 65 - Gross (losses) on sales and calls (1) (1) (1)
The carrying value and estimated fair value of securities available for sale at December 31, 2009, by contractual maturity, are shown below (dollars in thousands):
Amortized EstimatedCost Fair Value
Due in one year or less 6$ 6$ Due after one year through five years 409 469 Due after five years through ten years 2,330 2,298 Due after ten years 42,113 43,740
Total 44,858$ 46,513$
Contractual maturities may differ from expected maturities because issuers may have the right to call or prepay obligations with or without call or prepayment penalties. See Note 8 for information on securities pledged to secure borrowings from the Federal Home Loan Bank. NOTE 4 - LOANS
The composition of loans at December 31 is as follows (dollars in thousands):
2009 2008
Commercial real estate 208,895$ 185,241$ Commercial, financial, and agricultural 72,184 79,734 One to four family residential real estate 67,232 65,595 Construction : Consumer 7,118 4,852 Commerical 24,591 31,113 Consumer 4,290 3,745
Total loans 384,310$ 370,280$
Notes to the Consolidated Financial Statements
MACKINAC FINANCIAL CORPORATION AND SUBSIDIARIES
26
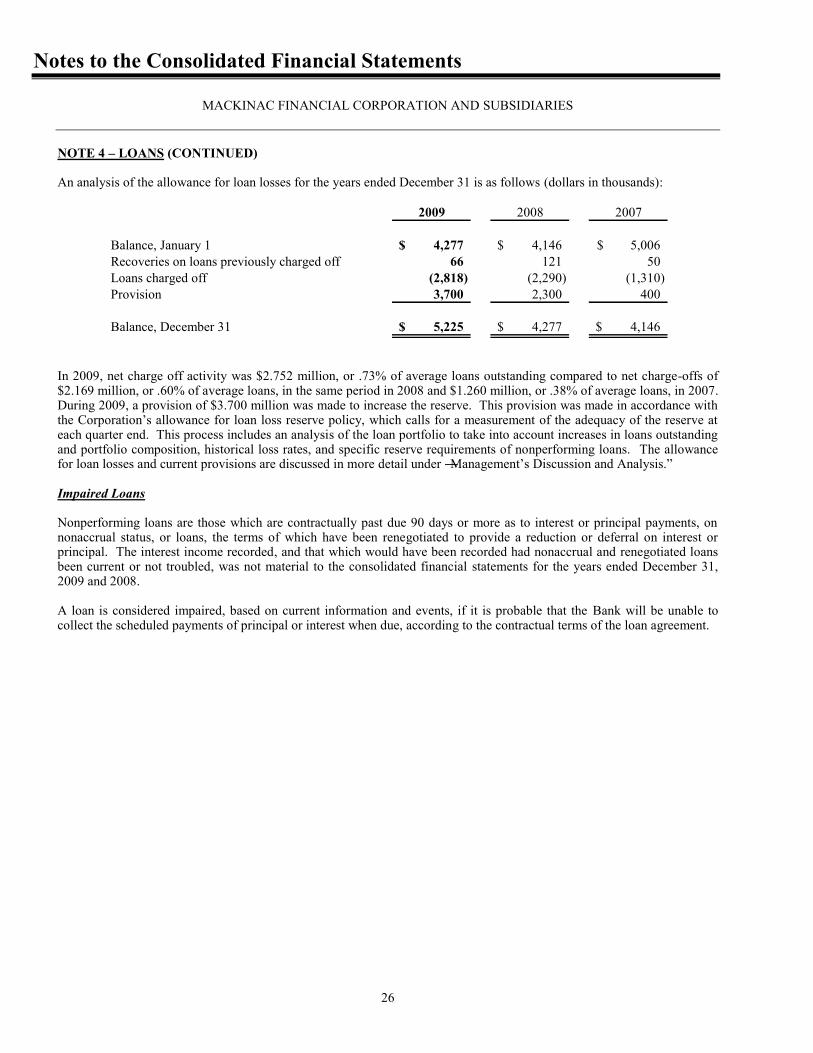
NOTE 4 – LOANS (CONTINUED) An analysis of the allowance for loan losses for the years ended December 31 is as follows (dollars in thousands):
2009 2008 2007
Balance, January 1 4,277$ 4,146$ 5,006$ Recoveries on loans previously charged off 66 121 50 Loans charged off (2,818) (2,290) (1,310) Provision 3,700 2,300 400
Balance, December 31 5,225$ 4,277$ 4,146$
In 2009, net charge off activity was $2.752 million, or .73% of average loans outstanding compared to net charge-offs of $2.169 million, or .60% of average loans, in the same period in 2008 and $1.260 million, or .38% of average loans, in 2007. During 2009, a provision of $3.700 million was made to increase the reserve. This provision was made in accordance with the Corporation’s allowance for loan loss reserve policy, which calls for a measurement of the adequacy of the reserve at each quarter end. This process includes an analysis of the loan portfolio to take into account increases in loans outstanding and portfolio composition, historical loss rates, and specific reserve requirements of nonperforming loans. The allowance for loan losses and current provisions are discussed in more detail under ―Management’s Discussion and Analysis.‖ Impaired Loans Nonperforming loans are those which are contractually past due 90 days or more as to interest or principal payments, on nonaccrual status, or loans, the terms of which have been renegotiated to provide a reduction or deferral on interest or principal. The interest income recorded, and that which would have been recorded had nonaccrual and renegotiated loans been current or not troubled, was not material to the consolidated financial statements for the years ended December 31, 2009 and 2008. A loan is considered impaired, based on current information and events, if it is probable that the Bank will be unable to collect the scheduled payments of principal or interest when due, according to the contractual terms of the loan agreement.
Notes to the Consolidated Financial Statements
MACKINAC FINANCIAL CORPORATION AND SUBSIDIARIES
27
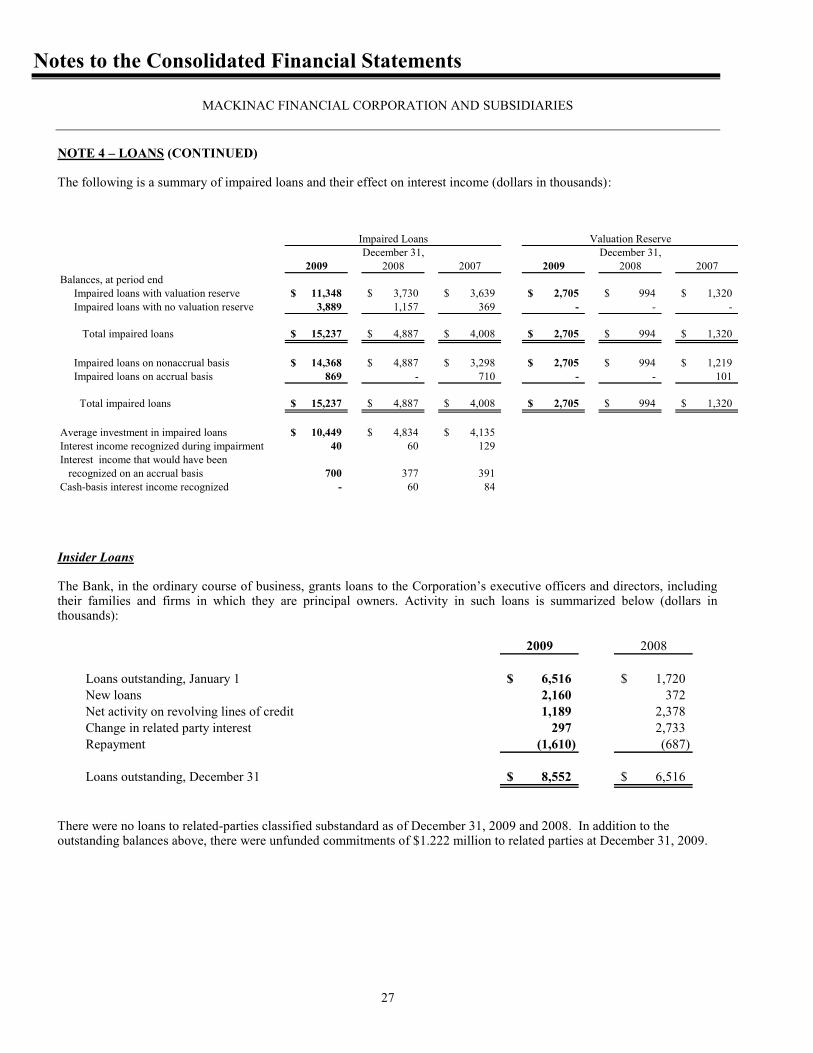
NOTE 4 – LOANS (CONTINUED) The following is a summary of impaired loans and their effect on interest income (dollars in thousands):
2009 2008 2007 2009 2008 2007
Impaired loans with valuation reserve 11,348$ 3,730$ 3,639$ 2,705$ 994$ 1,320$ Impaired loans with no valuation reserve 3,889 1,157 369 - - -
Total impaired loans 15,237$ 4,887$ 4,008$ 2,705$ 994$ 1,320$
Impaired loans on nonaccrual basis 14,368$ 4,887$ 3,298$ 2,705$ 994$ 1,219$ Impaired loans on accrual basis 869 - 710 - - 101
Total impaired loans 15,237$ 4,887$ 4,008$ 2,705$ 994$ 1,320$
10,449$ 4,834$ 4,135$ 40 60 129
recognized on an accrual basis 700 377 391 - 60 84
Impaired Loans Valuation Reserve
Interest income recognized during impairmentInterest income that would have been
Balances, at period end
Cash-basis interest income recognized
Average investment in impaired loans
December 31, December 31,
Insider Loans The Bank, in the ordinary course of business, grants loans to the Corporation’s executive officers and directors, including their families and firms in which they are principal owners. Activity in such loans is summarized below (dollars in thousands):
2009 2008
Loans outstanding, January 1 6,516$ 1,720$ New loans 2,160 372 Net activity on revolving lines of credit 1,189 2,378 Change in related party interest 297 2,733 Repayment (1,610) (687)
Loans outstanding, December 31 8,552$ 6,516$
There were no loans to related-parties classified substandard as of December 31, 2009 and 2008. In addition to the outstanding balances above, there were unfunded commitments of $1.222 million to related parties at December 31, 2009.

Notes to the Consolidated Financial Statements
MACKINAC FINANCIAL CORPORATION AND SUBSIDIARIES
28
NOTE 5 – PREMISES AND EQUIPMENT Details of premises and equipment at December 31 are as follows (dollars in thousands):
2009 2008
Land 1,811$ 2,042$ Buildings and improvements 11,816 12,545 Furniture, fixtures, and equipment 4,346 4,261 Construction in progress 84 70 Total cost basis 18,057 18,918 Less - accumulated depreciation 7,892 7,729
Net book value 10,165$ 11,189$
The construction in progress at the end of 2009 pertains to ATM installation at a branch location, improvements to an existing branch location, and costs associated with the establishment of a new branch location. In August 2009, the Bank sold its Ontonagon and South Range branch offices, with deposits of approximately $29.300 million, premises and equipment with a net book value of $.600 million, and loans totaling approximately $31,000. Depreciation of premises and equipment charged to operating expenses amounted to $1.050 million in 2009, $1.035 million in 2008, and $.891 million in 2007. NOTE 6 – OTHER REAL ESTATE HELD FOR SALE An analysis of other real estate held for sale for the years ended December 31 is as follows (dollars in thousands):
2009 2008
Balance, January 1 2,189$ 1,226$ Other real estate transferred from loans due to foreclosure 4,879 2,849 Reclassification of redemption ORE (475) - Other real estate sold / written down (768) (1,886) Loss on ORE (21) -
Balance, December 31 5,804$ 2,189$

Notes to the Consolidated Financial Statements
MACKINAC FINANCIAL CORPORATION AND SUBSIDIARIES
29
NOTE 7 – DEPOSITS The distribution of deposits at December 31 is as follows (dollars in thousands):
2009 2008
Noninterest bearing 35,878$ 30,099$ NOW, money market, checking 95,790 70,584 Savings 18,207 20,730 CDs <$100,000 59,953 73,752 CDs >$100,000 36,385 25,044 Brokered 175,176 150,888
Total deposits 421,389$ 371,097$
Maturities of non-brokered time deposits outstanding at December 31, 2009, are as follows (dollars in thousands):
2010 76,257$ 2011 11,551 2012 5,457 2013 2,133 2014 374 Thereafter 566
Total 96,338$
Brokered deposits of $101.708 million mature in 2010, $70.739 million mature in 2011, and $2.729 million matures thereafter. NOTE 8 – FEDERAL HOME LOAN BANK BORROWINGS Federal Home Loan Bank borrowings consist of the following at December 31 (dollars in thousands):
2009 2008
Federal Home Loan Bank fixed rate advances at rates ranging from 4.98% to 5.16% 15,000$ 15,000$ maturing in 2010Federal Home Loan Bank variable rate advances at rates ranging from .298% to .304% maturing in 2011 20,000 20,000
35,000$ 35,000$
The Federal Home Loan Bank borrowings are collateralized at December 31, 2009 by the following: a collateral agreement on the Corporation’s one to four family residential real estate loans with a book value of approximately $29.275 million; mortgage related and municipal securities with an amortized cost and estimated fair value of $16.224 million and $17.077 million, respectively; and Federal Home Loan Bank stock owned by the Bank totaling $3.794 million. Prepayment of the remaining advances is subject to the provisions and conditions of the credit policy of the Federal Home Loan Bank of Indianapolis in effect as of December 31, 2009.
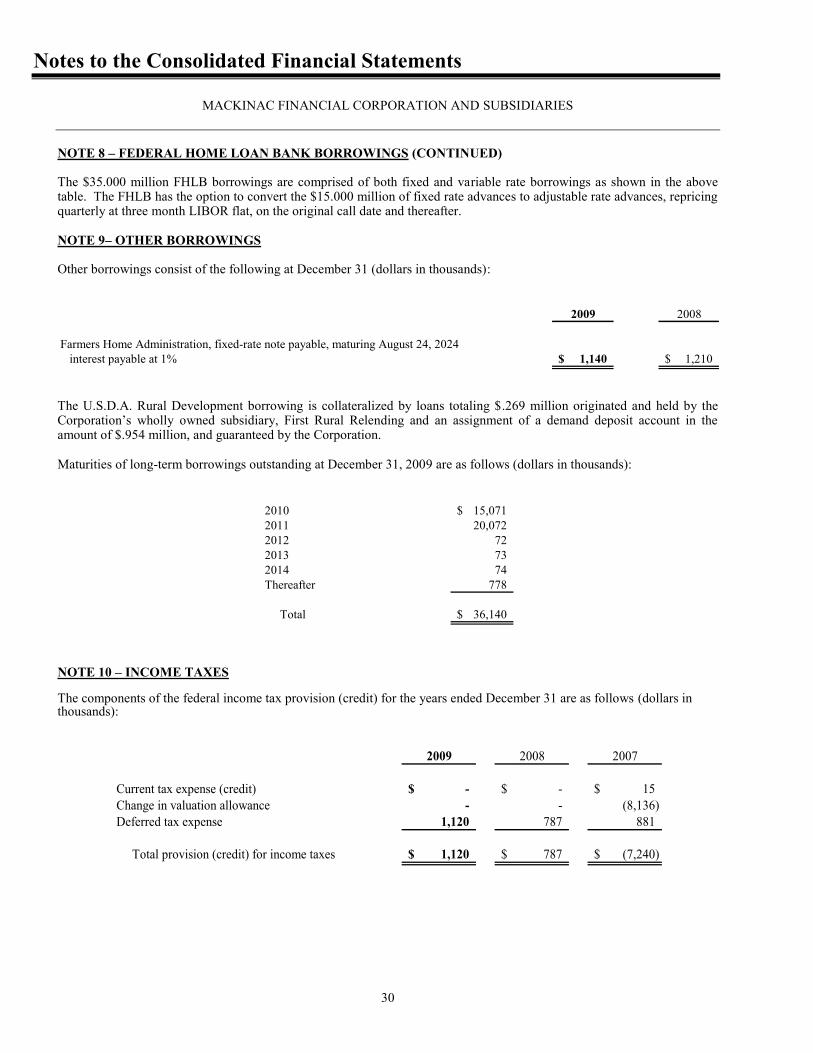
Notes to the Consolidated Financial Statements
MACKINAC FINANCIAL CORPORATION AND SUBSIDIARIES
30
NOTE 8 – FEDERAL HOME LOAN BANK BORROWINGS (CONTINUED) The $35.000 million FHLB borrowings are comprised of both fixed and variable rate borrowings as shown in the above table. The FHLB has the option to convert the $15.000 million of fixed rate advances to adjustable rate advances, repricing quarterly at three month LIBOR flat, on the original call date and thereafter. NOTE 9– OTHER BORROWINGS Other borrowings consist of the following at December 31 (dollars in thousands):
2009 2008
Farmers Home Administration, fixed-rate note payable, maturing August 24, 2024 interest payable at 1% 1,140$ 1,210$
The U.S.D.A. Rural Development borrowing is collateralized by loans totaling $.269 million originated and held by the Corporation’s wholly owned subsidiary, First Rural Relending and an assignment of a demand deposit account in the amount of $.954 million, and guaranteed by the Corporation. Maturities of long-term borrowings outstanding at December 31, 2009 are as follows (dollars in thousands):
2010 15,071$ 2011 20,072 2012 72 2013 73 2014 74 Thereafter 778
Total 36,140$
NOTE 10 – INCOME TAXES The components of the federal income tax provision (credit) for the years ended December 31 are as follows (dollars in thousands):
2009 2008 2007
Current tax expense (credit) -$ -$ 15$ Change in valuation allowance - - (8,136) Deferred tax expense 1,120 787 881
Total provision (credit) for income taxes 1,120$ 787$ (7,240)$
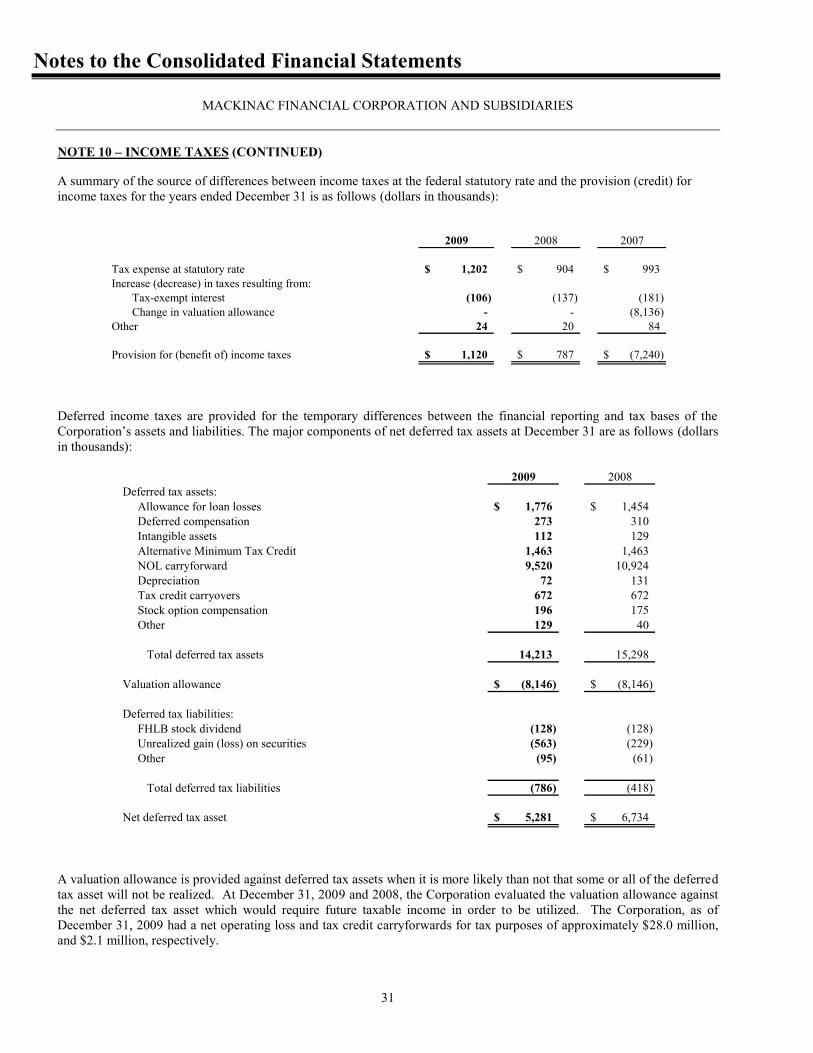
Notes to the Consolidated Financial Statements
MACKINAC FINANCIAL CORPORATION AND SUBSIDIARIES
31
NOTE 10 – INCOME TAXES (CONTINUED)
A summary of the source of differences between income taxes at the federal statutory rate and the provision (credit) for income taxes for the years ended December 31 is as follows (dollars in thousands):
2009 2008 2007
Tax expense at statutory rate 1,202$ 904$ 993$ Increase (decrease) in taxes resulting from: Tax-exempt interest (106) (137) (181) Change in valuation allowance - - (8,136) Other 24 20 84
Provision for (benefit of) income taxes 1,120$ 787$ (7,240)$
Deferred income taxes are provided for the temporary differences between the financial reporting and tax bases of the Corporation’s assets and liabilities. The major components of net deferred tax assets at December 31 are as follows (dollars in thousands):
2009 2008Deferred tax assets: Allowance for loan losses 1,776$ 1,454$ Deferred compensation 273 310 Intangible assets 112 129 Alternative Minimum Tax Credit 1,463 1,463 NOL carryforward 9,520 10,924 Depreciation 72 131 Tax credit carryovers 672 672 Stock option compensation 196 175 Other 129 40
Total deferred tax assets 14,213 15,298
Valuation allowance (8,146)$ (8,146)$
Deferred tax liabilities: FHLB stock dividend (128) (128) Unrealized gain (loss) on securities (563) (229) Other (95) (61)
Total deferred tax liabilities (786) (418)
Net deferred tax asset 5,281$ 6,734$
A valuation allowance is provided against deferred tax assets when it is more likely than not that some or all of the deferred tax asset will not be realized. At December 31, 2009 and 2008, the Corporation evaluated the valuation allowance against the net deferred tax asset which would require future taxable income in order to be utilized. The Corporation, as of December 31, 2009 had a net operating loss and tax credit carryforwards for tax purposes of approximately $28.0 million, and $2.1 million, respectively.
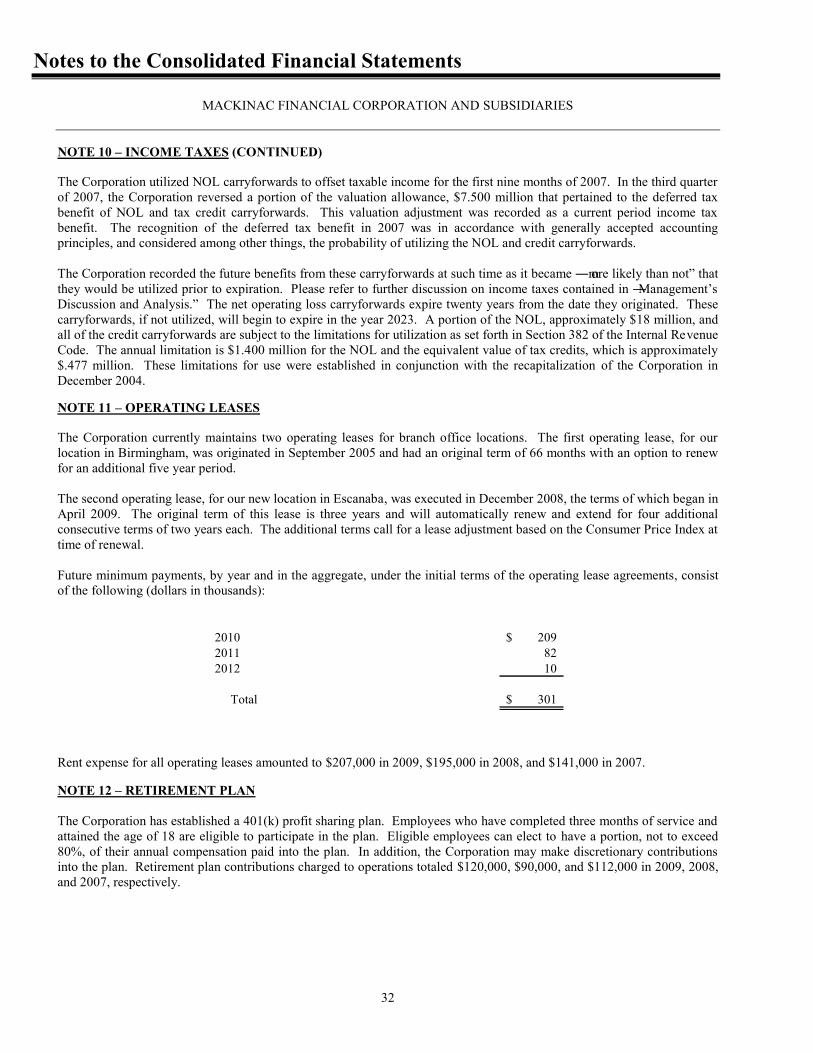
Notes to the Consolidated Financial Statements
MACKINAC FINANCIAL CORPORATION AND SUBSIDIARIES
32
NOTE 10 – INCOME TAXES (CONTINUED) The Corporation utilized NOL carryforwards to offset taxable income for the first nine months of 2007. In the third quarter of 2007, the Corporation reversed a portion of the valuation allowance, $7.500 million that pertained to the deferred tax benefit of NOL and tax credit carryforwards. This valuation adjustment was recorded as a current period income tax benefit. The recognition of the deferred tax benefit in 2007 was in accordance with generally accepted accounting principles, and considered among other things, the probability of utilizing the NOL and credit carryforwards. The Corporation recorded the future benefits from these carryforwards at such time as it became ―more likely than not‖ that they would be utilized prior to expiration. Please refer to further discussion on income taxes contained in ―Management’s Discussion and Analysis.‖ The net operating loss carryforwards expire twenty years from the date they originated. These carryforwards, if not utilized, will begin to expire in the year 2023. A portion of the NOL, approximately $18 million, and all of the credit carryforwards are subject to the limitations for utilization as set forth in Section 382 of the Internal Revenue Code. The annual limitation is $1.400 million for the NOL and the equivalent value of tax credits, which is approximately $.477 million. These limitations for use were established in conjunction with the recapitalization of the Corporation in December 2004. NOTE 11 – OPERATING LEASES The Corporation currently maintains two operating leases for branch office locations. The first operating lease, for our location in Birmingham, was originated in September 2005 and had an original term of 66 months with an option to renew for an additional five year period. The second operating lease, for our new location in Escanaba, was executed in December 2008, the terms of which began in April 2009. The original term of this lease is three years and will automatically renew and extend for four additional consecutive terms of two years each. The additional terms call for a lease adjustment based on the Consumer Price Index at time of renewal. Future minimum payments, by year and in the aggregate, under the initial terms of the operating lease agreements, consist of the following (dollars in thousands):
2010 209$ 2011 82 2012 10
Total 301$
Rent expense for all operating leases amounted to $207,000 in 2009, $195,000 in 2008, and $141,000 in 2007. NOTE 12 – RETIREMENT PLAN The Corporation has established a 401(k) profit sharing plan. Employees who have completed three months of service and attained the age of 18 are eligible to participate in the plan. Eligible employees can elect to have a portion, not to exceed 80%, of their annual compensation paid into the plan. In addition, the Corporation may make discretionary contributions into the plan. Retirement plan contributions charged to operations totaled $120,000, $90,000, and $112,000 in 2009, 2008, and 2007, respectively.
Notes to the Consolidated Financial Statements
MACKINAC FINANCIAL CORPORATION AND SUBSIDIARIES
33
NOTE 13 – DEFERRED COMPENSATION PLAN As an incentive to retain key members of management and directors, the Corporation established a deferred compensation plan, with benefits based on the number of years the individuals have served the Corporation. This plan was discontinued and no longer applies to current officers and directors. A liability was recorded on a present value basis and discounted using the rates in effect at the time the deferred compensation agreement was entered into. The liability may change depending upon changes in long-term interest rates. The liability at December 31, 2009 and 2008, for vested benefits under this plan, was $.815 million and $.912 million respectively. These benefits were originally contracted to be paid over a ten to fifteen-year period. The final payment is scheduled to occur in 2023. The deferred compensation plan is unfunded; however, the Bank maintains life insurance policies on the majority of the plan participants. The cash surrender value of the policies was $1.464 million and $1.384 million at December 31, 2009 and 2008, respectively. Deferred compensation expense for the plan was $72,000, $84,000, and $90,000 for 2009, 2008, and 2007 respectively. NOTE 14 – REGULATORY MATTERS The Corporation is subject to various regulatory capital requirements administered by the federal banking agencies. Failure to meet minimum capital requirements can initiate certain mandatory—and possibly additional discretionary—actions by regulators that, if undertaken, could have a direct material effect on the Corporation’s consolidated financial statements. Under capital adequacy guidelines and the regulatory framework for prompt corrective action, the Corporation must meet specific capital guidelines that involve quantitative measures of the Corporation’s assets, liabilities, and certain off-balance-sheet items as calculated under regulatory accounting practices. The Corporation’s capital amounts and classification are also subject to qualitative judgments by the regulators about components, risk weightings, and other factors.
Quantitative measures established by regulation to ensure capital adequacy require the Corporation to maintain minimum amounts and ratios (set forth in the table below) of total and Tier 1 capital to risk-weighted assets and of Tier 1 capital to average assets. Management has determined that, as of December 31, 2009, the Corporation is well capitalized. To be categorized as well capitalized, the Bank must maintain minimum total risk-based, Tier 1 risk-based, and Tier 1 leverage ratios as set forth in the table. In addition, federal banking regulators have established capital classifications beyond the minimum requirements in order to risk-rate deposit insurance premiums and to provide trigger points for prompt corrective action.
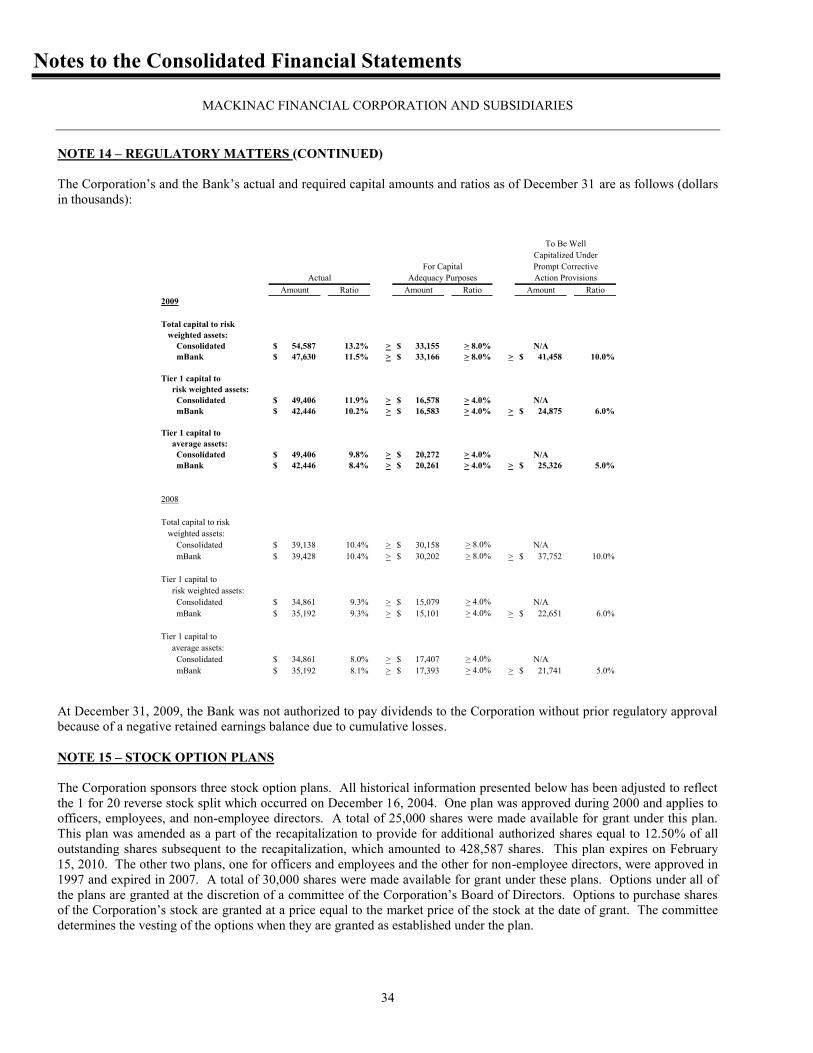
Notes to the Consolidated Financial Statements
MACKINAC FINANCIAL CORPORATION AND SUBSIDIARIES
34
NOTE 14 – REGULATORY MATTERS (CONTINUED) The Corporation’s and the Bank’s actual and required capital amounts and ratios as of December 31 are as follows (dollars in thousands):
To Be WellCapitalized Under
For Capital Prompt CorrectiveActual Adequacy Purposes Action Provisions
Amount Ratio Amount Ratio Amount Ratio2009
Total capital to risk weighted assets: Consolidated 54,587$ 13.2% > 33,155$ > 8.0% N/A mBank 47,630$ 11.5% > 33,166$ > 8.0% > 41,458$ 10.0%
Tier 1 capital to risk weighted assets: Consolidated 49,406$ 11.9% > 16,578$ > 4.0% N/A mBank 42,446$ 10.2% > 16,583$ > 4.0% > 24,875$ 6.0%
Tier 1 capital to average assets: Consolidated 49,406$ 9.8% > 20,272$ > 4.0% N/A mBank 42,446$ 8.4% > 20,261$ > 4.0% > 25,326$ 5.0%
2008
Total capital to risk weighted assets: Consolidated 39,138$ 10.4% > 30,158$ > 8.0% N/A mBank 39,428$ 10.4% > 30,202$ > 8.0% > 37,752$ 10.0%
Tier 1 capital to risk weighted assets: Consolidated 34,861$ 9.3% > 15,079$ > 4.0% N/A mBank 35,192$ 9.3% > 15,101$ > 4.0% > 22,651$ 6.0%
Tier 1 capital to average assets: Consolidated 34,861$ 8.0% > 17,407$ > 4.0% N/A mBank 35,192$ 8.1% > 17,393$ > 4.0% > 21,741$ 5.0%
At December 31, 2009, the Bank was not authorized to pay dividends to the Corporation without prior regulatory approval because of a negative retained earnings balance due to cumulative losses. NOTE 15 – STOCK OPTION PLANS The Corporation sponsors three stock option plans. All historical information presented below has been adjusted to reflect the 1 for 20 reverse stock split which occurred on December 16, 2004. One plan was approved during 2000 and applies to officers, employees, and non-employee directors. A total of 25,000 shares were made available for grant under this plan. This plan was amended as a part of the recapitalization to provide for additional authorized shares equal to 12.50% of all outstanding shares subsequent to the recapitalization, which amounted to 428,587 shares. This plan expires on February 15, 2010. The other two plans, one for officers and employees and the other for non-employee directors, were approved in 1997 and expired in 2007. A total of 30,000 shares were made available for grant under these plans. Options under all of the plans are granted at the discretion of a committee of the Corporation’s Board of Directors. Options to purchase shares of the Corporation’s stock are granted at a price equal to the market price of the stock at the date of grant. The committee determines the vesting of the options when they are granted as established under the plan.
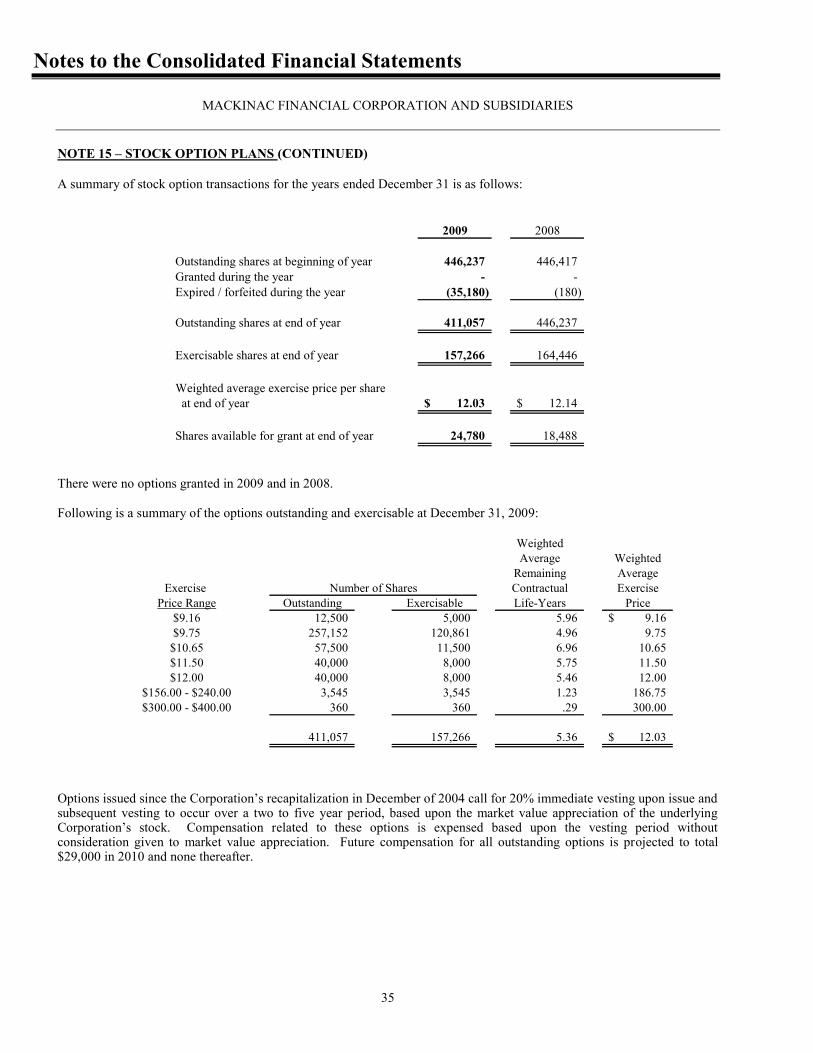
Notes to the Consolidated Financial Statements
MACKINAC FINANCIAL CORPORATION AND SUBSIDIARIES
35
NOTE 15 – STOCK OPTION PLANS (CONTINUED) A summary of stock option transactions for the years ended December 31 is as follows:
2009 2008
Outstanding shares at beginning of year 446,237 446,417 Granted during the year - - Expired / forfeited during the year (35,180) (180)
Outstanding shares at end of year 411,057 446,237
Exercisable shares at end of year 157,266 164,446
Weighted average exercise price per share at end of year 12.03$ 12.14$
Shares available for grant at end of year 24,780 18,488
There were no options granted in 2009 and in 2008. Following is a summary of the options outstanding and exercisable at December 31, 2009:
WeightedAverage Weighted
Remaining AverageExercise Contractual Exercise
Price Range Outstanding Exercisable Life-Years Price$9.16 12,500 5,000 5.96 9.16$ $9.75 257,152 120,861 4.96 9.75
$10.65 57,500 11,500 6.96 10.65 $11.50 40,000 8,000 5.75 11.50 $12.00 40,000 8,000 5.46 12.00
$156.00 - $240.00 3,545 3,545 1.23 186.75 $300.00 - $400.00 360 360 .29 300.00
411,057 157,266 5.36 12.03$
Number of Shares
Options issued since the Corporation’s recapitalization in December of 2004 call for 20% immediate vesting upon issue and subsequent vesting to occur over a two to five year period, based upon the market value appreciation of the underlying Corporation’s stock. Compensation related to these options is expensed based upon the vesting period without consideration given to market value appreciation. Future compensation for all outstanding options is projected to total $29,000 in 2010 and none thereafter.
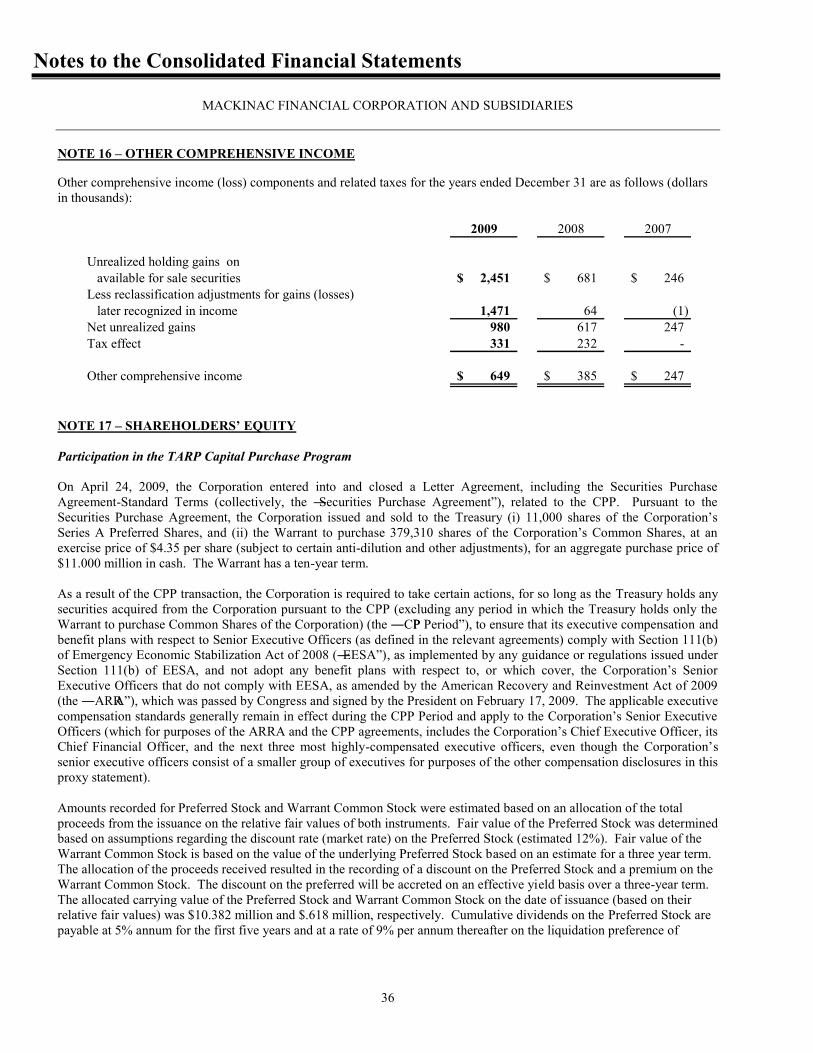
Notes to the Consolidated Financial Statements
MACKINAC FINANCIAL CORPORATION AND SUBSIDIARIES
36
NOTE 16 – OTHER COMPREHENSIVE INCOME Other comprehensive income (loss) components and related taxes for the years ended December 31 are as follows (dollars in thousands):
2009 2008 2007
Unrealized holding gains on available for sale securities 2,451$ 681$ 246$ Less reclassification adjustments for gains (losses) later recognized in income 1,471 64 (1) Net unrealized gains 980 617 247 Tax effect 331 232 -
Other comprehensive income 649$ 385$ 247$
NOTE 17 – SHAREHOLDERS’ EQUITY Participation in the TARP Capital Purchase Program
On April 24, 2009, the Corporation entered into and closed a Letter Agreement, including the Securities Purchase Agreement-Standard Terms (collectively, the ―Securities Purchase Agreement‖), related to the CPP. Pursuant to the Securities Purchase Agreement, the Corporation issued and sold to the Treasury (i) 11,000 shares of the Corporation’s Series A Preferred Shares, and (ii) the Warrant to purchase 379,310 shares of the Corporation’s Common Shares, at an exercise price of $4.35 per share (subject to certain anti-dilution and other adjustments), for an aggregate purchase price of $11.000 million in cash. The Warrant has a ten-year term.
As a result of the CPP transaction, the Corporation is required to take certain actions, for so long as the Treasury holds any securities acquired from the Corporation pursuant to the CPP (excluding any period in which the Treasury holds only the Warrant to purchase Common Shares of the Corporation) (the ―CPP Period‖), to ensure that its executive compensation and benefit plans with respect to Senior Executive Officers (as defined in the relevant agreements) comply with Section 111(b) of Emergency Economic Stabilization Act of 2008 (―EESA‖), as implemented by any guidance or regulations issued under Section 111(b) of EESA, and not adopt any benefit plans with respect to, or which cover, the Corporation’s Senior Executive Officers that do not comply with EESA, as amended by the American Recovery and Reinvestment Act of 2009 (the ―ARRA‖), which was passed by Congress and signed by the President on February 17, 2009. The applicable executive compensation standards generally remain in effect during the CPP Period and apply to the Corporation’s Senior Executive Officers (which for purposes of the ARRA and the CPP agreements, includes the Corporation’s Chief Executive Officer, its Chief Financial Officer, and the next three most highly-compensated executive officers, even though the Corporation’s senior executive officers consist of a smaller group of executives for purposes of the other compensation disclosures in this proxy statement). Amounts recorded for Preferred Stock and Warrant Common Stock were estimated based on an allocation of the total proceeds from the issuance on the relative fair values of both instruments. Fair value of the Preferred Stock was determined based on assumptions regarding the discount rate (market rate) on the Preferred Stock (estimated 12%). Fair value of the Warrant Common Stock is based on the value of the underlying Preferred Stock based on an estimate for a three year term. The allocation of the proceeds received resulted in the recording of a discount on the Preferred Stock and a premium on the Warrant Common Stock. The discount on the preferred will be accreted on an effective yield basis over a three-year term. The allocated carrying value of the Preferred Stock and Warrant Common Stock on the date of issuance (based on their relative fair values) was $10.382 million and $.618 million, respectively. Cumulative dividends on the Preferred Stock are payable at 5% annum for the first five years and at a rate of 9% per annum thereafter on the liquidation preference of

Notes to the Consolidated Financial Statements
MACKINAC FINANCIAL CORPORATION AND SUBSIDIARIES
37
NOTE 17 – SHAREHOLDERS’ EQUITY (CONTINUED) $1,000 per share. The Company is prohibited from paying any dividend with respect to shares of common stock unless all accrued and unpaid dividends are paid in full on the Preferred Stock for all past dividend periods. The Preferred Stock is non-voting, other than class voting rights on matters that could adversely affect the Preferred Stock. The Preferred Stock may be redeemed at any time with regulatory approval. The Treasury may also transfer the Preferred Stock to a third party at any time. The preferred stock qualifies as Tier 1 Capital for regulatory purposes at the holding company. The Corporation has the right to redeem the Series A Preferred Shares at any time after consulting with its primary regulator, in which case the executive compensation standards would no longer apply to the Corporation. This capital will be used to increase the strong capital position of the Bank. The Bank will use the capital to grow loans. In addition, the capital will allow the Corporation to consider acquisitions of deposit franchisees that would enhance our funding mix. NOTE 18 - COMMITMENTS, CONTINGENCIES, AND CREDIT RISK Financial Instruments with Off-Balance-Sheet Risk The Corporation is a party to financial instruments with off-balance-sheet risk in the normal course of business to meet the financing needs of its customers. These financial instruments include commitments to extend credit and standby letters of credit. Those instruments involve, to varying degrees, elements of credit risk in excess of the amount recognized in the consolidated balance sheets. The Corporation’s exposure to credit loss, in the event of nonperformance by the other party to the financial instrument for commitments to extend credit and standby letters of credit, is represented by the contractual amount of those instruments. The Corporation uses the same credit policies in making commitments and conditional obligations as it does for on-balance-sheet instruments. These commitments at December 31 are as follows (dollars in thousands):
2009 2008
Commitments to extend credit: Variable rate 24,839$ 40,036$ Fixed rate 6,039 4,487 Standby letters of credit - Variable rate 1,279 1,838 Credit card commitments - Fixed rate 2,714 2,438
34,871$ 48,799$
Commitments to extend credit are agreements to lend to a customer as long as there is no violation of any condition established in the contract. Commitments generally have fixed expiration dates or other termination clauses and may require payment of a fee. Since many of the commitments are expected to expire without being drawn upon, the total commitment amounts do not necessarily represent future cash requirements. The Corporation evaluates each customer’s creditworthiness on a case-by-case basis. The amount of collateral obtained, if deemed necessary by the Corporation upon extension of credit, is based on management’s credit evaluation of the party. Collateral held varies, but may include accounts receivable, inventory, property, plant and equipment, and income-producing commercial properties. Standby letters of credit are conditional commitments issued by the Corporation to guarantee the performance of a customer to a third party. Those guarantees are primarily issued to support public and private borrowing arrangements. The credit risk involved in issuing letters of credit is essentially the same as that involved in extending loan facilities to customers. The commitments are structured to allow for 100% collateralization on all standby letters of credit. Credit card commitments are commitments on credit cards issued by the Corporation’s subsidiary and serviced by other companies. These commitments are unsecured.
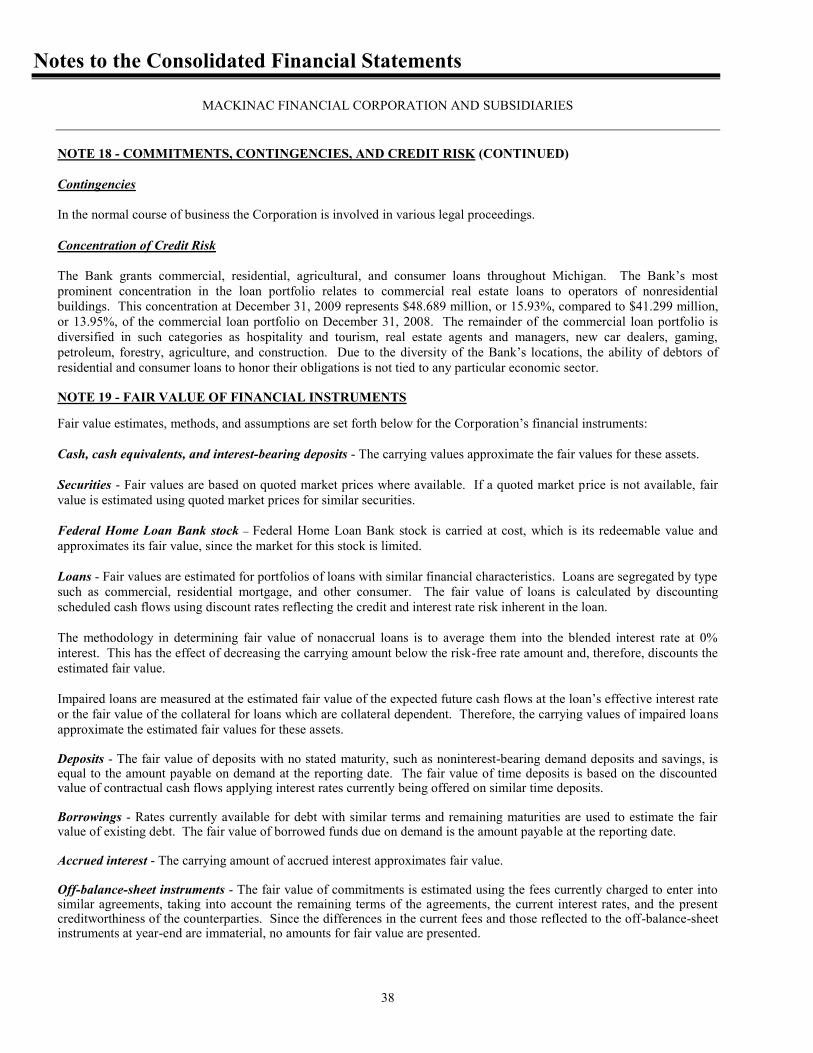
Notes to the Consolidated Financial Statements
MACKINAC FINANCIAL CORPORATION AND SUBSIDIARIES
38
NOTE 18 - COMMITMENTS, CONTINGENCIES, AND CREDIT RISK (CONTINUED) Contingencies In the normal course of business the Corporation is involved in various legal proceedings. Concentration of Credit Risk The Bank grants commercial, residential, agricultural, and consumer loans throughout Michigan. The Bank’s most prominent concentration in the loan portfolio relates to commercial real estate loans to operators of nonresidential buildings. This concentration at December 31, 2009 represents $48.689 million, or 15.93%, compared to $41.299 million, or 13.95%, of the commercial loan portfolio on December 31, 2008. The remainder of the commercial loan portfolio is diversified in such categories as hospitality and tourism, real estate agents and managers, new car dealers, gaming, petroleum, forestry, agriculture, and construction. Due to the diversity of the Bank’s locations, the ability of debtors of residential and consumer loans to honor their obligations is not tied to any particular economic sector. NOTE 19 - FAIR VALUE OF FINANCIAL INSTRUMENTS Fair value estimates, methods, and assumptions are set forth below for the Corporation’s financial instruments: Cash, cash equivalents, and interest-bearing deposits - The carrying values approximate the fair values for these assets. Securities - Fair values are based on quoted market prices where available. If a quoted market price is not available, fair value is estimated using quoted market prices for similar securities. Federal Home Loan Bank stock – Federal Home Loan Bank stock is carried at cost, which is its redeemable value and approximates its fair value, since the market for this stock is limited. Loans - Fair values are estimated for portfolios of loans with similar financial characteristics. Loans are segregated by type such as commercial, residential mortgage, and other consumer. The fair value of loans is calculated by discounting scheduled cash flows using discount rates reflecting the credit and interest rate risk inherent in the loan. The methodology in determining fair value of nonaccrual loans is to average them into the blended interest rate at 0% interest. This has the effect of decreasing the carrying amount below the risk-free rate amount and, therefore, discounts the estimated fair value. Impaired loans are measured at the estimated fair value of the expected future cash flows at the loan’s effective interest rate or the fair value of the collateral for loans which are collateral dependent. Therefore, the carrying values of impaired loans approximate the estimated fair values for these assets. Deposits - The fair value of deposits with no stated maturity, such as noninterest-bearing demand deposits and savings, is equal to the amount payable on demand at the reporting date. The fair value of time deposits is based on the discounted value of contractual cash flows applying interest rates currently being offered on similar time deposits. Borrowings - Rates currently available for debt with similar terms and remaining maturities are used to estimate the fair value of existing debt. The fair value of borrowed funds due on demand is the amount payable at the reporting date. Accrued interest - The carrying amount of accrued interest approximates fair value. Off-balance-sheet instruments - The fair value of commitments is estimated using the fees currently charged to enter into similar agreements, taking into account the remaining terms of the agreements, the current interest rates, and the present creditworthiness of the counterparties. Since the differences in the current fees and those reflected to the off-balance-sheet instruments at year-end are immaterial, no amounts for fair value are presented.
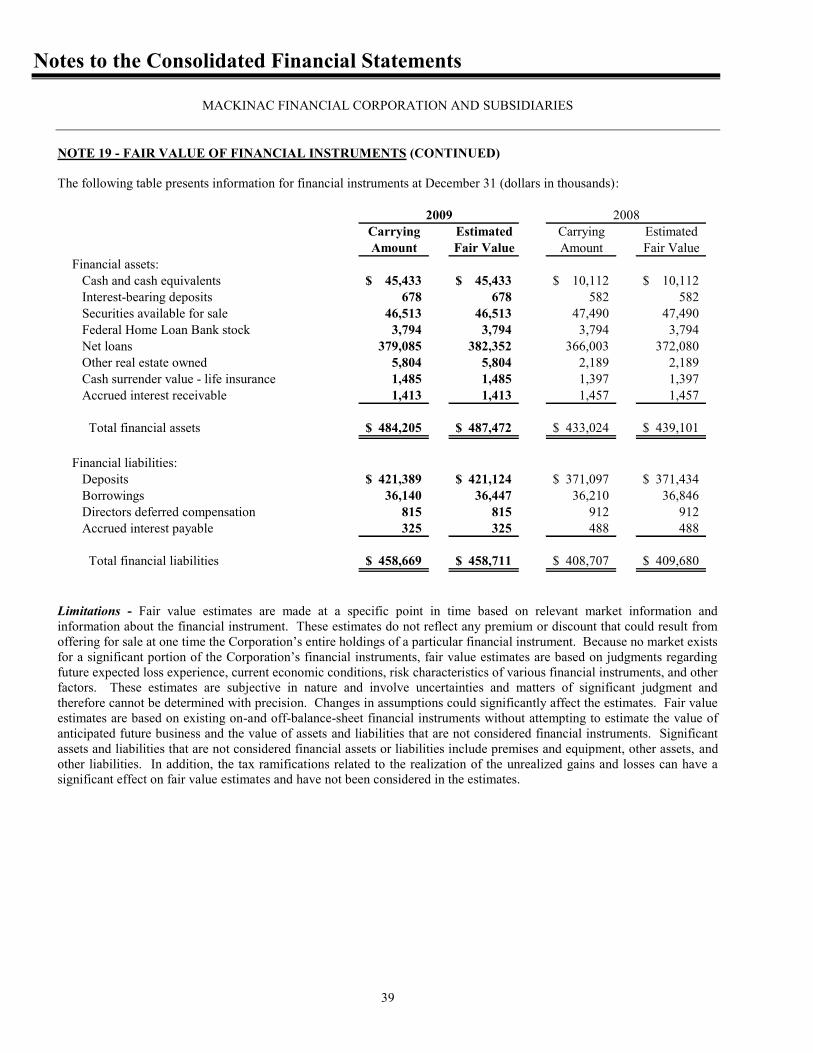
Notes to the Consolidated Financial Statements
MACKINAC FINANCIAL CORPORATION AND SUBSIDIARIES
39
NOTE 19 - FAIR VALUE OF FINANCIAL INSTRUMENTS (CONTINUED) The following table presents information for financial instruments at December 31 (dollars in thousands):
Carrying Estimated Carrying EstimatedAmount Fair Value Amount Fair Value
Financial assets: Cash and cash equivalents 45,433$ 45,433$ 10,112$ 10,112$ Interest-bearing deposits 678 678 582 582 Securities available for sale 46,513 46,513 47,490 47,490 Federal Home Loan Bank stock 3,794 3,794 3,794 3,794 Net loans 379,085 382,352 366,003 372,080 Other real estate owned 5,804 5,804 2,189 2,189 Cash surrender value - life insurance 1,485 1,485 1,397 1,397 Accrued interest receivable 1,413 1,413 1,457 1,457
Total financial assets 484,205$ 487,472$ 433,024$ 439,101$
Financial liabilities: Deposits 421,389$ 421,124$ 371,097$ 371,434$ Borrowings 36,140 36,447 36,210 36,846 Directors deferred compensation 815 815 912 912 Accrued interest payable 325 325 488 488
Total financial liabilities 458,669$ 458,711$ 408,707$ 409,680$
20082009
Limitations - Fair value estimates are made at a specific point in time based on relevant market information and information about the financial instrument. These estimates do not reflect any premium or discount that could result from offering for sale at one time the Corporation’s entire holdings of a particular financial instrument. Because no market exists for a significant portion of the Corporation’s financial instruments, fair value estimates are based on judgments regarding future expected loss experience, current economic conditions, risk characteristics of various financial instruments, and other factors. These estimates are subjective in nature and involve uncertainties and matters of significant judgment and therefore cannot be determined with precision. Changes in assumptions could significantly affect the estimates. Fair value estimates are based on existing on-and off-balance-sheet financial instruments without attempting to estimate the value of anticipated future business and the value of assets and liabilities that are not considered financial instruments. Significant assets and liabilities that are not considered financial assets or liabilities include premises and equipment, other assets, and other liabilities. In addition, the tax ramifications related to the realization of the unrealized gains and losses can have a significant effect on fair value estimates and have not been considered in the estimates.
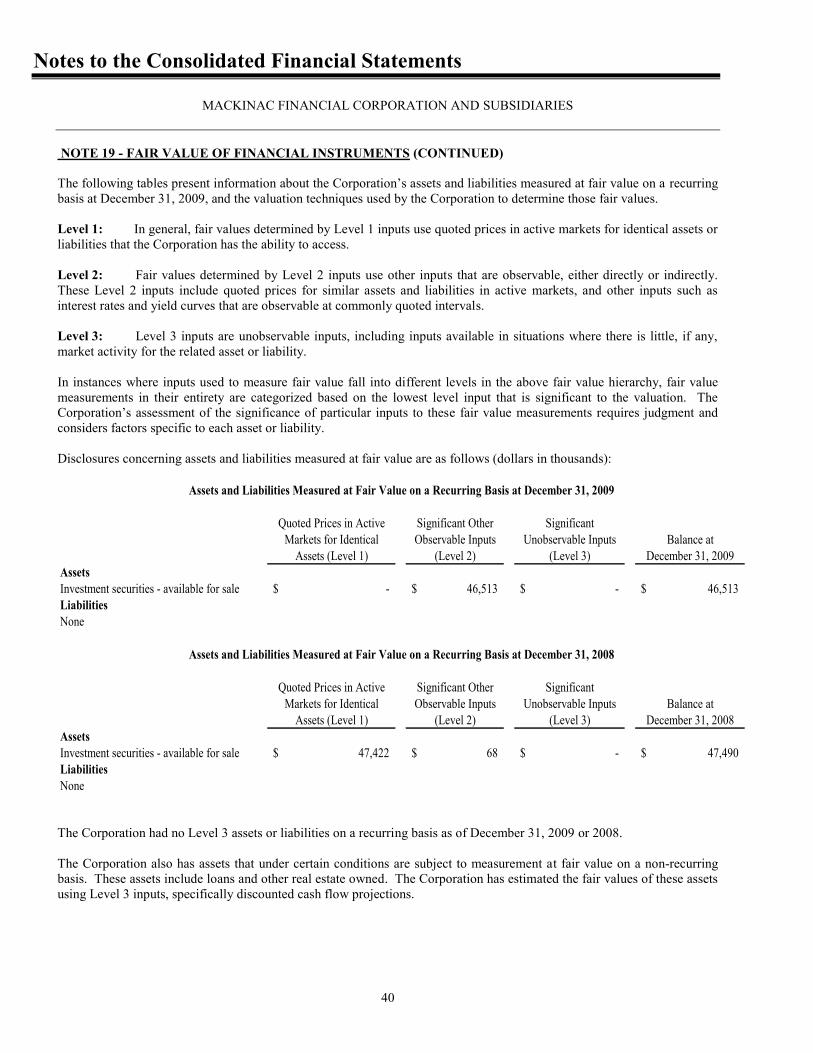
Notes to the Consolidated Financial Statements
MACKINAC FINANCIAL CORPORATION AND SUBSIDIARIES
40
NOTE 19 - FAIR VALUE OF FINANCIAL INSTRUMENTS (CONTINUED) The following tables present information about the Corporation’s assets and liabilities measured at fair value on a recurring basis at December 31, 2009, and the valuation techniques used by the Corporation to determine those fair values. Level 1: In general, fair values determined by Level 1 inputs use quoted prices in active markets for identical assets or liabilities that the Corporation has the ability to access. Level 2: Fair values determined by Level 2 inputs use other inputs that are observable, either directly or indirectly. These Level 2 inputs include quoted prices for similar assets and liabilities in active markets, and other inputs such as interest rates and yield curves that are observable at commonly quoted intervals. Level 3: Level 3 inputs are unobservable inputs, including inputs available in situations where there is little, if any, market activity for the related asset or liability. In instances where inputs used to measure fair value fall into different levels in the above fair value hierarchy, fair value measurements in their entirety are categorized based on the lowest level input that is significant to the valuation. The Corporation’s assessment of the significance of particular inputs to these fair value measurements requires judgment and considers factors specific to each asset or liability.
Disclosures concerning assets and liabilities measured at fair value are as follows (dollars in thousands):
Quoted Prices in Active Significant Other SignificantMarkets for Identical Observable Inputs Unobservable Inputs Balance at
Assets (Level 1) (Level 2) (Level 3) December 31, 2009AssetsInvestment securities - available for sale -$ 46,513$ -$ 46,513$ LiabilitiesNone
Assets and Liabilities Measured at Fair Value on a Recurring Basis at December 31, 2009
Quoted Prices in Active Significant Other SignificantMarkets for Identical Observable Inputs Unobservable Inputs Balance at
Assets (Level 1) (Level 2) (Level 3) December 31, 2008AssetsInvestment securities - available for sale 47,422$ 68$ -$ 47,490$ LiabilitiesNone
Assets and Liabilities Measured at Fair Value on a Recurring Basis at December 31, 2008
The Corporation had no Level 3 assets or liabilities on a recurring basis as of December 31, 2009 or 2008. The Corporation also has assets that under certain conditions are subject to measurement at fair value on a non-recurring basis. These assets include loans and other real estate owned. The Corporation has estimated the fair values of these assets using Level 3 inputs, specifically discounted cash flow projections.
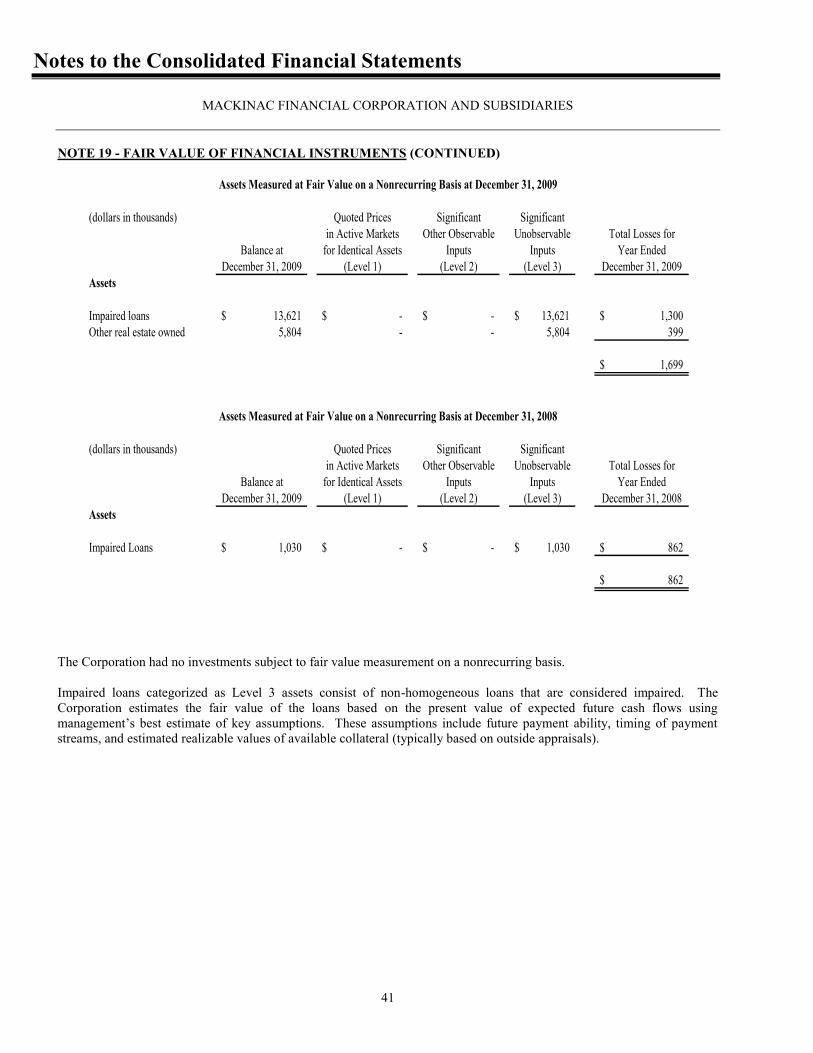
Notes to the Consolidated Financial Statements
MACKINAC FINANCIAL CORPORATION AND SUBSIDIARIES
41
NOTE 19 - FAIR VALUE OF FINANCIAL INSTRUMENTS (CONTINUED)
(dollars in thousands) Quoted Prices Significant Significantin Active Markets Other Observable Unobservable Total Losses for
Balance at for Identical Assets Inputs Inputs Year EndedDecember 31, 2009 (Level 1) (Level 2) (Level 3) December 31, 2009
Assets
Impaired loans 13,621$ -$ -$ 13,621$ 1,300$ Other real estate owned 5,804 - - 5,804 399
1,699$
Assets Measured at Fair Value on a Nonrecurring Basis at December 31, 2009
(dollars in thousands) Quoted Prices Significant Significantin Active Markets Other Observable Unobservable Total Losses for
Balance at for Identical Assets Inputs Inputs Year EndedDecember 31, 2009 (Level 1) (Level 2) (Level 3) December 31, 2008
Assets
Impaired Loans 1,030$ -$ -$ 1,030$ 862$
862$
Assets Measured at Fair Value on a Nonrecurring Basis at December 31, 2008
The Corporation had no investments subject to fair value measurement on a nonrecurring basis. Impaired loans categorized as Level 3 assets consist of non-homogeneous loans that are considered impaired. The Corporation estimates the fair value of the loans based on the present value of expected future cash flows using management’s best estimate of key assumptions. These assumptions include future payment ability, timing of payment streams, and estimated realizable values of available collateral (typically based on outside appraisals).
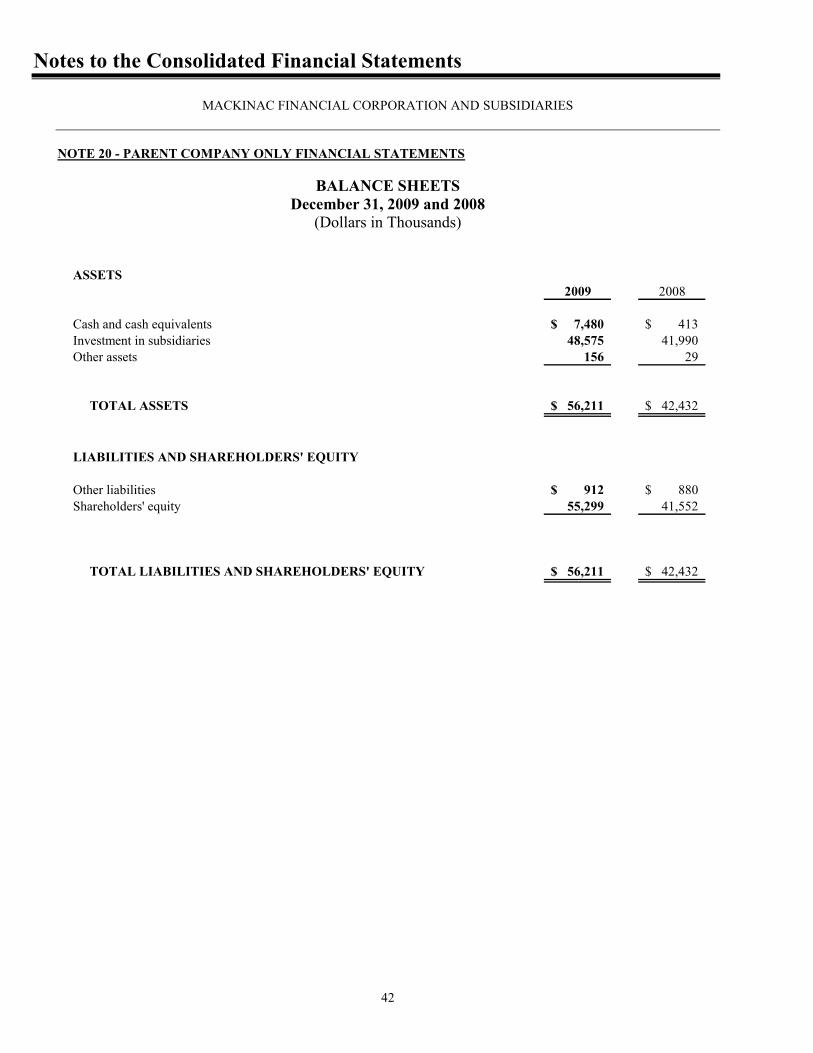
Notes to the Consolidated Financial Statements
MACKINAC FINANCIAL CORPORATION AND SUBSIDIARIES
42
NOTE 20 - PARENT COMPANY ONLY FINANCIAL STATEMENTS
BALANCE SHEETS December 31, 2009 and 2008
(Dollars in Thousands)
ASSETS2009 2008
Cash and cash equivalents 7,480$ 413$ Investment in subsidiaries 48,575 41,990 Other assets 156 29
TOTAL ASSETS 56,211$ 42,432$
LIABILITIES AND SHAREHOLDERS' EQUITY
Other liabilities 912$ 880$ Shareholders' equity 55,299 41,552
TOTAL LIABILITIES AND SHAREHOLDERS' EQUITY 56,211$ 42,432$
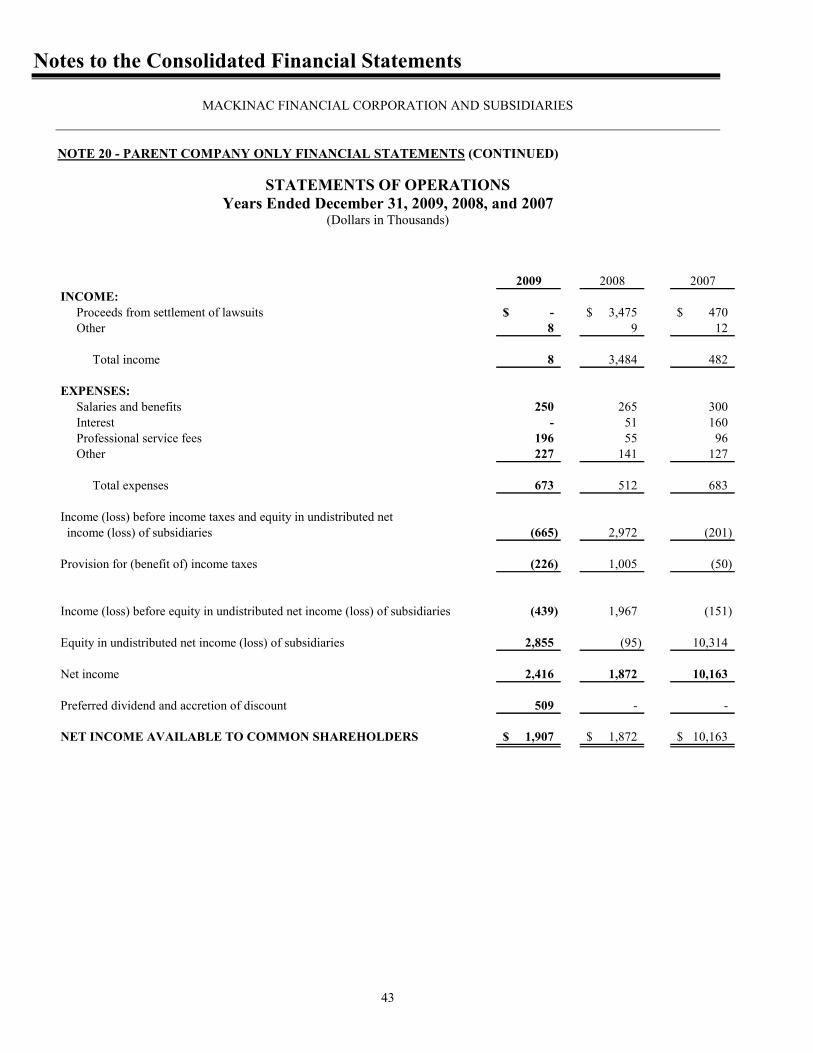
Notes to the Consolidated Financial Statements
MACKINAC FINANCIAL CORPORATION AND SUBSIDIARIES
43
NOTE 20 - PARENT COMPANY ONLY FINANCIAL STATEMENTS (CONTINUED)
STATEMENTS OF OPERATIONS Years Ended December 31, 2009, 2008, and 2007
(Dollars in Thousands)
2009 2008 2007INCOME: Proceeds from settlement of lawsuits -$ 3,475$ 470$ Other 8 9 12
Total income 8 3,484 482
EXPENSES: Salaries and benefits 250 265 300 Interest - 51 160 Professional service fees 196 55 96 Other 227 141 127 Total expenses 673 512 683
Income (loss) before income taxes and equity in undistributed net income (loss) of subsidiaries (665) 2,972 (201)
Provision for (benefit of) income taxes (226) 1,005 (50)
Income (loss) before equity in undistributed net income (loss) of subsidiaries (439) 1,967 (151)
Equity in undistributed net income (loss) of subsidiaries 2,855 (95) 10,314
Net income 2,416 1,872 10,163
Preferred dividend and accretion of discount 509 - -
NET INCOME AVAILABLE TO COMMON SHAREHOLDERS 1,907$ 1,872$ 10,163$
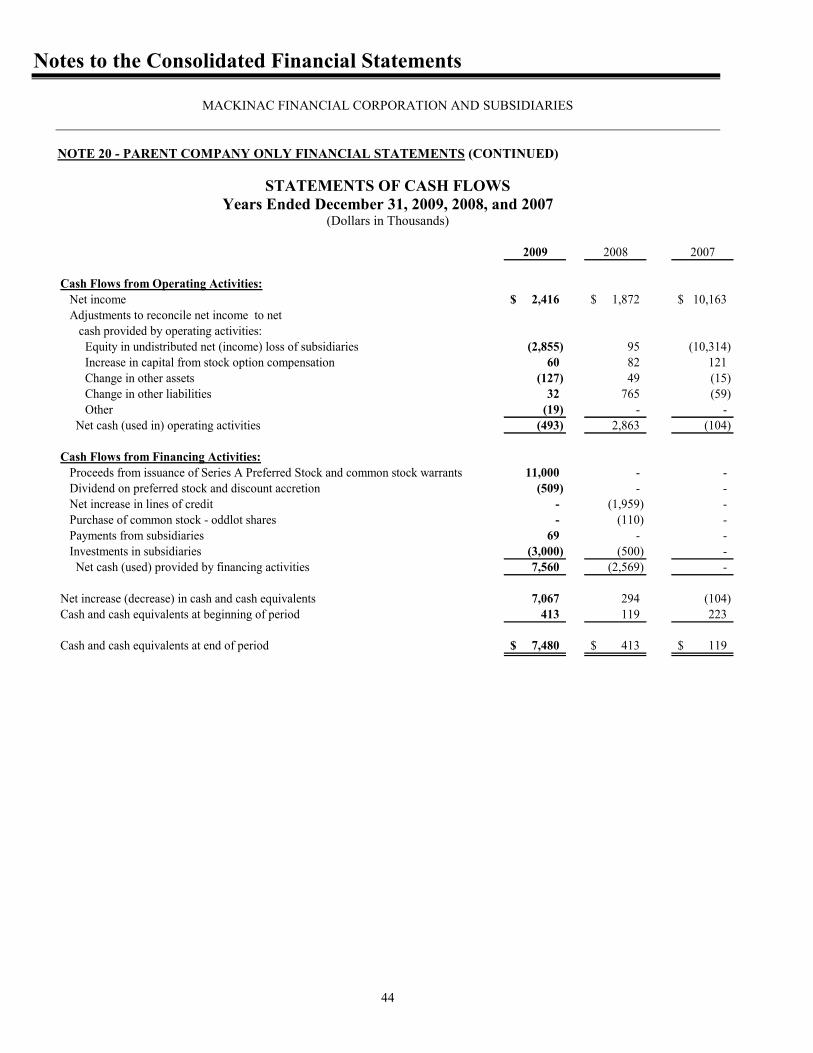
Notes to the Consolidated Financial Statements
MACKINAC FINANCIAL CORPORATION AND SUBSIDIARIES
44
NOTE 20 - PARENT COMPANY ONLY FINANCIAL STATEMENTS (CONTINUED)
STATEMENTS OF CASH FLOWS Years Ended December 31, 2009, 2008, and 2007
(Dollars in Thousands)
2009 2008 2007
Cash Flows from Operating Activities: Net income 2,416$ 1,872$ 10,163$ Adjustments to reconcile net income to net cash provided by operating activities: Equity in undistributed net (income) loss of subsidiaries (2,855) 95 (10,314) Increase in capital from stock option compensation 60 82 121 Change in other assets (127) 49 (15) Change in other liabilities 32 765 (59) Other (19) - - Net cash (used in) operating activities (493) 2,863 (104)
Cash Flows from Financing Activities: Proceeds from issuance of Series A Preferred Stock and common stock warrants 11,000 - - Dividend on preferred stock and discount accretion (509) - - Net increase in lines of credit - (1,959) - Purchase of common stock - oddlot shares - (110) - Payments from subsidiaries 69 - - Investments in subsidiaries (3,000) (500) - Net cash (used) provided by financing activities 7,560 (2,569) -
Net increase (decrease) in cash and cash equivalents 7,067 294 (104) Cash and cash equivalents at beginning of period 413 119 223
Cash and cash equivalents at end of period 7,480$ 413$ 119$
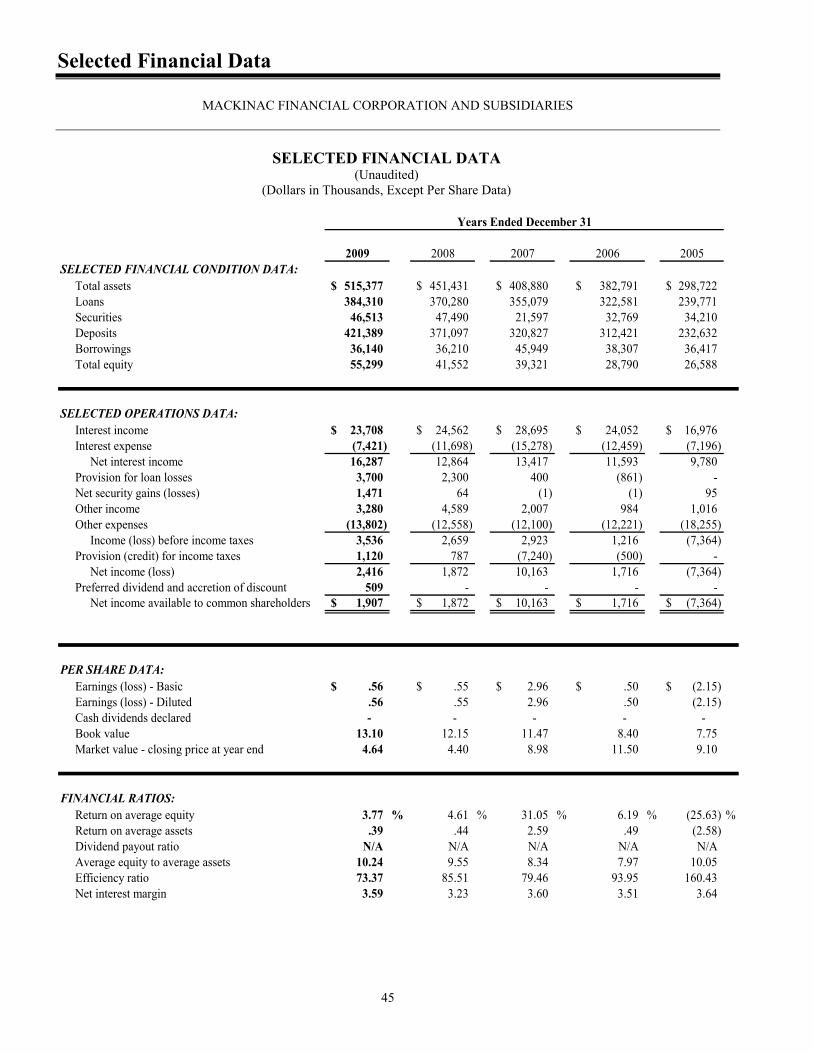
Selected Financial Data
MACKINAC FINANCIAL CORPORATION AND SUBSIDIARIES
45
SELECTED FINANCIAL DATA
(Unaudited) (Dollars in Thousands, Except Per Share Data)
2009 2008 2007 2006 2005SELECTED FINANCIAL CONDITION DATA: Total assets 515,377$ 451,431$ 408,880$ 382,791$ 298,722$ Loans 384,310 370,280 355,079 322,581 239,771 Securities 46,513 47,490 21,597 32,769 34,210 Deposits 421,389 371,097 320,827 312,421 232,632 Borrowings 36,140 36,210 45,949 38,307 36,417 Total equity 55,299 41,552 39,321 28,790 26,588
SELECTED OPERATIONS DATA: Interest income 23,708$ 24,562$ 28,695$ 24,052$ 16,976$ Interest expense (7,421) (11,698) (15,278) (12,459) (7,196) Net interest income 16,287 12,864 13,417 11,593 9,780 Provision for loan losses 3,700 2,300 400 (861) - Net security gains (losses) 1,471 64 (1) (1) 95 Other income 3,280 4,589 2,007 984 1,016 Other expenses (13,802) (12,558) (12,100) (12,221) (18,255) Income (loss) before income taxes 3,536 2,659 2,923 1,216 (7,364) Provision (credit) for income taxes 1,120 787 (7,240) (500) - Net income (loss) 2,416 1,872 10,163 1,716 (7,364) Preferred dividend and accretion of discount 509 - - - - Net income available to common shareholders 1,907$ 1,872$ 10,163$ 1,716$ (7,364)$
PER SHARE DATA: Earnings (loss) - Basic .56$ .55$ 2.96$ .50$ (2.15)$ Earnings (loss) - Diluted .56 .55 2.96 .50 (2.15) Cash dividends declared - - - - - Book value 13.10 12.15 11.47 8.40 7.75 Market value - closing price at year end 4.64 4.40 8.98 11.50 9.10
FINANCIAL RATIOS: Return on average equity 3.77 % 4.61 % 31.05 % 6.19 % (25.63) % Return on average assets .39 .44 2.59 .49 (2.58) Dividend payout ratio N/A N/A N/A N/A N/A Average equity to average assets 10.24 9.55 8.34 7.97 10.05 Efficiency ratio 73.37 85.51 79.46 93.95 160.43 Net interest margin 3.59 3.23 3.60 3.51 3.64
Years Ended December 31
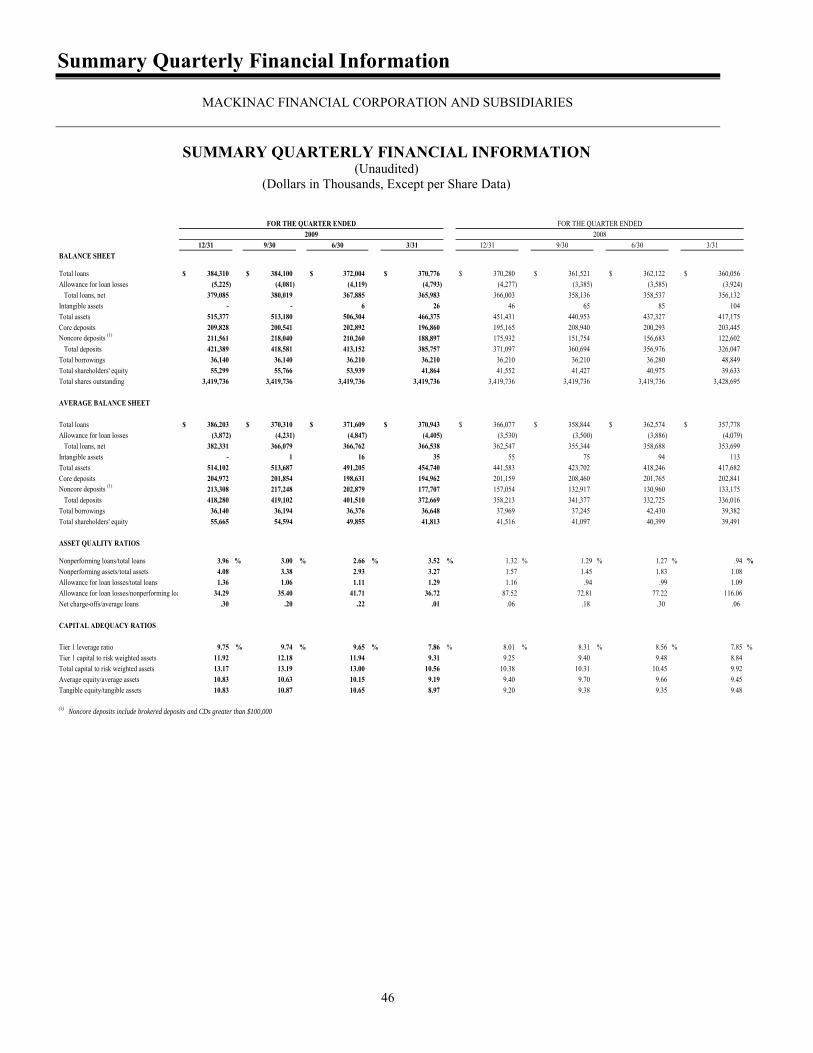
Summary Quarterly Financial Information
MACKINAC FINANCIAL CORPORATION AND SUBSIDIARIES
46
SUMMARY QUARTERLY FINANCIAL INFORMATION (Unaudited)
(Dollars in Thousands, Except per Share Data)
12/31 9/30 6/30 3/31 12/31 9/30 6/30 3/31BALANCE SHEET
Total loans 384,310$ 384,100$ 372,004$ 370,776$ 370,280$ 361,521$ 362,122$ 360,056$ Allowance for loan losses (5,225) (4,081) (4,119) (4,793) (4,277) (3,385) (3,585) (3,924) Total loans, net 379,085 380,019 367,885 365,983 366,003 358,136 358,537 356,132 Intangible assets - - 6 26 46 65 85 104 Total assets 515,377 513,180 506,304 466,375 451,431 440,953 437,327 417,175 Core deposits 209,828 200,541 202,892 196,860 195,165 208,940 200,293 203,445 Noncore deposits (1) 211,561 218,040 210,260 188,897 175,932 151,754 156,683 122,602 Total deposits 421,389 418,581 413,152 385,757 371,097 360,694 356,976 326,047 Total borrowings 36,140 36,140 36,210 36,210 36,210 36,210 36,280 48,849 Total shareholders' equity 55,299 55,766 53,939 41,864 41,552 41,427 40,975 39,633 Total shares outstanding 3,419,736 3,419,736 3,419,736 3,419,736 3,419,736 3,419,736 3,419,736 3,428,695
AVERAGE BALANCE SHEET
Total loans 386,203$ 370,310$ 371,609$ 370,943$ 366,077$ 358,844$ 362,574$ 357,778$ Allowance for loan losses (3,872) (4,231) (4,847) (4,405) (3,530) (3,500) (3,886) (4,079) Total loans, net 382,331 366,079 366,762 366,538 362,547 355,344 358,688 353,699 Intangible assets - 1 16 35 55 75 94 113 Total assets 514,102 513,687 491,205 454,740 441,583 423,702 418,246 417,682 Core deposits 204,972 201,854 198,631 194,962 201,159 208,460 201,765 202,841 Noncore deposits (1) 213,308 217,248 202,879 177,707 157,054 132,917 130,960 133,175 Total deposits 418,280 419,102 401,510 372,669 358,213 341,377 332,725 336,016 Total borrowings 36,140 36,194 36,376 36,648 37,969 37,245 42,430 39,382 Total shareholders' equity 55,665 54,594 49,855 41,813 41,516 41,097 40,399 39,491
ASSET QUALITY RATIOS
Nonperforming loans/total loans 3.96 % 3.00 % 2.66 % 3.52 % 1.32 % 1.29 % 1.27 % .94 %Nonperforming assets/total assets 4.08 3.38 2.93 3.27 1.57 1.45 1.83 1.08Allowance for loan losses/total loans 1.36 1.06 1.11 1.29 1.16 .94 .99 1.09Allowance for loan losses/nonperforming loans 34.29 35.40 41.71 36.72 87.52 72.81 77.22 116.06Net charge-offs/average loans .30 .20 .22 .01 .06 .18 .30 .06
CAPITAL ADEQUACY RATIOS
Tier 1 leverage ratio 9.75 % 9.74 % 9.65 % 7.86 % 8.01 % 8.31 % 8.56 % 7.85 %Tier 1 capital to risk weighted assets 11.92 12.18 11.94 9.31 9.25 9.40 9.48 8.84Total capital to risk weighted assets 13.17 13.19 13.00 10.56 10.38 10.31 10.45 9.92Average equity/average assets 10.83 10.63 10.15 9.19 9.40 9.70 9.66 9.45Tangible equity/tangible assets 10.83 10.87 10.65 8.97 9.20 9.38 9.35 9.48
(1) Noncore deposits include brokered deposits and CDs greater than $100,000
2009FOR THE QUARTER ENDED FOR THE QUARTER ENDED
2008
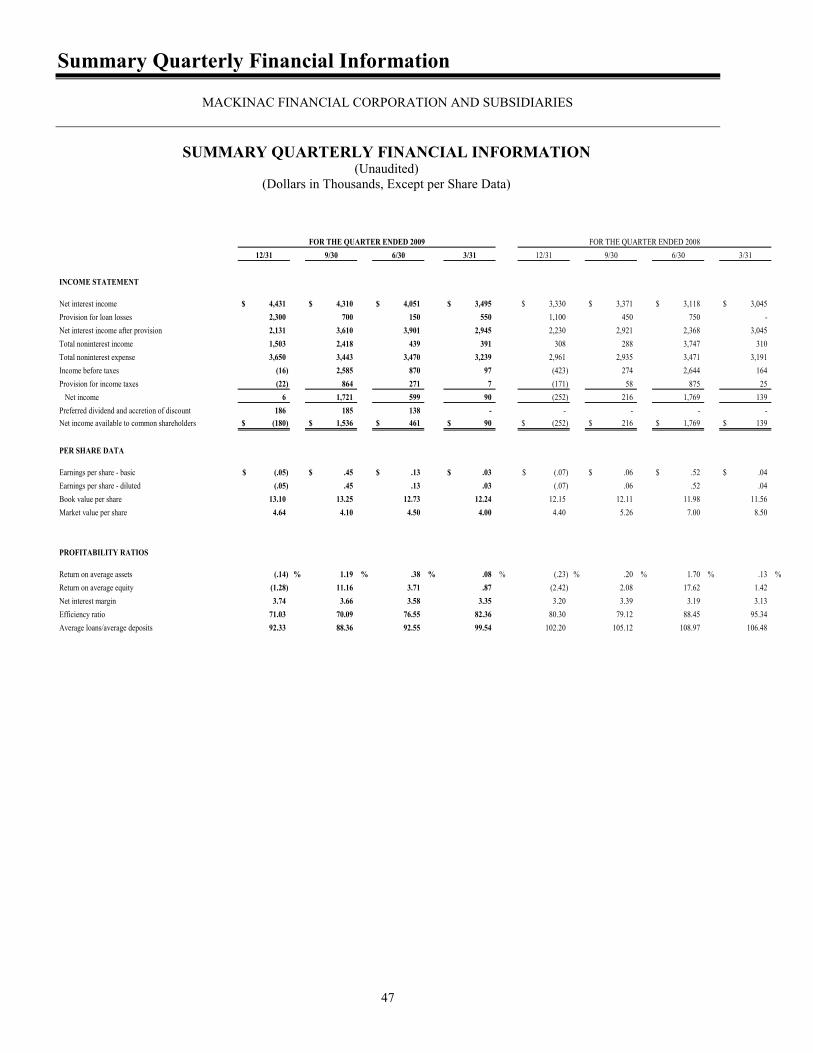
Summary Quarterly Financial Information
MACKINAC FINANCIAL CORPORATION AND SUBSIDIARIES
47
SUMMARY QUARTERLY FINANCIAL INFORMATION (Unaudited)
(Dollars in Thousands, Except per Share Data)
12/31 9/30 6/30 3/31 12/31 9/30 6/30 3/31
INCOME STATEMENT
Net interest income 4,431$ 4,310$ 4,051$ 3,495$ 3,330$ 3,371$ 3,118$ 3,045$ Provision for loan losses 2,300 700 150 550 1,100 450 750 - Net interest income after provision 2,131 3,610 3,901 2,945 2,230 2,921 2,368 3,045 Total noninterest income 1,503 2,418 439 391 308 288 3,747 310 Total noninterest expense 3,650 3,443 3,470 3,239 2,961 2,935 3,471 3,191 Income before taxes (16) 2,585 870 97 (423) 274 2,644 164 Provision for income taxes (22) 864 271 7 (171) 58 875 25 Net income 6 1,721 599 90 (252) 216 1,769 139 Preferred dividend and accretion of discount 186 185 138 - - - - - Net income available to common shareholders (180)$ 1,536$ 461$ 90$ (252)$ 216$ 1,769$ 139$
PER SHARE DATA
Earnings per share - basic (.05)$ .45$ .13$ .03$ (.07)$ .06$ .52$ .04$ Earnings per share - diluted (.05) .45 .13 .03 (.07) .06 .52 .04 Book value per share 13.10 13.25 12.73 12.24 12.15 12.11 11.98 11.56 Market value per share 4.64 4.10 4.50 4.00 4.40 5.26 7.00 8.50
PROFITABILITY RATIOS
Return on average assets (.14) % 1.19 % .38 % .08 % (.23) % .20 % 1.70 % .13 %Return on average equity (1.28) 11.16 3.71 .87 (2.42) 2.08 17.62 1.42 Net interest margin 3.74 3.66 3.58 3.35 3.20 3.39 3.19 3.13 Efficiency ratio 71.03 70.09 76.55 82.36 80.30 79.12 88.45 95.34 Average loans/average deposits 92.33 88.36 92.55 99.54 102.20 105.12 108.97 106.48
FOR THE QUARTER ENDED 2009 FOR THE QUARTER ENDED 2008
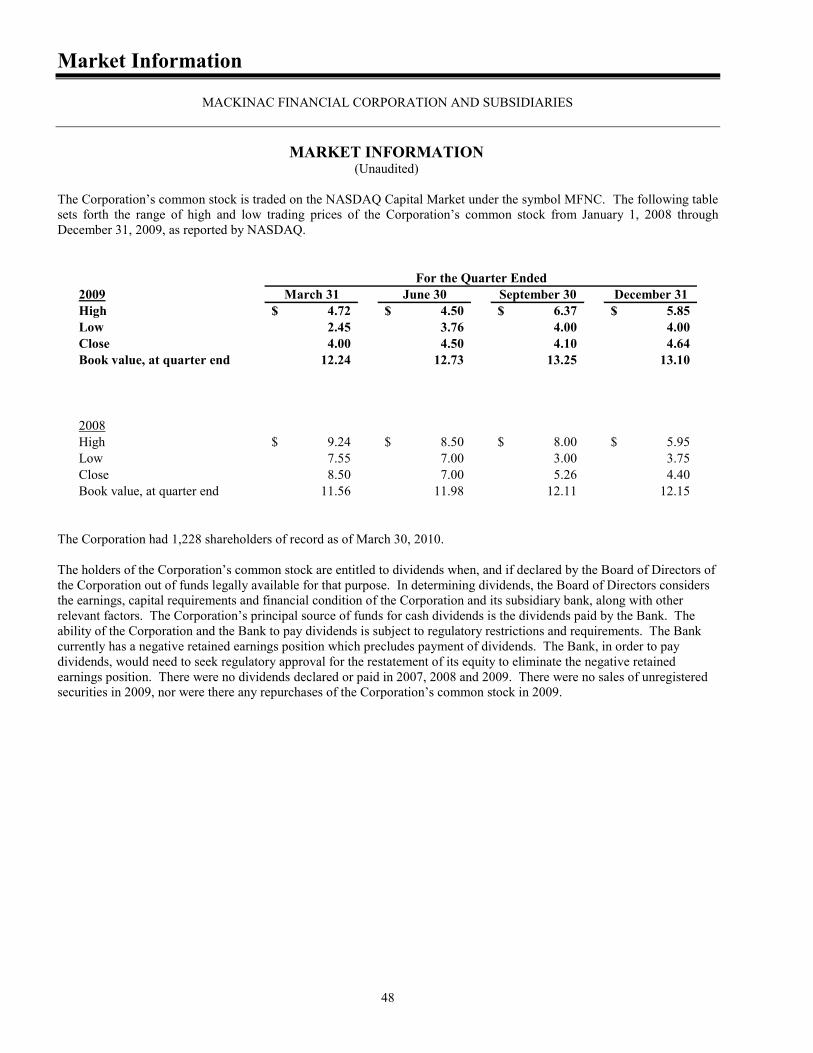
Market Information
MACKINAC FINANCIAL CORPORATION AND SUBSIDIARIES
48
MARKET INFORMATION (Unaudited)
The Corporation’s common stock is traded on the NASDAQ Capital Market under the symbol MFNC. The following table sets forth the range of high and low trading prices of the Corporation’s common stock from January 1, 2008 through December 31, 2009, as reported by NASDAQ.
2009 March 31 June 30 September 30 December 31High 4.72$ 4.50$ 6.37$ 5.85$ Low 2.45 3.76 4.00 4.00 Close 4.00 4.50 4.10 4.64 Book value, at quarter end 12.24 12.73 13.25 13.10
2008High 9.24$ 8.50$ 8.00$ 5.95$ Low 7.55 7.00 3.00 3.75 Close 8.50 7.00 5.26 4.40 Book value, at quarter end 11.56 11.98 12.11 12.15
For the Quarter Ended
The Corporation had 1,228 shareholders of record as of March 30, 2010. The holders of the Corporation’s common stock are entitled to dividends when, and if declared by the Board of Directors of the Corporation out of funds legally available for that purpose. In determining dividends, the Board of Directors considers the earnings, capital requirements and financial condition of the Corporation and its subsidiary bank, along with other relevant factors. The Corporation’s principal source of funds for cash dividends is the dividends paid by the Bank. The ability of the Corporation and the Bank to pay dividends is subject to regulatory restrictions and requirements. The Bank currently has a negative retained earnings position which precludes payment of dividends. The Bank, in order to pay dividends, would need to seek regulatory approval for the restatement of its equity to eliminate the negative retained earnings position. There were no dividends declared or paid in 2007, 2008 and 2009. There were no sales of unregistered securities in 2009, nor were there any repurchases of the Corporation’s common stock in 2009.
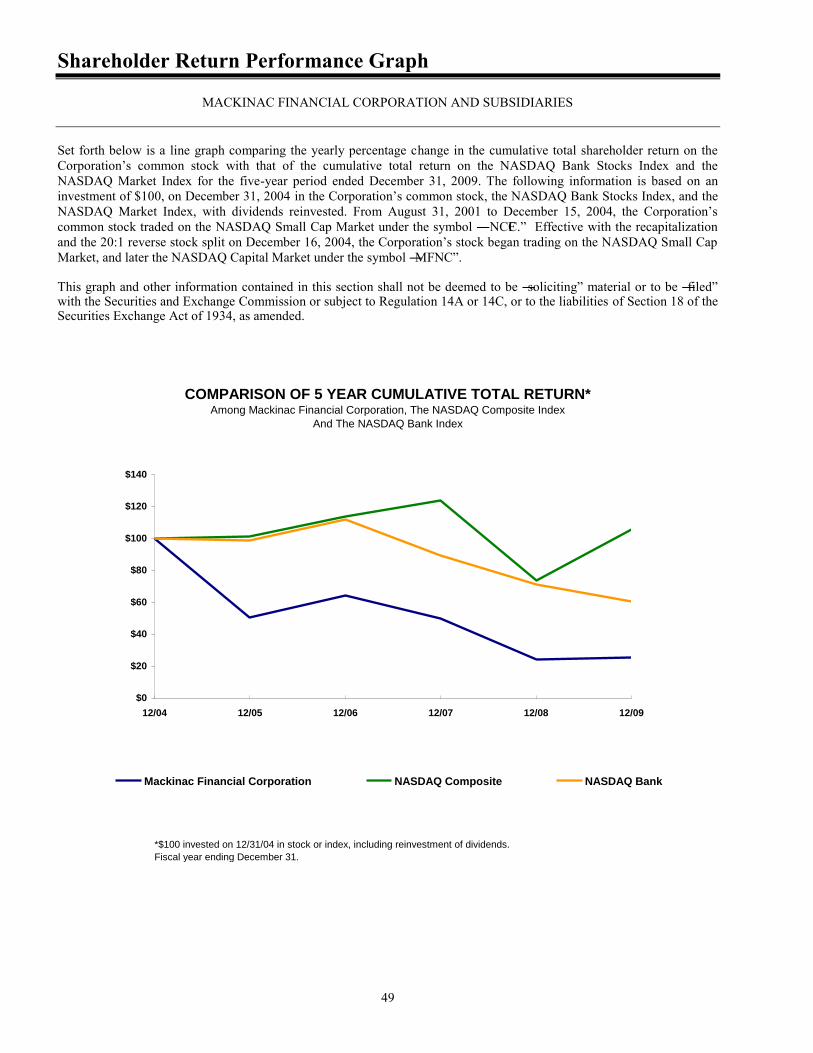
Shareholder Return Performance Graph
MACKINAC FINANCIAL CORPORATION AND SUBSIDIARIES
49
Set forth below is a line graph comparing the yearly percentage change in the cumulative total shareholder return on the Corporation’s common stock with that of the cumulative total return on the NASDAQ Bank Stocks Index and the NASDAQ Market Index for the five-year period ended December 31, 2009. The following information is based on an investment of $100, on December 31, 2004 in the Corporation’s common stock, the NASDAQ Bank Stocks Index, and the NASDAQ Market Index, with dividends reinvested. From August 31, 2001 to December 15, 2004, the Corporation’s common stock traded on the NASDAQ Small Cap Market under the symbol ―NCFC.‖ Effective with the recapitalization and the 20:1 reverse stock split on December 16, 2004, the Corporation’s stock began trading on the NASDAQ Small Cap Market, and later the NASDAQ Capital Market under the symbol ―MFNC‖. This graph and other information contained in this section shall not be deemed to be ―soliciting‖ material or to be ―filed‖ with the Securities and Exchange Commission or subject to Regulation 14A or 14C, or to the liabilities of Section 18 of the Securities Exchange Act of 1934, as amended.
COMPARISON OF 5 YEAR CUMULATIVE TOTAL RETURN*Among Mackinac Financial Corporation, The NASDAQ Composite Index
And The NASDAQ Bank Index
$0
$20
$40
$60
$80
$100
$120
$140
12/04 12/05 12/06 12/07 12/08 12/09
Mackinac Financial Corporation NASDAQ Composite NASDAQ Bank
*$100 invested on 12/31/04 in stock or index, including reinvestment of dividends.
Fiscal year ending December 31.
Forward Looking Statements
50
This report contains certain forward-looking statements within the meaning of Section 27A of the Securities Act of 1933, as amended, and Section 21E of the Securities Exchange Act of 1934, as amended. The Corporation intends such forward-looking statements to be covered by the safe harbor provisions for forward-looking statements contained in the Private Securities Litigation Reform Act of 1995 and is including this statement for purposes of these safe harbor provisions. Forward-looking statements which are based on certain assumptions and describe future plans, strategies, or expectations of the Corporation, are generally identifiable by use of the words ―believe‖, ―expect‖, ―intend‖, ―anticipate‖, ―estimate‖, ―project‖, or similar expressions. The Corporation’s ability to predict results or the actual effect of future plans or strategies is inherently uncertain. Factors that could cause actual results to differ from the results in forward-looking statements include, but are not limited to:
The highly regulated environment in which the Corporation operates could adversely affect its ability to carry out
its strategic plan due to restrictions on new products, funding opportunities or new market entrances; General economic conditions, either nationally or in the state(s) in which the Corporation does business; Legislation or regulatory changes which affect the business in which the Corporation is engaged; Changes in the level and volatility of interest rates which may negatively affect the Corporation’s interest margin; Changes in securities markets with respect to the market value of financial assets and the level of volatility in
certain markets such as foreign exchange; Significant increases in competition in the banking and financial services industry resulting from industry
consolidation, regulatory changes and other factors, as well as action taken by particular competitors; The ability of borrowers to repay loans; The effects on liquidity of unusual decreases in deposits; Changes in consumer spending, borrowing, and saving habits; Technological changes; Acquisitions and unanticipated occurrences which delay or reduce the expected benefits of acquisitions; Difficulties in hiring and retaining qualified management and banking personnel; The Corporation’s ability to increase market share and control expenses; The effect of compliance with legislation or regulatory changes; The effect of changes in accounting policies and practices; The costs and effects of existing and future litigation and of adverse outcomes in such litigation; An increase in the Corporation’s FDIC insurance premiums, or the collection of special assessments by the FDIC.
These risks and uncertainties should be considered in evaluating forward-looking statements. Further information concerning the Corporation and its business, including additional factors that could materially affect the Corporation’s financial results, is included in the Corporation’s filings with the Securities and Exchange Commission. All forward-looking statements contained in this report are based upon information presently available and the Corporation assumes no obligation to update any forward-looking statements.

Management’s Discussion and Analysis of Financial Condition and Results of Operations
51
The following discussion will cover results of operations for 2007 through 2009 and asset quality, financial position, liquidity, interest rate sensitivity, and capital resources for the years 2008 and 2009. The information included in this discussion is intended to assist readers in their analysis of, and should be read in conjunction with, the consolidated financial statements and related notes and other supplemental information presented elsewhere in this report. Throughout this discussion, the term ―Bank‖ refers to mBank, the principal banking subsidiary of the Corporation. EXECUTIVE OVERVIEW
The purpose of this section is to provide a brief overview of the 2009 results of operations. Additional detail of the balance sheet and Statement of Operations follows this summary. The Corporation reported net income available to common shareholders of $1.907 million, or $.56 per share for the year ended December 31, 2009, compared to net income available to common shareholders of $1.872 million, or $.55 per share for 2008. Weighted average shares outstanding amounted to 3,419,736 in 2009 and 3,422,012 in 2008. The 2009 results include $1.208 million of gains related to branch office sales and $1.471 million of security gains. The 2008 results included the positive effect, $3.475 million, of a lawsuit settlement, and the negative effect, $.425 million, of a severance agreement. Total assets of the Corporation at December 31, 2009, were $515.377 million, an increase of $63.946 million, or 14.17% from total assets of $451.431 million reported at December 31, 2008. At December 31, 2009, the Corporation’s loans stood at $384.310 million, an increase of $14.030 million, or 3.79%, from 2008 year-end balances of $370.280 million. Total loan originations in 2009 amounted to $88.122 million, while we experienced significant reductions from loan amortization and principal payoffs of $60.415 million. A good portion of these payoffs pertained to loan relationships that no longer met our pricing or credit standards. Nonperforming assets increased in 2009, as the economy continued to weaken, especially in Southeast Michigan. Nonperforming loans totaled $15.237 million, or 3.96% of total loans at December 31, 2009. Nonperforming assets at December 31, 2009, were $21.041 million, 4.08% of total assets, compared to $7.076 million or 1.57% of total assets at December 31, 2008. Total deposits grew from $371.097 million at December 31, 2008, to $421.389 million at December 31, 2009, an increase of 13.55%. Core deposits increased by $14.663 million after the sale of $29.260 million of deposits in connection with branch office sales. Shareholders’ equity totaled $55.299 million at December 31, 2009, compared to $41.552 million at the end of 2008, an increase of $13.747 million. This increase reflects consolidated net income of $1.907 million, the capital contribution impact of stock options of $.060 million and the increase in equity due to the increase in the market value of available-for-sale investments, which amounted to $.648 million. The increase also includes the issuance of Series A Preferred Stock and common stock warrants and subsequent discount accretion totaling $11.132 million through the Corporation’s participation in TARP. The book value per share at December 31, 2009, amounted to $13.10 compared to $12.15 at the end of 2008.
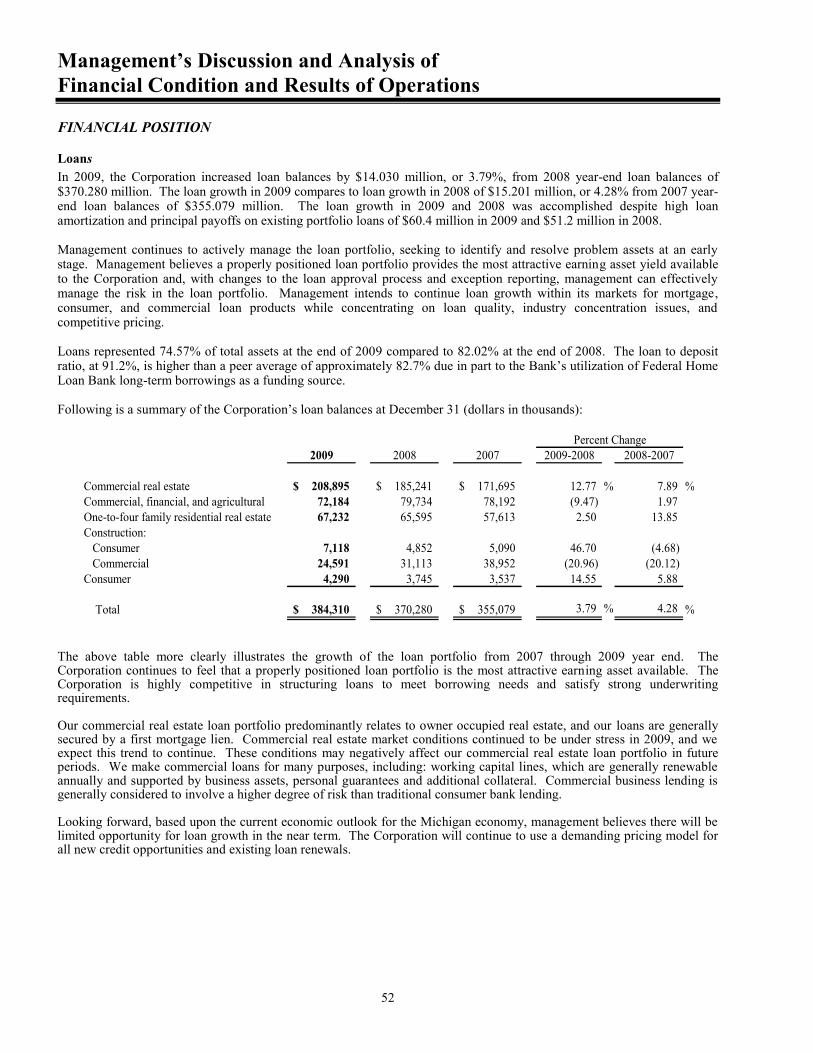
Management’s Discussion and Analysis of Financial Condition and Results of Operations
52
FINANCIAL POSITION
Loans In 2009, the Corporation increased loan balances by $14.030 million, or 3.79%, from 2008 year-end loan balances of $370.280 million. The loan growth in 2009 compares to loan growth in 2008 of $15.201 million, or 4.28% from 2007 year-end loan balances of $355.079 million. The loan growth in 2009 and 2008 was accomplished despite high loan amortization and principal payoffs on existing portfolio loans of $60.4 million in 2009 and $51.2 million in 2008. Management continues to actively manage the loan portfolio, seeking to identify and resolve problem assets at an early stage. Management believes a properly positioned loan portfolio provides the most attractive earning asset yield available to the Corporation and, with changes to the loan approval process and exception reporting, management can effectively manage the risk in the loan portfolio. Management intends to continue loan growth within its markets for mortgage, consumer, and commercial loan products while concentrating on loan quality, industry concentration issues, and competitive pricing. Loans represented 74.57% of total assets at the end of 2009 compared to 82.02% at the end of 2008. The loan to deposit ratio, at 91.2%, is higher than a peer average of approximately 82.7% due in part to the Bank’s utilization of Federal Home Loan Bank long-term borrowings as a funding source. Following is a summary of the Corporation’s loan balances at December 31 (dollars in thousands):
2009 2008 2007 2009-2008 2008-2007
Commercial real estate 208,895$ 185,241$ 171,695$ 12.77 % 7.89 %Commercial, financial, and agricultural 72,184 79,734 78,192 (9.47) 1.97 One-to-four family residential real estate 67,232 65,595 57,613 2.50 13.85 Construction: Consumer 7,118 4,852 5,090 46.70 (4.68) Commercial 24,591 31,113 38,952 (20.96) (20.12)Consumer 4,290 3,745 3,537 14.55 5.88
Total 384,310$ 370,280$ 355,079$ 3.79 % 4.28 %
Percent Change
The above table more clearly illustrates the growth of the loan portfolio from 2007 through 2009 year end. The Corporation continues to feel that a properly positioned loan portfolio is the most attractive earning asset available. The Corporation is highly competitive in structuring loans to meet borrowing needs and satisfy strong underwriting requirements. Our commercial real estate loan portfolio predominantly relates to owner occupied real estate, and our loans are generally secured by a first mortgage lien. Commercial real estate market conditions continued to be under stress in 2009, and we expect this trend to continue. These conditions may negatively affect our commercial real estate loan portfolio in future periods. We make commercial loans for many purposes, including: working capital lines, which are generally renewable annually and supported by business assets, personal guarantees and additional collateral. Commercial business lending is generally considered to involve a higher degree of risk than traditional consumer bank lending. Looking forward, based upon the current economic outlook for the Michigan economy, management believes there will be limited opportunity for loan growth in the near term. The Corporation will continue to use a demanding pricing model for all new credit opportunities and existing loan renewals.
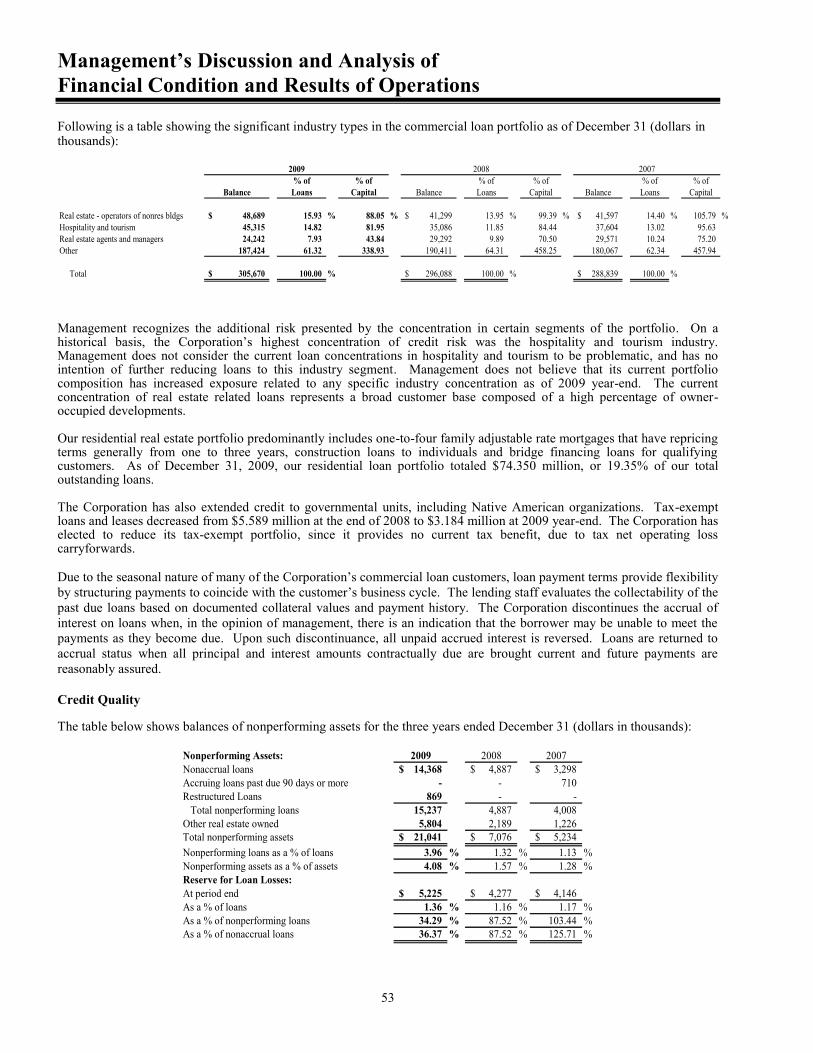
Management’s Discussion and Analysis of Financial Condition and Results of Operations
53
Following is a table showing the significant industry types in the commercial loan portfolio as of December 31 (dollars in thousands):
% of % of % of % of % of % ofBalance Loans Capital Balance Loans Capital Balance Loans Capital
Real estate - operators of nonres bldgs 48,689$ 15.93 % 88.05 % 41,299$ 13.95 % 99.39 % 41,597$ 14.40 % 105.79 %Hospitality and tourism 45,315 14.82 81.95 35,086 11.85 84.44 37,604 13.02 95.63 Real estate agents and managers 24,242 7.93 43.84 29,292 9.89 70.50 29,571 10.24 75.20 Other 187,424 61.32 338.93 190,411 64.31 458.25 180,067 62.34 457.94
Total 305,670$ 100.00 % 296,088$ 100.00 % 288,839$ 100.00 %
2008 20072009
Management recognizes the additional risk presented by the concentration in certain segments of the portfolio. On a historical basis, the Corporation’s highest concentration of credit risk was the hospitality and tourism industry. Management does not consider the current loan concentrations in hospitality and tourism to be problematic, and has no intention of further reducing loans to this industry segment. Management does not believe that its current portfolio composition has increased exposure related to any specific industry concentration as of 2009 year-end. The current concentration of real estate related loans represents a broad customer base composed of a high percentage of owner-occupied developments. Our residential real estate portfolio predominantly includes one-to-four family adjustable rate mortgages that have repricing terms generally from one to three years, construction loans to individuals and bridge financing loans for qualifying customers. As of December 31, 2009, our residential loan portfolio totaled $74.350 million, or 19.35% of our total outstanding loans. The Corporation has also extended credit to governmental units, including Native American organizations. Tax-exempt loans and leases decreased from $5.589 million at the end of 2008 to $3.184 million at 2009 year-end. The Corporation has elected to reduce its tax-exempt portfolio, since it provides no current tax benefit, due to tax net operating loss carryforwards. Due to the seasonal nature of many of the Corporation’s commercial loan customers, loan payment terms provide flexibility by structuring payments to coincide with the customer’s business cycle. The lending staff evaluates the collectability of the past due loans based on documented collateral values and payment history. The Corporation discontinues the accrual of interest on loans when, in the opinion of management, there is an indication that the borrower may be unable to meet the payments as they become due. Upon such discontinuance, all unpaid accrued interest is reversed. Loans are returned to accrual status when all principal and interest amounts contractually due are brought current and future payments are reasonably assured. Credit Quality The table below shows balances of nonperforming assets for the three years ended December 31 (dollars in thousands):
Nonperforming Assets: 2009 2008 200714,368$ 4,887$ 3,298$
Accruing loans past due 90 days or more - - 710 Restructured Loans 869 - - Total nonperforming loans 15,237 4,887 4,008 Other real estate owned 5,804 2,189 1,226 Total nonperforming assets 21,041$ 7,076$ 5,234$ Nonperforming loans as a % of loans 3.96 % 1.32 % 1.13 %Nonperforming assets as a % of assets 4.08 % 1.57 % 1.28 %Reserve for Loan Losses:At period end 5,225$ 4,277$ 4,146$ As a % of loans 1.36 % 1.16 % 1.17 %As a % of nonperforming loans 34.29 % 87.52 % 103.44 %As a % of nonaccrual loans 36.37 % 87.52 % 125.71 %
Nonaccrual loans
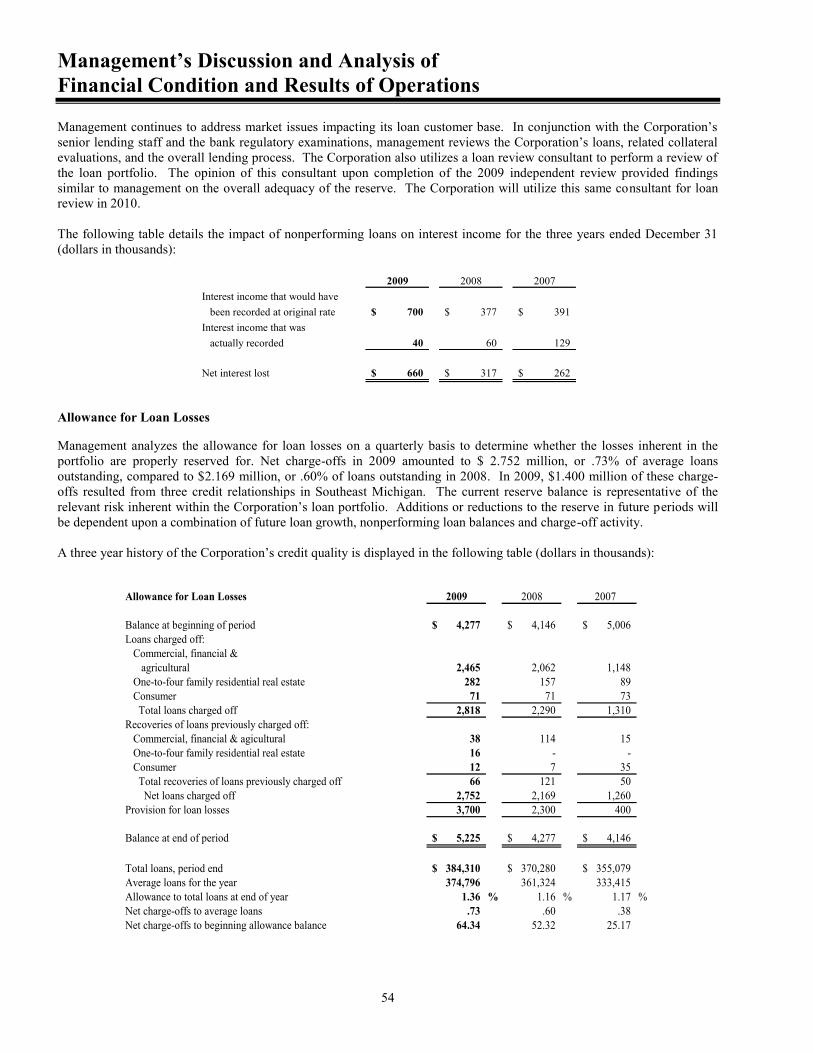
Management’s Discussion and Analysis of Financial Condition and Results of Operations
54
Management continues to address market issues impacting its loan customer base. In conjunction with the Corporation’s senior lending staff and the bank regulatory examinations, management reviews the Corporation’s loans, related collateral evaluations, and the overall lending process. The Corporation also utilizes a loan review consultant to perform a review of the loan portfolio. The opinion of this consultant upon completion of the 2009 independent review provided findings similar to management on the overall adequacy of the reserve. The Corporation will utilize this same consultant for loan review in 2010. The following table details the impact of nonperforming loans on interest income for the three years ended December 31 (dollars in thousands):
2009 2008 2007Interest income that would have been recorded at original rate 700$ 377$ 391$ Interest income that was actually recorded 40 60 129
Net interest lost 660$ 317$ 262$
Allowance for Loan Losses Management analyzes the allowance for loan losses on a quarterly basis to determine whether the losses inherent in the portfolio are properly reserved for. Net charge-offs in 2009 amounted to $ 2.752 million, or .73% of average loans outstanding, compared to $2.169 million, or .60% of loans outstanding in 2008. In 2009, $1.400 million of these charge-offs resulted from three credit relationships in Southeast Michigan. The current reserve balance is representative of the relevant risk inherent within the Corporation’s loan portfolio. Additions or reductions to the reserve in future periods will be dependent upon a combination of future loan growth, nonperforming loan balances and charge-off activity. A three year history of the Corporation’s credit quality is displayed in the following table (dollars in thousands):
Allowance for Loan Losses 2009 2008 2007
Balance at beginning of period 4,277$ 4,146$ 5,006$ Loans charged off: Commercial, financial & agricultural 2,465 2,062 1,148 One-to-four family residential real estate 282 157 89 Consumer 71 71 73 Total loans charged off 2,818 2,290 1,310 Recoveries of loans previously charged off: Commercial, financial & agicultural 38 114 15 One-to-four family residential real estate 16 - - Consumer 12 7 35 Total recoveries of loans previously charged off 66 121 50 Net loans charged off 2,752 2,169 1,260 Provision for loan losses 3,700 2,300 400
Balance at end of period 5,225$ 4,277$ 4,146$
Total loans, period end 384,310$ 370,280$ 355,079$ Average loans for the year 374,796 361,324 333,415 Allowance to total loans at end of year 1.36 % 1.16 % 1.17 %Net charge-offs to average loans .73 .60 .38 Net charge-offs to beginning allowance balance 64.34 52.32 25.17
Management’s Discussion and Analysis of Financial Condition and Results of Operations
55
The computation of the required allowance for loan losses as of any point in time is one of the critical accounting estimates made by management in the financial statements. As such, factors used to establish the allowance could change significantly from the assumptions made and impact future earnings positively or negatively. The future of the national and local economies and the resulting impact on borrowers’ ability to repay their loans and the value of collateral are examples of areas where assumptions must be made for individual loans, as well as the overall portfolio. The Corporation’s computation of the allowance for loan losses follows the Interagency Policy Statement on Allowance for Loan and Lease Losses Methodologies and Documentation for Banks and Savings Associations issued by the Federal Financial Institutions Examination Council (FFIEC) in July 2001. The computation of the allowance for loan losses considers prevailing local and national economic conditions as well as past and present underwriting practices. As part of the management of the loan portfolio, risk ratings are assigned to all commercial loans. Through the loan review process, ratings are modified as believed to be appropriate to reflect changes in the credit. Our ability to manage credit risk depends in large part on our ability to properly identify and manage problem loans. To do so, we operate a credit risk rating system under which our credit management personnel assign a credit risk rating to each loan at the time of origination and review loans on a regular basis to determine each loan’s credit risk rating on a scale of 1 through 8, with higher scores indicating higher risk. The credit risk rating structure used is shown below. In the context of the credit risk rating structure, the term Classified is defined as a problem loan which may or may not be in a nonaccrual status, dependent upon current payment status and collectability.
Excellent (1) Borrower is not vulnerable to sudden economic or technological changes and is in a non-seasonal business or industry. These loans generally would be characterized by having good experienced management and a strong liquidity position with minimal leverage. Good (2) Borrower shows limited vulnerability to sudden economic change with modest seasonal effect. Borrower has ―above average‖ financial statements and an acceptable repayment history with minimal leverage and a profitability that exceeds peers. Average (3) Generally, a borrower rated as average may be susceptible to unfavorable changes in the economy and somewhat effected by seasonal factors. Some product lines may be affected by technological change. Borrowers in this category exhibit stable earnings, with a satisfactory payment history. Acceptable (4) The loan is an otherwise acceptable credit that warrants a higher level of administration due to various underlying weaknesses. These weaknesses, however, have not and may never deteriorate to the point of a Special Mention rating or Classified status. This rating category may include new businesses not yet having established a firm performance record. Special Mention (5) The loan is not considered as a Classified status, however may exhibit material weaknesses that, if not corrected, may cause future problems. Borrowers in this category warrant special attention but have not yet reached the point of concern for loss. The borrower may have deteriorated to the point that they would have difficulty refinancing elsewhere. Similarly, purchasers of these businesses would not be eligible for bank financing unless they represent a significantly stronger credit risk. Substandard (6) The loan is Classified and exhibits a number of well-defined weaknesses that jeopardize normal repayment. The assets are no longer adequately protected due to declining net worth, lack of earning capacity or insufficient collateral offering the distinct possibility of the loss of a portion of the loan principal. Loans within this category clearly represent troubled and deteriorating credit situations requiring constant supervision and an action plan must be developed and approved by the appropriate officers to mitigate the risk.

Management’s Discussion and Analysis of Financial Condition and Results of Operations
56
Doubtful (7) Loans in this category exhibit the same weaknesses used to describe the substandard credit; however, the traits are more pronounced. Loans are frozen with collection improbable. Such loans are not yet rated as Charge-off because certain actions may yet occur which would salvage the loan. Charge-off/Loss (8) Loans in this category are largely uncollectible and should be charged against the loan loss reserve immediately. General Reserves: For loans with a credit risk rating of 5 or better and any loans with a risk rating of 6 or 7 with no specific reserve, reserves are established based on the type of loan collateral, if any, and the assigned credit risk rating. Determination of the allowance is inherently subjective as it requires significant estimates, including the amounts and timing of expected future cash flows on impaired loans, estimated losses on pools of homogenous loans based on historical loss experience, and consideration of current environmental factors and economic trends, all of which may be susceptible to significant change.
Using a historical average loss by loan type as a base, each loan graded as higher risk is assigned a specific percentage. Within the commercial loan portfolio, the historical loss rates are used for specific industries such as hospitality, gaming, petroleum, and forestry. The residential real estate and consumer loan portfolios are assigned a loss percentage as a homogenous group. If, however, on an individual loan the projected loss based on collateral value and payment histories are in excess of the computed allowance, the allocation is increased for the higher anticipated loss. These computations provide the basis for the allowance for loan losses as recorded by the Corporation.
Following is a table showing the specific loan allocation of the allowance for loan losses at December 31, 2009 (dollars in thousands):
Commercial, financial and agricultural loans 4,805$ One-to-four family residential real estate loans 23 Consumer loans 13 Unallocated and general reserves 384
Total 5,225$
At the end of 2009, the allowance for loan losses represented 1.36% of total loans. In management’s opinion, the allowance for loan losses is adequate to cover probable losses related to specifically identified loans, as well as probable losses inherent in the balance of the loan portfolio. As part of the process of resolving problem credits, the Corporation may acquire ownership of real estate collateral which secured such credits. The Corporation carries this collateral in other real estate on the balance sheet. The following table represents the activity in other real estate (dollars in thousands):
Balance at January 1, 2008 1,226$ Other real estate transferred from loans due to foreclosure 2,849 Other real estate transferred to premises and equipment - Other real estate sold / written down (1,886)
Balance at December 31, 2008 2,189 Other real estate transferred from loans due to foreclosure 4,879 Reclassification of redemption ORE (475) Other real estate transferred to premises and equipment - Other real estate sold / written down (789)
Balance at December 31, 2009 5,804$
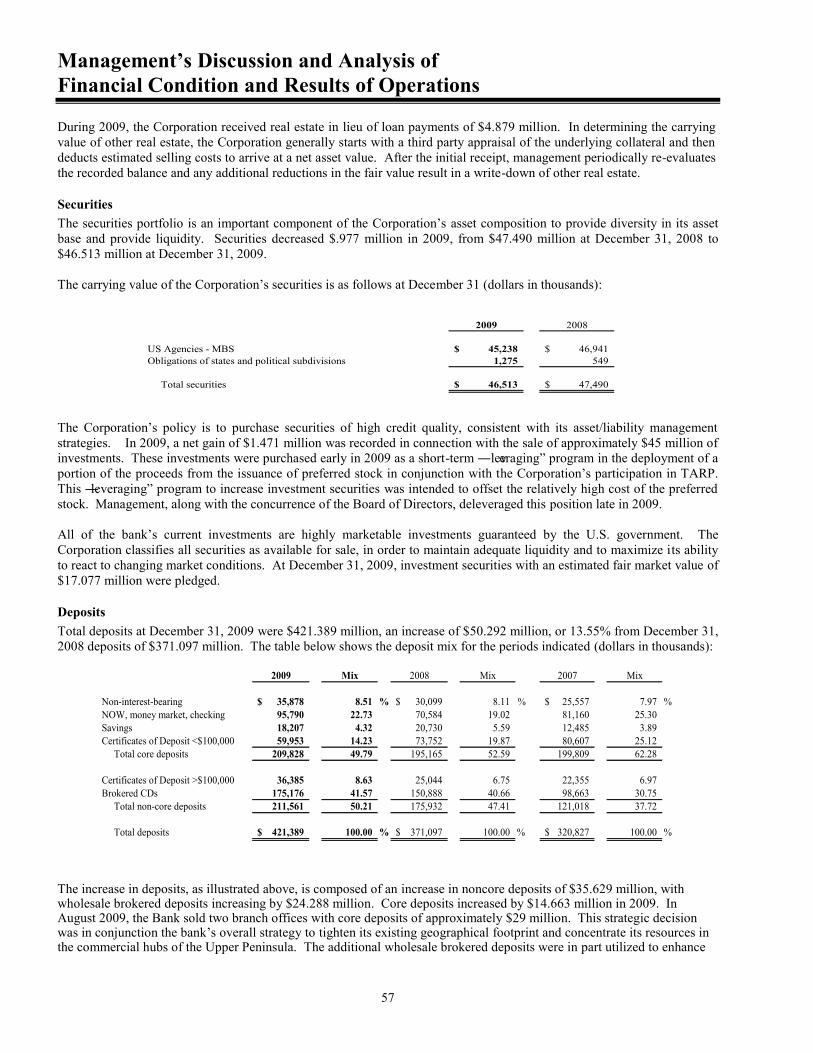
Management’s Discussion and Analysis of Financial Condition and Results of Operations
57
During 2009, the Corporation received real estate in lieu of loan payments of $4.879 million. In determining the carrying value of other real estate, the Corporation generally starts with a third party appraisal of the underlying collateral and then deducts estimated selling costs to arrive at a net asset value. After the initial receipt, management periodically re-evaluates the recorded balance and any additional reductions in the fair value result in a write-down of other real estate.
Securities The securities portfolio is an important component of the Corporation’s asset composition to provide diversity in its asset base and provide liquidity. Securities decreased $.977 million in 2009, from $47.490 million at December 31, 2008 to $46.513 million at December 31, 2009. The carrying value of the Corporation’s securities is as follows at December 31 (dollars in thousands):
2009 2008
US Agencies - MBS 45,238$ 46,941$ Obligations of states and political subdivisions 1,275 549
Total securities 46,513$ 47,490$
The Corporation’s policy is to purchase securities of high credit quality, consistent with its asset/liability management strategies. In 2009, a net gain of $1.471 million was recorded in connection with the sale of approximately $45 million of investments. These investments were purchased early in 2009 as a short-term ―leveraging‖ program in the deployment of a portion of the proceeds from the issuance of preferred stock in conjunction with the Corporation’s participation in TARP. This ―leveraging‖ program to increase investment securities was intended to offset the relatively high cost of the preferred stock. Management, along with the concurrence of the Board of Directors, deleveraged this position late in 2009. All of the bank’s current investments are highly marketable investments guaranteed by the U.S. government. The Corporation classifies all securities as available for sale, in order to maintain adequate liquidity and to maximize its ability to react to changing market conditions. At December 31, 2009, investment securities with an estimated fair market value of $17.077 million were pledged.
Deposits Total deposits at December 31, 2009 were $421.389 million, an increase of $50.292 million, or 13.55% from December 31, 2008 deposits of $371.097 million. The table below shows the deposit mix for the periods indicated (dollars in thousands):
2009 Mix 2008 Mix 2007 Mix
Non-interest-bearing 35,878$ 8.51 % 30,099$ 8.11 % 25,557$ 7.97 %NOW, money market, checking 95,790 22.73 70,584 19.02 81,160 25.30 Savings 18,207 4.32 20,730 5.59 12,485 3.89 Certificates of Deposit <$100,000 59,953 14.23 73,752 19.87 80,607 25.12 Total core deposits 209,828 49.79 195,165 52.59 199,809 62.28
Certificates of Deposit >$100,000 36,385 8.63 25,044 6.75 22,355 6.97 Brokered CDs 175,176 41.57 150,888 40.66 98,663 30.75 Total non-core deposits 211,561 50.21 175,932 47.41 121,018 37.72
Total deposits 421,389$ 100.00 % 371,097$ 100.00 % 320,827$ 100.00 %
The increase in deposits, as illustrated above, is composed of an increase in noncore deposits of $35.629 million, with wholesale brokered deposits increasing by $24.288 million. Core deposits increased by $14.663 million in 2009. In August 2009, the Bank sold two branch offices with core deposits of approximately $29 million. This strategic decision was in conjunction the bank’s overall strategy to tighten its existing geographical footprint and concentrate its resources in the commercial hubs of the Upper Peninsula. The additional wholesale brokered deposits were in part utilized to enhance
Management’s Discussion and Analysis of Financial Condition and Results of Operations
58
balance sheet liquidity and to fund the acquisition of investments purchased in the TARP leveraging program discussed earlier in this management discussion, the Corporation expects near term reduction of wholesale deposits to a level of approximately $100 million as current issues mature. Although the Corporation has been successful in growing core deposits, the high level of funding required by loan growth has resulted in increased reliance upon brokered deposits. As of December 31, 2009, non-core deposits amounted to 50.21% of total deposits, an increase from 47.41% at 2008 year-end. A portion, approximately $40.000 million, of the increase in brokered deposits was used to augment liquidity through the purchase of investment securities. The Bank had $175.176 million in brokered deposits at December 31, 2009, 41.57% of total deposits. Management continues to monitor existing deposit products in order to stay competitive, both as to terms and pricing. It is the intent of management to be aggressive in its markets to grow core deposits with an emphasis placed on transactional accounts. Borrowings The Corporation historically used alternative funding sources to provide long-term, stable sources of funds. Current borrowings total $35.000 million with stated maturities ranging through 2011. Borrowings at year end include $20.000 million with adjustable rates that reprice quarterly based upon the three month LIBOR. The FHLB has the option to convert the remaining $15.000 million fixed-rate advances to adjustable rate advances on the original call date and quarterly thereafter.
Shareholders’ Equity Changes in shareholders’ equity are discussed in detail in the ―Capital and Regulatory‖ section of this report.
RESULTS OF OPERATIONS
Summary The Corporation reported net income available to common shareholders of $1.907 million in 2009, compared to net income of $1.872 million in 2008 and a net income of $10.163 million in 2007. As previously mentioned, the 2009 results include $1.208 million of gains related to branch office sales and $1.471 million of security gains. The 2008 operating results include the positive effect, $3.475 million of a lawsuit settlement, and the negative effect, $.425 million of a severance agreement. The 2007 results of operations include the $7.500 million recognition of a deferred tax benefit pertaining to NOL and tax credit carryforwards. Also included in the 2007 results is $.470 million from the settlement of the lawsuit against the Corporation’s former accountants.

Management’s Discussion and Analysis of Financial Condition and Results of Operations
59
The following table details changes in earnings and earnings per share for the three years ended December 31 (dollars in thousands, except for per share data):
2009 2008 2007Dollars Dollars Dollars Dollars Per Share Dollars Per Share
Interest Income 23,708$ 24,562$ 28,695$ (854)$ (.25)$ (4,133)$ (1.21)$ Interest Expense 7,421 11,698 15,278 (4,277) (1.25) (3,580) (1.05) Net Interest Income 16,287 12,864 13,417 3,423 1.00 (553) (.16) Provision for loan losses 3,700 2,300 400 1,400 .41 1,900 .56 Net interest income after provision 12,587 10,564 13,017 2,023 .59 (2,453) (.72) Noninterest Income: Service fees 1,023 838 688 185 .05 150 .04 Net gains on sale of secondary market loans 737 120 498 617 .18 (378) (.11) Proceeds from settlement of lawsuits - 3,475 470 (3,475) (1.01) 3,005 .88 Other 2,991 220 350 2,771 .81 (130) (.04) Total noninterest income 4,751 4,653 2,006 98 .04 2,647 .77 Noninterest Expense: Salaries and employee benefits 6,583 6,886 6,757 (303) (.09) 129 .04 Occupancy 1,385 1,374 1,272 11 .00 102 .03 Furniture and equipment 805 771 678 34 .01 93 .03 Data processing 862 844 785 18 .01 59 .02 Professional services: Accounting 261 254 308 7 .00 (54) (.02) Legal 95 41 42 54 .02 (1) .00 Consulting and other 247 213 182 34 .01 31 .01 Loan and deposit 933 488 250 445 .13 238 .07 FDIC insurance premiums 839 81 35 758 .22 46 .01 Telephone 187 170 228 17 .00 (58) (.02) Advertising 322 305 370 17 .00 (65) (.02) Other 1,283 1,131 1,193 152 .05 (62) (.02) Total noninterest expense 13,802 12,558 12,100 1,244 .36 458 .13 Income (loss) before provision for income taxes 3,536 2,659 2,923 877 .26 (264) (.08) Provision (credit) for income taxes 1,120 787 (7,240) 333 .10 8,027 2.34 Net Income 2,416 1,872 10,163 544 .16 (8,291) (2.42) Preferred dividend and accretion of discount 509 - - 509 .15 - - Net income available to common shareholders, current period 1,907$ 1,872$ 10,163$ 35$ .16$ (8,291)$ (2.42)$
Change2008-2007
Income/Expense2009-2008
Net Interest Income
Net interest income is the Corporation’s primary source of core earnings. Net interest income represents the difference between the average yield earned on interest-earning assets and the average rate paid on interest-bearing obligations. The net interest income is impacted by economic and competitive factors that influence rates, loan demand, and the availability of funding. Net interest income increased $3.423 million to $16.287 million, in 2009. In 2009, the Corporation benefited from low interest rates prevalent on wholesale deposit instruments. The interest rates in the wholesale environment were significantly more attractive than offering rates by competitors in local markets. In addition to the benefits derived from lower rates or wholesale deposit instruments a number of new or rewritten loans were structured with interest rate floors that locked in a near term favorable interest rate spread. Net interest income decreased $.553 million to $12.864 million, in 2008. The decrease in net interest income for 2008 was primarily the result of prime rate reductions that translated into lower yields on the Corporation’s earning assets, specifically variable rate commercial loans and short-term investments which reprice immediately. Offering rates on brokered certificates of deposit are influenced by other factors, such as overall market liquidity. During most of 2008, rates on brokered deposits were high due to overall liquidity issues prevalent in the financial markets. Throughout 2008, as interest rates continued to decline and economic conditions deteriorated, management evaluated new and existing credit
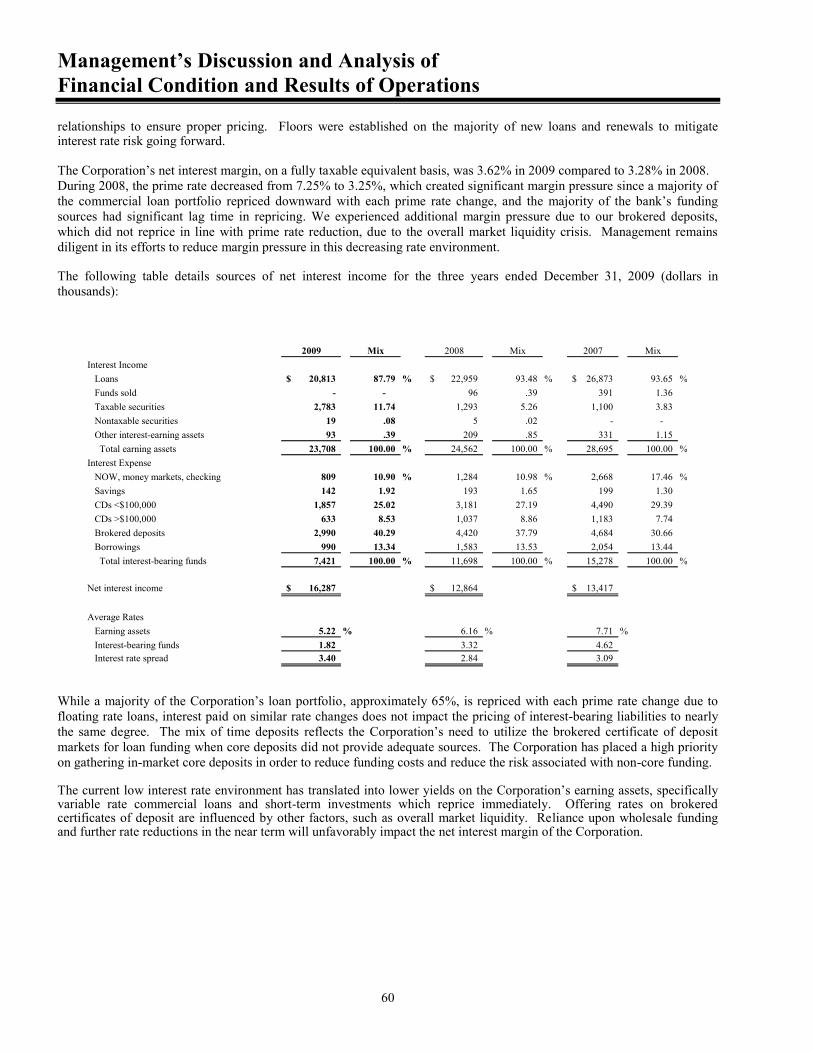
Management’s Discussion and Analysis of Financial Condition and Results of Operations
60
relationships to ensure proper pricing. Floors were established on the majority of new loans and renewals to mitigate interest rate risk going forward. The Corporation’s net interest margin, on a fully taxable equivalent basis, was 3.62% in 2009 compared to 3.28% in 2008. During 2008, the prime rate decreased from 7.25% to 3.25%, which created significant margin pressure since a majority of the commercial loan portfolio repriced downward with each prime rate change, and the majority of the bank’s funding sources had significant lag time in repricing. We experienced additional margin pressure due to our brokered deposits, which did not reprice in line with prime rate reduction, due to the overall market liquidity crisis. Management remains diligent in its efforts to reduce margin pressure in this decreasing rate environment. The following table details sources of net interest income for the three years ended December 31, 2009 (dollars in thousands):
2009 Mix 2008 Mix 2007 MixInterest Income Loans 20,813$ 87.79 % 22,959$ 93.48 % 26,873$ 93.65 % Funds sold - - 96 .39 391 1.36 Taxable securities 2,783 11.74 1,293 5.26 1,100 3.83 Nontaxable securities 19 .08 5 .02 - - Other interest-earning assets 93 .39 209 .85 331 1.15 Total earning assets 23,708 100.00 % 24,562 100.00 % 28,695 100.00 %Interest Expense NOW, money markets, checking 809 10.90 % 1,284 10.98 % 2,668 17.46 % Savings 142 1.92 193 1.65 199 1.30 CDs <$100,000 1,857 25.02 3,181 27.19 4,490 29.39 CDs >$100,000 633 8.53 1,037 8.86 1,183 7.74 Brokered deposits 2,990 40.29 4,420 37.79 4,684 30.66 Borrowings 990 13.34 1,583 13.53 2,054 13.44 Total interest-bearing funds 7,421 100.00 % 11,698 100.00 % 15,278 100.00 %
Net interest income 16,287$ 12,864$ 13,417$
Average Rates Earning assets 5.22 % 6.16 % 7.71 % Interest-bearing funds 1.82 3.32 4.62 Interest rate spread 3.40 2.84 3.09
While a majority of the Corporation’s loan portfolio, approximately 65%, is repriced with each prime rate change due to floating rate loans, interest paid on similar rate changes does not impact the pricing of interest-bearing liabilities to nearly the same degree. The mix of time deposits reflects the Corporation’s need to utilize the brokered certificate of deposit markets for loan funding when core deposits did not provide adequate sources. The Corporation has placed a high priority on gathering in-market core deposits in order to reduce funding costs and reduce the risk associated with non-core funding. The current low interest rate environment has translated into lower yields on the Corporation’s earning assets, specifically variable rate commercial loans and short-term investments which reprice immediately. Offering rates on brokered certificates of deposit are influenced by other factors, such as overall market liquidity. Reliance upon wholesale funding and further rate reductions in the near term will unfavorably impact the net interest margin of the Corporation.
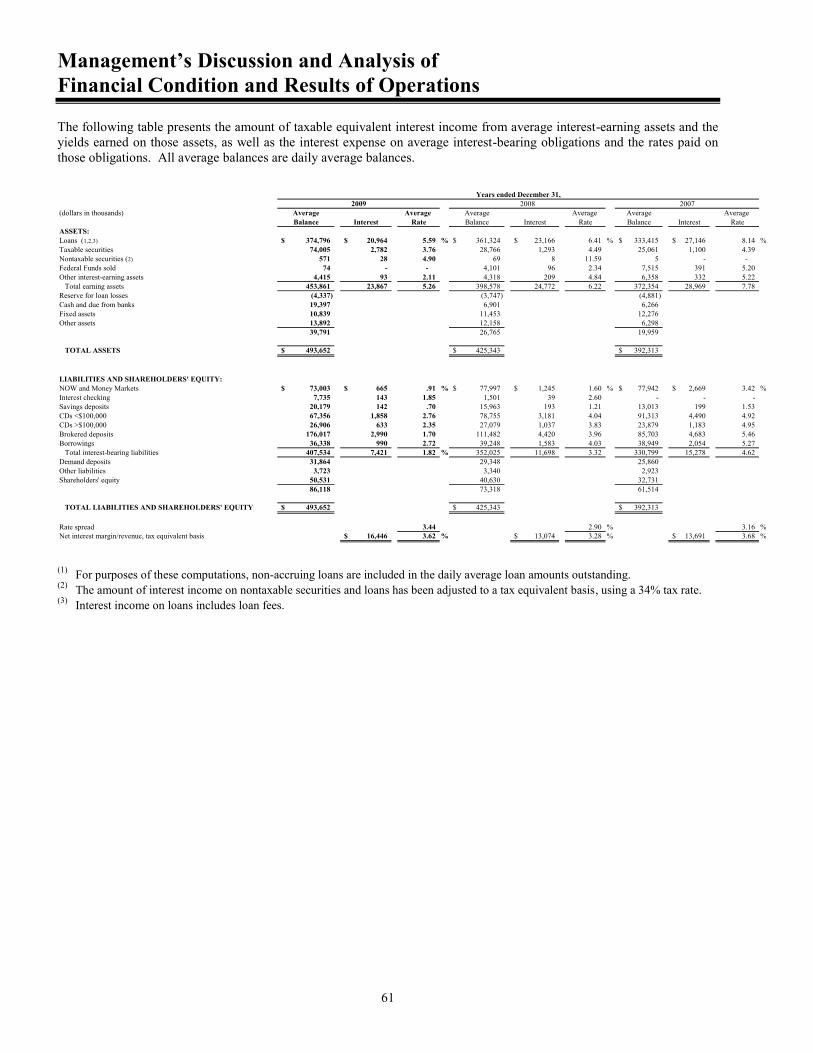
Management’s Discussion and Analysis of Financial Condition and Results of Operations
61
The following table presents the amount of taxable equivalent interest income from average interest-earning assets and the yields earned on those assets, as well as the interest expense on average interest-bearing obligations and the rates paid on those obligations. All average balances are daily average balances.
(dollars in thousands) Average Average Average Average Average Average Balance Interest Rate Balance Interest Rate Balance Interest Rate
ASSETS:Loans (1,2,3) 374,796$ 20,964$ 5.59 % 361,324$ 23,166$ 6.41 % 333,415$ 27,146$ 8.14 %Taxable securities 74,005 2,782 3.76 28,766 1,293 4.49 25,061 1,100 4.39 Nontaxable securities (2) 571 28 4.90 69 8 11.59 5 - - Federal Funds sold 74 - - 4,101 96 2.34 7,515 391 5.20 Other interest-earning assets 4,415 93 2.11 4,318 209 4.84 6,358 332 5.22 Total earning assets 453,861 23,867 5.26 398,578 24,772 6.22 372,354 28,969 7.78 Reserve for loan losses (4,337) (3,747) (4,881) Cash and due from banks 19,397 6,901 6,266 Fixed assets 10,839 11,453 12,276 Other assets 13,892 12,158 6,298
39,791 26,765 19,959
TOTAL ASSETS 493,652$ 425,343$ 392,313$
LIABILITIES AND SHAREHOLDERS' EQUITY:NOW and Money Markets 73,003$ 665$ .91 % 77,997$ 1,245$ 1.60 % 77,942$ 2,669$ 3.42 %Interest checking 7,735 143 1.85 1,501 39 2.60 - - - Savings deposits 20,179 142 .70 15,963 193 1.21 13,013 199 1.53 CDs <$100,000 67,356 1,858 2.76 78,755 3,181 4.04 91,313 4,490 4.92 CDs >$100,000 26,906 633 2.35 27,079 1,037 3.83 23,879 1,183 4.95 Brokered deposits 176,017 2,990 1.70 111,482 4,420 3.96 85,703 4,683 5.46 Borrowings 36,338 990 2.72 39,248 1,583 4.03 38,949 2,054 5.27 Total interest-bearing liabilities 407,534 7,421 1.82 % 352,025 11,698 3.32 330,799 15,278 4.62 Demand deposits 31,864 29,348 25,860 Other liabilities 3,723 3,340 2,923 Shareholders' equity 50,531 40,630 32,731
86,118 73,318 61,514
TOTAL LIABILITIES AND SHAREHOLDERS' EQUITY 493,652$ 425,343$ 392,313$
Rate spread 3.44 2.90 % 3.16 %Net interest margin/revenue, tax equivalent basis 16,446$ 3.62 % 13,074$ 3.28 % 13,691$ 3.68 %
200720082009Years ended December 31,
(1) For purposes of these computations, non-accruing loans are included in the daily average loan amounts outstanding. (2) The amount of interest income on nontaxable securities and loans has been adjusted to a tax equivalent basis, using a 34% tax rate. (3) Interest income on loans includes loan fees.

Management’s Discussion and Analysis of Financial Condition and Results of Operations
62
The following table presents the dollar amount, in thousands, of changes in taxable equivalent interest income and interest expense for major components of interest-earning assets and interest-bearing obligations. It distinguishes between changes related to higher or lower outstanding balances and changes due to the levels and fluctuations in interest rates. For each category of interest-earning assets and interest-bearing obligations, information is provided for changes attributable to (i) changes in volume (i.e. changes in volume multiplied by prior period rate) and (ii) changes in rate (i.e., changes in rate multiplied by prior period volume). For purposes of this table, changes attributable to both rate and volume are shown as a separate variance.
Total TotalVolume Increase Volume Increase
Volume Rate and Rate (Decrease) Volume Rate and Rate (Decrease)
Interest earning assets:Loans 863$ (2,955)$ (110)$ (2,202)$ 2,271$ (5,768)$ (483)$ (3,980)$ Taxable securities 2,033 (212) (332) 1,489 163 26 4 193 Nontaxable securities 58 (5) (33) 20 - 1 7 8 Federal funds sold (94) (96) 94 (96) (178) (215) 98 (295) Other interest earning assets 5 (118) (3) (116) (107) (24) 8 (123)
Total interest earning assets 2,865$ (3,386)$ (384)$ (905)$ 2,149$ (5,980)$ (366)$ (4,197)$
Interest bearing obligationsNOW and money market deposits (80)$ (535)$ 35$ (580)$ 2$ (1,425)$ (1)$ (1,424)$ Interest checking 162 (11) (47) 104 - - 39 39 Savings deposits 51 (81) (21) (51) 45 (42) (9) (6) CDs <$100,000 (460) (1,010) 147 (1,323) (617) (802) 110 (1,309) CDs >$100,000 (7) (400) 3 (404) 159 (269) (36) (146) Brokered deposits 2,559 (2,526) (1,463) (1,430) 1,409 (1,285) (387) (263) Borrowings (117) (514) 38 (593) 16 (483) (4) (471)
Total interest bearing obligations 2,108$ (5,077)$ (1,308)$ (4,277)$ 1,014$ (4,306)$ (288)$ (3,580)$
Net interest income, tax equivalent basis 3,372$ (617)$
Increase (Decrease)
Years ended December 31,2008 vs. 2007
Increase (Decrease)Due to
2009 vs. 2008
Due to
Provision for Loan Losses The Corporation records a provision for loan losses when it believes it is necessary to adjust the allowance for loan losses to maintain an adequate level after considering factors such as loan charge-offs and recoveries, changes in identified levels of risk in the loan portfolio, changes in the mix of loans in the portfolio, loan growth, and other economic factors. During 2009, the Corporation recorded a provision for loan loss of $3.700 million, compared to a provision of $2.300 million in 2008. In the third quarter of 2007, the Corporation recorded a $.400 million provision in order to provide for the potential loss related to a commercial loan. Noninterest Income Noninterest income was $4.751 million, $4.653 million, and $2.006 million in 2009, 2008, and 2007, respectively. The principal recurring sources of noninterest income are the gains on the sale of secondary market loans and fees for services related to deposit and loan accounts. In 2009, the Corporation recorded a gain on the sale of two branch offices, $1.208 million, and a gain on security sales of $1.471 million. In 2008, the Corporation recorded the benefit of proceeds received, $3.475 million, from the settlement of a lawsuit. In 2007, the Corporation recognized $.470 million of income from the settlement of a lawsuit against its former accountants. Service fees were $1.023 million in 2009, while other noninterest income was $.219 million.
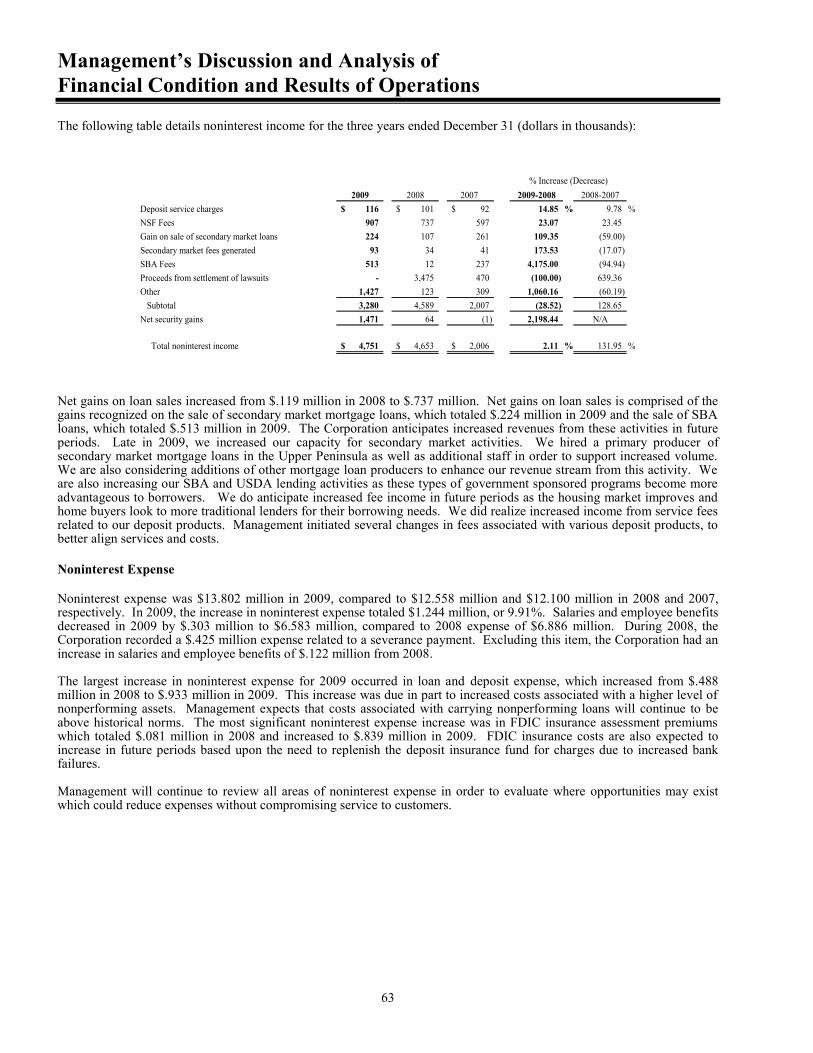
Management’s Discussion and Analysis of Financial Condition and Results of Operations
63
The following table details noninterest income for the three years ended December 31 (dollars in thousands):
2009 2008 2007 2009-2008 2008-2007Deposit service charges 116$ 101$ 92$ 14.85 % 9.78 %NSF Fees 907 737 597 23.07 23.45 Gain on sale of secondary market loans 224 107 261 109.35 (59.00) Secondary market fees generated 93 34 41 173.53 (17.07) SBA Fees 513 12 237 4,175.00 (94.94) Proceeds from settlement of lawsuits - 3,475 470 (100.00) 639.36 Other 1,427 123 309 1,060.16 (60.19) Subtotal 3,280 4,589 2,007 (28.52) 128.65 Net security gains 1,471 64 (1) 2,198.44 N/A
Total noninterest income 4,751$ 4,653$ 2,006$ 2.11 % 131.95 %
% Increase (Decrease)
Net gains on loan sales increased from $.119 million in 2008 to $.737 million. Net gains on loan sales is comprised of the gains recognized on the sale of secondary market mortgage loans, which totaled $.224 million in 2009 and the sale of SBA loans, which totaled $.513 million in 2009. The Corporation anticipates increased revenues from these activities in future periods. Late in 2009, we increased our capacity for secondary market activities. We hired a primary producer of secondary market mortgage loans in the Upper Peninsula as well as additional staff in order to support increased volume. We are also considering additions of other mortgage loan producers to enhance our revenue stream from this activity. We are also increasing our SBA and USDA lending activities as these types of government sponsored programs become more advantageous to borrowers. We do anticipate increased fee income in future periods as the housing market improves and home buyers look to more traditional lenders for their borrowing needs. We did realize increased income from service fees related to our deposit products. Management initiated several changes in fees associated with various deposit products, to better align services and costs.
Noninterest Expense Noninterest expense was $13.802 million in 2009, compared to $12.558 million and $12.100 million in 2008 and 2007, respectively. In 2009, the increase in noninterest expense totaled $1.244 million, or 9.91%. Salaries and employee benefits decreased in 2009 by $.303 million to $6.583 million, compared to 2008 expense of $6.886 million. During 2008, the Corporation recorded a $.425 million expense related to a severance payment. Excluding this item, the Corporation had an increase in salaries and employee benefits of $.122 million from 2008. The largest increase in noninterest expense for 2009 occurred in loan and deposit expense, which increased from $.488 million in 2008 to $.933 million in 2009. This increase was due in part to increased costs associated with a higher level of nonperforming assets. Management expects that costs associated with carrying nonperforming loans will continue to be above historical norms. The most significant noninterest expense increase was in FDIC insurance assessment premiums which totaled $.081 million in 2008 and increased to $.839 million in 2009. FDIC insurance costs are also expected to increase in future periods based upon the need to replenish the deposit insurance fund for charges due to increased bank failures. Management will continue to review all areas of noninterest expense in order to evaluate where opportunities may exist which could reduce expenses without compromising service to customers.
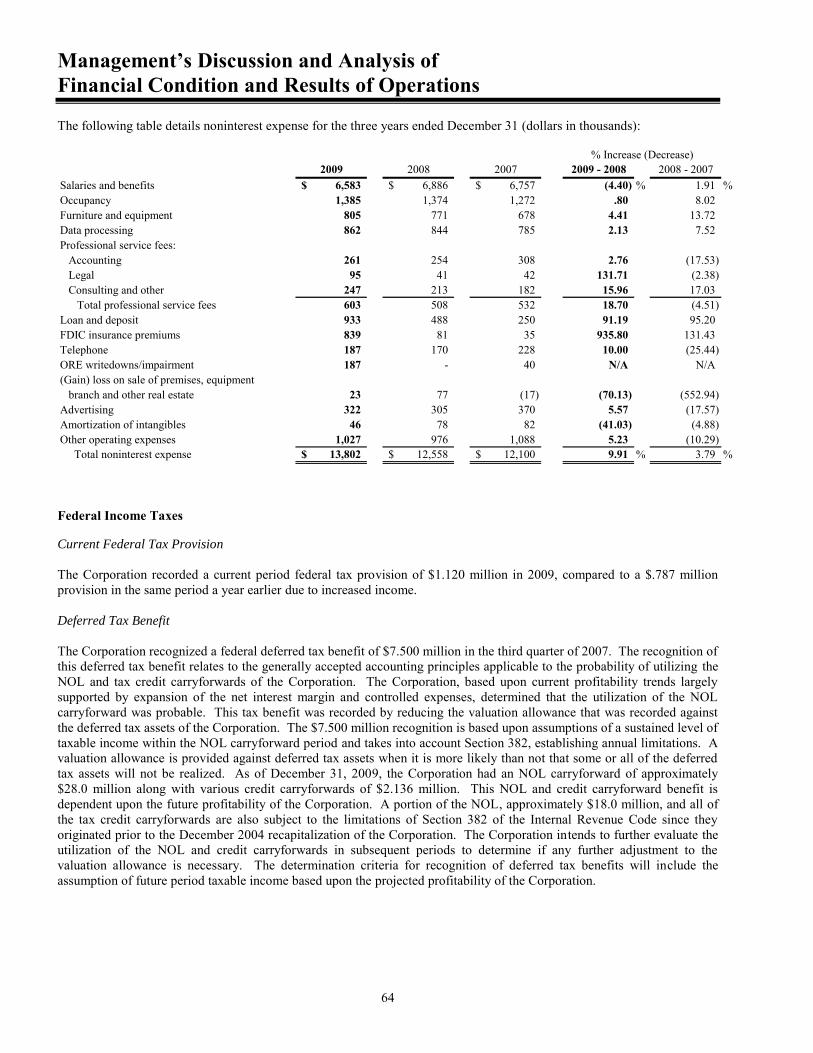
Management’s Discussion and Analysis of Financial Condition and Results of Operations
64
The following table details noninterest expense for the three years ended December 31 (dollars in thousands):
% Increase (Decrease)2009 2008 2007 2009 - 2008 2008 - 2007
Salaries and benefits 6,583$ 6,886$ 6,757$ (4.40) % 1.91 %Occupancy 1,385 1,374 1,272 .80 8.02 Furniture and equipment 805 771 678 4.41 13.72 Data processing 862 844 785 2.13 7.52 Professional service fees: Accounting 261 254 308 2.76 (17.53) Legal 95 41 42 131.71 (2.38) Consulting and other 247 213 182 15.96 17.03 Total professional service fees 603 508 532 18.70 (4.51) Loan and deposit 933 488 250 91.19 95.20 FDIC insurance premiums 839 81 35 935.80 131.43 Telephone 187 170 228 10.00 (25.44) ORE writedowns/impairment 187 - 40 N/A N/A(Gain) loss on sale of premises, equipment branch and other real estate 23 77 (17) (70.13) (552.94) Advertising 322 305 370 5.57 (17.57) Amortization of intangibles 46 78 82 (41.03) (4.88) Other operating expenses 1,027 976 1,088 5.23 (10.29) Total noninterest expense 13,802$ 12,558$ 12,100$ 9.91 % 3.79 %
Federal Income Taxes Current Federal Tax Provision
The Corporation recorded a current period federal tax provision of $1.120 million in 2009, compared to a $.787 million provision in the same period a year earlier due to increased income. Deferred Tax Benefit
The Corporation recognized a federal deferred tax benefit of $7.500 million in the third quarter of 2007. The recognition of this deferred tax benefit relates to the generally accepted accounting principles applicable to the probability of utilizing the NOL and tax credit carryforwards of the Corporation. The Corporation, based upon current profitability trends largely supported by expansion of the net interest margin and controlled expenses, determined that the utilization of the NOL carryforward was probable. This tax benefit was recorded by reducing the valuation allowance that was recorded against the deferred tax assets of the Corporation. The $7.500 million recognition is based upon assumptions of a sustained level of taxable income within the NOL carryforward period and takes into account Section 382, establishing annual limitations. A valuation allowance is provided against deferred tax assets when it is more likely than not that some or all of the deferred tax assets will not be realized. As of December 31, 2009, the Corporation had an NOL carryforward of approximately $28.0 million along with various credit carryforwards of $2.136 million. This NOL and credit carryforward benefit is dependent upon the future profitability of the Corporation. A portion of the NOL, approximately $18.0 million, and all of the tax credit carryforwards are also subject to the limitations of Section 382 of the Internal Revenue Code since they originated prior to the December 2004 recapitalization of the Corporation. The Corporation intends to further evaluate the utilization of the NOL and credit carryforwards in subsequent periods to determine if any further adjustment to the valuation allowance is necessary. The determination criteria for recognition of deferred tax benefits will include the assumption of future period taxable income based upon the projected profitability of the Corporation.
Management’s Discussion and Analysis of Financial Condition and Results of Operations
65
QUANTITATIVE AND QUALITATIVE DISCLOSURES ABOUT MARKET RISK
Interest Rate Risk In general, the Corporation attempts to manage interest rate risk by investing in a variety of assets which afford it an opportunity to reprice assets and increase interest income at a rate equal to or greater than the interest expense associated with repricing liabilities. Interest rate risk is the exposure of the Corporation to adverse movements in interest rates. The Corporation derives its income primarily from the excess of interest collected on its interest-earning assets over the interest paid on its interest-bearing obligations. The rates of interest the Corporation earns on its assets and owes on its obligations generally are established contractually for a period of time. Since market interest rates change over time, the Corporation is exposed to lower profitability if it cannot adapt to interest rate changes. Accepting interest rate risk can be an important source of profitability and shareholder value; however, excess levels of interest rate risk could pose a significant threat to the Corporation’s earnings and capital base. Accordingly, effective risk management that maintains interest rate risk at prudent levels is essential to the Corporation’s safety and soundness. Loans are the most significant earning asset. Management offers commercial and real estate loans priced at interest rates which fluctuate with various indices, such as the prime rate or rates paid on various government issued securities. When loans are made with longer-term fixed rates, the Corporation attempts to match these balances with sources of funding with similar maturities in order to mitigate interest rate risk. In addition, the Corporation prices loans so it has an opportunity to reprice the loan within 12 to 36 months. The Bank has $46.513 million of securities, with a weighted average maturity of 22 months. The investment portfolio is intended to provide a source of liquidity to the Corporation with limited interest rate risk. The Corporation may also elect to sell monies as investments in federal funds sold to correspondent banks, and has other interest bearing deposits with correspondent banks. These funds are generally repriced on a daily basis. The Corporation offers deposit products with a variety of terms ranging from deposits whose interest rates can change on a weekly basis to certificates of deposit with repricing terms of up to five years. Longer-term deposits generally include penalty provisions for early withdrawal. Beyond general efforts to shorten the loan pricing periods and extend deposit maturities, management can manage interest rate risk by the maturity periods of securities purchased, selling securities available for sale, and borrowing funds with targeted maturity periods, among other strategies. Also, the rate of interest rate changes can impact the actions taken, since the speed of change affects borrowers and depositors differently. Exposure to interest rate risk is reviewed on a regular basis. Interest rate risk is the potential of economic losses due to future interest rate changes. These economic losses can be reflected as a loss of future net interest income and/or a loss of current fair market values. The objective is to measure the effect of interest rate changes on net interest income and to structure the composition of the balance sheet to minimize interest rate risk and, at the same time, maximize income. Management realizes certain risks are inherent and that the goal is to identify and minimize the risks. Tools used by management include maturity and repricing analysis and interest rate sensitivity analysis. The Bank has monthly asset/ liability (―ALCO‖) meetings, whose membership includes senior management, board representation and third party investment consultants. During these monthly meetings, we review the current ALCO position and strategize about future opportunities on risks relative to pricing and positioning of assets and liabilities. The difference between repricing assets and liabilities for a specific period is referred to as the gap. An excess of repricable assets over liabilities is referred to as a positive gap. An excess of repricable liabilities over assets is referred to as a negative gap. The cumulative gap is the summation of the gap for all periods to the end of the period for which the cumulative gap is being measured. Assets and liabilities scheduled to reprice are reported in the following timeframes. Those instruments with a variable interest rate tied to an index and considered immediately repricable are reported in the 1 to 90 day timeframe. The
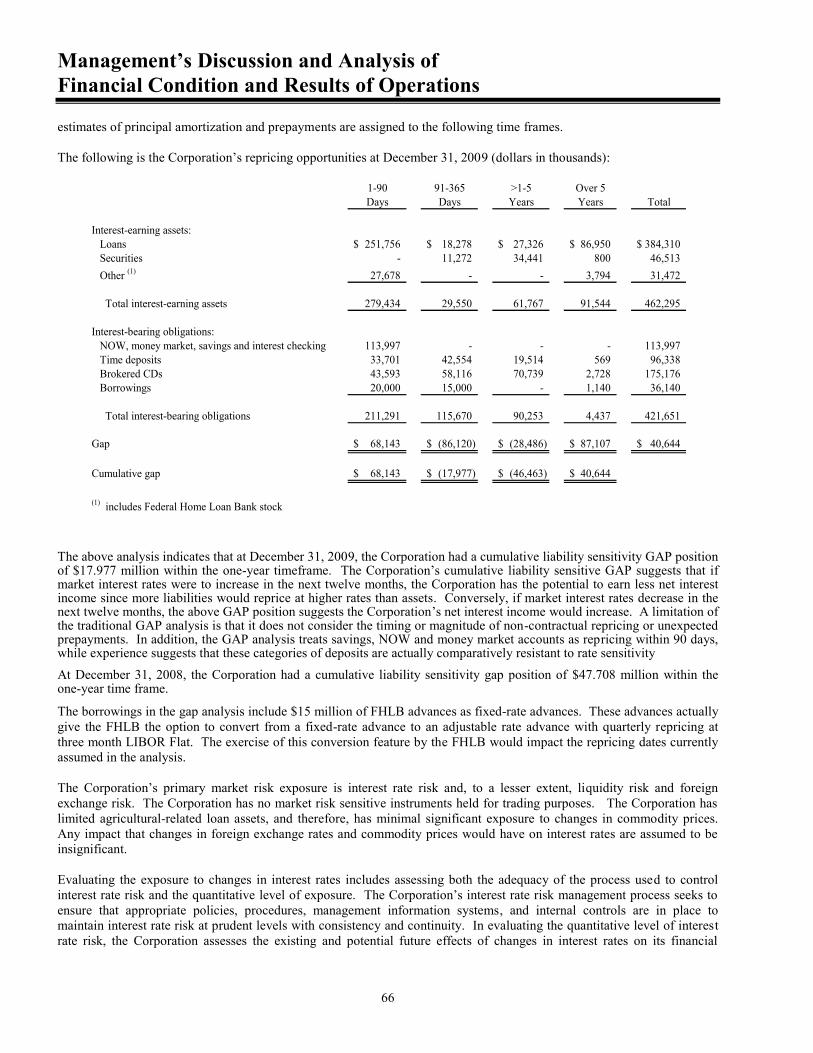
Management’s Discussion and Analysis of Financial Condition and Results of Operations
66
estimates of principal amortization and prepayments are assigned to the following time frames. The following is the Corporation’s repricing opportunities at December 31, 2009 (dollars in thousands):
1-90 91-365 >1-5 Over 5Days Days Years Years Total
Interest-earning assets: Loans 251,756$ 18,278$ 27,326$ 86,950$ 384,310$ Securities - 11,272 34,441 800 46,513 Other (1) 27,678 - - 3,794 31,472
Total interest-earning assets 279,434 29,550 61,767 91,544 462,295
Interest-bearing obligations: NOW, money market, savings and interest checking 113,997 - - - 113,997 Time deposits 33,701 42,554 19,514 569 96,338 Brokered CDs 43,593 58,116 70,739 2,728 175,176 Borrowings 20,000 15,000 - 1,140 36,140
Total interest-bearing obligations 211,291 115,670 90,253 4,437 421,651
Gap 68,143$ (86,120)$ (28,486)$ 87,107$ 40,644$
Cumulative gap 68,143$ (17,977)$ (46,463)$ 40,644$
(1) includes Federal Home Loan Bank stock
The above analysis indicates that at December 31, 2009, the Corporation had a cumulative liability sensitivity GAP position of $17.977 million within the one-year timeframe. The Corporation’s cumulative liability sensitive GAP suggests that if market interest rates were to increase in the next twelve months, the Corporation has the potential to earn less net interest income since more liabilities would reprice at higher rates than assets. Conversely, if market interest rates decrease in the next twelve months, the above GAP position suggests the Corporation’s net interest income would increase. A limitation of the traditional GAP analysis is that it does not consider the timing or magnitude of non-contractual repricing or unexpected prepayments. In addition, the GAP analysis treats savings, NOW and money market accounts as repricing within 90 days, while experience suggests that these categories of deposits are actually comparatively resistant to rate sensitivity At December 31, 2008, the Corporation had a cumulative liability sensitivity gap position of $47.708 million within the one-year time frame.
The borrowings in the gap analysis include $15 million of FHLB advances as fixed-rate advances. These advances actually give the FHLB the option to convert from a fixed-rate advance to an adjustable rate advance with quarterly repricing at three month LIBOR Flat. The exercise of this conversion feature by the FHLB would impact the repricing dates currently assumed in the analysis. The Corporation’s primary market risk exposure is interest rate risk and, to a lesser extent, liquidity risk and foreign exchange risk. The Corporation has no market risk sensitive instruments held for trading purposes. The Corporation has limited agricultural-related loan assets, and therefore, has minimal significant exposure to changes in commodity prices. Any impact that changes in foreign exchange rates and commodity prices would have on interest rates are assumed to be insignificant. Evaluating the exposure to changes in interest rates includes assessing both the adequacy of the process used to control interest rate risk and the quantitative level of exposure. The Corporation’s interest rate risk management process seeks to ensure that appropriate policies, procedures, management information systems, and internal controls are in place to maintain interest rate risk at prudent levels with consistency and continuity. In evaluating the quantitative level of interest rate risk, the Corporation assesses the existing and potential future effects of changes in interest rates on its financial
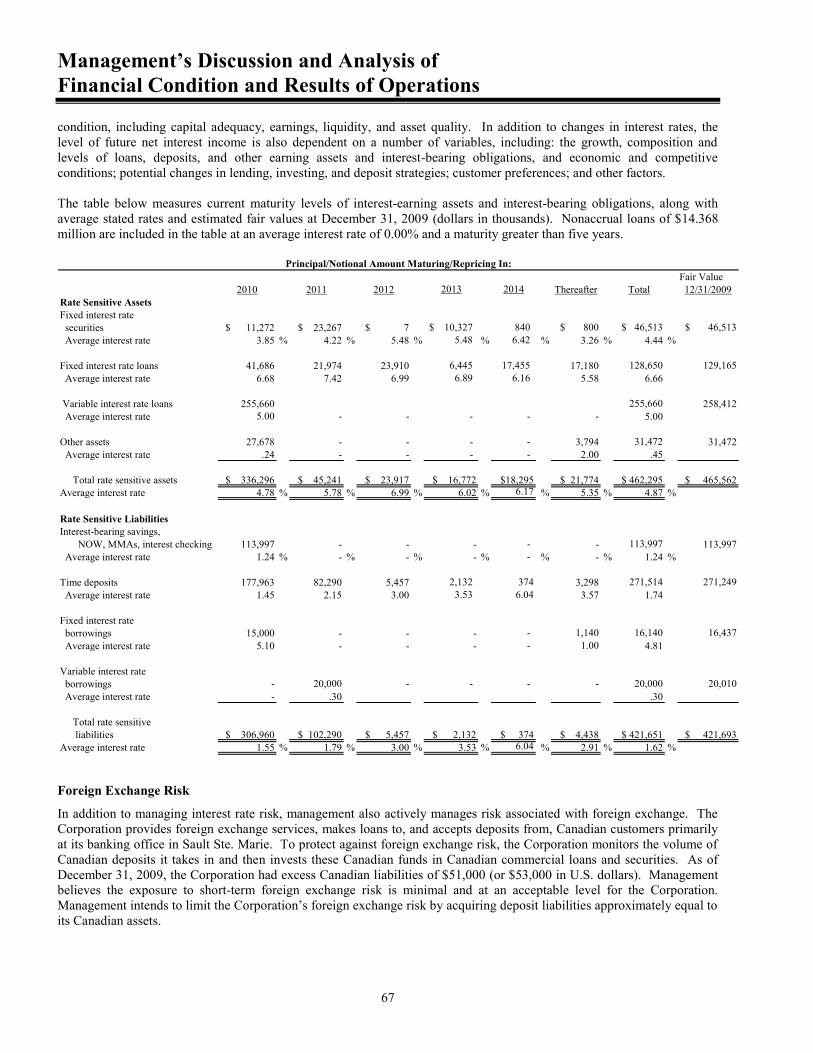
Management’s Discussion and Analysis of Financial Condition and Results of Operations
67
condition, including capital adequacy, earnings, liquidity, and asset quality. In addition to changes in interest rates, the level of future net interest income is also dependent on a number of variables, including: the growth, composition and levels of loans, deposits, and other earning assets and interest-bearing obligations, and economic and competitive conditions; potential changes in lending, investing, and deposit strategies; customer preferences; and other factors. The table below measures current maturity levels of interest-earning assets and interest-bearing obligations, along with average stated rates and estimated fair values at December 31, 2009 (dollars in thousands). Nonaccrual loans of $14.368 million are included in the table at an average interest rate of 0.00% and a maturity greater than five years.
Fair Value2010 2011 2012 2013 2014 Thereafter Total 12/31/2009
$ 11,272 $ 23,267 $ 7 10,327$ 840 $ 800 $ 46,513 $ 46,513 3.85 % 4.22 % 5.48 % 5.48 % 6.42 % 3.26 % 4.44 %
41,686 21,974 23,910 6,445 17,455 17,180 128,650 129,165 6.68 7.42 6.99 6.89 6.16 5.58 6.66
255,660 255,660 258,412 5.00 - - - - - 5.00
27,678 - - - - 3,794 31,472 31,472 .24 - - - - 2.00 .45
$ 336,296 $ 45,241 $ 23,917 $ 16,772 $18,295 $ 21,774 $ 462,295 $ 465,562 4.78 % 5.78 % 6.99 % 6.02 % 6.17 % 5.35 % 4.87 %
113,997 - - - - - 113,997 113,997 1.24 % - % - % - % - % - % 1.24 %
177,963 82,290 5,457 2,132 374 3,298 271,514 271,249 1.45 2.15 3.00 3.53 6.04 3.57 1.74
15,000 - - - - 1,140 16,140 16,437 5.10 - - - - 1.00 4.81
- 20,000 - - - - 20,000 20,010 - .30 .30
$ 306,960 $ 102,290 $ 5,457 $ 2,132 $ 374 $ 4,438 $ 421,651 $ 421,693 1.55 % 1.79 % 3.00 % 3.53 % 6.04 % 2.91 % 1.62 %Average interest rate
Total rate sensitive liabilities
Average interest rate
Fixed interest rate borrowings
Average interest rate
Variable interest rate borrowings
Average interest rate NOW, MMAs, interest checking
Rate Sensitive Liabilities
Average interest rate
Interest-bearing savings,
Average interest rateTime deposits
Average interest rate Variable interest rate loans
Average interest rate
Total rate sensitive assets
Average interest rateOther assets
Principal/Notional Amount Maturing/Repricing In:
Rate Sensitive Assets
Fixed interest rate loans
Average interest rate
Fixed interest rate securities
Foreign Exchange Risk
In addition to managing interest rate risk, management also actively manages risk associated with foreign exchange. The Corporation provides foreign exchange services, makes loans to, and accepts deposits from, Canadian customers primarily at its banking office in Sault Ste. Marie. To protect against foreign exchange risk, the Corporation monitors the volume of Canadian deposits it takes in and then invests these Canadian funds in Canadian commercial loans and securities. As of December 31, 2009, the Corporation had excess Canadian liabilities of $51,000 (or $53,000 in U.S. dollars). Management believes the exposure to short-term foreign exchange risk is minimal and at an acceptable level for the Corporation. Management intends to limit the Corporation’s foreign exchange risk by acquiring deposit liabilities approximately equal to its Canadian assets.

Management’s Discussion and Analysis of Financial Condition and Results of Operations
68
Off-Balance-Sheet Risk
Derivative financial instruments include futures, forwards, interest rate swaps, option contracts and other financial instruments with similar characteristics. The Corporation currently does not enter into futures, forwards, swaps or options. However, the Corporation is party to financial instruments with off-balance-sheet risk in the normal course of business to meet the financing needs of its customers. These financial instruments include commitments to extend credit and standby letters of credit and involve to varying degrees, elements of credit and interest rate risk in excess of the amount recognized in the consolidated balance sheets. Commitments to extend credit are agreements to lend to a customer as long as there is no violation of any condition established in the contract. Commitments generally have fixed expiration dates and may require collateral from the borrower if deemed necessary by the Corporation. Standby letters of credit are conditional commitments issued by the Corporation to guarantee the performance of a customer to a third party up to a stipulated amount and with specified terms and conditions.
Commitments to extend credit and standby letters of credit are not recorded as an asset or liability by the Corporation until the instrument is exercised. See Note 18 to the consolidated financial statements for additional information.
LIQUIDITY Liquidity is defined as the ability to generate cash at a reasonable cost to fulfill lending commitments and support asset growth, while satisfying the withdrawal demands of customers and make payments on existing borrowing commitments. The Bank’s principal sources of liquidity are core deposits and loan and investment payments and prepayments. Providing a secondary source of liquidity is the available for sale investment portfolio. As a final source of liquidity, the Bank can exercise existing credit arrangements. During 2009, the Corporation increased cash and cash equivalents by $35.321 million. As shown on the Corporation’s consolidated statement of cash flows, liquidity was primarily impacted by cash provided by investing activities, a net increase in loans of $21.218 million and a ―net‖ decrease in securities available for sale of $2.629 million. The net increases in assets were offset by a similar increase in deposit liabilities of $79.552 million. This increase in deposits was composed of an increase in non-core deposits of $35.629 million combined with an increase in bank deposits of $14.663 million. The management of bank liquidity for funding of loans and deposit maturities and withdrawals includes monitoring projected loan fundings and scheduled prepayments and deposit maturities within a 30 day period, a 30 to 90 day period and from 90 days until the end of the year. This funding forecast model is completed weekly. The Bank’s investment portfolio, most of which are guaranteed by the U.S. government, provide added liquidity during periods of market turmoil and overall liquidity concerns in the financial markets. As of December 31, 2009, $29.436 million of the Bank’s investment portfolio was unpledged, which makes them readily available for sale to address any short term liquidity needs. It is anticipated that during 2010, the Corporation will fund anticipated loan production with a combination of core-deposit growth and noncore funding, primarily brokered CDs. The Corporation’s primary source of liquidity on a stand-alone basis is dividends from the Bank. The Bank is currently prohibited from paying dividends because of a deficit in retained earnings. The Bank, in order to pay dividends in future periods, will need to restate its capital accounts, which requires the approval of the Office of Financial and Insurance Services of the State of Michigan. The Corporation is currently exploring alternative opportunities for longer term sources of liquidity and permanent equity to support projected asset growth. Liquidity is managed by the Corporation through its Asset and Liability Committee (―ALCO‖). The ALCO Committee meets monthly to discuss asset and liability management in order to address liquidity and funding needs to provide a process to seek the best alternatives for investments of assets, funding costs, and risk management. The liquidity position of the Bank is managed daily, thus enabling the Bank to adapt its position according to market fluctuations. Core deposits are important in maintaining a strong liquidity position as they represent a stable and relatively low cost source of funds. The Bank’s liquidity is best illustrated by the mix in the Bank’s core and non-core funding dependency ratio, which explains the degree of reliance on non-core liabilities to fund long-term assets. Core deposits are herein defined as demand deposits, NOW (negotiable order withdrawals), money markets, savings and certificates of deposit under $100,000. Non-core funding consists of certificates of deposit greater than $100,000, brokered deposits, and FHLB and other borrowings. At December 31, 2009, the Bank’s core deposits in relation to total funding was 45.86% compared to 47.92% in 2008. These ratios indicated at December 31, 2009, that the Bank has decreased its reliance on non-core deposits and borrowings to fund the Bank’s long-term assets, namely loans and investments. The Bank believes that by maintaining adequate volumes of short-term investments and implementing competitive pricing strategies on deposits, it can ensure adequate liquidity to support future growth. The Bank also has correspondent lines of credit available to meet unanticipated short-
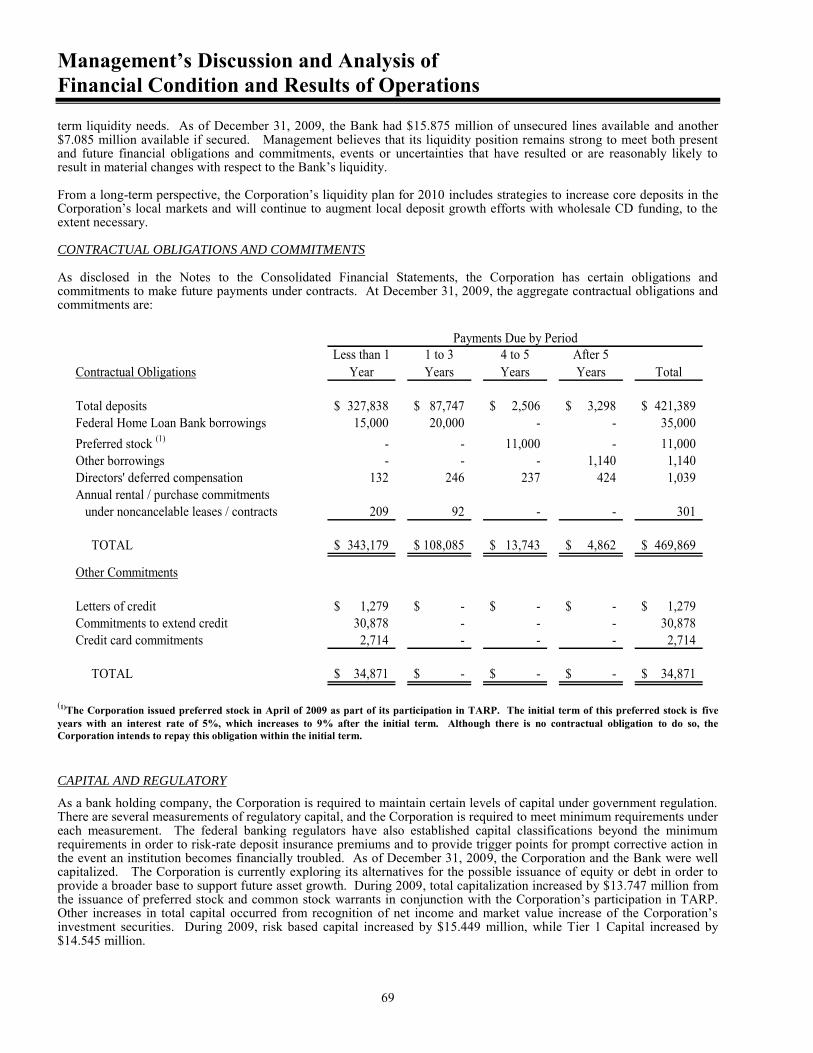
Management’s Discussion and Analysis of Financial Condition and Results of Operations
69
term liquidity needs. As of December 31, 2009, the Bank had $15.875 million of unsecured lines available and another $7.085 million available if secured. Management believes that its liquidity position remains strong to meet both present and future financial obligations and commitments, events or uncertainties that have resulted or are reasonably likely to result in material changes with respect to the Bank’s liquidity. From a long-term perspective, the Corporation’s liquidity plan for 2010 includes strategies to increase core deposits in the Corporation’s local markets and will continue to augment local deposit growth efforts with wholesale CD funding, to the extent necessary. CONTRACTUAL OBLIGATIONS AND COMMITMENTS As disclosed in the Notes to the Consolidated Financial Statements, the Corporation has certain obligations and commitments to make future payments under contracts. At December 31, 2009, the aggregate contractual obligations and commitments are:
Contractual ObligationsLess than 1
Year1 to 3 Years
4 to 5 Years
After 5 Years Total
Total deposits 327,838$ 87,747$ 2,506$ 3,298$ 421,389$ Federal Home Loan Bank borrowings 15,000 20,000 - - 35,000 Preferred stock (1) - - 11,000 - 11,000 Other borrowings - - - 1,140 1,140 Directors' deferred compensation 132 246 237 424 1,039 Annual rental / purchase commitments under noncancelable leases / contracts 209 92 - - 301
TOTAL 343,179$ 108,085$ 13,743$ 4,862$ 469,869$
Other Commitments
Letters of credit 1,279$ -$ -$ -$ 1,279$ Commitments to extend credit 30,878 - - - 30,878 Credit card commitments 2,714 - - - 2,714
TOTAL 34,871$ -$ -$ -$ 34,871$
Payments Due by Period
(1)The Corporation issued preferred stock in April of 2009 as part of its participation in TARP. The initial term of this preferred stock is five years with an interest rate of 5%, which increases to 9% after the initial term. Although there is no contractual obligation to do so, the Corporation intends to repay this obligation within the initial term.
CAPITAL AND REGULATORY
As a bank holding company, the Corporation is required to maintain certain levels of capital under government regulation. There are several measurements of regulatory capital, and the Corporation is required to meet minimum requirements under each measurement. The federal banking regulators have also established capital classifications beyond the minimum requirements in order to risk-rate deposit insurance premiums and to provide trigger points for prompt corrective action in the event an institution becomes financially troubled. As of December 31, 2009, the Corporation and the Bank were well capitalized. The Corporation is currently exploring its alternatives for the possible issuance of equity or debt in order to provide a broader base to support future asset growth. During 2009, total capitalization increased by $13.747 million from the issuance of preferred stock and common stock warrants in conjunction with the Corporation’s participation in TARP. Other increases in total capital occurred from recognition of net income and market value increase of the Corporation’s investment securities. During 2009, risk based capital increased by $15.449 million, while Tier 1 Capital increased by $14.545 million.
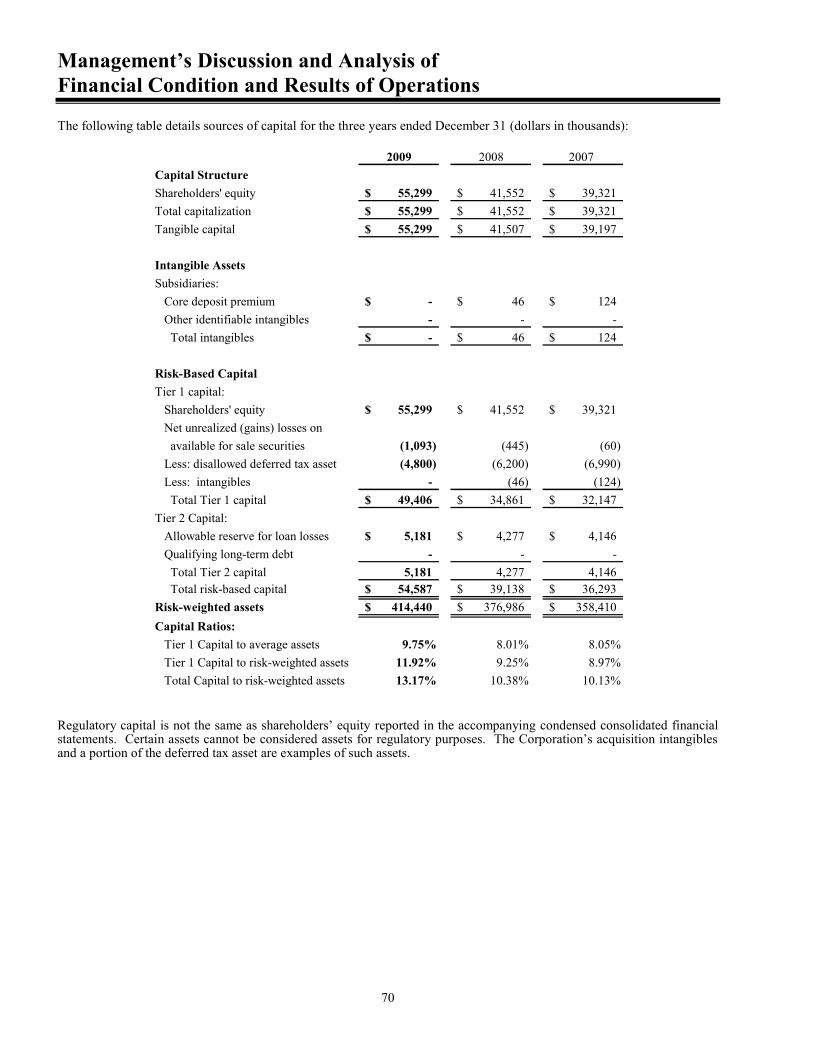
Management’s Discussion and Analysis of Financial Condition and Results of Operations
70
The following table details sources of capital for the three years ended December 31 (dollars in thousands):
2009 2008 2007Capital StructureShareholders' equity 55,299$ 41,552$ 39,321$ Total capitalization 55,299$ 41,552$ 39,321$ Tangible capital 55,299$ 41,507$ 39,197$
Intangible AssetsSubsidiaries: Core deposit premium -$ 46$ 124$ Other identifiable intangibles - - - Total intangibles -$ 46$ 124$
Risk-Based CapitalTier 1 capital: Shareholders' equity 55,299$ 41,552$ 39,321$ Net unrealized (gains) losses on available for sale securities (1,093) (445) (60) Less: disallowed deferred tax asset (4,800) (6,200) (6,990) Less: intangibles - (46) (124) Total Tier 1 capital 49,406$ 34,861$ 32,147$ Tier 2 Capital: Allowable reserve for loan losses 5,181$ 4,277$ 4,146$ Qualifying long-term debt - - - Total Tier 2 capital 5,181 4,277 4,146 Total risk-based capital 54,587$ 39,138$ 36,293$ Risk-weighted assets 414,440$ 376,986$ 358,410$ Capital Ratios: Tier 1 Capital to average assets 9.75% 8.01% 8.05% Tier 1 Capital to risk-weighted assets 11.92% 9.25% 8.97% Total Capital to risk-weighted assets 13.17% 10.38% 10.13%
Regulatory capital is not the same as shareholders’ equity reported in the accompanying condensed consolidated financial statements. Certain assets cannot be considered assets for regulatory purposes. The Corporation’s acquisition intangibles and a portion of the deferred tax asset are examples of such assets.
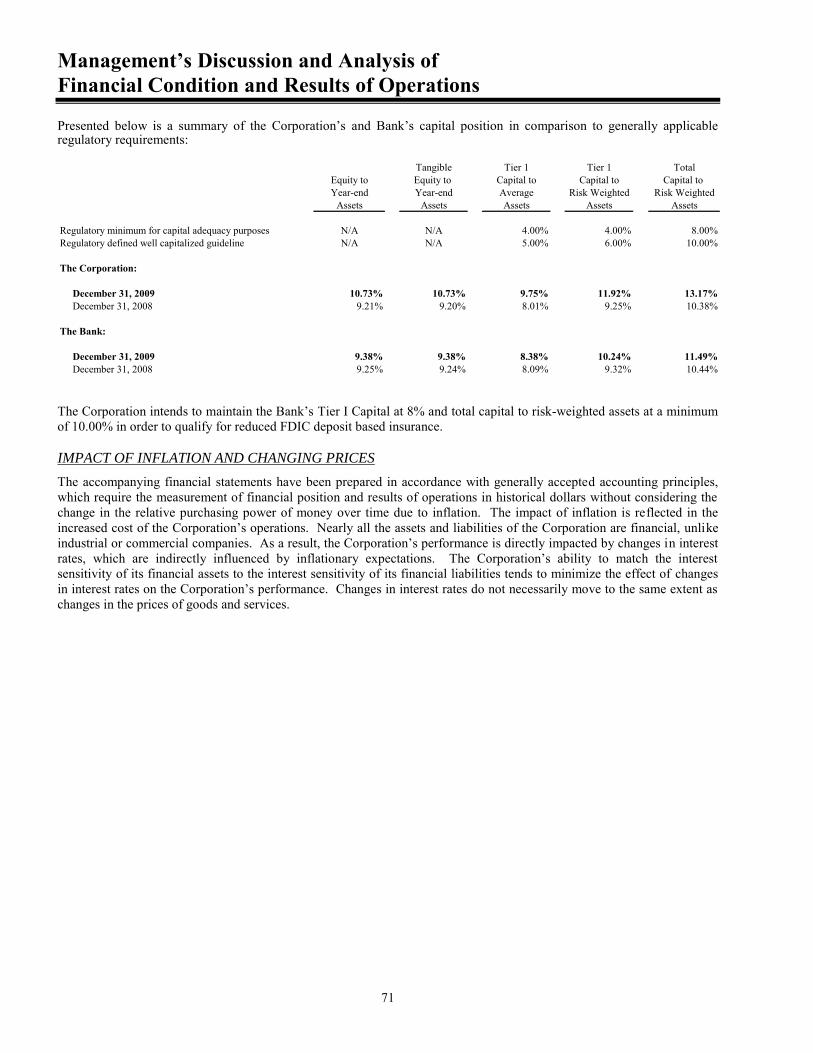
Management’s Discussion and Analysis of Financial Condition and Results of Operations
71
Presented below is a summary of the Corporation’s and Bank’s capital position in comparison to generally applicable regulatory requirements:
Tangible Tier 1 Tier 1 TotalEquity to Equity to Capital to Capital to Capital to Year-end Year-end Average Risk Weighted Risk Weighted
Assets Assets Assets Assets Assets
Regulatory minimum for capital adequacy purposes N/A N/A 4.00% 4.00% 8.00%Regulatory defined well capitalized guideline N/A N/A 5.00% 6.00% 10.00%
The Corporation:
December 31, 2009 10.73% 10.73% 9.75% 11.92% 13.17% December 31, 2008 9.21% 9.20% 8.01% 9.25% 10.38%
The Bank:
December 31, 2009 9.38% 9.38% 8.38% 10.24% 11.49% December 31, 2008 9.25% 9.24% 8.09% 9.32% 10.44%
The Corporation intends to maintain the Bank’s Tier I Capital at 8% and total capital to risk-weighted assets at a minimum of 10.00% in order to qualify for reduced FDIC deposit based insurance. IMPACT OF INFLATION AND CHANGING PRICES
The accompanying financial statements have been prepared in accordance with generally accepted accounting principles, which require the measurement of financial position and results of operations in historical dollars without considering the change in the relative purchasing power of money over time due to inflation. The impact of inflation is reflected in the increased cost of the Corporation’s operations. Nearly all the assets and liabilities of the Corporation are financial, unlike industrial or commercial companies. As a result, the Corporation’s performance is directly impacted by changes in interest rates, which are indirectly influenced by inflationary expectations. The Corporation’s ability to match the interest sensitivity of its financial assets to the interest sensitivity of its financial liabilities tends to minimize the effect of changes in interest rates on the Corporation’s performance. Changes in interest rates do not necessarily move to the same extent as changes in the prices of goods and services.

Directors and Officers
72
OFFICERS
Mackinac Financial CorporationName Title Location
Paul D. Tobias Chairman and Chief Executive Officer BirminghamKelly W. George President ManistiqueErnie R. Krueger EVP - Chief Financial Officer Manistique
mBankName Title Location
Bernadette C. Beaudre AVP - Deposit Compliance Officer ManistiqueShelby J. Bischoff AVP - Business Development Officer MarquetteLinda K. Bolda VP - Human Resources Manager ManistiqueJesse A. Deering First VP - SEM Executive BirminghamKevin D. Evans SVP - Retail Sales Management NewberryJeremy W. Flodin AVP - Sr. Credit Admin/Credit Risk Analyst ManistiqueJack C. Frost Regional President - UP MarquetteLaura L. Garvin VP - Commercial Banking Officer BirminghamKelly W. George President and CEO ManistiqueClarice A. Ghiardi VP - Mortgage/Consumer Banking Officer MarquetteRobert C. Henry VP - Commercial Banking Officer Traverse CityErnie R. Krueger EVP - Chief Financial Officer ManistiqueJake D. Martin SVP - IT Manager ManistiqueBoris Martysz VP - Commercial Banking Officer MarquetteTamara R. McDowell SVP - Sernior Credit/Operations Officer ManistiqueJacquelyn R. Menhennick SVP - Mortgage and Consumer Lending Manager MarquetteBarbara A. Parrett AVP - Branch Sales Manager/Retail Banking Officer StephensonScott A. Ravet VP - Commercial Banking Officer Manistique/EscanabaKimberly R. Robinson VP - New Business Development BirminghamJason J. Rolling AVP - Commercial Banking Officer MarquetteAndrew P. Sabatine Regional President - NLP Traverse CityGregory D. Schuetter VP - Commercial Banking Officer ManistiqueJoanna B. Slaght SVP - Compliance/Risk Manager/BSA Officer ManistiqueMichael A. Slaght VP - Branch Sales Manager/Retail Banking Officer NewberryJennifer A. Stempki VP - Assistant Controller ManistiqueAnn M. Stepp SVP - Branch Administration GaylordDavid R. Thomas VP - Commercial Banking Officer Sault Ste. MarieTimothy J. Timmer VP - Commercial Banking Officer GaylordPaul D. Tobias Chairman BirminghamJanet M. Willbee AVP - Mortgage Loan Officer Gaylord
Walter J. Aspatore - Lead Director Robert H. OrleyChairman Vice President and SecretaryAmherst Partners Real Estate Interests Group, Inc.Director Since: 2004 Director Since: 2004
Dennis B. Bittner L. Brooks PattersonOwner and President County ExecutiveBittner Engineering, Inc. Oakland CountyDirector Since: 2001 Director Since: 2006
Joseph D. Garea Randolph C. PaschkeManaging Partner Chairman, Department of AccountingHancock Securities Wayne State University, School of Business AdministrationDirector Since: 2007 Director Since: 2004
Kelly W. George Paul D. TobiasPresident, Mackinac Financial Corporation Chairman and CEO, Mackinac Financial CorporationPresident and CEO, mBank Chairman, mBankDirector Since: 2006 Director Since: 2004
Robert E. MahaneySole ProprietorVeridea Group, LLCDirector Since: 2008
DIRECTORS
Mackinac Financial Corporation and mBank

Corporate Information
CORPORATE HEADQUARTERS TRANSFER AGENT Mackinac Financial Corporation Registrar and Transfer Company 130 South Cedar Street 10 Commerce Drive Manistique, Michigan 49854 Cranford, NJ 07016 (888) 343-8147 (800) 368-5948 INVESTOR RELATIONS WEBSITE (888) 343-8147 www.bankmbank.com INDEPENDENT REGISTERED PUBLIC ACCOUNTING FIRM STOCK LISTING AND SYMBOL Plante and Moran, PLLC NASDAQ Capital Market Auburn Hills, Michigan Symbol: MFNC SHAREHOLDER INFORMATION Copies of the Corporation’s 10-K and 10-Q reports as filed with the Securities and Exchange Commission are available upon request from the Corporation. ANNUAL SHAREHOLDERS’ MEETING The 2010 Annual Meeting of the Shareholders of Mackinac Financial Corporation will be held on Wednesday May 26, 2010. Visit our website, www.bankmbank.com, for updated news releases, financial reports, SEC filings, corporate governance and other investor information.
Related Documents