A NNUAL F INANCIAL R EPORT FOR THE YEAR ENDED 30 th JUNE 2011 EMERGING MARKETS FUND LIMITED

Welcome message from author
This document is posted to help you gain knowledge. Please leave a comment to let me know what you think about it! Share it to your friends and learn new things together.
Transcript

ANNUAL FINANCIAL REPORT
FOR THE YEAR ENDED 30th JUNE 2011
EMERGING MARKETS FUND LIMITED

1
GE N E S I S EM E RG I N G MA R K E T S FU N D LI M I T E D
NOTE: All reference to “US dollars” or “$” throughout this report are to the United States currency.
Page
IN T RO D U C T I O N .. . . . . . . . . . . . . . . . . . . . . . . . . . . . . . . . . . . . . . . . . . . . . . . . . . . . . . . . . . . . . . . . . . . . . . . . . . . . . . . . . . . . . . . . . . . . . . . . . . .2
DI R E C TO R S .. . . . . . . . . . . . . . . . . . . . . . . . . . . . . . . . . . . . . . . . . . . . . . . . . . . . . . . . . . . . . . . . . . . . . . . . . . . . . . . . . . . . . . . . . . . . . . . . . . . . . . . . .3
HI G H L I G H T S .. . . . . . . . . . . . . . . . . . . . . . . . . . . . . . . . . . . . . . . . . . . . . . . . . . . . . . . . . . . . . . . . . . . . . . . . . . . . . . . . . . . . . . . . . . . . . . . . . . . . . . .5
MA NAG E M E N T RE P O RT
CH A I R M A N’S STAT E M E N T .. . . . . . . . . . . . . . . . . . . . . . . . . . . . . . . . . . . . . . . . . . . . . . . . . . . . . . . . . . . . . . . . . . . . . . . . . . . . . . .7
DI R E C TO R S ’ RE P O RT .. . . . . . . . . . . . . . . . . . . . . . . . . . . . . . . . . . . . . . . . . . . . . . . . . . . . . . . . . . . . . . . . . . . . . . . . . . . . . . . . . . .10
MA NAG E R’S RE V I E W .. . . . . . . . . . . . . . . . . . . . . . . . . . . . . . . . . . . . . . . . . . . . . . . . . . . . . . . . . . . . . . . . . . . . . . . . . . . . . . . . . . . . .18
TW E N T Y LA RG E S T HO L D I N G S .. . . . . . . . . . . . . . . . . . . . . . . . . . . . . . . . . . . . . . . . . . . . . . . . . . . . . . . . . . . . . . . . . . . . . . . . .20
CO U N T RY EX P O S U R E O F T H E PO RT F O L I O .. . . . . . . . . . . . . . . . . . . . . . . . . . . . . . . . . . . . . . . . . . . . . . . . . . . . . . .23
SE C TO R EX P O S U R E O F T H E PO RT F O L I O .. . . . . . . . . . . . . . . . . . . . . . . . . . . . . . . . . . . . . . . . . . . . . . . . . . . . . . . . .24
TH E PO RT F O L I O .. . . . . . . . . . . . . . . . . . . . . . . . . . . . . . . . . . . . . . . . . . . . . . . . . . . . . . . . . . . . . . . . . . . . . . . . . . . . . . . . . . . . . . . . . . . . . . .25
IN D E P E N D E N T AU D I TO R S ’ RE P O RT .. . . . . . . . . . . . . . . . . . . . . . . . . . . . . . . . . . . . . . . . . . . . . . . . . . . . . . . . . . . . . . . . .29
CO N S O L I DAT E D STAT E M E N T O F FI NA N C I A L PO S I T I O N .. . . . . . . . . . . . . . . . . . . . . . . . . . . . . . . . . . .31
CO N S O L I DAT E D STAT E M E N T O F CO M P R E H E N S I V E IN C O M E .. . . . . . . . . . . . . . . . . . . . . . . . . . .32
CO N S O L I DAT E D STAT E M E N T O F CH A N G E S I N EQU I T Y .. . . . . . . . . . . . . . . . . . . . . . . . . . . . . . . . . . .33
CO N S O L I DAT E D STAT E M E N T O F CA S H FLOW S .. . . . . . . . . . . . . . . . . . . . . . . . . . . . . . . . . . . . . . . . . . . . . . .34
NOT E S TO T H E CO N S O L I DAT E D FI NA N C I A L STAT E M E N T S .. . . . . . . . . . . . . . . . . . . . . . . . . . . . .35
PE R F O R M A N C E RE C O R D .. . . . . . . . . . . . . . . . . . . . . . . . . . . . . . . . . . . . . . . . . . . . . . . . . . . . . . . . . . . . . . . . . . . . . . . . . . . . . . . . . . .58
AD M I N I S T R AT I O N .. . . . . . . . . . . . . . . . . . . . . . . . . . . . . . . . . . . . . . . . . . . . . . . . . . . . . . . . . . . . . . . . . . . . . . . . . . . . . . . . . . . . . . . . . . . . .59
NOT I C E O F ME E T I N G .. . . . . . . . . . . . . . . . . . . . . . . . . . . . . . . . . . . . . . . . . . . . . . . . . . . . . . . . . . . . . . . . . . . . . . . . . . . . . . . . . . . . . . .60
2
IN T RO D U C T I O N
OBJECTIVE
To provide shareholders with a broadly diversified means of investing in developing
countries and immature stock markets, and thus to provide access to superior returns
offered by high rates of economic and corporate growth, whilst limiting individual
country risk.
STRUCTURE
The Fund is a Guernsey based closed-ended investment company with the ability to issue
additional shares. The Fund’s shares are listed on the London Stock Exchange. The
Participating Preference Shares of the Fund were redenominated to permit trading in
£ Sterling and split ten for one in November 2009. The number of Participating
Preference Shares outstanding is 135,863,060 as at 30th June 2011 (30th June 2010:
135,863,060). Following the restructuring, the Fund became eligible for inclusion in
the FTSE 250.
MANAGER
Genesis Asset Managers, LLP (“the Manager” or “Genesis”)
INVESTMENT APPROACH
Genesis follows a value-based stock selection approach, buying companies whose shares
appear under-valued on the basis of long-term earning power, current free cash flows or
asset backing.
NEW SHARES
Shares may be issued twice monthly subject to the following conditions:
i) the Fund is invested as to at least 75% in emerging market securities;
ii) the Manager will only issue new shares if it is unable, on behalf of the new subscriber,
to acquire shares in the secondary market at a price equivalent to or below the price
at which new shares would be issued; and
iii) the issued share capital of the Fund is not increased by more than ten per cent in any
six month period.

3
COEN TEULINGS (Chairman) †
Coen Teulings (Dutch) is based in Belgium and is Chairman of Merifin Capital, an independent European privategroup investing worldwide in diversified industries. He was formerly with leading merchant bank Kleinwort Benson inLondon and prior to this with Heineken Breweries in Amsterdam. He is or has been a Director of Charterhouse Group,Inc. (New York), Viscardi AG (Munich), TMW Immobilien AG (Munich), The International Yehudi MenuhinFoundation (Brussels) and The American European Community Association (Brussels). He serves on the AdvisoryBoard of TCR Capital (Paris), Activa Capital (Paris), von Braun & Scheiber (Munich), Arsenal Capital (New York)and Red Abbey (Baltimore).
MICHAEL HAMSON †
Michael Hamson was born in Scotland but is now an Australian Citizen and based in Melbourne. He is a Director ofNewmont Mining Inc., Chairman of Hamson Consultants Pty Ltd and Technology Venture Partners, as well as anumber of other companies. Michael was the former Deputy Chairman of Normandy Mining Limited and was thefounding partner, Chief Executive and Joint Chairman of McIntosh Griffin Hamson & Co (now Merrill LynchAustralia), a leading stockbroker in Australia. Among his other interests is the Chairmanship of the Royal BotanicGardens Australian Garden Project and he is also a Trustee of the World Wildlife Fund (WWF).
THE HON. JOHN TRAIN
The Hon. John Train is Chairman of Montrose Advisors and founder of Train Smith Counsel, both investmentadvisers in New York. His books include “The Craft of Investing”, “Money Masters of Our Time”, “PreservingCapital and Making it Grow”, “Famous Financial Fiascos” and “The Midas Touch”. He writes columns for the WallStreet Journal, the Financial Times and other periodicals. He has received several US Presidential appointments.
Dr. JOHN LLEWELLYNDr. John Llewellyn is the founder of Llewellyn Consulting, a London-based consultancy specialising inmacroeconomics and environmental economics. From 1995 to 2008 he was Global Chief Economist and then SeniorEconomic Policy Advisor at Lehman Brothers. Previously he spent seventeen years at the OECD in Paris, in charge ofinternational economic forecasting and policy analysis and, latterly, as Head of the Secretary-General’s Private Office(Chief of Staff). Prior to that Dr. Llewellyn spent ten years in academia (University of Cambridge).
† Member of Audit Committee
DI R E C TO R S

4
Dr. GENG XIAO(appointed 1st March 2011)
Dr. Xiao is Senior Fellow and Director of Research at the Fung Global Institute in Hong Kong. He is also anindependent director of HSBC Bank (China) and an honorary special advisor to the Columbia Beijing Center.Previously Dr. Xiao was tenured professor of economics at the university of Hong Kong, head of research and advisorto the chairman at the Securities and Futures Commission of Hong Kong, a member of the board of supervisors atthe Shenzhen Development Bank and a consultant at the World Bank. Dr. Xiao obtained his Bachelor of Science inManagement Sciences from the University of Science and Technology of China and his MA & PhD in Economics fromthe University of California, Los Angeles.
SAFFET KARPAT(appointed 1st October 2011)
Saffet Karpat is General Manager for Procter & Gamble’s (P&G) business in Turkey and the Caucasian and CentralAsian Republics, based in Istanbul, a post he has held since 2004. He started his career at P&G in 1983 and afterfulfilling Finance Director positions based in Egypt and in Saudi Arabia, he then spent seven years in the role of FinanceDirector for Central and Eastern Europe, the Middle East, and Africa. He was educated at the University of Istanbuland Lausanne University.
CHRISTIAN BAILLET
(resigned 29th October 2010)
Christian Baillet is Vice-Chairman of Quilvest, after being the CEO for 15 years. Quilvest is an international privatebanking and wealth management group providing family office services to high net worth individuals. He joinedQuilvest in 1979 and for much of that time he has led Quilvest’s private equity investment activities in Europe, the USand Asia. Prior to joining Quilvest, Christian was with Citibank in New York. Christian is a graduate of the EcoleCentrale and holds an MBA from the Wharton School, University of Pennsylvania.
† Member of Audit Committee
DI R E C TO R SCONTINUED

5
HI G H L I G H T S
30th June 30th June2011 2010 % change
Published Net Asset Value* £773.1m £654.6m 18.1
Published net asset value per participating preference share* £5.73 £4.85 18.1
Share price £5.29 £4.56 15.9
Expense ratio 1.71% 1.86%
Discount 7.70% 6.00%
Countries represented 42 43
Stocks in portfolio 159 157
Year to Year to30th June 2011 30th June 2010
Low High Low High
Share price £4.39 £5.68 £2.94 £4.82
Net asset value £4.86 £5.84 £3.34 £5.29
%Discount 8.2 4.5 11.2 4.4
£ Returns
Annualised
1 Year 3 Year 5 Year Since Inception % % % %
Fund Share Price 15.9 15.6 17.1 13.6
Fund NAV (net of fees) 18.1 15.5 17.2 14.0
MSCI EM (TR) 19.4 12.3 14.9 11.8
MSCI World (TR) 22.3 8.5 5.8 6.7
Past performance is no guarantee of future performance.
*The figures are based on Mid-Market prices.

6
HI G H L I G H T SCONTINUED
Last 5 Years
Val
ue (
reba
sed
to 1
00 o
n 30
/6/0
3)
0.0
50.0
100.0
150.0
200.0
250.0
30.06.06 29.06.07 30.06.08 30.06.09 30.06.10 30.06.11
Fund N.A.V. MSCI EM (TR) Secondary market price
220.7
200.6
220.3
Discount to NAV – last 5 Years
0.0
5.0
10.0
15.0
30.06.06 30.06.07 30.06.08 30.06.09 30.06.10 30.06.11

7
CH A I R M A N’S STAT E M E N T
I have pleasure in presenting to shareholders the twenty-second Annual Financial Report of the Genesis
Emerging Markets Fund Limited, for the year ended 30th June 2011.
Performance
The overall return figure for emerging markets over the Fund’s financial year was an attractive one, but (following
the pattern of the 2009–10 financial year) this was down to strong performance in the first half, the final six months of 2010, with
much more uneasy market conditions in 2011. Over the last few weeks, of course, markets have seen significant declines, leaving
investors facing a more difficult and uncertain outlook.
The Fund’s net asset value (“NAV”) per share rose 18.1%, from £4.85 to £5.73, over the twelve-month period,
slightly underperforming the MSCI EM (TR) index. I refer shareholders to the Report of the Manager on the following pages
which comments on the factors driving these returns, as well as describing the economic environment and some of the changes to
the Fund’s holdings over the year.
Returns from emerging markets over the recent past have been very pleasing (over the last three years, a period
that encompassed the Lehman crash in late 2008 and its aftermath, the Fund has generated an average return of 15.5% per annum).
When assessing the Manager’s performance, however, as Directors we do need to consider the potential long-term returns available
to shareholders, and in particular how the Manager will be able to continue to generate performance for shareholders in what may
be an environment of sustained uncertainty and volatility.
The Manager’s approach focuses on identifying companies it feels are high quality and which appear cheap
relative to the market’s valuation of them. This has in the past had the effect of somewhat protecting the Fund’s value during periods
of stock price declines, with the Fund’s value falling less than that of the market. We remain confident that – given the Manager’s
stability of process and personnel – this is likely to continue to be the case if the current negative environment persists.
The Directors’ opinion is therefore that the ongoing appointment of the Manager is in the best interests of the
Fund’s shareholders.
The average discount over the period was 6.1%, which is notably lower than during recent years, and this figure
additionally appears to be somewhat less volatile. It seems likely that this is at least partly due to the higher levels of trading volumes
which have been evident since the restructuring of the Fund in late 2009. As well as the higher volumes, a notable broadening of
the shareholder base has also continued. Both effects are of course very welcome.
The Board
The Notice convening the Annual General Meeting to be held on 28th October 2011 can be found at the
end of this Annual Financial Report.
I would like to draw shareholders’ attention to various items with respect to the Board of Directors, for
which we request approval by vote as detailed on the Notice.

8
CH A I R M A N’S STAT E M E N TCONTINUED
In the Interim Report six months ago, we noted the appointment to the Board of Dr. Geng Xiao. Dr. Xiao’s
work in economics is internationally known and well-respected in the government, corporate, and academic arenas, and he has
already shown that his knowledge, especially with respect to Chinese economic policy, will be extremely valuable to the Board.
I therefore thoroughly endorse his election by shareholders at the forthcoming Annual General Meeting.
It is with great pleasure that we recently announced to shareholders the appointment of Mr. Saffet Karpat
to the Board. A Turkish national, Mr. Karpat is currently General Manager of Procter & Gamble’s business in Turkey, the
Caucuses and Central Asia, and in previous roles in his career has taken responsibility for Proctor & Gamble’s business in Egypt
and the Arabian peninsula. His appointment is very much in line with our desire to have Directors on the Board representing
a variety of different business backgrounds, and I am confident that Mr. Karpat’s many years’ experience of managing consumer
businesses in a number of emerging markets will be a tremendous source of insight for the Directors. I therefore wholeheartedly
endorse his election by the shareholders.
In accordance with the Articles of Association and with regulatory requirements, Michael Hamson offers
himself for re-election at the forthcoming Annual General Meeting. Mr. Hamson has been a valuable member of the Board
and the Audit Committee during his time as a Director, and I have no hesitation in recommending to shareholders that he
continues to serve on the Board.
I will also be standing for re-election at the Meeting, and I hope very much that shareholders will feel able
to vote in favour of my re-election and allow me to continue to serve them as Chairman of the Board of Directors.
Against this, however, it is with sadness that I have to announce the retirement of the Hon. John Train as
a member of the Board, effective from the forthcoming Annual General Meeting.
Mr. Train has been a member of the Board for many years, during which he has served the Fund and its
shareholders with utmost distinction, and has contributed very significantly to the Fund’s success. It would be no exaggeration
to say that he is exceptional as an investor and as an expert political commentator, and it is his long experience in investment
matters and his deep knowledge of the politics of developing countries that have made him an invaluable source of guidance
to his fellow Directors. On behalf of the Board, I would like to express my gratitude to Mr. Train for his many contributions.
His insight, intellect and wit will be sorely missed.
We will be holding an Information Meeting in London on 4th November 2011. An invitation is enclosed,
and we hope to see as many shareholders as possible at this event.
Outlook
At the time of writing – in mid September – the Fund’s NAV has fallen some 13.7% since its high point
at the end of 2010, and clearly investor sentiment remains significantly negative in an environment where growth is slowing and
there is substantial concern over the indebtedness of much of Europe and the US, in particular.

9
CH A I R M A N’S STAT E M E N TCONTINUED
The last few weeks have demonstrated that whenever equity markets in the developed world suffer, emerging
markets are not immune from the effects. It is important to note that at the individual business level, however, emerging market
companies (and in particular those represented in the Fund’s holdings) are still seeing broadly healthy growth – so even though
economic growth in the developed world may be rather more anaemic (and the news headlines may also focus on declines in
Chinese economic growth), the underlying emerging markets growth dynamic is still present.
The positive side of the market decline of the past few weeks is, of course, that many attractive companies
now have rather cheaper prices than they did earlier this year. Given the Manager’s stock selection-focused investment approach,
this is presenting opportunities for them to invest in new, and existing, holdings that the market appears to be under-pricing.
The broader investment environment remains nervous, but we are confident that emerging market
companies in general will continue to be able to capitalise on improving trends in management ability, technology,
infrastructure, and demographics to outpace the growth of their developed world counterparts. In conclusion, our expectations
for emerging markets therefore remain extremely positive, and I, in common with my colleagues on the Board, believe very
strongly that over the medium to long term the Fund will continue to generate highly attractive returns.
Coen Teulings
Chairman
September 2011

10
DI R E C TO R S ’ RE P O RT
The Directors are pleased to present their twenty-second Annual Financial Report of the Fund covering the year ended
30th June 2011.
CORPORATE GOVERNANCE
The Board is accountable to shareholders for the governance of the Fund’s affairs. The Fund comprises the Company and its
wholly owned subsidiary Genemar Limited. The Directors have used their board report to detail the Fund’s corporate
governance statement.
As a Guernsey incorporated company listed on the London Stock Exchange within the FTSE 250, the Fund is required to
comply with Listing Rules 9.8.7 (for overseas incorporated companies). This requires the Fund to state how it has applied the
main principles set out in the UK Corporate Governance Code and whether it has complied throughout the accounting period
with these provisions set out in the UK Corporate Governance Code.
The Board of the Fund has considered the principles and recommendations of the Association of Investment Companies
(“AIC”) Code of Corporate Governance (“AIC Code”) by reference to the AIC Corporate Governance Guide for Investment
Companies (“AIC Guide”). The AIC Code, as explained by the AIC Guide, addresses all the principles set out in the UK
Corporate Governance Code, as well as setting out additional principles and recommendations on issues that are of specific
relevance to the Fund.
The Board considers that reporting against the principles and recommendations of the AIC Code, and by reference to the AIC
Guide (which incorporates the UK Corporate Governance Code), will provide better information to shareholders.
STATEMENT OF COMPLIANCE
The Directors believe that during the year under review they have complied with the provisions of the AIC Code, and insofar
as they apply to the Fund’s business, with the provisions of the Combined Code except as noted below.
• The role of Chief Executive
Since all Directors are non-executive and day-to-day management responsibilities are sub-contracted to the Manager, the
Company does not have a Chief Executive.
• Executive Directors’ remuneration
As the Board has no Executive Directors, it is not required to comply with the principles of the Combined Code in respect
of Executive Directors’ remuneration and does not have a Remuneration Committee.
• Audit Committee
The Chairman of the Board is one of the two non-executive Directors which comprise the Audit Committee.
• Internal audit function
As the Company delegates to third parties its day-to-day operations and has no employees, the Board has determined that
there is no requirement for an internal audit function. The Directors annually review whether a function equivalent to
internal audit is needed and will continue to monitor the Fund’s systems of internal controls in order to provide assurance
that they operate as intended.

11
DI R E C TO R S ’ RE P O RTCONTINUED
THE BOARD
The Board, chaired by Coen Teulings, consists of non-executive Directors, all of whom are considered to be independent under
the Listing Rules of the London Stock Exchange. The Board has consisted of no more than six Directors during the year and
given the size of the Board it is not necessary to appoint a Senior Independent Director. The Audit Committee comprises Coen
Teulings (Chairman) and Michael Hamson. The Board does not consider it necessary to form a remuneration committee or a
nomination committee. As the Board is only composed of five members and the Directors do not have executive roles, all
remuneration and nomination matters are considered by the whole Board.
The Fund has no Executive Directors or employees and there is therefore no requirement for a Chief Executive. A management
agreement between the Fund and Genesis Asset Managers, LLP sets out matters over which the Manager has authority. This
includes management of the Fund’s assets and the provision of accounting, secretarial and administrative services. All other
matters are reserved for the approval of the Board. Under this agreement, the Manager is entitled to receive a management fee
from the Fund, payable monthly, equal to 1.5% per annum, calculated and accrued on the Net Asset Value of the Fund as at
each Valuation Day. The Manager’s appointment is under a rolling contract which may be determined by three months’ written
notice given by the Fund, and 12 months’ written notice given by the Manager.
The Board regularly reviews both the performance of, and the contractual arrangements with, the Manager and is satisfied that
the continuing appointment of the Manager is in the best interests of shareholders. The Audit Committee reviews the
performance of, and the contractual arrangements with, the Administrator and is satisfied that the continuing appointment of
the Administrator is in the best interests of shareholders.
The Board meets at least three times during the year and between these meetings there is regular contact with the Manager who
provides the Board with appropriate and timely information. Attendance at those meetings is given in the table below.
Director AuditDirector Board Meetings Attended Committee Meetings Attended______________________________ _____________________ ________________________
Coen Teulings 3 3Christian Baillet 1 –Michael Hamson 3 3The Hon. John Train 2 –Dr. John Llewellyn 3 –Dr. Geng Xiao 2 –______________________________ _____________________ ________________________
BOARD APPOINTMENTS AND RE-ELECTION
All members of the Board consider new Board appointments as there is no separate nomination committee. The Chairman, Manager
or other appropriate persons provide new appointees to the Board with a preliminary briefing on the workings of the Fund. When
appointing a new Director, the Board takes care to ensure that the new Director enhances the balance of skills and experience
appropriate to the requirements of the Fund and that a new Director has enough time available to properly fulfil their duties. The
Directors also have access, where necessary in the furtherance of their duties, to independent professional advice at the Fund’s
expense. Directors are initially appointed until the following Annual General Meeting when, under the Company’s Articles of
Association, it is required that they be elected by shareholders. The Articles also require two Directors to retire by rotation every
year, and that all Directors stand for re-election every three years, subject to their approval by the Board.

12
DI R E C TO R S ’ RE P O RTCONTINUED
Mr. Coen Teulings and Mr. Michael Hamson retire in accordance with the Articles of Association, and offer themselves for
re-election. As Mr. Teulings and Mr. Hamson have maintained their effectiveness and commitment to the Fund, the Board
endorses them and commends their election to shareholders. The Hon. John Train also retires at the forthcoming Annual
General Meeting but is not standing for re-election. Effective 1st March 2011, Dr. Geng Xiao was appointed as a Director.
Effective 1st October 2011, Mr. Saffet Karpat was appointed as a Director.
The Board evaluates its performance and considers the tenure of each Director on an annual basis, and considers that the blend
of skills, experience, age and length of service is appropriate for the requirements of the Fund. The Board is aware of the UK
Corporate Governance Code and regularly reviews its succession plan.
STATEMENT OF DIRECTORS’ RESPONSIBILITIES
The Directors are responsible for preparing the financial statements for each financial year so that they give a true and fair view,
in accordance with applicable Guernsey Law and International Financial Reporting Standards as adopted by the European
Union, of the state of affairs of the Fund and of the profit or loss of the Fund for that year.
In the preparation of these financial statements, the Directors are required to:
• select suitable accounting policies and then apply them consistently;
• make judgments and estimates that are reasonable and prudent;
• ensure the financial statements are prepared on a going concern basis unless it is inappropriate to presume that the Fund
will continue in business; and
• state whether applicable accounting standards have been followed subject to any material departures disclosed and explained
in the financial statements.
The Directors confirm that they have complied with the above requirements in preparing the financial statements. The
Directors are responsible for ensuring that the Fund keeps proper accounting records which disclose with reasonable accuracy
at any time the financial position of the Fund and enable them to ensure that the financial statements comply with The
Guernsey Companies Law, 2008. They are also responsible for ensuring the safeguarding of the assets of the Fund and hence
for taking reasonable steps for the prevention and detection of fraud and other irregularities.
The financial statements are published on the website www.giml.co.uk, which is maintained by the Fund’s Investment Adviser. The
maintenance and integrity of the website is, so far as relates to the Fund, the responsibility of the Investment Adviser. The work
carried out by the auditors does not involve consideration of these matters and, accordingly, the auditors accept no responsibility
for any changes that may have occurred to the financial statements since they were initially presented on the website.
Legislation in Guernsey governing the preparation and dissemination of financial statements may differ from legislation in
other jurisdictions.

13
DI R E C TO R S ’ RE P O RTCONTINUED
AUDIT COMMITTEE
The Board has established an Audit Committee whose responsibilities are, inter alia:
• To make recommendations to the Board in relation to the appointment of external auditors.
• To monitor the independence and objectivity of auditors.
• To review the draft Annual and Half Year Financial Statements.
• To review the audit fees, terms of engagement and provision of non-audit services by the external auditor.
• To review the Fund’s accounting policies.
• To monitor and review the internal financial control and risk management systems on which the Fund is reliant.
The Audit Committee usually meets twice a year to review the Annual and Half Year Report and Financial Statements, audit
timetable and other risk management and governance matters. It may meet more often if deemed necessary, or if required by
the Fund’s auditors.
INTERNAL CONTROLS
The Board is responsible for the Fund’s system of internal control and for reviewing its effectiveness.
As there is delegation of daily operational activity, described below, there is no requirement for a direct internal audit function.
The internal control systems are designed to meet the Fund’s particular needs and the risks to which it is exposed. Accordingly,
the internal control systems are designed to manage rather than eliminate the risk of failure to achieve business objectives and
by their nature can only provide reasonable and not absolute assurance against misstatement and loss.
Those services provided to the Fund by the Administrator, such as administration services, accounting services and company
secretarial duties reflect the system of internal controls of the Administrator. The relevant control regime for other services,
such as the Manager, Adviser, Custodian and Registrar, reflect those of the respective service providers.
The Administrator provides semi-annual and annual financial statements based on the requirements of the Fund. Statements
are based on the consolidated trial balance, net asset valuation, purchase and sales report and investment schedules produced
from the Administrator’s valuation system. All statements are reconciled and reviewed by the Administrator using pre-defined
checklists and approved by the Directors prior to distribution.
In order for the Directors to review their effectiveness for the Fund’s business, an annual review of all out-sourced functions
has taken place and their performance was monitored against obligations specified in the relevant contracts and was found to
be in order.
The Administrator reports annually on the design and effectiveness of internal controls operating over the functions provided
by the Administrator. This report is reviewed by the Audit Committee and any material findings are considered by the Board
of Directors as a whole.
The Audit Committee has carried out it’s annual assessment of the the internal controls of the Fund’s service providers for the
year ended 30th June 2011 and considered the Administrator’s internal control procedures to be adequate based on the fundings
of the SAS 70 Report. Details of the Administrator’s internal controls can be found in the annual SAS 70 report.

14
DI R E C TO R S ’ RE P O RTCONTINUED
GOING CONCERN
The Directors believe that the Fund has adequate resources to continue in operational existence for the foreseeable future. For
this reason, they continue to adopt the going concern basis in preparing the Consolidated Financial Statements.
RISK MANAGEMENT
The investment objective of the Fund is to achieve capital growth over the medium to long term, primarily through investment
in equity securities quoted on emerging markets. The main risks to the value of its assets arising from the Fund’s investment
in financial instruments are unanticipated adverse changes in market prices and foreign currency exchange rates and an absence
of liquidity. The Board reviews and agrees with the Manager policies for managing each of these risks and they are summarised
below. These policies have remained unchanged since the beginning of the period to which these financial statements relate.
The economies, the currencies and the financial markets of a number of developing countries in which the Fund invests may
be extremely volatile. To manage the risks posed by adverse price fluctuations the Fund’s investments are geographically
diversified, and will continue to be so. The Fund will not normally invest more than 25% of its assets (at the time the
investment is made) in any one country. Further, the exposure to any one company or group (other than an investment company,
unit trust or mutual fund) is unlikely to exceed 5% of the Fund’s net assets at the time the investment is made. The Articles
of Incorporation place a limit of 10% for securities issued by one company but the Directors use 5% for monitoring purposes.
The Fund’s assets will be invested in securities of companies in various countries and income will be received by the Fund in
a variety of currencies. However, the Fund will compute its net asset value and make any distributions in dollars. The value of
the assets of the Fund as measured in dollars may be affected favourably or unfavourably by fluctuations in currency rates and
exchange control regulations. Further, the Fund may incur costs in connection with conversions between various currencies.
Trading volumes on the stock exchanges of developing countries can be substantially less than in the leading stock markets of
the developed world. This lower level of liquidity exaggerates the fluctuations in the value of investments described previously.
The restrictions on concentration and the diversification requirements detailed above also serve normally to protect the overall
value of the Fund from the risks created by the lower level of liquidity in the markets in which the Fund operates.
The Fund is also exposed to operational risks such as custody risk. Custody risk is the risk of loss of securities held in custody
occasioned by the insolvency or negligence of the custodian. Although an appropriate legal framework is in place that
eliminates the risk of loss of value of the securities held by the custodian, in the event of its failure, the ability of the Fund
to transfer the securities might be temporarily impaired. The day to day management of these risks is carried out by the
Manager under policies approved by the Board of Directors.

15
DI R E C TO R S ’ RE P O RTCONTINUED
AUTHORITY TO PURCHASE OWN SHARES
Under Resolution 6 of the Annual General Meeting held on 25th October 2010, the shareholders authorised the Fund to
purchase its own shares. This authority is limited to the maximum number of 20,200,000 Participating Preference Shares of
no par value (equivalent to approximately 14.9 per cent of the issued share capital of the Fund). This authority expires at this
year’s Annual General Meeting of the Fund. The maximum price that may be paid for a Participating Preference Share will be
the amount that is equal to 5 per cent above the average of the middle market prices shown in quotations for a Participating
Preference Share in the London Stock Exchange Daily Official List for the five business days immediately preceding the day on
which that Participating Preference Share is purchased.
Renewal of the Fund’s power to purchase its own shares will be sought at the Annual General Meeting on 28th October 2011.
In the event that the Fund should purchase shares for cancellation, the Directors would only do so after consideration of the
effect on earnings per share and the longer term benefits for shareholders.
SHAREHOLDER RELATIONS
The Board recognises the need for good communications with its shareholders. The primary medium through which the Fund
communicates with shareholders is the Annual and Half Year Report and Financial Statements and the monthly Fact Sheet,
which is available via the Investment Adviser’s website, www.giml.co.uk. The Board monitors the trading in the Fund’s shares
and shareholder profile on a regular basis and maintains regular contact with the Fund’s brokers to ascertain the views of the
market. Sentiment is also ascertained by careful monitoring of the discount/premium that the shares trade on versus their NAV
and the comparison with the Fund’s peer group. Members of the Board and the Manager will also make direct contact with
shareholders as needed.
DIRECTORS’ REMUNERATION
The Directors are entitled to receive fees for their services which shall not exceed $200,000 in aggregate per annum. They are
entitled to receive increased remuneration as may be voted by the Company in a General Meeting. As agreed among the
Directors, the current distribution of fees is: $30,000 per annum for each Director, $5,000 per annum for Audit Committee
Directors and $10,000 per annum for the Chairman. Such remuneration is deemed to accrue on a daily basis.
The Directors are also entitled to be paid all travelling, hotel and other expenses properly incurred by them in attending and
returning from meetings of the Directors or any committee of the Directors or General Meetings of the Company or in
connection with the business of the Company.

16
DI R E C TO R S ’ RE P O RTCONTINUED
DIRECTORS’ INTERESTS
The Directors listed on pages 3 and 4 (except Christian Baillet who resigned 29th October 2010, Dr. Geng Xiao who was appointed
on 1st March 2011 and Saffet Karpat who was appointed 1st October 2011) served throughout the year under review. The following
(who were Directors during the financial year) had a beneficial interest in the share capital of the Fund at 30th June 2011:
Participating Preference Shares
_____________________________________________________________________ _________________
Coen Teulings 40,000
Michael Hamson (including family interests) 8,700
The Hon. John Train (including family interests) 20,510_____________________________________________________________________ _________________
SECRETARY
The Secretary as at 30th June 2011, HSBC Securities Services (Guernsey) Limited, has been in office for the whole of the year
under review.
INDEPENDENT AUDITORS
The Fund’s Independent Auditors, PricewaterhouseCoopers CI LLP, have indicated their willingness to continue in office.
Resolutions re-appointing them and authorising the Directors to agree their remuneration will be proposed at the Annual
General Meeting.
NON-AUDIT SERVICES
PricewaterhouseCoopers CI LLP were not engaged as advisors to the Fund in any capacity during the year. In order to maintain
their independence, such appointments for non-audit services are only made when the Audit Committee is satisfied that there
are no matters that would compromise the independence of the auditors or affect the performance of their statutory duties.
PricewaterhouseCoopers CI LLP have also considered their position and have confirmed their independence to the Fund
in writing.
AUDITORS AND DISCLOSURE OF INFORMATION TO AUDITORS
In the case of each of the persons who are Directors at the time when the report is approved, the following applies:
• so far as the Director is aware, there is no relevant audit information of which the Fund’s auditors are unaware; and
• they have taken all steps that ought to have been taken as a Director in order to make themselves aware of any relevant audit
information and to establish that the Fund’s auditors are aware of that information.
COMPLIANCE WITH DISCLOSURE AND TRANSPARENCY DIRECTIVE
The Directors confirm to the best of their knowledge that:
• the financial statements are prepared in accordance with applicable accounting standards, give a true and fair view of the
assets, liabilities, financial position and profit or loss of the Fund and
• this annual financial report includes a fair review of the development and performance of the business and the position of
the Fund, together with a description of the principal risks and uncertainties that exist.

17
DI R E C TO R S ’ RE P O RTCONTINUED
RESULTS
The total profit for the year for the Fund amounted to $262,843,625 compared to a total profit of $240,098,718 in the previous
year. The Directors do not recommend the payment of a dividend in respect of the year ended 30th June 2011 (2010: nil).
CAPITAL VALUES
At 30th June 2011, the value of Equity Shareholders’ Funds was $1,237,202,432 (2010: $974,358,807), the Equity per
Participating Preference Share was $9.17 (2010: $7.22).
SIGNIFICANT SHAREHOLDINGS
The Directors are aware of the following shareholdings which represented beneficial interests of 3% or more of the issued
share capital of the Fund at 30th June 2011:
__________________________________________________ _________________ ________________
Participating Percentage ofPreference Participating
Shares Preference Held Shares Held
__________________________________________________ _________________ ________________
Strathclyde Pension Fund 19,013,120 14%
Banque Degroof Luxembourg SA 12,290,262 9%
Banque Degroof SCS 11,297,894 8%
Sarasin and Partners LLP 10,967,650 8%
Lazard Asset Management LLC Group 8,646,805 6%
BAE Pension Fund Investment Management 6,790,000 5%
Legal & General Investment Management Limited 4,478,377 3%__________________________________________________ _________________ ________________
Signed on behalf of the Board
Coen Teulings
Dr. John Llewellyn
29th September 2011

18
MA NAG E R’S RE V I E W
The Fund ended the year to 30th June 2011 up 18.1% in Sterling terms (calculated based onpublished net asset value).
Following a period of strong market performance during the first half of the year under review,the second half saw various major events, such as the Japanese earthquake and the Greek debt crisis, which subduedmarket sentiment. Since the year-end, equity markets have been suffering from trauma of their own as investorconcerns over economic growth and government indebtedness in the developed world led to stock prices collapsingin August.
Looking specifically at the twelve-month period under review, consumer-related stocks generallyled the market, although the materials sector in general also performed well. The strong performance of Zambiancopper miner First Quantum Minerals, and Chinese cement producer Anhui Conch, helped drive portfolioperformance, along with positive stock selection in India (particularly Sun Pharmaceuticals and Asian Paints).Against this, the portfolio was negatively affected by the poor stock price performance of Chinese sportswearmanufacturer Li Ning, and – in relative terms – by the lack of holding in firstly Gazprom, and secondly in the morecyclical businesses of HTC in Taiwan, and Hyundai Motor of South Korea.
Significant changes to the Fund’s positioning included increases in technology companies (andlong-term holdings) Samsung Electronics and TSMC, both of which are global leaders in their fields and continueto offer attractive valuations. We have also added to Li Ning and to Korean electric utility Kepco, both of whoseunderperformance in market price terms have given us an opportunity to buy more of businesses which we feel havea strong investment case, despite the market’s negative short-term view.
Against this, the Fund’s exposure to Russia was reduced (we sold three positions there; MDMBank, Mobile Telesystems, and Lukoil) and we scaled back exposure to First Quantum and Anhui Conch followingtheir strong performance. The Fund’s turnover, at around 17% over the period, remains on the low side of historicaverages.
In terms of the investment outlook, it would of course have been unrealistic to think that a globalequity sell-off would not impact emerging markets too, but while investors may have significant worries about growthin the developed world, emerging market economies are in a rather stronger position in terms of growth.
Emerging markets are slowing too, however, partly because of global demand issues and partly dueto local monetary tightening activity to control inflation. Sure enough, as a result, some companies’ earnings releasesare finally beginning to show signs of margin pressure and slower demand. For example, TSMC, one of the Fund’smajor holdings and a bellwether for the Asian technology industry, has reduced expectations for semiconductordemand in 2011 due to “weaker economic conditions”. Against that, the Fund’s largest holding Anglo American saidrecently it has not seen any slowdown in demand in bulk commodities or industrial metals, where prices have mainlycontinued to move higher. (This may reflect the fact that the demand for Anglo’s products largely emanates fromemerging markets, while the global semiconductor market is more skewed to developed countries.)

19
MA NAG E R’S RE V I E WCONTINUED
The general picture is one where profit margins remain above long-term averages and demandgrowth is still healthy. The company results we have seen from the second quarter remain reasonably strong. In manycountries, the peak of inflation has probably been seen, as interest rates have been raised and various tighteningmeasures implemented to restrict credit growth and generally curb demand. Inflation data have yet to soften in Chinabut credit and money supply growth have slowed and the authorities have made clear that they intend consumer pricerises to be firmly under control.
While inflation, or more accurately the policy responses to it, may not be as much of a headwindin future for emerging equity markets as it has been so far this year, there is another, longer-term, concern: increasingcompetition resulting from both the arrival in emerging markets of developed market businesses as well as companiesfrom other emerging markets.
Overall, however, we feel that the investments held by the Fund represent those businesses that canmaintain their competitive position and continue to grow. Generally, stocks in our markets do not feel too expensive,especially now that the price action of the last few weeks has left many companies’ stock prices seemingly discountingsome very poor business scenarios. While the high returns of 2009 and 2010 are unlikely to be repeated, we areconfident that the Fund’s holdings will continue to deliver attractive returns to its shareholders over the medium tolong term.
Genesis Asset Managers, LLPSeptember 2011

20
TW E N T Y LA RG E S T HO L D I N G Sas at 30th June 2011
Genesis Indian Investment Company (India) 8.75%
Investment Company
An open-ended Mauritian company whose objective is to achieve capital growth over the medium to long term throughinvestment in equities quoted on the Indian stock market. It held positions in 16 stocks as at 30th June 2011.
Genesis Smaller Companies SICAV (Luxembourg) 7.12%
Investment Company
An open-ended Luxembourg SICAV whose objective is to achieve capital growth over the medium to long term throughinvestment in smaller emerging market companies. It held positions in 48 stocks as at 30th June 2011.
Anglo American (South Africa) 5.21%
Materials
Anglo American is one of the world’s largest diversified mining and natural resource groups and is a global leader in theproduction of copper, coal, platinum group metals and iron ore.
TSMC (Taiwan) 4.74%
Information Technology
TSMC is the world’s largest dedicated semiconductor foundry, manufacturing integrated circuits for computer,communications, and consumer electronics applications.
Samsung Electronics (South Korea) 4.45%
Information Technology
Samsung Electronics is a global leader in the IT hardware industry, producing semiconductors (mostly memory), LCDpanels, handsets and a wide range of consumer electronics and digital appliances.
SABMiller (South Africa) 2.52%
Consumer Staples
SABMiller is one of the world’s largest brewers, having brewing interests and distribution agreements across sixcontinents with a bias towards fast-growing developing markets.
First Quantum Minerals (Zambia) 2.41%
Materials
First Quantum Minerals is engaged in mineral exploration, development, mining and refining. The company producescopper, gold and sulfuric acid with its flagship project being in Zambia.

21
TW E N T Y LA RG E S T HO L D I N G SCONTINUED
Banco Santander (Brazil) 2.37%
Financials
Banco Santander Brasil is a leading full-service bank strategically concentrated in the South and Southeast of Brazil.
América Móvil (Mexico) 1.99%
Telecommunications
América Móvil is the leading wireless service provider in Latin America and the third largest in the world in terms ofsubscribers.
China Mobile (China) 1.92%
Telecommunications
China Mobile is the largest mobile phone operator in China with 70% of subscriber market share, or more than 584million subscribers.
Sberbank (Russia) 1.90%
Financials
Sberbank is one of Russia’s oldest banks and the largest credit institution there, accounting for over a quarter of theaggregate Russian banking assets and capital.
Korea Electric Power (South Korea) 1.85%
Energy
Korea Electric Power generates, transmits, and distributes electricity to South Korea for a variety of uses. The Companyalso builds and operates hydro-power, thermal-power, and nuclear power units in South Korea.
China Resources Enterprise (China) 1.81%
Consumer Staples
China Resources Enterprise is a conglomerate uniting several fast-growing consumer businesses in mainland China,including breweries, hypermarkets, supermarkets and food manufacturers.
Tullow Oil (United Kingdom) 1.74%
Energy
Tullow Oil is a UK-listed independent oil exploration and production company with a major focus on Africa, wherethey are already a dominant player.

22
Telekomunikasi Indonesia (Indonesia) 1.42%
Telecommunications
Telekomunikasi Indonesia is the largest telecommunication and network services provider in Indonesia, with over 120million subscribers.
Shinhan Financial Group (South Korea) 1.42%
Financials
Shinhan Financial Group, a holding company, provides a full range of consumer and commercial banking-relatedfinancial services. The company’s main businesses include banking, securities brokerage, trust banking, and assetsmanagement to individuals, businesses and other financial institutions.
Samsung Fire & Marine Insurance (South Korea) 1.38%
Financials
Samsung Fire & Marine Insurance Co. Ltd. offers non-life insurance services such as auto, fire, marine, casualty, health,leisure and retirement. The Company offers services to the domestic and overseas clients through a network of branchesand outlets.
MOL (Hungary) 1.37%
Energy
MOL is a leading integrated oil and gas company in Central and Eastern Europe, with refineries and explorationprojects throughout the region.
Bank Rakyat Indonesia (Indonesia) 1.28%
Financials
Bank Rakyat Indonesia provides commercial banking activities and its related services. The Bank also provides bankingactivities based on shariah principles.
China Merchants Bank (China) 1.28%
Financials
China Merchants Bank provides a wide range of commercial banking services including deposit, loan, bill discount,government bonds underwriting and trading, interbank lending, letter of credit, bank guarantee, and other related services.
TW E N T Y LA RG E S T HO L D I N G SCONTINUED

23
CO U N T RY EX P O S U R E O F T H E PO RT F O L I O*
June June JuneCountry 2011 2010 2009
% % %________________________ ______ ______ _____China 13.03 12.84 12.06 South Africa 10.86 11.07 12.05 South Korea 10.11 6.27 6.38 India 8.66 8.78 6.97 Russia 7.93 9.47 9.69 Brazil 7.39 8.44 5.67 Taiwan 5.63 4.22 3.83 Mexico 5.46 5.19 5.70 Indonesia 5.26 5.86 5.82 Thailand 2.83 2.45 1.84 Malaysia 2.76 2.04 1.93 Turkey 2.64 3.80 4.22 Zambia 2.40 1.13 1.59 United Kingdom 1.73 1.48 2.02 Egypt 1.64 1.97 2.20 Hungary 1.38 1.46 1.51 Nigeria 1.28 1.61 1.56 Colombia 0.97 0.93 0.75 Greece 0.77 0.79 0.99 Romania 0.68 0.77 0.90 Philippines 0.63 0.74 0.50 Mauritius 0.61 0.76 1.54 Chile 0.51 0.67 0.93 Austria 0.47 0.74 0.27 Saudi Arabia 0.45 0.43 –Vietnam 0.32 0.37 0.28 Croatia 0.30 0.32 0.36 Ukraine 0.28 0.31 0.28 Argentina 0.26 0.29 0.28 Senegal 0.25 0.28 0.43 Zimbabwe 0.21 0.16 0.18 Estonia 0.18 0.18 0.17 Kenya 0.17 0.30 0.33 Lebanon 0.11 0.17 0.19 Peru 0.10 1.09 0.94 Sri Lanka 0.06 0.17 0.25 United Arab Emirates 0.06 0.07 0.35 Czech Republic 0.05 0.05 0.07 Ghana 0.04 0.06 0.06 Kazakhstan 0.04 0.04 0.12 Iran 0.03 0.29 0.36 Israel – – 2.09 Congo, D.R. – – 0.02 Net current assets/(liabilities) 1.46 1.94 2.32________________________ ______ _____ _____Total 100.00 100.0 100.0________________________ ______ _____ _____________________________ ______ _____ _____
*Treating Genesis Smaller Companies SICAV and Genesis Indian Investment Company Limited on a‘look-through’ basis.

24
SE C TO R EX P O S U R E O F T H E PO RT F O L I O*
Industry June June June
2011 2010 2009
% % %________________________ __________ __________ __________
Financials 26.91 26.68 23.61
Materials 14.61 13.44 11.06
Consumer Staples 14.52 15.88 12.77
Information Technology 11.11 7.56 8.09
Energy 8.71 10.40 13.64
Industrials 5.74 6.25 6.83
Telecommunications 5.66 7.50 8.19
Health Care 3.48 2.37 3.36
Consumer Discretionary 3.10 3.49 4.63
Utilities 2.99 2.22 2.99
Investment Companies 1.71 2.23 2.54
Net current assets 1.46 1.98 2.29 ________________________ __________ __________ __________Total 100.0 100.0 100.0________________________ __________ __________ __________________________________ __________ __________ __________
*Treating Genesis Smaller Companies SICAV and Genesis Indian Investment Company Limited on a ‘look-through’ basis.

25
TH E PO RT F O L I Oas at 30th June 2011
FAIR PROPORTIONVALUE OF FUND
$ (%)_______________________________________ ___________ ___________AUSTRIA (2010 – 0.74%)Vienna Insurance Group 5,865,475 0.47_______________________________________ ___________ ___________BRAZIL (2010 – 7.68%)Amil Participacoes 6,238,202 0.50Banco do Brasil 4,048,896 0.33Banco Santander Brasil ADS 20,042,673 1.62Banco Santander Brasil Unit 9,321,735 0.75Companhia Siderurgica Nacional 3,678,316 0.30Lojas Renner 6,303,188 0.51Marfrig Alimentos 2,795,223 0.23OGX Petroleo E Gas Participacoes 12,341,029 1.00Tractebel 7,557,678 0.61Ultrapar Participacoes (Preferred) 12,604,574 1.02_______________________________________ ___________ ___________
84,931,514 6.87_______________________________________ ___________ ___________CHILE (2010 – 0.67%)Embotelladora Andina A 2,279,034 0.18Embotelladora Andina ADR A 17,437 0.00Embotelladora Andina B 3,771,381 0.31_______________________________________ ___________ ___________
6,067,852 0.49_______________________________________ ___________ ___________CHINA (2010 – 11.83%)Anhui Conch Cement ‘H’ 13,440,365 1.09ASM Pacific Technology 1,067,874 0.09China Foods 2,168,877 0.17China Life Insurance ‘H’ 6,366,841 0.51China Merchants Bank ‘H’ 15,814,184 1.28China Mobile ‘H’ 23,788,965 1.92China Overseas Land & Investment ‘H’ 9,704,204 0.78China Resources Enterprise ‘H’ 22,452,833 1.81China Resources Gas 995,046 0.08China Shenhua Energy ‘H’ 12,621,085 1.02Industrial and Commercial Bank of China ‘H’ 13,462,003 1.09Li Ning 7,277,787 0.59Longfor Properties 3,720,409 0.30Parkson Retail Group 8,292,642 0.67Want Want China Holdings 6,877,656 0.56West China Cement 3,035,720 0.25_______________________________________ ___________ ___________
151,086,491 12.21_______________________________________ ___________ ___________COLOMBIA (2010 – 0.93%)Bancolombia 6,238,646 0.50Bancolombia ADR 5,458,940 0.44Bancolombia (Preferred) 338,369 0.03_______________________________________ ___________ ___________
12,035,955 0.97_______________________________________ ___________ ___________CROATIA (2010 – 0.32%)Jupiter Adria* 3,720,750 0.30_______________________________________ ___________ ___________CYPRUS (2010 – 0.00%)Global Ports Investments 2,109,665 0.17_______________________________________ ___________ ___________EGYPT (2010 – 1.39%)Orascom Construction Industries 15,237,255 1.23_______________________________________ ___________ ___________

26
TH E PO RT F O L I OCONTINUED
FAIR PROPORTIONVALUE OF FUND
$ (%)_______________________________________ ___________ ___________GREECE (2010 – 0.77%)Coca-Cola Hellenic Bottling 9,546,319 0.77_______________________________________ ___________ ___________HUNGARY (2010 – 1.43%)MOL 16,933,458 1.37_______________________________________ ___________ ___________INDIA (2010 – 8.93%)Genesis Indian Investment Company*^ 108,246,127 8.75_______________________________________ ___________ ___________INDONESIA (2010 – 5.65%)Bank Danamon 7,236,358 0.59Bank Rakyat 15,845,667 1.28Indocement Tunggal Prakarsa 14,330,760 1.16Ramayana Lestari Sentosa 2,088,481 0.17Semen Gresik Persero 5,496,424 0.44Telekomunikasi Indonesia 17,593,053 1.42_______________________________ ________ ___________ ___________
62,590,743 5.06_______________________________________ ___________ ___________IRAN (2010 – 0.29%)Turquoise Partners ‘C’* 394,891 0.03_______________________________________ ___________ ___________LUXEMBOURG (2010 – 8.29%)Genesis Smaller Companies SICAV*^ 88,099,748 7.12_______________________________________ ___________ ___________MALAYSIA (2010 – 1.62%)CIMB Group Holdings 15,200,994 1.23Lafarge Malayan Cement 2,438,871 0.20Petronas Chemicals 1,602,793 0.13RHB Capital 6,426,411 0.52_______________________________ ________ ___________ ___________
25,669,069 2.08_______________________________________ ___________ ___________MAURITIUS (2010 – 0.76%)ECP Africa Fund II* 7,539,640 0.61_______________________________________ ___________ ___________MEXICO (2010 – 4.68%)America Movil ADR Series L 24,600,124 1.99Femsa ADS 14,553,198 1.18Grupo Financiero Banorte 5,734,325 0.46Grupo Financiero Inbursa 10,715,357 0.87Megacable Holdings CPO 2,629,236 0.21Moctezuma 2,819,116 0.23_______________________________ ________ ___________ ___________
61,051,356 4.94_______________________________________ ___________ ___________NIGERIA (2010 – 1.60%)First City Monument Bank 2,812,784 0.23Guaranty Trust Bank 2,255,934 0.18Guaranty Trust Bank GDR 3,241,376 0.26Nigerian Breweries 4,355,807 0.35United Bank for Africa 2,951,780 0.24_______________________________ ________ ___________ ___________
15,617,681 1.26_______________________________________ ___________ ___________ROMANIA (2010 – 0.77%)NCH Balkan Fund* 8,435,250 0.68_______________________________________ ___________ ___________

TH E PO RT F O L I OCONTINUED
27
FAIR PROPORTIONVALUE OF FUND
$ (%)_______________________________________ ___________ ___________RUSSIA (2010 - 8.85%)FESCO 4,634,505 0.38LSR Group – GDR 3,516,056 0.28Lukoil ADR 1,183,005 0.10Lukoil Holdings ADR 508,800 0.04Magnit 14,947,366 1.21Mail.ru Group Ltd GDR 287,473 0.02Nomos Bank 3,930,356 0.32Novatek GDR Reg S 14,645,112 1.18Novorossiysk Commercial Sea Port GDR 4,805,518 0.39Raspadskaya 8,557,710 0.69Sberbank RF 23,536,148 1.90X5 Retail Group GDR Reg S 10,850,211 0.88__________________________ ___________ ___________ ___________
91,402,260 7.39_______________________________________ ___________ ___________SAUDI ARABIA (2010 – 0.45%)Almarai – Deutsche Bank P Note 2,735,460 0.22Almarai – HSBC Bank P Note 2,837,444 0.23__________________________ ___________ ___________ ___________
5,572,904 0.45_______________________________________ ___________ ___________SOUTH AFRICA (2010 – 11.13%)Anglo American 64,423,384 5.21Bidvest Group 12,872,264 1.04Pick ‘n’ Pay Stores 4,468,052 0.36SABMiller 24,908,416 2.01SABMiller (London Listing) 6,292,257 0.51Sasol 8,905,603 0.72Standard Bank Group 12,102,741 0.98__________________________ ___________ ___________ ___________
133,972,717 10.83_______________________________________ ___________ ___________SOUTH KOREA (2010 – 6.22%)Korea Electric Power 22,923,330 1.85MegaStudy 2,737,850 0.22NHN Corp 6,934,927 0.56Samsung Electronics (Ordinary) 32,962,908 2.66Samsung Electronics (Preferred) 14,806,411 1.20Samsung Electronics GDS 1/2 N/Vtg 7,246,894 0.59Samsung Fire & Marine 17,028,690 1.38Shinhan Financial Group 17,533,981 1.42__________________________ ___________ ___________ ___________
122,174,991 9.88_______________________________________ ___________ ___________TAIWAN (2010 – 4.22%)MediaTek 7,278,681 0.59RichTek Technology 1,802,476 0.14Taiwan Semiconductor Manufacturing 58,602,182 4.74__________________________ ___________ ___________ ___________
67,683,339 5.47_______________________________________ ___________ ___________THAILAND (2010 – 2.00%)Bank of Ayudhya 8,787,063 0.71C.P. All Pcl (foreign) 4,699,621 0.38Siam Commercial Bank (foreign) 9,638,537 0.78Thai Beverages 7,225,361 0.58__________________________ ___________ ___________ ___________
30,350,582 2.45_______________________________________ ___________ ___________

28
TH E PO RT F O L I OCONTINUED
FAIR PROPORTIONVALUE OF FUND
$ (%)_______________________________________ ____________ ___________TURKEY (2010 – 3.26%)Akfen Holdings 2,027,745 0.16Anadolu Efes Biracilik 11,224,958 0.91Turkiye Garanti Bankasi 5,964,217 0.48Yapi ve Kredi Bankasi 5,747,434 0.46__________________________ ___________ ____________ ___________
24,964,354 2.01_______________________________________ ____________ ___________UKRAINE (2010 – 0.05%)Ukraine Opportunity 787,500 0.06Ukraine Opportunity Trust Wts 04/30/2012 5,000 0.00__________________________ ___________ ____________ ____________________________________ 792,500 0.06_______________________________________ ____________ ___________UNITED KINGDOM (2010 – 1.49%)Tullow Oil 21,520,144 1.74_______________________________________ ____________ ___________VIETNAM (2010 – 0.37%)Mekong Enterprise Fund II* 3,996,300 0.32_______________________________________ ____________ ___________ZAMBIA (2010 – 1.14%)First Quantum Minerals 29,762,938 2.41_______________________________________ ____________ ___________ZIMBABWE (2010 – 0.16%)Delta Corp 2,552,464 0.21_______________________________________ ____________ ___________TOTAL INVESTMENTS 1,219,924,732 98.60Net current assests 17,277,700 1.40_________________________ ___________ ____________ ___________TOTAL NET ASSETS 1,237,202,432 100.00_______________________________________ ____________ __________________________________________________ ____________ ___________
* Unquoted securities, not traded on an official Stock Exchange or other Regulated Market.
^ Treating Genesis smaller Companies SICAV and Genesis Indian Investment Company on a“non-look-through” basis.

29
IN D E P E N D E N T AU D I TO R S ’ RE P O RTTO T H E ME M B E R S O F GE N E S I S EM E RG I N G MA R K E T S FU N D LI M I T E D
Report on the financial statementsWe have audited the accompanying consolidated financial statements (the “financial statements”) of GenesisEmerging Markets Fund Limited (the “Group”) which comprise the consolidated statement of financialposition as of 30th June 2011 and the consolidated statement of comprehensive income, the consolidatedstatement of changes in equity and the consolidated statement of cash flows for the year then ended and asummary of significant accounting policies and other explanatory information.
Directors’ responsibility for the financial statementsThe directors are responsible for the preparation of financial statements that give a true and fair view inaccordance with International Financial Reporting Standards as adopted by the European Union (“EU”) andwith the requirements of Guernsey law. The directors are also responsible for such internal control as theydetermine is necessary to enable the preparation of financial statements that are free from material misstatement,whether due to fraud or error.
Auditors’ responsibilityOur responsibility is to express an opinion on these financial statements based on our audit. We conducted ouraudit in accordance with International Standards on Auditing. Those Standards require that we comply withethical requirements and plan and perform the audit to obtain reasonable assurance whether the financialstatements are free from material misstatement.
An audit involves performing procedures to obtain audit evidence about the amounts and disclosures in thefinancial statements. The procedures selected depend on the auditors’ judgement, including the assessment ofthe risks of material misstatement of the financial statements, whether due to fraud or error. In making thoserisk assessments, the auditor considers internal control relevant to the entity’s preparation and fair presentationof the financial statements in order to design audit procedures that are appropriate in the circumstances, but notfor the purpose of expressing an opinion on the effectiveness of the entity’s internal control. An audit alsoincludes evaluating the appropriateness of accounting policies used and the reasonableness of accountingestimates made by the directors, as well as evaluating the overall presentation of the financial statements.
We believe that the audit evidence we have obtained is sufficient and appropriate to provide a basis for ouraudit opinion.
OpinionIn our opinion, the financial statements give a true and fair view of the financial position of the Group as of30th June 2011, and of its financial performance and cash flows for the year then ended in accordance withInternational Financial Reporting Standards as adopted by the EU and have been properly prepared inaccordance with the requirements of The Companies (Guernsey) Law, 2008.
Report on other legal and regulatory requirementsWe read the other information contained in the Annual Report and consider the implications for our report if webecome aware of any apparent misstatements or material inconsistencies with the financial statements. The otherinformation comprises only the introduction, the directors, the highlights, the chairman’s statement, the directors’report, the manager’s review, the twenty largest holdings, the country exposure of the portfolio, the sector exposureof the portfolio, the portfolio, the performance record, the administration and the notice of meeting.

30
IN D E P E N D E N T AU D I TO R S ’ RE P O RTTO T H E ME M B E R S O F GE N E S I S EM E RG I N G MA R K E T S FU N D LI M I T E D
CONTINUED
In our opinion the information given in the directors’ report is consistent with the financial statements.
This report, including the opinion, has been prepared for and only for the Company’s members as a body inaccordance with Section 262 of The Companies (Guernsey) Law, 2008 and for no other purpose. We do not,in giving this opinion, accept or assume responsibility for any other purpose or to any other person to whomthis report is shown or into whose hands it may come save where expressly agreed by our prior consent in writing.
Matters on which we are required to report by exceptionWe have nothing to report in respect of the following matters which we are required to review under the Listing Rules:
• the directors’ statement set out on page 14 in relation to going concern; and
• the part of the Corporate Governance Statement relating to the Company’s compliance with the nineprovisions of the UK Corporate Governance Code specified for our review.
John LuffFor and on behalf ofPricewaterhouseCoopers CI LLPChartered Accountants and Recognised AuditorsGuernsey,Channel Islands30th September 2011

31
CO N S O L I DAT E D STAT E M E N T O F FI NA N C I A L PO S I T I O Nas at 30th June 2011
2011 2010Note $ $
______________ ______________ASSETSCurrent assets
2(b), 15 Financial assets at fair value through profit or loss 1,219,924,732 960,328,4122(g) Amounts due from brokers 5,340,370 131,0022(d) Dividends receivable 5,002,712 1,895,408
Other receivables and prepayments 161,691 155,2952(f) Cash and cash equivalents 13,495,617 13,689,031
______________ ______________TOTAL ASSETS 1,243,925,122 976,199,148
______________ ______________
LIABILITIESCurrent Liabilities
2(g) Amounts due to brokers 2,635,513 257,9832(j) Capital gains tax payable 2,053,400 33,8177 Payables and accrued expenses 2,033,777 1,548,5392(f) Bank overdraft – 2
______________ ______________TOTAL LIABILITIES 6,722,690 1,840,341
______________ ______________TOTAL NET ASSETS 1,237,202,432 974,358,807
______________ ____________________________ ______________
EQUITY4 Share premium 134,348,973 134,348,9736 Capital reserve 1,068,728,454 804,245,831
Revenue account 34,125,005 35,764,003 ______________ ______________
TOTAL EQUITY 1,237,202,432 974,358,807______________ ____________________________ ______________
19 EQUITY PER PARTICIPATINGPREFERENCE SHARE* $9.17 $7.22
______________ ____________________________ ______________
* Calculated on an average number of 134,963,060 Participating Preference Shares outstanding (2010:134,963,060).
Signed on behalf of the Board
Coen TeulingsDr. John Llewellyn
29th September 2011
The notes on pages 35 to 57 form part of these financial statementsReport of the Independent Auditors page 29 to 30

32
CO N S O L I DAT E D STAT E M E N T O FCO M P R E H E N S I V E IN C O M E
for the year ended 30th June 2011
2011 2010Note $ $
______________ ______________INCOME
2(b), 15 Net change in financial assets at fair value through profit or loss 265,037,087 245,000,9422(c) Net exchange losses (554,464) (449,957)2(d) Dividend income 25,395,679 15,755,331 2(d) Deposit interest 21,215 26,097
______________ ______________289,899,517 260,332,413
______________ ______________
EXPENSES9 Management fees (17,629,348) (14,241,355)11 Custodian fees (1,475,671) (1,262,244)16 Transaction costs (990,520) (1,143,840)12 Directors’ fees and expenses (413,466) (294,992)10 Administration fees (171,711) (160,763)
Audit fees (53,032) (36,680)Other expenses (182,376) (317,390)
______________ ______________TOTAL OPERATING EXPENSES (20,916,124) (17,457,264)
______________ ______________OPERATING PROFIT 268,983,393 242,875,149
FINANCE COSTSBank charges (512) (1,824)Interest expense (341) (31,907)
______________ ______________TOTAL FINANCE COSTS (853) (33,731)
2(j), 13 Capital gains tax (3,340,340) (1,165,675)2(j), 13 Withholding taxes (2,798,575) (1,577,025)
______________ ______________PROFIT FOR THE YEAR ATTRIBUTABLE
TO PARTICIPATING PREFERENCE SHARES 262,843,625 240,098,718______________ ______________
Other Comprehensive Income – –______________ ______________
TOTAL COMPREHENSIVE INCOME 262,843,625 240,098,718______________ ____________________________ ______________
5 EARNINGS PER PARTICIPATING PREFERENCE SHARE* $1.95 $1.78
______________ ____________________________ ______________
* Calculated on an average number of 134,963,060 Participating Preference Shares outstanding (2010:134,963,060).
The notes on pages 35 to 57 form part of these financial statementsReport of the Independent Auditors page 29 to 30

33
CO N S O L I DAT E D STAT E M E N T O F CH A N G E S I N EQU I T Yfor the year ended 30th June 2011
2011Share Capital Revenue
Premium Reserve Account Total
$ $ $ $ _________________________________________________________________Net assets at the beginning
of the year 134,348,973 804,245,831 35,764,003 974,358,807Profit for the year – – 262,843,625 262,843,625 Transfer to Capital Reserve – 264,482,623 (264,482,623) –_________________________________________________________________Net assets at the end
of the year 134,348,973 1,068,728,454 34,125,005 1,237,202,432 __________________________________________________________________________________________________________________________________
2010Share Share Capital Revenue
Capital Premium Reserve Account Total
$ $ $ $ $ _________________________________________________________________Net assets at the beginning
of the year 270,633 134,078,340 559,694,846 40,216,270 734,260,089 Redenomination of shares* (270,633) 270,633 – – –Profit for the year – – – 240,098,718 240,098,718 Transfer to Capital Reserve – – 244,550,985 (244,550,985) –_________________________________________________________________Net assets at the end
of the year – 134,348,973 804,245,831 35,764,003 974,358,807 __________________________________________________________________________________________________________________________________
* At the Extraordinary General Meeting held at the end of October 2009 it was resolved to re-denominate the share capitalso as to permit the shares to be quoted in Sterling rather than US dollars, and secondly a division of each existing share intoten, thereby reducing the market price of each share.
The notes on pages 35 to 57 form part of these financial statementsReport of the Independent Auditors page 29 to 30
34
CO N S O L I DAT E D STAT E M E N T O F CA S H FLOW Sfor the year ended 30th June 2011
2011 2010$ $_____________ _____________
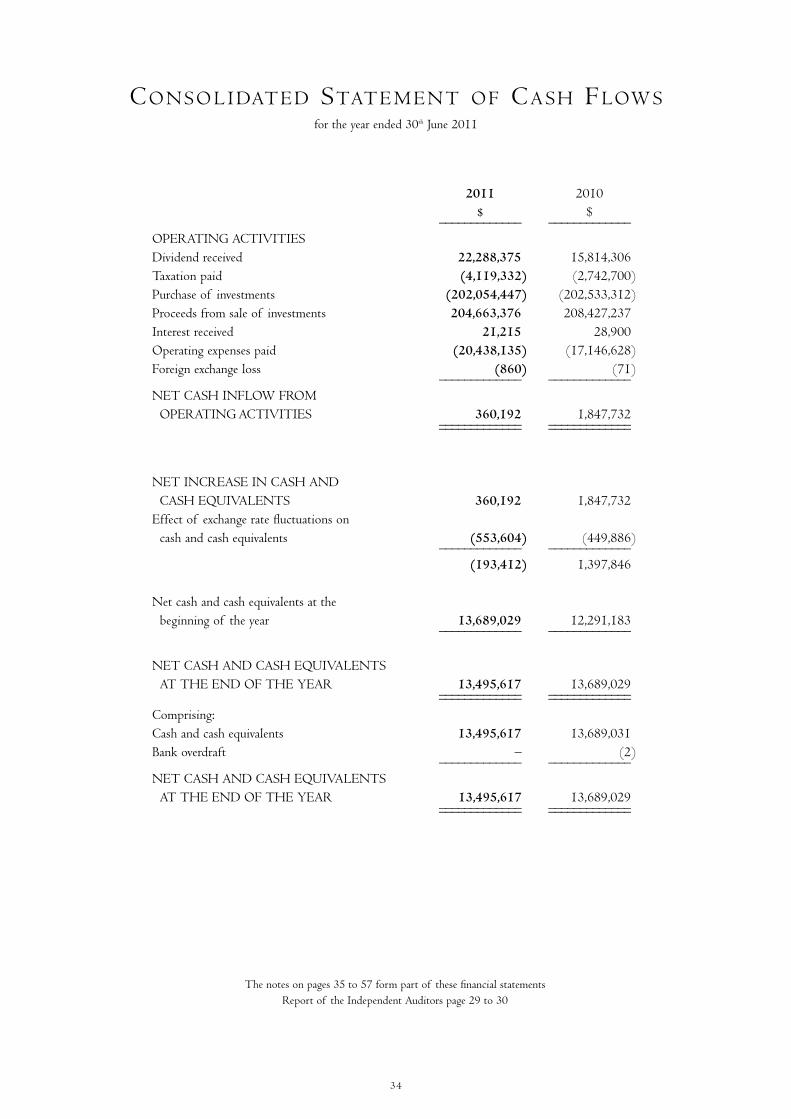
OPERATING ACTIVITIESDividend received 22,288,375 15,814,306Taxation paid (4,119,332) (2,742,700)Purchase of investments (202,054,447) (202,533,312)Proceeds from sale of investments 204,663,376 208,427,237Interest received 21,215 28,900Operating expenses paid (20,438,135) (17,146,628)Foreign exchange loss (860) (71)_____________ _____________
NET CASH INFLOW FROMOPERATING ACTIVITIES 360,192 1,847,732_____________ __________________________ _____________
NET INCREASE IN CASH AND CASH EQUIVALENTS 360,192 1,847,732
Effect of exchange rate fluctuations oncash and cash equivalents (553,604) (449,886)_____________ _____________
(193,412) 1,397,846
Net cash and cash equivalents at thebeginning of the year 13,689,029 12,291,183_____________ _____________
NET CASH AND CASH EQUIVALENTSAT THE END OF THE YEAR 13,495,617 13,689,029_____________ __________________________ _____________
Comprising:Cash and cash equivalents 13,495,617 13,689,031Bank overdraft – (2)_____________ _____________
NET CASH AND CASH EQUIVALENTSAT THE END OF THE YEAR 13,495,617 13,689,029_____________ __________________________ _____________
The notes on pages 35 to 57 form part of these financial statementsReport of the Independent Auditors page 29 to 30

35
NOT E S TO T H E CO N S O L I DAT E D FI NA N C I A L STAT E M E N T Sfor the year ended 30th June 2011
Genesis Emerging Markets Fund Limited (the “Company”), a closed-ended fund listed on
the London Stock Exchange, was incorporated in Guernsey on 7th June 1989 and
commenced activities on 19th September 1989. The Fund comprises the Company and its
wholly owned subsidiary Genemar Limited. The Fund is an Authorised Closed-ended
Investment Scheme as defined by the Authorised Closed-ended Investment Schemes Rules
(2008) (and, as such, is subject to ongoing supervision by the Guernsey Financial Services
Commission). The Fund is a constituent of the FTSE 250 Index.
The Fund’s registered office is at Arnold House, St. Julian’s Avenue, St. Peter Port,
Guernsey GY1 3NF, Channel Islands.
(a) Basis of Preparation
The principal accounting policies applied in the preparation of these consolidated financial
statements are set out below. These policies have been consistently applied to all years
presented, unless otherwise stated.
The consolidated financial statements have been prepared in accordance with International
Financial Reporting Standards (“IFRS”) as adopted by the European Union (“EU”) and
interpretations by the International Financial Reporting Interpretations Committee of the
International Accounting Standards Board.
The consolidated financial statements have been prepared under the historical cost
convention, as modified by the revaluation of financial assets and financial liabilities at fair
value through profit or loss.
The preparation of consolidated financial statements in conformity with IFRS may require
management to make judgements, estimates and assumptions that affect the application of
policies and the reported amounts of assets and liabilities, income and expense. The
estimates and associated assumptions, relating to unlisted securities, are based on the
historical experience and various other factors that are believed to be reasonable under the
circumstances, the results of which form the basis of making the judgements about the
carrying value of assets and liabilities that are not readily apparent from other sources.
Actual results may differ from these estimates.
The following new standards and amendments to existing standards are relevant to the
Fund’s operations and are mandatory for accounting periods ending on 30th June 2011:
1. GENERAL
2. SUMMARY OF
SIGNIFICANT
ACCOUNTING
POLICIES

36
NOT E S TO T H E CO N S O L I DAT E D FI NA N C I A L STAT E M E N T SCONTINUED
(a) Basis of Preparation (continued)
Annual Improvements to IFRS’s (2009) (effective 1 January 2010)
IFRS 8, ‘Operating Segments’
IAS 1, ‘Presentation of financial statements’
IAS 7, ‘Statement of cash flows’
IAS 18, ‘Revenue’
IAS 36, ‘Impairment of assets’
IAS 39, ‘Financial instruments: Recognition and measurement’
The following standards, amendments to standards and interpretations are newly applicable
for companies with 30th June 2011 year ends, but are not relevant to the consolidated
financial statements of the Fund:
Annual Improvements to IFRS’s (2009) (effective 1 January 2010)
IFRS 2, ‘Share based payments’
IFRS 5, ‘Non current assets held for sale and discontinued operations’
IAS 17, ‘Leases’
IAS 38, ‘Intangible assets’
IFRIC 9, ‘Reassessment of embedded derivatives’
IFRIC 16, ‘Hedges of net investment in foreign operation’
Amendments to IFRS 1 for additional exemptions (effective 1 January 2010)
Amendments IAS 32, ‘Financial instruments: Presentation on classification of rights issues’
(effective 1 February 2010)
Amendment to IFRS 2, ‘Share based payments – Group cash-settled share-based payment
transactions’ (effective 1 January 2010)
Amendment to IFRS 1, ‘First time adoption on financial instrument disclosures’ (effective
1 July 2010)
IFRIC 15, ‘Arrangements for construction of real estates’ (effective 1 January 2009 but EU
endorsed for 1 January 2010)
IFRIC 18, ‘Transfer of assets from customers’ (effective for transfers of assets from
customers received on or after 1 July 2009; EU-endorsed for use in annual periods
beginning on or after 31 October 2009)
IFRIC 19, ‘Extinguishing financial liabilities with equity instruments’ (effective 1 July 2010)
(b) Financial Instruments
Classification
In accordance with IAS 39 the Fund has designated all of its investments as at fair value
through profit or loss. This category comprises financial instruments designated at fair
value through profit or loss upon initial recognition and includes financial assets that are
not held for trading purposes and which may be sold. The investments of the Fund are
principally in listed equities.
2. SUMMARY OF
ACCOUNTING
POLICIES
CONTINUED

37
NOT E S TO T H E CO N S O L I DAT E D FI NA N C I A L STAT E M E N T SCONTINUED
(b) Financial Instruments (continued)
Loans and receivables are non-derivative financial assets with fixed or determinable
payments that are not quoted in an active market. The Fund includes in this category cash
and cash equivalents, due from brokers and other short term receivables.
Other financial liabilities include all financial liabilities, other than those classified as held
for trading. The Fund includes in this category bank overdraft, due to brokers and other
short term liabilities.
Recognition/derecognition
The Fund recognises a financial asset or a financial liability when, and only when, it
becomes a party to the contractual provisions of the instrument.
Regular-way purchases and sales of investments are recognised on the trade date – the date
on which the Fund commits to purchase or sell the investment.
Investments are derecognised when the rights to cash flows from the investments have
expired or the Fund has transferred substantially all risks and rewards of ownership.
The Fund derecognises a financial liability when the obligation under the liability is
discharged, cancelled or expires.
Measurement
Financial assets and financial liabilities at fair value through profit or loss are measured initially
at fair value being the transaction price. Transaction costs are expensed in the Consolidated
Statement of Comprehensive Income. Subsequent to initial recognition, all financial assets
and financial liabilities at fair value through profit or loss are measured at fair value.
Gains and losses arising from changes in the fair value of the ‘financial assets or financial
liabilities at fair value through profit or loss’ category are presented in the Consolidated
Statement of Comprehensive Income in the year in which they arise.
Loans and receivables and financial liabilities are measured initially at their fair value plus
any directly attributable incremental costs of acquisition or issue.
Fair value measurement
Fair value is the amount by which an asset could be exchanged, or a liability settled, between
knowledgeable willing parties in an arm’s length transaction.
Securities listed on active markets are valued based on their closing bid prices, as quoted on
the principal exchange on which they are listed. Positions held in Genesis Smaller Companies
SICAV (open-ended and listed but not traded) and Genesis Indian Investment Company
(close-ended and non-listed) are valued at their fair value at the reporting end date.
2. SUMMARY OF
ACCOUNTING
POLICIES
CONTINUED
38
NOT E S TO T H E CO N S O L I DAT E D FI NA N C I A L STAT E M E N T SCONTINUED
(b) Financial Instruments (continued)
Private placements are not registered for public sale and, excluding the two Genesis
investment funds, are carried at an estimated fair value at the end of the year, as determined
in good faith by the Valuation Committee of the Manager, in consultation with the Board
of Directors of the Fund. Factors considered in determining fair value will include a review
of the most recent statement of financial position and operating results of the private
placement and such other factors as may be relevant. Private placements are classified either
in Level 2 or 3 of the fair value hierarchy, depending on whether they are valued based on
observable inputs or unobservable inputs.
For other investments held, where market prices are not readily available (or if available
market quotations are not reliable), securities are valued at their fair value as determined in
good faith by the Valuation Committee of the Manager, using procedures approved by the
Board of Directors. In such circumstances the value of the security will be determined after
considering factors such as cost, the type of investment, subsequent trades by the Fund or
other investors and other factors as may be relevant.
The Fund may use fair value pricing if the value of a security has been materially affected by
events occurring before the Fund’s calculation of NAV but after the close of the primary
markets on which the security is traded. The Fund may also use fair value pricing if reliable
market quotations are unavailable due to infrequent trading or if trading in a particular
security was halted during the day and did not resume prior to the Fund’s calculation of NAV.
Amortised cost measurement
Loans and receivables are carried at amortised cost using the effective interest method less any
allowance for impairment. Gains and losses are recognised in profit or loss when the loans and
receivables are derecognised or impaired, as well as through the amortisation process.
The effective interest method is a method of calculating the amortised cost of a financial asset
or financial liability and of allocating the interest income or interest expense over the relevant
period. The effective interest rate is the rate that exactly discounts estimated future cash
payments or receipts throughout the expected life of the financial instrument, or, when
appropriate, a shorter period, to the net carrying amount of the financial asset or financial
liability. When calculating the effective interest rate, the Fund estimates cash flows considering
all contractual terms of the financial instrument but does not consider future credit losses. The
calculation includes all fees paid or received between parties to the contract that are an integral
part of the effective interest rate, transaction costs and all other premiums or discounts.
Financial liabilities, other than those classified as at fair value through profit or loss, are
measured at amortised cost using the effective interest method. Gains and losses are
recognised in profit or loss when the liabilities are derecognised, as well as through the
amortisation of these liabilities.
2. SUMMARY OF
ACCOUNTING
POLICIES
CONTINUED
39
NOT E S TO T H E CO N S O L I DAT E D FI NA N C I A L STAT E M E N T SCONTINUED
(b) Financial Instruments (continued)
Identification and measurement of impairment
At each reporting date the Fund assesses whether there is objective evidence that financial assets
measured at amortised cost are impaired. A financial asset or a group of financial assets is
impaired when objective evidence demonstrates that a loss event has occurred after the initial
recognition of the asset(s), and that the loss event has an impact on the future cash flows of
the asset(s) that can be estimated reliably. When a subsequent event causes the amount of
impairment loss to decrease, the decrease in impairment is reversed through profit or loss.
Impairment losses on assets carried at amortised cost are measured as the difference between
the carrying amount of the financial asset and the present value of estimated future cash flows
discounted at the asset’s original effective interest rate. Impairment losses are recognised in
profit or loss and reflected in an allowance account against loans and receivables. Interest on
impaired assets continues to be recognised through the unwinding of the discount.
The Fund writes off financial assets carried at amortised cost when they are determined to
be uncollectible.
(c) Foreign Currency Translation
(i) Functional and Presentation Currency
The books and records of the Fund are maintained in the currency of the primary economic
environment in which it operates (its functional currency). The Directors have considered the
primary economic environment of the Fund and considered the currency in which the original
capital was raised, past distributions have been made and ultimately the currency capital would
be returned on a break up basis. The Directors have also considered the currency to which
underlying investments are exposed. On balance the Directors believe that US dollar best
represents the functional currency. The financial statements, results and financial position of
the Fund are also expressed in US dollars which is the presentation currency of the Fund.
(ii) Transactions and balances
Transactions in currencies other than US dollars are recorded at the rates of exchange
prevailing on the date of the transaction. At the end of each reporting period monetary
items and non-monetary assets and liabilities that are fair valued and are denominated in
foreign currencies are retranslated at rates prevailing at the end of the reporting period.
Gains and losses arising on translation are included in the Consolidated Statement of
Comprehensive Income for the year.
Foreign exchange gains and losses relating to cash and cash equivalents are presented in the
Consolidated Statement of Comprehensive Income within ‘Net exchange losses’.
Foreign exchange gains and losses relating to financial assets at fair value through profit or
loss are presented in the Consolidated Statement of Comprehensive Income within ‘Net
change in financial assets at fair value through profit or loss’.
2. SUMMARY OF
ACCOUNTING
POLICIES
CONTINUED

40
(d) Recognition of Dividend and Interest Income
Dividends arising on the Fund’s investments are accounted for on an ex-dividend basis, gross
of applicable withholding taxes. Deposit interest and interest on short-term paper is accrued
on a day-to-day basis using the effective interest method. Dividend and interest income are
recognised in the Consolidated Statement of Comprehensive Income.
(e) Dividend Distribution
Dividend distributions are at the discretion of the Fund. A proposed dividend is recognised
as a liability in the period in which it is approved by the annual general meeting of the
shareholders and is recognised in the Consolidated Statement of Comprehensive Income.
(f) Cash and Cash Equivalents
Cash comprises current deposits with banks. Cash equivalents are short-term highly liquid
investments that are readily convertible within three months to known amounts of cash, are
subject to an insignificant risk of changes in value, and are held for the purpose of meeting
short-term cash commitments rather than for investment or other purposes. Cash and cash
equivalents are classified as loans and receivables.
Bank overdrafts are accounted for as short term liabilities on the Consolidated Statement of
Financial Position and the interest expense is recorded using the effective interest rate
method. Bank overdrafts are classified as other financial liabilities.
(g) Due To and Due From Brokers
Amounts due to brokers are payables for securities purchased that have been contracted for
but not yet delivered on the reporting date.
Amounts due from brokers include receivables for securities sold that have been contracted
for but not yet delivered on the reporting date.
These amounts are recognised initially at fair value and subsequently measured at amortised
cost using the effective interest method, less provision for impairment for amounts due from
brokers. A provision for impairment of amounts due from brokers is established when there
is objective evidence that the Fund will not be able to collect all amounts due from the
relevant broker. Significant financial difficulties of the broker, probability that the broker
will enter bankruptcy or financial reorganisation, and default in payments are considered
indicators that the amount due from brokers is impaired.
(h) Segment Reporting
Operating Segments are reported in a manner consistent with the internal reporting used by
the chief operating decision maker (“CODM”). The CODM, who is responsible for
allocation of resources and assisting performance of the operating segments, has been
identified as the Manager.
2. SUMMARY OF
ACCOUNTING
POLICIES
CONTINUED
NOT E S TO T H E CO N S O L I DAT E D FI NA N C I A L STAT E M E N T SCONTINUED

41
2. SUMMARY OF
ACCOUNTING
POLICIES
CONTINUED
(i) Expenses
All expenses are accounted for on an accruals basis and are charged to the Consolidated
Statement of Comprehensive Income.
(j) Taxation
The Fund currently incurs withholding taxes imposed by certain countries on investment
income and capital gains taxes upon realisation of its investments. Such income or gains are
recorded gross of withholding taxes in the Consolidated Statement of Comprehensive
Income. Withholding taxes and capital gains taxes are shown as separate items in the
Consolidated Statement of Comprehensive Income.
In accordance with IAS 12, “Income Taxes”, where necessary the Fund provides for
deferred taxes on any capital gains/losses on the revaluation of securities in such
jurisdictions where capital gains tax is levied.
(k) Basis of Consolidation
The Consolidated Statement of Financial Position, Consolidated Statement of
Comprehensive Income and Consolidated Statement of Cash Flows include the accounts
of the Fund and its subsidiary undertaking made up to 30th June 2011. Intra-group
transactions are eliminated fully on consolidation.
Subsidiaries are all entities (including underlying investment funds) over which the Fund
has the power to govern the financial and operating policies generally accompanying a
shareholding of more than one half of the voting rights. The existence and effect of
potential voting rights that are currently exercisable or convertible are considered when
assessing whether the Fund controls another entity. Subsidiaries are fully consolidated from
the date on which control is transferred to the Fund. They are de-consolidated from the
date that control ceases.
(l) Share Capital
Participating Preference Shares have no fixed redemption date and do not automatically
participate in the net income or accrue dividends of the Fund and are classified as equity.
Incremental costs directly attributable to the issue of new shares are shown in equity as a
deduction from the proceeds net of tax.
(m) Purchase of Own Shares
The cost of purchases of the Fund’s own shares is shown as a reduction in Shareholders’
Funds. The Fund’s net asset value and return per Participating Preference Share are
calculated using the number of shares outstanding after adjusting for purchases.
NOT E S TO T H E CO N S O L I DAT E D FI NA N C I A L STAT E M E N T SCONTINUED

42
The preparation of consolidated financial statements, in conformity with IFRS, requires the
use of certain critical accounting estimates. It also requires the Board of Directors to exercise
its judgment in the process of applying the Fund’s accounting policies. For example, the Fund
may, from time to time, hold financial instruments that are not quoted in active markets, such
as minority holdings in investment and private equity companies. Fair values of such
instruments are determined using different valuation techniques validated and periodically
reviewed by the Board of Directors.
(a) Authorised
1,000 Founder shares of no par value
335,000,000 Unclassified shares of no par value
Called-up(b) Issued Number of Share Share
Shares Capital Premium$ $
As at 30th June 2011 134,964,060 – 134,348,973__________ _________ ___________________ _________ _________
As at 1st July 2009 26,064,303 270,633 134,078,340__________ _________ _________
Transfer to share premium – (270,633) 270,633__________ _________ _________
Cancellation of nominal shares (13,376,997) – –__________ _________ _________
Increase in Participating Preference Sharesdue to redenomination 122,276,754 – –__________ _________ _________
Totals at 30th June 2010 134,964,060 – 134,348,973__________ _________ ___________________ _________ _________
Consists of:Founder shares of no par value 1,000Participating Preference Shares of no par value adjusted for purchase of own shares(note 2(m) and 8) 134,963,060__________Total at 30th June 2011 134,964,060
____________________
Founder Shares
All of the Founder Shares were issued on 6th June 1989 to the Manager or its nominees. The
Founder Shares exist solely to comply with Guernsey Law which requires that Participating
Preference Shares must have preference over another class of capital. The Founder Shares were
issued at $1 each par value. The Founder Shares are not redeemable.
3. CRITICAL
ACCOUNTING
ESTIMATES AND
ASSUMPTIONS
4. SHARE CAPITAL
AND SHARE
PREMIUM
NOT E S TO T H E CO N S O L I DAT E D FI NA N C I A L STAT E M E N T SCONTINUED

43
NOT E S TO T H E CO N S O L I DAT E D FI NA N C I A L STAT E M E N T SCONTINUED
4. SHARE CAPITAL
AND SHARE
PREMIUM
CONTINUED
The Founder Shares confer upon the holders thereof the right in a winding up, subject to
prior repayment of the Participating Preference Shares and any Nominal Shares that may
be in issue at the time, to the repayment of the amount paid up on the Founder Shares, but
confer no right to participate in profits of the Fund. Accordingly, Founder Shares will not
entitle the holders thereof to receive any dividends. At general meetings, on a poll, every
holder is entitled to one vote in respect of each Founder Share held.
At the Extraordinary General Meeting of the Company on 30th October 2009 and in
accordance with The Companies (Guernsey) Law, 2008 it was approved that each Founder
Share be redesignated as no par value shares.
Nominal Shares
All of the Nominal Shares were issued to the Manager. The Nominal Shares were issued to
comply with The Companies (Guernsey) Law, 1994 which required that upon the
redemption of any part of the share capital of a company, the nominal value redeemed must
be replaced by a fresh issue of shares. Following the share split and redenomination, the
Participating Preference Shares were redesignated as shares with no par value in accordance
with The Companies (Guernsey) Law, 2008 (as amended) and subsequently Nominal
Shares will not be required to be issued upon their redemption and so were cancelled in the
prior year. This was noted in Note 3 of the prior year financial statements.
Participating Preference Shares
At the Extraordinary General Meeting of the Company on 30th October 2009 it was
approved that each Participating Preference Share be divided into ten Redenomination
Shares. Under the The Companies (Guernsey) Law, 2008 (as amended) the nominal value
of the shares were also converted into Sterling and redesignated as no par value shares.
After repayment of the nominal amounts paid up on the Founder Shares and any Nominal
Shares in issue, the holders of Participating Preference Shares rank ahead of holders of any
other class of share in issue in a winding up. They have the right to receive any surplus assets
available for distribution. The Participating Preference Shares confer the right to dividends
declared, and at general meetings, on a poll, confer the right to one vote in respect of each
Participating Preference Share held. Participating Preference Shares are classed as equity as
they have a residual interest in the assets of the company.
All of the above classes of shares are considered as Equity under the definitions set out in
IAS 32, “Financial Instruments: Presentation”, because the shares are not redeemable and
there is no obligation to pay cash or another financial asset to the holder.

44
Basic earnings per share is calculated by dividing the profit/(loss) for the year by the weightedaverage number of Participating Preference Shares in issue during the year.
2011 2010$ $____________ ____________
Profit for the year attributable toParticipating Preference Shares 262,843,625 240,098,718
Weighted average number ofParticipating Preference Shares outstanding 134,963,060 134,963,060____________ ____________
Basic earnings per Participating PreferenceShares – basic and diluted $1.95 $1.78____________ ________________________ ____________
The Fund has not issued any shares or other instruments that will dilute basic earnings.
All gains and losses derived from the sale, realisation or transfer of investments, and any othersums which in the opinion of the Directors are of a capital nature are applied to the capitalreserve.
The capital reserve as at 30th June 2011 consists of the following accumulated amounts:
2011 2010$ $____________ ___________
Realised gains on investments sold 661,971,126 580,462,321 Unrealised appreciation on revaluation
of investments 415,508,256 231,979,974 Exchange losses (8,723,693) (8,169,229)Transfer to share premium (27,235) (27,235)____________ ___________
1,068,728,454 804,245,831 ____________ ________________________ ____________
2011 2010$ $___________ ___________
Management fees 1,522,234 1,217,280 Custodian fees 262,107 168,880Directors’ fees 160,000 84,001Audit fees 48,183 39,292Administration fees 26,718 24,599Interest expense 4 105Other accrued expenses 14,531 14,382 ___________ ___________
2,033,777 1,548,539____________ ________________________ ____________
5. EARNINGS PER
SHARE
6. CAPITAL
RESERVE
7. PAYABLES
AND ACCRUED
EXPENSES
NOT E S TO T H E CO N S O L I DAT E D FI NA N C I A L STAT E M E N T SCONTINUED

45
Genemar Limited, a wholly owned subsidiary of the Fund, was incorporated in Guernsey on
22nd June 1999. Its only activity is to purchase shares in the Fund. All of the issued shares in
Genemar Limited are owned by the Fund and were acquired for the cost of $2.
Genemar Limited owns 900,000 shares of the Company. The cost of these shares is shown
as a reduction in Shareholders’ Funds.
Genemar Limited has not purchased any of the Company’s shares during the year (2010: nil)
and there have been no purchases between the end of the reporting period and the date of this
report.
The Manager’s appointment is under a rolling contract which may be terminated by three
months written notice given by the Fund and twelve months by the Manager.
Under the Management Agreement, the Manager is entitled to receive a management fee from
the Fund, payable monthly, equal to 1.5% per annum, calculated and accrued on the Net
Asset Value of the Fund as at each Valuation Day (being the 15th day and last day of each
month), except for investments in other funds, where the Manager will absorb the expenses of
the management of other such funds to a maximum of 1% per annum of the value of the
Fund’s holding in the relevant fund at the relevant time. The effective management fee on the
average Net Assets of the Fund was 1.49% (2010: 1.49%). Where, in order to gain access to
a particular market, investment is made in a vehicle directly managed by Genesis, no fee will
be payable by the Fund on that proportion of its assets so invested, unless no management fee
is charged to that vehicle.
The Administrator, HSBC Securities Services (Guernsey) Limited, is entitled to receive
a fee, payable monthly, based on time incurred. Administration fees were $171,711
(2010: $160,763) for the year.
Under the Custodian Agreement, HSBC Custody Services (Guernsey) Limited, as Custodian
to the Fund, is entitled to receive a fee payable monthly, based on the Net Asset Value of the
Fund. Under the agreement between the Custodian and the Sub-Custodian, JP Morgan Chase
Bank, the latter is also entitled to receive a fee calculated on the same basis as the Custodian’s
fee. The Fund also reimburses the charges and expenses of other organisations with whom
securities are held. The total of all Custodian fees for the year represented approximately
0.12% (2010: 0.13%) per annum of the average Net Assets of the Fund.
8. PURCHASE OF OWN
SHARES
9. MANAGER’S
REMUNERATION AND
TERMS OF
APPOINTMENT
10. ADMINISTRATION
FEES
11. CUSTODIAN FEE
NOT E S TO T H E CO N S O L I DAT E D FI NA N C I A L STAT E M E N T SCONTINUED

46
Included in Directors’ fees and expenses are Directors’ fees for the year of $170,023 in total
(2010: $141,333). Also included are travelling, hotel and other expenses which the Directors
are entitled to when properly incurred by them in travelling to, attending and returning from
meetings and while on other business of the Fund.
The Fund is exempt from taxation in Guernsey under the provisions of the Income Tax
(Exempt Bodies) (Guernsey) Ordinance, 1989. As such, the Fund is only liable to pay a fixed
annual fee, currently £600.
Income due to the Fund is subject to withholding taxes. The Manager undertakes a review of
the tax situation of the Fund and believes that withholding taxes on dividend income and
capital gains taxes on capital gains are currently the material transactions that generate the
amounts of tax payable.
In accordance with IAS 12, “Income Taxes”, where necessary the Fund provides for deferred
taxes on any capital gains/losses on the revaluation of securities in such jurisdictions where
capital gains tax is levied.
The capital gains charge has been calculated on the basis of the tax laws enacted or
substantially enacted at the reporting date in the countries where the Fund’s investments
generate taxable income on realisation. The Manager on behalf of the Board periodically
evaluates which applicable tax regulations are subject to interpretation and establishes
provisions when appropriate.
The Genesis Indian Investment Company Limited and Genesis Smaller Companies SICAV were
related parties of the Fund by virtue of having a common Manager in Genesis Asset Managers,
LLP. The Fund’s holdings in these funds are summarised in the portfolio statement on pages 25
to 28, subscriptions and redemptions during the year under review are detailed in the table below.
No dividends were received from these funds during the year (2010: nil). There were no other
transactions between the Fund and such related parties during the year except as disclosed in
Notes 9 to 12 and there are no outstanding balances between these entities at 30th June 2011.
Directors’ related party interests are stated on page 16 as part of the Directors’ Report.
2011Subscriptions Redemptions
$ $___________ ___________Genesis Indian Investment Company Limited 11,003,376 8,457,906Genesis Smaller Companies SICAV 999,662 25,148,663
2010Subscriptions Redemptions
$ $___________ ___________Genesis Indian Investment Company Limited 14,594,207 14,335,255Genesis Smaller Companies SICAV – 19,025,584
12. DIRECTORS’ FEES
AND EXPENSES
13. TAXATION
14. RELATED PARTIES
NOT E S TO T H E CO N S O L I DAT E D FI NA N C I A L STAT E M E N T SCONTINUED

47
2011 2010
$ $____________ ___________
Financial assets at fair value through profit or loss:Designated at fair value through profit or loss:Listed equity securities 1,003,212,776 771,148,971Unlisted equity securities 216,711,956 189,179,441 ____________ ___________Total financial assets at fair value through
profit or loss: 1,219,924,732 960,328,412____________ _______________________ ___________
Other net changes in fair value of financial assets at fair value through profit or loss:Realised gains 81,508,805 64,803,259 Unrealised gains 183,528,282 180,197,683
____________ ___________Net change in financial assets at fair value
through profit or loss 265,037,087 245,000,942 ____________ _______________________ ___________
The following table shows financial instruments recorded at fair value, analysed between thosewhose fair value is based on quoted market prices, those involving valuation techniques where allthe model inputs are observable in the market and those where the valuation technique involvesthe use of non-market observable inputs. Fair value measurements are disclosed below by thesource of inputs using the following three-level hierarchy:
– Level 1: Quoted prices (unadjusted) in active markets for identical assets or liabilities.– Level 2: Inputs other than quoted prices included in Level 1 that are observable for the asset or
liability, either directly (as prices) or indirectly (derived from prices).– Level 3: Inputs for the asset or liability that are not based on observable market data
(unobservable inputs).
In some instances, the inputs used to measure fair value might fall into different levels of the fairvalue hierarchy. The level in the fair value hierarchy within which the fair value measurement in itsentirety falls shall be determined based on the lowest input level that is significant to the fair valuemeasurement in its entirety.
The following table summarises the valuation of the Fund’s securities using the fair valuehierarchy:
Level 1 Level 2 Level 3$ $ $____________ ____________ ____________
At 30th June 2011Investment in equity 998,699,526 196,345,875 24,879,331 ____________ ____________ ____________
998,699,526 196,345,875 24,879,331____________ ____________ ________________________ ____________ ____________
15. FINANCIAL ASSETS
AT FAIR VALUE
THROUGH PROFIT
OR LOSS
NOT E S TO T H E CO N S O L I DAT E D FI NA N C I A L STAT E M E N T SCONTINUED

48
Level 1 Level 2 Level 3$ $ $____________ ____________ ____________
At 30th June 2010Investment in equity 767,508,726 167,837,061 24,982,625 ____________ ____________ ____________
767,508,726 167,837,061 24,982,625____________ ____________ ________________________ ____________ ____________
The following table summarises the change in value associated with Level 3 financial instrumentscarried at fair value for the year ended 30th June 2011:
2011 2010Level 3 Level 3
$ $___________ ___________Balance at 1st July 24,982,625 21,363,051 Net (sales)/purchases (2,732,761) 2,359,172Realised gain 309,663 –Unrealised gain 2,319,804 1,260,402 ___________ ___________Balance at 30th June 24,879,331 24,982,625 ___________ ______________________ ___________
Unrealised gains as at year end amounting to $33,325 (2010: losses of $(2,286,479)) related
to Level 3 securities. Gains and losses (realised and unrealised) included in the Consolidated
Statement of Comprehensive Income for the year are reported in ‘net change in financial assets
at fair value through profit or loss’. There was no transfer of investments to Level 3 from Level
1 and Level 2 during the year.
During the year, expenses were incurred in acquiring or disposing of investments.
2011 2010$ $___________ ___________
Acquiring 567,932 581,870 Disposing 422,588 561,970 ___________ ___________
990,520 1,143,840 ___________ ______________________ ___________
The Fund has elected to treat all of its operations, for management purposes, as a single
operating segment as it does not aim at controlling or having any significant influence over the
entities in which it holds its investments.
The Fund is invested in equity securities. All of the Funds’ activities are interrelated, and each
activity is dependant on the others. Accordingly, all significant operating decisions are based
upon analysis of the Fund as one segment.
The financial positions and results from this segment are equivalent to the consolidated
financial statements of the Fund as a whole, as internal reports are prepared on a consistent
basis in accordance with the measurement and recognition principles of IFRS.
15. FINANCIAL ASSETS
AT FAIR VALUE
THROUGH PROFIT
OR LOSS
CONTINUED
16. COSTS OF
INVESTMENT
TRANSACTIONS
17. SEGMENT
INFORMATION
NOT E S TO T H E CO N S O L I DAT E D FI NA N C I A L STAT E M E N T SCONTINUED

49
The table below analyses the Fund’s operating income per geographical location. The
basis for attributing the operating income is consistent with the portfolio statement on
pages 25 to 28.
2011 2010$ $___________ ___________
Argentina 1 361,814 Austria 1,889,056 (1,618,513)Brazil 21,684,910 17,495,710 Chile 2,001,187 2,943,839 China 14,339,487 19,450,712 Colombia 3,241,171 3,730,711 Croatia 574,256 (996,316)Cyprus 293,545 –Egypt 670,061 2,632,214 Greece 2,260,150 1,175,482 Hungary 5,389,395 3,719,682 India 18,677,356 32,572,489 Indonesia 11,788,599 21,216,283 Iran 340,038 395,930 Israel – 2,584,305 Kenya 773,646 –Luxembourg 31,434,990 30,744,778 Malaysia 8,822,259 5,308,301 Mauritius 1,286,080 895,626 Mexico 13,646,444 13,609,975 Nigeria (70,300) 2,596,724 Peru 2,044,497 3,366,616 Romania 896,715 878,846 Russia 33,699,979 36,935,877 Saudi Arabia (89,600) 2,312,778 South Africa 42,169,138 19,085,112 South Korea 17,683,765 14,083,534 Taiwan 13,922,684 5,811,566 Thailand 8,241,206 3,871,348 Turkey 3,616,271 13,838,868 Ukraine 298,750 (67,500)United Kingdom 4,248,689 (690,846)United Arab Emirates – (2,359,724)Vietnam 1,150,378 1,361,444 Zambia 21,924,649 2,826,271 Zimbabwe 1,050,065 258,477 ___________ ___________TOTAL INCOME 289,899,517 260,332,413___________ ______________________ ___________
17. SEGMENT
INFORMATION
CONTINUED
NOT E S TO T H E CO N S O L I DAT E D FI NA N C I A L STAT E M E N T SCONTINUED

50
The table below analyses the Fund’s operating income by investment type.
2011 2010$ $___________ ___________
Equity securities 290,432,766 260,756,273 Cash and cash equivalents (533,249) (423,860)___________ ___________Total 289,899,517 260,332,413 ___________ ______________________ ___________
As at 30th June 2011 and 30th June 2010, the Fund has no assets classified as non-current
assets. For the breakdown of the Fund’s financial assets carried at fair value through profit or
loss, please refer to the Country Exposure of the Portfolio on page 23.
The Fund has a diversified shareholder population. However, as at 30th June 2011 there was
one shareholder who held more than 10% of the Fund’s net assets attributable to holders of
participating redeemable preference shares. The holding was as follows:
Strathclyde Pension Fund 14%
The Fund’s financial instruments comprise equities, holdings in investment companies, cash
and cash equivalents and short-term receivables and payables that arise directly from its
operations including amounts due to and due from brokers.
(a) Strategy in using Financial Instruments
(i) Objective of the Fund
The Fund’s objective is to provide shareholders with a broadly diversified means of investing
in developing countries and immature stock markets, and thus to provide access to superior
returns offered by high rates of economic and corporate growth, whilst limiting individual
country risk.
(ii) Investment Strategy and Process
The Manager employs a research driven approach at the stock specific level to identify
undervalued investments. In doing so, the Manager emphasises the importance of sustainable
cash-flow return on invested capital when assessing organisations.
Portfolios are constructed with reference to the following consideration:
– the Manager seeks to build a portfolio of quoted shares of approximately 160 to 200 issuers.
The portfolio will consist of those stocks identified from the Manager’s fundamental research.
The Fund’s activities expose it to a variety of financial risks: market risk (including price risk,
currency risk and interest rate risk), liquidity risk and credit risk. The Fund’s approach to the
management of these risks is set out as follows.
17. SEGMENT
INFORMATION
CONTINUED
18. FINANCIAL RISK
MANAGEMENT
NOT E S TO T H E CO N S O L I DAT E D FI NA N C I A L STAT E M E N T SCONTINUED

51
(b) Market Price Risk
Market price risk is the risk that value of the instrument will experience unanticipated
fluctuations as a result of changes in market prices (other than those arising from foreign
currency risk and interest rate risk), whether caused by factors specific to an individual
investment, its issuer, or all factors influencing all instruments traded in the market.
Market price risk exposure
The Fund invests predominantly in quoted equity securities, the fair value of which may
fluctuate because of changes in market prices. All investments in securities present a risk of loss
of capital, due to poor performance of the individual company, or a sharp deterioration in the
sector, country, or region’s economic environment. The Fund also invests in securities and
investments that are not traded in active markets and are susceptible to market price risk from
uncertainties about the future values of those securities, investments or investment funds.
Market price risk management
Market price risk can be moderated in a number of ways by the Manager through:
(i) a disciplined stock selection and investment process; and
(ii) limitation of exposure to a single investment through diversification and through, amongst
others, the implementation of investment restrictions.
The Board reviews the prices of the portfolio’s holdings and investment performance at their
meetings.
The Fund’s portfolio at the end of reporting period reflects the diversified strategy. The tables
on Country Exposure of the Portfolio, Sector Exposure of the Portfolio and composition of
the Portfolio (see pages 23 to 28) illustrate the allocation of the portfolio assets according to
these criteria as at 30th June 2011.
The Fund Manager has identified the MSCI EM (TR) Index as a relevant benchmark for the
markets in which it operates.
Given an historical volatility of 13.46% (2010: 17.25%) in the Fund’s Net Asset Value
(NAV) observed during the year, and assuming the same level of volatility in the coming year,
the NAV and profit stands to increase or decrease by the amounts set out below:
2011 2010
$ $___________ ___________
Financial assets at fair value through profit or loss 1,219,924,732 960,328,412 ___________ ___________
Net Asset Value impact 164,201,869 165,656,651 ___________ ___________
18. FINANCIAL RISK
MANAGEMENT
CONTINUED
NOT E S TO T H E CO N S O L I DAT E D FI NA N C I A L STAT E M E N T SCONTINUED

5252
(c) Foreign Currency RiskThe Fund invests in financial instruments and enters into transactions denominated incurrencies other than its functional currency. Consequently, the Fund is exposed to risks thatthe exchange rate of its functional currency relative to other foreign currencies may change ina manner that has an adverse affect on the value of that portion of the Fund’s assets orliabilities denominated in currencies other than the US dollar.
Foreign currency risk exposureThe following table sets out the Fund’s material exposures to foreign currency risk as at 30th June 2011:
Net non-monetary Net monetary
assets and assets and Total foreign Currency (liabilities) (liabilities) currency risk
$ $ $____________ ____________ ____________Brazilian Real 64,888,841 (1,652,713) 63,236,128 Canadian Dollar 29,762,938 – 29,762,938 Egyptian Pound 15,237,255 (4) 15,237,251 Euro 19,527,434 – 19,527,434 Hong Kong Dollar 151,086,491 374,579 151,461,070 Hungarian Forint 16,933,458 – 16,933,458 Indonesian Rupiah 62,590,743 804,340 63,395,083 Korean Won 114,928,097 – 114,928,097 Malaysian Ringgit 25,669,069 25,819 25,694,888 Mexican Peso 21,898,033 141,862 22,039,895 Nigerian Naira 12,376,305 18,841 12,395,146 South African Rand 127,680,460 46 127,680,506 Sterling 27,812,400 (24,675) 27,787,725 Taiwan Dollar 67,683,339 1,899,196 69,582,535 Thailand Baht 23,125,221 (119,099) 23,006,122 Turkish Lira 24,964,354 3 24,964,357 United States Dollar 393,907,502 14,671,694 408,579,196 Other currencies 19,852,792 1,137,811 20,990,603 ____________ ____________ ____________Total 1,219,924,732 17,277,700 1,237,202,432____________ ____________ ________________________ ____________ ____________
18. FINANCIAL RISK
MANAGEMENT
CONTINUED
NOT E S TO T H E CO N S O L I DAT E D FI NA N C I A L STAT E M E N T SCONTINUED

535353
Comparative figures as at 30th June 2010 are as follows:
Net non-monetary Net monetary
assets and assets and Total foreign Currency (liabilities) (liabilities) currency risk
$ $ $____________ ____________ ____________Brazilian Real 57,113,712 152,299 57,266,011 Chinese Renminbi – 607,315 607,315 Euro 20,762,335 118,694 20,881,029 Hong Kong Dollar 115,277,188 40,425 115,317,613 Indonesian Rupiah 55,022,419 341,294 55,363,713 Korean Won 54,546,335 – 54,546,335 South African Rand 103,532,872 – 103,532,872 Taiwan Dollar 41,179,056 – 41,179,056 Turkish Lira 31,813,628 (1) 31,813,627 United States Dollar 349,122,915 12,688,485 361,811,400 Other currencies 131,957,952 81,884 132,039,836 ____________ ____________ ____________Total 960,328,412 14,030,395 974,358,807 ____________ ____________ ________________________ ____________ ____________
Foreign currency risk managementThe Fund has opted not to engage into any active management of foreign currency risk, andtherefore all its open foreign exchange positions are unhedged at the end of the reporting period.
The degree of sensitivity of the Fund’s assets to foreign currency risk depends on the netexposure of the Fund to each specific currency and the volatility of that specific currency in theyear. At 30th June 2011, had the average exchange rate of the US dollar weakened by 100 basispoints in relation to the basket of currencies in which the Fund’s net assets are denominated,weighted by the Fund’s exposure to each currency with all other variables held constant, the Fundestimates net assets and the change in net assets per the Consolidated Statement ofComprehensive Income would have increased by $8,286,232 (2010: $6,125,474).
An increase in the US dollar by 100 basis points in relation to the basket of currencies in whichthe Fund’s net assets are denominated would have resulted in a decline in net assets by the sameamount but in the opposite direction, under the assumption that all other factors remain constant.
The Manager does not consider it realistic or useful to examine foreign currency risk inisolation. The Manager considers the standard deviation of the NAV (which is struck in USdollars) as the appropriate risk measurement for the portfolio as a whole it reflects market pricerisk generally. Please see Market Price Risk section in Note 18(b).
18. FINANCIAL RISK
MANAGEMENT
CONTINUED
NOT E S TO T H E CO N S O L I DAT E D FI NA N C I A L STAT E M E N T SCONTINUED

545454
(d) Liquidity RiskLiquidity risk exposureLiquidity risk is the risk that the Fund will encounter difficulty in meeting obligations as theyarise for settlement associated with financial liabilities. Liquidity risk also arises because theFund’s assets may be invested in equities in emerging markets which may be less liquid thandeveloping markets.
The Fund is closed-ended; therefore risk arising from redemption requests from investors doesnot exist. The liquidity risk profile of the Fund at 30th June 2011 was as follows:
2011 2010Amounts due Amounts due within 1 year within 1 year
$ $____________ ____________Amounts due to brokers 2,635,513 257,983 Capital gains tax payable 2,053,400 33,817 Payables and accrued expenses 2,033,777 1,548,539 Bank overdraft – 2____________ ____________Total liabilities 6,722,690 1,840,341____________ ________________________ ____________
There were no amounts due beyond one year.
Liquidity risk managementThe restrictions on concentration and the diversification requirements detailed above (seemarket price risk) also serve normally to protect the overall value of the Fund from the riskscreated by the lower level of liquidity in the markets in which the Fund operates.
(e) Interest Rate RiskInterest rate risk is the risk that the fair value or future cash flows of a financial instrument willfluctuate because of changes in market interest rates. It arises on interest-bearing financialinstruments recognised at the end of the reporting period.
Interest rate risk exposure The Fund has the ability to borrow funds in order to increase the amount of capital availablefor investment subject to the limits set out in the Private Offering Memorandum. It may alsohold interest bearing securities and cash. Interest rate movements may affect the level of incomereceivable on cash deposits and cash equivalents and interest payable on borrowing. However,the majority of the Fund’s net financial assets are non interest bearing (98.91% on average overthe 12 month period to 30th June 2011 (2010: 98.58%)). As a result, the Fund is not subjectto significant amounts of risk due to fluctuations in the prevailing levels of market interest ratesother than the impact such fluctuations may have on capital returns.
18. FINANCIAL RISK
MANAGEMENT
CONTINUED
NOT E S TO T H E CO N S O L I DAT E D FI NA N C I A L STAT E M E N T SCONTINUED

555555
The following table summarises the Fund’s exposure to interest rate risk as at 30th June 2011.It includes the Fund’s assets and liabilities at fair values, categorised by the earlier of contractualre-pricing or maturity dates.
Interest- Non interest- bearing bearing Total
$ $ $____________ ____________ ____________Financial assets at fair value through
profit or loss – 1,219,924,732 1,219,924,732 Amounts due from brokers – 5,340,370 5,340,370 Dividends receivable – 5,002,712 5,002,712 Other receivables and prepayments – 161,691 161,691 Cash and cash equivalents 13,495,617 – 13,495,617 ____________ ____________ ____________TOTAL ASSETS 13,495,617 1,230,429,505 1,243,925,122____________ ____________ ____________Amounts due to brokers – 2,635,513 2,635,513 Capital gains tax payable – 2,053,400 2,053,400 Payables and accrued expenses – 2,033,777 2,033,777 ____________ ____________ ____________TOTAL LIABILITIES – 6,722,690 6,722,690____________ ____________ ____________Equity shares – 1,237,202,432 1,237,202,432 ____________ ____________ ____________TOTAL LIABILITIESINCLUDING EQUITY SHARES – 1,243,925,122 1,243,925,122____________ ____________ ____________
Total interest sensitivity gap 13,495,617 (13,495,617) –____________ ____________ ________________________ ____________ ____________
Interest rate risk exposure as at 30th June 2010
Interest- Non interest- bearing bearing Total
$ $ $____________ ____________ ____________Financial assets at fair value through
profit or loss – 960,328,412 960,328,412 Amounts due from brokers – 131,002 131,002Dividends receivable – 1,895,408 1,895,408 Other receivables and prepayments – 155,295 155,295 Cash and cash equivalents 13,689,031 – 13,689,031 ____________ ____________ ____________TOTAL ASSETS 13,689,031 962,510,117 976,199,148____________ ____________ ____________Amounts due to brokers – 257,983 257,983 Bank overdraft 2 – 2 Capital gains tax payable – 33,817 33,817Payables and accrued expenses – 1,548,539 1,548,539 ____________ ____________ ____________TOTAL LIABILITIES 2 1,840,339 1,840,341 ____________ ____________ ____________Equity shares – 974,358,807 974,358,807 ____________ ____________ ____________TOTAL LIABILITIESINCLUDING EQUITY SHARES 2 976,199,146 976,199,148____________ ____________ ____________
Total interest sensitivity gap 13,689,029 (13,689,029) –____________ ____________ ________________________ ____________ ____________
18. FINANCIAL RISK
MANAGEMENT
CONTINUED
NOT E S TO T H E CO N S O L I DAT E D FI NA N C I A L STAT E M E N T SCONTINUED

56565656
(e) Interest Rate Risk (continued)Interest rate risk managementThe Fund has the capacity to leverage its investments up to 10% of net assets. The Fund aimsto keep its use of the overdraft facility for trading purposes to a minimum only using the facilityto enable settlements. The Directors do not consider the exposure to interest rate risk as beingmaterial to the Fund.
Sensitivity analysis for interest rate riskBased on the previous table showing the interest rate risk exposure as at 30th June 2011, shouldinterest rates have been lower on average by 100 basis points on a pro forma basis as interestearned is less than 100 basis points, with all other variables held constant, the decrease in netassets and profit for the year would amount to approximately $134,956 (2010: $136,890). Weestimate that if interest rates had risen by 100 basis points, the increase in net assets and profitwould amount to approximately the same amount but in the opposite direction.
(f) Credit Risk Credit risk exposureCredit risk is the risk that a counterparty to a financial instrument will fail to discharge anobligation or commitment it has entered into with the Fund. The Fund is exposed to counterpartycredit risk on cash and cash equivalents and amounts due from brokers. Risk relating to unsettledtransactions is considered small due to the credit quality of the custodians used by the Fund. TheFund has no receivables past their due dates as at 30th June 2011 (2010: nil).
Credit risk managementAll transactions in securities are settled upon delivery using approved brokers. The risk of defaultis considered minimal, as delivery of securities sold is only made once the Fund has receivedpayment. Payment is made on a purchase once the securities have been received by the Custodianor Sub-Custodian. The trade will fail if either party fails to meet its obligation.
The maximum exposure to credit risk before any credit enhancements at 30th June is thecarrying amount of the financial assets as set out below.
2011 2010$ $____________ ____________
Financial assets at fair valuethrough profit or loss 1,219,924,732 960,328,412
Amounts due from brokers 5,340,370 131,002 Dividends receivable 5,002,712 1,895,408 Other receivables and prepayments 161,691 155,295 Cash and cash equivalents 13,495,617 13,689,031 ____________ ____________Total assets 1,243,925,122 976,199,148 ____________ ________________________ ____________
18. FINANCIAL RISK
MANAGEMENT
CONTINUED
NOT E S TO T H E CO N S O L I DAT E D FI NA N C I A L STAT E M E N T SCONTINUED

5757575757
(g) Capital Risk ManagementThe capital of the Fund is represented by the equity attributable to holders of preferenceshares. The amount of equity attributable to holders of Participating Preference Shares issubject to change at most, twice monthly as the Fund is a closed-ended fund with the abilityto issue additional shares only if certain conditions are met as set out in the Fund’s schemeparticulars. The Fund’s objective when managing capital is to safeguard the Fund’s ability tocontinue as a going concern in order to provide returns for shareholders and benefits for otherstakeholders to maintain a strong capital base to support the development of the investmentactivities of the Fund.
PerParticipating
2011 PreferenceTotal Share
$ $______________ ____________Published Net Asset Value 1,241,698,534 9.20 Change from mid market pricing to bid pricing for investments (4,496,102) (0.03)______________ ____________Net Asset Value under IFRS 1,237,202,432 9.17 ______________ __________________________ ____________
PerParticipating
2010 PreferenceTotal Share
$ $______________ ____________Published Net Asset Value 979,819,807 7.26Change from mid market pricing to bid pricing for investments (5,461,000) (0.04)______________ ____________
Net Asset Value under IFRS 974,358,807 7.22______________ __________________________ ____________
In the opinion of the Directors on the basis of the shareholdings advised to them, the Fundhas no immediate or ultimate controlling party.
Effective 1st October 2011, Mr. Saffet Karpat was appointed as a Director.
18. FINANCIAL RISK
MANAGEMENT
CONTINUED
19. RECONCILIATION
OF PUBLISHED NET
ASSET VALUE
ATTRIBUTABLE TO
EQUITY
SHAREHOLDERS TO
THE IFRS
EQUIVALENT
20. ULTIMATE
CONTROLLING PARTY
21. EVENTS AFTER
THE BALANCE SHEET
DATE
NOT E S TO T H E CO N S O L I DAT E D FI NA N C I A L STAT E M E N T SCONTINUED

58
____________ ____________PERCENTAGE PERCENTAGE
INCREASE INCREASE FROM FROM
6th July 1989 30th June 1989________ ________ ________ ________ __________ __________ ____________ ____________Date Fund FX Rate Fund MSCI EM (TR) MSCI EM (TR) Fund MSCI EM (TR)
NAV ($) NAV (£) ($) (£) NAV (£) (£)________ ________ ________ ________ __________ __________ ____________ ____________31.12.89 0.58 1.61 0.36 231.65 143.61 11.85 28.0029.06.90 0.77 1.74 0.44 258.08 147.93 35.93 31.8531.12.90 0.61 1.93 0.31 207.21 107.25 (2.36) (4.41)
28.06.91 0.78 1.62 0.48 281.28 173.52 48.98 54.6631.12.91 0.93 1.87 0.50 331.35 177.67 54.92 58.35
30.06.92 1.07 1.90 0.56 355.82 186.90 74.15 66.5831.12.92 0.95 1.51 0.63 369.14 244.02 95.19 117.49
30.06.93 1.11 1.49 0.74 421.83 282.35 129.80 151.6531.12.93 1.58 1.48 1.07 645.38 436.81 231.72 289.32
30.06.94 1.47 1.55 0.95 578.58 373.77 194.69 233.1431.12.94 1.58 1.56 1.01 598.17 382.26 213.61 240.71
30.06.95 1.53 1.59 0.96 578.48 363.54 197.48 224.0231.12.95 1.46 1.55 0.94 567.01 364.99 190.54 225.31
30.06.96 1.70 1.55 1.10 627.49 403.71 239.66 259.8231.12.96 1.75 1.71 1.02 601.21 351.17 217.06 212.99
30.06.97 2.21 1.67 1.33 707.94 425.11 310.84 278.8931.12.97 1.82 1.64 1.11 531.56 323.41 243.65 188.25
30.06.98 1.52 1.67 0.91 431.27 258.25 182.34 130.1731.12.98 1.30 1.66 0.78 396.86 238.66 141.60 112.71
30.06.99 1.55 1.57 0.98 555.08 352.48 204.13 214.1631.12.99 1.86 1.62 1.15 660.41 408.84 257.15 264.40
30.06.00 1.76 1.51 1.17 607.65 401.62 261.43 257.9631.12.00 1.47 1.50 0.98 458.26 306.40 205.32 173.09
30.06.01 1.55 1.41 1.10 450.73 320.05 241.19 185.2631.12.01 1.57 1.45 1.08 447.39 308.44 234.47 174.91
30.06.02 1.61 1.52 1.06 456.63 299.88 228.38 167.2831.12.02 1.55 1.61 0.96 420.54 261.32 197.61 132.91
30.06.03 1.84 1.65 1.11 488.40 295.55 244.99 163.4231.12.03 2.53 1.79 1.42 657.22 368.02 339.01 228.01
30.06.04 2.61 1.81 1.44 652.07 359.94 346.96 220.8131.12.04 3.38 1.92 1.76 827.78 431.56 445.78 284.64
30.06.05 3.67 1.79 2.05 879.58 490.86 535.43 337.5031.12.05 4.59 1.72 2.67 1,113.71 648.45 727.93 477.95
30.06.06 4.80 1.85 2.60 1,195.39 646.51 704.76 476.2231.12.06 5.92 1.96 3.02 1,476.63 754.15 836.49 572.16
30.06.07 7.05 2.01 3.52 1,738.72 866.89 989.80 672.6531.12.07 7.96 1.99 4.00 2,064.00 1,036.87 1,139.16 824.15
31.03.08 7.45 1.99 3.75 1,838.52 925.04 1,061.86 724.4830.06.08 7.40 1.99 3.72 1,823.79 916.43 1,053.17 716.8030.09.08 5.77 1.78 3.24 1,333.96 748.41 903.19 567.0531.12.08 3.97 1.44 2.76 966.34 672.10 755.31 499.03
31.03.09 3.82 1.43 2.66 976.24 681.06 725.07 507.0230.06.09 5.47 1.65 3.32 1,316.39 799.36 928.94 612.4630.09.09 6.73 1.60 4.21 1,593.31 996.19 1,204.43 787.8931.12.09 7.40 1.62 4.57 1,729.96 1,070.52 1,318.22 854.14
31.03.10 7.81 1.51 5.15 1,772.37 1,167.88 1,495.23 940.9130.06.10 7.26 1.49 4.85 1,625.46 1,085.95 1,403.59 867.9030.09.10 8.50 1.57 5.42 1,920.65 1,223.03 1,578.81 990.0731.12.10 9.12 1.56 5.84 2,062.04 1,320.72 1,710.43 1,077.14
31.03.11 8.97 1.60 5.71 2,105.28 1,311.62 1,669.95 1,069.0330.06.11 9.20 1.61 5.73 2,083.30 1,297.12 1,675.77 1,056.11________ ________ ________ __________ __________ __________ __________ __________
The $ and £ NAV figures have been adjusted to reflect the One for One Capitalisation issue made in September 1993.The $ and £ NAV figures have been adjusted to reflect the Ten for One share split in November 2009.The figures are based on Mid-Market prices.
PE R F O R M A N C E RE C O R D

59
AD M I N I S T R AT I O N
REGISTERED OFFICE
Arnold House, St. Julian’s Avenue, St. Peter Port, Guernsey GY1 3NF, Channel Islands
INFORMATION WEBSITE
www.giml.co.uk
MANAGER
Genesis Asset Managers, LLPHeritage Hall, P.O. Box 225, Le Marchant Street, St. Peter Port, Guernsey GY1 4HY, Channel Islands
CUSTODIAN AND REGISTRAR
HSBC Custody Services (Guernsey) LimitedArnold House, St. Julian’s Avenue, St. Peter Port, Guernsey GY1 3NF, Channel Islands
INVESTMENT ADVISER
Genesis Investment Management, LLP21 Knightsbridge, London SWIX 7LY, United Kingdom
(Authorised and regulated by the United Kingdom’s Financial Services Authority)
SUB-CUSTODIAN
JP Morgan Chase Bank125 London Wall, London EC2Y 5AJ, United Kingdom
ADMINISTRATOR AND SECRETARY
HSBC Securities Services (Guernsey) LimitedArnold House, St. Julian’s Avenue, St. Peter Port, Guernsey GY1 3NF, Channel Islands
SUB-REGISTRAR AND TRANSFER AGENT
Computershare Investor Services (Channel Islands) LimitedQueensway House, Hilgrove Street, St. Helier, Jersey JE1 1ES, Channel Islands
STOCKBROKERS
JP Morgan Cazenove20 Moorgate, London EC2R 6DA, United Kingdom
Smith & Williamson Securities25 Moorgate, London EC2R 6AY, United Kingdom
INDEPENDENT AUDITORS
PricewaterhouseCoopers, CI LLPRoyal Bank Place, 1 Glategny Esplanade, St. Peter Port, Guernsey GY1 4AO, Channel Islands
LEGAL ADVISERS
Mourant OzannesI Le Marchant Street, St. Peter Port, Guernsey GY1 4HP, Channel Islands
© Copyright: Genesis Emerging Markets Fund Limited 2011

60
NOT I C E O F ME E T I N G
Notice is hereby given of the Twenty Second Annual General Meeting of theShareholders of the Fund which is to be held at
Arnold House, St. Julian’s Avenue, St. Peter Port, Guernseyon 28th October 2011 at 10a.m. for the following purposes:
AGENDAORDINARY RESOLUTIONS
1To adopt the Annual Financial Report of the Fund for
the year ended 30th June 2011.
2To re-appoint PricewaterhouseCoopers CI LLP
as Independent Auditors to the Fund.
3To authorise the Directors to agree the remuneration of the Independent Auditors.
4To elect Dr. Geng Xiao as a Director of the Fund.
5To elect Mr. Saffet Karpat as a Director of the Fund.
6To re-elect Mr. Coen Teulings as a Director of the Fund,
who retiring by rotation, offers himself for re-election.
7To re-elect Mr. Michael Hamson as a Director of the Fund,
who retiring by rotation, offers himself for re-election.
None of the Directors has a service contract.
8
To consider and, if thought fit, pass the following resolution:THAT
In substitution for the Fund’s existing authority to make market purchases of Participating PreferenceShares, the Fund is hereby authorised to make market purchases of Participating Preference Sharesprovided that:
(i) the maximum number of Participating Preference Shares hereby authorised to be purchased shall be20,200,000;
(ii) the maximum price which may be paid for a Share is an amount equal to 105% of the average of themiddle market quotations for a Share taken from the London Stock Exchange Daily Official List for thefive business days immediately preceding the day on which the Participating Preference Share is purchased
(iii) the authority hereby conferred shall expire at the conclusion of the Annual General Meeting of the Fundto be held in 2012 unless such authority is renewed prior to such time, and
(iv) the Fund may make a contract to purchase Participating Preference Shares under the authority herebyconferred prior to the expiry of such authority which will or may be executed wholly or partly after theexpiration of such authority and may make a purchase of Participating Preference Shares pursuant to anysuch contract.
Printed by Barnard & Westwood Ltd 23 Parkenham Street, London WC1X 0LB By Appointment to Her Majesty The Queen Printers and Bookbinders

GENESIS EMERGING MARKETS FUND LIMITED
Arnold HouseSt. Julian’s Avenue, St. Peter Port
Guernsey GY1 3NF, Channel Islands
Related Documents