1 st SEMI-ANNUAL 2017 GROUNDWATER MONITORING REPORT GREEN VALLEY GARAGE Prepared for: Mr. Ron Anderson Green Valley Garage 11602 Finger Board Road Monrovia, MD 21770 Prepared by: ARM Group Inc. 9175 Guilford Road Suite 310 Columbia, Maryland 21046 ARM Project No. 170167M April 2017

Welcome message from author
This document is posted to help you gain knowledge. Please leave a comment to let me know what you think about it! Share it to your friends and learn new things together.
Transcript

1st SEMI-ANNUAL 2017GROUNDWATER MONITORING REPORT
GREEN VALLEY GARAGE
Prepared for:
Mr. Ron AndersonGreen Valley Garage
11602 Finger Board RoadMonrovia, MD 21770
Prepared by:
ARM Group Inc.9175 Guilford Road
Suite 310Columbia, Maryland 21046
ARM Project No. 170167M
April 2017

1st SEMI-ANNUAL 2017 GROUNDWATER MONITORING REPORT
GREEN VALLEY GARAGE
Prepared for:
Mr. Ron Anderson Green Valley Garage
11602 Finger Board Rd Monrovia, MD 21770
Prepared by:
ARM Group Inc. 9175 Guilford Road, Suite 310
Columbia, Maryland 21046
ARM Project No. 170167M
April 2017
Respectfully submitted:
Stewart Kabis, G.I.T. Staff Geologist
Eric Magdar Project Manager
Green Valley Garage, Monrovia, MD i 1st Semi-Annual 2017 GWMR
ARM Project 170167M
TABLEOFCONTENTS
SECTION PAGE
1 INTRODUCTION................................................................................................................... 1
1.1 Purpose ....................................................................................................................... 1
2 SUMMARY OF SAMPLING EVENT ................................................................................. 2
2.1 Groundwater Monitoring Network ............................................................................ 2
2.2 Sample Collection Procedures ................................................................................... 2
2.3 Laboratory Analysis ................................................................................................... 3
3 SUMMARY OF RESULTS ................................................................................................... 4
3.1 Summary of Detected Parameters .............................................................................. 4
3.1.1 Monitoring Wells ..................................................................................... 4
3.1.2 Water Supply Samples .............................................................................. 4
3.2 Comparison to Groundwater Standards ..................................................................... 4
4 SUMMARY AND CONCLUSIONS ..................................................................................... 5
FIGURES
Figure 1 Groundwater Contour Map ........................................................ Following Text Figure 2 MTBE Concentration Contour Map .......................................... Following Text Figure 3 MTBE Time-Series Graph ......................................................... Following Text
TABLES
Table 1 Groundwater Elevations, March 2017 ....................................... Following Text Table 2 Detected Parameters and Criteria Comparison .......................... Following Text Table 3 Historical Data ........................................................................... Following Text
APPENDICES
Appendix A Field Sampling Records ............................................................. Following Text Appendix B Laboratory Certificate of Analysis ............................................. Following Text
Green Valley Garage, Monrovia, MD 1 1st Semi-Annual 2017 GWMR
ARM Project 170167M
1 INTRODUCTION
1.1 Purpose
This report summarizes the findings of the 1st semi-annual 2017 groundwater monitoring event at the Green Valley Garage (the Site), located in Monrovia, Maryland. This 1st semi-annual 2017 Groundwater Monitoring Report for the Green Valley Garage has been prepared by ARM Group Inc. (ARM). The primary objective of this report is to evaluate and provide an interpretive discussion of the analytical groundwater results, including comparison to relevant regulatory criteria and addressing any changes in groundwater quality over time. The following activities were performed for the 1st semi-annual 2017 groundwater monitoring event at the Site, and are documented in this report:
the measurement of groundwater levels in each of the monitoring wells;
the measurement of non-aqueous phase liquid (NAPL) thickness (if present) in each of the monitoring wells;
the construction of a groundwater contour map based on potentiometric elevations;
the sampling of monitoring wells;
the collection of an influent and an effluent sample associated with the current domestic supply well’s point of entry treatment (POET) system;
the laboratory analysis of collected samples for volatile organic compounds (VOCs); and
the evaluation of analytical data, including comparisons to previous sampling events.

Green Valley Garage, Monrovia, MD 2 1st Semi-Annual 2017 GWMR
ARM Project 170167M
2 SUMMARY OF SAMPLING EVENT
2.1 Groundwater Monitoring Network
The existing groundwater monitoring network consists of seven groundwater monitoring wells and one former domestic supply well. The wells have been denoted as MW-1 through MW-7, and Former Domestic Supply Well (Former DSW). In addition, influent and effluent water supply samples were collected from the POET system for the Current Domestic Supply Well (Current DSW).1 Groundwater monitoring well locations, as well as groundwater contours constructed using groundwater level measurements taken during the 1st semi-annual 2017 sampling event, are shown on Figure 1. The direction of groundwater flow beneath the Site is generally to the north and northwest across the site. Table 1 presents a summary of the March 2017 groundwater elevations.
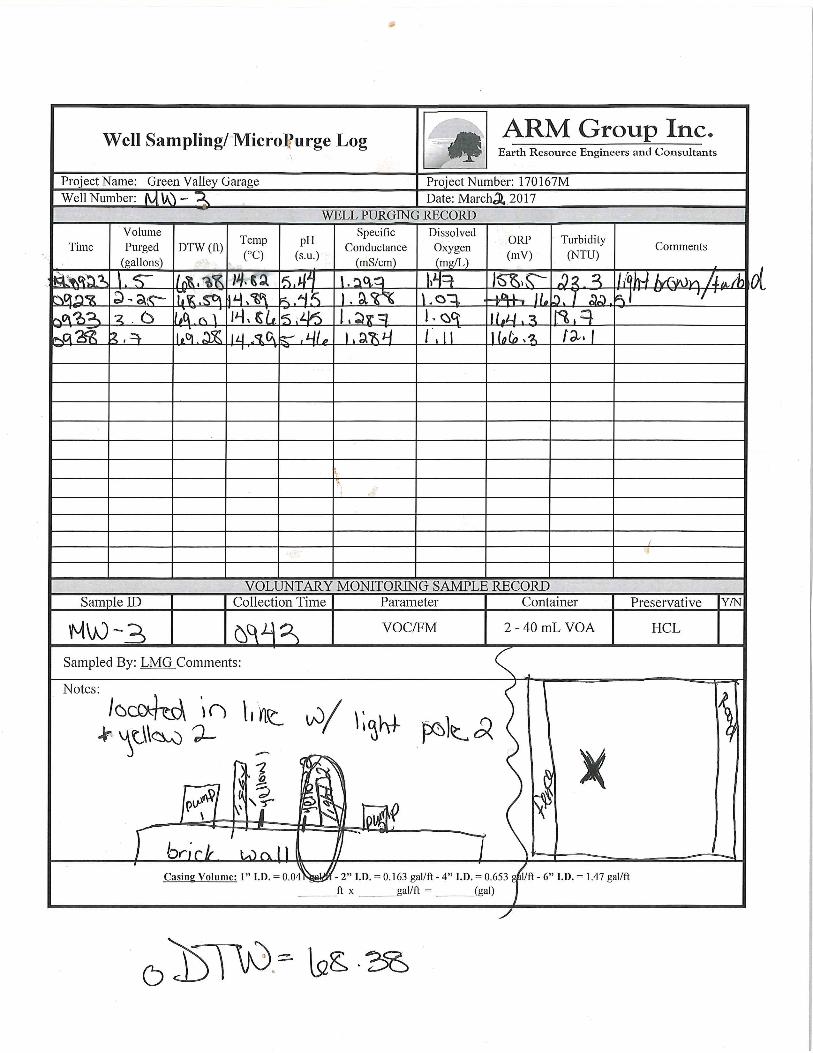
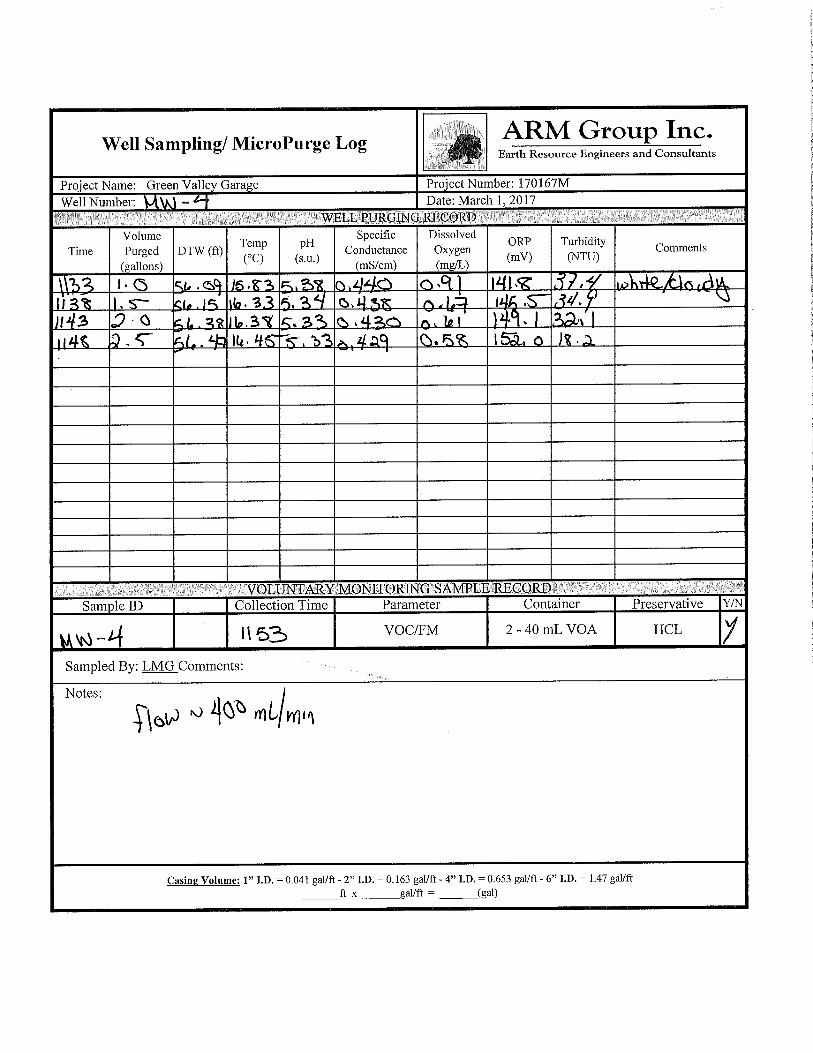
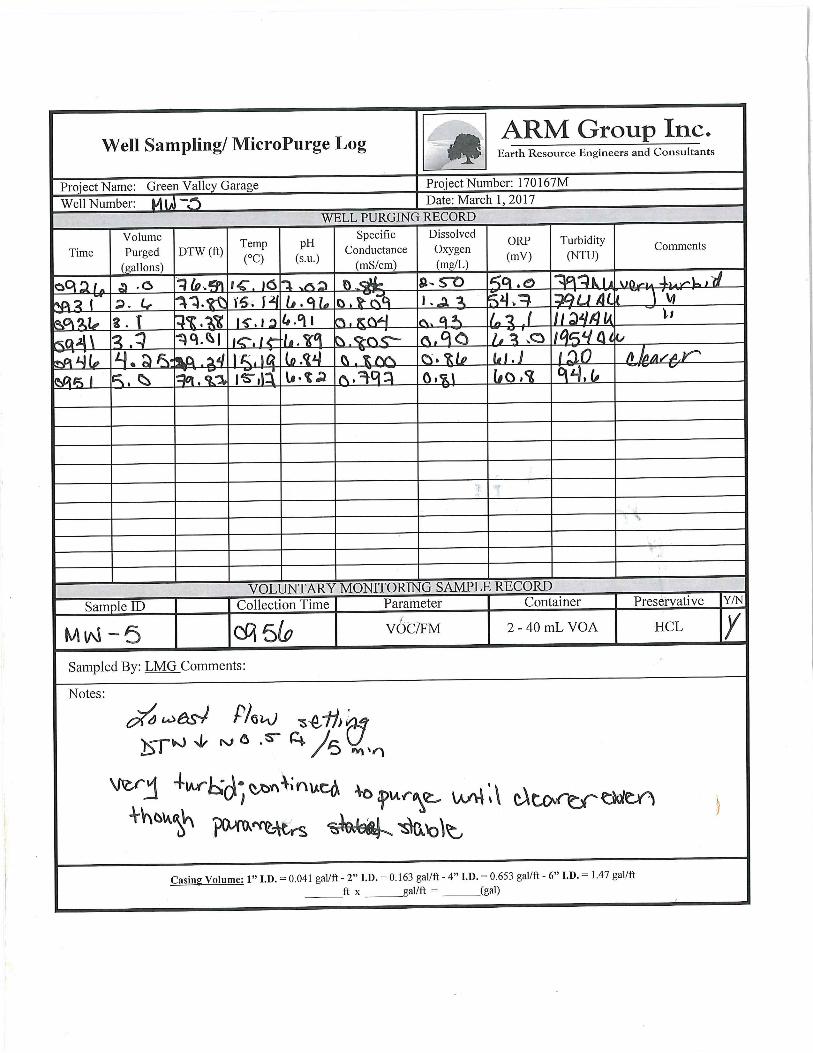
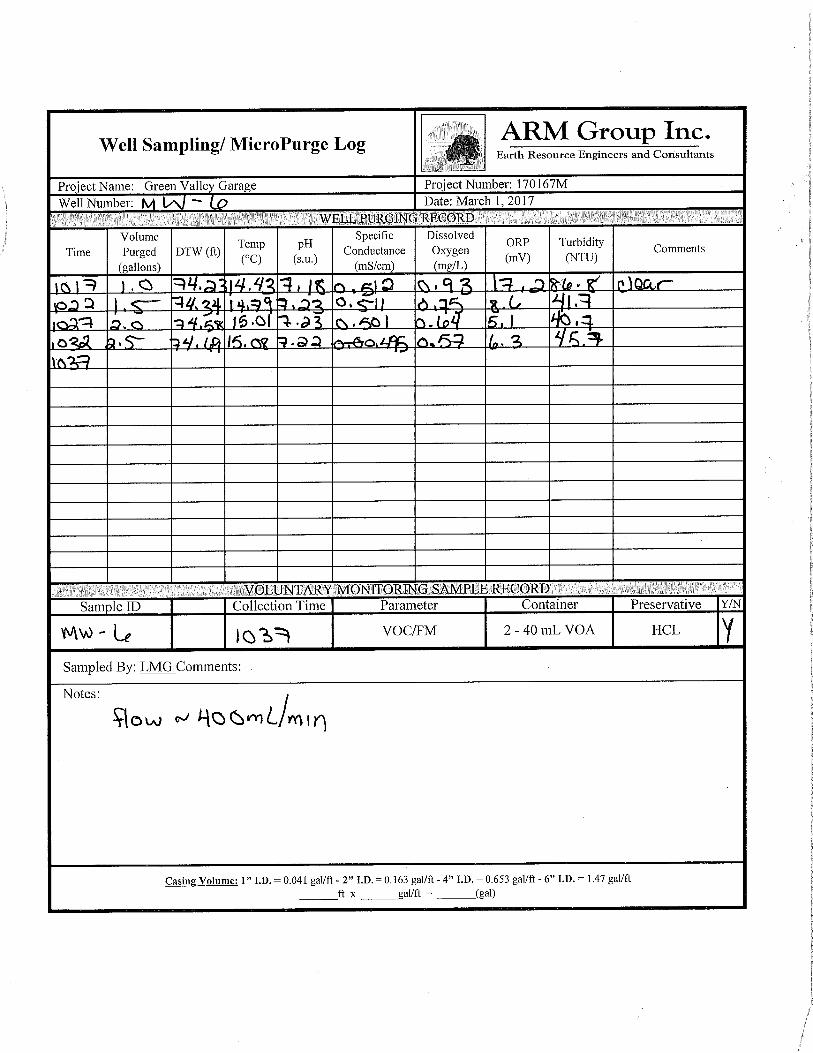
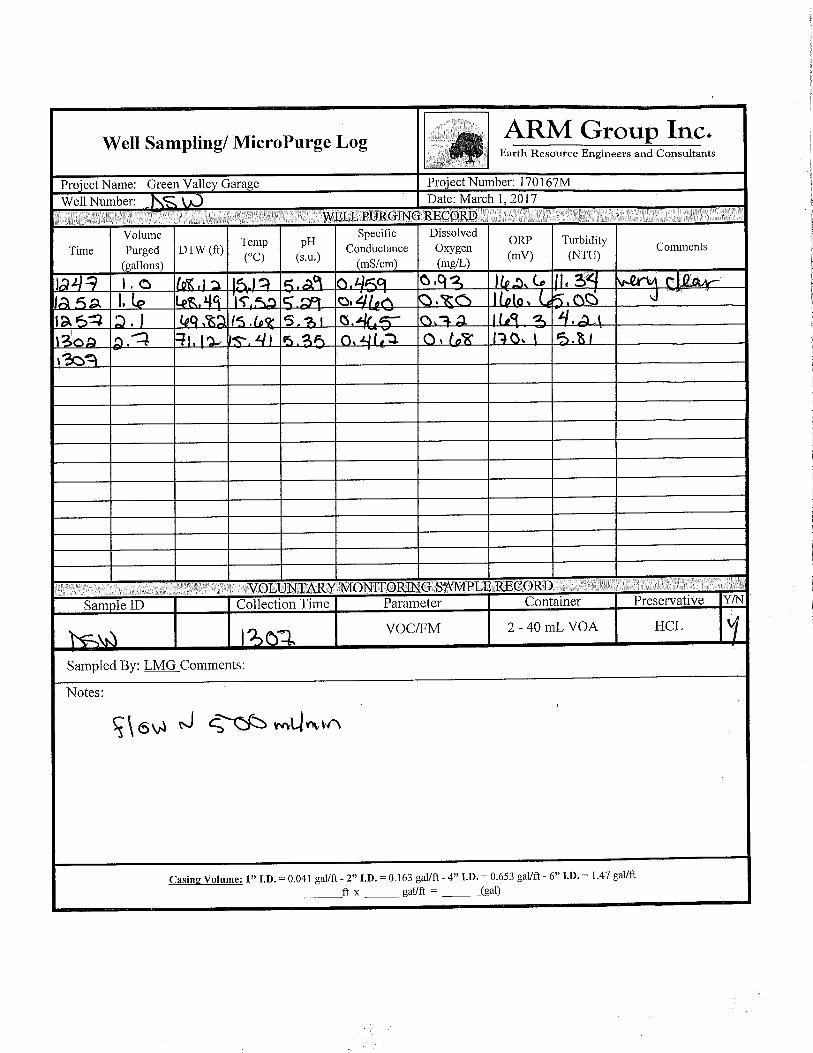
2.2 Sample Collection Procedures
On March 1st and 2nd, 2017, groundwater samples were collected from MW-1 through MW-7 and Former DSW. The wells were purged and sampled in accordance with low-flow purging/sampling protocols, and applicable federal and state regulatory guidance. In order to facilitate low-flow purging, a flow-through cell was attached to the groundwater discharge tubing, and several water quality parameters were monitored to indicate stabilization. Groundwater was evacuated from the well at a purge rate less than 500 milliliters per minute (ml/min). Readings were taken on indicator parameters every five (5) minutes with a multi-parameter water quality meter. The monitored parameters included temperature, pH, specific conductance, oxidation-reduction potential, dissolved oxygen, and turbidity. Groundwater purging continued until stabilization of the parameters had occurred for three (3) consecutive readings over a 15-minute period. The depth to water was also measured at five-minute intervals in order to monitor and prevent drawdown of the water column in the well during purging. The field sampling records for each well are included in Appendix A. Two water supply samples, associated with the POET system for the Current DSW, were collected on March 1st, 2017 by a MDE-certified Drinking Water Sampler. Prior to sampling, all required sample containers were labeled and readied for sample collection. Once the water quality parameters had stabilized, the groundwater samples were collected into laboratory provided sample containers while maintaining the appropriate low-flow discharge rates. Immediately prior to the first vial being filled at each location, the time of sampling was noted and all sample containers for the sample location were assigned the same sampling time. The sample containers were filled directly from the discharge tubing without allowing the tubing to touch the rim or inside of the containers. The groundwater was allowed to flow gently down
1 Not used for drinking water.
Green Valley Garage, Monrovia, MD 3 1st Semi-Annual 2017 GWMR
ARM Project 170167M
the inside of the sample containers so that no air bubbles were generated. Immediately following sample collection, the samples were stored in coolers with ice before being transferred to the laboratory under a completed chain-of-custody. Purged groundwater was treated with activated carbon before being discharged to the ground.
2.3 Laboratory Analysis
After sample collection, all samples were delivered to ALS Environmental Laboratories (ALS) of Middletown, Pennsylvania, for analysis. Samples were analyzed in accordance with EPA Method 8260 by ALS for volatile organic compounds (VOCs), including fuel oxygenates and naphthalene. The laboratory Certificates of Analysis for the 1st semi-annual 2017 sampling event are included as Appendix B.
Field QA/QC utilized during the 1st semi-annual 2017 sampling event included collection and analysis of a trip blank. A trip blank consists of reagent water that is transported to the sampling site and returned to the laboratory of origin without being opened. This serves as a check on sample contamination originating from sample transport, shipping, and laboratory sources. The holding time for the trip blank begins when received by the laboratory, unless otherwise specified by the client. There were no parameters detected in the trip blank for the 1st semi-annual 2017 sampling event.

Green Valley Garage, Monrovia, MD 4 1st Semi-Annual 2017 GWMR
ARM Project 170167M
3 SUMMARY OF RESULTS
3.1 Summary of Detected Parameters
3.1.1 Monitoring Wells
Table 2 shows all parameters detected in the wells at the Site during the 1st semi-annual 2017 sampling event. Methyl tertiary butyl ether (MTBE), tert-Amyl methyl ether (TAME), and tert-Butyl Alcohol (TBA) were detected in all wells at the Site. During this sampling event, the following parameters were detected for the first time over the historical record at relatively low-level concentrations:
diisopropyl ether in Former DSW and MW-2;
bromomethane in MW-5; and
trans-1,2-dichloroethene in MW-2, MW-3, and MW-7. Benzene was also detected in wells MW-2, MW-3, and MW-4 at relatively low-level concentrations, although it has been previously detected in these wells over the historical record.
3.1.2 Water Supply Samples
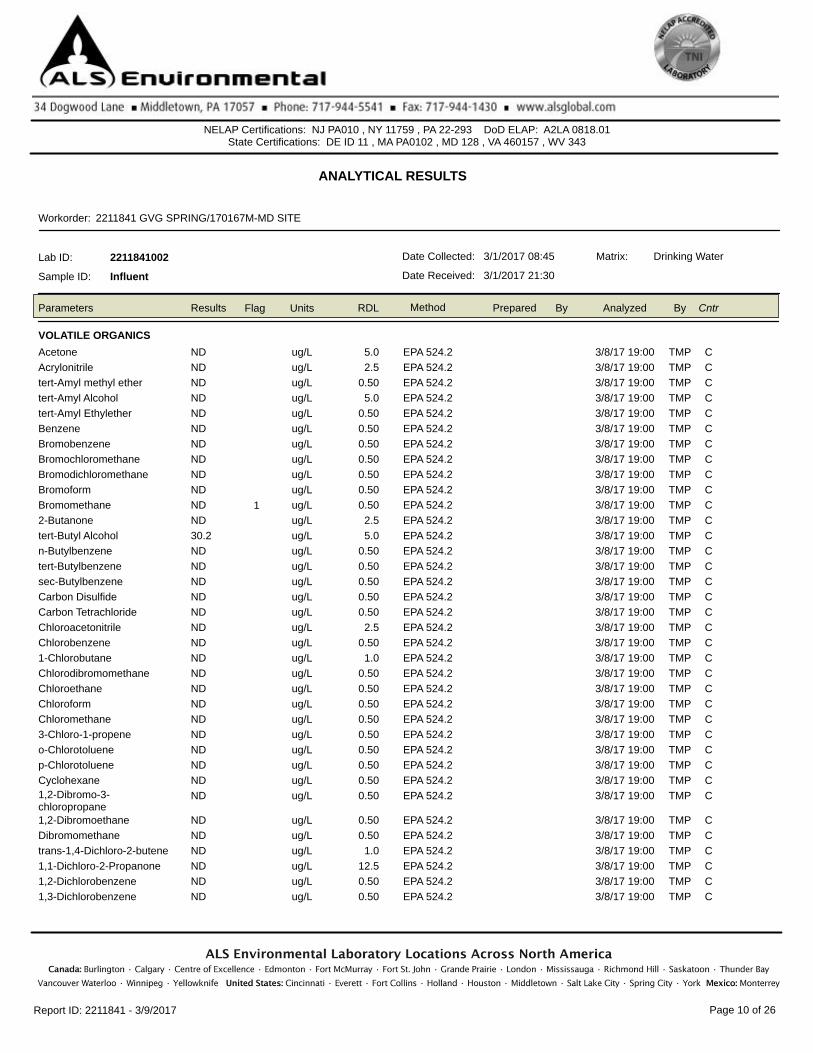
TBA was detected in the influent sample at a concentration of 24.1 µg/L, while MTBE was detected in the effluent sample at a concentration of 5.0 µg/L. These were the only detections in the water supply samples during this sampling event.
3.2 Comparison to Groundwater Standards
Upon receipt of the analytical data, parameters detected in each monitoring well were evaluated and compared to the Maryland Department of the Environment 2008 Generic Numeric Cleanup Standards for Groundwater. Parameters detected in water supply samples (influent and effluent samples) were evaluated and comparted to the established USEPA National Primary (MCLs) and Secondary (SMCLs) Drinking Water Standards. MCLs have been established based upon health concerns, whereas SMCLS are based upon aesthetic concerns, such as, taste, color, and odor.
Table 2 shows all detected parameters and whether or not they were in exceedance of their respective criteria. MTBE was the only parameter to exhibit criteria exceedances for the 1st semi-annual 2017 sampling event. The detected concentrations of MTBE in all wells exceeded the MTBE action level in Maryland of 20 µg/L, which is consistent with historical data. An MTBE concentration contour map has been included as Figure 2. The concentration of MTBE detected in the effluent sample did not exceed the Maryland action level. It is important to note that there is no established MCL, Region III Regional Screening Level, or MDE Generic Numeric Cleanup Standard for TAME or TBA.
Green Valley Garage, Monrovia, MD 5 1st Semi-Annual 2017 GWMR
ARM Project 170167M
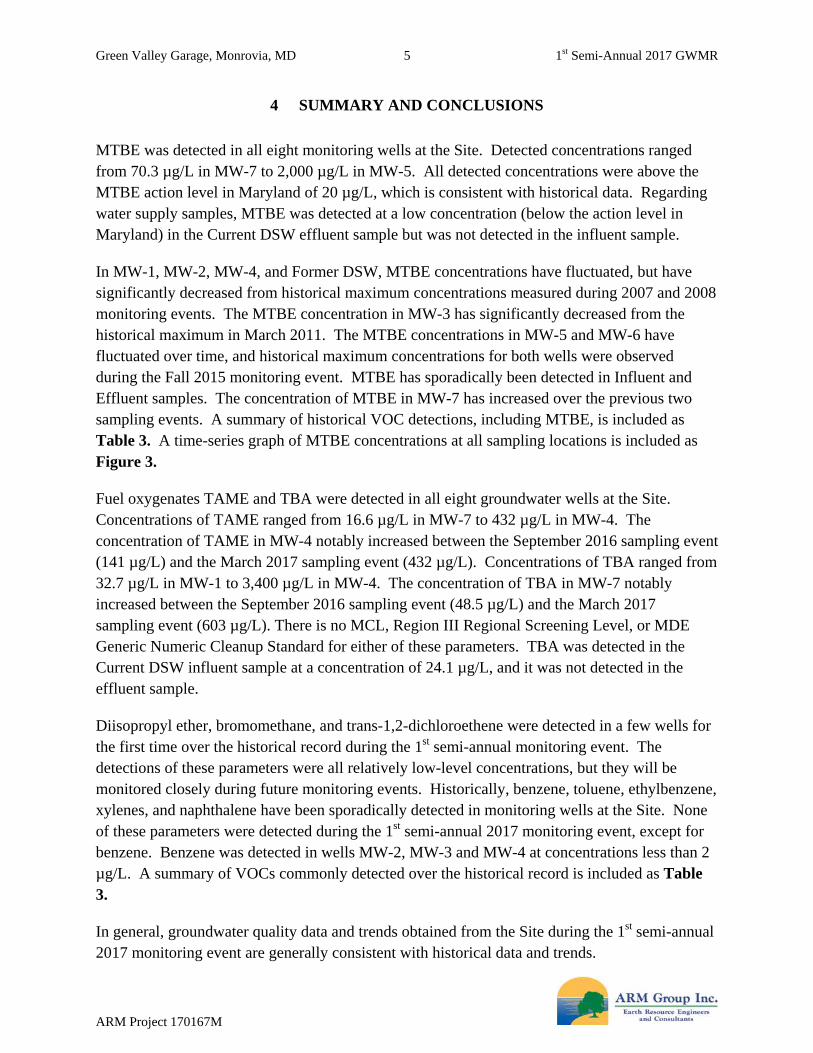
4 SUMMARY AND CONCLUSIONS
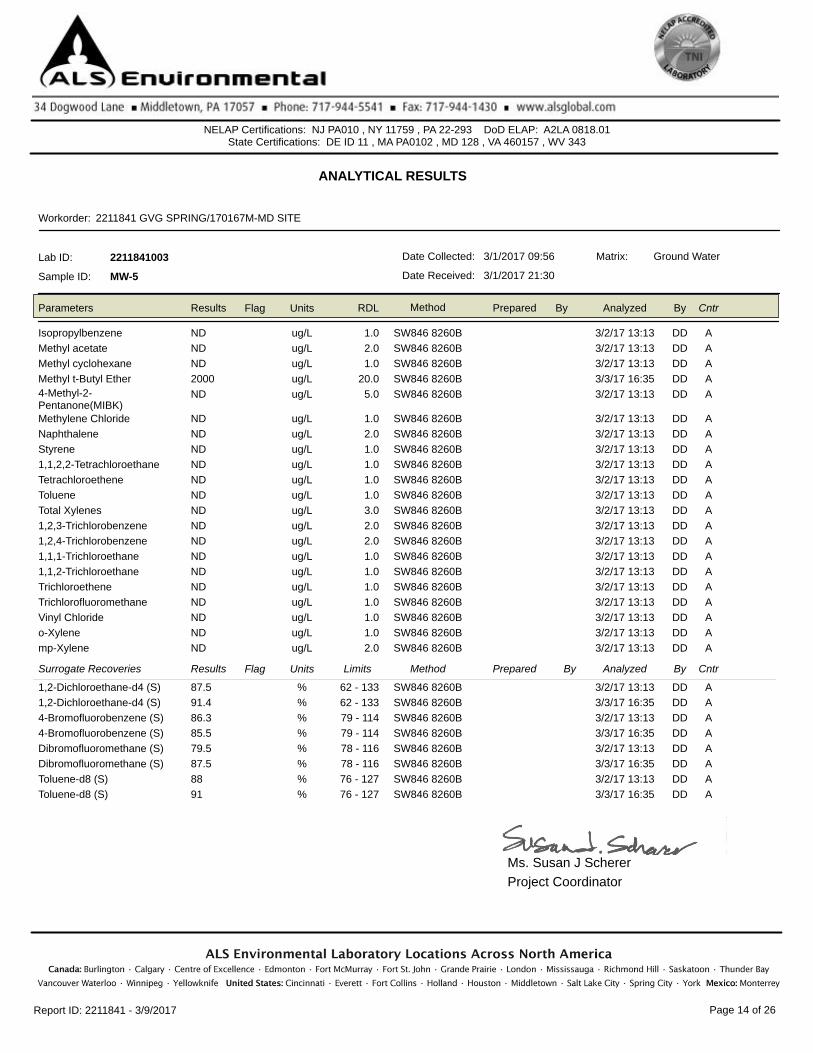
MTBE was detected in all eight monitoring wells at the Site. Detected concentrations ranged from 70.3 µg/L in MW-7 to 2,000 µg/L in MW-5. All detected concentrations were above the MTBE action level in Maryland of 20 µg/L, which is consistent with historical data. Regarding water supply samples, MTBE was detected at a low concentration (below the action level in Maryland) in the Current DSW effluent sample but was not detected in the influent sample.
In MW-1, MW-2, MW-4, and Former DSW, MTBE concentrations have fluctuated, but have significantly decreased from historical maximum concentrations measured during 2007 and 2008 monitoring events. The MTBE concentration in MW-3 has significantly decreased from the historical maximum in March 2011. The MTBE concentrations in MW-5 and MW-6 have fluctuated over time, and historical maximum concentrations for both wells were observed during the Fall 2015 monitoring event. MTBE has sporadically been detected in Influent and Effluent samples. The concentration of MTBE in MW-7 has increased over the previous two sampling events. A summary of historical VOC detections, including MTBE, is included as Table 3. A time-series graph of MTBE concentrations at all sampling locations is included as Figure 3.
Fuel oxygenates TAME and TBA were detected in all eight groundwater wells at the Site. Concentrations of TAME ranged from 16.6 µg/L in MW-7 to 432 µg/L in MW-4. The concentration of TAME in MW-4 notably increased between the September 2016 sampling event (141 µg/L) and the March 2017 sampling event (432 µg/L). Concentrations of TBA ranged from 32.7 µg/L in MW-1 to 3,400 µg/L in MW-4. The concentration of TBA in MW-7 notably increased between the September 2016 sampling event (48.5 µg/L) and the March 2017 sampling event (603 µg/L). There is no MCL, Region III Regional Screening Level, or MDE Generic Numeric Cleanup Standard for either of these parameters. TBA was detected in the Current DSW influent sample at a concentration of 24.1 µg/L, and it was not detected in the effluent sample.
Diisopropyl ether, bromomethane, and trans-1,2-dichloroethene were detected in a few wells for the first time over the historical record during the 1st semi-annual monitoring event. The detections of these parameters were all relatively low-level concentrations, but they will be monitored closely during future monitoring events. Historically, benzene, toluene, ethylbenzene, xylenes, and naphthalene have been sporadically detected in monitoring wells at the Site. None of these parameters were detected during the 1st semi-annual 2017 monitoring event, except for benzene. Benzene was detected in wells MW-2, MW-3 and MW-4 at concentrations less than 2 µg/L. A summary of VOCs commonly detected over the historical record is included as Table 3.
In general, groundwater quality data and trends obtained from the Site during the 1st semi-annual 2017 monitoring event are generally consistent with historical data and trends.

FIGURES
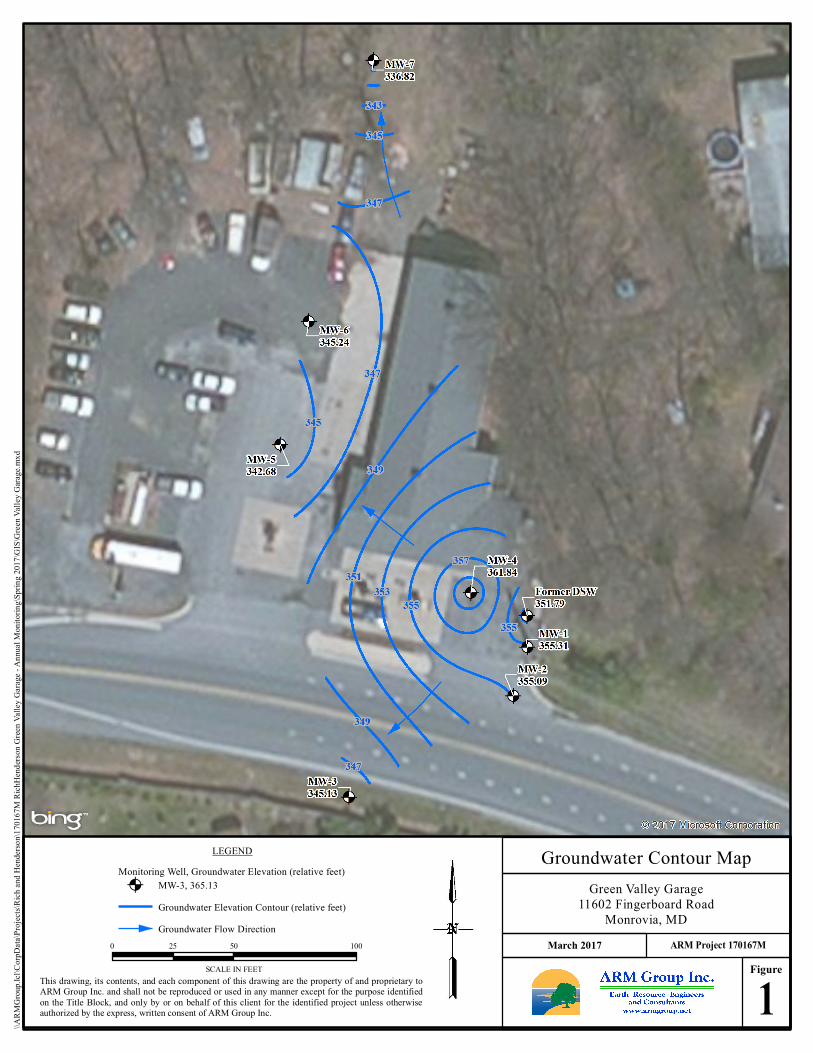
Figure1
Groundwater Contour MapGreen Valley Garage
11602 Fingerboard RoadMonrovia, MD
0 50 10025
SCALE IN FEET
\\ARM
Grou
p.lcl\
CorpD
ata\Pr
ojects
\Rich
and H
ende
rson\1
7016
7M R
ichHe
nders
on G
reen V
alley
Gara
ge - A
nnua
l Mon
itorin
g\Spri
ng 20
17\G
IS\Gr
een Va
lley G
arage
.mxd
This drawing, its contents, and each component of this drawing are the property of and proprietary toARM Group Inc. and shall not be reproduced or used in any manner except for the purpose identifiedon the Title Block, and only by or on behalf of this client for the identified project unless otherwiseauthorized by the express, written consent of ARM Group Inc.
March 2017
LEGENDMonitoring Well, Groundwater Elevation (relative feet)@A MW-3, 365.13
Groundwater Elevation Contour (relative feet)Groundwater Flow Direction
ARM Project 170167M

Figure2
MTBE Concentration Contour MapGreen Valley Garage
11602 Fingerboard RoadMonrovia, MD
0 50 10025
SCALE IN FEET
C:\U
sers\s
kabis
\Desk
top\G
IS\Gr
een Va
lley G
arage
.mxd
This drawing, its contents, and each component of this drawing are the property of and proprietary toARM Group Inc. and shall not be reproduced or used in any manner except for the purpose identifiedon the Title Block, and only by or on behalf of this client for the identified project unless otherwiseauthorized by the express, written consent of ARM Group Inc.
April 2017
LEGENDMonitoring Well, MTBE Concentration (µg/L)@A MW-3, 155
MTBE Concentration Contour (µg/L)ARM Project 170167M

Figure 3 - MTBE Time-Series Graph
0
5,000
10,000
15,000
20,000
25,000
30,000
35,000
40,000
45,000
50,000
Con
cen
trat
ion
(µ
g/L
)
Sampling Dates
MW-1
MW-2
MW-3
MW-4
MW-5
MW-6
MW-7
Former DSW
Influent
Effluent
Green Valley Garage1st Semi-Annual 2017 GWMRARM Project 170167M

TABLES

MW-1 61.80 70.5 6.89 355.31
MW-2 59.52 70 9.39 355.09
MW-3 68.38 70.5 10.49 345.13
MW-4 56.09 84 6.07 361.84
MW-5 76.59 >100 4.73 342.68
MW-6 74.17 100 4.59 345.24
MW-7 79.56 86.5 7.62 336.82
Former Domestic Supply Well
67.59 NA 4.62 351.79
*Elevation measurements made relative to an arbitrary survey control point.
Project Name: Green Valley Garage Project Number: 170167M
Groundwater Potentiometric Level Measurement Log
Table 1 - Groundwater Elevations - March 2017
Well NumberDepth to Water (ft)
Total Depth (ft)
Top of Casing from Survey Control Point* (feet)
Potentiometric Elevation* (relative feet)
Measurement Date: 3/1/2017
Green Valley Garage1st Semi-Annual 2017 GWMRARM Project 170167M 1 of 1

Green Valley Garage1st Semi-Annual 2017 GWMRARM Project 170167M 1 of 1
Location ID Parameter Result unitComparison
CriteriaDiisopropyl ether 2 µg/L
Methyl Tertiary Butyl Ether 213 µg/L 20tert-Amyl methyl ether 51.1 µg/L
tert-Butyl Alcohol 167 µg/LMethyl Tertiary Butyl Ether 304 µg/L 20
tert-Amyl methyl ether 107 µg/Ltert-Butyl Alcohol 32.7 µg/L
Benzene 1.6 µg/L 5Diisopropyl ether 5.8 µg/L
Methyl Tertiary Butyl Ether 573 µg/L 20tert-Amyl methyl ether 82.3 µg/L
tert-Butyl Alcohol 222 µg/LTrans-1,2-dichloroethene 2.2 µg/L 100
Benzene 1.7 µg/L 5Methyl Tertiary Butyl Ether 155 µg/L 20
tert-Amyl methyl ether 120 µg/Ltert-Butyl Alcohol 684 µg/L
Trans-1,2-dichloroethene 2.4 µg/L 100Benzene 1.3 µg/L 5
Methyl Tertiary Butyl Ether 1990 µg/L 20tert-Amyl methyl ether 432 µg/L
tert-Butyl Alcohol 3400 µg/LBromomethane 1.2 µg/L
Methyl Tertiary Butyl Ether 2000 µg/L 20tert-Amyl methyl ether 402 µg/L
tert-Butyl Alcohol 2980 µg/LMethyl Tertiary Butyl Ether 740 µg/L 20
tert-Amyl methyl ether 161 µg/Ltert-Butyl Alcohol 1060 µg/L
Methyl Tertiary Butyl Ether 70.3 µg/L 20tert-Amyl methyl ether 16.6 µg/L
tert-Butyl Alcohol 603 µg/LTrans-1,2-dichloroethene 2.1 µg/L 100
Effluent Methyl Tertiary Butyl Ether 5 µg/L 20Influent tert-Butyl Alcohol 24.1 µg/L
MW-5
MW-6
MW-7
Table 2 - Detected Parameters and Criteria Comparison
Former DSW
MW-1
MW-2
MW-3
MW-4

Table 3 - Historical VOC Detections
ParameterMonitoring
EventEffluent Influent
Former DSW
MW-1 MW-2 MW-3 MW-4 MW-5 MW-6 MW-7
February-07 ND NS 346 119 11.9 ND 154 ND ND NDAugust-07 ND ND 68 144 111 11 78.1 ND ND ND
May-08 ND ND 126 156 208 ND 62 ND ND NDJune-09 ND ND 79.9 24.1 43.1 ND 13.1 ND ND NDJune-10 ND ND 2600 14.4 308 34.9 11.8 112 331 ND
March-11 ND ND ND ND ND 14.4 ND ND ND NDFebruary-12 ND ND ND ND ND ND 6.76 ND ND ND
March-13 ND ND ND ND ND ND ND ND ND NDMarch-14 ND ND ND ND ND ND ND ND ND ND
June-14 ND ND ND ND ND 29.9 ND ND ND NDOctober-14 ND ND 6.78 ND NS ND 22.2 ND ND ND
March-15 ND ND ND ND ND ND ND ND ND NDSeptember-15 ND ND ND ND NS ND ND ND ND NDDecember-15 NS NS NS NS NS NS NS ND ND NS
March-16 ND ND ND ND ND 1.1 ND ND ND NDSeptember-16 ND ND ND ND ND ND ND ND ND ND
March-17 ND ND ND ND 1.6 1.7 1.3 ND ND NDFebruary-07 ND NS ND ND ND ND ND ND ND ND
August-07 ND ND ND ND ND ND ND ND ND NDMay-08 ND ND ND ND ND ND ND ND ND NDJune-09 ND ND ND ND ND ND ND ND ND NDJune-10 ND ND ND 15.2 ND ND ND ND ND ND
March-11 ND ND ND ND ND ND ND ND ND 46.6February-12 ND ND ND ND ND ND ND ND ND ND
March-13 ND ND ND ND ND ND ND ND ND NDMarch-14 ND ND ND ND ND ND ND ND ND ND
June-14 ND ND ND ND ND 13.1 ND ND ND NDOctober-14 ND ND ND ND NS ND ND ND ND ND
March-15 ND ND ND ND ND ND ND ND ND NDSeptember-15 ND ND ND ND NS ND ND ND ND NDDecember-15 NS NS NS NS NS NS NS ND ND NS
March-16 ND ND ND ND ND ND ND ND ND NDSeptember‐16 ND ND ND ND ND ND ND ND ND ND
March‐17 ND ND ND ND ND ND ND ND ND NDFebruary-07 ND NS ND ND ND ND ND ND ND ND
August-07 ND ND ND ND ND ND ND ND ND NDMay-08 ND ND ND ND ND ND ND ND ND NDJune-09 ND ND ND ND 30.6 ND ND ND ND NDJune-10 ND ND ND 5.61 ND ND ND ND ND ND
March-11 ND ND ND 26.8 ND ND ND ND ND NDFebruary-12 ND ND ND ND ND ND ND ND ND ND
March-13 ND ND 26.2 ND ND ND ND ND ND NDMarch-14 ND ND ND ND ND ND ND ND ND ND
June-14 ND ND ND ND ND ND ND ND ND NDOctober-14 ND ND ND ND NS ND 5.87 ND ND ND
March-15 ND 1.87 ND ND ND ND 11.6 ND ND NDSeptember-15 ND ND ND ND NS ND ND ND ND NDDecember-15 NS NS NS NS NS NS NS ND ND NS
March-16 ND ND ND ND ND ND ND ND ND NDSeptember-16 ND ND ND ND ND ND ND ND ND ND
March-17 ND ND ND ND ND ND ND ND ND NDFebruary-07 ND NS ND 47.4 ND ND 9.26 ND ND ND
August-07 ND ND ND 45 7 ND ND ND ND NDMay-08 ND ND ND 68 7 ND ND ND ND NDJune-09 ND ND ND ND 110 ND ND ND ND NDJune-10 ND ND ND 17.6 ND ND ND ND ND ND
March-11 ND ND ND ND ND ND ND ND ND NDFebruary-12 ND ND ND ND ND ND ND ND ND ND
March-13 ND ND 135.6 ND ND ND ND ND ND NDMarch-14 ND ND ND ND ND ND ND ND ND ND
June-14 ND ND ND ND ND 87.2 ND ND ND NDOctober-14 ND ND ND ND NS ND 137 ND ND ND
March-15 ND 1.42 J ND ND ND ND ND ND ND NDSeptember-15 ND ND ND ND NS ND ND ND ND NDDecember-15 NS NS NS NS NS NS NS ND ND NS
March-16 ND ND ND ND ND 1.2 ND ND ND NDSeptember-16 ND ND ND ND ND ND ND ND ND ND
March-17 ND ND ND ND ND ND ND ND ND ND
Benzene (comparison criterion: 5 µg/L)
Ethylbenzene (comparison criterion:
70 µg/L)
Toluene (comparison criterion: 1,000 µg/L)
Xylenes (comparison criterion: 10,000 µg/L)
Green Valley Garage1st Semi-Annual 2017 GWMRARM Project 170167M Page 1 of 2

Table 3 - Historical VOC Detections
ParameterMonitoring
EventEffluent Influent
Former DSW
MW-1 MW-2 MW-3 MW-4 MW-5 MW-6 MW-7
February-07 ND NS 1275 9280 362 ND 524 ND ND NDAugust-07 ND 38 12880 43600 29600 4400 7560 11 6 52
May-08 4.4 410 7200 42400 24000 4640 11000 ND ND 168June-09 168 984 4320 14720 9120 2450 5360 413 ND 992June-10 ND 2.98 9000 5920 1360 357 1840 460 1720 ND
March-11 232 1100 4720 6360 2970 8100 256 3120 134 792February-12 ND 6.98 10840 3988 11120 5640 9990 366 1550 585
March-13 ND ND 3440 1160 5560 2276 2440 64.47 ND NDMarch-14 4.14 0.98 J 1323 297 1440 636 880 114 305 ND
June-14 ND 14.9 1160 244 755 3920 776 382 617 NDOctober-14 60.7 23.8 3170 330 NS 226 1680 714 55.4 ND
March-15 ND 115 852 231 122 690 1000 2600 ND NDSeptember-15 ND ND 3960 279 NS ND 2120 5640 1920 NDDecember-15 NS NS NS NS NS NS NS 2900 642 NS
March-16 ND 1.2 450 199 1450 808 731 2420 1080 NDSeptember-16 7.9 ND 626 148 233 116 685 3080 894 9.7
March-17 5 ND 213 304 573 155 1990 2000 740 70.3March-16 ND ND 121 67 302 244 177 577 273 ND
September-16 0.91 ND 129 32.1 32.8 26.4 141 452 184 1.5March-17 ND ND 51.1 107 82.3 120 432 402 161 16.6March-16 57.4 60 1430 51.7 333 1580 2450 2370 776 ND
September-16 11.7 82.4 2860 ND 71.2 282 3570 4950 830 48.5March-17 ND 24.1 167 32.7 222 684 3400 2980 1060 603
tert-Butyl Alcohol
All concentration units are µg/L
Methyl Tertiary Butyl Ether (comparison criterion: 20 µg/L)
tert-Amyl methyl ether
Green Valley Garage1st Semi-Annual 2017 GWMRARM Project 170167M Page 2 of 2
APPENDIX A – Field Sampling Records


APPENDIX B – Laboratory Certificate of Analysis

Report ID: 2211841 - 3/9/2017 Page 1 of 26
Mr. Stewart KabisARM Group, Inc. - MD9175 Guilford RoadSuite 310Columbia, MD 21046
March 9, 2017
Dear Mr. Kabis:
Certificate of AnalysisProject Name:Purchase Order:
GVG SPRING/170167M-MD SITE170167M
Workorder:Workorder ID:
2211841GVG SPRING/170167M-MD SITE
Revised Report - 3/9/2017 6:20:14 PM - See workorder comment section for explanation
CC: Mr. Eric Magdar , Accounts Payable
This page is included as part of the Analytical Report andmust be retained as a permanent record thereof. Project Coordinator
Ms. Susan J Scherer
Enclosed are the analytical results for samples received by the laboratory on Wednesday, March 1, 2017.
The ALS Environmental laboratory in Middletown, Pennsylvania is a National Environmental LaboratoryAccreditation Program (NELAP) accredited laboratory and as such, certifies that all applicable test results meet therequirements of NELAP.
If you have any questions regarding this certificate of analysis, please contact Ms. Susan J Scherer (ProjectCoordinator) at (717) 944-5541.
Analyses were performed according to our laboratory’s NELAP-approved quality assurance program and anyapplicable state requirements. The test results meet requirements of the current NELAP standards or staterequirements, where applicable. For a specific list of accredited analytes, refer to the certifications section of theALS website at www.alsglobal.com/en/Our-Services/Life-Sciences/Environmental/Downloads.
This laboratory report may not be reproduced, except in full, without the written approval of ALS Environmental.
ALS Spring City: 10 Riverside Drive, Spring City, PA 19475 610-948-4903
NELAP Certifications: NJ PA010 , NY 11759 , PA 22-293 DoD ELAP: A2LA 0818.01State Certifications: DE ID 11 , MA PA0102 , MD 128 , VA 460157 , WV 343
DL ID - 46465, QC - 0

Report ID: 2211841 - 3/9/2017 Page 2 of 26
Workorder: 2211841 GVG SPRING/170167M-MD SITE
SAMPLE SUMMARY
Lab ID Sample ID Matrix Date Collected Date Received Collected By
2211841001 Effluent Drinking Water 3/1/2017 08:40 3/1/2017 21:30 Collected by Client
2211841002 Influent Drinking Water 3/1/2017 08:45 3/1/2017 21:30 Collected by Client
2211841003 MW-5 Ground Water 3/1/2017 09:56 3/1/2017 21:30 Collected by Client
2211841004 MW-6 Ground Water 3/1/2017 10:37 3/1/2017 21:30 Collected by Client
2211841005 MW-4 Ground Water 3/1/2017 11:53 3/1/2017 21:30 Collected by Client
2211841006 MW-1 Ground Water 3/1/2017 12:38 3/1/2017 21:30 Collected by Client
2211841007 DSW Ground Water 3/1/2017 13:07 3/1/2017 21:30 Collected by Client
2211841008 Trip Blank Ground Water 3/1/2017 00:00 3/1/2017 21:30 Collected by Client
NELAP Certifications: NJ PA010 , NY 11759 , PA 22-293 DoD ELAP: A2LA 0818.01State Certifications: DE ID 11 , MA PA0102 , MD 128 , VA 460157 , WV 343
DL ID - 46465, QC - 0

Report ID: 2211841 - 3/9/2017 Page 3 of 26
Workorder: 2211841 GVG SPRING/170167M-MD SITE
SAMPLE SUMMARY
Standard Acronyms/Flags
Notes
-- All Waste Water analyses comply with methodology requirements of 40 CFR Part 136.-- All Drinking Water analyses comply with methodology requirements of 40 CFR Part 141.-- Unless otherwise noted, all quantitative results for soils are reported on a dry weight basis.-- The Chain of Custody document is included as part of this report.
Indicates an estimated value between the Method Detection Limit (MDL) and the Practical Quantitation Limit (PQL) for the analyteIndicates that the analyte was Not Detected (ND)
Method Detection LimitPractical Quantitation Limit
JU
MDLPQL
Reporting Detection LimitNot Detected - indicates that the analyte was Not Detected at the RDLAnalysis was performed using this containerRegulatory Limit
RDLNDCntr
RegLmtLaboratory Control SampleMatrix Spike
LCSMS
Matrix Spike DuplicateSample DuplicatePercent Recovery
MSDDUP
%RecRelative Percent DifferenceRPD
-- Samples collected by ALS personnel are done so in accordance with the procedures set forth in the ALS Field Sampling Plan (20 - Field Services Sampling Plan).
N Indicates presumptive evidence of the presence of a compound
-- All Library Search analytes should be regarded as tentative identifications based on the presumptive evidence of the mass spectra. Concentrations reported are estimated values. -- Parameters identified as "analyze immediately" require analysis within 15 minutes of collection. Any "analyze immediately" parameters not listed under the header "Field Parameters" are preformed in the laboratory and are therefore analyzed out of hold time.
LOD DoD Limit of DetectionLOQ DoD Limit of QuantitationDL DoD Detection Limit
-- Method references listed on this report beginning with the prefix “S” followed by a method number (such as S2310B-97) refer to methods from “Standard Methods for the Examination of Water and Wastewater”.
I Indicates reported value is greater than or equal to the Method Detection Limit (MDL) but less than the Report Detection Limit (RDL)(S) Surrogate CompoundNC Not Calculated* Result outside of QC limits
-- For microbiological analyses, the "Prepared" value is the date/time into the incurbator and the "Analyzed" value is the date/time out the incubator.
NELAP Certifications: NJ PA010 , NY 11759 , PA 22-293 DoD ELAP: A2LA 0818.01State Certifications: DE ID 11 , MA PA0102 , MD 128 , VA 460157 , WV 343
DL ID - 46465, QC - 0

Report ID: 2211841 - 3/9/2017 Page 4 of 26
Workorder: 2211841 GVG SPRING/170167M-MD SITE
PROJECT SUMMARY
Workorder Comments
This certificate of analysis was modified to report the requested analysis of EPA 524.2 for the effluent and influent locations asrequested on the chain of custody. Originally SW846-8260B was analyzed and reported in error. SJS 03/08/17
NELAP Certifications: NJ PA010 , NY 11759 , PA 22-293 DoD ELAP: A2LA 0818.01State Certifications: DE ID 11 , MA PA0102 , MD 128 , VA 460157 , WV 343
DL ID - 46465, QC - 0

Report ID: 2211841 - 3/9/2017 Page 5 of 26
Workorder: 2211841 GVG SPRING/170167M-MD SITE
ANALYTICAL RESULTS
3/1/2017 21:30Effluent
Matrix: Drinking Water
Parameters
Lab ID:
Sample ID:
2211841001
Results Units RDL Prepared By ByAnalyzedFlag
Date Collected:
Date Received:
3/1/2017 08:40
CntrMethod
VOLATILE ORGANICSAcetone ND ug/L 10.0 3/2/17 11:02 DD ASW846 8260BAcetone ND ug/L 5.0 3/8/17 18:36 TMP BEPA 524.2Acrylonitrile ND ug/L 2.5 3/8/17 18:36 TMP BEPA 524.2tert-Amyl methyl ether ND ug/L 1.0 3/2/17 11:02 DD ASW846 8260Btert-Amyl methyl ether 0.65 ug/L 0.50 3/8/17 18:36 TMP BEPA 524.2tert-Amyl Alcohol ND ug/L 5.0 3/8/17 18:36 TMP BEPA 524.2tert-Amyl Ethylether ND ug/L 0.50 3/8/17 18:36 TMP BEPA 524.2Benzene ND ug/L 1.0 3/2/17 11:02 DD ASW846 8260BBenzene ND ug/L 0.50 3/8/17 18:36 TMP BEPA 524.2Bromobenzene ND ug/L 0.50 3/8/17 18:36 TMP BEPA 524.2Bromochloromethane ND ug/L 1.0 3/2/17 11:02 DD ASW846 8260BBromochloromethane ND ug/L 0.50 3/8/17 18:36 TMP BEPA 524.2Bromodichloromethane ND ug/L 1.0 3/2/17 11:02 DD ASW846 8260BBromodichloromethane ND ug/L 0.50 3/8/17 18:36 TMP BEPA 524.2Bromoform ND ug/L 1.0 3/2/17 11:02 DD ASW846 8260BBromoform ND ug/L 0.50 3/8/17 18:36 TMP BEPA 524.2Bromomethane ND ug/L 1.0 3/2/17 11:02 DD ASW846 8260BBromomethane ND ug/L 0.50 3/8/17 18:36 TMP B1 EPA 524.22-Butanone ND ug/L 10.0 3/2/17 11:02 DD ASW846 8260B2-Butanone ND ug/L 2.5 3/8/17 18:36 TMP BEPA 524.2tert-Butyl Alcohol ND ug/L 10.0 3/2/17 11:02 DD ASW846 8260Btert-Butyl Alcohol 9.8 ug/L 5.0 3/8/17 18:36 TMP BEPA 524.2n-Butylbenzene ND ug/L 0.50 3/8/17 18:36 TMP BEPA 524.2tert-Butylbenzene ND ug/L 0.50 3/8/17 18:36 TMP BEPA 524.2sec-Butylbenzene ND ug/L 0.50 3/8/17 18:36 TMP BEPA 524.2Carbon Disulfide ND ug/L 1.0 3/2/17 11:02 DD ASW846 8260BCarbon Disulfide ND ug/L 0.50 3/8/17 18:36 TMP BEPA 524.2Carbon Tetrachloride ND ug/L 1.0 3/2/17 11:02 DD ASW846 8260BCarbon Tetrachloride ND ug/L 0.50 3/8/17 18:36 TMP BEPA 524.2Chloroacetonitrile ND ug/L 2.5 3/8/17 18:36 TMP BEPA 524.2Chlorobenzene ND ug/L 1.0 3/2/17 11:02 DD ASW846 8260BChlorobenzene ND ug/L 0.50 3/8/17 18:36 TMP BEPA 524.21-Chlorobutane ND ug/L 1.0 3/8/17 18:36 TMP BEPA 524.2Chlorodibromomethane ND ug/L 1.0 3/2/17 11:02 DD ASW846 8260BChlorodibromomethane ND ug/L 0.50 3/8/17 18:36 TMP BEPA 524.2
NELAP Certifications: NJ PA010 , NY 11759 , PA 22-293 DoD ELAP: A2LA 0818.01State Certifications: DE ID 11 , MA PA0102 , MD 128 , VA 460157 , WV 343
DL ID - 46465, QC - 0

Report ID: 2211841 - 3/9/2017 Page 6 of 26
Workorder: 2211841 GVG SPRING/170167M-MD SITE
ANALYTICAL RESULTS
3/1/2017 21:30Effluent
Matrix: Drinking Water
Parameters
Lab ID:
Sample ID:
2211841001
Results Units RDL Prepared By ByAnalyzedFlag
Date Collected:
Date Received:
3/1/2017 08:40
CntrMethod
Chloroethane ND ug/L 1.0 3/2/17 11:02 DD ASW846 8260BChloroethane ND ug/L 0.50 3/8/17 18:36 TMP BEPA 524.2Chloroform ND ug/L 1.0 3/2/17 11:02 DD ASW846 8260BChloroform ND ug/L 0.50 3/8/17 18:36 TMP BEPA 524.2Chloromethane ND ug/L 1.0 3/2/17 11:02 DD ASW846 8260BChloromethane ND ug/L 0.50 3/8/17 18:36 TMP BEPA 524.23-Chloro-1-propene ND ug/L 0.50 3/8/17 18:36 TMP BEPA 524.2o-Chlorotoluene ND ug/L 0.50 3/8/17 18:36 TMP BEPA 524.2p-Chlorotoluene ND ug/L 0.50 3/8/17 18:36 TMP BEPA 524.2Cyclohexane ND ug/L 1.0 3/2/17 11:02 DD ASW846 8260BCyclohexane ND ug/L 0.50 3/8/17 18:36 TMP BEPA 524.21,2-Dibromo-3-chloropropane
ND ug/L 7.0 3/2/17 11:02 DD ASW846 8260B
1,2-Dibromo-3-chloropropane
ND ug/L 0.50 3/8/17 18:36 TMP BEPA 524.2
1,2-Dibromoethane ND ug/L 1.0 3/2/17 11:02 DD ASW846 8260B1,2-Dibromoethane ND ug/L 0.50 3/8/17 18:36 TMP BEPA 524.2Dibromomethane ND ug/L 0.50 3/8/17 18:36 TMP BEPA 524.2trans-1,4-Dichloro-2-butene ND ug/L 1.0 3/8/17 18:36 TMP BEPA 524.21,1-Dichloro-2-Propanone ND ug/L 12.5 3/8/17 18:36 TMP BEPA 524.21,2-Dichlorobenzene ND ug/L 1.0 3/2/17 11:02 DD ASW846 8260B1,2-Dichlorobenzene ND ug/L 0.50 3/8/17 18:36 TMP BEPA 524.21,3-Dichlorobenzene ND ug/L 1.0 3/2/17 11:02 DD ASW846 8260B1,3-Dichlorobenzene ND ug/L 0.50 3/8/17 18:36 TMP BEPA 524.21,4-Dichlorobenzene ND ug/L 1.0 3/2/17 11:02 DD ASW846 8260B1,4-Dichlorobenzene ND ug/L 0.50 3/8/17 18:36 TMP BEPA 524.2Dichlorodifluoromethane ND ug/L 1.0 3/2/17 11:02 DD ASW846 8260BDichlorodifluoromethane ND ug/L 0.50 3/8/17 18:36 TMP BEPA 524.21,1-Dichloroethane ND ug/L 1.0 3/2/17 11:02 DD ASW846 8260B1,1-Dichloroethane ND ug/L 0.50 3/8/17 18:36 TMP BEPA 524.21,2-Dichloroethane ND ug/L 1.0 3/2/17 11:02 DD ASW846 8260B1,2-Dichloroethane ND ug/L 0.50 3/8/17 18:36 TMP BEPA 524.21,1-Dichloroethene ND ug/L 1.0 3/2/17 11:02 DD ASW846 8260B1,1-Dichloroethene ND ug/L 0.50 3/8/17 18:36 TMP BEPA 524.2cis-1,2-Dichloroethene ND ug/L 1.0 3/2/17 11:02 DD ASW846 8260Bcis-1,2-Dichloroethene ND ug/L 0.50 3/8/17 18:36 TMP BEPA 524.2trans-1,2-Dichloroethene ND ug/L 1.0 3/2/17 11:02 DD ASW846 8260B
NELAP Certifications: NJ PA010 , NY 11759 , PA 22-293 DoD ELAP: A2LA 0818.01State Certifications: DE ID 11 , MA PA0102 , MD 128 , VA 460157 , WV 343
DL ID - 46465, QC - 0

Report ID: 2211841 - 3/9/2017 Page 7 of 26
Workorder: 2211841 GVG SPRING/170167M-MD SITE
ANALYTICAL RESULTS
3/1/2017 21:30Effluent
Matrix: Drinking Water
Parameters
Lab ID:
Sample ID:
2211841001
Results Units RDL Prepared By ByAnalyzedFlag
Date Collected:
Date Received:
3/1/2017 08:40
CntrMethod
trans-1,2-Dichloroethene ND ug/L 0.50 3/8/17 18:36 TMP BEPA 524.2Dichlorofluoromethane ND ug/L 0.50 3/8/17 18:36 TMP BEPA 524.21,3-Dichloropropane ND ug/L 0.50 3/8/17 18:36 TMP BEPA 524.22,2-Dichloropropane ND ug/L 0.50 3/8/17 18:36 TMP BEPA 524.21,2-Dichloropropane ND ug/L 1.0 3/2/17 11:02 DD ASW846 8260B1,2-Dichloropropane ND ug/L 0.50 3/8/17 18:36 TMP BEPA 524.21,1-Dichloropropene ND ug/L 0.50 3/8/17 18:36 TMP BEPA 524.2cis-1,3-Dichloropropene ND ug/L 1.0 3/2/17 11:02 DD ASW846 8260Bcis-1,3-Dichloropropene ND ug/L 0.50 3/8/17 18:36 TMP BEPA 524.2trans-1,3-Dichloropropene ND ug/L 1.0 3/2/17 11:02 DD ASW846 8260Btrans-1,3-Dichloropropene ND ug/L 0.50 3/8/17 18:36 TMP BEPA 524.21,3-Dichloropropene, Total ND ug/L 1.0 3/8/17 18:36 TMP BEPA 524.2Diisopropyl ether ND ug/L 1.0 3/2/17 11:02 DD ASW846 8260BDiisopropyl ether 1.3 ug/L 0.50 3/8/17 18:36 TMP BEPA 524.21,4-Dioxane ND ug/L 320 3/2/17 11:02 DD ASW846 8260BEthyl Ether ND ug/L 0.50 3/8/17 18:36 TMP BEPA 524.2Ethyl Methacrylate ND ug/L 0.50 3/8/17 18:36 TMP BEPA 524.2Ethyl tert-butyl ether ND ug/L 0.50 3/8/17 18:36 TMP BEPA 524.2Ethylbenzene ND ug/L 1.0 3/2/17 11:02 DD ASW846 8260BEthylbenzene ND ug/L 0.50 3/8/17 18:36 TMP BEPA 524.2Freon 113 ND ug/L 1.0 3/2/17 11:02 DD ASW846 8260BFreon 113 ND ug/L 0.50 3/8/17 18:36 TMP BEPA 524.2Hexachlorobutadiene ND ug/L 0.50 3/8/17 18:36 TMP BEPA 524.2Hexachloroethane ND ug/L 1.0 3/8/17 18:36 TMP BEPA 524.2Hexane ND ug/L 0.50 3/8/17 18:36 TMP BEPA 524.22-Hexanone ND ug/L 5.0 3/2/17 11:02 DD ASW846 8260B2-Hexanone ND ug/L 2.5 3/8/17 18:36 TMP BEPA 524.2Iodomethane ND ug/L 0.50 3/8/17 18:36 TMP BEPA 524.2Isopropyl Alcohol ND ug/L 25.0 3/8/17 18:36 TMP BEPA 524.2Isopropylbenzene ND ug/L 1.0 3/2/17 11:02 DD ASW846 8260BIsopropylbenzene ND ug/L 0.50 3/8/17 18:36 TMP BEPA 524.2p-Isopropyltoluene ND ug/L 0.50 3/8/17 18:36 TMP BEPA 524.2Methacrylonitrile ND ug/L 1.0 3/8/17 18:36 TMP BEPA 524.2Methyl methacrylate ND ug/L 0.50 3/8/17 18:36 TMP BEPA 524.2Methyl acetate ND ug/L 2.0 3/2/17 11:02 DD ASW846 8260BMethyl acetate ND ug/L 0.50 3/8/17 18:36 TMP BEPA 524.2Methyl acrylate ND ug/L 1.0 3/8/17 18:36 TMP BEPA 524.2
NELAP Certifications: NJ PA010 , NY 11759 , PA 22-293 DoD ELAP: A2LA 0818.01State Certifications: DE ID 11 , MA PA0102 , MD 128 , VA 460157 , WV 343
DL ID - 46465, QC - 0

Report ID: 2211841 - 3/9/2017 Page 8 of 26
Workorder: 2211841 GVG SPRING/170167M-MD SITE
ANALYTICAL RESULTS
3/1/2017 21:30Effluent
Matrix: Drinking Water
Parameters
Lab ID:
Sample ID:
2211841001
Results Units RDL Prepared By ByAnalyzedFlag
Date Collected:
Date Received:
3/1/2017 08:40
CntrMethod
Methyl cyclohexane ND ug/L 1.0 3/2/17 11:02 DD ASW846 8260BMethyl cyclohexane ND ug/L 0.50 3/8/17 18:36 TMP BEPA 524.2Methyl t-Butyl Ether 5.0 ug/L 1.0 3/2/17 11:02 DD ASW846 8260BMethyl t-Butyl Ether 6.0 ug/L 0.50 3/8/17 18:36 TMP BEPA 524.24-Methyl-2-Pentanone(MIBK)
ND ug/L 5.0 3/2/17 11:02 DD ASW846 8260B
4-Methyl-2-Pentanone(MIBK)
ND ug/L 2.5 3/8/17 18:36 TMP BEPA 524.2
Methylene Chloride ND ug/L 1.0 3/2/17 11:02 DD ASW846 8260BMethylene Chloride ND ug/L 0.50 3/8/17 18:36 TMP BEPA 524.2Naphthalene ND ug/L 2.0 3/2/17 11:02 DD ASW846 8260BNaphthalene ND ug/L 0.50 3/8/17 18:36 TMP BEPA 524.2Nitrobenzene ND ug/L 5.0 3/8/17 18:36 TMP BEPA 524.22-Nitropropane ND ug/L 2.5 3/8/17 18:36 TMP BEPA 524.2Octane ND ug/L 0.50 3/8/17 18:36 TMP BEPA 524.2Pentachloroethane ND ug/L 0.50 3/8/17 18:36 TMP BEPA 524.2Pentane ND ug/L 0.50 3/8/17 18:36 TMP BEPA 524.2Propionitrile ND ug/L 2.5 3/8/17 18:36 TMP BEPA 524.2n-Propylbenzene ND ug/L 0.50 3/8/17 18:36 TMP BEPA 524.2Styrene ND ug/L 1.0 3/2/17 11:02 DD ASW846 8260BStyrene ND ug/L 0.50 3/8/17 18:36 TMP BEPA 524.21,1,1,2-Tetrachloroethane ND ug/L 0.50 3/8/17 18:36 TMP BEPA 524.21,1,2,2-Tetrachloroethane ND ug/L 1.0 3/2/17 11:02 DD ASW846 8260B1,1,2,2-Tetrachloroethane ND ug/L 0.50 3/8/17 18:36 TMP BEPA 524.2Tetrachloroethene ND ug/L 1.0 3/2/17 11:02 DD ASW846 8260BTetrachloroethene ND ug/L 0.50 3/8/17 18:36 TMP BEPA 524.2Tetrahydrofuran ND ug/L 2.5 3/8/17 18:36 TMP BEPA 524.2Toluene ND ug/L 1.0 3/2/17 11:02 DD ASW846 8260BToluene ND ug/L 0.50 3/8/17 18:36 TMP BEPA 524.2Total Xylenes ND ug/L 3.0 3/2/17 11:02 DD ASW846 8260BTotal Xylenes ND ug/L 0.50 3/8/17 18:36 TMP BEPA 524.21,2,3-Trichlorobenzene ND ug/L 2.0 3/2/17 11:02 DD ASW846 8260B1,2,3-Trichlorobenzene ND ug/L 0.50 3/8/17 18:36 TMP BEPA 524.21,2,4-Trichlorobenzene ND ug/L 2.0 3/2/17 11:02 DD ASW846 8260B1,2,4-Trichlorobenzene ND ug/L 0.50 3/8/17 18:36 TMP BEPA 524.21,1,1-Trichloroethane ND ug/L 1.0 3/2/17 11:02 DD ASW846 8260B1,1,1-Trichloroethane ND ug/L 0.50 3/8/17 18:36 TMP BEPA 524.2
NELAP Certifications: NJ PA010 , NY 11759 , PA 22-293 DoD ELAP: A2LA 0818.01State Certifications: DE ID 11 , MA PA0102 , MD 128 , VA 460157 , WV 343
DL ID - 46465, QC - 0

Report ID: 2211841 - 3/9/2017 Page 9 of 26
Workorder: 2211841 GVG SPRING/170167M-MD SITE
ANALYTICAL RESULTS
3/1/2017 21:30Effluent
Matrix: Drinking Water
Parameters
Lab ID:
Sample ID:
2211841001
Results Units RDL Prepared By ByAnalyzedFlag
Date Collected:
Date Received:
3/1/2017 08:40
CntrMethod
1,1,2-Trichloroethane ND ug/L 1.0 3/2/17 11:02 DD ASW846 8260B1,1,2-Trichloroethane ND ug/L 0.50 3/8/17 18:36 TMP BEPA 524.2Trichloroethene ND ug/L 1.0 3/2/17 11:02 DD ASW846 8260BTrichloroethene ND ug/L 0.50 3/8/17 18:36 TMP BEPA 524.2Trichlorofluoromethane ND ug/L 1.0 3/2/17 11:02 DD ASW846 8260BTrichlorofluoromethane ND ug/L 0.50 3/8/17 18:36 TMP BEPA 524.21,2,3-Trichloropropane ND ug/L 0.50 3/8/17 18:36 TMP BEPA 524.21,2,4-Trimethylbenzene ND ug/L 0.50 3/8/17 18:36 TMP BEPA 524.21,3,5-Trimethylbenzene ND ug/L 0.50 3/8/17 18:36 TMP BEPA 524.2Vinyl Acetate ND ug/L 0.50 3/8/17 18:36 TMP BEPA 524.2Vinyl Chloride ND ug/L 1.0 3/2/17 11:02 DD ASW846 8260BVinyl Chloride ND ug/L 0.50 3/8/17 18:36 TMP BEPA 524.2o-Xylene ND ug/L 1.0 3/2/17 11:02 DD ASW846 8260Bo-Xylene ND ug/L 0.50 3/8/17 18:36 TMP BEPA 524.2mp-Xylene ND ug/L 2.0 3/2/17 11:02 DD ASW846 8260Bmp-Xylene ND ug/L 0.50 3/8/17 18:36 TMP BEPA 524.2
Surrogate Recoveries Flag UnitsResults Limits Prepared By Analyzed By CntrMethod
1,2-Dichlorobenzene-d4 (S) 84.6 % 70 - 130 3/8/17 18:36 TMP BEPA 524.24-Bromofluorobenzene (S) 102 % 70 - 130 3/8/17 18:36 TMP BEPA 524.2
Surrogate Recoveries Flag UnitsResults Limits Prepared By Analyzed By CntrMethod
1,2-Dichloroethane-d4 (S) 88.1 % 62 - 133 3/2/17 11:02 DD ASW846 8260B4-Bromofluorobenzene (S) 87.3 % 79 - 114 3/2/17 11:02 DD ASW846 8260BDibromofluoromethane (S) 83.6 % 78 - 116 3/2/17 11:02 DD ASW846 8260BToluene-d8 (S) 84.4 % 76 - 127 3/2/17 11:02 DD ASW846 8260B
Project CoordinatorMs. Susan J Scherer
NELAP Certifications: NJ PA010 , NY 11759 , PA 22-293 DoD ELAP: A2LA 0818.01State Certifications: DE ID 11 , MA PA0102 , MD 128 , VA 460157 , WV 343
DL ID - 46465, QC - 0
Report ID: 2211841 - 3/9/2017 Page 10 of 26
Workorder: 2211841 GVG SPRING/170167M-MD SITE
ANALYTICAL RESULTS
3/1/2017 21:30Influent
Matrix: Drinking Water
Parameters
Lab ID:
Sample ID:
2211841002
Results Units RDL Prepared By ByAnalyzedFlag
Date Collected:
Date Received:
3/1/2017 08:45
CntrMethod
VOLATILE ORGANICSAcetone ND ug/L 5.0 3/8/17 19:00 TMP CEPA 524.2Acrylonitrile ND ug/L 2.5 3/8/17 19:00 TMP CEPA 524.2tert-Amyl methyl ether ND ug/L 0.50 3/8/17 19:00 TMP CEPA 524.2tert-Amyl Alcohol ND ug/L 5.0 3/8/17 19:00 TMP CEPA 524.2tert-Amyl Ethylether ND ug/L 0.50 3/8/17 19:00 TMP CEPA 524.2Benzene ND ug/L 0.50 3/8/17 19:00 TMP CEPA 524.2Bromobenzene ND ug/L 0.50 3/8/17 19:00 TMP CEPA 524.2Bromochloromethane ND ug/L 0.50 3/8/17 19:00 TMP CEPA 524.2Bromodichloromethane ND ug/L 0.50 3/8/17 19:00 TMP CEPA 524.2Bromoform ND ug/L 0.50 3/8/17 19:00 TMP CEPA 524.2Bromomethane ND ug/L 0.50 3/8/17 19:00 TMP C1 EPA 524.22-Butanone ND ug/L 2.5 3/8/17 19:00 TMP CEPA 524.2tert-Butyl Alcohol 30.2 ug/L 5.0 3/8/17 19:00 TMP CEPA 524.2n-Butylbenzene ND ug/L 0.50 3/8/17 19:00 TMP CEPA 524.2tert-Butylbenzene ND ug/L 0.50 3/8/17 19:00 TMP CEPA 524.2sec-Butylbenzene ND ug/L 0.50 3/8/17 19:00 TMP CEPA 524.2Carbon Disulfide ND ug/L 0.50 3/8/17 19:00 TMP CEPA 524.2Carbon Tetrachloride ND ug/L 0.50 3/8/17 19:00 TMP CEPA 524.2Chloroacetonitrile ND ug/L 2.5 3/8/17 19:00 TMP CEPA 524.2Chlorobenzene ND ug/L 0.50 3/8/17 19:00 TMP CEPA 524.21-Chlorobutane ND ug/L 1.0 3/8/17 19:00 TMP CEPA 524.2Chlorodibromomethane ND ug/L 0.50 3/8/17 19:00 TMP CEPA 524.2Chloroethane ND ug/L 0.50 3/8/17 19:00 TMP CEPA 524.2Chloroform ND ug/L 0.50 3/8/17 19:00 TMP CEPA 524.2Chloromethane ND ug/L 0.50 3/8/17 19:00 TMP CEPA 524.23-Chloro-1-propene ND ug/L 0.50 3/8/17 19:00 TMP CEPA 524.2o-Chlorotoluene ND ug/L 0.50 3/8/17 19:00 TMP CEPA 524.2p-Chlorotoluene ND ug/L 0.50 3/8/17 19:00 TMP CEPA 524.2Cyclohexane ND ug/L 0.50 3/8/17 19:00 TMP CEPA 524.21,2-Dibromo-3-chloropropane
ND ug/L 0.50 3/8/17 19:00 TMP CEPA 524.2
1,2-Dibromoethane ND ug/L 0.50 3/8/17 19:00 TMP CEPA 524.2Dibromomethane ND ug/L 0.50 3/8/17 19:00 TMP CEPA 524.2trans-1,4-Dichloro-2-butene ND ug/L 1.0 3/8/17 19:00 TMP CEPA 524.21,1-Dichloro-2-Propanone ND ug/L 12.5 3/8/17 19:00 TMP CEPA 524.21,2-Dichlorobenzene ND ug/L 0.50 3/8/17 19:00 TMP CEPA 524.21,3-Dichlorobenzene ND ug/L 0.50 3/8/17 19:00 TMP CEPA 524.2
NELAP Certifications: NJ PA010 , NY 11759 , PA 22-293 DoD ELAP: A2LA 0818.01State Certifications: DE ID 11 , MA PA0102 , MD 128 , VA 460157 , WV 343
DL ID - 46465, QC - 0

Report ID: 2211841 - 3/9/2017 Page 11 of 26
Workorder: 2211841 GVG SPRING/170167M-MD SITE
ANALYTICAL RESULTS
3/1/2017 21:30Influent
Matrix: Drinking Water
Parameters
Lab ID:
Sample ID:
2211841002
Results Units RDL Prepared By ByAnalyzedFlag
Date Collected:
Date Received:
3/1/2017 08:45
CntrMethod
1,4-Dichlorobenzene ND ug/L 0.50 3/8/17 19:00 TMP CEPA 524.2Dichlorodifluoromethane ND ug/L 0.50 3/8/17 19:00 TMP CEPA 524.21,1-Dichloroethane ND ug/L 0.50 3/8/17 19:00 TMP CEPA 524.21,2-Dichloroethane ND ug/L 0.50 3/8/17 19:00 TMP CEPA 524.21,1-Dichloroethene ND ug/L 0.50 3/8/17 19:00 TMP CEPA 524.2cis-1,2-Dichloroethene ND ug/L 0.50 3/8/17 19:00 TMP CEPA 524.2trans-1,2-Dichloroethene ND ug/L 0.50 3/8/17 19:00 TMP CEPA 524.2Dichlorofluoromethane ND ug/L 0.50 3/8/17 19:00 TMP CEPA 524.21,3-Dichloropropane ND ug/L 0.50 3/8/17 19:00 TMP CEPA 524.22,2-Dichloropropane ND ug/L 0.50 3/8/17 19:00 TMP CEPA 524.21,2-Dichloropropane ND ug/L 0.50 3/8/17 19:00 TMP CEPA 524.21,1-Dichloropropene ND ug/L 0.50 3/8/17 19:00 TMP CEPA 524.2cis-1,3-Dichloropropene ND ug/L 0.50 3/8/17 19:00 TMP CEPA 524.2trans-1,3-Dichloropropene ND ug/L 0.50 3/8/17 19:00 TMP CEPA 524.21,3-Dichloropropene, Total ND ug/L 1.0 3/8/17 19:00 TMP CEPA 524.2Diisopropyl ether ND ug/L 0.50 3/8/17 19:00 TMP CEPA 524.2Ethyl Ether ND ug/L 0.50 3/8/17 19:00 TMP CEPA 524.2Ethyl Methacrylate ND ug/L 0.50 3/8/17 19:00 TMP CEPA 524.2Ethyl tert-butyl ether ND ug/L 0.50 3/8/17 19:00 TMP CEPA 524.2Ethylbenzene ND ug/L 0.50 3/8/17 19:00 TMP CEPA 524.2Freon 113 ND ug/L 0.50 3/8/17 19:00 TMP CEPA 524.2Hexachlorobutadiene ND ug/L 0.50 3/8/17 19:00 TMP CEPA 524.2Hexachloroethane ND ug/L 1.0 3/8/17 19:00 TMP CEPA 524.2Hexane ND ug/L 0.50 3/8/17 19:00 TMP CEPA 524.22-Hexanone ND ug/L 2.5 3/8/17 19:00 TMP CEPA 524.2Iodomethane ND ug/L 0.50 3/8/17 19:00 TMP CEPA 524.2Isopropyl Alcohol ND ug/L 25.0 3/8/17 19:00 TMP CEPA 524.2Isopropylbenzene ND ug/L 0.50 3/8/17 19:00 TMP CEPA 524.2p-Isopropyltoluene ND ug/L 0.50 3/8/17 19:00 TMP CEPA 524.2Methacrylonitrile ND ug/L 1.0 3/8/17 19:00 TMP CEPA 524.2Methyl methacrylate ND ug/L 0.50 3/8/17 19:00 TMP CEPA 524.2Methyl acetate ND ug/L 0.50 3/8/17 19:00 TMP CEPA 524.2Methyl acrylate ND ug/L 1.0 3/8/17 19:00 TMP CEPA 524.2Methyl cyclohexane ND ug/L 0.50 3/8/17 19:00 TMP CEPA 524.2Methyl t-Butyl Ether ND ug/L 0.50 3/8/17 19:00 TMP CEPA 524.24-Methyl-2-Pentanone(MIBK)
ND ug/L 2.5 3/8/17 19:00 TMP CEPA 524.2
Methylene Chloride ND ug/L 0.50 3/8/17 19:00 TMP CEPA 524.2Naphthalene ND ug/L 0.50 3/8/17 19:00 TMP CEPA 524.2
NELAP Certifications: NJ PA010 , NY 11759 , PA 22-293 DoD ELAP: A2LA 0818.01State Certifications: DE ID 11 , MA PA0102 , MD 128 , VA 460157 , WV 343
DL ID - 46465, QC - 0

Report ID: 2211841 - 3/9/2017 Page 12 of 26
Workorder: 2211841 GVG SPRING/170167M-MD SITE
ANALYTICAL RESULTS
3/1/2017 21:30Influent
Matrix: Drinking Water
Parameters
Lab ID:
Sample ID:
2211841002
Results Units RDL Prepared By ByAnalyzedFlag
Date Collected:
Date Received:
3/1/2017 08:45
CntrMethod
Nitrobenzene ND ug/L 5.0 3/8/17 19:00 TMP CEPA 524.22-Nitropropane ND ug/L 2.5 3/8/17 19:00 TMP CEPA 524.2Octane ND ug/L 0.50 3/8/17 19:00 TMP CEPA 524.2Pentachloroethane ND ug/L 0.50 3/8/17 19:00 TMP CEPA 524.2Pentane ND ug/L 0.50 3/8/17 19:00 TMP CEPA 524.2Propionitrile ND ug/L 2.5 3/8/17 19:00 TMP CEPA 524.2n-Propylbenzene ND ug/L 0.50 3/8/17 19:00 TMP CEPA 524.2Styrene ND ug/L 0.50 3/8/17 19:00 TMP CEPA 524.21,1,1,2-Tetrachloroethane ND ug/L 0.50 3/8/17 19:00 TMP CEPA 524.21,1,2,2-Tetrachloroethane ND ug/L 0.50 3/8/17 19:00 TMP CEPA 524.2Tetrachloroethene ND ug/L 0.50 3/8/17 19:00 TMP CEPA 524.2Tetrahydrofuran ND ug/L 2.5 3/8/17 19:00 TMP CEPA 524.2Toluene ND ug/L 0.50 3/8/17 19:00 TMP CEPA 524.2Total Xylenes ND ug/L 0.50 3/8/17 19:00 TMP CEPA 524.21,2,3-Trichlorobenzene ND ug/L 0.50 3/8/17 19:00 TMP CEPA 524.21,2,4-Trichlorobenzene ND ug/L 0.50 3/8/17 19:00 TMP CEPA 524.21,1,1-Trichloroethane ND ug/L 0.50 3/8/17 19:00 TMP CEPA 524.21,1,2-Trichloroethane ND ug/L 0.50 3/8/17 19:00 TMP CEPA 524.2Trichloroethene ND ug/L 0.50 3/8/17 19:00 TMP CEPA 524.2Trichlorofluoromethane ND ug/L 0.50 3/8/17 19:00 TMP CEPA 524.21,2,3-Trichloropropane ND ug/L 0.50 3/8/17 19:00 TMP CEPA 524.21,2,4-Trimethylbenzene ND ug/L 0.50 3/8/17 19:00 TMP CEPA 524.21,3,5-Trimethylbenzene ND ug/L 0.50 3/8/17 19:00 TMP CEPA 524.2Vinyl Acetate ND ug/L 0.50 3/8/17 19:00 TMP CEPA 524.2Vinyl Chloride ND ug/L 0.50 3/8/17 19:00 TMP CEPA 524.2o-Xylene ND ug/L 0.50 3/8/17 19:00 TMP CEPA 524.2mp-Xylene ND ug/L 0.50 3/8/17 19:00 TMP CEPA 524.2
Surrogate Recoveries Flag UnitsResults Limits Prepared By Analyzed By CntrMethod
1,2-Dichlorobenzene-d4 (S) 86.2 % 70 - 130 3/8/17 19:00 TMP CEPA 524.24-Bromofluorobenzene (S) 99.3 % 70 - 130 3/8/17 19:00 TMP CEPA 524.2
Project CoordinatorMs. Susan J Scherer
NELAP Certifications: NJ PA010 , NY 11759 , PA 22-293 DoD ELAP: A2LA 0818.01State Certifications: DE ID 11 , MA PA0102 , MD 128 , VA 460157 , WV 343
DL ID - 46465, QC - 0

Report ID: 2211841 - 3/9/2017 Page 13 of 26
Workorder: 2211841 GVG SPRING/170167M-MD SITE
ANALYTICAL RESULTS
3/1/2017 21:30MW-5
Matrix: Ground Water
Parameters
Lab ID:
Sample ID:
2211841003
Results Units RDL Prepared By ByAnalyzedFlag
Date Collected:
Date Received:
3/1/2017 09:56
CntrMethod
VOLATILE ORGANICSAcetone ND ug/L 10.0 3/2/17 13:13 DD ASW846 8260Btert-Amyl methyl ether 402 ug/L 20.0 3/3/17 16:35 DD ASW846 8260BBenzene ND ug/L 1.0 3/2/17 13:13 DD ASW846 8260BBromochloromethane ND ug/L 1.0 3/2/17 13:13 DD ASW846 8260BBromodichloromethane ND ug/L 1.0 3/2/17 13:13 DD ASW846 8260BBromoform ND ug/L 1.0 3/2/17 13:13 DD ASW846 8260BBromomethane 1.2 ug/L 1.0 3/2/17 13:13 DD ASW846 8260B2-Butanone ND ug/L 10.0 3/2/17 13:13 DD ASW846 8260Btert-Butyl Alcohol 2980 ug/L 200 3/3/17 16:35 DD ASW846 8260BCarbon Disulfide ND ug/L 1.0 3/2/17 13:13 DD ASW846 8260BCarbon Tetrachloride ND ug/L 1.0 3/2/17 13:13 DD ASW846 8260BChlorobenzene ND ug/L 1.0 3/2/17 13:13 DD ASW846 8260BChlorodibromomethane ND ug/L 1.0 3/2/17 13:13 DD ASW846 8260BChloroethane ND ug/L 1.0 3/2/17 13:13 DD ASW846 8260BChloroform ND ug/L 1.0 3/2/17 13:13 DD ASW846 8260BChloromethane ND ug/L 1.0 3/2/17 13:13 DD ASW846 8260BCyclohexane ND ug/L 1.0 3/2/17 13:13 DD ASW846 8260B1,2-Dibromo-3-chloropropane
ND ug/L 7.0 3/2/17 13:13 DD ASW846 8260B
1,2-Dibromoethane ND ug/L 1.0 3/2/17 13:13 DD ASW846 8260B1,2-Dichlorobenzene ND ug/L 1.0 3/2/17 13:13 DD ASW846 8260B1,3-Dichlorobenzene ND ug/L 1.0 3/2/17 13:13 DD ASW846 8260B1,4-Dichlorobenzene ND ug/L 1.0 3/2/17 13:13 DD ASW846 8260BDichlorodifluoromethane ND ug/L 1.0 3/2/17 13:13 DD ASW846 8260B1,1-Dichloroethane ND ug/L 1.0 3/2/17 13:13 DD ASW846 8260B1,2-Dichloroethane ND ug/L 1.0 3/2/17 13:13 DD ASW846 8260B1,1-Dichloroethene ND ug/L 1.0 3/2/17 13:13 DD ASW846 8260Bcis-1,2-Dichloroethene ND ug/L 1.0 3/2/17 13:13 DD ASW846 8260Btrans-1,2-Dichloroethene ND ug/L 1.0 3/2/17 13:13 DD ASW846 8260B1,2-Dichloropropane ND ug/L 1.0 3/2/17 13:13 DD ASW846 8260Bcis-1,3-Dichloropropene ND ug/L 1.0 3/2/17 13:13 DD ASW846 8260Btrans-1,3-Dichloropropene ND ug/L 1.0 3/2/17 13:13 DD ASW846 8260BDiisopropyl ether ND ug/L 1.0 3/2/17 13:13 DD ASW846 8260B1,4-Dioxane ND ug/L 320 3/2/17 13:13 DD ASW846 8260BEthylbenzene ND ug/L 1.0 3/2/17 13:13 DD ASW846 8260BFreon 113 ND ug/L 1.0 3/2/17 13:13 DD ASW846 8260B2-Hexanone ND ug/L 5.0 3/2/17 13:13 DD ASW846 8260B
NELAP Certifications: NJ PA010 , NY 11759 , PA 22-293 DoD ELAP: A2LA 0818.01State Certifications: DE ID 11 , MA PA0102 , MD 128 , VA 460157 , WV 343
DL ID - 46465, QC - 0
Report ID: 2211841 - 3/9/2017 Page 14 of 26
Workorder: 2211841 GVG SPRING/170167M-MD SITE
ANALYTICAL RESULTS
3/1/2017 21:30MW-5
Matrix: Ground Water
Parameters
Lab ID:
Sample ID:
2211841003
Results Units RDL Prepared By ByAnalyzedFlag
Date Collected:
Date Received:
3/1/2017 09:56
CntrMethod
Isopropylbenzene ND ug/L 1.0 3/2/17 13:13 DD ASW846 8260BMethyl acetate ND ug/L 2.0 3/2/17 13:13 DD ASW846 8260BMethyl cyclohexane ND ug/L 1.0 3/2/17 13:13 DD ASW846 8260BMethyl t-Butyl Ether 2000 ug/L 20.0 3/3/17 16:35 DD ASW846 8260B4-Methyl-2-Pentanone(MIBK)
ND ug/L 5.0 3/2/17 13:13 DD ASW846 8260B
Methylene Chloride ND ug/L 1.0 3/2/17 13:13 DD ASW846 8260BNaphthalene ND ug/L 2.0 3/2/17 13:13 DD ASW846 8260BStyrene ND ug/L 1.0 3/2/17 13:13 DD ASW846 8260B1,1,2,2-Tetrachloroethane ND ug/L 1.0 3/2/17 13:13 DD ASW846 8260BTetrachloroethene ND ug/L 1.0 3/2/17 13:13 DD ASW846 8260BToluene ND ug/L 1.0 3/2/17 13:13 DD ASW846 8260BTotal Xylenes ND ug/L 3.0 3/2/17 13:13 DD ASW846 8260B1,2,3-Trichlorobenzene ND ug/L 2.0 3/2/17 13:13 DD ASW846 8260B1,2,4-Trichlorobenzene ND ug/L 2.0 3/2/17 13:13 DD ASW846 8260B1,1,1-Trichloroethane ND ug/L 1.0 3/2/17 13:13 DD ASW846 8260B1,1,2-Trichloroethane ND ug/L 1.0 3/2/17 13:13 DD ASW846 8260BTrichloroethene ND ug/L 1.0 3/2/17 13:13 DD ASW846 8260BTrichlorofluoromethane ND ug/L 1.0 3/2/17 13:13 DD ASW846 8260BVinyl Chloride ND ug/L 1.0 3/2/17 13:13 DD ASW846 8260Bo-Xylene ND ug/L 1.0 3/2/17 13:13 DD ASW846 8260Bmp-Xylene ND ug/L 2.0 3/2/17 13:13 DD ASW846 8260B
Surrogate Recoveries Flag UnitsResults Limits Prepared By Analyzed By CntrMethod
1,2-Dichloroethane-d4 (S) 87.5 % 62 - 133 3/2/17 13:13 DD ASW846 8260B1,2-Dichloroethane-d4 (S) 91.4 % 62 - 133 3/3/17 16:35 DD ASW846 8260B4-Bromofluorobenzene (S) 86.3 % 79 - 114 3/2/17 13:13 DD ASW846 8260B4-Bromofluorobenzene (S) 85.5 % 79 - 114 3/3/17 16:35 DD ASW846 8260BDibromofluoromethane (S) 79.5 % 78 - 116 3/2/17 13:13 DD ASW846 8260BDibromofluoromethane (S) 87.5 % 78 - 116 3/3/17 16:35 DD ASW846 8260BToluene-d8 (S) 88 % 76 - 127 3/2/17 13:13 DD ASW846 8260BToluene-d8 (S) 91 % 76 - 127 3/3/17 16:35 DD ASW846 8260B
Project CoordinatorMs. Susan J Scherer
NELAP Certifications: NJ PA010 , NY 11759 , PA 22-293 DoD ELAP: A2LA 0818.01State Certifications: DE ID 11 , MA PA0102 , MD 128 , VA 460157 , WV 343
DL ID - 46465, QC - 0

Report ID: 2211841 - 3/9/2017 Page 15 of 26
Workorder: 2211841 GVG SPRING/170167M-MD SITE
ANALYTICAL RESULTS
3/1/2017 21:30MW-6
Matrix: Ground Water
Parameters
Lab ID:
Sample ID:
2211841004
Results Units RDL Prepared By ByAnalyzedFlag
Date Collected:
Date Received:
3/1/2017 10:37
CntrMethod
VOLATILE ORGANICSAcetone ND ug/L 10.0 3/2/17 12:51 DD ASW846 8260Btert-Amyl methyl ether 161 ug/L 20.0 3/3/17 16:13 DD ASW846 8260BBenzene ND ug/L 1.0 3/2/17 12:51 DD ASW846 8260BBromochloromethane ND ug/L 1.0 3/2/17 12:51 DD ASW846 8260BBromodichloromethane ND ug/L 1.0 3/2/17 12:51 DD ASW846 8260BBromoform ND ug/L 1.0 3/2/17 12:51 DD ASW846 8260BBromomethane ND ug/L 1.0 3/2/17 12:51 DD ASW846 8260B2-Butanone ND ug/L 10.0 3/2/17 12:51 DD ASW846 8260Btert-Butyl Alcohol 1060 ug/L 200 3/3/17 16:13 DD ASW846 8260BCarbon Disulfide ND ug/L 1.0 3/2/17 12:51 DD ASW846 8260BCarbon Tetrachloride ND ug/L 1.0 3/2/17 12:51 DD ASW846 8260BChlorobenzene ND ug/L 1.0 3/2/17 12:51 DD ASW846 8260BChlorodibromomethane ND ug/L 1.0 3/2/17 12:51 DD ASW846 8260BChloroethane ND ug/L 1.0 3/2/17 12:51 DD ASW846 8260BChloroform ND ug/L 1.0 3/2/17 12:51 DD ASW846 8260BChloromethane ND ug/L 1.0 3/2/17 12:51 DD ASW846 8260BCyclohexane ND ug/L 1.0 3/2/17 12:51 DD ASW846 8260B1,2-Dibromo-3-chloropropane
ND ug/L 7.0 3/2/17 12:51 DD ASW846 8260B
1,2-Dibromoethane ND ug/L 1.0 3/2/17 12:51 DD ASW846 8260B1,2-Dichlorobenzene ND ug/L 1.0 3/2/17 12:51 DD ASW846 8260B1,3-Dichlorobenzene ND ug/L 1.0 3/2/17 12:51 DD ASW846 8260B1,4-Dichlorobenzene ND ug/L 1.0 3/2/17 12:51 DD ASW846 8260BDichlorodifluoromethane ND ug/L 1.0 3/2/17 12:51 DD ASW846 8260B1,1-Dichloroethane ND ug/L 1.0 3/2/17 12:51 DD ASW846 8260B1,2-Dichloroethane ND ug/L 1.0 3/2/17 12:51 DD ASW846 8260B1,1-Dichloroethene ND ug/L 1.0 3/2/17 12:51 DD ASW846 8260Bcis-1,2-Dichloroethene ND ug/L 1.0 3/2/17 12:51 DD ASW846 8260Btrans-1,2-Dichloroethene ND ug/L 1.0 3/2/17 12:51 DD ASW846 8260B1,2-Dichloropropane ND ug/L 1.0 3/2/17 12:51 DD ASW846 8260Bcis-1,3-Dichloropropene ND ug/L 1.0 3/2/17 12:51 DD ASW846 8260Btrans-1,3-Dichloropropene ND ug/L 1.0 3/2/17 12:51 DD ASW846 8260BDiisopropyl ether ND ug/L 1.0 3/2/17 12:51 DD ASW846 8260B1,4-Dioxane ND ug/L 320 3/2/17 12:51 DD ASW846 8260BEthylbenzene ND ug/L 1.0 3/2/17 12:51 DD ASW846 8260BFreon 113 ND ug/L 1.0 3/2/17 12:51 DD ASW846 8260B2-Hexanone ND ug/L 5.0 3/2/17 12:51 DD ASW846 8260B
NELAP Certifications: NJ PA010 , NY 11759 , PA 22-293 DoD ELAP: A2LA 0818.01State Certifications: DE ID 11 , MA PA0102 , MD 128 , VA 460157 , WV 343
DL ID - 46465, QC - 0

Report ID: 2211841 - 3/9/2017 Page 16 of 26
Workorder: 2211841 GVG SPRING/170167M-MD SITE
ANALYTICAL RESULTS
3/1/2017 21:30MW-6
Matrix: Ground Water
Parameters
Lab ID:
Sample ID:
2211841004
Results Units RDL Prepared By ByAnalyzedFlag
Date Collected:
Date Received:
3/1/2017 10:37
CntrMethod
Isopropylbenzene ND ug/L 1.0 3/2/17 12:51 DD ASW846 8260BMethyl acetate ND ug/L 2.0 3/2/17 12:51 DD ASW846 8260BMethyl cyclohexane ND ug/L 1.0 3/2/17 12:51 DD ASW846 8260BMethyl t-Butyl Ether 740 ug/L 20.0 3/3/17 16:13 DD ASW846 8260B4-Methyl-2-Pentanone(MIBK)
ND ug/L 5.0 3/2/17 12:51 DD ASW846 8260B
Methylene Chloride ND ug/L 1.0 3/2/17 12:51 DD ASW846 8260BNaphthalene ND ug/L 2.0 3/2/17 12:51 DD ASW846 8260BStyrene ND ug/L 1.0 3/2/17 12:51 DD ASW846 8260B1,1,2,2-Tetrachloroethane ND ug/L 1.0 3/2/17 12:51 DD ASW846 8260BTetrachloroethene ND ug/L 1.0 3/2/17 12:51 DD ASW846 8260BToluene ND ug/L 1.0 3/2/17 12:51 DD ASW846 8260BTotal Xylenes ND ug/L 3.0 3/2/17 12:51 DD ASW846 8260B1,2,3-Trichlorobenzene ND ug/L 2.0 3/2/17 12:51 DD ASW846 8260B1,2,4-Trichlorobenzene ND ug/L 2.0 3/2/17 12:51 DD ASW846 8260B1,1,1-Trichloroethane ND ug/L 1.0 3/2/17 12:51 DD ASW846 8260B1,1,2-Trichloroethane ND ug/L 1.0 3/2/17 12:51 DD ASW846 8260BTrichloroethene ND ug/L 1.0 3/2/17 12:51 DD ASW846 8260BTrichlorofluoromethane ND ug/L 1.0 3/2/17 12:51 DD ASW846 8260BVinyl Chloride ND ug/L 1.0 3/2/17 12:51 DD ASW846 8260Bo-Xylene ND ug/L 1.0 3/2/17 12:51 DD ASW846 8260Bmp-Xylene ND ug/L 2.0 3/2/17 12:51 DD ASW846 8260B
Surrogate Recoveries Flag UnitsResults Limits Prepared By Analyzed By CntrMethod
1,2-Dichloroethane-d4 (S) 92.9 % 62 - 133 3/3/17 16:13 DD ASW846 8260B1,2-Dichloroethane-d4 (S) 85.6 % 62 - 133 3/2/17 12:51 DD ASW846 8260B4-Bromofluorobenzene (S) 85.9 % 79 - 114 3/3/17 16:13 DD ASW846 8260B4-Bromofluorobenzene (S) 84.7 % 79 - 114 3/2/17 12:51 DD ASW846 8260BDibromofluoromethane (S) 88.2 % 78 - 116 3/3/17 16:13 DD ASW846 8260BDibromofluoromethane (S) 78.2 % 78 - 116 3/2/17 12:51 DD ASW846 8260BToluene-d8 (S) 88.2 % 76 - 127 3/3/17 16:13 DD ASW846 8260BToluene-d8 (S) 86 % 76 - 127 3/2/17 12:51 DD ASW846 8260B
Project CoordinatorMs. Susan J Scherer
NELAP Certifications: NJ PA010 , NY 11759 , PA 22-293 DoD ELAP: A2LA 0818.01State Certifications: DE ID 11 , MA PA0102 , MD 128 , VA 460157 , WV 343
DL ID - 46465, QC - 0

Report ID: 2211841 - 3/9/2017 Page 17 of 26
Workorder: 2211841 GVG SPRING/170167M-MD SITE
ANALYTICAL RESULTS
3/1/2017 21:30MW-4
Matrix: Ground Water
Parameters
Lab ID:
Sample ID:
2211841005
Results Units RDL Prepared By ByAnalyzedFlag
Date Collected:
Date Received:
3/1/2017 11:53
CntrMethod
VOLATILE ORGANICSAcetone ND ug/L 10.0 3/2/17 12:29 DD ASW846 8260Btert-Amyl methyl ether 432 ug/L 20.0 3/3/17 15:51 DD ASW846 8260BBenzene 1.3 ug/L 1.0 3/2/17 12:29 DD ASW846 8260BBromochloromethane ND ug/L 1.0 3/2/17 12:29 DD ASW846 8260BBromodichloromethane ND ug/L 1.0 3/2/17 12:29 DD ASW846 8260BBromoform ND ug/L 1.0 3/2/17 12:29 DD ASW846 8260BBromomethane ND ug/L 1.0 3/2/17 12:29 DD ASW846 8260B2-Butanone ND ug/L 10.0 3/2/17 12:29 DD ASW846 8260Btert-Butyl Alcohol 3400 ug/L 200 3/3/17 15:51 DD ASW846 8260BCarbon Disulfide ND ug/L 1.0 3/2/17 12:29 DD ASW846 8260BCarbon Tetrachloride ND ug/L 1.0 3/2/17 12:29 DD ASW846 8260BChlorobenzene ND ug/L 1.0 3/2/17 12:29 DD ASW846 8260BChlorodibromomethane ND ug/L 1.0 3/2/17 12:29 DD ASW846 8260BChloroethane ND ug/L 1.0 3/2/17 12:29 DD ASW846 8260BChloroform ND ug/L 1.0 3/2/17 12:29 DD ASW846 8260BChloromethane ND ug/L 1.0 3/2/17 12:29 DD ASW846 8260BCyclohexane ND ug/L 1.0 3/2/17 12:29 DD ASW846 8260B1,2-Dibromo-3-chloropropane
ND ug/L 7.0 3/2/17 12:29 DD ASW846 8260B
1,2-Dibromoethane ND ug/L 1.0 3/2/17 12:29 DD ASW846 8260B1,2-Dichlorobenzene ND ug/L 1.0 3/2/17 12:29 DD ASW846 8260B1,3-Dichlorobenzene ND ug/L 1.0 3/2/17 12:29 DD ASW846 8260B1,4-Dichlorobenzene ND ug/L 1.0 3/2/17 12:29 DD ASW846 8260BDichlorodifluoromethane ND ug/L 1.0 3/2/17 12:29 DD ASW846 8260B1,1-Dichloroethane ND ug/L 1.0 3/2/17 12:29 DD ASW846 8260B1,2-Dichloroethane ND ug/L 1.0 3/2/17 12:29 DD ASW846 8260B1,1-Dichloroethene ND ug/L 1.0 3/2/17 12:29 DD ASW846 8260Bcis-1,2-Dichloroethene ND ug/L 1.0 3/2/17 12:29 DD ASW846 8260Btrans-1,2-Dichloroethene ND ug/L 1.0 3/2/17 12:29 DD ASW846 8260B1,2-Dichloropropane ND ug/L 1.0 3/2/17 12:29 DD ASW846 8260Bcis-1,3-Dichloropropene ND ug/L 1.0 3/2/17 12:29 DD ASW846 8260Btrans-1,3-Dichloropropene ND ug/L 1.0 3/2/17 12:29 DD ASW846 8260BDiisopropyl ether ND ug/L 1.0 3/2/17 12:29 DD ASW846 8260B1,4-Dioxane ND ug/L 320 3/2/17 12:29 DD ASW846 8260BEthylbenzene ND ug/L 1.0 3/2/17 12:29 DD ASW846 8260BFreon 113 ND ug/L 1.0 3/2/17 12:29 DD ASW846 8260B2-Hexanone ND ug/L 5.0 3/2/17 12:29 DD ASW846 8260B
NELAP Certifications: NJ PA010 , NY 11759 , PA 22-293 DoD ELAP: A2LA 0818.01State Certifications: DE ID 11 , MA PA0102 , MD 128 , VA 460157 , WV 343
DL ID - 46465, QC - 0

Report ID: 2211841 - 3/9/2017 Page 18 of 26
Workorder: 2211841 GVG SPRING/170167M-MD SITE
ANALYTICAL RESULTS
3/1/2017 21:30MW-4
Matrix: Ground Water
Parameters
Lab ID:
Sample ID:
2211841005
Results Units RDL Prepared By ByAnalyzedFlag
Date Collected:
Date Received:
3/1/2017 11:53
CntrMethod
Isopropylbenzene ND ug/L 1.0 3/2/17 12:29 DD ASW846 8260BMethyl acetate ND ug/L 2.0 3/2/17 12:29 DD ASW846 8260BMethyl cyclohexane ND ug/L 1.0 3/2/17 12:29 DD ASW846 8260BMethyl t-Butyl Ether 1990 ug/L 20.0 3/3/17 15:51 DD ASW846 8260B4-Methyl-2-Pentanone(MIBK)
ND ug/L 5.0 3/2/17 12:29 DD ASW846 8260B
Methylene Chloride ND ug/L 1.0 3/2/17 12:29 DD ASW846 8260BNaphthalene ND ug/L 2.0 3/2/17 12:29 DD ASW846 8260BStyrene ND ug/L 1.0 3/2/17 12:29 DD ASW846 8260B1,1,2,2-Tetrachloroethane ND ug/L 1.0 3/2/17 12:29 DD ASW846 8260BTetrachloroethene ND ug/L 1.0 3/2/17 12:29 DD ASW846 8260BToluene ND ug/L 1.0 3/2/17 12:29 DD ASW846 8260BTotal Xylenes ND ug/L 3.0 3/2/17 12:29 DD ASW846 8260B1,2,3-Trichlorobenzene ND ug/L 2.0 3/2/17 12:29 DD ASW846 8260B1,2,4-Trichlorobenzene ND ug/L 2.0 3/2/17 12:29 DD ASW846 8260B1,1,1-Trichloroethane ND ug/L 1.0 3/2/17 12:29 DD ASW846 8260B1,1,2-Trichloroethane ND ug/L 1.0 3/2/17 12:29 DD ASW846 8260BTrichloroethene ND ug/L 1.0 3/2/17 12:29 DD ASW846 8260BTrichlorofluoromethane ND ug/L 1.0 3/2/17 12:29 DD ASW846 8260BVinyl Chloride ND ug/L 1.0 3/2/17 12:29 DD ASW846 8260Bo-Xylene ND ug/L 1.0 3/2/17 12:29 DD ASW846 8260Bmp-Xylene ND ug/L 2.0 3/2/17 12:29 DD ASW846 8260B
Surrogate Recoveries Flag UnitsResults Limits Prepared By Analyzed By CntrMethod
1,2-Dichloroethane-d4 (S) 85.2 % 62 - 133 3/2/17 12:29 DD ASW846 8260B1,2-Dichloroethane-d4 (S) 93.9 % 62 - 133 3/3/17 15:51 DD ASW846 8260B4-Bromofluorobenzene (S) 84.7 % 79 - 114 3/3/17 15:51 DD ASW846 8260B4-Bromofluorobenzene (S) 84.9 % 79 - 114 3/2/17 12:29 DD ASW846 8260BDibromofluoromethane (S) 87.8 % 78 - 116 3/3/17 15:51 DD ASW846 8260BDibromofluoromethane (S) 76.7 % 78 - 116 3/2/17 12:29 DD ASW846 8260BToluene-d8 (S) 90 % 76 - 127 3/3/17 15:51 DD ASW846 8260BToluene-d8 (S) 84.5 % 76 - 127 3/2/17 12:29 DD ASW846 8260B
Project CoordinatorMs. Susan J Scherer
NELAP Certifications: NJ PA010 , NY 11759 , PA 22-293 DoD ELAP: A2LA 0818.01State Certifications: DE ID 11 , MA PA0102 , MD 128 , VA 460157 , WV 343
DL ID - 46465, QC - 0

Report ID: 2211841 - 3/9/2017 Page 19 of 26
Workorder: 2211841 GVG SPRING/170167M-MD SITE
ANALYTICAL RESULTS
3/1/2017 21:30MW-1
Matrix: Ground Water
Parameters
Lab ID:
Sample ID:
2211841006
Results Units RDL Prepared By ByAnalyzedFlag
Date Collected:
Date Received:
3/1/2017 12:38
CntrMethod
VOLATILE ORGANICSAcetone ND ug/L 10.0 3/2/17 11:46 DD ASW846 8260Btert-Amyl methyl ether 107 ug/L 1.0 3/2/17 11:46 DD ASW846 8260BBenzene ND ug/L 1.0 3/2/17 11:46 DD ASW846 8260BBromochloromethane ND ug/L 1.0 3/2/17 11:46 DD ASW846 8260BBromodichloromethane ND ug/L 1.0 3/2/17 11:46 DD ASW846 8260BBromoform ND ug/L 1.0 3/2/17 11:46 DD ASW846 8260BBromomethane ND ug/L 1.0 3/2/17 11:46 DD ASW846 8260B2-Butanone ND ug/L 10.0 3/2/17 11:46 DD ASW846 8260Btert-Butyl Alcohol 32.7 ug/L 10.0 3/2/17 11:46 DD ASW846 8260BCarbon Disulfide ND ug/L 1.0 3/2/17 11:46 DD ASW846 8260BCarbon Tetrachloride ND ug/L 1.0 3/2/17 11:46 DD ASW846 8260BChlorobenzene ND ug/L 1.0 3/2/17 11:46 DD ASW846 8260BChlorodibromomethane ND ug/L 1.0 3/2/17 11:46 DD ASW846 8260BChloroethane ND ug/L 1.0 3/2/17 11:46 DD ASW846 8260BChloroform ND ug/L 1.0 3/2/17 11:46 DD ASW846 8260BChloromethane ND ug/L 1.0 3/2/17 11:46 DD ASW846 8260BCyclohexane ND ug/L 1.0 3/2/17 11:46 DD ASW846 8260B1,2-Dibromo-3-chloropropane
ND ug/L 7.0 3/2/17 11:46 DD ASW846 8260B
1,2-Dibromoethane ND ug/L 1.0 3/2/17 11:46 DD ASW846 8260B1,2-Dichlorobenzene ND ug/L 1.0 3/2/17 11:46 DD ASW846 8260B1,3-Dichlorobenzene ND ug/L 1.0 3/2/17 11:46 DD ASW846 8260B1,4-Dichlorobenzene ND ug/L 1.0 3/2/17 11:46 DD ASW846 8260BDichlorodifluoromethane ND ug/L 1.0 3/2/17 11:46 DD ASW846 8260B1,1-Dichloroethane ND ug/L 1.0 3/2/17 11:46 DD ASW846 8260B1,2-Dichloroethane ND ug/L 1.0 3/2/17 11:46 DD ASW846 8260B1,1-Dichloroethene ND ug/L 1.0 3/2/17 11:46 DD ASW846 8260Bcis-1,2-Dichloroethene ND ug/L 1.0 3/2/17 11:46 DD ASW846 8260Btrans-1,2-Dichloroethene ND ug/L 1.0 3/2/17 11:46 DD ASW846 8260B1,2-Dichloropropane ND ug/L 1.0 3/2/17 11:46 DD ASW846 8260Bcis-1,3-Dichloropropene ND ug/L 1.0 3/2/17 11:46 DD ASW846 8260Btrans-1,3-Dichloropropene ND ug/L 1.0 3/2/17 11:46 DD ASW846 8260BDiisopropyl ether ND ug/L 1.0 3/2/17 11:46 DD ASW846 8260B1,4-Dioxane ND ug/L 320 3/2/17 11:46 DD ASW846 8260BEthylbenzene ND ug/L 1.0 3/2/17 11:46 DD ASW846 8260BFreon 113 ND ug/L 1.0 3/2/17 11:46 DD ASW846 8260B2-Hexanone ND ug/L 5.0 3/2/17 11:46 DD ASW846 8260B
NELAP Certifications: NJ PA010 , NY 11759 , PA 22-293 DoD ELAP: A2LA 0818.01State Certifications: DE ID 11 , MA PA0102 , MD 128 , VA 460157 , WV 343
DL ID - 46465, QC - 0

Report ID: 2211841 - 3/9/2017 Page 20 of 26
Workorder: 2211841 GVG SPRING/170167M-MD SITE
ANALYTICAL RESULTS
3/1/2017 21:30MW-1
Matrix: Ground Water
Parameters
Lab ID:
Sample ID:
2211841006
Results Units RDL Prepared By ByAnalyzedFlag
Date Collected:
Date Received:
3/1/2017 12:38
CntrMethod
Isopropylbenzene ND ug/L 1.0 3/2/17 11:46 DD ASW846 8260BMethyl acetate ND ug/L 2.0 3/2/17 11:46 DD ASW846 8260BMethyl cyclohexane ND ug/L 1.0 3/2/17 11:46 DD ASW846 8260BMethyl t-Butyl Ether 304 ug/L 5.0 3/3/17 17:19 DD ASW846 8260B4-Methyl-2-Pentanone(MIBK)
ND ug/L 5.0 3/2/17 11:46 DD ASW846 8260B
Methylene Chloride ND ug/L 1.0 3/2/17 11:46 DD ASW846 8260BNaphthalene ND ug/L 2.0 3/2/17 11:46 DD ASW846 8260BStyrene ND ug/L 1.0 3/2/17 11:46 DD ASW846 8260B1,1,2,2-Tetrachloroethane ND ug/L 1.0 3/2/17 11:46 DD ASW846 8260BTetrachloroethene ND ug/L 1.0 3/2/17 11:46 DD ASW846 8260BToluene ND ug/L 1.0 3/2/17 11:46 DD ASW846 8260BTotal Xylenes ND ug/L 3.0 3/2/17 11:46 DD ASW846 8260B1,2,3-Trichlorobenzene ND ug/L 2.0 3/2/17 11:46 DD ASW846 8260B1,2,4-Trichlorobenzene ND ug/L 2.0 3/2/17 11:46 DD ASW846 8260B1,1,1-Trichloroethane ND ug/L 1.0 3/2/17 11:46 DD ASW846 8260B1,1,2-Trichloroethane ND ug/L 1.0 3/2/17 11:46 DD ASW846 8260BTrichloroethene ND ug/L 1.0 3/2/17 11:46 DD ASW846 8260BTrichlorofluoromethane ND ug/L 1.0 3/2/17 11:46 DD ASW846 8260BVinyl Chloride ND ug/L 1.0 3/2/17 11:46 DD ASW846 8260Bo-Xylene ND ug/L 1.0 3/2/17 11:46 DD ASW846 8260Bmp-Xylene ND ug/L 2.0 3/2/17 11:46 DD ASW846 8260B
Surrogate Recoveries Flag UnitsResults Limits Prepared By Analyzed By CntrMethod
1,2-Dichloroethane-d4 (S) 96 % 62 - 133 3/3/17 17:19 DD ASW846 8260B1,2-Dichloroethane-d4 (S) 86.1 % 62 - 133 3/2/17 11:46 DD ASW846 8260B4-Bromofluorobenzene (S) 83.7 % 79 - 114 3/3/17 17:19 DD ASW846 8260B4-Bromofluorobenzene (S) 87.6 % 79 - 114 3/2/17 11:46 DD ASW846 8260BDibromofluoromethane (S) 87.8 % 78 - 116 3/3/17 17:19 DD ASW846 8260BDibromofluoromethane (S) 81.2 % 78 - 116 3/2/17 11:46 DD ASW846 8260BToluene-d8 (S) 89.3 % 76 - 127 3/3/17 17:19 DD ASW846 8260BToluene-d8 (S) 85.9 % 76 - 127 3/2/17 11:46 DD ASW846 8260B
Project CoordinatorMs. Susan J Scherer
NELAP Certifications: NJ PA010 , NY 11759 , PA 22-293 DoD ELAP: A2LA 0818.01State Certifications: DE ID 11 , MA PA0102 , MD 128 , VA 460157 , WV 343
DL ID - 46465, QC - 0

Report ID: 2211841 - 3/9/2017 Page 21 of 26
Workorder: 2211841 GVG SPRING/170167M-MD SITE
ANALYTICAL RESULTS
3/1/2017 21:30DSW
Matrix: Ground Water
Parameters
Lab ID:
Sample ID:
2211841007
Results Units RDL Prepared By ByAnalyzedFlag
Date Collected:
Date Received:
3/1/2017 13:07
CntrMethod
VOLATILE ORGANICSAcetone ND ug/L 10.0 3/2/17 12:08 DD ASW846 8260Btert-Amyl methyl ether 51.1 ug/L 1.0 3/2/17 12:08 DD ASW846 8260BBenzene ND ug/L 1.0 3/2/17 12:08 DD ASW846 8260BBromochloromethane ND ug/L 1.0 3/2/17 12:08 DD ASW846 8260BBromodichloromethane ND ug/L 1.0 3/2/17 12:08 DD ASW846 8260BBromoform ND ug/L 1.0 3/2/17 12:08 DD ASW846 8260BBromomethane ND ug/L 1.0 3/2/17 12:08 DD ASW846 8260B2-Butanone ND ug/L 10.0 3/2/17 12:08 DD ASW846 8260Btert-Butyl Alcohol 167 ug/L 10.0 3/2/17 12:08 DD ASW846 8260BCarbon Disulfide ND ug/L 1.0 3/2/17 12:08 DD ASW846 8260BCarbon Tetrachloride ND ug/L 1.0 3/2/17 12:08 DD ASW846 8260BChlorobenzene ND ug/L 1.0 3/2/17 12:08 DD ASW846 8260BChlorodibromomethane ND ug/L 1.0 3/2/17 12:08 DD ASW846 8260BChloroethane ND ug/L 1.0 3/2/17 12:08 DD ASW846 8260BChloroform ND ug/L 1.0 3/2/17 12:08 DD ASW846 8260BChloromethane ND ug/L 1.0 3/2/17 12:08 DD ASW846 8260BCyclohexane ND ug/L 1.0 3/2/17 12:08 DD ASW846 8260B1,2-Dibromo-3-chloropropane
ND ug/L 7.0 3/2/17 12:08 DD ASW846 8260B
1,2-Dibromoethane ND ug/L 1.0 3/2/17 12:08 DD ASW846 8260B1,2-Dichlorobenzene ND ug/L 1.0 3/2/17 12:08 DD ASW846 8260B1,3-Dichlorobenzene ND ug/L 1.0 3/2/17 12:08 DD ASW846 8260B1,4-Dichlorobenzene ND ug/L 1.0 3/2/17 12:08 DD ASW846 8260BDichlorodifluoromethane ND ug/L 1.0 3/2/17 12:08 DD ASW846 8260B1,1-Dichloroethane ND ug/L 1.0 3/2/17 12:08 DD ASW846 8260B1,2-Dichloroethane ND ug/L 1.0 3/2/17 12:08 DD ASW846 8260B1,1-Dichloroethene ND ug/L 1.0 3/2/17 12:08 DD ASW846 8260Bcis-1,2-Dichloroethene ND ug/L 1.0 3/2/17 12:08 DD ASW846 8260Btrans-1,2-Dichloroethene ND ug/L 1.0 3/2/17 12:08 DD ASW846 8260B1,2-Dichloropropane ND ug/L 1.0 3/2/17 12:08 DD ASW846 8260Bcis-1,3-Dichloropropene ND ug/L 1.0 3/2/17 12:08 DD ASW846 8260Btrans-1,3-Dichloropropene ND ug/L 1.0 3/2/17 12:08 DD ASW846 8260BDiisopropyl ether 2.0 ug/L 1.0 3/2/17 12:08 DD ASW846 8260B1,4-Dioxane ND ug/L 320 3/2/17 12:08 DD ASW846 8260BEthylbenzene ND ug/L 1.0 3/2/17 12:08 DD ASW846 8260BFreon 113 ND ug/L 1.0 3/2/17 12:08 DD ASW846 8260B2-Hexanone ND ug/L 5.0 3/2/17 12:08 DD ASW846 8260B
NELAP Certifications: NJ PA010 , NY 11759 , PA 22-293 DoD ELAP: A2LA 0818.01State Certifications: DE ID 11 , MA PA0102 , MD 128 , VA 460157 , WV 343
DL ID - 46465, QC - 0

Report ID: 2211841 - 3/9/2017 Page 22 of 26
Workorder: 2211841 GVG SPRING/170167M-MD SITE
ANALYTICAL RESULTS
3/1/2017 21:30DSW
Matrix: Ground Water
Parameters
Lab ID:
Sample ID:
2211841007
Results Units RDL Prepared By ByAnalyzedFlag
Date Collected:
Date Received:
3/1/2017 13:07
CntrMethod
Isopropylbenzene ND ug/L 1.0 3/2/17 12:08 DD ASW846 8260BMethyl acetate ND ug/L 2.0 3/2/17 12:08 DD ASW846 8260BMethyl cyclohexane ND ug/L 1.0 3/2/17 12:08 DD ASW846 8260BMethyl t-Butyl Ether 213 ug/L 5.0 3/3/17 16:57 DD ASW846 8260B4-Methyl-2-Pentanone(MIBK)
ND ug/L 5.0 3/2/17 12:08 DD ASW846 8260B
Methylene Chloride ND ug/L 1.0 3/2/17 12:08 DD ASW846 8260BNaphthalene ND ug/L 2.0 3/2/17 12:08 DD ASW846 8260BStyrene ND ug/L 1.0 3/2/17 12:08 DD ASW846 8260B1,1,2,2-Tetrachloroethane ND ug/L 1.0 3/2/17 12:08 DD ASW846 8260BTetrachloroethene ND ug/L 1.0 3/2/17 12:08 DD ASW846 8260BToluene ND ug/L 1.0 3/2/17 12:08 DD ASW846 8260BTotal Xylenes ND ug/L 3.0 3/2/17 12:08 DD ASW846 8260B1,2,3-Trichlorobenzene ND ug/L 2.0 3/2/17 12:08 DD ASW846 8260B1,2,4-Trichlorobenzene ND ug/L 2.0 3/2/17 12:08 DD ASW846 8260B1,1,1-Trichloroethane ND ug/L 1.0 3/2/17 12:08 DD ASW846 8260B1,1,2-Trichloroethane ND ug/L 1.0 3/2/17 12:08 DD ASW846 8260BTrichloroethene ND ug/L 1.0 3/2/17 12:08 DD ASW846 8260BTrichlorofluoromethane ND ug/L 1.0 3/2/17 12:08 DD ASW846 8260BVinyl Chloride ND ug/L 1.0 3/2/17 12:08 DD ASW846 8260Bo-Xylene ND ug/L 1.0 3/2/17 12:08 DD ASW846 8260Bmp-Xylene ND ug/L 2.0 3/2/17 12:08 DD ASW846 8260B
Surrogate Recoveries Flag UnitsResults Limits Prepared By Analyzed By CntrMethod
1,2-Dichloroethane-d4 (S) 94.2 % 62 - 133 3/3/17 16:57 DD ASW846 8260B1,2-Dichloroethane-d4 (S) 86.2 % 62 - 133 3/2/17 12:08 DD ASW846 8260B4-Bromofluorobenzene (S) 84.8 % 79 - 114 3/3/17 16:57 DD ASW846 8260B4-Bromofluorobenzene (S) 84.5 % 79 - 114 3/2/17 12:08 DD ASW846 8260BDibromofluoromethane (S) 79.5 % 78 - 116 3/2/17 12:08 DD ASW846 8260BDibromofluoromethane (S) 89.3 % 78 - 116 3/3/17 16:57 DD ASW846 8260BToluene-d8 (S) 85.3 % 76 - 127 3/2/17 12:08 DD ASW846 8260BToluene-d8 (S) 87.5 % 76 - 127 3/3/17 16:57 DD ASW846 8260B
Project CoordinatorMs. Susan J Scherer
NELAP Certifications: NJ PA010 , NY 11759 , PA 22-293 DoD ELAP: A2LA 0818.01State Certifications: DE ID 11 , MA PA0102 , MD 128 , VA 460157 , WV 343
DL ID - 46465, QC - 0

Report ID: 2211841 - 3/9/2017 Page 23 of 26
Workorder: 2211841 GVG SPRING/170167M-MD SITE
ANALYTICAL RESULTS
3/1/2017 21:30Trip Blank
Matrix: Ground Water
Parameters
Lab ID:
Sample ID:
2211841008
Results Units RDL Prepared By ByAnalyzedFlag
Date Collected:
Date Received:
3/1/2017 00:00
CntrMethod
VOLATILE ORGANICSAcetone ND ug/L 10.0 3/2/17 10:40 DD ASW846 8260Btert-Amyl methyl ether ND ug/L 1.0 3/2/17 10:40 DD ASW846 8260BBenzene ND ug/L 1.0 3/2/17 10:40 DD ASW846 8260BBromochloromethane ND ug/L 1.0 3/2/17 10:40 DD ASW846 8260BBromodichloromethane ND ug/L 1.0 3/2/17 10:40 DD ASW846 8260BBromoform ND ug/L 1.0 3/2/17 10:40 DD ASW846 8260BBromomethane ND ug/L 1.0 3/2/17 10:40 DD ASW846 8260B2-Butanone ND ug/L 10.0 3/2/17 10:40 DD ASW846 8260Btert-Butyl Alcohol ND ug/L 10.0 3/2/17 10:40 DD ASW846 8260BCarbon Disulfide ND ug/L 1.0 3/2/17 10:40 DD ASW846 8260BCarbon Tetrachloride ND ug/L 1.0 3/2/17 10:40 DD ASW846 8260BChlorobenzene ND ug/L 1.0 3/2/17 10:40 DD ASW846 8260BChlorodibromomethane ND ug/L 1.0 3/2/17 10:40 DD ASW846 8260BChloroethane ND ug/L 1.0 3/2/17 10:40 DD ASW846 8260BChloroform ND ug/L 1.0 3/2/17 10:40 DD ASW846 8260BChloromethane ND ug/L 1.0 3/2/17 10:40 DD ASW846 8260BCyclohexane ND ug/L 1.0 3/2/17 10:40 DD ASW846 8260B1,2-Dibromo-3-chloropropane
ND ug/L 7.0 3/2/17 10:40 DD ASW846 8260B
1,2-Dibromoethane ND ug/L 1.0 3/2/17 10:40 DD ASW846 8260B1,2-Dichlorobenzene ND ug/L 1.0 3/2/17 10:40 DD ASW846 8260B1,3-Dichlorobenzene ND ug/L 1.0 3/2/17 10:40 DD ASW846 8260B1,4-Dichlorobenzene ND ug/L 1.0 3/2/17 10:40 DD ASW846 8260BDichlorodifluoromethane ND ug/L 1.0 3/2/17 10:40 DD ASW846 8260B1,1-Dichloroethane ND ug/L 1.0 3/2/17 10:40 DD ASW846 8260B1,2-Dichloroethane ND ug/L 1.0 3/2/17 10:40 DD ASW846 8260B1,1-Dichloroethene ND ug/L 1.0 3/2/17 10:40 DD ASW846 8260Bcis-1,2-Dichloroethene ND ug/L 1.0 3/2/17 10:40 DD ASW846 8260Btrans-1,2-Dichloroethene ND ug/L 1.0 3/2/17 10:40 DD ASW846 8260B1,2-Dichloropropane ND ug/L 1.0 3/2/17 10:40 DD ASW846 8260Bcis-1,3-Dichloropropene ND ug/L 1.0 3/2/17 10:40 DD ASW846 8260Btrans-1,3-Dichloropropene ND ug/L 1.0 3/2/17 10:40 DD ASW846 8260BDiisopropyl ether ND ug/L 1.0 3/2/17 10:40 DD ASW846 8260B1,4-Dioxane ND ug/L 320 3/2/17 10:40 DD ASW846 8260BEthylbenzene ND ug/L 1.0 3/2/17 10:40 DD ASW846 8260BFreon 113 ND ug/L 1.0 3/2/17 10:40 DD ASW846 8260B2-Hexanone ND ug/L 5.0 3/2/17 10:40 DD ASW846 8260B
NELAP Certifications: NJ PA010 , NY 11759 , PA 22-293 DoD ELAP: A2LA 0818.01State Certifications: DE ID 11 , MA PA0102 , MD 128 , VA 460157 , WV 343
DL ID - 46465, QC - 0

Report ID: 2211841 - 3/9/2017 Page 24 of 26
Workorder: 2211841 GVG SPRING/170167M-MD SITE
ANALYTICAL RESULTS
3/1/2017 21:30Trip Blank
Matrix: Ground Water
Parameters
Lab ID:
Sample ID:
2211841008
Results Units RDL Prepared By ByAnalyzedFlag
Date Collected:
Date Received:
3/1/2017 00:00
CntrMethod
Isopropylbenzene ND ug/L 1.0 3/2/17 10:40 DD ASW846 8260BMethyl acetate ND ug/L 2.0 3/2/17 10:40 DD ASW846 8260BMethyl cyclohexane ND ug/L 1.0 3/2/17 10:40 DD ASW846 8260BMethyl t-Butyl Ether ND ug/L 1.0 3/2/17 10:40 DD ASW846 8260B4-Methyl-2-Pentanone(MIBK)
ND ug/L 5.0 3/2/17 10:40 DD ASW846 8260B
Methylene Chloride ND ug/L 1.0 3/2/17 10:40 DD ASW846 8260BNaphthalene ND ug/L 2.0 3/2/17 10:40 DD ASW846 8260BStyrene ND ug/L 1.0 3/2/17 10:40 DD ASW846 8260B1,1,2,2-Tetrachloroethane ND ug/L 1.0 3/2/17 10:40 DD ASW846 8260BTetrachloroethene ND ug/L 1.0 3/2/17 10:40 DD ASW846 8260BToluene ND ug/L 1.0 3/2/17 10:40 DD ASW846 8260BTotal Xylenes ND ug/L 3.0 3/2/17 10:40 DD ASW846 8260B1,2,3-Trichlorobenzene ND ug/L 2.0 3/2/17 10:40 DD ASW846 8260B1,2,4-Trichlorobenzene ND ug/L 2.0 3/2/17 10:40 DD ASW846 8260B1,1,1-Trichloroethane ND ug/L 1.0 3/2/17 10:40 DD ASW846 8260B1,1,2-Trichloroethane ND ug/L 1.0 3/2/17 10:40 DD ASW846 8260BTrichloroethene ND ug/L 1.0 3/2/17 10:40 DD ASW846 8260BTrichlorofluoromethane ND ug/L 1.0 3/2/17 10:40 DD ASW846 8260BVinyl Chloride ND ug/L 1.0 3/2/17 10:40 DD ASW846 8260Bo-Xylene ND ug/L 1.0 3/2/17 10:40 DD ASW846 8260Bmp-Xylene ND ug/L 2.0 3/2/17 10:40 DD ASW846 8260B
Surrogate Recoveries Flag UnitsResults Limits Prepared By Analyzed By CntrMethod
1,2-Dichloroethane-d4 (S) 89.2 % 62 - 133 3/2/17 10:40 DD ASW846 8260B4-Bromofluorobenzene (S) 84.6 % 79 - 114 3/2/17 10:40 DD ASW846 8260BDibromofluoromethane (S) 82 % 78 - 116 3/2/17 10:40 DD ASW846 8260BToluene-d8 (S) 84.1 % 76 - 127 3/2/17 10:40 DD ASW846 8260B
Project CoordinatorMs. Susan J Scherer
NELAP Certifications: NJ PA010 , NY 11759 , PA 22-293 DoD ELAP: A2LA 0818.01State Certifications: DE ID 11 , MA PA0102 , MD 128 , VA 460157 , WV 343
DL ID - 46465, QC - 0

Report ID: 2211841 - 3/9/2017 Page 25 of 26
PARAMETER QUALIFIERS
#Lab ID Analytical MethodSample ID Analyte
1The QC sample type LCS for method EPA 524.2 was outside the control limits for the analyte Bromomethane. The % Recovery was reported as138 and the control limits were 70 to 130.
2211841001 EPA 524.2Effluent Bromomethane
1The QC sample type LCS for method EPA 524.2 was outside the control limits for the analyte Bromomethane. The % Recovery was reported as138 and the control limits were 70 to 130.
2211841002 EPA 524.2Influent Bromomethane
NELAP Certifications: NJ PA010 , NY 11759 , PA 22-293 DoD ELAP: A2LA 0818.01State Certifications: DE ID 11 , MA PA0102 , MD 128 , VA 460157 , WV 343
DL ID - 46465, QC - 0

Page 26 of 26
Thursday, March 09, 2017 6:25:09 PM

Report ID: 2212180 - 3/7/2017 Page 1 of 11
Accounts PayableARM Group, Inc.PO Box 797Hershey, PA 17033
March 7, 2017
Dear Accounts Payable:
Certificate of AnalysisProject Name:Purchase Order:
GVG SPRING/170167M-MD SITE170167M
Workorder:Workorder ID:
2212180GVG SPRING/170167M-MD SITE
CC: Mr. Stewart Kabis , Mr. Eric Magdar
This page is included as part of the Analytical Report andmust be retained as a permanent record thereof. Project Coordinator
Ms. Susan J Scherer
Enclosed are the analytical results for samples received by the laboratory on Thursday, March 2, 2017.
The ALS Environmental laboratory in Middletown, Pennsylvania is a National Environmental LaboratoryAccreditation Program (NELAP) accredited laboratory and as such, certifies that all applicable test results meet therequirements of NELAP.
If you have any questions regarding this certificate of analysis, please contact Ms. Susan J Scherer (ProjectCoordinator) at (717) 944-5541.
Analyses were performed according to our laboratory’s NELAP-approved quality assurance program and anyapplicable state requirements. The test results meet requirements of the current NELAP standards or staterequirements, where applicable. For a specific list of accredited analytes, refer to the certifications section of theALS website at www.alsglobal.com/en/Our-Services/Life-Sciences/Environmental/Downloads.
This laboratory report may not be reproduced, except in full, without the written approval of ALS Environmental.
ALS Spring City: 10 Riverside Drive, Spring City, PA 19475 610-948-4903
NELAP Certifications: NJ PA010 , NY 11759 , PA 22-293 DoD ELAP: A2LA 0818.01State Certifications: DE ID 11 , MA PA0102 , MD 128 , VA 460157 , WV 343
DL ID - 46362, QC - 0

Report ID: 2212180 - 3/7/2017 Page 2 of 11
Workorder: 2212180 GVG SPRING/170167M-MD SITE
SAMPLE SUMMARY
Lab ID Sample ID Matrix Date Collected Date Received Collected By
2212180001 MW-7 Ground Water 3/2/2017 07:50 3/2/2017 21:10 Collected by Client
2212180002 MW-2 Ground Water 3/2/2017 08:50 3/2/2017 21:10 Collected by Client
2212180003 MW-3 Ground Water 3/2/2017 09:43 3/2/2017 21:10 Collected by Client
NELAP Certifications: NJ PA010 , NY 11759 , PA 22-293 DoD ELAP: A2LA 0818.01State Certifications: DE ID 11 , MA PA0102 , MD 128 , VA 460157 , WV 343
DL ID - 46362, QC - 0
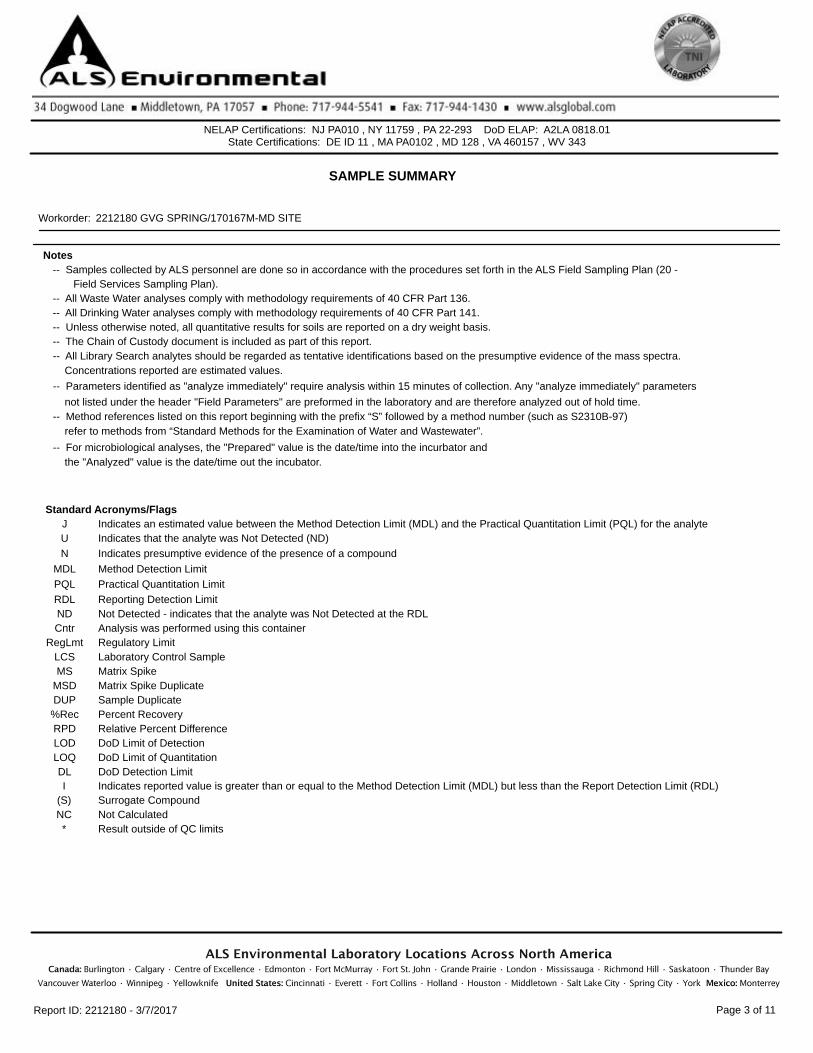
Report ID: 2212180 - 3/7/2017 Page 3 of 11
Workorder: 2212180 GVG SPRING/170167M-MD SITE
SAMPLE SUMMARY
Standard Acronyms/Flags
Notes
-- All Waste Water analyses comply with methodology requirements of 40 CFR Part 136.-- All Drinking Water analyses comply with methodology requirements of 40 CFR Part 141.-- Unless otherwise noted, all quantitative results for soils are reported on a dry weight basis.-- The Chain of Custody document is included as part of this report.
Indicates an estimated value between the Method Detection Limit (MDL) and the Practical Quantitation Limit (PQL) for the analyteIndicates that the analyte was Not Detected (ND)
Method Detection LimitPractical Quantitation Limit
JU
MDLPQL
Reporting Detection LimitNot Detected - indicates that the analyte was Not Detected at the RDLAnalysis was performed using this containerRegulatory Limit
RDLNDCntr
RegLmtLaboratory Control SampleMatrix Spike
LCSMS
Matrix Spike DuplicateSample DuplicatePercent Recovery
MSDDUP
%RecRelative Percent DifferenceRPD
-- Samples collected by ALS personnel are done so in accordance with the procedures set forth in the ALS Field Sampling Plan (20 - Field Services Sampling Plan).
N Indicates presumptive evidence of the presence of a compound
-- All Library Search analytes should be regarded as tentative identifications based on the presumptive evidence of the mass spectra. Concentrations reported are estimated values. -- Parameters identified as "analyze immediately" require analysis within 15 minutes of collection. Any "analyze immediately" parameters not listed under the header "Field Parameters" are preformed in the laboratory and are therefore analyzed out of hold time.
LOD DoD Limit of DetectionLOQ DoD Limit of QuantitationDL DoD Detection Limit
-- Method references listed on this report beginning with the prefix “S” followed by a method number (such as S2310B-97) refer to methods from “Standard Methods for the Examination of Water and Wastewater”.
I Indicates reported value is greater than or equal to the Method Detection Limit (MDL) but less than the Report Detection Limit (RDL)(S) Surrogate CompoundNC Not Calculated* Result outside of QC limits
-- For microbiological analyses, the "Prepared" value is the date/time into the incurbator and the "Analyzed" value is the date/time out the incubator.
NELAP Certifications: NJ PA010 , NY 11759 , PA 22-293 DoD ELAP: A2LA 0818.01State Certifications: DE ID 11 , MA PA0102 , MD 128 , VA 460157 , WV 343
DL ID - 46362, QC - 0

Report ID: 2212180 - 3/7/2017 Page 4 of 11
Workorder: 2212180 GVG SPRING/170167M-MD SITE
ANALYTICAL RESULTS
3/2/2017 21:10MW-7
Matrix: Ground Water
Parameters
Lab ID:
Sample ID:
2212180001
Results Units RDL Prepared By ByAnalyzedFlag
Date Collected:
Date Received:
3/2/2017 07:50
CntrMethod
VOLATILE ORGANICSAcetone ND ug/L 10.0 3/3/17 16:37 DD ASW846 8260Btert-Amyl methyl ether 16.6 ug/L 1.0 3/3/17 16:37 DD ASW846 8260BBenzene ND ug/L 1.0 3/3/17 16:37 DD ASW846 8260BBromochloromethane ND ug/L 1.0 3/3/17 16:37 DD ASW846 8260BBromodichloromethane ND ug/L 1.0 3/3/17 16:37 DD ASW846 8260BBromoform ND ug/L 1.0 3/3/17 16:37 DD ASW846 8260BBromomethane ND ug/L 1.0 3/3/17 16:37 DD ASW846 8260B2-Butanone ND ug/L 10.0 3/3/17 16:37 DD ASW846 8260Btert-Butyl Alcohol 603 ug/L 10.0 3/3/17 16:37 DD ASW846 8260BCarbon Disulfide ND ug/L 1.0 3/3/17 16:37 DD ASW846 8260BCarbon Tetrachloride ND ug/L 1.0 3/3/17 16:37 DD ASW846 8260BChlorobenzene ND ug/L 1.0 3/3/17 16:37 DD ASW846 8260BChlorodibromomethane ND ug/L 1.0 3/3/17 16:37 DD ASW846 8260BChloroethane ND ug/L 1.0 3/3/17 16:37 DD ASW846 8260BChloroform ND ug/L 1.0 3/3/17 16:37 DD ASW846 8260BChloromethane ND ug/L 1.0 3/3/17 16:37 DD ASW846 8260BCyclohexane ND ug/L 1.0 3/3/17 16:37 DD ASW846 8260B1,2-Dibromo-3-chloropropane
ND ug/L 7.0 3/3/17 16:37 DD ASW846 8260B
1,2-Dibromoethane ND ug/L 1.0 3/3/17 16:37 DD ASW846 8260B1,2-Dichlorobenzene ND ug/L 1.0 3/3/17 16:37 DD ASW846 8260B1,3-Dichlorobenzene ND ug/L 1.0 3/3/17 16:37 DD ASW846 8260B1,4-Dichlorobenzene ND ug/L 1.0 3/3/17 16:37 DD ASW846 8260BDichlorodifluoromethane ND ug/L 1.0 3/3/17 16:37 DD ASW846 8260B1,1-Dichloroethane ND ug/L 1.0 3/3/17 16:37 DD ASW846 8260B1,2-Dichloroethane ND ug/L 1.0 3/3/17 16:37 DD ASW846 8260B1,1-Dichloroethene ND ug/L 1.0 3/3/17 16:37 DD ASW846 8260Bcis-1,2-Dichloroethene ND ug/L 1.0 3/3/17 16:37 DD ASW846 8260Btrans-1,2-Dichloroethene 2.1 ug/L 1.0 3/3/17 16:37 DD ASW846 8260B1,2-Dichloropropane ND ug/L 1.0 3/3/17 16:37 DD ASW846 8260Bcis-1,3-Dichloropropene ND ug/L 1.0 3/3/17 16:37 DD ASW846 8260Btrans-1,3-Dichloropropene ND ug/L 1.0 3/3/17 16:37 DD ASW846 8260BDiisopropyl ether ND ug/L 1.0 3/3/17 16:37 DD ASW846 8260B1,4-Dioxane ND ug/L 320 3/3/17 16:37 DD ASW846 8260BEthylbenzene ND ug/L 1.0 3/3/17 16:37 DD ASW846 8260BFreon 113 ND ug/L 1.0 3/3/17 16:37 DD ASW846 8260B2-Hexanone ND ug/L 5.0 3/3/17 16:37 DD ASW846 8260B
NELAP Certifications: NJ PA010 , NY 11759 , PA 22-293 DoD ELAP: A2LA 0818.01State Certifications: DE ID 11 , MA PA0102 , MD 128 , VA 460157 , WV 343
DL ID - 46362, QC - 0

Report ID: 2212180 - 3/7/2017 Page 5 of 11
Workorder: 2212180 GVG SPRING/170167M-MD SITE
ANALYTICAL RESULTS
3/2/2017 21:10MW-7
Matrix: Ground Water
Parameters
Lab ID:
Sample ID:
2212180001
Results Units RDL Prepared By ByAnalyzedFlag
Date Collected:
Date Received:
3/2/2017 07:50
CntrMethod
Isopropylbenzene ND ug/L 1.0 3/3/17 16:37 DD ASW846 8260BMethyl acetate ND ug/L 2.0 3/3/17 16:37 DD ASW846 8260BMethyl cyclohexane ND ug/L 1.0 3/3/17 16:37 DD ASW846 8260BMethyl t-Butyl Ether 70.3 ug/L 1.0 3/3/17 16:37 DD A1 SW846 8260B4-Methyl-2-Pentanone(MIBK)
ND ug/L 5.0 3/3/17 16:37 DD ASW846 8260B
Methylene Chloride ND ug/L 1.0 3/3/17 16:37 DD ASW846 8260BNaphthalene ND ug/L 2.0 3/3/17 16:37 DD ASW846 8260BStyrene ND ug/L 1.0 3/3/17 16:37 DD ASW846 8260B1,1,2,2-Tetrachloroethane ND ug/L 1.0 3/3/17 16:37 DD ASW846 8260BTetrachloroethene ND ug/L 1.0 3/3/17 16:37 DD ASW846 8260BToluene ND ug/L 1.0 3/3/17 16:37 DD ASW846 8260BTotal Xylenes ND ug/L 3.0 3/3/17 16:37 DD ASW846 8260B1,2,3-Trichlorobenzene ND ug/L 2.0 3/3/17 16:37 DD ASW846 8260B1,2,4-Trichlorobenzene ND ug/L 2.0 3/3/17 16:37 DD ASW846 8260B1,1,1-Trichloroethane ND ug/L 1.0 3/3/17 16:37 DD ASW846 8260B1,1,2-Trichloroethane ND ug/L 1.0 3/3/17 16:37 DD ASW846 8260BTrichloroethene ND ug/L 1.0 3/3/17 16:37 DD ASW846 8260BTrichlorofluoromethane ND ug/L 1.0 3/3/17 16:37 DD ASW846 8260BVinyl Chloride ND ug/L 1.0 3/3/17 16:37 DD ASW846 8260Bo-Xylene ND ug/L 1.0 3/3/17 16:37 DD ASW846 8260Bmp-Xylene ND ug/L 2.0 3/3/17 16:37 DD ASW846 8260B
Surrogate Recoveries Flag UnitsResults Limits Prepared By Analyzed By CntrMethod
1,2-Dichloroethane-d4 (S) 108 % 62 - 133 3/3/17 16:37 DD ASW846 8260B4-Bromofluorobenzene (S) 101 % 79 - 114 3/3/17 16:37 DD ASW846 8260BDibromofluoromethane (S) 94.9 % 78 - 116 3/3/17 16:37 DD ASW846 8260BToluene-d8 (S) 93.1 % 76 - 127 3/3/17 16:37 DD ASW846 8260B
Project CoordinatorMs. Susan J Scherer
NELAP Certifications: NJ PA010 , NY 11759 , PA 22-293 DoD ELAP: A2LA 0818.01State Certifications: DE ID 11 , MA PA0102 , MD 128 , VA 460157 , WV 343
DL ID - 46362, QC - 0

Report ID: 2212180 - 3/7/2017 Page 6 of 11
Workorder: 2212180 GVG SPRING/170167M-MD SITE
ANALYTICAL RESULTS
3/2/2017 21:10MW-2
Matrix: Ground Water
Parameters
Lab ID:
Sample ID:
2212180002
Results Units RDL Prepared By ByAnalyzedFlag
Date Collected:
Date Received:
3/2/2017 08:50
CntrMethod
VOLATILE ORGANICSAcetone ND ug/L 10.0 3/3/17 16:59 DD ASW846 8260Btert-Amyl methyl ether 82.3 ug/L 10.0 3/7/17 02:39 SYB BSW846 8260BBenzene 1.6 ug/L 1.0 3/3/17 16:59 DD ASW846 8260BBromochloromethane ND ug/L 1.0 3/3/17 16:59 DD ASW846 8260BBromodichloromethane ND ug/L 1.0 3/3/17 16:59 DD ASW846 8260BBromoform ND ug/L 1.0 3/3/17 16:59 DD ASW846 8260BBromomethane ND ug/L 1.0 3/3/17 16:59 DD ASW846 8260B2-Butanone ND ug/L 10.0 3/3/17 16:59 DD ASW846 8260Btert-Butyl Alcohol 222 ug/L 100 3/7/17 02:39 SYB BSW846 8260BCarbon Disulfide ND ug/L 1.0 3/3/17 16:59 DD ASW846 8260BCarbon Tetrachloride ND ug/L 1.0 3/3/17 16:59 DD ASW846 8260BChlorobenzene ND ug/L 1.0 3/3/17 16:59 DD ASW846 8260BChlorodibromomethane ND ug/L 1.0 3/3/17 16:59 DD ASW846 8260BChloroethane ND ug/L 1.0 3/3/17 16:59 DD ASW846 8260BChloroform ND ug/L 1.0 3/3/17 16:59 DD ASW846 8260BChloromethane ND ug/L 1.0 3/3/17 16:59 DD ASW846 8260BCyclohexane ND ug/L 1.0 3/3/17 16:59 DD ASW846 8260B1,2-Dibromo-3-chloropropane
ND ug/L 7.0 3/3/17 16:59 DD ASW846 8260B
1,2-Dibromoethane ND ug/L 1.0 3/3/17 16:59 DD ASW846 8260B1,2-Dichlorobenzene ND ug/L 1.0 3/3/17 16:59 DD ASW846 8260B1,3-Dichlorobenzene ND ug/L 1.0 3/3/17 16:59 DD ASW846 8260B1,4-Dichlorobenzene ND ug/L 1.0 3/3/17 16:59 DD ASW846 8260BDichlorodifluoromethane ND ug/L 1.0 3/3/17 16:59 DD ASW846 8260B1,1-Dichloroethane ND ug/L 1.0 3/3/17 16:59 DD ASW846 8260B1,2-Dichloroethane ND ug/L 1.0 3/3/17 16:59 DD ASW846 8260B1,1-Dichloroethene ND ug/L 1.0 3/3/17 16:59 DD ASW846 8260Bcis-1,2-Dichloroethene ND ug/L 1.0 3/3/17 16:59 DD ASW846 8260Btrans-1,2-Dichloroethene 2.2 ug/L 1.0 3/3/17 16:59 DD ASW846 8260B1,2-Dichloropropane ND ug/L 1.0 3/3/17 16:59 DD ASW846 8260Bcis-1,3-Dichloropropene ND ug/L 1.0 3/3/17 16:59 DD ASW846 8260Btrans-1,3-Dichloropropene ND ug/L 1.0 3/3/17 16:59 DD ASW846 8260BDiisopropyl ether 5.8 ug/L 1.0 3/3/17 16:59 DD ASW846 8260B1,4-Dioxane ND ug/L 320 3/3/17 16:59 DD ASW846 8260BEthylbenzene ND ug/L 1.0 3/3/17 16:59 DD ASW846 8260BFreon 113 ND ug/L 1.0 3/3/17 16:59 DD ASW846 8260B2-Hexanone ND ug/L 5.0 3/3/17 16:59 DD ASW846 8260B
NELAP Certifications: NJ PA010 , NY 11759 , PA 22-293 DoD ELAP: A2LA 0818.01State Certifications: DE ID 11 , MA PA0102 , MD 128 , VA 460157 , WV 343
DL ID - 46362, QC - 0

Report ID: 2212180 - 3/7/2017 Page 7 of 11
Workorder: 2212180 GVG SPRING/170167M-MD SITE
ANALYTICAL RESULTS
3/2/2017 21:10MW-2
Matrix: Ground Water
Parameters
Lab ID:
Sample ID:
2212180002
Results Units RDL Prepared By ByAnalyzedFlag
Date Collected:
Date Received:
3/2/2017 08:50
CntrMethod
Isopropylbenzene ND ug/L 1.0 3/3/17 16:59 DD ASW846 8260BMethyl acetate ND ug/L 2.0 3/3/17 16:59 DD ASW846 8260BMethyl cyclohexane ND ug/L 1.0 3/3/17 16:59 DD ASW846 8260BMethyl t-Butyl Ether 573 ug/L 10.0 3/7/17 02:39 SYB BSW846 8260B4-Methyl-2-Pentanone(MIBK)
ND ug/L 5.0 3/3/17 16:59 DD ASW846 8260B
Methylene Chloride ND ug/L 1.0 3/3/17 16:59 DD ASW846 8260BNaphthalene ND ug/L 2.0 3/3/17 16:59 DD ASW846 8260BStyrene ND ug/L 1.0 3/3/17 16:59 DD ASW846 8260B1,1,2,2-Tetrachloroethane ND ug/L 1.0 3/3/17 16:59 DD ASW846 8260BTetrachloroethene ND ug/L 1.0 3/3/17 16:59 DD ASW846 8260BToluene ND ug/L 1.0 3/3/17 16:59 DD ASW846 8260BTotal Xylenes ND ug/L 3.0 3/3/17 16:59 DD ASW846 8260B1,2,3-Trichlorobenzene ND ug/L 2.0 3/3/17 16:59 DD ASW846 8260B1,2,4-Trichlorobenzene ND ug/L 2.0 3/3/17 16:59 DD ASW846 8260B1,1,1-Trichloroethane ND ug/L 1.0 3/3/17 16:59 DD ASW846 8260B1,1,2-Trichloroethane ND ug/L 1.0 3/3/17 16:59 DD ASW846 8260BTrichloroethene ND ug/L 1.0 3/3/17 16:59 DD ASW846 8260BTrichlorofluoromethane ND ug/L 1.0 3/3/17 16:59 DD ASW846 8260BVinyl Chloride ND ug/L 1.0 3/3/17 16:59 DD ASW846 8260Bo-Xylene ND ug/L 1.0 3/3/17 16:59 DD ASW846 8260Bmp-Xylene ND ug/L 2.0 3/3/17 16:59 DD ASW846 8260B
Surrogate Recoveries Flag UnitsResults Limits Prepared By Analyzed By CntrMethod
1,2-Dichloroethane-d4 (S) 109 % 62 - 133 3/3/17 16:59 DD ASW846 8260B1,2-Dichloroethane-d4 (S) 94.1 % 62 - 133 3/7/17 02:39 SYB BSW846 8260B4-Bromofluorobenzene (S) 103 % 79 - 114 3/3/17 16:59 DD ASW846 8260B4-Bromofluorobenzene (S) 101 % 79 - 114 3/7/17 02:39 SYB BSW846 8260BDibromofluoromethane (S) 93.1 % 78 - 116 3/3/17 16:59 DD ASW846 8260BDibromofluoromethane (S) 85.8 % 78 - 116 3/7/17 02:39 SYB BSW846 8260BToluene-d8 (S) 93.4 % 76 - 127 3/7/17 02:39 SYB BSW846 8260BToluene-d8 (S) 94.4 % 76 - 127 3/3/17 16:59 DD ASW846 8260B
Project CoordinatorMs. Susan J Scherer
NELAP Certifications: NJ PA010 , NY 11759 , PA 22-293 DoD ELAP: A2LA 0818.01State Certifications: DE ID 11 , MA PA0102 , MD 128 , VA 460157 , WV 343
DL ID - 46362, QC - 0

Report ID: 2212180 - 3/7/2017 Page 8 of 11
Workorder: 2212180 GVG SPRING/170167M-MD SITE
ANALYTICAL RESULTS
3/2/2017 21:10MW-3
Matrix: Ground Water
Parameters
Lab ID:
Sample ID:
2212180003
Results Units RDL Prepared By ByAnalyzedFlag
Date Collected:
Date Received:
3/2/2017 09:43
CntrMethod
VOLATILE ORGANICSAcetone ND ug/L 10.0 3/3/17 17:21 DD ASW846 8260Btert-Amyl methyl ether 120 ug/L 1.0 3/3/17 17:21 DD ASW846 8260BBenzene 1.7 ug/L 1.0 3/3/17 17:21 DD ASW846 8260BBromochloromethane ND ug/L 1.0 3/3/17 17:21 DD ASW846 8260BBromodichloromethane ND ug/L 1.0 3/3/17 17:21 DD ASW846 8260BBromoform ND ug/L 1.0 3/3/17 17:21 DD ASW846 8260BBromomethane ND ug/L 1.0 3/3/17 17:21 DD ASW846 8260B2-Butanone ND ug/L 10.0 3/3/17 17:21 DD ASW846 8260Btert-Butyl Alcohol 684 ug/L 100 3/7/17 03:01 SYB BSW846 8260BCarbon Disulfide ND ug/L 1.0 3/3/17 17:21 DD ASW846 8260BCarbon Tetrachloride ND ug/L 1.0 3/3/17 17:21 DD ASW846 8260BChlorobenzene ND ug/L 1.0 3/3/17 17:21 DD ASW846 8260BChlorodibromomethane ND ug/L 1.0 3/3/17 17:21 DD ASW846 8260BChloroethane ND ug/L 1.0 3/3/17 17:21 DD ASW846 8260BChloroform ND ug/L 1.0 3/3/17 17:21 DD ASW846 8260BChloromethane ND ug/L 1.0 3/3/17 17:21 DD ASW846 8260BCyclohexane ND ug/L 1.0 3/3/17 17:21 DD ASW846 8260B1,2-Dibromo-3-chloropropane
ND ug/L 7.0 3/3/17 17:21 DD ASW846 8260B
1,2-Dibromoethane ND ug/L 1.0 3/3/17 17:21 DD ASW846 8260B1,2-Dichlorobenzene ND ug/L 1.0 3/3/17 17:21 DD ASW846 8260B1,3-Dichlorobenzene ND ug/L 1.0 3/3/17 17:21 DD ASW846 8260B1,4-Dichlorobenzene ND ug/L 1.0 3/3/17 17:21 DD ASW846 8260BDichlorodifluoromethane ND ug/L 1.0 3/3/17 17:21 DD ASW846 8260B1,1-Dichloroethane ND ug/L 1.0 3/3/17 17:21 DD ASW846 8260B1,2-Dichloroethane ND ug/L 1.0 3/3/17 17:21 DD ASW846 8260B1,1-Dichloroethene ND ug/L 1.0 3/3/17 17:21 DD ASW846 8260Bcis-1,2-Dichloroethene ND ug/L 1.0 3/3/17 17:21 DD ASW846 8260Btrans-1,2-Dichloroethene 2.4 ug/L 1.0 3/3/17 17:21 DD ASW846 8260B1,2-Dichloropropane ND ug/L 1.0 3/3/17 17:21 DD ASW846 8260Bcis-1,3-Dichloropropene ND ug/L 1.0 3/3/17 17:21 DD ASW846 8260Btrans-1,3-Dichloropropene ND ug/L 1.0 3/3/17 17:21 DD ASW846 8260BDiisopropyl ether ND ug/L 1.0 3/3/17 17:21 DD ASW846 8260B1,4-Dioxane ND ug/L 320 3/3/17 17:21 DD ASW846 8260BEthylbenzene ND ug/L 1.0 3/3/17 17:21 DD ASW846 8260BFreon 113 ND ug/L 1.0 3/3/17 17:21 DD ASW846 8260B2-Hexanone ND ug/L 5.0 3/3/17 17:21 DD ASW846 8260B
NELAP Certifications: NJ PA010 , NY 11759 , PA 22-293 DoD ELAP: A2LA 0818.01State Certifications: DE ID 11 , MA PA0102 , MD 128 , VA 460157 , WV 343
DL ID - 46362, QC - 0

Report ID: 2212180 - 3/7/2017 Page 9 of 11
Workorder: 2212180 GVG SPRING/170167M-MD SITE
ANALYTICAL RESULTS
3/2/2017 21:10MW-3
Matrix: Ground Water
Parameters
Lab ID:
Sample ID:
2212180003
Results Units RDL Prepared By ByAnalyzedFlag
Date Collected:
Date Received:
3/2/2017 09:43
CntrMethod
Isopropylbenzene ND ug/L 1.0 3/3/17 17:21 DD ASW846 8260BMethyl acetate ND ug/L 2.0 3/3/17 17:21 DD ASW846 8260BMethyl cyclohexane ND ug/L 1.0 3/3/17 17:21 DD ASW846 8260BMethyl t-Butyl Ether 155 ug/L 10.0 3/7/17 03:01 SYB BSW846 8260B4-Methyl-2-Pentanone(MIBK)
ND ug/L 5.0 3/3/17 17:21 DD ASW846 8260B
Methylene Chloride ND ug/L 1.0 3/3/17 17:21 DD ASW846 8260BNaphthalene ND ug/L 2.0 3/3/17 17:21 DD ASW846 8260BStyrene ND ug/L 1.0 3/3/17 17:21 DD ASW846 8260B1,1,2,2-Tetrachloroethane ND ug/L 1.0 3/3/17 17:21 DD ASW846 8260BTetrachloroethene ND ug/L 1.0 3/3/17 17:21 DD ASW846 8260BToluene ND ug/L 1.0 3/3/17 17:21 DD ASW846 8260BTotal Xylenes ND ug/L 3.0 3/3/17 17:21 DD ASW846 8260B1,2,3-Trichlorobenzene ND ug/L 2.0 3/3/17 17:21 DD ASW846 8260B1,2,4-Trichlorobenzene ND ug/L 2.0 3/3/17 17:21 DD ASW846 8260B1,1,1-Trichloroethane ND ug/L 1.0 3/3/17 17:21 DD ASW846 8260B1,1,2-Trichloroethane ND ug/L 1.0 3/3/17 17:21 DD ASW846 8260BTrichloroethene ND ug/L 1.0 3/3/17 17:21 DD ASW846 8260BTrichlorofluoromethane ND ug/L 1.0 3/3/17 17:21 DD ASW846 8260BVinyl Chloride ND ug/L 1.0 3/3/17 17:21 DD ASW846 8260Bo-Xylene ND ug/L 1.0 3/3/17 17:21 DD ASW846 8260Bmp-Xylene ND ug/L 2.0 3/3/17 17:21 DD ASW846 8260B
Surrogate Recoveries Flag UnitsResults Limits Prepared By Analyzed By CntrMethod
1,2-Dichloroethane-d4 (S) 109 % 62 - 133 3/3/17 17:21 DD ASW846 8260B1,2-Dichloroethane-d4 (S) 97.2 % 62 - 133 3/7/17 03:01 SYB BSW846 8260B4-Bromofluorobenzene (S) 101 % 79 - 114 3/3/17 17:21 DD ASW846 8260B4-Bromofluorobenzene (S) 97.6 % 79 - 114 3/7/17 03:01 SYB BSW846 8260BDibromofluoromethane (S) 86.2 % 78 - 116 3/7/17 03:01 SYB BSW846 8260BDibromofluoromethane (S) 95 % 78 - 116 3/3/17 17:21 DD ASW846 8260BToluene-d8 (S) 92.9 % 76 - 127 3/3/17 17:21 DD ASW846 8260BToluene-d8 (S) 92.4 % 76 - 127 3/7/17 03:01 SYB BSW846 8260B
Project CoordinatorMs. Susan J Scherer
NELAP Certifications: NJ PA010 , NY 11759 , PA 22-293 DoD ELAP: A2LA 0818.01State Certifications: DE ID 11 , MA PA0102 , MD 128 , VA 460157 , WV 343
DL ID - 46362, QC - 0

Report ID: 2212180 - 3/7/2017 Page 10 of 11
PARAMETER QUALIFIERS
#Lab ID Analytical MethodSample ID Analyte
1The QC sample type LCS for method SW846 8260B was outside the control limits for the analyte Methyl t-Butyl Ether. The % Recovery wasreported as 116 and the control limits were 69 to 115.
2212180001 SW846 8260BMW-7 Methyl t-Butyl Ether
NELAP Certifications: NJ PA010 , NY 11759 , PA 22-293 DoD ELAP: A2LA 0818.01State Certifications: DE ID 11 , MA PA0102 , MD 128 , VA 460157 , WV 343
DL ID - 46362, QC - 0

Page 11 of 11
Tuesday, March 07, 2017 7:05:54 PM
Related Documents