1966: A Year of Continued Expansion in the Central Mississippi Valley CONOMIC ACTIVITY in the Central Missis- sippi Valley advanced at a brisk pace during 1966, with regional gains roughly paralleling those in the nation. Population increased only slightly, but em- ployment and personal income in Arkansas, Kentucky, Mississippi, Missouri, and Tennessee combined were well above year-earlier levels. In the metropolitan areas of the region (Eighth Federal Reserve District), employment, spending, and banking activity moved strongly upward, with largest increases occurring in the first half of the year. Population in the Central Mississippi Valley rose an estimated 0.6 per cent during the year ending in mid- 1966 compared with a 1.1 per cent annual rate from 1960 to 1965 (Table I). In the nation population growth also slowed last year, declining to a 1.1 per ~ cent rate from a 1.6 per cent average rate during the previous five years. NOTE: Data for the Central Mississippi Valley and for each state and metropolitan area discussed in this article are publish- ed monthly in a release, “Selected Economic Indicators—Cen- tral Mississippi Valley,” which is available upon request. Total employment in the Central Mississippi \‘alley advanced 1.1 per cent (luring the past year, with the long-term decline in agricultural employment con- tinuing to partially offset gains in other industries. Payroll employment, which excludes agricultural, un- paid family, domestic, and self-employed workers, in- creased 4.4 per cent, about equal to the national rate of expansion. Manufacturing employment rose sharp- ly and by late 1966 was 6 per cent above year-earlier levels. Increased production by ordnance plants in several areas contributed to this gain. Nonmanufac- turing employment increases were slightly above the average rate of the preceding five years. Total personal income in the Central Mississippi Valley advanced at about the same rate as the 8 per cent national gain from 1965 to 1966 despite the slower rate of population growth in the region. Per capita personal income rose 8 per cent in the Valley, somewhat more than the 7 per cent gain nationally. Per capita income in the five states of the Valley averaged about $2,285 in 1966, with income in each of the states below the estimated national average of $2,935. Table I ECONOMIC INDICATORS Central Mississppi Valley States Annual Pates af Change Per Capita Population 1 Total Employment 2 Payroll Emplaymanl 2 Paroanal Income 5 Personal Income 1960-65 1965-66 1960-65 196566 196065 1965-66 1960-65 1965-66 1960-65 196566 Arkansas 1.7 0.7 2.5 —-0.7 4.3 - 4.4 7.8 6.1 9.6 Kentucky 0.9 0.3 p.o. na. 3.0 4.6 6.3 6.3 5.4 6.0 Mississippi 1.2 0.8 1.0 0.9 3.5 3.7 7.1 7.9 5.9 7.1 Missouri 08 D4 0.7 1.8 1.7 3.0 5.5 8.3 4.7 7.9 Tennessee 1.5 0.9 na. na. 3.7 6.5 7.0 8.8 5.5 7.9 TotalS states 1.1 0.6 1.1’ 1.11 2.9 4.4 6.4 8.2 5.2 7.6 United Stafas 1.6 1.1 1.6 2.5 2.3 4.7 5.9 8.1 4.4 6.9 Rote”, c,ampsstt’cl frnan April 1, 1960 Ia July 1, 1P65 end frosts July 1, 1905 to Jesly 1. lonG. flat, c ~etn5’u. 1,-cl ins rn J 9(51) avis-sg,~ fn 196 so rcsszrssnci f,o,s, aver..o’ for S cpts’~tsl , er—Octs her 196.3 Is sot’ rope for S rpte.srslsrs’—Ocfolser i 966 Bets, cx’my’s’ tel fran, 1960 (etal to 1 9&5 [nail :snd Iran’ filet airs, n sessst Iso 1965 to first ni rn ,ssontlse 1966. 4 Total for Ark.n5 os. Mic’icssppi, ond Maca, sri only. na-—Nat avseilalslr. N’ erect 17. 5. Departmsn L of Con~ it trot’. state’ psrsplsiysne’ss t ci’ curit} csffic.eo, U. S. Purr-ta of Lalsar Stati icc, and lies‘etcss II’ cs I’:sgs 5 ‘0

Welcome message from author
This document is posted to help you gain knowledge. Please leave a comment to let me know what you think about it! Share it to your friends and learn new things together.
Transcript

1966: A Year of Continued Expansionin the Central Mississippi Valley
CONOMIC ACTIVITY in the Central Missis-sippi Valley advanced at a brisk pace during 1966,with regional gains roughly paralleling those in thenation. Population increased only slightly, but em-ployment and personal income in Arkansas, Kentucky,Mississippi, Missouri, and Tennessee combined werewell above year-earlier levels. In the metropolitanareas of the region (Eighth Federal Reserve District),employment, spending, and banking activity movedstrongly upward, with largest increases occurring inthe first half of the year.
Population in the Central Mississippi Valley rose anestimated 0.6 per cent during the year ending in mid-1966 compared with a 1.1 per cent annual rate from1960 to 1965 (Table I). In the nation populationgrowth also slowed last year, declining to a 1.1 per
‘~ cent rate from a 1.6 per cent average rate during theprevious five years.
NOTE: Data for the Central Mississippi Valley and for eachstate and metropolitan area discussed in this article are publish-ed monthly in a release, “Selected Economic Indicators—Cen-tral Mississippi Valley,” which is available upon request.
Total employment in the Central Mississippi \‘alleyadvanced 1.1 per cent (luring the past year, with thelong-term decline in agricultural employment con-tinuing to partially offset gains in other industries.Payroll employment, which excludes agricultural, un-paid family, domestic, and self-employed workers, in-creased 4.4 per cent, about equal to the national rateof expansion. Manufacturing employment rose sharp-ly and by late 1966 was 6 per cent above year-earlierlevels. Increased production by ordnance plants inseveral areas contributed to this gain. Nonmanufac-turing employment increases were slightly above theaverage rate of the preceding five years.
Total personal income in the Central MississippiValley advanced at about the same rate as the 8 percent national gain from 1965 to 1966 despite theslower rate of population growth in the region. Percapita personal income rose 8 per cent in the Valley,somewhat more than the 7 per cent gain nationally.Per capita income in the five states of the Valleyaveraged about $2,285 in 1966, with income in each ofthe states below the estimated national average of$2,935.
Table I
ECONOMIC INDICATORSCentral Mississppi Valley States
Annual Pates af Change
Per CapitaPopulation
1Total Employment
2Payroll Emplaymanl
2Paroanal Income
5Personal Income
1960-65 1965-66 1960-65 196566 196065 1965-66 1960-65 1965-66 1960-65 196566
Arkansas 1.7 0.7 2.5 —-0.7 4.3 - 4.4 7.8 6.1 9.6Kentucky 0.9 0.3 p.o. na. 3.0 4.6 6.3 6.3 5.4 6.0Mississippi 1.2 0.8 1.0 0.9 3.5 3.7 7.1 7.9 5.9 7.1Missouri 08 D4 0.7 1.8 1.7 3.0 5.5 8.3 4.7 7.9Tennessee 1.5 0.9 na. na. 3.7 6.5 7.0 8.8 5.5 7.9TotalS states 1.1 0.6 1.1’ 1.11 2.9 4.4 6.4 8.2 5.2 7.6
United Stafas 1.6 1.1 1.6 2.5 2.3 4.7 5.9 8.1 4.4 6.9
Rote”, c,ampsstt’cl frnan April 1, 1960 Ia July 1, 1P65 end frosts July 1, 1905 to Jesly 1. lonG.flat, c ~etn5’u.1,-cl ins rn J 9(51) avis-sg,~fn 196 so rcsszrssnci f,o,s, aver..o’ for S cpts’~tsl, er—Octs her 196.3 Is sot’ rope for S rpte.srslsrs’—Ocfolser i 966Bets, cx’my’s’ tel fran, 1960 (etal to 1 9&5 [nail :snd Iran’ filet airs, n sessst Iso 1965 to first ni rn ,ssontlse 1966.
4 Total for Ark.n5os. Mic’icssppi, ond Maca, sri only.na-—Nat avseilalslr.N’ erect 17. 5. DepartmsnL of Con~it trot’. state’ psrsplsiysne’ss t ci’curit} csffic.eo, U. S. Purr-ta of Lalsar Stati icc, and lies‘etcss II’ cs
I’:sgs 5
‘0

Z0
9ra;~
°W
~,a
~M
9ea
ri’
e~
~n
o,e
~°‘8
~ a’
~rU
ta’~
Wa
0”
,6
’‘
a‘
-‘
~‘
~r~
aa
..
:‘
alt
2-a
’-’
:~a C
‘4
~0’
ft‘°
~•O
ssaoM
iJi
PR
,o
~,
~0a
~4
~e
stn
~J3
Lo
~I
CO
sn
aL
M~
4Z
OiM
bs
9’~
050.
toO
s
$,.
,a
L~
°~
tflj
Os
S3
~at
~‘~‘
O£
~~
a~O
tatn
0~~~
090
I‘°
a a-,
8~
‘.i
’ti~
~ro
‘oca-a
.ac~
osc3s’o
~*
9,
eso
II
.~
r—
—~
—‘-‘
‘Ott
,—
NO
r’5
~-’
00
e~ ~
, 0./
>
05,,
0’
/to
)‘55
(.5
—i
—.
-ø~
~0’
otn
cc~
oa’O
OO
~sis
,
o55,
//a
—
g’~4
ahca
M—
~”~~
0 ’Q
s;
U0O
lO~
4M
)5t4
’ø50
~05
*,a
0’//
a Os
/
—
/——
L——
:~_~
“,°c;
•‘4O
ON
”,
,~
0’
——
an
—n
-~
-~
a-‘—
~a
cca
-‘a
~5~3
?,C
a~a
-‘a
a
~~
je~
-Q~
5a
“a-
~E
~‘—
ao
a.-
ca’a
—.
a-a
<~
aa~
ae
5~
2-~
,~
.a
a
za
aa-
aa
~;~
-‘1
-~—
aC
a-
—a—
aa
a-~
aa
0—
-ta~
Caa~
saa
-
-)rot
an—
.a
—~
‘,~
a=
C~a
~—
n‘a
~-t
’cr
-~
ac~
—a
Z~
‘<a
~a
S—
aa
a—
-—
a-i
—C
-2
<aa
a‘-,.
.5,-
,.
—a
~a
aad
a -H C a~ a—
-5. ~g °~
So
~ ~ ~ ‘-t a
0~ caa
Cl,-- a
C-
—~
a,.
,
a-~
—‘
C~
a-~
an
~°° ~ ,-t<
an
~a —a
:~-
‘~,-
,.a_
0<0
-.
0a
a~
a-~
~-~
0’.
-).-
~—
,a
,-.,
~
ii~
L~
r~~2
o~
~2-a
-’~s
cc,..
,s.,
a,.
’~~
oa~’
aa_a
ao
C~
~~
-a-~
’’~
’a-5
~aS~
a’~-
~->
o-’
a-
a,.
.,.r
-’a
aaZ
5’,~
5~
~a
at~
aaq
C.s
’~a
-~
o~
’<a
,:i°
°d
’2~
Caa~
—’~
g,-
,.a
~o
roaaaC
aa
cc~
a-~
~~—
.,.—
a—a
,a.C
l’ara
a~
”B’4
S-t
~~
a~
g~
_~
~-~
at
—,
a~
r’-i
Cd
mo,0
a~
ar5a5P
~~a5
a~Jn
~aaa
a~
Ca’E
~n
~~
~~5~
5__
n~
.~ 1c~
ana~
a~ha
_.-
5a~
’.a
~G~a
~—o—
’-a
—an
.—
—
5~
5aa~
~’a~
~-,a
aoJ°
—r-,
-aro
t‘~
a~
aa-~
aa”_
~__a
~-a
-t-
•<tt
ar’
aaia
—-
----
a—
,~a
——
a—
~aC
a~z
g~
~si
~a,
,a’
‘ao,,aQ
~~
~,o’
~a~9
~a~’
~~aa
a~
j~aa~
’’’
~a
~ a,~
,aa
~n’a
~a
a~
am
zO
’Q’a
-c~
_a-
’-”
~a,
~5C
~—
—C’
~~
.-~
~acc
a-a
z~
~a
q~
~
ad_a,.
9d
<-~
a“a
a-a
~—sg
.~-
a~
a~
h’C
-a
,_,~
—.
~—
a~a
r’-a
-5
. a’~
a-t
~~
—a
uir
°--
<
0
aan
aa
aa
-io
ta
aa
ai--
C-~
Cl)
=it
aa
a—
a~a
2d
~
5.‘-
ca
0~
~
‘1~
~,
ra
—
~~—
Cr
—cc
a-a
01a,-
a
H—
.-
ao
a-~
—
‘—‘~
-a.-
a-a
aS
-~
‘aa~
aaa ~
a.~
in a a a a a Ca a a ~1~
9 a a 0~5 a 0-n a
fl

Little Rock’
Economic activity in the Little Rock area grewmoderately in 1966, but some indicators showed littleor no gain in the later months of the year. Employ-ment, spending, and banking activity all advancedless rapidly tb-an in previous years.
Total employment rose less than 1 per cent duringthe year, well below the longer term growth rate.The labor force, however, was fully utilized and re-mained about unchanged from late—1965 levels. Un-employment averaged only 2.4 per cent of the laborforce during the 12 months ending in November1966, the lowest for any metropolitan area of theregion.
Payroll employment rose 2.0 per cent during theyear, with manufacturing gains exceeding those innonmanufacturing lmtil strikes caused a sharp drop inapparel and nonelectrical machinery manufacturingin November. Metal working was the fastest growingmanufacturing industry. In the nonmanufacturing cat-egory government employment increased substantially,while contract construction employment declined.
Check payments rose 8 per cent from late 1965 tolate 1966, with practically all the growth concen-trated in the early part of the period. This indicator‘~ of spending declined sharply in November 1966, prob-ably reflecting the decline in employment because ofstrikes.
Banking activity rose rapidly from late 1965 toApril 1966 and then leveled off. Deposits moved up7 per cent for the year as a whole, while businessloans expanded 12 per cent. The increase in depositswas slightly below the trend rate, while the increasein business loans was somewhat above the average 11per cent rate of gain from 1960 to 1965.
Fort Smith2
The Fort Smith economy, which was seriously af-fected by the closing of Fort Chaffee in 1965, con-tinued to decline during 1966. Employment rose earlyin the year, but the increase was more than offset bya decline during the second half. Check paymentsrose moderately, and other banking activity remainedabout unchanged.
Total employment declined 3.5 per cent (luring theyear ending in the fall of 1966, while the labor force
‘The Standard Metropolitan Statistical Area (SMSA) is Pulaski~ County, Arkansas.
2The SMSA consists of Sebastian and Crawford Counties,Arkansas and LeFlore and Sequoyah Counties, Oklahoma.
T”~”/ MAN.UFACCJPNO N-C
Ilotetloyacet Ralt
~~-~-3
2
Lzttle~Rock /
Manpower Utilizationseetetteell M’e,t.cr
~957_59100 Payroll teploymeut 1937
144
140 ‘‘0
136
132 .22
128 128
124 124
1”O .20Per Cent Per Cent
4 4
3_____ - - 2
C 01964 19*5 1966
Spending5.o~n&5pAdps,t,d
1957-59—100 Check Paysseat, 1957 59—100
10*
L J ,~: ,~ •‘‘ -
,~
14C
1957
— ———— -964 1965 1966
Banking Activity
59 100 Buttress bert —
306 300
280 280
266
246
~
‘160
240
E200
Benk Deposits 200
180
::180
-- C’ W64 ,‘C’ ~ /,/,,, \89C
64/ /
/ \‘, / / / / / ,~\\ C-”
Page 7
0’

156
140
132
124
litPer
8
6
4
2
8564 \~96 1946
‘C
// -C- N‘C / / C-’’,,
increased slightly. Consequently, the unemploymentrate rose markedly, from 6.0 per cent of the laborforce in the autumn of 1965 to 7.6 per cent a yearlater, Unemployment has generally been between 6and 7 per cent of the labor force during the pastthree years. Fort Smith was the only metropolitanarea in ti’ie Central Mississippi Valley classified as anearea of substantial unemployment” in 1966.
Payroll employment in the area declined 2.4 percent from late 1965 to late 1966, in contrast to a 6per cent average annual rate of growth during theperiod 1960-65. Manufacturing employment was 3.0per cent below year-earlier levels. Employment in themetals industry dropped sharply while one plant re-tooled following a change in ownership, but employ-ment in the food processing and furniture industriesincreased. Strikes in the stone, clay, and glass in-dustry and in the metals industry late in the yearcontributed to the depressed level of manufacturingemployment. Nonmanufacturing employment contin-ued to decline from the high level reached in mid-1964, with employment in contract construction show-ing the sharpest decline.
Check payments in Fort Smith were counter to thegeneral trend of economic activity, expanding 10 percent in 1966, slightly above the 8 per cent averagerate of expansion from 1960 to 1965.
Banking activity, which had risen rapidly since thelate 1950’s, continued to increase but at a reducedrate. Deposits rose only 0.9 per cent, and total loans,1.2 per cent compared with growth rates of 11 and 12per cent, respectively, from 1960 to 1965.
Pine Bluff3
Economic activity in the Pine Bluff area declinedsomewhat last year following a period of rapid growthfrom 1960 to 1965. Employment and banking activitywere only slightly below year-earlier levels, but spend-ing, as measured by check payments, dropped sharplyduring the second half of the year.
Total employment decreased 0.9 per cent, primarilybecause a small cotton crop reduced the demand foragricultural workers. The unemployment rate roseslightly, from 3.6 to 3.8 per cent. Payroll employment,which had increased rapidly in late 1965, reached ahigh level in January and then declined somewhat.
Check payments rose rapidly until July and thendeclined sharply through October and November, re-flecting the general decline in other sectors of theeconomy.
3The SMSA is Jefferson County, Arkansas.
C
CPage 8
Banking activity also slowed last year. After risingin the first three quarters of the year, total loans de-) dined markedly in October. Bank deposits changedlittle on balance during the year in contrast to a 9per cent annual growth rate in the preceding fiveyears.
Keutu c kvThe year 1966 was one of moderate economic
growth in Kentucky, following very rapid growth in1965, During the past year population, employment,and income all expanded somewhat less rapidly thanin the previous year.
The population of the state was estimated at3,183,000 in mid-1966, up 0.3 per cent from 1965. Since1960 population has increased at a 0.9 per cent aver-age annual rate, about half the average rate of 1.6 percent for the nation.
Payroll employment rose 4.6 per cent during theyear ending in late 1966, with most of the gain oc-curring prior to April. Manufacturing employment in-creased somewhat more rapidly than nonmanufactur-ing, with sizable gains in the petroleum refining andrubber products and electrical and nonelectrical ma-chinery industries. In the nonmanufacturing sectorgovernment and trade had much higher levels of em-
‘~ ployment than a year earlier. Partially offsetting thesegains was a sharp decline in contract constructionemployment, reflecting the housing slump.
Personal income rose 6.3 per cent from 1965 to 1966,a slightly lower rate than the average for the Valleybut equal to the average rate of gain for Kentuckyfrom 1960 to 1965. The growth of personal income inthe state during these five years more than kept pacewith the 5.9 per cent rate of growth in the nation butwas slightly below the 6.4 per cent average rate forthe Valley. Per capita personal income in Kentuckyin 1966 was estimated at $2,168, about average for theValley but well below the estimated $2,935 average inthe nation.
Louisville4
Economic activity in the Louisville metropolitanarea rose significantly during 1966. Employment,spending, and banking activity increased at rates wellabove the trend rate.
Total employment expanded 4.7 per cent, more thandouble the 1.8 per cent average rate for the previousfive years. The unemployment rate remained about 3
per cent throughout the year, generally below the rate
) 4The SMSA consis~ of Jefferson County, Kenuicky and Clarkand Floyd Counties, Indiana.
Page 9
0’

Payroll employment advanced 4.6 per cent, withmanufacturing employment expanding more thantwice as fast as nonmanufacturing employment. In-creased production of machinery and of war materialswas primarily responsible for tile gain in manufactur-ing employment. Labor disputes tended to retardbusiness activity. In March several thousand workersin the electrical appliance industry were on strike, andmanufacturing employment levels dropped sharply.In each month from June to October at least 1,000workers were on strike during each employment-re-porting period.
Spending in Louisville, as measured by check pay-ments, rose quite rapidly during most of the year. A12 per cent net gain for the 12-month period endingin November was only slightly less than the nationalgrowth rate.
Banking activity advanced during the 12 monthsending in November 1966 at a rate slightly greaterthan the trend rate. Deposits rose 5 per cent, some-what less than the 7 per cent rate of the precedingfive years. Business loans expanded 12 per cent, pri-marily in the early part of the year; the longer runrate of expansion was 6 per cent.
Evansville, Indiana-Kentucky5
The economy of the Evansville area, which showedlittle net gain during 1965, moved up strongly in 1966.Manufacturing employment and bank deposits in-creased substantially.
Total employment expanded 6 per cent comparedwith a 2.4 per cent average rate from 1960 to 1965.The unemployment rate, 2.9 per cent of the laborforce in late 1966, was about unchanged from a yearearlier.
Payroll employment in Evansville rose at a fasterpace than in the nation, reflecting primarily a 15 percent increase in the manufacturing sector. Employ-ment in the refrigeration and air-conditioning equip-ment industry rose by more than 2,000 workers. Inaddition, a new industrial operation in the area beganhiring personnel to work on defense contracts. Thisplant is expected to expand during 1967. A smallgain in nonmanufacturing employment was concen-trated in the government category.
Check payments in Evansville rose 6 per centduring the 12 months ending in November, well below
5The SMSA consists of Vanderburgh and Warrick Counties,Indiana and Henderson County, Kentucky.
of the preceding year and well below the 1960-65average.
Page 10

the 8 per cent trend rate of the preceding five years.Other banking trends were mixed. Deposits expanded) very rapidly, while business loans showed only aslight increase. This experience was the reverse of thenational pattern. Total deposits expanded 12 percent, and business loans, 3.1 per cent. In contrast, de-posits nationally expanded 3.5 per cent, and loans, 18per cent. This diversity of trends in Evansville coin-pared with the nation may reflect the source ofcapital involved in the area’s expansion. Most of theemployment growth in Evansville was in plantsowned by larger national corporations which bor-rowed elsewhere for local expansion. The area’s hankdeposits, however, reflected new income and savingsgenerated by the expansion.
M ISSISS1f)P1
Economic activity in Mississippi advanced at aboutthe same rate in 1966 as in the 1960-65 period.
Population rose 0.8 per cent from mid-1965 to mid-1966 compared with a 1.2 per cent average rate ofgrowth in the previous five years. Population in thenation increased 1.1 per cent during the year.
Total employment in the state rose 0.9 per centduring the past year, slightly below the average 1960-65 growth rate. Agricultural employment rose less
than seasonally during the fall months as had weatherand a smaller cotton crop reduced the demand forfarm workers.
Payroll employment advanced 3.7 per cent overlevels of late 1965, with manufacturing employmentgains slightly more rapid than nonmanufacturinggains. Among durables the furniture, primary metals,
and electrical machinery industries showed the largestincreases in number of workers. In the nondurablegoods category employment in the apparel industmyrose substantially. Government employment in mostrecent months was well above year-earlier levels, andseveral other nonmanufacturing categories showedsmall increases.
Personal income in the state expanded about 8 percent last year. This increase was about the same asfor the nation as a whole. Estimated per capita per-sonal income of $1,722 was 7 per cent greater than in1965, about the same gain as nationally.
MissouriEconomic trends in Missouri were mixed in 1966.
Employment gains were striking compared with thosej of previous years, though population expanded lessrapidly than the average 1960-65 rate. Personal in-
a-----~Ll’,’i, I I,,~, I
Of
72
Per CentPet Cent Useosptoyrseol Role
I IT~- t964 m96~ 1966
Spending1951 59 TOO Sen,,tmrd’aid 1957 42 100
Page 11

come also rose at a higher rate than in the longer runperiod.
Population was estimated at 4,508,000 in mid-1966,a 0.4 per cent gain from a year earlier. In the fiveyears 1960-65 population rose at an 0.8 per centaverage rate, half the rate for the United States as awhole.
Total employment increased 1.8 per cent during thepast year, substantially above the 0.7 per cent averagerate of gro~vthfrom 1960 to 1965. Unemnployment wasabout 3.1 per cent of the labor force in 1966, a littlebelow the level of a year earlier.
Payroll employment advanced more rapidly during1966 than in any year since the late 1950’s. The 3.0per cent rate of gain was almost double the 1.7 percent average annual rate for the longer run period.Manufacturing employment rose 4.7 per cent, withall major durables industries, particularly ordnanceand transportation equipment, showing increases.Much of the 2.3 per cent rise in nonmanufacturingesnploymnent was attributable to an increase in govern-ment workers.
Personal income in Missouri rose 8 per cent duringthe year, about the same rate as in the nation andgreater than the trend rate in Missouri. Per capitapersonal income, estimated at $2,873, was higher thanin any of the other Central Mississippi Valley Statesand 8 per cent above the year-ago level for Missouri.
St. Louis°
The St. Louis economy advanced rapidly during thefirst half of 1966 but leveled off somewhat after mid-year. Net growth for the year was well above trendrates for St. Louis but below the national average.
Total employment in the area rose 3.1 per cent,about triple the 1960-65 average rate of gain. Em-ployment gains during the past year would probablyhave been even greater had there not been an increaseof labor disputes. In only three of the first ten monthsdid striking workers number under 1,000, and, at onetime in the last half of 1966, 7,000 workers were onstrike. Unemployment declined to 3.2 per cent of thelabor force in the autumn compared with 3.4 percent a year earlier.
Payroll employment rose rapidly through June andthen stabilized, with the level during the fall 4.2 percent above a year earlier. The annual rate of gain inthe previous five years was 1.6 per cent. In the long-
6The SMSA consists of St. Louis City, St. Louis, St. Charles,Jefferson, and Franklin Counties, Missouri and Madison andSt. Clair Counties, Illinois.
964 1965 566
Spending
195? 59 CO check Patnenco 1~57-59n
Page 12

~tv~---i-i---,,I -I
I’
Springfield
Manpower UtnIr2ataonS.ao~e’.4trM,~I,d
,_“ N ONMANUFACTGRING
Cent tioen,pleymeet Rote Per
128 -_- —- -——fl- -- 124
1 20
iio no
12 112
lOS 108Per “ent
5}
1964 1965 1966
Spending~edlyAdwnted
1957-59 tOO Check Payments 957 59 lOP‘“U
2W 210
-~ Yw
run period, manufacturing employment showed onlya slight increase, as gains in durable goods employ-) ment were largely offset by declines in nondurables.In the early part of the past year, however, manu-facturing employment rose sharply and stabilized ata high level after March. Employment increased dur-ing the year in the production of both durable andnondurable goods. Employment in the transportationequipment industry continued to expand more rapidlythan in any other area of manufacturing. The mnanmm-facture of aircraft and parts employed several thou-sand more workers than in 1965. The ordnance in-dustry w’ill probably grou’ rapidly as a new defensepiant is staffed. Noumnanufacturing emnploymnent ex-panded 4.6 per cent, with most of the expansion inthe first half of the year. Tile trade, service, andgovernment fields each employed about 7,000 moreworkers in late 1966 than a year earlier.
Total spending, as measured by check payments,rose rapidly from late 1965 to mid-1966 and leveledoff during the last half of the year. ‘rile net gain forthe year was 12 per cent compared with a 10 per centaverage rate from 1960 to 1965.
Banking trends were mixed. Deposits at weekly re-porting banks rose in the first half of the year hutwere about unchanged after June. Deposit expansionfor the whole year was only 2.7 per cent, comnpared
} svith a 6 per cent trend rate and a 3.5 per cent increasein the United States last year. Business loans rose 18per cent, with all of the increase in the first half ofthe year.
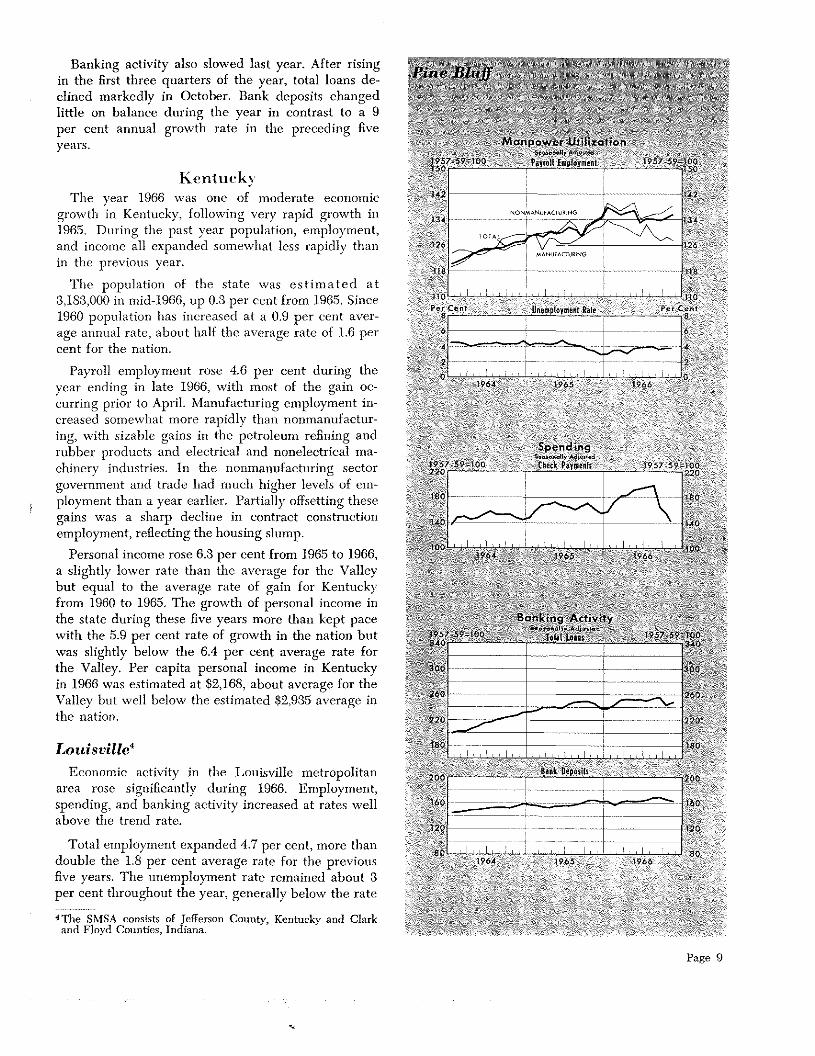
Springfield7
Economic activity in the Springfield area wasmarked by rapid growth in manufacturing employ-ment. Banking activity expanded moderately fromyear-earlier levels. Spending rose somewhat, but at aslower rate than the long-term trend.
Near the end of the year total employment was 3.4per cent higher than in late 1965. Unemployment was2.8 per cent of the labor force late in 1966 compared\vitll 3.6 per cent a year earlier.
Payroll employment advanced 5 per cent withmost of the gain in manufacturing. Emnpioytncnt in themachinery industry rose by several hundred workers,primarily because of expansion by a firm which pro-duces office machines. Other industries showed smnailerincreases. Among the nonmanufacturing groups em-ployment in trade increased most, but employment
in construction was also ~veil above year-earlier levels.
j 7The SMSA is Greene County, Missouri.
rN~J
-I1-a U - - - --
I/c
964 1965 1966
Banking ActivityI-’..’,
1957.59-100 Total [mans ~‘ ~24C - .
2g.
200
~c.C
lao — 160
160 noo
‘40 ‘40
‘20—— —-—— 1201964 1965 1966
170
150
~QO
~o
:oo
Inn
-- I- -- -
\II
~~-------------~---~
Demand Pepesats
Page 13
0’

964
4
3
1965 - 1966 -
SpendingSnele, mu
59 100 Check Payments ‘957 59
200 200
180 )
160
1401964 WaS 1966
240
220
20C
I... ISO
160
140 I I ~II !I? I? 140
Bank Depasits
240 240
220 220
200 200
180 I
160—I I! I! II II*964 1965
Check payments advanced 5 per cent during theyear, substantially below the 8 per cent averageannual increase from 1960 to 1965. Demand depositsexpanded 9 per cent, and total bank loans rose 10 percent,
Tennessee
A period of exceptionally rapid ec000nlic expansionin Tennessee which began in mid-1965 continuedthrough 1966. Population grou’th iaggecl, hut empioy—men t and personal income expanded faster than ill
the nation during the past year.
Population increased 0.9 per cent compared with
1.1 per cent in the nation and a 1.5 per cent averageannual rate in Tennessee from 1960 to 1965.
Payroll employment moved strongly- upward at a 6per cent rate compared with a 4.7 per cent increasefor tile nation. Manufacturing employment advanced
8 per cent. Sharp gains ~vere reported in the electricalmachinery, chemical, and apparel industries. Amongthe noumnanufacturing categories construction, trade,
services, and government all silowed substantial in-creases in employs-nent during the year.
Tennessee’s 9 per cent gain in personal incomeexceeded the national rate of growth. Per capita per-sonal income rose from $2,013 in 1965 to $2,172 in1966, an 8 per cent increase.
Memphis°
The Memphis economy displayed widely varyingtrends in 1966. Employment growth accelerated sharp-ly, but spending and banking activity rose at below-average rates.
Employment in Memphis rose at a faster pace thanin the nation. Total employment was 3.6 per centabove year-earlier levels. Payroll employment rose6 per cent compared with a 4.7 per cent nationalrate. Much of the area’s gain was attributable to alarge increase in manufacturing employment. A newplant which produces television sets was opened inmid-1966 and initially employed about 1,000 workers.The \vork force at the plant is expected to increaseto about 2,400 by mid-1967. In addition, several otherindustries showed employment increases last year. Inthe nonmanufacturing sector trade, services, andgovernment each had employment increases of morethan 1,000 workers. Unemployment was near the 3per cent level throughout the 12-month period endingin November 1966, well below the rate for most ofthe previous 12 months.tThe SMSA consists of Shelby County, Tennessee andCrittenden County, Arkansas,
Per Cent Unemployment Rate Per Cent
C
UPmoge 14

Spending, as measured by check payments, roserapidly in early 1966 but dropped sharpiy after mid-
) year. The net gain for the 12 months was 1.6 percent, substantially below the 9 per cent trend ratefor tile area.
Banking activity, after risimlg rapidly during most
(If tile period from 1960 to 1964, slowed considerablyduring tile last two years. Deposits ill 1966 moved up
2.9 per cent, well below the 11 per cent annual in-
crease from 1960 to 1965. This low rate of deposit in-crease probably reflects the 4 per cent hsnit 011 interestrates that can be paid on time and savings deposits byTemlnessee banks. Business loans rose rapidly duringthe first seven ononths of 1966 but declined sharply
after August. Near the end of the year these loans
were 3.5 per cent heio\v year-earlier levels.
B ULK MAILiNGS of this bank’s REVIEW for classroom use will be
made monthly during the school year to teachers requesting this service.
Requests should be directed to: Research Department, Federal Reserve
Bank of St. Louis, P. 0. Box 442, St. Louis, Missouri 63166.
Page 15
0’
Related Documents