Expansion of gallery forests into central Brazilian savannas LUCAS C. R. SILVA *w , LEONEL STERNBERG z, MUNDAYATAN HARIDASAN§, WILLIAM A. HOFFMANN } , FERNANDO MIRALLES-WILHELM k and AUGUSTO C. FRANCO ** *Embrapa Cerrados Agricultural Research Center, Planaltina, DF 73310-970, Brazil, wDepartment of Forest Engineering, University of Brasilia, DF, Brazil, zDepartment of Biology, University of Miami, Coral Gables, FL 33124, USA, §Department of Ecology, University of Brasilia, Brasilia, DF 70904-970, Brazil, }Department of Plant Biology, North Carolina State University, Raleigh, NC 27695, USA, kSoutheast Environmental Research Center, Florida International University, Miami, FL 33199, USA, **Department of Botany, University of Brasilia, Brasilia, DF 70904-970, Brazil Abstract Upland tropical forests have expanded and contracted in response to past climates, but it is not clear whether similar dynamics were exhibited by gallery (riparian) forests within savanna biomes. Because such forests generally have access to ample water, their extent may be buffered against changing climates. We tested the long-term stability of gallery forest boundaries by characterizing the border between gallery forests and savannas and tracing the presence of gallery forest through isotopic analysis of organic carbon in the soil profile. We measured leaf area index, grass vs. shrub or tree coverage, the organic carbon, phosphorus, nitrogen and calcium concentrations in soils and the carbon isotope ratios of soil organic matter in two transitions spanning gallery forests and savanna in a Cerrado ecosystem. Gallery forests without grasses typically show a greater leaf area index in contrast to savannas, which show dense grass coverage. Soils of gallery forests have significantly greater concentrations of organic carbon, phosphorus, nitrogen and calcium than those of savannas. Soil organic carbon of savannas is significantly more enriched in 13 C compared with that of gallery forests. This difference in enrichment is in part caused by the presence of C 4 grasses in savanna ecosystem and its absence in gallery forests. Using the 13 C abundance as a signature for savanna and gallery forest ecosystems in 1 m soil cores, we show that the borders of gallery forests have expanded into the savanna and that this process initiated at least 3000–4000 BP based on 14 C analysis. Gallery forests, however, may be still expanding as we found more recent transitions according to 14 C activity measurements. We discuss the possible mechanisms of gallery forest expansion and the means by which nutrients required for the expansion of gallery forest might accumulate. Keywords: carbon isotope ratios, carbon sink, carbon stocks, climate change, gallery forest, leaf area index, nutrients, savanna, tropical ecosystems, vegetation dynamics Received 17 December 2007; revised version received 11 February 2008 and accepted 23 February 2008 Introduction The Cerrado biome of central Brazil encompasses open grassy fields (known as campo limpo), a savanna vege- tation of variable structure (known as Cerrado sensu lato) and forest corridors along stream and river basins (known as gallery forests; Ribeiro & Walter, 1998). This biome covers a region of approximately 2 000 000 km 2 (Ribeiro & Walter, 2001; Oliveira-Filho & Ratter, 2002), 5% of which is occupied by gallery forests. Gallery forests hold 1/3 of whole Cerrado plant diversity (Ribeiro & Walter, 2001) and represent the greatest biodiversity per area in the Cerrado biome (Mendonc ¸a et al., 1998). Gallery forest soils typically have greater nutrient and water availability compared with the neighboring savanna (Furley, 1992; Haridasan, 1998) and boundaries between gallery forest and savanna tend to be sharp (Furley, 1992). In other savanna regions, sharp forest–savanna boundaries are believed to arise primarily due to fires, Correspondence: Leonel Sternberg, Department of Biology, University of Miami, Coral Gables, FL 33124, USA, tel. 1 1 305 284 6436, fax 1 1 305 284 3039, e-mail: [email protected] Global Change Biology (2008) 14, 2108–2118, doi: 10.1111/j.1365-2486.2008.01637.x r 2008 The Authors 2108 Journal compilation r 2008 Blackwell Publishing Ltd

Welcome message from author
This document is posted to help you gain knowledge. Please leave a comment to let me know what you think about it! Share it to your friends and learn new things together.
Transcript
Expansion of gallery forests into central Braziliansavannas
L U C A S C . R . S I LVA *w, L E O N E L S T E R N B E R G z, M U N D AYA T A N H A R I D A S A N § , W I L L I A M
A . H O F F M A N N } , F E R N A N D O M I R A L L E S - W I L H E L M k and A U G U S T O C . F R A N C O **
*Embrapa Cerrados Agricultural Research Center, Planaltina, DF 73310-970, Brazil, wDepartment of Forest Engineering,
University of Brasilia, DF, Brazil, zDepartment of Biology, University of Miami, Coral Gables, FL 33124, USA, §Department of
Ecology, University of Brasilia, Brasilia, DF 70904-970, Brazil, }Department of Plant Biology, North Carolina State University,
Raleigh, NC 27695, USA, kSoutheast Environmental Research Center, Florida International University, Miami, FL 33199, USA,**Department of Botany, University of Brasilia, Brasilia, DF 70904-970, Brazil
Abstract
Upland tropical forests have expanded and contracted in response to past climates, but it
is not clear whether similar dynamics were exhibited by gallery (riparian) forests within
savanna biomes. Because such forests generally have access to ample water, their extent
may be buffered against changing climates. We tested the long-term stability of gallery
forest boundaries by characterizing the border between gallery forests and savannas and
tracing the presence of gallery forest through isotopic analysis of organic carbon in the
soil profile. We measured leaf area index, grass vs. shrub or tree coverage, the organic
carbon, phosphorus, nitrogen and calcium concentrations in soils and the carbon isotope
ratios of soil organic matter in two transitions spanning gallery forests and savanna in
a Cerrado ecosystem. Gallery forests without grasses typically show a greater leaf area
index in contrast to savannas, which show dense grass coverage. Soils of gallery forests
have significantly greater concentrations of organic carbon, phosphorus, nitrogen and
calcium than those of savannas. Soil organic carbon of savannas is significantly more
enriched in 13C compared with that of gallery forests. This difference in enrichment is in
part caused by the presence of C4 grasses in savanna ecosystem and its absence in gallery
forests. Using the 13C abundance as a signature for savanna and gallery forest ecosystems
in 1 m soil cores, we show that the borders of gallery forests have expanded into the
savanna and that this process initiated at least 3000–4000 BP based on 14C analysis.
Gallery forests, however, may be still expanding as we found more recent transitions
according to 14C activity measurements. We discuss the possible mechanisms of gallery
forest expansion and the means by which nutrients required for the expansion of gallery
forest might accumulate.
Keywords: carbon isotope ratios, carbon sink, carbon stocks, climate change, gallery forest, leaf area
index, nutrients, savanna, tropical ecosystems, vegetation dynamics
Received 17 December 2007; revised version received 11 February 2008 and accepted 23 February 2008
Introduction
The Cerrado biome of central Brazil encompasses open
grassy fields (known as campo limpo), a savanna vege-
tation of variable structure (known as Cerrado sensu
lato) and forest corridors along stream and river basins
(known as gallery forests; Ribeiro & Walter, 1998). This
biome covers a region of approximately 2 000 000 km2
(Ribeiro & Walter, 2001; Oliveira-Filho & Ratter, 2002),
5% of which is occupied by gallery forests. Gallery
forests hold 1/3 of whole Cerrado plant diversity
(Ribeiro & Walter, 2001) and represent the greatest
biodiversity per area in the Cerrado biome (Mendonca
et al., 1998). Gallery forest soils typically have greater
nutrient and water availability compared with the
neighboring savanna (Furley, 1992; Haridasan, 1998)
and boundaries between gallery forest and savanna
tend to be sharp (Furley, 1992).
In other savanna regions, sharp forest–savanna
boundaries are believed to arise primarily due to fires,
Correspondence: Leonel Sternberg, Department of Biology,
University of Miami, Coral Gables, FL 33124, USA, tel. 1 1 305 284
6436, fax 1 1 305 284 3039, e-mail: [email protected]
Global Change Biology (2008) 14, 2108–2118, doi: 10.1111/j.1365-2486.2008.01637.x
r 2008 The Authors2108 Journal compilation r 2008 Blackwell Publishing Ltd
which are common in savanna but do not typically
penetrate into the forest (Biddulph & Kellman, 1998).
To the extent that fire and climate govern the dynamics
of gallery forest boundaries, their position may not be
stable. The effect of fire in forest–savanna boundaries is
particularly relevant in view of interest on future cli-
mate change. Projections by the Brazilian National
Space Institute (INPE) indicate that global warming
would cause a decrease in rainfall in the Cerrado biome
of Brazil (Marengo, 2007). Because gallery forests are
believed to have abundant access to ground water and
runoff, it is not clear whether gallery forests will be as
sensitive to this decrease in rainfall as other forest types.
Of further interest is the hypothesis that the replace-
ment of savannas with gallery forests having a greater
biomass would represent an increase in carbon stocks.
As gallery forests tend to follow streambeds, their
perimeter-to-area ratios are large and a small incremen-
tal expansion of forests into savanna would mean
a relatively large increase in forest area.
The boundary between gallery forests and savannas
has often been suggested to be determined by edaphic
characteristics of the landscape (Furley, 1992). Soil
properties such as soil organic matter (SOM) concentra-
tion and exchangeable cations can be closely correlated
with the vegetation physiognomy in the Cerrado biome
of central Brazil (Furley, 1992). It is not known, however,
if these characteristics are the cause or the effect of
vegetation differences.
It is likely that the boundaries between savannas and
gallery forests will remain fixed if the vegetation reacts
passively to edaphic conditions. However, vegetation
can profoundly affect the distribution and retention of
nutrients in the soil profile and other soil characteristics
(Chapin et al., 1997; Jobbagy & Jackson, 2004). Likewise,
the vegetation can influence regional and local climate
(Hoffmann & Jackson, 2000; Sternberg, 2001; Oyama &
Nobre, 2003). If such is the case, then it is likely that
savanna–forest boundaries are dynamic with positive
feedback loops driven by changes in climate and/or
disturbances (Sternberg, 2001; Hoffmann et al., 2002;
Oyama & Nobre, 2003; Beerling & Osborne, 2006).
Here, we compare modern characteristics of gallery
forests and savannas considering both vegetation struc-
ture (leaf area index of grasses and trees) and edaphic
properties, including soil organic carbon, phosphorus
(P), nitrogen (N) and calcium (Ca) concentrations and
carbon isotope ratios of SOM. Phosphorus, nitrogen and
calcium are considered the most important in limiting
the aboveground biomass of central Brazilian savanna
ecosystems (Haridasan, 1992, 2005). We then test
whether the boundary between gallery forests and
savannas in central Brazil has been stable. To do so,
we rely on isotopic signatures to measure the relative
contribution of trees and grasses to SOM through the
soil profile along two transects spanning forests and
savannas. The feasibility of this technique is based on
two assumptions. First, SOM through the soil profile in
part represents a chronological sequence of the vegeta-
tion signature, with past vegetation recorded at deeper
levels of the soil profile compared with present day
vegetation (Victoria et al., 1995; Boutton et al., 1998).
However, SOM at lower depths in the soil profile, in
addition to having carbon from the previous vegetation
also has carbon from root exudates or mobile organic
carbon from the present vegetation (Krull et al., 2002).
Second, the difference in the mean carbon isotopic
ratios between biomass of savannas and forests leads
to different signatures in their respective SOM. This
difference, in part, is based on the abundance of C4
grasses in savannas compared to gallery forests (Klink
& Joly, 1989; Victoria et al., 1995; Martinelli et al., 1996;
Beerling & Osborne, 2006). C4 plants discriminate less
against 13C compared with C3 plants (Smith & Epstein,
1971). So, we expect that total savanna biomass and
SOM will be more enriched in 13C compared with
forests having only C3 plants. There are several pro-
cesses that can modify the isotopic signature of SOM
relative to that of the standing vegetation biomass
(Ehleringer et al., 2000). Even with these isotopic mod-
ifications, however, this method has been used success-
fully in the interpretation of past vegetation changes in
wetlands and savannas of Brazil (Victoria et al., 1995;
Martinelli et al., 1996; Sanaiotti et al., 2002), Africa
(Giresse et al., 1994), United States (Boutton et al., 1998)
and Australia (Bowman et al., 2004). Our study repre-
sents the first analysis of trends along a transition cover-
ing gallery forests and savannas. We estimate the date of
changes in vegetation by 14C analysis of SOM and
consider possible mechanisms causing ecotonal shifts.
Materials and methods
Site description
Measurements were done at the Ecological Reserve
of the Brazilian Institute of Geography and Statistics
(RECOR-IBGE) located near the city of Brasilia (Federal
District, Brazil) at 1515604100S and 4715600700W and at an
elevation of 1100 m a.s.l. The average annual rainfall at
this site is 1426 mm (1993–2002), having a distinct
5-month dry season (May–September) and an average
annual temperature of 22.5 1C. This area (1300 ha) was
designated as a conservation area in 1975 and protected
against fire for approximately 30 years. The reserve is
a patchwork of several different vegetation physiog-
nomies of the Cerrado biome, having abundant stands
of gallery forest associated with several streams (Fig. 1).
G A L L E R Y F O R E S T E X PA N S I O N 2109
r 2008 The AuthorsJournal compilation r 2008 Blackwell Publishing Ltd, Global Change Biology, 14, 2108–2118
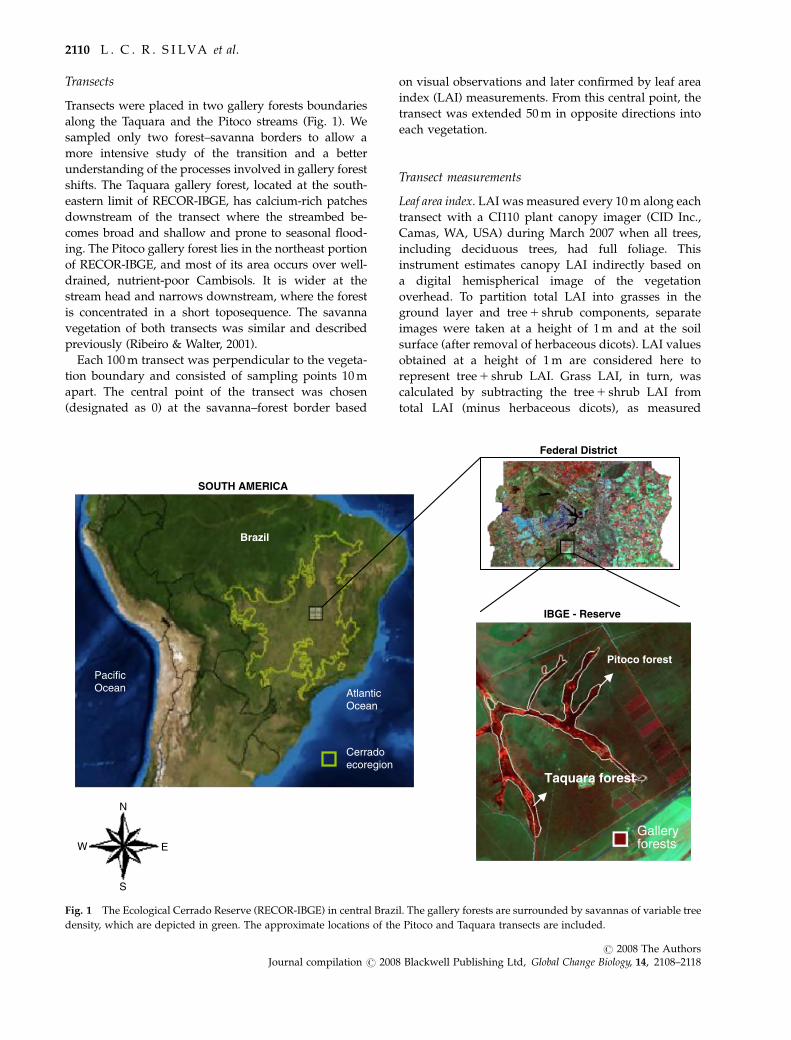
Transects
Transects were placed in two gallery forests boundaries
along the Taquara and the Pitoco streams (Fig. 1). We
sampled only two forest–savanna borders to allow a
more intensive study of the transition and a better
understanding of the processes involved in gallery forest
shifts. The Taquara gallery forest, located at the south-
eastern limit of RECOR-IBGE, has calcium-rich patches
downstream of the transect where the streambed be-
comes broad and shallow and prone to seasonal flood-
ing. The Pitoco gallery forest lies in the northeast portion
of RECOR-IBGE, and most of its area occurs over well-
drained, nutrient-poor Cambisols. It is wider at the
stream head and narrows downstream, where the forest
is concentrated in a short toposequence. The savanna
vegetation of both transects was similar and described
previously (Ribeiro & Walter, 2001).
Each 100 m transect was perpendicular to the vegeta-
tion boundary and consisted of sampling points 10 m
apart. The central point of the transect was chosen
(designated as 0) at the savanna–forest border based
on visual observations and later confirmed by leaf area
index (LAI) measurements. From this central point, the
transect was extended 50 m in opposite directions into
each vegetation.
Transect measurements
Leaf area index. LAI was measured every 10 m along each
transect with a CI110 plant canopy imager (CID Inc.,
Camas, WA, USA) during March 2007 when all trees,
including deciduous trees, had full foliage. This
instrument estimates canopy LAI indirectly based on
a digital hemispherical image of the vegetation
overhead. To partition total LAI into grasses in the
ground layer and tree 1 shrub components, separate
images were taken at a height of 1 m and at the soil
surface (after removal of herbaceous dicots). LAI values
obtained at a height of 1 m are considered here to
represent tree 1 shrub LAI. Grass LAI, in turn, was
calculated by subtracting the tree 1 shrub LAI from
total LAI (minus herbaceous dicots), as measured
Brazil
AtlanticOcean
PacificOcean
Cerradoecoregion
Taquara forest
Pitoco forest
Galleryforests
Federal District
IBGE - Reserve
SOUTH AMERICA
N
S
W E
Fig. 1 The Ecological Cerrado Reserve (RECOR-IBGE) in central Brazil. The gallery forests are surrounded by savannas of variable tree
density, which are depicted in green. The approximate locations of the Pitoco and Taquara transects are included.
2110 L . C . R . S I LVA et al.
r 2008 The AuthorsJournal compilation r 2008 Blackwell Publishing Ltd, Global Change Biology, 14, 2108–2118

from the soil surface. The values obtained in this
manner are a measure of total vegetation area index,
and as such are meant to quantify vegetation density
rather than green leaf area per se. For trees, our values of
LAI include stem area, as well as leaf area. For grasses,
LAI comprise both living and dead leaf area.
Soil core analyses
Soil cores were taken every 10 m along each transect to
the depth of 1 m, and soil samples were collected every
10 cm of depth. Soil samples were acquired by pressing
100 cm3 tubes into each layer of sequentially dug soil
pits. Tubes were inserted so that pressure was only
exerted in the tube walls, thereby preventing soil com-
paction and overestimation of soil density. Soil samples
were dried at room temperature after which the fine
roots were separated by sieving through a 0.8 mm mesh.
We analyzed the soil samples for density using the mass
of soil dried at 70 1C for 2 days. Available phosphorus
concentration was determined by the method of
Mehlich (1953). Exchangeable calcium was extracted
by a 1 M KCl solution and its concentration determined
by atomic absorption, while total nitrogen was deter-
mined by the Kjeldhal method (Bremner & Mulvaney,
1982). Organic carbon content was analyzed by wet
oxidation (Walkley & Black, 1934). Soil organic carbon
was always analyzed with two standard soils showing
contrasting carbon percentages having the analytical
error of o� 5% of the soil carbon content. We calcu-
lated the organic carbon stock (T ha�1) of the soil by
multiplying carbon concentration by total soil mass per
hectare using bulk density measurements and thickness
of the sampled layer. The total soil organic carbon stock
(T ha�1) to a depth of 1 m was summed using the
organic carbon stocks at each 10 cm depth interval. We
tested for a significant difference in soil organic carbon
content between forests and savanna at each level of the
soil profile using a one-way ANOVA with replication. We
considered the cores within each ecosystem as repli-
cates. Because this involved 10 different tests for each
transect, we corrected for the experiment-wise error rate
by making the significance level more stringent with the
Dunn–Sidak method (Sokal & Rohlf, 1995). We tested
for differences in total carbon per hectare between
forests, savannas and border using a one-way ANOVA.
Carbon isotope ratios of soil samples were deter-
mined at the Laboratory of Stable Isotope Ecology
in Tropical Ecosystems (LSIETE) at the University of
Miami. Soil samples (10 mg) were loaded in tin cups
(3 mm diameter and 8 mm height; Elemental Micro-
analysis, Milan, Italy), which were placed in an
automated elemental analyzer (Euro-EA-Elemental
Analyzer, Eurovector, Milan, Italy) connected to a
continuous flow isotope ratio mass spectrometer
(Isoprime, GV, Manchester, UK). Soil samples were
not pretreated with acid to remove carbonates because
soil in this area is acidic (pH 4.5–5.5) and unlikely
to have inorganic carbon. Carbon-13 abundances are
expressed as d13C values:
d13Cð%Þ ¼ ½ðRsample=RPDBÞ � 1� � 1000;
in which Rsample and RPDB represent the 13C/12C ratios
of the sample and PeeDee standard, respectively. The
precision of analysis was � 0.1% ( � s).
We analyzed 14C activity of carbon in SOM from
depths in the soil profiles which showed major shifts
from savanna to forest, which were: Taquara border at
20–30 cm depth, Pitoco border at 80–90 cm depth and
one 50 m in the Pitoco forest at 40–50 cm depth. Carbon-
14 activity of SOM was analyzed by accelerator
mass spectrometry (AMS) and converted to mean
age of SOM at Beta Analytic Radiocarbon Dating
Laboratory (Miami, USA).
Results
LAI of trees and shrubs shows a transition from high
values of 2.8 to 4.2 inside the gallery forest to low values
of o1 within 10 m of the forest–savanna boundary
(Fig. 2). In contrast, the LAI of grasses was higher
within the savanna ranging from 1.5 to 2.5 and quickly
declining to 0 inside the forest (Fig. 2).
The carbon stock at each depth of the soil profile was
significantly higher in the two forests compared to the
savanna at all soil depths with the exception of
the carbon stock at 10–20 cm at the Pitoco transect
(Po0.005; Fig. 3a). Carbon stocks ranged between 60
and 120 T ha�1 for Taquara forest which was much
greater than the observed 30 and 50 T ha�1 for Pitoco
forest. Savanna soil carbon stocks were o30 T ha�1,
0
1
2
3
4
5
−50
FOREST
Leaf
are
a in
dex
Distance from border (m)
SAVANNA
50403020100−10−20−30−40
BORDER
Fig. 2 Leaf area index for trees/shrubs and grasses along the
Taquara and the Pitoco transects encompassing gallery forests
and savanna.
G A L L E R Y F O R E S T E X PA N S I O N 2111
r 2008 The AuthorsJournal compilation r 2008 Blackwell Publishing Ltd, Global Change Biology, 14, 2108–2118

even near the surface. Carbon stocks integrated to 1 m
depth and 1 ha at the Taquara and Pitoco forest (�1000
and 400 T ha�1, respectively) are significantly greater
than carbon stocks of approximately 200 T ha�1 found
in the savanna (F 5 102 and 36 respectively, Po0.01 for
both transects; Fig. 3b).
The tree/shrub and grass leaf area indices were
highly correlated with the d13C value of the soil organic
carbon at the surface for both transects (Fig. 4). These
high correlations are consistent with an increase of grass
LAI causing an increase in the d13C value of SOM and
an increase of tree/shrub LAI causing a decrease in the
d13C value of surface SOM (Fig. 4).
Soil total nitrogen, available phosphorus and ex-
changeable calcium concentrations averaged over the
1 m soil profile or at the soil surface (0–10 cm) were
higher in the gallery forests compared with the savan-
nas (Fig. 5). Total nitrogen and available phosphorus
concentration along the savanna–gallery forest transect
bb
a
a
0
200
400
600
800
1000
1200
Taquaratransect
Pitocotransect
SavannaBorderForest
Tot
al o
rgan
ic c
arbo
n (T
ha−1
)
0–10
(a)
(b)
10–20
20–30
30–40
40–50
50–60
60–70
70–80
80–90
90–100
0–10
10–20
20–30
30–40
40–50
50–60
60–70
70–80
80–90
90–100
Savanna
Gallery forest
Pitoco transect
Taquara transect
Dep
th (
cm)
Dep
th (
cm)
150
Organic carbon (T ha−1)
50250255075100125
Fig. 3 Average organic carbon stocks (� s, n 5 5) of gallery forests and savanna areas at each depth in a 1 m soil profile (a). The average
total organic carbon stocks (� s, n 5 5 for forests and savannas; n 5 1 for border) in the top meter of the soil profile for savanna, border
and forest for each transect (b). Different letters in part (b) represent statistical difference between means.
y = −2.9981Ln(x) − 22.012R = 0.633
y = 3.3104x − 25.967R = 0.817
−29
−27
−25
−23
−21
−19
−17
−150
Leaf area index
Sup
erfic
ial s
oil �
C
(‰
)
54321
Fig. 4 The d13C values of the superficial soil organic matter
(0–10 cm) along the transects as a function of grass and trees/
shrub coverage.
2112 L . C . R . S I LVA et al.
r 2008 The AuthorsJournal compilation r 2008 Blackwell Publishing Ltd, Global Change Biology, 14, 2108–2118
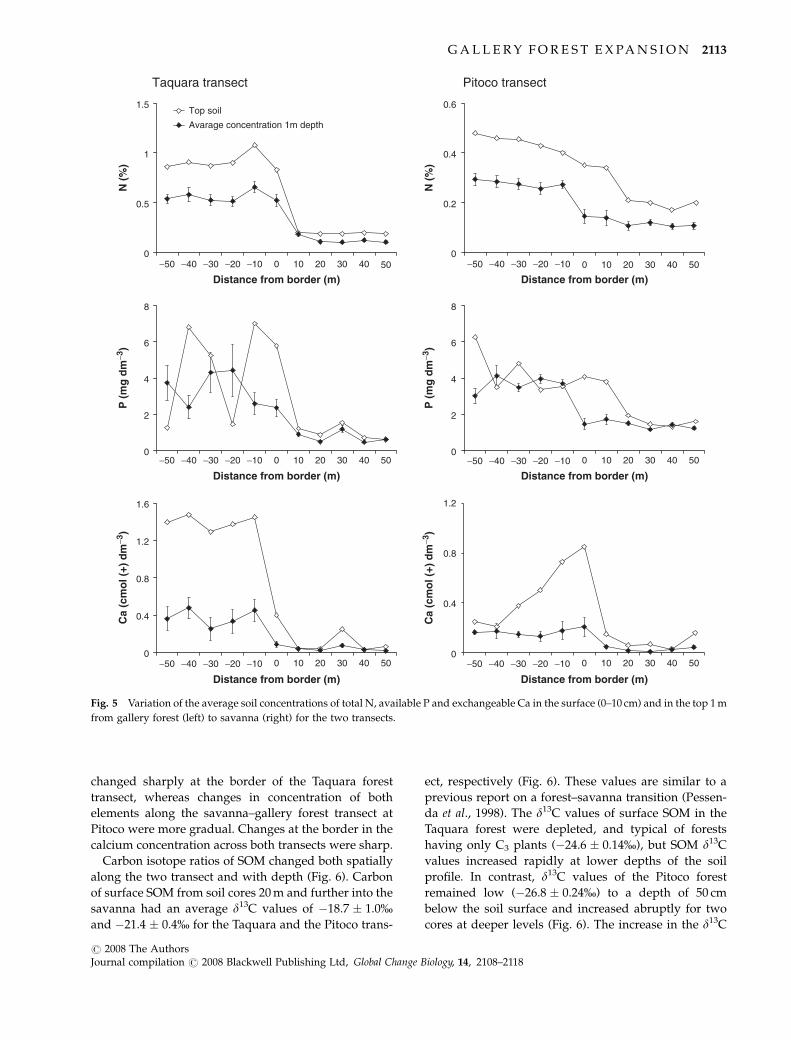
changed sharply at the border of the Taquara forest
transect, whereas changes in concentration of both
elements along the savanna–gallery forest transect at
Pitoco were more gradual. Changes at the border in the
calcium concentration across both transects were sharp.
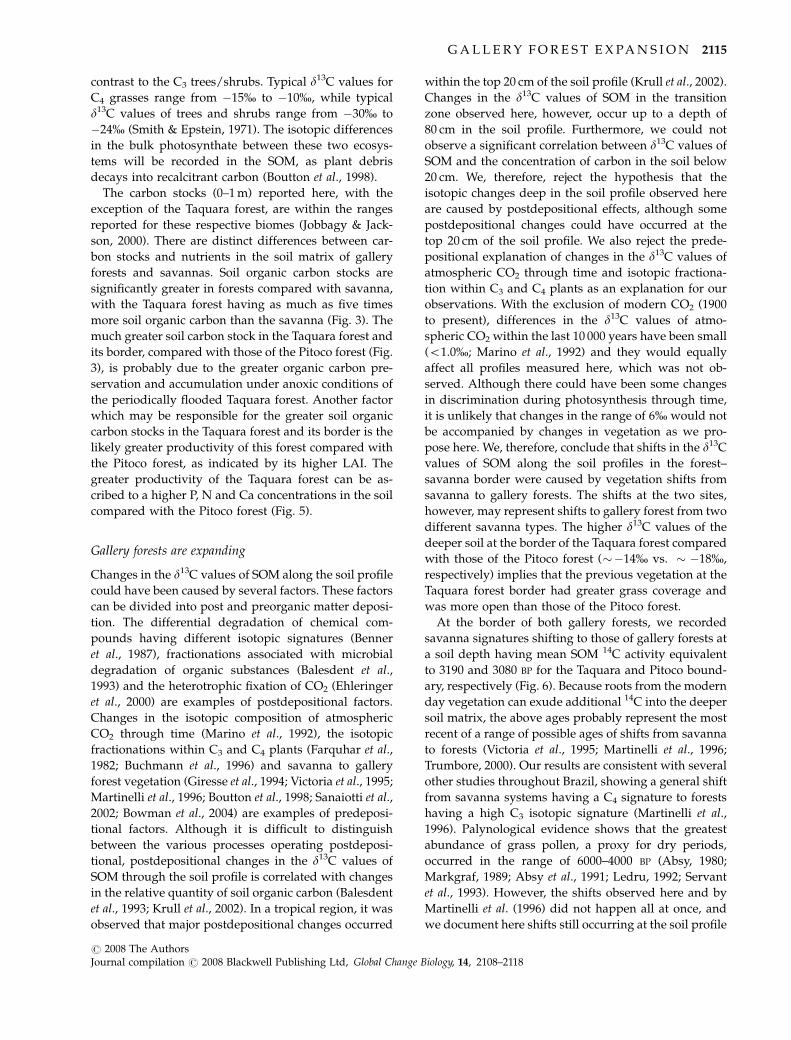
Carbon isotope ratios of SOM changed both spatially
along the two transect and with depth (Fig. 6). Carbon
of surface SOM from soil cores 20 m and further into the
savanna had an average d13C values of �18.7 � 1.0%and �21.4 � 0.4% for the Taquara and the Pitoco trans-
ect, respectively (Fig. 6). These values are similar to a
previous report on a forest–savanna transition (Pessen-
da et al., 1998). The d13C values of surface SOM in the
Taquara forest were depleted, and typical of forests
having only C3 plants (�24.6 � 0.14%), but SOM d13C
values increased rapidly at lower depths of the soil
profile. In contrast, d13C values of the Pitoco forest
remained low (�26.8 � 0.24%) to a depth of 50 cm
below the soil surface and increased abruptly for two
cores at deeper levels (Fig. 6). The increase in the d13C
0
1.2
Distance from border (m)
Ca
(cm
ol (
+) d
m−3
)
0
0.4
0.8
1.2
1.6
Distance from border (m)
Ca
(cm
ol (
+) d
m−3
)
0
2
4
6
8
Distance from border (m)
P (
mg
dm
−3)
0
2
4
6
8
Distance from border (m)
P (
mg
dm
−3)
0
Distance from border (m)
N (
%)
0
0.5
1
1.5
−40
Distance from border (m)
N (
%)
Top soil
Avarage concentration 1m depth
0.8
0.4
0.6
0.4
0.2
Taquara transect
50403020100−10−20−30−50
−40 50403020100−10−20−30−50
−40 50403020100−10−20−30−50
−40 50403020100−10−20−30−50
−40 50403020100−10−20−30−50
−40 50403020100−10−20−30−50
Pitoco transect
Fig. 5 Variation of the average soil concentrations of total N, available P and exchangeable Ca in the surface (0–10 cm) and in the top 1 m
from gallery forest (left) to savanna (right) for the two transects.
G A L L E R Y F O R E S T E X PA N S I O N 2113
r 2008 The AuthorsJournal compilation r 2008 Blackwell Publishing Ltd, Global Change Biology, 14, 2108–2118
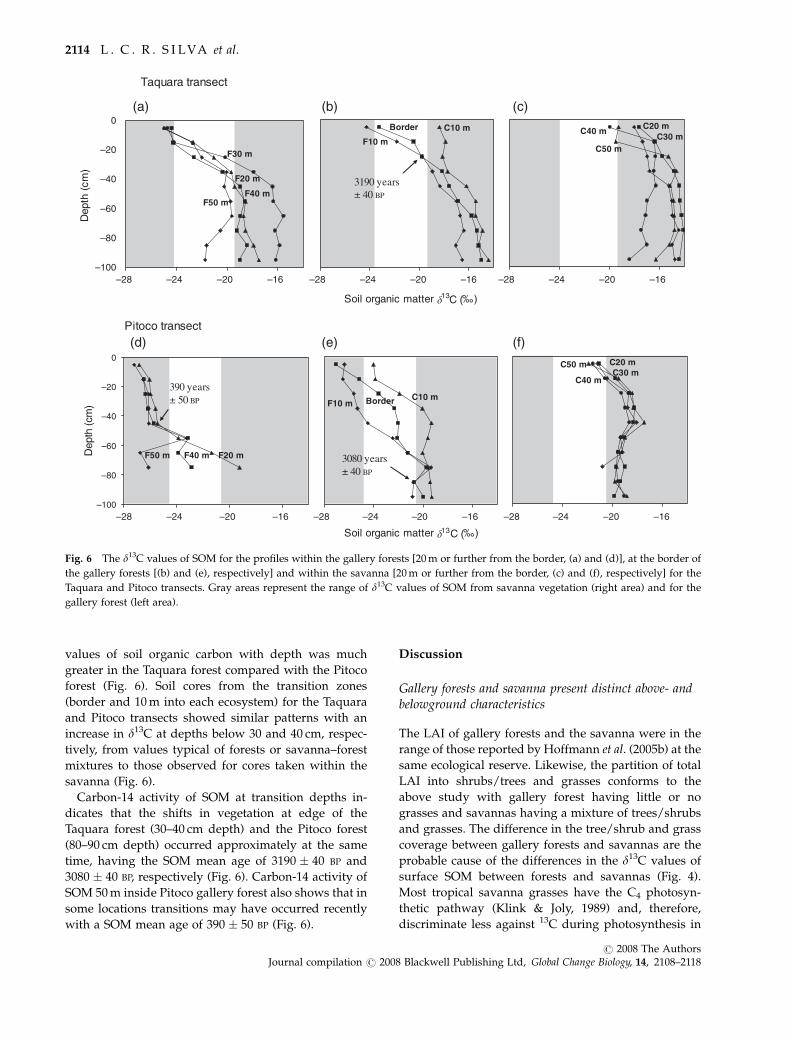
values of soil organic carbon with depth was much
greater in the Taquara forest compared with the Pitoco
forest (Fig. 6). Soil cores from the transition zones
(border and 10 m into each ecosystem) for the Taquara
and Pitoco transects showed similar patterns with an
increase in d13C at depths below 30 and 40 cm, respec-
tively, from values typical of forests or savanna–forest
mixtures to those observed for cores taken within the
savanna (Fig. 6).
Carbon-14 activity of SOM at transition depths in-
dicates that the shifts in vegetation at edge of the
Taquara forest (30–40 cm depth) and the Pitoco forest
(80–90 cm depth) occurred approximately at the same
time, having the SOM mean age of 3190 � 40 BP and
3080 � 40 BP, respectively (Fig. 6). Carbon-14 activity of
SOM 50 m inside Pitoco gallery forest also shows that in
some locations transitions may have occurred recently
with a SOM mean age of 390 � 50 BP (Fig. 6).
Discussion
Gallery forests and savanna present distinct above- andbelowground characteristics
The LAI of gallery forests and the savanna were in the
range of those reported by Hoffmann et al. (2005b) at the
same ecological reserve. Likewise, the partition of total
LAI into shrubs/trees and grasses conforms to the
above study with gallery forest having little or no
grasses and savannas having a mixture of trees/shrubs
and grasses. The difference in the tree/shrub and grass
coverage between gallery forests and savannas are the
probable cause of the differences in the d13C values of
surface SOM between forests and savannas (Fig. 4).
Most tropical savanna grasses have the C4 photosyn-
thetic pathway (Klink & Joly, 1989) and, therefore,
discriminate less against 13C during photosynthesis in
F10 m Border C10 m
C20 mC30 m
C40 m
C50 m
F50 m
–100
–80
–60
–40
–20
0
F50 mF40 m
F20 m
F30 m
–100
–80
–60
–40
–20
0
F10 m
Border C10 m C20 mC30 m
C40 m
C50 m
(a) (b) (c)
(d) (e) (f)
3190 years± 40 BP
390 years± 50 BP
3080 years± 40 BP
Dep
th (c
m)
Dep
th (
cm)
Soil organic matter C (‰)
Soil organic matter C (‰)
Taquara transect
Pitoco transect
–28 –24 –20 –16 –28 –24 –20 –16 –28 –24 –20 –16
–28 –24 –20 –16 –28 –24 –20 –16 –28 –24 –20 –16
F20 mF40 m
Fig. 6 The d13C values of SOM for the profiles within the gallery forests [20 m or further from the border, (a) and (d)], at the border of
the gallery forests [(b) and (e), respectively] and within the savanna [20 m or further from the border, (c) and (f), respectively] for the
Taquara and Pitoco transects. Gray areas represent the range of d13C values of SOM from savanna vegetation (right area) and for the
gallery forest (left area).
2114 L . C . R . S I LVA et al.
r 2008 The AuthorsJournal compilation r 2008 Blackwell Publishing Ltd, Global Change Biology, 14, 2108–2118
contrast to the C3 trees/shrubs. Typical d13C values for
C4 grasses range from �15% to �10%, while typical
d13C values of trees and shrubs range from �30% to
�24% (Smith & Epstein, 1971). The isotopic differences
in the bulk photosynthate between these two ecosys-
tems will be recorded in the SOM, as plant debris
decays into recalcitrant carbon (Boutton et al., 1998).
The carbon stocks (0–1 m) reported here, with the
exception of the Taquara forest, are within the ranges
reported for these respective biomes (Jobbagy & Jack-
son, 2000). There are distinct differences between car-
bon stocks and nutrients in the soil matrix of gallery
forests and savannas. Soil organic carbon stocks are
significantly greater in forests compared with savanna,
with the Taquara forest having as much as five times
more soil organic carbon than the savanna (Fig. 3). The
much greater soil carbon stock in the Taquara forest and
its border, compared with those of the Pitoco forest (Fig.
3), is probably due to the greater organic carbon pre-
servation and accumulation under anoxic conditions of
the periodically flooded Taquara forest. Another factor
which may be responsible for the greater soil organic
carbon stocks in the Taquara forest and its border is the
likely greater productivity of this forest compared with
the Pitoco forest, as indicated by its higher LAI. The
greater productivity of the Taquara forest can be as-
cribed to a higher P, N and Ca concentrations in the soil
compared with the Pitoco forest (Fig. 5).
Gallery forests are expanding
Changes in the d13C values of SOM along the soil profile
could have been caused by several factors. These factors
can be divided into post and preorganic matter deposi-
tion. The differential degradation of chemical com-
pounds having different isotopic signatures (Benner
et al., 1987), fractionations associated with microbial
degradation of organic substances (Balesdent et al.,
1993) and the heterotrophic fixation of CO2 (Ehleringer
et al., 2000) are examples of postdepositional factors.
Changes in the isotopic composition of atmospheric
CO2 through time (Marino et al., 1992), the isotopic
fractionations within C3 and C4 plants (Farquhar et al.,
1982; Buchmann et al., 1996) and savanna to gallery
forest vegetation (Giresse et al., 1994; Victoria et al., 1995;
Martinelli et al., 1996; Boutton et al., 1998; Sanaiotti et al.,
2002; Bowman et al., 2004) are examples of predeposi-
tional factors. Although it is difficult to distinguish
between the various processes operating postdeposi-
tional, postdepositional changes in the d13C values of
SOM through the soil profile is correlated with changes
in the relative quantity of soil organic carbon (Balesdent
et al., 1993; Krull et al., 2002). In a tropical region, it was
observed that major postdepositional changes occurred
within the top 20 cm of the soil profile (Krull et al., 2002).
Changes in the d13C values of SOM in the transition
zone observed here, however, occur up to a depth of
80 cm in the soil profile. Furthermore, we could not
observe a significant correlation between d13C values of
SOM and the concentration of carbon in the soil below
20 cm. We, therefore, reject the hypothesis that the
isotopic changes deep in the soil profile observed here
are caused by postdepositional effects, although some
postdepositional changes could have occurred at the
top 20 cm of the soil profile. We also reject the prede-
positional explanation of changes in the d13C values of
atmospheric CO2 through time and isotopic fractiona-
tion within C3 and C4 plants as an explanation for our
observations. With the exclusion of modern CO2 (1900
to present), differences in the d13C values of atmo-
spheric CO2 within the last 10 000 years have been small
(o1.0%; Marino et al., 1992) and they would equally
affect all profiles measured here, which was not ob-
served. Although there could have been some changes
in discrimination during photosynthesis through time,
it is unlikely that changes in the range of 6% would not
be accompanied by changes in vegetation as we pro-
pose here. We, therefore, conclude that shifts in the d13C
values of SOM along the soil profiles in the forest–
savanna border were caused by vegetation shifts from
savanna to gallery forests. The shifts at the two sites,
however, may represent shifts to gallery forest from two
different savanna types. The higher d13C values of the
deeper soil at the border of the Taquara forest compared
with those of the Pitoco forest (��14% vs. � �18%,
respectively) implies that the previous vegetation at the
Taquara forest border had greater grass coverage and
was more open than those of the Pitoco forest.
At the border of both gallery forests, we recorded
savanna signatures shifting to those of gallery forests at
a soil depth having mean SOM 14C activity equivalent
to 3190 and 3080 BP for the Taquara and Pitoco bound-
ary, respectively (Fig. 6). Because roots from the modern
day vegetation can exude additional 14C into the deeper
soil matrix, the above ages probably represent the most
recent of a range of possible ages of shifts from savanna
to forests (Victoria et al., 1995; Martinelli et al., 1996;
Trumbore, 2000). Our results are consistent with several
other studies throughout Brazil, showing a general shift
from savanna systems having a C4 signature to forests
having a high C3 isotopic signature (Martinelli et al.,
1996). Palynological evidence shows that the greatest
abundance of grass pollen, a proxy for dry periods,
occurred in the range of 6000–4000 BP (Absy, 1980;
Markgraf, 1989; Absy et al., 1991; Ledru, 1992; Servant
et al., 1993). However, the shifts observed here and by
Martinelli et al. (1996) did not happen all at once, and
we document here shifts still occurring at the soil profile
G A L L E R Y F O R E S T E X PA N S I O N 2115
r 2008 The AuthorsJournal compilation r 2008 Blackwell Publishing Ltd, Global Change Biology, 14, 2108–2118
with the SOM mean age of 390 BP (Fig. 6). Further
evidence of continued shift from savanna to forest is
provided by one core in the Pitoco transect 10 m inside
the savanna showing SOM isotopic characteristics simi-
lar to gallery forests (Fig. 6).
Mechanism of gallery forest expansion
Gallery forest expansion initiated at least 3000–4000
years ago and continues to expand as recently as
390 BP (Fig. 6). The approximate average date of gallery
forest expansion coincides with the expansion of other
types of tropical forests reported by Martinelli et al.
(1996) using the same techniques and of palynological
studies (Absy, 1980; Markgraf, 1989; Absy et al., 1991;
Ledru, 1992; Servant et al., 1993). This simultaneous
expansion of woody vegetation throughout several
regions in Brazil indicates that global climate change
initiated gallery forest expansion at this site. There are
several ways in which global climate change can bring
about changes in gallery forest coverage. Interglacial
periods associated with a higher atmospheric CO2 con-
centration, for example, favors the growth of woody C3
plants at the expense of the C4 grasses (Ehleringer et al.,
1997). The decrease in C4 grasses would lower fire
frequency and allow for the expansion of forests (Bond
et al., 2003). Postglacial climate change also brought
greater water availability. It is unlikely, however, that
greater water availability is the only direct cause of
forest expansion. It is well known that the standing
biomass of savannas is not only limited by the lack of
water (Sankaran et al., 2005), but by lack of nutrients
(Haridasan, 1992), drainage or high fire frequencies
(Higgins et al., 2007). Greater availability of water, for
example, could indirectly facilitate forest expansion by
decreasing fire frequency into the areas bordering
gallery forests.
Concentrations of P, N and Ca are significantly great-
er in the gallery forest soils compared with savanna
soils (Fig. 5), while soils at the border of the gallery
forests and savannas have intermediate concentrations.
These nutrients are the most limiting to woody vegeta-
tion growth in the central Brazilian savannas (Harida-
san, 1992, 2005). The gradients in nutrient concentration
differed markedly between the two gallery forest–
savanna transects, with the Taquara transect showing
a much sharper decline from forest to savanna com-
pared with the Pitoco transect (Fig. 5). This difference in
the profile between the two transects suggests that
nutrient accumulation necessary for the expansion of
gallery forests might have occurred by different me-
chanisms at each border. One possibility is that these
nutrients were already present at the border, but gallery
forest expansion was limited by other factors, such as
fire. This is a possible explanation for the expansion of
the Pitoco forest where the differences in nutrient con-
centration across the transect was less distinct. The
presence of forest species growing in the savanna but
not the other way around (Hoffmann et al., 2005a)
suggests that gallery forests are poised to invade sa-
vannas given the right conditions. Gallery forest species
at the Pitoco border, in the absence of fire, could
certainly find savanna microhabitats containing suffi-
cient nutrients to sustain their growth. However, the
scenario described earlier is unlikely for the Taquara
forest expansion because a sharp gradient in soil nu-
trients in transects crossing gallery and savanna eco-
systems was observed. A second possibility, and a more
likely scenario for the Taquara forest expansion, is that
the expanding gallery forests received more nutrients
via increased ground water flow from higher elevations
during wetter periods. Ground water nutrients are an
important component of nutrient input into gallery
forests (Markewitz et al., 2006). This would be a feasible
scenario for the Taquara forest expansion because it is
so close to the ground water and flooded periodically.
Ground water flow over thousand of years may bring
sufficient P, N and Ca to support gallery forest expan-
sion, even though P and Ca have a low mobility.
Once gallery forests begin establishing in savannas,
positive feedback effects may come into play and sta-
bilize the expansion. Nutrient inputs through atmo-
spheric deposition are known to be significant in this
area (Lilienfein & Wilcke, 2004). Gallery forests, by the
nature of their higher soil organic content and lower fire
frequency, may retain nutrients in the soil to a greater
degree than the savanna ecosystem. A more efficient
retention of nutrients may also be maintained by higher
transpiration of forests compared with savanna (Mir-
anda et al., 1996; Jipp et al., 1998), which will prevent
percolation of nutrients away from the rooting zone.
Conclusion
Gallery forests and savannas have significantly differ-
ent aboveground and edaphic characteristics as has
been shown elsewhere (Furley, 1992). We also show
that the gallery forests expanded into savannas at a
similar period of time as other tropical forests (Marti-
nelli et al., 1996), but expansion still occurred as recently
as 390 BP. Our two transects, however, indicate that
there may be more than one way in which climate
change can provide the conditions necessary for gallery
forest expansion. Our study suggests that climate
change may initiate the expansion of gallery forest into
savannas and consequently feedback effects such as
nutrient accumulation and fire suppression may further
the expansion of gallery forests into savannas.
2116 L . C . R . S I LVA et al.
r 2008 The AuthorsJournal compilation r 2008 Blackwell Publishing Ltd, Global Change Biology, 14, 2108–2118
Acknowledgements
We thank the staff of RECOR for the research infrastructuresupport. We also thank Dr Jose Carlos Sousa Silva at EMBRAPACerrados and Ricardo Flores Haidar for field assistance andvaluable comments on this research. This research is based uponwork supported by the National Science Foundation Grant No.DEB-0542912 (W. H.), AW Mellon Foundation (W. H.) andNational Science Foundation Grant No. EAR-BE-332051 (L. S.,M. H., F. M.-W., A. F.).
References
Absy ML (1980) Dados sobre as mudancas do clima e da
vegetacao da Amazonia durante o Quarternario. Acta Amazo-
nica, 6, 293–299.
Absy ML, Cleef A, Fournier M et al. (1991) Mise en evidence de
quatre phases d ouverture de la foret dense dans le sud-est de
l’Amazonie au cours des 60000 dernieres annees. Premiere
comparison avec d’autres regions tropicales. Comptes Rendus
de L’Academie de Sciences de Paris Serie II, 312, 673–678.
Balesdent J, Girarden C, Mariotti A (1993) Site-related d13C of
tree leaves and soil organic matter in a temperate forest.
Ecology, 74, 1713–1721.
Beerling DJ, Osborne CP (2006) The origin of the savanna biome.
Global Change Biology, 12, 2023–2031.
Benner R, Fogel ML, Sprague K, Hodson RE (1987) Depletion of13C in lignin and its implications for stable carbon isotope
studies. Nature, 329, 708–710.
Biddulph I, Kellman M (1998) Fuels and fire at savanna–gallery
forest boundaries in southeastern Venezuela. Journal of Tropical
Ecology, 14, 445–461.
Bond WJ, Midgley GF, Woodward FI (2003) The importance of
low atmospheric CO2 and fire in promoting the spread of
grasslands and savannas. Global Change Biology, 9, 973–982.
Boutton TW, Archer SR, Midwood AJ, Zitzer SF, Bol R (1998)
d13C values of soil organic carbon and their use in document-
ing vegetation change in a subtropical savanna ecosystem.
Geoderma, 82, 5–41.
Bowman DMJS, Cook GD, Zoppi U (2004) Holocene boundary
dynamics of a northern Australian monsoon rainforest patch
inferred from isotopic analysis of carbon (14C and d13C) and
nitrogen (d15N) in soil organic matter. Austral Ecology, 29, 605–
612.
Bremner JM, Mulvaney CS (1982) Nitrogen total. In: Methods of
Soil Analysis: Chemical and Microbiological Properties, Vol. 2, 2nd
edn) eds Page AL, Miller RH, Keeney DR), pp. 595–624.
American Society of Agronomy, Madison.
Buchmann N, Brooks JR, Rapp KD, Ehleringer JR (1996) Carbon
isotope composition of C4 grasses is influenced by light and
water supply. Plant Cell and Environment, 19, 392–402.
Chapin FS III, Walker BH, Hobbs RJ, Hooper DU, Lawton JH,
Sala OE, Tilman D (1997) Biotic control over the functioning of
ecosystems. Science, 277, 500–504.
Ehleringer JR, Buchmann N, Flanagan LB (2000) Carbon isotope
ratios in belowground carbon cycle processes. Ecological Ap-
plications, 10, 412–422.
Ehleringer JR, Cerling TE, Helliker BR (1997) C4 photosynthesis,
atmospheric CO2 and climate. Oecologia, 112, 285–299.
Farquhar GD, O’Leary MH, Berry JA (1982) On the relationship
between carbon isotope discrimination and the inter-cellular
carbon-dioxide concentration in leaves. Australian Journal of
Plant Physiology, 9, 121–137.
Furley PA (1992) Edaphic changes at the forest–savanna bound-
ary with particular reference to the neotropics. In: Nature and
Dynamics of Forest–Savanna Boundaries (ed. Furley PA), pp. 91–
117. Chapman & Hall, London.
Giresse P, Maley J, Brenac P (1994) Late Quartenary palaeo-
environments in the Lake Barombi Mbo (West Cameroon)
deduced from pollen and carbon isotopes of organic matter.
Paleogeography, Paleoclimate and Paleoecology, 105, 65–78.
Haridasan M (1992) Observations on soils, foliar nutrient con-
centrations, and floristic composition of cerrado and cerradao
communities in central Brazil. In: The Nature and Dynamics of
Forest Savanna Boundaries (eds Proctor J, Ratter JA, Furley PA),
pp. 171–184. Chapman & Hall, London.
Haridasan M (1998) Solos de mata de galeria e nutricao mineral
de especies arboreas em condicoes naturais. In: Cerrado: Matas
de Galeria (ed. Ribeiro JF), pp. 19–28. EMBRAPA-CPAC, Pla-
naltina, DF.
Haridasan M (2005) Competicao por nutrientes em especies
arboreas do cerrado. In: Cerrado: Ecologia, Biodiversidade e
Conservacao (eds Scariot A, Felfili JM, Sousa-Silva JC), pp.
167–178. Ministerio do Meio Ambiente, Brasılia, DF.
Higgins SI, Bond WJ, February EC et al. (2007) Effects of four
decades of fire manipulation on woody vegetation structure in
savanna. Ecology, 88, 1119–1125.
Hoffmann WA, Jackson RB (2000) Vegetation-climate feedbacks
in the conversion of tropical savannas to grassland. Journal of
Climate, 13, 1593–1602.
Hoffmann WA, Franco AC, Moreira MZ, Haridasan M (2005a)
Specific leaf area explains differences in leaf traits between
congeneric savanna and forest trees. Functional Ecology, 19,
932–940.
Hoffmann WA, Schroeder W, Jackson RB (2002) Positive feed-
backs of fire, climate and vegetation and the conversion of
tropical savannas. Geophysical Research Letters, 29, doi: 10.1029/
2002GL01542.
Hoffmann WA, Silva ER, da Machado GC, Bucci SJ, Scholz FG,
Goldstein G, Meinzer FC (2005b) Seasonal leaf dynamics
across a tree density gradient in a Brazilian savanna. Oecologia,
145, 307–316.
Jipp PH, Nepstad DC, Cassel DK, Carvalho CR (1998) Deep soil
moisture storage and transpiration in forests and pastures of
seasonally-dry Amazonia. Climate Change, 39, 395–412.
Jobbagy EG, Jackson RB (2000) The vertical distribution of soil
organic carbon and its relation to climate and vegetation.
Ecological Applications, 10, 423–436.
Jobbagy EG, Jackson RB (2004) The uplift of soil nutrients by
plants: biogeochemical consequences across scales. Ecology, 85,
2380–2389.
Klink CA, Joly CA (1989) Identification and distribution of C3
and C4 grasses in open and shaded habitats in Sao Paulo State,
Brazil. Biotropica, 21, 30–34.
Krull ES, Bestland EA, Gates WP (2002) Soil organic matter
decomposition and turnover in a tropical ultisol: evidence
from d13C, d15N and geochemistry. Radiocarbon, 44, 93–112.
G A L L E R Y F O R E S T E X PA N S I O N 2117
r 2008 The AuthorsJournal compilation r 2008 Blackwell Publishing Ltd, Global Change Biology, 14, 2108–2118

Ledru MP (1992) Late Quaternary environmental and climatic
changes in central Brazil. Quartenary Research, 39, 90–98.
Lilienfein J, Wilcke W (2004) Water and element input into
native, agri- and silvicultural ecosystems of the Brazilian
savanna. Biogeochemistry, 67, 183–212.
Marengo JA (2007) Atlas de Cenarios Climaticos Futuro para o Brasil.
Instituto Nacional de Pesquisas Espaciais – INPE. Cachoeira
Paulista, Sao Paulo, Brasil 124pp.
Marino BD, McElroy MB, Salawitch RJ, Spaulding WG (1992)
Glacial-to-interglacial variations in the carbon isotopic compo-
sition of atmospheric CO2. Nature, 357, 461–466.
Markewitz D, Resende JCF, Parron L et al. (2006) Dissolved
rainfall inputs and streamwater outputs in an undisturbed
watershed on highly weathered soils in the Brazilian cerrado.
Hydrological Processes, 20, 2615–2639.
Markgraf V (1989) Paleoclimates in Central and South America
since 18,000 BP based on pollen and lake-level records. Quar-
tenary Science Reviews, 8, 1–24.
Martinelli LA, Pessenda LCR, Espinoza E (1996) Carbon-13
depth variation in soil of Brazil and relations with climate
changes during the Quaternary. Oecologia, 106, 376–381.
Mehlich A (1953) Determination of P, Ca, Mg, K, Na and NH4.
North Carolina Soil Test Division, Publ. 1–53, North Carolina
Department of Agriculture, Raleigh, NC.
Mendonca RC, Felfili JM, Walter BMT, Silva Junior MC, Rezende
AV, Filgueiras TS, Nogueira PE (1998) Flora vascular do
cerrado. In: Cerrado: Ambiente e Flora (eds Sano SM, Almeida
SP), pp. 289–556. Embrapa, Planaltina, DF.
Miranda AC, Miranda HS, Lloyd J et al. (1996) Carbon dioxide
fluxes over a cerrado sensu stricto in central Brazil. In:
Amazonian Deforestation and Climate (eds Gash JHC, Nobre
CA, Roberts JM, Victoria RL), pp. 353–364. John Wiley and
Sons, Chichester.
Oliveira-Filho AT, Ratter JA (2002) Vegetation physiognomies
and woody flora of the cerrado biome. In: The cerrados of Brazil.
Ecology and Natural History of a Neotropical Savanna (eds Oli-
veira PS, Marquis RJ), pp. 91–120. Columbia University Press,
New York.
Oyama MD, Nobre CA (2003) A new climate-vegetation equili-
brium state for tropical South America. Geophysical Research
Letters, 30, 51–55.
Pessenda LCR, Gomes BM, Aravena R, Ribeiro AS,
Boulet R, Gouveia SEM (1998) The carbon isotope
record in soils along a forest–cerrado ecosystem transect:
implications for vegetation changes in the Rondonia
state, southwestern Brazilian Amazon region. The Holocene,
8, 599–603.
Ribeiro JF, Walter BMT (1998) Fitofisionomias do bioma cerrado.
In: Cerrado: Ambiente e Flora (eds Sano SM, Almeida SP), pp.
89–166. EMBRAPA-CPAC, Planaltina, DF.
Ribeiro JF, Walter BMT (2001) As matas de galeria no contexto do
bioma Cerrado. In: Cerrado: caracterizacao e recuperacao de Matas
de Galeria (eds Ribeiro JF, Fonseca CEL, Sousa-Silva JC), pp. 29–
47. Embrapa Cerrados, Planaltina, DF.
Sanaiotti TM, Martinelli LA, Victoria RL, Trumbore SE, Camargo
PB (2002) Past vegetation changes in Amazon savannas de-
termined using carbon isotopes of soil organic matter. Biotro-
pica, 34, 2–16.
Sankaran M, Hanan NP, Scholes RJ et al. (2005) Determinants
of woody cover in African savannas. Nature, 438,
846–849.
Servant M, Maley J, Turcq B, Absy ML, Brenac P, Fournier M,
Ledru MP (1993) Tropical forest changes during the Late
Quartenary in African and South American lowlands. Paleo-
geography, Paleoclimatology, Palaeoecology, 7, 1–16.
Smith BN, Epstein S (1971) Two categories of 13C/12C ratios for
higher plants. Plant Physiology, 47, 380–394.
Sokal RR, Rohlf FH (1995) Biometry. WH Freeman, New York.
Sternberg LSL (2001) Savanna–forest hysteresis in the tropics.
Global Ecology and Biogeography, 10, 369–378.
Trumbore S (2000) Age of soil organic matter and soil respiration:
radiocarbon constraints on belowground C dynamics. Ecologi-
cal Applications, 10, 399–411.
Victoria RL, Fernandes F, Martinelli LA, Piccolo MC, Camargo
PB, Trumbore S (1995) Past vegetation changes in the Brazilian
Pantanal arboreal–grassy savanna ecotone by using carbon
isotopes in the soil organic matter. Global Change Biology, 1,
165–171.
Walkley A, Black IA (1934) An examination of the Degtjareff
method for determining soil organic matter and a proposed
modification of the chromic acid tritation method. Soil Science,
37, 29–38.
2118 L . C . R . S I LVA et al.
r 2008 The AuthorsJournal compilation r 2008 Blackwell Publishing Ltd, Global Change Biology, 14, 2108–2118
Related Documents