Brussels, November 8, 2007 - 1/16 Continued EBITDA Margin Expansion in a Tough Quarter InBev (Euronext: INB), the world’s leading brewer, announced today its results for the third quarter 2007 (3Q07) and 9 months 2007 (9M07): Volume growth: beer volumes increased 3.6% organically in 3Q07 year-on-year (yoy), with volume growth in all Zones except Western Europe. Year to date, overall beer volumes were 4.8% higher. Revenue growth: revenue grew by 4.8% in the third quarter, due to higher volumes and an increase in revenue per Hl of 1.3%, or +2.9% eliminating the impact of the change in geographic mix. During the first nine months of 2007, revenue was 7.0% higher, as the result of 1.8% higher revenue per Hl and increased volumes. Excluding the impact of the change in geographic mix, revenue per Hl would have increased +3.2%. Cost control remains: Cost of sales (CoS) in the 3Q07 were impacted by some commodity cost pressures, leading to an increase in CoS per Hl of 3.7%, year-on-year. Year to date, CoS per Hl was up by 2.6%. Despite the pressure on commodities, the company is confident that CoS per Hl will be below inflation for the full year. Operating expenses, and more specifically non-working expenses, continued to be strongly managed, resulting in a 1.1% reduction on an organic basis in 3Q07, and zero growth for the nine months 2007, yoy, despite higher commercial and distribution expenses. EBITDA growth and further margin expansion: normalized EBITDA increased by 8.5%, leading to an EBITDA margin of 35.2% in 3Q07, an organic increase of 119 basis points. For 9M07, normalized EBITDA growth was 13.7%, resulting in an EBITDA margin of 33.4%, with organic margin expansion of 197 basis points. Net profits grew further: normalized profit attributable to equity holders of InBev increased by 5% on an absolute basis to 522 million euro in the 3Q, and was up by more than 17% to 1 282 million euro for 9M07. Returning cash to shareholders: InBev acquired 121 million euro of InBev shares during the third quarter as part of our share buyback programs. Combining the program launched in February and completed in August, and the new one announced in August, each for up to 300 million euro, in total YTD InBev has already acquired 356 million euro of its own shares. Total volumes (thousand Hls) 71 084 67 432 3.5% Beer volumes 62 046 58 979 3.6% Non-beer volumes 9 038 8 453 2.9% Revenue 3 778 3 542 4.8% Gross profit 2 224 2 118 3.2% Normalized EBITDA 1 330 1 209 8.5% Normalized EBIT 1 056 962 8.2% Profit attributable to equity holders of InBev (normalized) 522 498 Profit attributable to equity holders of Inbev 519 479 Normalized earnings per share (euro) 0.85 0.82 Earnings per share (euro) 0.85 0.79 Margins Gross margin 58.9% 59.8% -95 bp Normalized EBITDA margin 35.2% 34.1% 119 bp Normalized EBIT margin 27.9% 27.2% 87 bp Figure 1: Consolidated performance (million euro) 3Q07 3Q06 Organic growth

Welcome message from author
This document is posted to help you gain knowledge. Please leave a comment to let me know what you think about it! Share it to your friends and learn new things together.
Transcript

Brussels, November 8, 2007 - 1/16
Continued EBITDA Margin Expansion in a Tough Quarter
InBev (Euronext: INB), the world’s leading brewer, announced today its results for the third quarter 2007 (3Q07) and 9 months 2007 (9M07): Volume growth: beer volumes increased 3.6% organically in 3Q07 year-on-year (yoy),
with volume growth in all Zones except Western Europe. Year to date, overall beer volumes were 4.8% higher.
Revenue growth: revenue grew by 4.8% in the third quarter, due to higher volumes and an increase in revenue per Hl of 1.3%, or +2.9% eliminating the impact of the change in geographic mix. During the first nine months of 2007, revenue was 7.0% higher, as the result of 1.8% higher revenue per Hl and increased volumes. Excluding the impact of the change in geographic mix, revenue per Hl would have increased +3.2%.
Cost control remains: Cost of sales (CoS) in the 3Q07 were impacted by some commodity cost pressures, leading to an increase in CoS per Hl of 3.7%, year-on-year. Year to date, CoS per Hl was up by 2.6%. Despite the pressure on commodities, the company is confident that CoS per Hl will be below inflation for the full year. Operating expenses, and more specifically non-working expenses, continued to be strongly managed, resulting in a 1.1% reduction on an organic basis in 3Q07, and zero growth for the nine months 2007, yoy, despite higher commercial and distribution expenses.
EBITDA growth and further margin expansion: normalized EBITDA increased by 8.5%, leading to an EBITDA margin of 35.2% in 3Q07, an organic increase of 119 basis points. For 9M07, normalized EBITDA growth was 13.7%, resulting in an EBITDA margin of 33.4%, with organic margin expansion of 197 basis points.
Net profits grew further: normalized profit attributable to equity holders of InBev increased by 5% on an absolute basis to 522 million euro in the 3Q, and was up by more than 17% to 1 282 million euro for 9M07.
Returning cash to shareholders: InBev acquired 121 million euro of InBev shares during the third quarter as part of our share buyback programs. Combining the program launched in February and completed in August, and the new one announced in August, each for up to 300 million euro, in total YTD InBev has already acquired 356 million euro of its own shares.
Total volumes (thousand Hls) 71 084 67 432 3.5%
Beer volumes 62 046 58 979 3.6%
Non-beer volumes 9 038 8 453 2.9%
Revenue 3 778 3 542 4.8%
Gross profit 2 224 2 118 3.2%
Normalized EBITDA 1 330 1 209 8.5%
Normalized EBIT 1 056 962 8.2%
Profit attributable to equity holders of
InBev (normalized)522 498
Profit attributable to equity holders of Inbev519 479
Normalized earnings per share (euro) 0.85 0.82
Earnings per share (euro) 0.85 0.79
Margins
Gross margin 58.9% 59.8% -95 bp
Normalized EBITDA margin 35.2% 34.1% 119 bp
Normalized EBIT margin 27.9% 27.2% 87 bp
Figure 1: Consolidated performance (million euro)
3Q07 3Q06 Organic
growth

Brussels, November 8, 2007 - 2/16
InBev’s 3Q07 and 9M07 numbers are based on unaudited consolidated financial statements prepared in accordance with IFRS. Unless otherwise indicated, amounts are presented in million euro. To facilitate the understanding of InBev’s underlying performance, the analyses of growth, including all comments in this press release, unless otherwise indicated, are based on organic numbers. In other words, financials are analyzed eliminating the impact of changes in currencies on translation of foreign operations, and scopes. Scopes represent the impact of acquisitions and divestitures, the start up or termination of activities, or the transfer of activities between segments. Whenever used in this document, the term “normalized” refers to performance measures (EBITDA, EBIT, Profit, EPS) before non-recurring items. Non-recurring items are either income or expenses which do not occur regularly as part of the normal activities of the company. They are presented separately because they are important for the understanding of the underlying sustainable performance of the company due to their size or nature. Normalized measures are additional measures used by management, and should not replace the measures determined in accordance with IFRS as an indicator of the company’s performance. Values in the figures and annexes may not add up, due to rounding. EPS based upon weighted average of 611 (3Q07 and 9M07) and 608 (3Q06 and 9M06) million ordinary shares outstanding.
MANAGEMENT COMMENTS For the third quarter, a combination of top line growth and a continuous focus on tightly managing costs and expenses has once more resulted in EBITDA growth and margin expansion. Tight cost management in North America helped drive margins higher in a challenging environment. Another quarter of margin expansion was achieved in both Latin America North and Latin America South, where both volume growth and higher revenue per Hl were realized. Western Europe had lower margins despite ongoing savings of non-working fixed expenses, as volumes decreased and cost of sales were higher than last year. The top line continued to grow across Central & Eastern Europe based on solid volume and revenue per Hl growth which drove EBITDA higher than in 3Q06. The decline in the reported EBITDA margin in CEE is once more entirely explained by changes in intercompany charges which are neutral at group level. Excluding this adjustment, EBITDA margins would have been unchanged versus a year ago. Asia Pacific EBITDA was unchanged organically compared to 3Q06, as higher volumes and revenue were offset by increased investments, leading to a lower margin in the quarter. On a consolidated level, organic EBITDA growth of 8.5% was achieved, on top of 19.0% delivered in the 3Q of last year. In contrast, the 4Q of last year was negatively impacted by significantly higher administrative and other operating expenses that are not expected to take place in the coming quarter, translating into a more favourable comparable for the 4Q07. “Overall, our 3Q07 performance was below our expectations. In 3Q our cost management programs (ZBB and VPO) were key to offset the weaker top line results, mainly in the UK and China, and the commodity price pressure. This enabled us to increase our consolidated EBITDA margin organically by 119 basis points to 35.2% for the 3Q, and 197 basis points to 33.4% for the first nine months of 2007. We believe we have the commercial programs in place to deliver a stronger 4Q”, said Carlos Brito, InBev’s CEO. “For 2008 we are not currently providing specific guidance on the impact of changes in commodity costs, beyond highlighting that the price developments during the last months, especially for barley and malt, will impact 2008 cost of sales in all business units. However, this impact is likely to be partly offset by favourable results from our risk management initiatives, together with ongoing efficiency programs being implemented throughout the company. Therefore we expect that the consolidated cost of sales per Hl will move in line with the average inflation for next year”, said Felipe Dutra, InBev’s CFO.

Brussels, November 8, 2007 - 3/16
THIRD QUARTER VOLUMES CONFIRM ACCESS TO GROWING MARKETS
3Q06 Scope Organic
growth
3Q07 Organic
growth
North America 3 786 -272 43 3 558 1.3%
Latin America - North 21 986 341 712 23 038 3.2%
Latin America - South 5 498 615 391 6 503 7.3%
Western Europe 10 381 -280 -790 9 311 -7.8%
Central & Eastern Europe 13 669 0 1 464 15 133 10.7%
Asia Pacific 11 597 91 578 12 266 5.1%
Global Export & Holding Companies 515 789 -29 1 275 -2.2%
Worldwide 67 432 1 284 2 368 71 084 3.5%
Figure 2. Volumes (thousand Hls)
Total consolidated volume was 3.5% higher in 3Q07 with beer up 3.6% and non-beer 2.9%. Lower volumes in Western Europe were more than compensated by growth across all other Zones. Volumes in North America increased 1.3% in 3Q07. Canadian volumes were -1.7% lower organically, as we continue to focus on strengthening the equity of our brands while safeguarding profitability in a challenging market environment. Including the growth of the Lakeport brands, which became part of our portfolio in April of this year, we maintained market share, yoy, reflecting that these brands are already helping us to compete more effectively in Ontario. The total Zone volumes were helped by higher sales of our Canadian brands in the US. Although shipments of our European import brands into the US to Anheuser-Busch (“A-B”) were lower during the third quarter, depletions, while still slightly negative yoy, improved compared to the previous two quarters, led by Stella Artois®. Latin America North delivered 3Q07 volume growth of +3.2% (beer +4.6%; non-beer -0.2%). In Brazil, beer volumes rose +5.1% versus last year and market share climbed to 67.7%. While market share is below last year, we have recorded 6 consecutive months of sequential gains. Outside of Brazil, beer volumes were -4.9% lower which is fully explained by much lower industry volumes in Venezuela, where the company is maintaining share. In Latin America South, volumes increased +7.3% (beer +3.3%; non-beer +13.3%), especially driven by continued expansion in Argentina and Bolivia. In addition, our premium brands again performed well across all markets. Western European third quarter volumes decreased -7.8% as the industry declined versus 2006. UK volumes declined -5.2%, resulting in share loss in a market which was lower than last year. In Germany, the industry was much weaker than one year ago, and also experienced intensified price competition. Against this background, overall volumes, which continued to be impacted by much lower volumes of lower margin products, dropped -11%. Our branded beer volumes decreased less than this, with our share essentially unchanged, yoy. The Belgian market was also softer than the previous year, with our overall volumes -9.6% lower. However, branded beer volumes declined less than this, and we maintained our market share. Central & Eastern Europe presented +10.7% higher volumes compared to last year. Russian volumes grew by +14%, as we continued to increase market share in the core and premium segments at the expense of growth in the value segment. In Ukraine volumes were +14.9% higher. Central European volumes delivered another quarter of good growth across the region.

Brussels, November 8, 2007 - 4/16
Volumes were +5.1% higher for Asia Pacific in the third quarter. Chinese volumes grew by +5.3% organically, with the Sedrin business continuing to perform well. In South Korea, volumes increased +4.3%, supported by good growth of the premium portfolio. GLOBAL BRAND DEVELOPMENT InBev's global brands grew +1.8% for the third quarter. Brahma® had volume growth of +5.4%, mainly boosted by Brazil. Volumes of Stella Artois were down -1.1%, as the negative performance in the UK could not be fully offset by increases in the USA, Latin America South and Eastern Europe. Beck’s® volumes decreased by -5.5%, mainly explained by the negative performance of Germany, which was partly offset by higher volumes in the UK and Central & Eastern Europe. Leffe® had volume growth of +6.6%, mainly due to Western Europe and North America. INCOME STATEMENT – 3Q07
3Q06 Scope Currency
translation
Organic
growth
3Q07 Organic
growth
Revenue 3 542 37 29 170 3 778 4.8%
Cost of sales -1 424 -19 -7 -104 -1 553 -7.3%
Gross profit 2 118 18 22 66 2 224 3.2%
Distribution expenses -415 -11 -3 -19 -447 -4.5%
Sales & marketing expenses -517 -7 -3 -5 -532 -0.9%
Administrative expenses -259 -5 -2 15 -251 5.7%
Other operating income/expenses 36 4 1 21 62 52.5%
Normalized profit from operations
(normalized EBIT)962 -1 15 79 1 056 8.2%
Non recurring items above EBIT -48 12
Net financing costs -120 -157
Income tax expense -163 -197
Profit 632 714
attributable to equity holders of InBev 479 519
attributable to minority interests 153 195
Normalized EBITDA 1 209 4 16 102 1 330 8.5%
Figure 3. Consolidated Income Statement (million euro)
Note: Normalized EBIT and EBITDA is EBIT and EBITDA before non-recurring items. The impact of non-recurring items in 3Q07 was +12 million euro on EBIT and -9 million euro on EBITDA, versus -48 million euro on EBIT and on EBITDA in 3Q06.
Revenue – Consolidated revenue was 3 778 million euro for the third quarter, which translates into an organic increase of 4.8% (170 million euro), yoy. The company continued to achieve higher revenue per Hl in nearly all Zones, as a direct result of focusing on selling more core and premium brands. This is fully in line with our objective to grow revenue ahead of volume on a sustainable basis. Consolidated revenue per Hl rose by 1.3% yoy. On a constant geographic basis, i.e. eliminating the impact of faster growth in countries with lower revenue per Hl in euro, revenue per Hl would have grown 2.9% organically. Cost of Sales (CoS) – Consolidated CoS in 3Q07 was 1 553 million euro, an increase of 7.3% (104 million euro), yoy. CoS per Hl was up 3.7%, yoy. On a constant geographic basis, cost of sales per Hl would have increased by an estimated 4.8% organically. Operating Expenses – Operating expenses, which cover distribution expenses, sales and marketing expenses, administrative expenses and other operating income/expenses, were 1 169 million euro in 3Q07, or an organic decrease of 1.1% (12 million euro) versus 3Q06, mainly as a result of our continuous effort to reduce non-working expenses.

Brussels, November 8, 2007 - 5/16
Distribution expenses were up 19 million euro (4.5%) primarily as the result of increased volumes shipped, as well as higher transport costs in some parts of our business. Sales and marketing expenses increased 5 million euro (0.9%), as we continued to selectively invest in programs which are leading to good top line results. Further savings were realized in administrative expenses, which were 15 million euro lower (5.7%) organically, confirming that the company’s efforts to hold overhead costs down is in place across the business. Other operating income/expenses improved by +21 million euro during 3Q07 versus last year. This result is once more primarily due to an increase in royalty income from third parties, and a loss incurred in 3Q06, due to indirect tax contingencies which did not reoccur this year.
EBITDA – Normalized EBITDA in the third quarter of 1 330 million euro was 8.5% higher organically (up 102 million euro), with most Zones recording higher EBITDA.
North America EBITDA was 195 million euro (+7.3% / up 13 million euro), mainly thanks to a continued strong cost performance
Latin America North grew EBITDA to 499 million euro (+18.7% / up 74 million euro), due to another solid top line performance and ongoing cost management
Latin America South EBITDA of 80 million euro (+32.6% / up 19 million euro) was the result of good volume growth and effective management of expenses
Western Europe EBITDA came in at 226 million euro (-13.2% / down 34 million euro) as lower volumes and higher cost of sales could not be fully offset by continued expense control
Central & Eastern Europe registered EBITDA of 207 million euro (+12.9% / up 24 million euro), due to sustained volume and revenue growth, which has been partly mitigated by increased expenses related to direct distribution and in-market execution. In addition, a change in intercompany charges which started to take effect in the fourth quarter of 2006, negatively impacted the Zone EBITDA for 3Q07. This amount is paid to holding companies and is neutral at the consolidated EBITDA level. Excluding this impact, EBITDA margins would have been stable, year-on-year.
Asia Pacific EBITDA was 93 million euro (+0.4% / +0.4 million euro), due primarily to growth of volumes and revenue.
Global Export & Holding Companies had an EBITDA of 30 million euro (up 6 million euro), mainly impacted by changes in intercompany charges already highlighted above, and benefits related to the different business model for our European imports into the USA
At a consolidated level EBITDA margin for 3Q07 was 35.2% in 3Q07, compared to 34.1% in 3Q06. This translates into a margin expansion of 108 basis points, of which 119 basis points is organic. The positive currency translation impact was 16 million euro for 3Q07 (in 3Q06 the currency translation impact was positive and amounted to 18 million euro).
Brussels, November 8, 2007 - 6/16
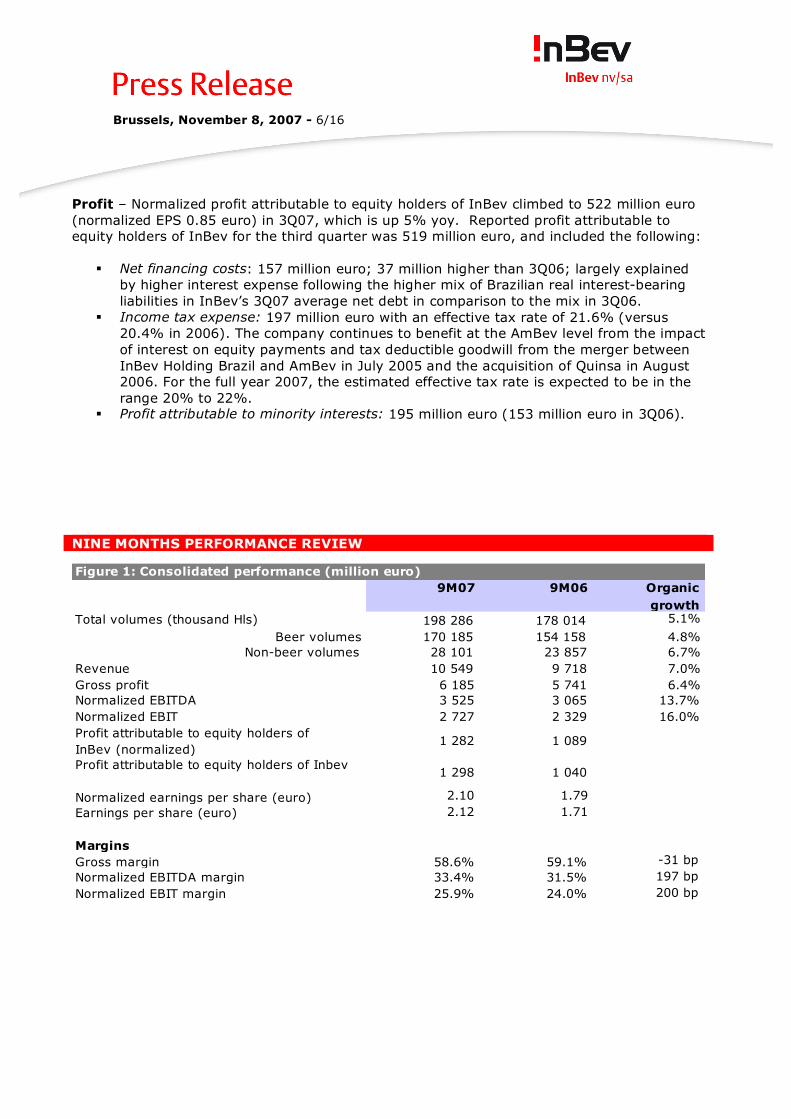
Profit – Normalized profit attributable to equity holders of InBev climbed to 522 million euro (normalized EPS 0.85 euro) in 3Q07, which is up 5% yoy. Reported profit attributable to equity holders of InBev for the third quarter was 519 million euro, and included the following:
Net financing costs: 157 million euro; 37 million higher than 3Q06; largely explained by higher interest expense following the higher mix of Brazilian real interest-bearing liabilities in InBev’s 3Q07 average net debt in comparison to the mix in 3Q06.
Income tax expense: 197 million euro with an effective tax rate of 21.6% (versus 20.4% in 2006). The company continues to benefit at the AmBev level from the impact of interest on equity payments and tax deductible goodwill from the merger between InBev Holding Brazil and AmBev in July 2005 and the acquisition of Quinsa in August 2006. For the full year 2007, the estimated effective tax rate is expected to be in the range 20% to 22%.
Profit attributable to minority interests: 195 million euro (153 million euro in 3Q06). NINE MONTHS PERFORMANCE REVIEW
Total volumes (thousand Hls) 198 286 178 014 5.1%
Beer volumes 170 185 154 158 4.8%
Non-beer volumes 28 101 23 857 6.7%
Revenue 10 549 9 718 7.0%
Gross profit 6 185 5 741 6.4%
Normalized EBITDA 3 525 3 065 13.7%
Normalized EBIT 2 727 2 329 16.0%
Profit attributable to equity holders of
InBev (normalized)1 282 1 089
Profit attributable to equity holders of Inbev1 298 1 040
Normalized earnings per share (euro) 2.10 1.79
Earnings per share (euro) 2.12 1.71
Margins
Gross margin 58.6% 59.1% -31 bp
Normalized EBITDA margin 33.4% 31.5% 197 bp
Normalized EBIT margin 25.9% 24.0% 200 bp
Figure 1: Consolidated performance (million euro)
9M07 9M06 Organic
growth

Brussels, November 8, 2007 - 7/16
NINE MONTHS VOLUMES
9M06 Scope Organic
growth
9M07 Organic
growth
North America 10 715 -1 200 -102 9 413 -1.1%
Latin America - North 66 234 562 2 737 69 533 4.1%
Latin America - South 13 394 6 080 1 218 20 692 9.4%
Western Europe 29 269 -792 -1 303 27 173 -4.6%
Central & Eastern Europe 33 498 0 4 994 38 492 14.9%
Asia Pacific 23 553 4 603 1 098 29 253 4.8%
Global Export & Holding Companies 1 352 2 087 291 3 730 8.5%
Worldwide 178 014 11 339 8 933 198 286 5.1%
Figure 2. Volumes (thousand Hls)
Total consolidated volume for the first nine months grew 5.1%, as beer rose 4.8% and non-beer 6.7%. Solid volume growth throughout Latin America and Central and Eastern Europe more than offset volume decreases in Western Europe, and to a lesser extent North America. North America volumes in 9M07 were -1.1% below last year. Volumes in Canada declined -1.9% organically, as we continue to focus on brand building in a challenging pricing environment, as well as quickly integrating the Lakeport brands into our portfolio. Volumes in Latin America North increased +4.1% (beer +3.8%; non-beer +4.9%) during the first nine months. Beer volumes in Brazil grew +4.5% when compared to the 9M06, while during the same period, beer volumes decreased -9.3% in the markets outside of Brazil, mainly attributable to a much softer industry in Venezuela. Latin America South volumes were up +9.4% for 9M07 (beer +6.3%; non-beer +14.2%), reflecting good performances so far this year, especially in Argentina and Bolivia. In Western Europe, a decline of -4.6% was recorded. UK volumes dropped -8.3%, resulting in a share decrease in an industry which is down versus last year. Reported total volumes in Germany were down -5.7%. This result is primarily due to significant declines in lower margin, non-branded volumes, as well as the decrease in branded beer experienced in the third quarter. Volumes in Belgium were -3.2% below last year, entirely due to the weaker third quarter, in which despite having weak volumes, we held share. Apart from the UK, the company maintained or grew share in our main WE markets. Volume growth of +14.9% was achieved in Central and Eastern Europe, with Russia +16.4%, Ukraine +21.3% as well as solid growth across our Central Europe operations. Asia Pacific volumes were +4.8% higher during the first nine months. In China, volumes were +4.3% up versus last year. We continue to build on the good results in Sedrin while implementing changes in our other operations, which should strengthen our business and lead to a better performance. South Korea volume growth was 6.7%, as we continue to benefit from changes implemented during the last year.

Brussels, November 8, 2007 - 8/16
GLOBAL BRAND DEVELOPMENT Volumes of the global brands were up by +2.0% for the first nine months 2007, as volume growth for Brahma and Beck’s was partially offset by lower volumes of Stella Artois in the UK. Brahma volumes grew +2.6% with positive results in Brazil, Latin America South and Eastern Europe. Volumes of Stella Artois decreased in Western Europe and climbed in the USA, Latin America South and Central and Eastern Europe, resulting in a -2.4% decline versus last year. Beck’s volumes improved +4.7% as higher volumes in Central and Eastern Europe were partly offset by Western Europe. Volumes of Leffe were +8.8% higher. INCOME STATEMENT – 9M07
9M06 Scope Currency
translation
Organic
growth
9M07 Organic
growth
Revenue 9 718 274 -114 671 10 549 7.0%
Cost of sales -3 977 -123 44 -307 -4 363 -7.8%
Gross profit 5 741 151 -70 364 6 185 6.4%
Distribution expenses -1 167 -31 19 -92 -1 271 -8.0%
Sales & marketing expenses -1 574 -50 14 -12 -1 621 -0.7%
Administrative expenses -771 -18 6 45 -739 5.9%
Other operating income/expenses 101 8 0 64 173 57.7%
Normalized profit from operations
(normalized EBIT)2 329 59 -30 369 2 727 16.0%
Non recurring items above EBIT -84 35
Net financing costs -338 -453
Income tax expense -382 -464
Profit 1 525 1 845
attributable to equity holders of InBev 1 040 1 298
attributable to minority interests 485 547
Normalized EBITDA 3 065 85 -41 416 3 525 13.7%
Figure 3. Consolidated Income Statement (million euro)
Note: Normalized EBIT and EBITDA is EBIT and EBITDA before non-recurring items. The impact of non-recurring items in 9M07 was +35 million euro on EBIT and -9 million euro on EBITDA, versus -84 million euro on EBIT and -68 million euro on EBITDA in 9M06. Non-recurring items for 9M06 include a reclassification in order to be consistent with the treatment of a similar item in 4Q06, as disclosed in the FY06 results release Revenue – Consolidated revenue of 10 549 million euro increased 7.0% (671 million euro), yoy. All Zones achieved revenue growth ahead of volume growth, resulting in higher revenue per Hl. At the consolidated level, revenue per Hl continued to grow, up by 1.8% yoy. On a constant geographic basis, i.e. eliminating the impact of stronger growth coming from countries with lower revenue per Hl, organic growth in revenue per Hl would have been 3.2%. Cost of Sales (CoS) – Consolidated CoS in 9M07 was 4 363 million euro, which is 7.8% (307 million euro) above last year. CoS per Hl growth was 2.6%, yoy, while on a constant geographic basis, cost of sales per Hl would have increased by an estimated 3.7%, which is below the company’s average inflation rate. Operating Expenses – Despite higher expenses related to the distribution of our products, operating expenses, which include distribution expenses, sales and marketing expenses, administrative expenses and other operating income/expenses, came in at 3 458 million euro, resulting in an organic decrease of 5 million euro (0.1%) versus the nine months of 2006.

Brussels, November 8, 2007 - 9/16
Distribution expenses (-92 million euro or 8.0%) were higher than one year ago, mainly due to volume growth as well as increased volumes sold through direct distribution and some higher transport costs. Sales and marketing expenses increased by 12 million euro (0.7%), evidencing our focus on investing in InBev’s most important activities, while administrative expenses were reduced by 45 million euro (5.9%) organically. Other operating income/expenses improved by +64 million euro during 9M07. This change is largely attributable to the release of some provisions and the adjustment of bonus accruals, as well as an increase in royalty income from third parties.
EBITDA – Normalized EBITDA of 3 525 million euro for the first nine months of 2007 represents a 13.7% increase, organically (up 416 million euro).
North America had an EBITDA of 434 million euro (+5.9% / up 25 million euro) delivered from good cost control.
Latin America North’s EBITDA of 1 519 million euro (+16.6% / up 215 million euro) reflected a higher top line and well managed expenses.
Latin America South generated EBITDA of 263 million euro (+26.2% / up 40 million euro) from good volume growth, higher revenue per Hl and cost containment.
Western Europe EBITDA was 565 million euro (-5.2% / down 31 million euro) despite good fixed cost management. In addition to lower volumes, Zone results were influenced by higher cost of sales, as a result of changes in intercompany charges, which are neutral at the consolidated level.
Central & Eastern Europe EBITDA came in at 420 million euro (+16.4% / up 60 million euro), due primarily to solid volume increases and control of overhead expenses. Additionally, a change in intercompany charges which took effect in 4Q06, negatively impacted Zone EBITDA for the nine months of 2007. This amount is paid to holding companies and is neutral at a consolidated level. Excluding this impact, EBITDA margins would have been slightly higher, year-on-year.
Asia Pacific EBITDA was 213 million euro (+18.6% / up 31 million euro), as revenue growth was only partly offset by growth in commercial and distribution expenses.
Global Export & Holding Companies EBITDA was 112 million euro (up 76 million euro), as results were positively impacted by changes in intercompany charges mentioned above and benefits related to the different business model for our European imports into the USA.
Consolidated EBITDA margin for 9M07 was 33.4%, versus 31.5% in 9M06. Margin expansion was 187 basis points, of which 197 basis points were organic. The negative currency translation impact was 41 million euro for 9M07 (positive impact of 257 million euro in 9M06).
Profit – Normalized profit attributable to equity holders of InBev reached 1 282 million euro (normalized EPS 2.10 euro) for the nine months of 2007, representing an absolute increase of nearly 18% yoy. Reported profit attributable to equity holders of InBev for the same period was 1 298 million euro, and included the following:
Net financing costs: 453 million euro; 115 million higher than 9M06; largely explained by higher interest expense following the higher mix of Brazilian real interest-bearing liabilities in InBev’s 2007 average net debt in comparison to the mix in 2006.
Income tax expense: 464 million euro with an effective tax rate of 20.1% (versus 20.0% in 2006). The company continues to benefit at the AmBev level from the impact

Brussels, November 8, 2007 - 10/16
of interest on equity payments and tax deductible goodwill from the merger between InBev Holding Brazil and AmBev in July 2005 and the acquisition of Quinsa in August 2006. For the full year 2007, the estimated effective tax rate is expected to be in the range 20% to 22%.
Profit attributable to minority interests: 547 million euro (485 million euro in 9M06). OUTLOOK InBev’s portfolio of operations features leading positions in several fast growing markets worldwide, as well as opportunities to improve our businesses in markets growing at lower rates. The company maintains its commitment to put in place the necessary programs to build healthy, profitable businesses across all geographic Zones, which should result in ongoing margin enhancement and value creation.
Recent events On October 31, InBev announced the closure of the transaction with Cofinimmo (Euronext/COFB), under which Cofinimmo has acquired a 90% interest in Immobrew S.A./N.V., a subsidiary of InBev Belgium that directly owns 823 pubs in Belgium and indirectly owns 245 pubs in the Netherlands, for an aggregate of 419 million euro, on a debt and cash free basis. At the same time, InBev Belgium and InBev Netherlands have entered into master lease agreements with Immobrew and its Netherland affiliates with respect to these pubs. Under the Sale and Purchase Agreement entered into between Mr. Cintra and AmBev on March 26, 2007, Mr. Cintra had the option to sell the Cintra brand to a third party by October 29, 2007, such date being subsequently extended to November 5, 2007. As the deadline has expired without the brand being sold, AmBev and Mr. Cintra are currently making the proper arrangements to implement the transfer of the brand to AmBev for a consideration of approximately 10 million USD. Until these arrangements are finalized, the brand continues to belong to Mr. Cintra. AmBev informs that there are no plans in place for the Cintra brand to be discontinued and that it will maintain the respective investments in line with the last quarters. Annexes InBev website: http://www.inbev.com/media/3__2__0__pressreleases.cfm
• Third quarter 2007 segment information (3Q07) • Nine months 2007 (9M07) segment information • Reconciliation between Brazilian GAAP and IFRS figures for Latin America (9M07)
Brussels, November 8, 2007 - 11/16
Third quarter 2007 Agenda November 8th, 2007 Conference call 3Q07 results for investors 2.00 p.m. CET / 1.00 p.m. BST / 8.00 a.m. EST - full registration details are available at www.InBev.com. 2008 Calendar – can also be found at: http://www.inbev.com/investors/4__5__0__financialcalendar.cfm February 28 Full Year 2007 results April 29 General Shareholders Meeting May 8 First Quarter 2008 results August 14 Second Quarter and Half Year 2008 results November 6 Third Quarter and Nine Months 2008 results
About InBev
InBev is a publicly traded company (Euronext: INB) based in Leuven, Belgium. The company's origins date back to 1366, and today it is the leading global brewer. InBev’s strategy is to strengthen its local platforms by building significant positions in the world's major beer markets through organic growth, world-class efficiency, targeted external growth, and by putting consumers first. InBev has a portfolio of more than 200 brands, including Stella Artois®, Brahma®, Beck’s®, Leffe® and Skol® - the third-largest selling beer brand in the world. InBev employs some 88 000 people, running operations in over 30 countries across the Americas, Europe and Asia Pacific. In 2006, InBev realized 13.3 billion euro of revenue. For further information visit www.InBev.com
Contact information Marianne Amssoms Philip Ludwig Vice President Global External Communications Vice President Investor Relations Tel: +32-16-27-67-11 Tel: +32-16-27-62-43 Fax: +32-16-50-67-11 Fax: +32-16-50-62-43 E-mail: [email protected] E-mail: [email protected] This report contains certain forward-looking statements reflecting the current views of the management of InBev with respect to, among other things, InBev’s strategic objectives, business prospects, future financial condition, budgets, projected levels of production, projected costs and projected levels of revenues and profits. These statements involve risks and uncertainties. The ability of InBev to achieve these objectives and targets is dependent on many factors which are outside of management’s control. In some cases, words such as “believe”, “intend”, “expect”, “anticipate”, “plan”, “target”, “will” and similar expressions to identify forward-looking statements are used. All statements other than statements of historical facts are forward-looking statements. You should not place undue reliance on these forward-looking statements. By their nature, forward-looking statements involve risk and uncertainty because they reflect InBev’s current expectations and assumptions as to future events and circumstances that may not prove accurate. The actual results could differ materially from those anticipated in the forward-looking statements for many reasons. InBev cannot assure you that the future results, level of activity, performance or achievements of InBev will meet the expectations reflected in the forward-looking statements.

Brussels, November 8, 2007 - 12/16
Annex 1 3Q07 segment information InBev Worldwide 3Q06 Scope Currency
translation
Organic
growth
3Q07 Organic
growth
Total volumes 67 432 1 284 0 2 368 71 084 3.5%
Revenue 3 542 37 29 170 3 778 4.8%
Cost of sales -1 424 -19 -7 -104 -1 553 -7.3%
Gross profit 2 118 18 22 66 2 224 3.2%
Distribution expenses -415 -11 -3 -19 -447 -4.5%
Sales & marketing expenses -517 -7 -3 -5 -532 -0.9%
Administrative expenses -259 -5 -2 15 -251 5.7%
Other operating income/expenses 36 4 1 21 62 52.5%
Normalized EBIT 962 -1 15 79 1 056 8.2%
Normalized EBITDA 1 209 4 16 102 1 330 8.5%
Normalized EBITDA margin 34.1% 35.2% 119 bp
North America 3Q06 Scope Currency
translation
Organic
growth
3Q07 Organic
growth
Total volumes 3 786 -272 0 43 3 558 1.3%
Revenue 489 -35 -6 -1 447 -0.2%
Cost of sales -164 32 3 -6 -136 -4.7%
Gross profit 325 -3 -4 -7 312 -2.2%
Distribution expenses -73 -9 0 7 -75 9.9%
Sales & marketing expenses -74 18 0 6 -50 10.7%
Administrative expenses -18 0 0 4 -15 20.6%
Other operating income/expenses 0 1 0 1 2 705.6%
Normalized EBIT 160 6 -4 11 173 7.0%
Normalized EBITDA 179 7 -4 13 195 7.3%
Normalized EBITDA margin 36.6% 43.6% 275 bp
Latin America - North 3Q06 Scope Currency
translation
Organic
growth
3Q07 Organic
growthTotal volumes 21 986 341 0 712 23 038 3.2%
Revenue 987 9 52 98 1 145 9.9%
Cost of sales -356 -7 -16 -22 -401 -6.2%
Gross profit 631 2 36 76 745 12.0%
Distribution expenses -122 -2 -5 -2 -131 -1.6%
Sales & marketing expenses -96 0 -5 -23 -124 -24.1%
Administrative expenses -77 -3 -2 6 -76 7.5%
Other operating income/expenses 4 0 2 13 19 353.8%
Normalized EBIT 340 -4 25 70 432 20.5%
Normalized EBITDA 399 -1 28 74 499 18.7%
Normalized EBITDA margin 40.4% 43.6% 322 bp
Latin America - South 3Q06 Scope Currency
translation
Organic
growth
3Q07 Organic
growth
Total volumes 5 498 615 0 391 6 503 7.3%
Revenue 181 19 -12 24 213 13.7%
Cost of sales -80 -10 6 -9 -93 -11.4%
Gross profit 102 9 -6 15 119 15.6%
Distribution expenses -16 -2 1 -2 -19 -14.8%
Sales & marketing expenses -22 -3 2 -5 -28 -24.2%
Administrative expenses -17 -2 1 6 -13 34.3%
Other operating income/expenses -1 0 0 1 -1 36.1%
Normalized EBIT 45 2 -3 14 59 33.4%
Normalized EBITDA 60 5 -4 19 80 32.6%
Normalized EBITDA margin 33.2% 37.6% 530 bp

Brussels, November 8, 2007 - 13/16
Annex 1 3Q07 segment information (continued) Western Europe 3Q06 Scope Currency
translation
Organic
growth
3Q07 Organic
growth
Total volumes 10 381 -280 0 -790 9 311 -7.8%
Revenue 966 -16 3 -67 886 -7.0%
Cost of sales -406 6 -2 -11 -412 -2.8%
Gross profit 560 -9 1 -78 474 -14.1%
Distribution expenses -114 3 0 6 -106 5.0%
Sales & marketing expenses -178 -2 0 19 -161 10.8%
Administrative expenses -58 0 0 6 -52 9.8%
Other operating income/expenses -21 4 0 10 -8 56.2%
Normalized EBIT 189 -5 0 -37 147 -20.2%
Normalized EBITDA 267 -7 0 -34 226 -13.2%
Normalized EBITDA margin 27.7% 25.5% -177 bp
Central & Eastern Europe 3Q06 Scope Currency
translation
Organic
growth
3Q07 Organic
growth
Total volumes 13 669 0 0 1 464 15 133 10.7%
Revenue 588 0 -4 113 697 19.2%
Cost of sales -253 0 3 -47 -298 -18.6%
Gross profit 335 0 -2 66 399 19.7%
Distribution expenses -71 0 1 -18 -88 -25.1%
Sales & marketing expenses -85 0 0 -16 -102 -19.1%
Administrative expenses -32 0 0 0 -32 1.5%
Other operating income/expenses -10 0 0 -15 -25 -161.0%
Normalized EBIT 137 0 -1 17 153 12.5%
Normalized EBITDA 185 0 -2 24 207 12.9%
Normalized EBITDA margin 31.4% 29.7% -166 bp
Asia Pacific 3Q06 Scope Currency
translation
Organic
growth
3Q07 Organic
growthTotal volumes 11 597 91 0 578 12 266 5.1%
Revenue 304 -8 -7 23 312 7.9%
Cost of sales -147 7 3 -14 -151 -10.1%
Gross profit 157 0 -4 9 161 5.8%
Distribution expenses -19 0 0 -2 -20 -10.0%
Sales & marketing expenses -51 -1 1 -5 -56 -9.2%
Administrative expenses -14 0 0 -2 -16 -13.8%
Other operating income/expenses 1 -1 0 -3 -2 -459.7%
Normalized EBIT 73 -2 -2 -2 67 -3.4%
Normalized EBITDA 97 -2 -3 0 93 0.4%
Normalized EBITDA margin 32.0% 29.8% -213 bp
Global Export & Holding Companies 3Q06 Scope Currency
translation
Organic
growth
3Q07 Organic
growth
Total volumes 515 789 0 -29 1 275 -2.2%
Revenue 27 68 4 -21 77 -21.7%
Cost of sales -19 -47 -2 5 -63 7.3%
Gross profit 8 21 1 -16 14 -54.8%
Distribution expenses 0 -1 0 -8 -8 -794.2%
Sales & marketing expenses -12 -18 -1 19 -11 64.7%
Administrative expenses -42 0 0 -5 -47 -10.7%
Other operating income/expenses 64 0 0 14 77 21.8%
Normalized EBIT 17 2 0 5 24 28.1%
Normalized EBITDA 22 2 0 6 30 23.9%
Brussels, November 8, 2007 - 14/16
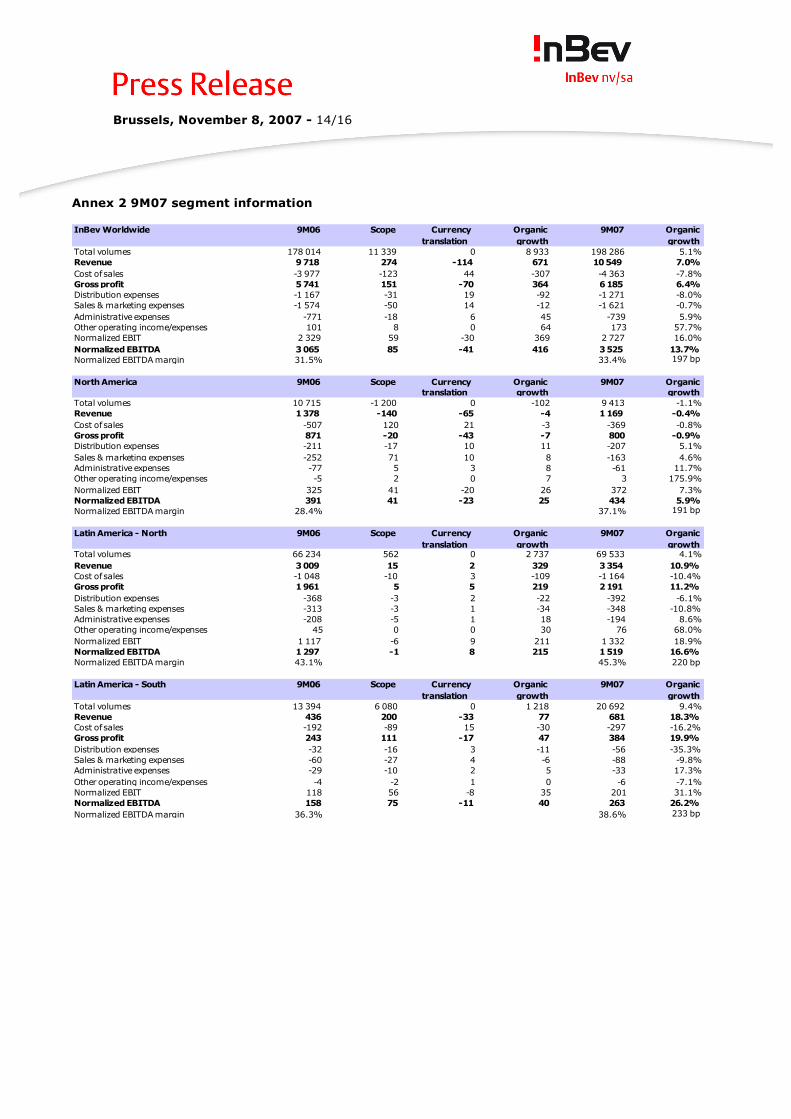
Annex 2 9M07 segment information InBev Worldwide 9M06 Scope Currency
translation
Organic
growth
9M07 Organic
growth
Total volumes 178 014 11 339 0 8 933 198 286 5.1%
Revenue 9 718 274 -114 671 10 549 7.0%
Cost of sales -3 977 -123 44 -307 -4 363 -7.8%
Gross profit 5 741 151 -70 364 6 185 6.4%
Distribution expenses -1 167 -31 19 -92 -1 271 -8.0%
Sales & marketing expenses -1 574 -50 14 -12 -1 621 -0.7%
Administrative expenses -771 -18 6 45 -739 5.9%
Other operating income/expenses 101 8 0 64 173 57.7%
Normalized EBIT 2 329 59 -30 369 2 727 16.0%
Normalized EBITDA 3 065 85 -41 416 3 525 13.7%
Normalized EBITDA margin 31.5% 33.4% 197 bp
North America 9M06 Scope Currency
translation
Organic
growth
9M07 Organic
growth
Total volumes 10 715 -1 200 0 -102 9 413 -1.1%
Revenue 1 378 -140 -65 -4 1 169 -0.4%
Cost of sales -507 120 21 -3 -369 -0.8%
Gross profit 871 -20 -43 -7 800 -0.9%
Distribution expenses -211 -17 10 11 -207 5.1%
Sales & marketing expenses -252 71 10 8 -163 4.6%
Administrative expenses -77 5 3 8 -61 11.7%
Other operating income/expenses -5 2 0 7 3 175.9%
Normalized EBIT 325 41 -20 26 372 7.3%
Normalized EBITDA 391 41 -23 25 434 5.9%
Normalized EBITDA margin 28.4% 37.1% 191 bp
Latin America - North 9M06 Scope Currency
translation
Organic
growth
9M07 Organic
growthTotal volumes 66 234 562 0 2 737 69 533 4.1%
Revenue 3 009 15 2 329 3 354 10.9%
Cost of sales -1 048 -10 3 -109 -1 164 -10.4%
Gross profit 1 961 5 5 219 2 191 11.2%
Distribution expenses -368 -3 2 -22 -392 -6.1%
Sales & marketing expenses -313 -3 1 -34 -348 -10.8%
Administrative expenses -208 -5 1 18 -194 8.6%
Other operating income/expenses 45 0 0 30 76 68.0%
Normalized EBIT 1 117 -6 9 211 1 332 18.9%
Normalized EBITDA 1 297 -1 8 215 1 519 16.6%
Normalized EBITDA margin 43.1% 45.3% 220 bp
Latin America - South 9M06 Scope Currency
translation
Organic
growth
9M07 Organic
growth
Total volumes 13 394 6 080 0 1 218 20 692 9.4%
Revenue 436 200 -33 77 681 18.3%
Cost of sales -192 -89 15 -30 -297 -16.2%
Gross profit 243 111 -17 47 384 19.9%
Distribution expenses -32 -16 3 -11 -56 -35.3%
Sales & marketing expenses -60 -27 4 -6 -88 -9.8%
Administrative expenses -29 -10 2 5 -33 17.3%
Other operating income/expenses -4 -2 1 0 -6 -7.1%
Normalized EBIT 118 56 -8 35 201 31.1%
Normalized EBITDA 158 75 -11 40 263 26.2%
Normalized EBITDA margin 36.3% 38.6% 233 bp

Brussels, November 8, 2007 - 15/16
Annex 2 9M07 segment information (continued) Western Europe 9M06 Scope Currency
translation
Organic
growth
9M07 Organic
growth
Total volumes 29 269 -792 0 -1 303 27 173 -4.6%
Revenue 2 712 -46 12 -73 2 605 -2.7%
Cost of sales -1 185 19 -8 -43 -1 217 -3.7%
Gross profit 1 527 -27 4 -116 1 388 -7.7%
Distribution expenses -321 8 -1 2 -312 0.8%
Sales & marketing expenses -544 -5 -2 28 -523 5.2%
Administrative expenses -193 1 -1 14 -178 7.2%
Other operating income/expenses -89 10 -1 31 -49 39.5%
Normalized EBIT 380 -14 -1 -40 326 -11.0%
Normalized EBITDA 615 -19 0 -31 565 -5.2%
Normalized EBITDA margin 22.7% 21.7% -54 bp
Central & Eastern Europe 9M06 Scope Currency
translation
Organic
growth
9M07 Organic
growth
Total volumes 33 498 0 0 4 994 38 492 14.9%
Revenue 1 417 0 -17 320 1 721 22.6%
Cost of sales -645 0 9 -121 -757 -18.8%
Gross profit 772 0 -8 199 963 25.8%
Distribution expenses -183 0 3 -45 -225 -24.4%
Sales & marketing expenses -230 0 1 -72 -301 -31.3%
Administrative expenses -97 0 0 -2 -99 -2.1%
Other operating income/expenses -35 0 1 -40 -75 -113.2%
Normalized EBIT 227 0 -3 40 264 17.8%
Normalized EBITDA 365 0 -5 60 420 16.4%
Normalized EBITDA margin 25.7% 24.4% -131 bp
Asia Pacific 9M06 Scope Currency
translation
Organic
growth
9M07 Organic
growthTotal volumes 23 553 4 603 0 1 098 29 253 4.8%
Revenue 689 66 -25 56 786 8.6%
Cost of sales -350 -28 11 -21 -388 -6.6%
Gross profit 340 38 -14 35 399 10.5%
Distribution expenses -51 0 2 -4 -53 -7.5%
Sales & marketing expenses -134 -24 5 -8 -160 -5.8%
Administrative expenses -39 -7 1 -2 -46 -4.8%
Other operating income/expenses -2 -1 0 1 -2 32.2%
Normalized EBIT 113 6 -5 23 137 21.8%
Normalized EBITDA 177 12 -8 31 213 18.6%
Normalized EBITDA margin 25.7% 27.0% 226 bp
Global Export & Holding Companies 9M06 Scope Currency
translation
Organic
growth
9M07 Organic
growth
Total volumes 1 352 2 087 0 291 3 730 8.5%
Revenue 76 179 12 -34 233 -13.4%
Cost of sales -50 -135 -8 21 -172 11.3%
Gross profit 26 44 3 -13 60 -18.8%
Distribution expenses -1 -2 0 -24 -27 -789.8%
Sales & marketing expenses -40 -63 -5 71 -36 69.9%
Administrative expenses -128 -3 0 4 -128 3.0%
Other operating income/expenses 192 0 -1 34 226 17.9%
Normalized EBIT 49 -24 -3 73 96 289.4%
Normalized EBITDA 61 -22 -3 76 112 196.4%

Brussels, November 8, 2007 - 16/16
Annex 3
Reconciliation between Brazilian GAAP and IFRS figures for
Latin America 9M07
EBIT Latin America under Brazilian GAAP (Brazil + HILA, as published in the 9M07 Segment financial information of AmBev’s Q3 press release) In million BRL.................................................................................................................... 3 904 In million euro ........................................................................................................................... 1 445 Reclassifications - Profit sharing (bonus plan) presented below EBIT in Brazilian GAAP, above EBIT in IFRS ............... (20) - Other operating income/expense, presented below EBIT in Brazilian GAAP, above EBIT in IFRS ...... (38) 1 387 Adjustments - Goodwill amortization in Brazilian GAAP, not in IFRS............................................................... 160 - Other depreciation adjustments (fair value base, InBev rates, commercial intangibles, …) ............. 5 - Deferred charges (start up costs capitalized under Brazilian GAAP, expensed in IFRS) .................. (7) - Indirect tax incentives (through equity in Brazilian GAAP, in income statement in IFRS) ................ 2 - Pension cost recognition and share based payment expense (IFRS 2 and IAS 19 treatment) ......... (5) - Other ............................................................................................................................ (9) EBIT Latin America under IFRS (as published in the 9M07 Segment information of Latin America North and Latin America South in annex 2 of this press release)........................................................................................................... 1 533
Related Documents