Technische Universität München Automated annotation of structurally uncharacterized metabolites in human metabolomics studies by systems biology models Jan-Dominik Bernd Quell 2019

Welcome message from author
This document is posted to help you gain knowledge. Please leave a comment to let me know what you think about it! Share it to your friends and learn new things together.
Transcript

Technische Universität München
Automated annotation of structurallyuncharacterized metabolites in human
metabolomics studies by systems biology models
Jan-Dominik Bernd Quell
2019


Fakultät Wissenschaftszentrum Weihenstephan für Ernährung, Landnutzung und Umwelt
Technische Universität MünchenLehrstuhl für Experimentelle Bioinformatik
Automated annotation of structurally uncharacterized metabo-lites in human metabolomics studies by systems biology models
Jan-Dominik Bernd Quell
Vollständiger Abdruck der von der Fakultät Wissenschaftszentrum Weihenstephan für Er-nährung, Landnutzung und Umwelt der Technischen Universität München zur Erlangungdes akademischen Grades eines
Doktors der Naturwissenschaften (Dr. rer. nat.)
genehmigten Dissertation.
Vorsitzender: Prof. Dr. Dmitrij FrischmannPrüfer der Dissertation: 1. Prof. Dr. Hans-Werner Mewes
2. Prof. Dr. Bernhard Küster
Die Dissertation wurde am 28.11.2018 bei der Technischen Universität München eingereichtund durch die Fakultät Wissenschaftszentrum Weihenstephan für Ernährung, Landnutzungund Umwelt am 28.01.2019 angenommen.


„Der Mensch muß bei dem Glauben verharren, daßdas Unbegreifliche begreiflich sei; er würde sonstnicht forschen.“
Johann Wolfgang von Goethe
i


Danksagung
Zunächst möchte ich mich ganz besonders bei meinem Doktorvater (Hans-)WernerMewes bedanken, der mir nicht nur die Möglichkeit gegeben hat an seinem Institutdes Helmholtz Zentrums München sowie seinem Lehrstuhl an der Technischen Uni-versität München in Forschung und Lehre zu arbeiten, sondern auch meine Laufbahnab dem ersten Tag meines Studiums sowohl im fachlichen als auch im persönlichenKontext entscheidend geprägt hat.
Mein besonderer Dank gilt auch Gabi Kastenmüller. Ihr möchte ich für viele fachlicheIdeen, Diskussionen, und Inspirationen danken, durch die wichtige Weichen gestelltwurden und in meinen Projekten mündeten.
Für fachliche Diskussionen insb. mit biochemischen Inhalten und für die Unterstüt-zung bei massenspektrometrischen Messungen zur Verifikation von Kandidatenmole-külen im Labor bedanke ich mich sehr herzlich bei Werner Römisch-Margl.
Da ich in dieser Arbeit Daten aus zahlreichen Kohortenstudien verwendet habe (u.a.SUMMIT, KORA, HuMet) geht an dieser Stelle ein Dank an meine Kooperations-partner wie Anna Köttgen (GCKD) und Karsten Suhre (QMDiab).
Bedanken möchte ich mich auch bei Bernhard Küster für die fachliche Auseinander-setzung mit meiner Arbeit und die Bereitschaft als zweiter Prüfer zu fungieren.
Natürlich geht auch ein Dank an meine Kollegen, Freunde und Familie, die mich aufunterschiedliche Arten und Weisen unterstützt haben. Die Vollendung dieser Arbeitmarkiert den Abschluss eines Kapitels in meinem Leben; nun freue ich mich auf neueberufliche Herausforderungen.
Nicht nur aus Tradition gebührt zum Abschluss ein sehr großer Dank meiner FrauChristina. Ich möchte ihr Danke sagen für viele Formen der Unterstützung bei mei-ner Arbeit, ebenso bei dem Verwirklichen von privaten Ideen und Zielen und fürgemeinsam geschmiedete Lebenspläne, die erst durch sie Bereicherung finden.
iii


Abstract
Metabolomics studies are commonly performed in research of health and disease,capturing metabolite levels as intermediate phenotypes that bridge interacting bio-chemical levels from the genome to clinically relevant phenotypes and reflect environ-mental influences. While defined sets of metabolites are quantified by targeted massspectrometry (MS) for testing of hypotheses, non-targeted MS includes measurementof metabolites with initially unknown chemical structures and enables hypothesis-free testing of unexpected associations. Although metabolites without any chemi-cal characterization only occur in non-targeted settings, targeted measurements canlead to ambiguous annotations too. The outcome of metabolomics studies stronglydepends on the insights that can be obtained from measured data: Functional orintermediate metabolite features influence measurements of highly sensitive massspectrometers, which differ in their mass resolution (e.g. ± 0.3 or ± 0.01) and in theirmetabolite separation capacity. Although separation of molecules can be improvedby a coupled chromatography or multiple reaction monitoring (MRM), some mole-cules that share similar chemical or physical properties are therefore not separatedanalytically and labeled ambiguously (measurement of metabolite sums, e.g. hexo-ses, steroids, or complex lipids). As unknown or ambiguously labeled metabolitesin scientific results mark dead ends in metabolomics research, they cannot be inter-preted in concrete biochemical contexts, or further used in clinical applications. Inconsequence, unknown or ambiguously labeled metabolites need to be characterizedprecisely. Experimental approaches in wet-laboratories are successful in identifica-tion of individual unknown metabolites, but they are comparably time-consumingand laboratory-intensive. For metabolite annotation in large scales, high-throughputin silico approaches that mostly analyze fragmentation spectra have been introducedin recent years. Since some commercial MS platforms do not provide spectra andthe development of MS devices leads to faster measurements, larger data sets, andincreasing numbers of metabolites (also of those with unknown structural identities),
v

vi Abstract
characterization of unknown metabolites will stay a long-term accompanying futurechallenge.Here, I propose two novel automatic approaches for (i) determination of main
constituents of measured metabolite sums and for (ii) characterization of unknownmetabolites including automated selection of candidate molecules relying mostly onnon-spectral data. In the first part, I provide an automatic workflow to determinemain constituents of ambiguously annotated metabolites based on a platform com-parison in a small data (sub-) set and impute concentrations of a (large) number ofsamples on a higher precision level: In case of phosphatidylcholines (PCs) that consistof a polar head group and two non-polar fatty acid chains, most established lipido-mics platforms measure the total length of side chains including their desaturationbut cannot distinguish the distribution to the sn-1 or sn-2 positions (lipid specieslevel). Recent platforms identify the length and desaturation of both side chainsseparately, but do not provide their ordering, or position of double bonds (higherprecision; fatty acid level). To this end I used 76 and 109 PC concentrations mea-sured by AbsoluteIDQTM that has frequently been used during numerous large cohortstudies for targeted quantification of amino acids and lipids on the lipid species level,and by the more precise LipidyzerTM platform (fatty acid level), respectively, in thesame 223 samples of healthy young men. First, I determined 150 to 456 theoreticallypossible constituents (fatty acid level) for 76 measured PC sums (lipid species level)by systematically distributing their fatty acid chains and desaturation to the sn-1and sn-2 positions. 69 of 109 PCs were identified as constituents for 38 PC sums,of which 10 compositions contained one clear main constituent with a contributionof at least 80%. Further 17 compositions consisted of one or two measured mainconstituents with contributions between 20 and 80%. In one case, a PC with oneodd-chain fatty acid was identified as main constituent, which was an unexpectedfinding, because in human matrices even-chain fatty acids are much more abundantthan odd chain lengths. Since 13 and 19 quantitative compositions, respectively,were replicated directly, or via imputation of metabolite concentrations in samplesof a second independent cohort, determined factors can be used for imputation ofPC concentrations (lipid species level → fatty acid level). Although PCs measuredon the fatty acid level are not equal to chemical structures, they allow more preciseinterpretations in their biochemical context.In the second part, I introduce a systems biology model that approaches charac-
terization of unknown metabolites, measured by non-targeted MS, from a holistic

vii
perspective. While current methods are focused on transforming and linking frag-ment spectra of unknown structures to database compounds, my approach identifiesthe biochemical context of unknown metabolites, before selecting specific candidatemolecules. On this account, I use 637 concentrations (388 known, 249 unknown)measured in 2 279 samples to estimate pairwise partial correlations that are knownto reconstruct biochemical pathways. The automatic data integration module mergessignificant associations with a published Gaussian graphical model (GGM) to receive1 040 edges as backbone of my network model. By mapping and adding metabolites,I integrated 299 metabolite-gene associations of a published mGWAS, and 1 152 re-actions as well as 495 functional metabolite-gene relations of the public databaseRecon. Several metabolite characterization modules that access the network modeland transfer information from known to unknown metabolites predicted pathways for180 unknown metabolites and selected 21 reaction types for 100 pairs of known andunknown metabolites. 12 reactions were substantiated by a second criterion on theretention time. I replicated 18 of 26 pathway annotations that were independentlypredicted in two data sets, based on high-resolution metabolite levels measured in1 209 samples of a second independent cohort. For 139 of 315 connected unknownhigh-resolution metabolites that are connected to known metabolites in the networkmodel, I automatically selected 676 candidate molecules by searching public databa-ses for structurally similar compounds (to neighboring known metabolites) with equalmass. Finally, I verified two out of five selected commercially available candidates ex-perimentally in a wet-laboratory and propose a database structure to organize severalpredicted or verified annotations for unknown metabolites. In contrast to existingmethods, my approach that is based on metabolite levels, genetic associations, andinformation from public resources, sets unknown metabolites into their biochemicalcontexts (facilitating reliable interpretations), even if their identity cannot be resolvedprecisely in any case.In this work I introduced two novel automatic approaches for biochemical clari-
fication of unknown or ambiguously labeled metabolites that are especially basedon measured metabolite levels. Both approaches enable or improve precise interpre-tations of scientific results in further metabolomics studies by identifying the localbiochemical environment of metabolites and can be used alone or together with com-plementary methods.


Zusammenfassung
Experimente der Metabolomik dienen häufig der Erforschung von Gesundheit undKrankheiten, wobei Konzentrationen von Metaboliten als intermediäre Phänotypenerfasst werden, die verschiedene interagierende biochemische Ebenen vom Genom zuklinisch relevanten Phänotypen überbrücken. Vorab selektierte Metabolite könnenzum Testen von Hypothesen durch Technologien der targeted Massenspektrometrie(MS) gemessen werden. Das Gegenstück besteht aus der non-targeted MS, die alleMetabolite detektiert, welche sich in einer Probe befinden, und damit hypothesenfreieTests zum Finden von unerwarteten Assoziationen ermöglicht, wobei sich darunterauch Metabolite mit zunächst unbekannter molekularer Struktur befinden. Währendunbekannte Metabolite ohne jegliche strukturelle Annotation nur bei der non-targetedMS vorkommen, kann auch targeted MS zu mehrdeutig benannten Metaboliten füh-ren. Der Wert von Experimenten der Metabolomik hängt stark von den gemessenenDaten und deren Annotation ab: Funktionale Metabolite oder Zwischenprodukte desStoffwechsels beeinflussen die Messung von hochsensitiven Massenspektrometern, diesich in ihrer Massenauflösung (bspw. ± 0.3 oder ± 0.01) und in ihrer Leistung zurTrennung verschiedener Metabolite unterscheiden. Obwohl die Auftrennung verschie-dener Metabolite durch chemische (bspw. Chromatographie) oder analytische (bspw.durch gezielte Selektion und Fragmentierung von Ionen in Tandem-MS) Methodenverbessert werden kann, können manche Metabolite, die ähnliche chemische und phy-sikalische Eigenschaften besitzen, nicht unterschieden werden (z.B. Hexosen, Steroide,oder komplexe Lipide). Gemessene Metabolit-Summen tragen folglich mehrdeutigeBezeichnungen. Unbekannte oder mehrdeutig annotierte Metabolite in Ergebnissenvon wissenschaftlichen Studien der Metabolomik stellen Sackgassen dar und könnenweder in biochemischen Zusammenhängen interpretiert, noch für klinische Anwen-dungen eingesetzt werden. Aus diesem Grund müssen unbekannte oder mehrdeutigannotierte Metabolite präzise charakterisiert werden. Einzelne unbekannte Metaboli-te können mit experimentellen Methoden, die u.a. auf MS beruhen, identifiziert wer-
ix

x Zusammenfassung
den, was allerdings mit sehr hohem Aufwand verbunden ist. Um Metabolite im großenMaßstab charakterisieren zu können, werden in den letzten Jahren computergestützteHochdurchsatzmethoden bereitgestellt, die überwiegend auf Fragment-Spektren be-ruhen. Da einige kommerzielle MS-Plattformen Spektren nicht zur Verfügung stellenund Weiterentwicklungen an Massenspektrometern zu schnelleren Messungen, größe-ren Datensätzen, und zu einer steigenden Anzahl an unbekannten Metaboliten führen,wird die Metabolit-Charakterisierung auch in Zukunft einen wichtigen Stellenwert inder Metabolomik einnehmen.In dieser Arbeit führe ich zwei neue automatisierte Methoden ein, die weitestge-
hend unabhängig von Fragment-Spektren arbeiten: (i) Bestimmung der hauptsäch-lichen Bestandteile von gemessenen Metabolit-Summen und (ii) Charakterisierungvon unbekannten Metaboliten einschließlich der Selektion von Kandidatenmolekülen.Im ersten Teil stelle ich eine automatische Methode vor, die anhand eines Platt-formvergleichs in einem kleinen Datensatz die Hauptkomponenten von Metabolitenmit mehrdeutigen Bezeichnungen bestimmt, die zum Imputieren von Konzentratio-nen eines (unabhängigen) großen Datensatzes auf einer höheren Präzisionsstufe ge-nutzt werden können: Phosphatidylcholine (PCs), die aus einer polaren Kopfgruppeund zwei unpolaren Fettsäureketten bestehen, werden von den meisten etabliertenLipidomik-Plattformen gemessen, indem die Gesamtlänge der Fettsäureketten undderen Sättigung bestimmt wird, wobei die Aufteilung in die sn-1 und sn-2 Positionennicht unterschieden werden kann (‘Lipidspezies-Level’). Moderne Plattformen messenMetaboliten auf einem höheren Präzisionslevel, indem sie die Länge und Sättigungbeider Seitenketten getrennt bestimmen, wobei sie deren Reihenfolge und die Positio-nen der Doppelbindungen nicht angeben können (‘Fettsäure-Level’). Für dieses Ex-periment habe ich Konzentrationen von 76 PCs des ‘Lipidspezies-Level’ und 109 PCsdes ‘Fettsäure-Level’ verwendet, die von AbsoluteIDQTM (welche von vielen großenKohortenstudien verwendet wurde) bzw. von LipidyzerTM (welche präziser quanti-fiziert) in den selben 223 Proben von gesunden jungen Männern gemessen wurden.Zunächst habe ich 150 bis 456 theoretisch mögliche Bestandteile für die 76 gemesse-nen PC-Summen (‘Lipidspezies-Level’) bestimmt, indem ich die Länge und Anzahl anDoppelbindungen systematisch auf ihre sn-1 und sn-2 Positionen verteilt habe. 69 der109 PCs wurden als Bestandteil von 38 PC-Summen identifiziert, wobei 10 Kompo-sitionen aus einer hauptsächlichen Komponente mit einem quantitativen Beitrag von80% bestanden. Weitere 17 Kompositionen enthielten ein oder zwei Komponentenmit einem Beitrag von 20 bis 80%. In einem Fall wurde ein PC als Hauptkomponente
xi
ermittelt, welches eine ungerade Kettenlänge bei einer seiner Fettsäureketten aufwies.Diese Beobachtung war nicht zu erwarten, da geradzahlige Fettsäuren in tierischenZellen bzw. Plasma wesentlich häufiger vorkommen als ungerade Kettenlängen. Da13 quantitative Kompositionen direkt und 19 Kompositionen durch Imputieren vonMetaboliten-Konzentrationen in Proben einer zweiten unabhängigen Kohorte repli-ziert wurden, kann davon ausgegangen werden, dass sich die bestimmten Faktorenzum Imputieren von PC-Konzentrationen eignen (‘Lipidspezies-Level’ → ‘Fettsäure-Level’). Obwohl PCs des ‘Fettsäure-Levels’ nicht mit molekularen Strukturen gleich-zusetzen sind, erlauben sie wesentlich präzisere Interpretationen im biochemischenZusammenhang.Im zweiten Teil stelle ich ein systembiologisches Modell vor, das die Charakte-
risierung von unbekannten Metaboliten, die durch non-targeted MS Technologiengemessen wurden, aus einer ganzheitlichen Perspektive angeht. Während sich be-stehende Methoden mit dem Verknüpfen von aus Fragment-Spektren gewonnenenInformationen und Datenbankeinträgen beschäftigen, identifiziert mein Ansatz diebiochemische Umgebung von unbekannten Metaboliten, bevor konkrete Kandida-ten selektiert werden. Mit diesem Ziel habe ich 637 Konzentrationen (388 bekannt,249 unbekannt) verwendet, die in 2 279 Proben gemessen wurden, um paarweise parti-elle Korrelationen zu bestimmen, die nachweislich ohne Vorwissen biochemische Stoff-wechselwege rekonstruieren können. Das Modul zur automatischen Datenintegrationvereinigt signifikante Assoziationen mit einem publizierten Gaußschen graphischenModell (GGM), die mit 1 040 Kanten das Rückgrat des Netzwerkmodells darstellen.Des Weiteren wurden 299 Metabolit-Gen-Assoziationen einer publizierten mGWASund 1 152 Reaktionen sowie 495 funktionale Metabolit-Gen-Relationen einer öffentli-chen Datenbank zum Modell hinzugefügt, indem bereits integrierte Metabolite gefun-den und weitere Metabolite ergänzt wurden. Zur Charakterisierung von unbekanntenMetaboliten greifen mehrere Module auf das Netzwerkmodell zu und transferierenInformationen von bekannten zu unbekannten Metaboliten. Auf diesem Weg wurden180 unbekannte Metabolite mit einer Zuordnung zu einem Stoffwechselweg annotiertund für 100 Paare von bekannten und unbekannten Metaboliten 21 Reaktionstypenselektiert. 12 zugeordnete Reaktionen wurden mit einem zweiten Kriterium (Reten-tionszeit) untermauert. In 1 209 Proben einer zweiten unabhängigen Kohorte, in derMetaboliten mit einer hochauflösenden non-targeted MS Plattform gemessen wurden,replizierte ich 18 von 26 Annotationen der Stoffwechselwege, die in beiden Datensät-zen unabhängig voneinander vorhergesagt wurden. Für 139 der 315 hochauflösend

xii Zusammenfassung
gemessenen unbekannten Metabolite, die im Netzwerkmodell bekannte Metaboliteunter ihren Nachbarn haben, wurden 676 Kandidaten automatisch selektiert, indemöffentliche Datenbanken auf strukturell ähnliche Moleküle (zu benachbarten Meta-boliten im Netzwerkmodell) mit gleicher Masse durchsucht wurden. Zum Schlusshabe ich zwei von fünf selektierte, kommerziell erhältliche Kandidaten durch MS-Messungen experimentell verifiziert und eine Datenbankstruktur vorgestellt, die esermöglicht, vorhergesagte oder verifizierte Annotationen von unbekannten Metaboli-ten zu organisieren. Im Gegensatz zu bestehenden Methoden platziert mein Ansatz,der auf Metaboliten-Konzentrationen, genetischen Assoziationen, und Informationenvon öffentlichen Datenbanken beruht, unbekannte Metabolite in ihren biochemischenKontext, was auch für Metabolite deren Struktur nicht gänzlich aufgeklärt werdenkann, fundierte Interpretationen erlaubt.In dieser Arbeit habe ich zwei neue automatische Methoden zur biochemischen
Aufklärung von unbekannten bzw. mehrdeutig annotierten Metaboliten vorgestellt,die in erster Linie auf gemessenen Metaboliten-Konzentrationen beruhen. Beide Me-thoden können eigenständig, oder in Kombination mit komplementären Methodenverwendet werden und ermöglichen bzw. verbessern präzise Interpretationen in künf-tigen Studien der Metabolomik, indem sie das biochemische Umfeld von Metabolitenidentifizieren.

Scientific contributions
In course of this thesis I contributed to the scientific community by publishing inpeer reviewed journals and presenting at conferences or summer schools as listedbelow.
• Quell JD, Römisch-Margl W, Haid M, Krumsiek J, Skurk T, Adamski J, HaunerH, Mohney R, Daniel H, Suhre K, Kastenmüller G. A platform comparisonto characterize compositions of phosphatidylcholines measured as li-pid sums in human plasma. Prepared manuscript, concurrent submissionto the Journal of Lipid Research scheduled for 12/2018.
• Quell JD. Characterizing compositions of phosphatidylcholines mea-sured as lipid-sums in human plasma – a platform comparison. Confe-rence talk. 8th Grainau Workshop of Genetic Epidemiology “From Associationto Function”. Grainau, D, 2018.
• Quell JD, Römisch-Margl W, Colombo M, Krumsiek J, Evans AM, Mohney R,Salomaa V, de Faire U, Groop LC, Agakov F, Looker HC, McKeigue P, Col-houn HM, Kastenmüller G. Automated pathway and reaction predictionfacilitates in silico identification of unknown metabolites in humancohort studies. Journal of Chromatography B – Analytical Technologies inthe Biomedical and Life Sciences, 1071:58–67, 2017.
• Quell JD. What can we learn from population metabolomics?. Confe-rence talk. 1st Munich Metabolomics Meeting, Freising, D, 2017.
• Hastreiter M, Jeske T, Hoser J, Kluge M, Ahomaa K, Friedl MS, Kopetzky SJ,Quell JD, Mewes HW, Küffner R. KNIME4NGS: a comprehensive tool-box for Next Generation Sequencing analysis. Bioinformatics, 33(10):1565–1567, 2017.
xiii

xiv Scientific contributions
• Altmaier E, Menni C, Heier M, Meisinger C, Thorand B, Quell JD, Kobl M,Römisch-Margl W, Valdes AM, Mangino M, Waldenberger M, Strauch K, IlligT, Adamski J, Spector T, Gieger C, Suhre K, Kastenmüller G. The Pharma-cogenetic Footprint of ACE Inhibition: A Population-Based Metabo-lomics Study. PLoS One, 11(4):e0153163, 2016.
• Quell JD, Römisch-Margl W, Colombo M, Krumsiek J, Looker H, Agakov F,McKeigue P, Gieger C, Adamski J, Suhre K, Colhorn H, Kastenmüller G. Iden-tification of unknown metabolites with systems biology models. Pos-ter presentation. SUMMIT Symposium and Plenary Meeting, Malmø, Sweden,2015.
• Quell JD, Krumsiek J, Gieger C, Adamski J, Suhre K, Kastenmüller G. Iden-tification of Unknown Metabolites with Means of Systems Biology.Talk and poster presentation. International Summer School: Data Aquisitionand Analysis in Metabolomics, Pula, Cagliari, Italy, 2014.
• Quell JD, Krumsiek J, Gieger C, Adamski J, Suhre K, Kastenmüller G. Iden-tification of Unknown Metabolites with Means of Systems Biology.Poster presentation. Conference Metabomeeting 2014, London, GB, 2014.

Contents
Abstract v
Scientific contributions xiii
1 Introduction 11.1 Current concepts and techniques in metabolomics . . . . . . . . . . . 2
1.1.1 Techniques to quantify metabolites . . . . . . . . . . . . . . . 31.1.2 Challenges and opportunities of metabolomics experiments . . 8
1.2 Systems biology models support metabolomics studies . . . . . . . . . 101.2.1 Networks for organization of biological information . . . . . . 111.2.2 Applications of network models in metabolomics . . . . . . . . 131.2.3 Opportunities in systems medicine . . . . . . . . . . . . . . . 15
1.3 Approaching structurally uncharacterized metabolites . . . . . . . . . 171.3.1 Uncharacterized metabolites in scientific results . . . . . . . . 171.3.2 Current metabolite annotation approaches . . . . . . . . . . . 181.3.3 Objective . . . . . . . . . . . . . . . . . . . . . . . . . . . . . 19
2 Materials and methods 232.1 Characterization of PC compositions . . . . . . . . . . . . . . . . . . 23
2.1.1 Human plasma samples of a controlled cohort . . . . . . . . . 232.1.2 PC quantification on the lipid species level (AbsoluteIDQTM) . 242.1.3 PC quantification on the fatty acid level (LipidyzerTM) . . . . 252.1.4 Qualitative description of PC sums . . . . . . . . . . . . . . . 262.1.5 Quantitative estimation of PC compositions . . . . . . . . . . 262.1.6 Replication of estimated quantitative PC compositions . . . . 272.1.7 Imputation of measured PC levels . . . . . . . . . . . . . . . . 272.1.8 Testing variation of compositions across subjects and challenges 282.1.9 Estimation of unmapped constituents of PC sums . . . . . . . 28
xv

xvi Contents
2.2 Annotation of metabolites measured by non-targeted metabolomics . 292.2.1 Study cohorts . . . . . . . . . . . . . . . . . . . . . . . . . . . 302.2.2 Metabolomics measurements . . . . . . . . . . . . . . . . . . . 302.2.3 Public data sources and data types . . . . . . . . . . . . . . . 322.2.4 Data processing and integration . . . . . . . . . . . . . . . . . 322.2.5 Automated prediction of super and sub pathways . . . . . . . 342.2.6 Automated prediction of reactions connecting metabolites . . 362.2.7 Comparative annotation of incorporating different platforms . 372.2.8 Computer aided manual candidate selection . . . . . . . . . . 392.2.9 Automated candidate selection procedure . . . . . . . . . . . . 392.2.10 Experimental verification of selected candidate molecules . . . 432.2.11 Storage of predicted or verified metabolite annotations . . . . 45
3 Results and discussion I:Characterization of PC compositions measured as lipid sums 473.1 Background . . . . . . . . . . . . . . . . . . . . . . . . . . . . . . . . 473.2 Qualitative composition of PC sums . . . . . . . . . . . . . . . . . . . 513.3 Quantitative composition of PC sums . . . . . . . . . . . . . . . . . . 52
3.3.1 Estimation of factors f . . . . . . . . . . . . . . . . . . . . . . 523.3.2 Variation of factors f . . . . . . . . . . . . . . . . . . . . . . . 53
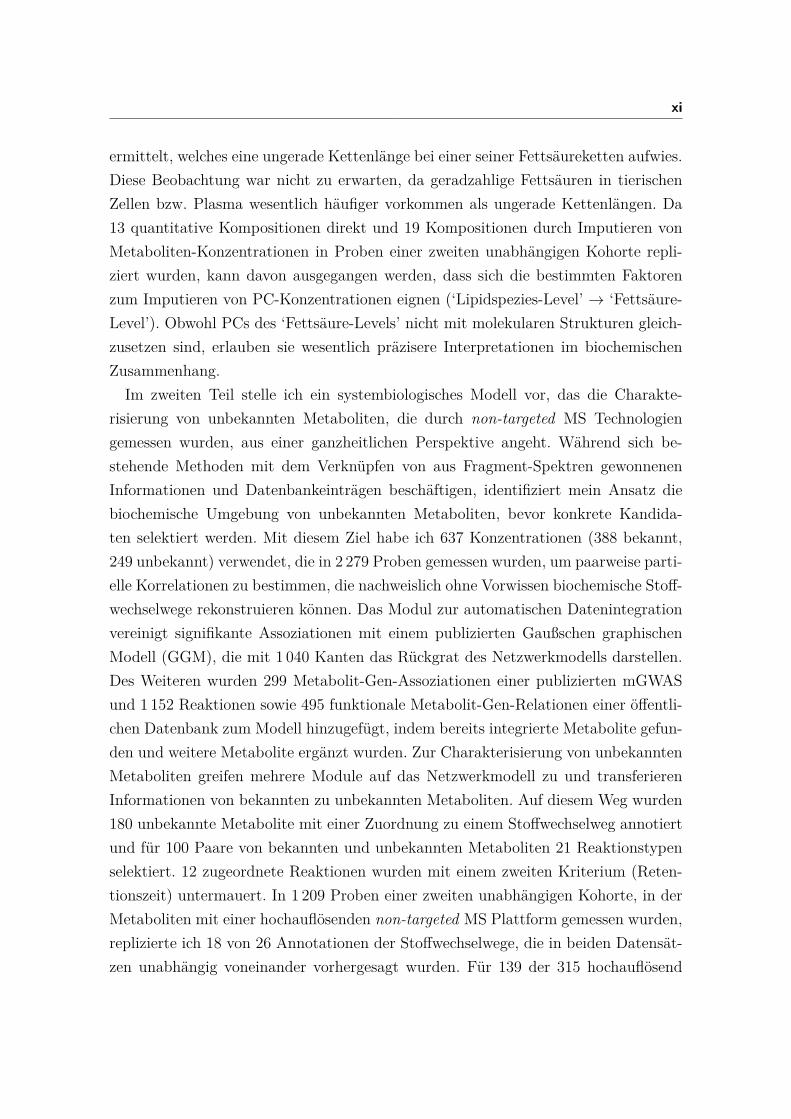
3.4 Replication of quantitative compositions in another cohort . . . . . . 563.4.1 Comparison of factors f between data sets . . . . . . . . . . . 563.4.2 Imputation of PC concentrations across data sets . . . . . . . 57
3.5 Contribution of non-measured constituents in PC sums . . . . . . . . 583.6 Discussion . . . . . . . . . . . . . . . . . . . . . . . . . . . . . . . . . 60
3.6.1 Strategies for structural elucidation of complex lipids . . . . . 613.6.2 Attributes of PC compositions in selected cohorts . . . . . . . 613.6.3 Precision levels in lipidomics experiments . . . . . . . . . . . . 633.6.4 Summary . . . . . . . . . . . . . . . . . . . . . . . . . . . . . 65
4 Results and discussion II:Systems biology models for annotation of unknown metabolites 674.1 Background . . . . . . . . . . . . . . . . . . . . . . . . . . . . . . . . 674.2 Integration of data from different biological domains . . . . . . . . . . 704.3 Automated workflow-based characterization of unknown metabolites . 72
4.3.1 Prediction of pathways . . . . . . . . . . . . . . . . . . . . . . 73

xvii
4.3.2 Prediction of reactions . . . . . . . . . . . . . . . . . . . . . . 744.4 Comparative annotation of metabolites measured on different platforms 76
4.4.1 Comparison of separately performed annotations . . . . . . . . 774.4.2 Benefit of annotations within merged sets . . . . . . . . . . . 79
4.5 Automated selection of candidate molecules . . . . . . . . . . . . . . 834.5.1 Automated procedure . . . . . . . . . . . . . . . . . . . . . . . 844.5.2 Parameter optimization and performance . . . . . . . . . . . . 854.5.3 Automatically selected candidates . . . . . . . . . . . . . . . . 874.5.4 Computer aided manual candidate selection . . . . . . . . . . 90
4.6 Experimental verification of selected candidate molecules . . . . . . . 924.7 Concepts to organize predicted or verified metabolite annotations . . 944.8 Discussion . . . . . . . . . . . . . . . . . . . . . . . . . . . . . . . . . 96
4.8.1 Large scale metabolite characterization without fragment spectra 974.8.2 Complementary annotation through orthogonal information . 984.8.3 Strategies to select specific candidate molecules . . . . . . . . 1004.8.4 Future directions of metabolite characterization approaches . . 1014.8.5 Summary . . . . . . . . . . . . . . . . . . . . . . . . . . . . . 102
5 Summary and outlook 1035.1 Achieved goals in metabolite characterization . . . . . . . . . . . . . 1045.2 Biological benefit of precise metabolite annotations . . . . . . . . . . 1055.3 Technical aspects on automated characterization approaches . . . . . 1075.4 Future directions in handling structurally uncharacterized metabolites 111
Bibliography 113
Appendix A Supplements: Characterization of PC sums 143
Appendix B Supplements: Annotation of unknown metabolites 149
Index of external materials 239
List of figures 241
List of tables 243
List of abbreviations 245
Teaching activity 247


CHAPTER 1Introduction
In the last decades, several omics-disciplines have emerged in modern molecular bi-ology. Omics is used as suffix that aggregates molecular analyses focusing on theentirety of specific molecular units of one kind. The prefix specifies the molecularlayer: e.g. proteomics, genomics, lipidomics, or transcriptomics. Metabolomics, asan example, deals with questions about small molecules, such as lipids, amino acids,nucleotides, peptides, and carbohydrates [1]. Metabolites can be found in any cell orfluid of living organisms (kingdoms: prokaryotes, eukaryotes (animals, plants, etc.),or archaea). While specific metabolites are substrates, intermediates, or productsof biochemical reactions or pathways, the metabolome describes all metabolites asentirety. [2, 3]Subdivision of molecular constituents of biochemical processes into several omics-
areas requires systems biology concepts (as super-structure) to reconstitute multi-level processes in integrative networks [4]. Although data in biology grows exponen-tially and is regularly organized as complex evolving networks of publications, topics,and ideas, there is still only a very tiny fraction of the theoretical information space(organisms × organs × cell types × genes × metabolites; and interactions, phenoty-pes, etc.) covered [5]. Efficient concepts and tools are necessary to utilize large partsof published knowledge for new projects. Systems biology tries to integrate variousomics-modules to receive a comprehensive model containing all levels of biochemicalfunction. This principle copes with the challenge to depict (parts of) the biologicalreality, in which many systems interact with each other. [3]
1

2 1 Introduction
1.1 Current concepts and techniques in metabolomicsIn contrast to genomes, the human metabolome is influenced by fixed (e.g. genetics,sex) as well as variable factors, such as the environment (air and water quality, disea-ses, lifestyle including specific diets, food, regular night shifts, and physical activity),molecular parameters (epigenetics, medication, and gene regulation), and personalproperties (age and body mass index (BMI)). As a consequence, the metabolomecan be seen as intermediate (molecular) phenotype that is (at least in part) objec-tively measurable in very large sample sizes [6, 7]. Some of these factors dependon each other (e.g. food and BMI, or disease and medication) and further ones canbe both, cause or consequence of metabolic changes (e.g. diseases, medication, epi-genetics, gene regulation, and BMI) [8]. The variability of metabolomes enablesestimation of metabolic responses to environmental factors (quantitatively or quali-tatively) and exploration of (functional) links between metabolite levels and geneticpredispositions [9–11].Metabolomics experiments are based on small clinical case-control or interventional
study designs or on large cohort studies [9, 11]. In general, cohort studies employan epidemiological observation study design in which several hundred or thousandparticipants reflect a cross-section through a certain population [12]. Participants areusually selected according to specific criteria, such as disease state, residential region,sex, age, BMI, medication, and ethnic origin. Appropriate protocols for collection ofinformation and bio-samples (e.g. blood plasma, serum, urine, saliva, sweat, tears, orcell tissue) ensure unbiased data for later analyses. Besides metabolite levels, cohortstudies incorporate further data on participants: e.g. clinical or life style informa-tion. These data are frequently collected by questionnaires that are very cheap, butthe data quality strongly depends on the honesty, knowledge, and self-assessmentof participants [13–15]. Because of cost, effort, and ethnics some data or samplesare only collected for a small subset of cohorts. As an example, Cooperative HealthResearch in the Augsburg Region (KORA) (n=3 080) focuses the exploration of car-dio vascular diseases including cross-links to environmental factors and samples wererandomly selected in the region of Augsburg [16, 17]. The German chronic kidneydisease (GCKD) study (n≈ 5 000) examines patients suffering from the homonymousdisease [18], surrogate markers for micro- and macro-vascular hard endpoints forinnovative Diabetes tools (SUMMIT) was sampled based on seven existing cohorts(n=2 279) [19–23], and the German national cohort (NAKO) (n≈ 200 000) will be a

1.1 Current concepts and techniques in metabolomics 3
large data basis for investigating the functional origin of common diseases (e.g. can-cer, diabetes, or cardio vascular diseases) and for finding new diagnostic and treat-ment procedures [24]. Since measured metabolomes represent snapshots of evolvingsystems, longitudinal studies, such as the Human Metabolome (HuMet) study [25],measure metabolite levels in samples that were taken during several time points.Data from large cohort studies is often analyzed by metabolite-based genome-wide
association studies (mGWAS), in which metabolite levels are statistically linked togenetics, i.e. to single nucleotide polymorphisms (SNPs), by linear models: genotypeAA (major allele homozygous), Aa (heterozygous), or aa (minor allele homozygous).These analyses provide insights into probable tasks of gene products in biochemi-cal pathways [26–30]. In metabolome-wide association studies (MWAS), (patho-)phenotypes are correlated to metabolite levels for identification of possible diseasepathways [31–33].MWAS and mGWAS are statistical approaches that do not provide information
about causal relationships. Therefore, resulting links must be examined manually,using previous biochemical knowledge. There are many publicly accessible databasesorganizing results of statistical analyses and in part functional knowledge: e.g. GWASserver [34], SNiPA [35], ENCODE [36, 37], or Kyoto Encyclopedia of Genes andGenomes (KEGG) [38, 39].
1.1.1 Techniques to quantify metabolites
There are two fundamentally different high-throughput technologies to quantify largesets of metabolites: mass spectrometry (MS) (optionally a chromatography is cou-pled to the MS device) and nuclear magnetic resonance (NMR) spectroscopy. Inthis work, the focus is on data measured by MS, which is described in this section.Mass spectrometers consist of three basic parts: an ion source evaporates and ionizesmolecules, an attached mass analyzer accelerates and filters ions according to theirmass-to-charge ratio, before a detector determines the amount of passed ions.
Sample preparation
Before quantification, metabolites need to be extracted according to established pro-tocols that depend on the matrix and measuring technique. In general, bio-samplesare homogenized, dissolved in solvents (e.g. methanol), and centrifuged to separatemetabolites from proteins and cell organelles. Some metabolites may require further

4 1 Introduction
treatment for later ionization. Sample preparations should be simple and fast to en-sure reproducibility and as non-selective as possible to keep a comprehensive set ofmetabolites. A careful sample preparation is essential, because metabolites that getlost during extraction cannot be restored later. [40–42]Most metabolites remain stable over several years, if raw (or extracted) samples
are stored at -80°C or in liquid nitrogen [43].
Mass spectrometric measurement
During the first step, an ion source accelerates and forwards molecules into themass analyzer. Soft ionization methods, like matrix-assisted laser desorption/ ioniza-tion (MALDI) that is most efficient for peptides, or electrospray ionization (ESI) thatis optimal for most of the other polar molecules and is a quasi-standard for metabo-lomics MS, lead to very few fragmentation of metabolites. An ESI source consists ofa metal capillary (inner diameter around 100 µm), with a voltage applied to its endand an electrode (cathode in positive mode or anode in negative mode) containing asmall hole aligned to the capillary (Figure 1.1(a)). Metabolites dissolved in methanol
+
+-- +
+--
ESI Q1 (m/z filter) Q2 (collision cell) Q3 (m/z filter) count ions
+ -
++++ ++
++
++
+-------
•• •
••••
+ ++++ + +
++
• ••• • ++ ++
+•••••++++ •
••+
•+ ++
4 kV
Taylor-Cone evaporation ions
capillaryelectrode
+
+--
collision gas
+
+--
(a) ion source
+
+-- +
+--
ESI Q1 (m/z filter) Q2 (collision cell) Q3 (m/z filter) count ions
+ -
++++ ++
++
++
+-------
•• •
••••
+ ++++ + +
++
• ••• • ++ ++
+•••••++++ •
••+
•+ ++
4 kV
Taylor-Cone evaporation ions
capillaryelectrode
+
+--
collision gas
+
+--
(b) mass analyzer (triple quadrupole)
+
+-- +
+--
ESI Q1 (m/z filter) Q2 (collision cell) Q3 (m/z filter) count ions
+ -
++++ ++
++
++
+-------
•• •
••••
+ ++++ + +
++
• ••• • ++ ++
+•••••++++ •
••+
•+ ++
4 kV
Taylor-Cone evaporation ions
capillaryelectrode
+
+--
collision gas
+
+--
(c) detector
Figure 1.1: Functional elements of a tandem mass spectrometerMain elements of a tandem mass spectrometer are shown as exemplary sketch. (a) ESIgenerates ions based on molecules and a solvent. For the negative mode, lots of the capillaryand the electrode are swapped. (b) The first and the third quadrupole (Q1 and Q3) filterions according to their mass-to-charge ratio. The second quadrupole (Q2) is filled witha collision gas and fragments ions. The charge of electrodes changes, whereas oppositepairs of electrodes are applied with the equal charge. (c) Finally, the detector counts ionsthat pass through the mass analyzer. These parts of mass spectrometers are inside vacuumchambers. The elements of the functional sketch are not true to scale. Contents of thisfigure has been inspired by Grebe et al. 2011 [44] and Honour 2003 [45].
and water are lead through the capillary (flow rate 1 – 10 µl/min). The high voltageof 3 – 4 kV leads to an accumulation of positively (in positive mode) or negatively(in negative mode) charged ions leaving the end of the capillary through a formationcalled Taylor-Cone. The solvent of the released aerosol progressively evaporates until

1.1 Current concepts and techniques in metabolomics 5
droplets burst and a stream of ionized molecules passes the hole of the electrode andenters the mass analyzer. [46–49]Mass analyzers (e.g. time of flight (TOF), quadrupole, or ion traps) accelerate ions,
optionally fragment metabolites, and filter them according to their mass-to-chargeratio. TOF analyzers accelerate ions and measure the time that ions need to movethrough the analyzer until reaching the detector. The velocity of equally chargedions only depends on their mass (ions of peptides may be multiply charged) [50, 51].Quadrupole mass analyzer contain four rod-shaped electrodes, in which the samecharge is applied to opposite electrodes (Figure 1.1(b)). An oscillating electric fieldmoves ions on a circular path through the mass analyzer. The radius depends ontheir mass-to-charge ratio and on the energy of the applied electric field. Only ionswith a mass-to-charge ratio within a predefined range can pass the quadrupole [52–54]. Ion traps (e.g. Orbitrap) collect ions in electrostatic fields and release them in acontrolled manner by electric impulses or measure them inside based on their specificoscillation [55, 56].Ions passing the mass analyzer are forwarded to a detector (Figure 1.1(c)). Detec-
tors basically count the number of ions, leading to a semi-quantitative estimation ofmetabolite levels. The measurement of internal standards with known concentrationsincrease the precision that may (partially) allow an absolute quantification (within adevice-dependent error range). [57, 58]
Separation of metabolites
Samples can either be directly injected into mass spectrometers (flow injection ana-lysis (FIA)), or they went through a chromatography for a chemical pre-separationof molecules first. In the best case, MS quantifies preferably individual chemicalstructures. The procedure described above would lead to an excessive quantificationof mixtures of several compounds with a narrow mass-to-charge range, because theseparation of molecules is not sufficient. There are several approaches of tandemmass spectrometry (MS/MS) to select metabolites more precisely: e.g. using a triplequadrupole or an ion-trap mass analyzer. Furthermore, injecting probes through achromatography before mass spectrometric analyses enable a pre-separation of ana-lytes. Often with triple quadrupole mass spectrometers, sample extracts are directlyinjected into the ionizer (FIA). Mass analyzers of these mass spectrometers containthree quadrupoles that are connected in linear series. In multiple reaction monito-ring (MRM) mode, ions are preselected by the first quadrupole (Q1) based on their

6 1 Introduction
mass-to-charge ratio. Passing ions get into the second quadrupole (Q2) that func-tions as collision cell. The cell contains a collision gas (e.g. nitrogen), whose moleculescollide with ionized molecules that break into smaller parts. Resulting fragments arefinally filtered by the third quadrupole (Q3) and are passed forward to the detector.An ion-trap (e.g. orbitrap) can combine several procedures in a single mass analyzer.Ions are collected within the orbitrap and specific ions are isolated by removing allother ions out of the analyzer. While triple quadruples perform a (i) selection, (ii)fragmentation, and (iii) selection step, orbitraps allow several iterations of selectionand fragmentation runs. Precursor scans (MS1 spectra) that are recorded before(without) fragmentation contain intensities of mass-to-charge ratios of complete ions.Selected mass-to-charge ratios (within a selected range and above a chosen intensity)are fragmented and recorded as MS2 spectra. This spectrum contains fragmentationpatterns of single peaks of the MS1 spectrum. [59–61]As second option to increase the separation of measured compounds, the mass
spectrometer can be coupled to a liquid chromatography (LC) or gas chromato-graphy (GC). Probes are injected into the chromatography column, leading to apre-sorting of metabolites according to their retention time (RT), before they are(physically separated) forwarded to the attached mass spectrometer. Therefore, twodifferent techniques (chromatography and mass spectrometry) targeting different che-mical or physical properties are used for distinguishing metabolites. In general, chro-matographic procedures use a stationary phase that retains target molecules and amobile phase that washes out molecules. Molecules that fulfill the following threecriteria can be physically separated by this procedure: they need to be retained bythe stationary phase, are solvable in the mobile phase, and show different affinities tothe stationary phase (to be washed out successively). The column is developed witha gradient of the mobile phase solvent (increasing concentration) during a definedperiod. The time molecules need to pass the chromatography column is measured(RT) and represented by a total ion chromatogram (TIC) (x-axis: retention time,y-axis: base peak intensity) or for a selected mass-to-charge ratio (i.e. specific mole-cule) by an extracted ion chromatogram (EIC). RT is usually standardized receivinga retention index (RI) to increase comparability. The columns of LCs consist of acapillary with a connected high-pressure pump for probe injection. The mobile phaseusually contains organic solvents (e.g. methanol). [62, 63]

1.1 Current concepts and techniques in metabolomics 7
Targeted and non-targeted metabolomics
Measuring techniques of metabolomics can be generally classified as targeted or non-targeted. In targeted metabolomics a predefined set of metabolites of interest (specificgroup or metabolites of one pathway) is measured with high accuracy (absolute quan-tification in nmol/g or Micromolar (=̂ µmol/L)). The extraction can be specific forthe selected compounds, leading to a selective extraction, higher level of purification,and better probe quality. Since all metabolites are (accurately) identified, this ap-proach is capable for e.g. hypothesis testing. Measurements can be reproduced withina given error range (that is specific for the quantification technique). [64–67]Non-targeted metabolomics (also known as metabolic fingerprinting) is a label-free
approach for measuring as many metabolites that are in the sample (after prepara-tion and extraction) as possible to capture the comprehensive cellular metabolism.The focus is on the detection of possibly thousands of metabolites of various groupsand pathways. Samples require a comprehensive preparation (several runs applyingdifferent techniques) for extraction of a heterogeneous set of metabolites. In return,measured metabolites are previously not annotated by chemical structures and onlya subset can be identified (depending on the MS platform). Non-targeted metabo-lomics typically leads to semi-quantitative measurements (ion counts), because nofurther knowledge and no internal standards are available. As another consequence,measurements cannot be easily reproduced and metabolite levels of different mea-surements (measuring time points, laboratories, or platforms) cannot be compareddirectly. This limitation is in part resolved by using metabolite ratios (ideally witha pair of metabolites that are causally related) or metabolite associations to stabi-lize the signal and therefore enable reproducibility and comparability. Non-targetedmetabolomics is suitable for large scale screens (for obtaining patterns or compre-hensive fingerprints) and hypothesis-free assays (e.g. MWAS for identification of newbiomarkers). [66–70]In general, quantified metabolites may consist of mixtures of compounds instead of
single chemical structures (e.g. hexoses, or complex lipids). Some metabolites cannotbe separated by MS (and optionally by coupled LC or GC) according to their chemicaland physical properties. Quantification of metabolites on mass spectrometric devicesis influenced by the extraction procedure, temperature, air pressure, humidity, theexecuting laboratory, equipment, and lots of consumables.Depending on the weight of quantified molecules, the usable resolution of older MS
devices is ± 0.3 Da and for newer devices ± 0.0001 – 0.001 Da (accurate mass reso-

8 1 Introduction
lution). Molecular masses or mass differences are reported in the chemical standardunits Dalton (Da) or unit (u). These units are defined as relative measure accordingto the atom mass of carbon-12: 1 Da = 1 u = mass(12C)
12 . Mass spectrometers usuallymeasure the mass-to-charge ratio (m
z) that is equivalent to Da, if z=1. The mass
accuracy of high-resolution MS measurements is indicated in parts per million (ppm)and depends on the measured mass (ppm = mmeasured−mexact
mexact· 106) (e.g. 0.5 – 1 ppm
for an orbitrap mass analyzer). While the exact mass of molecules refers to a calcu-lated mass of molecules (according to a specified isotope distribution), the accuratemass is defined as measured mass that enables determination of the unambiguousatomic composition of molecules (� 0.1 ppm, depending on the molecular weight).Public databases including Human Metabolome Database (HMDB) [71], KEGG [38],PubChem [72], and ChemSpider [73] report the monoisotopic mass (sum of massesof the most abundant isotopes of atoms of a molecule) and the average mass or mo-lecular weight (sum of the average masses of atoms of a molecule according to anobserved isotope distribution) for each molecule, considering different isotopic com-positions. [74–77]There are several standardized platforms (e.g. BiocratesTM 1 AbsoluteIDQTM kit for
targeted metabolomics or MetabolonTM 2 for non-targeted metabolomics) for quan-tification of a set of metabolites. These companies provide procedures for sampleextraction, measurement, and analysis of samples, specify measuring devices and of-fer consumables (solvents, chemicals, chromatography columns, standards, etc.) andsoftware. In part, they carry out metabolite identification and quality control (QC) ofmeasured data. MetabolonTM, as an example, identifies a subset of measured meta-bolites based on RI (in the EIC) and MS2 spectra (fragmentation pattern) accordingto their internal library. Quantification is performed by the base peak intensity.
1.1.2 Challenges and opportunities of metabolomics experiments
Metabolomics has great potential in clinical applications, because measurements re-quire very small amounts of probe material (usually 10 µL– 1 mL) and high num-bers of (several hundred or thousand) metabolites can be quickly measured in easilyaccessible matrices like blood, urine, or saliva. Measured metabolomes reflect thephysiological status that depends on intrinsic (gene variation or diseases) or extrinsic
1 BiocratesTM Life Sciences AG, Innsbruck, Austria2 MetabolonTM Inc., Durham, NC, USA

1.1 Current concepts and techniques in metabolomics 9
(environmental) factors. Although metabolomics platforms can only capture a sub-set of the metabolome of an organism, quantification incorporates several hundredor thousand metabolites. Compared to traditional quantification of single values,metabolomics quantification is cheap and scalable to large sample sizes.One of the major challenges of metabolomics (especially for non-targeted metabo-
lomics) is the limited comparability of ‘concentrations’. However, it has been shown,that ratios of (functionally related) metabolite levels that have been measured indifferent laboratories or on different devices are consistent across methods and pro-tocols [78, 79]. This principle is successfully applied in new born screens that areestablished in clinical context since several years [80, 81]. As second solution, stan-dardization of metabolite levels increases comparability significantly.Non-targeted metabolomics leads to measurement of distinguishable metabolites
with an initially unknown chemical structure. The measuring device provides RT(if a LC or GC hast been performed), mass-to-charge ratio, and (depending on theexecutive laboratory or company) fragmentation spectra, but the chemical identityor classification into biochemical pathways are lacking. Results of scientific analy-ses (e.g. cohort studies) frequently contain associations to, regressions with, or mo-dels containing unknown metabolites. The further use of these results is limited,since interpretations in biochemical contexts or clinical applications are impossible.This procedure requires chemically unambiguously characterized, or at least partiallyannotated metabolites [82]. While previous metabolite characterization approachescompare complete measured and target fragmentation spectra [83–85], recent meth-ods cluster individual peaks [86], perform in silico fragmentation of database struc-tures for a comparison to measured spectra of unknown metabolites [87–89], predictmolecular fingerprints based on measured spectra of unknown metabolites to selectdatabase compounds with similar fingerprints [90–93], or construct networks basedon spectral similarity and known biochemical relations [94]. Characterization of un-known metabolites enables scientific interpretations by placing respective moleculesinto their biochemical context.On a cellular level of biochemical pathways, some metabolites have very high turn-
over rates (assuming a normal distribution of turnover rates), leading to flexiblemetabolic fingerprints that strongly depend on the type or physiological state ofmatrices (or tissues) and compartmentation of pathways [82, 95]. Levels or mea-sured concentrations of specific metabolites are influenced by various factors basedon subjects (genetic variations, sex, age, BMI, lifestyle, food, diseases, drugs, and

10 1 Introduction
microbiome), preanalytical probe handling (collection, storage, and extraction), ormeasurement (batch effects and metabolomics platform) [96]. Although levels of sin-gle metabolites react sensitively to diseases, drug intake, or environmental exposures,cohort studies showed that individual metabolomes are stable over several years [6, 7].Metabolomics measurements show singular snapshots of an evolving biochemical sys-tem. Longitudinal analysis (taking several samples within defined periods of times tomodel time series) can partially cope with this issue, however, models can impossiblydepict the entirety of influencing factors. The sample size should be appropriate andmajor driving factors should be covered.Metabolomics has an important role in current scientific health or disease related
studies. This includes examination of influences of diseases, environmental factors, orgenetic predispositions to the biochemical balance determined by mGWAS or MWASas first analyses. It is still a challenge to transfer observations from systems biologymodels to clinic cases, because some impacting factors, such as diet or lifestyle, cannotbe completely observed. Cross-sectional cohort studies usually contain large sampleheterogeneity that is challenging for learning procedures, but also for procedures suchas prediction or classification [95].As hypothesis driven as well as hypothesis free approaches, metabolomics makes
sense in clinical medicine for several applications: e.g. discovery of hidden reasons forcommon diseases may lead to disease-origin oriented treatments (in contrast to con-ventional treatments of symptoms solely) or investigation of individual rare diseases(cf. Chapter 1.2.3). It is an ongoing challenge to convince physicians of using meta-bolomics analyses in their everyday practice and health insurances to pay for thesediagnostic examination techniques. Modern medicine is becoming more and moreexpensive (magnetic resonance imaging, surgeries, specialized medication, increasingnumber of treatment options) that will be a heavy burden for the social health sys-tem. Metabolomics can reduce the cost of laboratory blood tests dramatically and inaddition, it provides several thousand values [97]. Systems biology implements stra-tegies for integration of large datasets (e.g. high number of metabolites) to receivemodels that organize complex data and are easily searchable. [98]
1.2 Systems biology models support metabolomics studiesIn many disciplines, traditional science is very successful by reducing tasks and ans-wering questions isolated from their comprehensive environment. Since (micro) bio-

1.2 Systems biology models support metabolomics studies 11
logical processes are typically highly crosslinked to other processes related to variousregulatory levels, these systems can only be captured by a global description contai-ning as much interacting factors as possible. Systems biology copes with the challengeto integrate various levels of omics-areas into a comprehensive model, knowing that(by definition) models depict only parts of reality. [99, 100]Already fifty years ago, the central dogma of molecular biology dealt with the linear
transfer of sequential genetic information and stated that this information cannot betransferred from protein to protein or back to nucleic acids [101]. However, there areprocesses influencing or regulating the gene expression (transcription, translation,and protein function) incorporating epigenetics/ histone modifications, microRNAs,cofactors, genetic predispositions, and environmental signals [102, 103]. In conse-quence, elements of any biological level can be both, source and target of regulatoryprocesses.In addition to the complexity of the matter, the amount of data in biology grows
exponentially and leads to complicated evolving structures of papers containing ideasand information that cannot be handled manually. Models are required to make useof, apply, or combine this knowledge for generating a holistic picture of certain proces-ses. In systems biology, data is integrated systematically, and hypotheses are testedon resulting computational or mathematical models. On the one hand, resulting mo-dels only depict a small subset of all elements of the biochemical reality. On theother hand, these models structure available information very well, are searchable,and easy to handle compared to various types of raw data [5].
1.2.1 Networks for organization of biological information
Systems biology provides concepts and tools to integrate large amounts of hetero-geneous data of various omics-areas for approaching questions on comprehensivebiochemical processes. To this end, relationships among interacting elements andtheir effect on observed parameters can be modeled, capturing the big picture. Pos-sible elements include genes, mutations, proteins, metabolites, environmental para-meters, age, sex, BMI, disease states, medication, nutrition, and life style habits.These models are not a complete copy of reality. Systems biology typically integrateslarge amounts of high dimensional and complex data (big data). Depending on mea-surement techniques and laboratories, the quality of data varies, missing values areproduced, or the structure of information changes. [3, 95, 98, 99]The underlying data-organization of most systems biology models consist of network-

12 1 Introduction
like relationships of elements. Nodes represent elements (e.g. genes, proteins, or meta-bolites) and edges represent interactions between elements (that either belong to thesame level, e.g. protein-protein, or connect different levels, e.g. metabolite-enzyme).As an example, protein-protein interaction networks can incorporate several speciesand vast evolutionary distances [104] or metabolite-gene networks are used to recon-struct biochemical pathways including links to diseases, such as individual types oftumors, obesity, or diabetes [95, 105].The distributions of edges and nodes of most networks in biology are comparable
to scale-free topologies (Figure 1.2(b)) [106]. In contrast, random networks showtopologies, in which all nodes have similar node degrees, which is very rare in bi-ology, since self-organizing systems prefer established nodes, paths, or subsystemsleading to scale-free topologies. Furthermore, processes or compartmentation thatcontain largely independent substructures can be modeled as hierarchical networks.Hierarchical networks (e.g. signaling models) contain several scale-free networks con-nected by hierarchical super-structures. In common scale-free network topologies,few metabolites are connected to many neighboring nodes (hubs, high degree) andthe clear majority of nodes has a very small number of neighbors (low degree). As aconsequence, these networks in biology hold the small-world property, meaning thatthe distance of any pair of nodes is relatively short (distance: shortest path betweentwo nodes; path: number or weights of edges) [107]. Essential genes that encodehousekeeping proteins or -pathways tend to be represented by hubs. Scale-free net-works are robust against random failures, because probably nodes with small degreesare affected leading to a preservation of the main network structure and function.However, this type of networks is sensitive to ‘intended attacks’. In the worst case,networks may break into several parts, if main structures (such as single hubs) areaffected. In the best case, there are alternative routes through the network, but theymay have reduced capacities. Even for large networks, there are algorithms for fin-ding these potentially weak vulnerabilities efficiently. In clinical applications, hubsare promising starting points for biomarker- or drug target discovery. [106, 108, 109]Most networks of biological information contain modules that are substructures
showing a high degree of clustering (highly connected part of the network). Smallersubstructures that are related to a specific role (e.g. (negative) feedback loops, (po-sitive) feed forward loops, bifans, or oscillators) and frequently occur in biology net-works are called motives. Network models are accessed by algorithms to detect certainmodules, to search for shortest paths, to identify clusters, or to discover unexpected

1.2 Systems biology models support metabolomics studies 13
relations. Moreover, network models are able to combine results of several experi-ments to perform meta analyses or answer new questions [98].
1.2.2 Applications of network models in metabolomics
Organizing highly connective metabolic pathways requires systems biology models.Metabolic networks contain information such as reactions between metabolites, path-way annotations, and genes that encode proteins catalyzing these reactions. Al-though, metabolic networks belong to the most comprehensively described networksin biology, it is still an ongoing challenge to reconstruct the human metabolome(Recon: Virtual Metabolic Human Database [110, 111]) as a whole. Elements ofmetabolic networks are clearly separated: e.g. metabolites, reactions, and enzymes.However, there are cofactors, intermediates, co-substrates, byproducts, or secondarycompounds (e.g. ATP, ADP, NADPH, NADP+, or Water) leading to large amountsof interconnections of metabolic networks. These compounds are necessary for, orproduced by organisms, but play unspecific roles in many reactions. Furthermore,pathways that are interwoven with (or at least connected to) the basic housekeepingmetabolism have an increasing effect on the number of distant crosslinks and eachlevel of biochemical organization and control (genomics, gene expression, protein ex-pression, and metabolism) is often measured in different timescales. Since metabolitesare highly cross-linked and influenced by various stable and flexible factors, systemsbiology typically follows a top-down approach, in which observations of the generalsystem are transferred to a special part of its sub-systems (deduction). [82, 112, 113]Biochemical pathways can be reconstructed manually, hypothesis-driven, based on
experiments in the wet-laboratory, or in smaller scales computationally. Resultingnetwork maps are very precise in the basic (housekeeping) metabolism, but containlittle information about uncommon pathways, such as special disease or environmen-tal effect response pathways, or unexpected interconnections between pathways (e.g.Recon: Virtual Metabolic Human Database [110, 111], KEGG pathway maps [38, 39],MetaCyc/ HumanCyc/ BioCyc [114, 115], or Roche biochemical pathways [116]).These general pathway models can be refined to genome scale metabolic models, ifthey are enriched with species genomes.In contrast to genome scale metabolic models, metabolomics analyses use kinetic
models that consist of directed networks quantitatively depicting fluxes in biochem-ical reactions and pathways. Therefore, environmental influences and allostericallyregulated enzymes (usually only a few enzymes are regulated) are modeled precisely

14 1 Introduction
based on in vitro experiments. Metabolite levels are adjusted to achieve a balancedflux through each enzyme of the pathway. Large numbers of parameters and ne-cessity of experimental results lead to complex analyses. However, those models cansimulate the behavior of metabolomes over time, depending on defined input parame-ters. Some ressources are publicly available (e.g. BRENDA: Comprehensive EnzymeInformation System [117] contains organism information about enzyme kinetics andturnover rates). [82]While the approaches described above are based on previous biochemical know-
ledge, data-driven approaches lead to hypothesis-free reconstructions of biochemicalrelations incorporating measured known and unknown metabolites. The systema-tic estimation of pairwise Pearson correlations of metabolite levels of cohort studiesleads to correlation networks (CNs) with significant correlations between almost allmetabolites (Figure 1.2(a)). Transitive edges or edges between co-regulated meta-
(a) Correlation network (CN) (b) Gaussian graphical model (GGM)
Reaction system CN GGM Reaction system CN GGM
(c) Exemplary coherence I (d) Exemplary coherence II
Figure 1.2: Comparison of correlation networks and Gaussian graphical modelsPairwise (a) standard Pearson product-moment correlations and (b) partial correlationswere estimated by 151 metabolite levels of a cohort study (n=1 020) to receive a cor-relation network (CN) and a Gaussian graphical model (GGM). Colors of nodes referto metabolite classes: yellow: Acyl-carnitines, green: diacyl-phosphatidylcholines, beige:lyso-phosphatidylcholines, light green: acyl-alkyl-phosphatidylcholines, red: sphingomye-lins, orange: amino acids. (a& b) Gaussian graphical models (GGMs) are known to arithme-tically reconstruct biochemical reactions that can be clustered to pathways, while CN oftencontain all of the possible edges ending up to harry balls. Reprinted figure from Krumsieket al. by permission from BMC Systems Biology [118], copyright 2011.
bolites need to be removed for the creation of realistic biochemical pathways (Fi-

1.2 Systems biology models support metabolomics studies 15
gure 1.2(c&d)). This goal is achieved by partial correlations that consist of Pearsoncorrelation coefficients conditioned against the correlation with all remaining metabo-lites. The conditioning leads to an isolation of direct effects by removing linear effectsof all other metabolites on the tested variables (removal of indirect associations). Theunion of all significant pairwise partial correlations results in an undirected Gaussiangraphical model (GGM) that is much sparser than CNs (Figure 1.2(b)). It has beenshown that this hypothesis-free approach is able to robustly reconstruct biochemicalreactions and pathways by only using metabolite levels of a cross-sectional cohortstudy. Further data, previous knowledge, or assumptions are not necessary. As sec-ond advantage, GGMs incorporate metabolites with an unknown chemical identityand place them into the specific biochemical context. [118]Metabolomics with respect to systems biology concepts applies methods including
network inference, network analysis, enrichment analysis, pathway analysis, flux ana-lysis, metabolic modeling, or kinetics [112]. In general, correlations or relations donot necessarily imply causality (correlation is necessary bot not a sufficient condi-tion to identify causal relations). Some approaches incorporate any information ofdifferent biochemical organizational levels hypothesis-free, but e.g. flux analyses re-quire assumptions indicating the direction of relations, or causal links are manuallymodeled using knowledge of underlying real molecular mechanisms. [82, 119]
1.2.3 Opportunities in systems medicine
Most human diseases come along with changes in the metabolome. It is often assumedthat diseases causally lead to perturbations in metabolic processes, but the oppositedirection, or no causal relationships would also be possible. Patterns that can beidentified in plasma or urine samples show a mixture of these (potentially causal)links. Furthermore, there are genetic and environmental factors that have causaleffects on the living organism. [82]In traditional medicine, most approaches for diagnoses, prognoses, and treatment
of diseases have been established by correlations between clinical parameters andpatho-phenotypes (reductionist approach). Although this process has been success-fully applied to numerous diseases and is accepted by classical medicine, it struggleswith the identification of disease-relevant functional relations in complex systems.Future medicine will cope with this challenge and includes systems medicine, preci-sion medicine, network medicine, and personalized medicine that are described in thefollowing. In general, future medicine incorporates diagnoses of established common

16 1 Introduction
or rare diseases, defining disease predilection, developing (individualized) treatmentstrategies of disease causes and explore comorbidities. [120]While rare diseases are typically caused by a mono genetic defect that leads to a
(severe) (patho-)phenotype (and may express itself in several symptoms), commondiseases (diabetes, obesity, asthma, etc.) are the result of perturbations of the wholecomplex of intra- and intercellular processes [107]. Challenges, but also strengths ofsystems medicine are handling large amounts of heterogeneous data (big data) andidentification of causal biomarkers or drug targets. Especially the transfer of insightsfrom systems biology models to clinical cases is error-prone, because impacts of diets,lifestyle or further factors have frequently not been observed completely [95].Network medicine systematically integrates genetic, genomic, biochemical, cellular,
physiological, and clinical data into networks (disease networks, phenotypic networks)to model disease expression and underlying processes. Besides the classical observa-tion of late stage diseases, systems medicine explores pre-phenotypes enabling earlytreatments to stop the development or manifestation of diseases [120]. Systems bi-ology models enable hypothesis-free approaches for receiving unbiased insights intomolecular relations. Disease genes that often interact with each other can usuallybe located in the network periphery (otherwise perturbations would not be compati-ble with life). These disease modules help to identify disease pathways and tend toappear comorbidity [107, 121].The diseaseome consists of a systematic collection of overlapping disease modules
that have a common genetic basis, share metabolic pathways, or often occur simul-taneously (comorbidity) [122]. The opposite is also true: diseases that are locatedin separated modules are usually phenotypically distinct. Metabolomes play a ma-jor role in systems medicine, because metabolic levels directly relate to the currentbiological status of an organism (in contrast to the genome that is relatively stableover life time). Time-dependent changes and effects of drugs or environment can besystematically studied [119].Classical epidemiological cohort studies are focused on public health by exploration
of MWAS, risk biomarkers, or hypothesis testing. Precision medicine and persona-lized medicine target functional biomarkers for stratification and for prognosis ofdisease development. In future, individualized drug therapies, life style, nutrition,or environmental exposure will be recommended according to the individual status.Most promising drugs and their dosage will be individually selected to maximizethe therapeutic impact and to minimize side effects. Those analyses use insights of

1.3 Approaching structurally uncharacterized metabolites 17
systems medicine and add individual profiling of the metabolome and clinical para-meters. [95, 119, 123]
1.3 Approaching structurally uncharacterized metabolitesMetabolomics has established as an important discipline in research of health anddiseases, whose scientific outcome of experiments strongly depends on the quality ofmeasured metabolites. Non-targeted metabolomics based on LC-MS has emerged asan established technology to simultaneously measure the levels of a wide range of lowweight molecules in biofluids and tissues [68]. While this hypothesis-free approachallows to explore unexpected relations, large fractions of quantified metabolites arestructurally unknown [124, 125]. Even targeted metabolomics includes measurementof (in part) poorly characterized metabolites. Consequently, scientific results contai-ning these metabolites can hardly be set into biochemical contexts and their usagefor clinical applications is very limited.
1.3.1 Uncharacterized metabolites in scientific results
For enabling reliable biochemical interpretations to discover new biochemical relation-ships based on scientific results containing unknown or ambiguously characterizedmetabolites, precise annotations of these compounds are critical. The metaboliteidentification task group of the Metabolomics Society Inc. is in line with this as-sessment and accentuated the community consensus that identification of measuredunknown metabolites in large scales is one of the most important challenges in cur-rent metabolomics research. There are four levels of confidence, describing the rangebetween unknown compounds that are reproducibly detected and quantified but notfurther annotated (level 4) to identified metabolites (level 1, verified by measurementsof pure substances). In addition to level 4-compounds, putatively characterized com-pounds (label 3) come along with spectral or chemical/ physical properties that areconsistent with other metabolites of a certain class of compounds. Putatively an-notated compounds (level 2) need to fulfil the criteria of level 3-compounds andmoreover, spectral similarities to respective spectra of public or commercial librariesneed to be demonstrated. Increasing the amount of well annotated metabolites (lowlevel number) is aimed to maximize the usability of quantified metabolites. [126–128]Indeed, some metabolites in targeted as well as in non-targeted metabolomics are
characterized, but their labels indicate an ambiguous structural annotation. Sets

18 1 Introduction
of molecules instead of single compounds are measured, if the applied analyticalmethod cannot separate compounds that share equal chemical or physical properties(e.g. hexoses, steroids, or complex lipids). As a consequence, metabolite labels ex-press specific precision levels: phosphatidylcholines (PCs) that are among the majorconstituents of cell membranes [129, 130], important compounds of lipoproteins [131],and crucial in the energy metabolism, consist of a polar head group with phospho-choline and a nonpolar part with two fatty acid chains (with different lengths anddesaturation) connected to a glycerol [132–134]. PCs are frequently measured dur-ing MRM scans by selecting the total m/z (Q1) and the head group (Q3). As aconsequence, the total length of both fatty chains and number of double bonds is de-termined, but their division and configuration at the sn-1 and sn-2 positions remaincovered (lipid species level, cf. Figure 3.1). Furthermore, PC and isobaric PC-O, inwhich one fatty acid chain is longer by one and attached by an alkyl bond, are notanalytically separated. However, slight changes in the chemical structure of PCs im-ply large functional differences, such as the biochemical usage, the membrane fluidity,or associations to diseases [135–137]. Therefore, meaningful biochemical interpreta-tions need to be as close as possible to the chemical structure of lipids. That iscurrently only possible under assumptions or concrete expectations concerning theirconstituents [138–141]. Today, the availability of modern high-throughput lipidomicsplatforms allows quantification of numerous lipids in thousands of blood samples ofepidemiological cohorts. In particular, the MS-based targeted quantification of meta-bolites, such as PCs, lysophosphatidylcholines (lysoPCs), or sphingomyelins (SMs) ofthe lipid species level, using AbsoluteIDQTM has produced large data sets. In variouslarge-scale mGWAS and MWAS, multiple of these PC measures have been reportedto associate with common genetic variants and various diseases such as Alzheimer’sdisease [142, 143], Type 2 Diabetes [141], coronary artery disease [144], or gastric can-cer [145]. The gap between the lipid species level and the specific chemical structureneeds to be reduced to use results based on these measured metabolites reasonably.
1.3.2 Current metabolite annotation approaches
Singular unknown or ambiguously characterized metabolites are successfully annota-ted by traditional methods in wet laboratories. However, these approaches are veryexpensive and time-consuming, because they are limited to individual compounds,require numerous measurements, and findings concerning one compound cannot betransferred to the identification of other molecules. To enable metabolite annotations

1.3 Approaching structurally uncharacterized metabolites 19
at large scales, research on in silico approaches was started a few years ago and hasnowadays emerged to a hot topic in metabolomics [146].Most in silico approaches for identification of unknown metabolites primarily fo-
cus on fragmentation spectra and only require measurement of one single sample.The previous methods compare complete measured fragmentation spectra to targetspectra of public databases for selection of candidate molecules [83–85]. To bridgevarying availability and comparability of fragmentation spectra, MetAssign [86] clus-ters m/z and intensity of all peaks of measured and target spectra separately andranks possible candidates. Further approaches use in silico fragmentation of data-base structures to become independent from spectral databases: As an example, CFM(competitive fragmentation modeling) [87] uses a Markov-process to subsequently pre-dict fragmentation events (fragmentation tree) including resulting fragments for che-mical structures, or ranks possible structures of public databases based on measuredMS/MS spectra. MetFrag [88] applies in silico fragmentation to database structuresand calculates their expected RTs to substantiate candidates for unknown metaboli-tes. The compMS2Miner [89] benefits from combining several approaches includingin silico reconstruction of fragmentation, noise filtration, substructure annotation bysimilar fragmentation and database spectra, functional group detection, and near-est neighbor chemical similarity scoring. A further class of approaches that workindependent from spectral databases predict molecular fingerprints (e.g. PubChemfingerprint) based on fragmentation spectra of unknown metabolites (in part sup-ported by fragmentation trees) and query structure databases for compounds withsimilar fingerprints (in which similarity is estimated by the Tanimoto coefficient):FingerID [90], CSI:FingerID [91, 92], and SIMPLE [93]. While metabolite charac-terization approaches, described above, focus on structural similarity of unknownmetabolites (determined from fragmentation spectra) to database compounds, Met-MapR is a graph-based tool that estimates similarity based on fragmentation spectraand database information, such as enzymatic transformations or metabolite structu-ral similarity [94].
1.3.3 Objective
In this work, I provide two automated in silico approaches for (i) clarification ofambiguously measured metabolites (esp. PCs) by a systematic platform comparisonof targeted MS and for (ii) an automated annotation of unknown metabolites thathave been measured by non-targeted metabolomics including selection of specific

20 1 Introduction
candidate molecules by a systems biology model. Unlike existing approaches, bothconcepts are independent from fragmentation spectra (since spectra are frequently notavailable if commercial measuring kits or platforms are used), highly automated, andintegrate primary data of measurements within cohort studies (e.g. concentrations orion counts, mass-to-charge ratios, and RIs) or database information.In the first part of this work, I characterize the composition of 76 PC-sums (lipid
species level) measured by AbsoluteIDQTM in 223 human plasma samples of healthysubjects by a platform comparison to 109 PCs (fatty acid (acyl/alkyl) level) mea-sured on the LipidyzerTM 3 platform (Chapter 3). Measurements on the fatty acidlevel include determination of the lengths and desaturation of both fatty acids byMRM scans that select the total m/z (Q1) and one of both fatty acid chain (Q3).Their ordering (sn-1 or sn-2), position of double bonds or stereo-chemistry is notdetected. An automated procedure estimates respective fractions of constituentsand tested their variation during a replication in samples of a second independentcohort. Described quantities of constituents of PC-sums enable advanced interpre-tations of large amounts of scientific results that are based on measurements on thelipid species level and furthermore allow imputing concentrations receiving PC con-centrations measured on the fatty acid level. Although the fatty acid level is far frommolecular structures, imputation enables advanced interpretations of scientific resultsby clearly reducing the number of possible constituents.The second part of this work targets metabolites, whose structures are completely
unknown. Six years ago, Krumsiek et al. combined partial correlations betweenpairwise metabolites (GGM) and metabolite-gene associations (mGWAS) facilitatingmanual annotations of unknown metabolites [147]. In this work, I considerably exten-ded and transferred this idea to fully automated easy to use workflows (Figure 1.3).Comprehensive data integration of GGM, mGWAS, and reactions and metabolite-gene relations of public databases (such as Recon [110]) provides a flexible data basis(network model) for following automated analyses (Chapter 4.2). I predict reactionsconnecting known and unknown metabolites based on measured mass-to-charge ratiosas previously proposed by Breitling et al. [148] and predict pathways to identify thebiochemical contexts of unknown metabolites (Chapter 4.3). In the end, I introducean approach for automated selection of selected candidate molecules for unknownmetabolites based on structural similarities to database compounds (Chapter 4.5)
3 AB SciexTM Pte. Ltd., Framingham, USA and MetabolonTM Inc., Durham, NC, USA

1.3 Approaching structurally uncharacterized metabolites 21
Algorithm
► Data integration
► Network modeling► Analysis and prediction
Metabolite levelsof cohort studies
Database Information(reactions, metabolite-gene relations)
Published GGMs(optionally)
Published mGWASs(optionally)
Prediction of pathways(two level ontology)
Prediction of reactions(known-unknown)
Annotation ofnetwork relationships
Selection of specific candidates
Further filtering and manual interpretation
Experimental verification of candidates
in wet laboratory
Input Modeling & analyses Output Postprocessing
Figure 1.3: Process for characterization of unknown metabolitesThe automated process starts with modules for input of data, performs modeling andanalyses, and finishes with several outputs. Adaption of data to the input-interfaces andpostprocessing are the only steps of this concept that consist of manual work.
and generate easily readable summaries of any information collected per unknownmetabolite. Moreover, ideas for storage of predicted and verified information aboutunknown metabolites are proposed (Chapter 4.7). The automation of data integra-tion and standardized analyses are the basis and key part of this work. Manual stepsare systematically reduced to a minimum and basically consist of adaption of newinput data to the provided interfaces and consistency checks of the output. Theseworkflows are publicly available and include standardized interfaces enabling integra-tion of different types of data. To demonstrate the applicability of the introducedworkflow for metabolite identification, I applied my approach to a non-targeted meta-bolomics data set (439 known, 319 unknown metabolites) measured in blood samplesof 2 279 subjects that were analyzed in the course of the project SUMMIT using acommercial LC-MS-based metabolomics platform (MetabolonTM). To enable an au-tomated selection of specific candidate molecules, I applied my approach to 1 456 me-tabolites (796 known, 660 unknown) of a second data set that has been measuredby a non-targeted high-resolution LC-MS platform in 1 209 samples of the GCKDcohort. For a selected group of predicted metabolites, for which the pure compoundswere commercially available, I tested candidate molecules experimentally.The focus of both concepts is on the provision of tools and concepts to facilitate the
further usage of scientific results containing unknown or ambiguously characterizedmetabolites by automated procedures. Even if the approaches cannot lead to iden-tification of all unknown metabolites, it provides annotations (predicted pathways,

22 1 Introduction
network relations, potential reactions) helping to set compounds into their biochem-ical context.I used the contents Chapter 3 including materials and methods, results, and con-
clusions to prepare a manuscript that I will submit to the Journal of Lipid Researchconcurrently; Quell et al. [149]. Large parts of Chapter 4 and respective materials andmethods are based on and significantly extend (e.g. through replication, automatedcandidate selection, and database organization concepts) my paper published in theJournal of Chromatography B; Quell et al. 2017 [150]. The references are specifiedexplicitly in the beginning of respective chapters. Both main Chapters 3 and 4 consistof independent results and discussions, but share common materials and methods inChapter 2. In addition, a common discussion of both main chapters is provided inthe summary (Chapter 5). In this thesis external references within the text refer toone or few sentences and citations at the end of a paragraph refer to the contents ofthe respective paragraph.

CHAPTER 2Materials and methods
This chapter introduces cohorts, measuring devices and procedures, and describesworkflows for (i) characterization of phosphatidylcholine (PC) compositions that havebeen measured as lipid sums and for (ii) annotation of unknown metabolites measuredby non-targeted MS devices. In general, analyses were performed, and related plotswere generated by R project version 3.4.0 [151].
2.1 Characterization of PC compositionsPCs measured on the lipid species level consist of several PCs of the fatty acid level.We used samples from a cohort study that have been measured on two platformscovering both precision levels. First, we systematically collected all possible constitu-ents per PC-sum and in a second step, we estimated quantitative compositions. Forreplication, we tested the variation of resulting compositions within an independentcohort and across samples. With most contents of this section I also prepared amanuscript for concurrent submission; Quell et al. [149].
2.1.1 Human plasma samples of a controlled cohort
Plasma samples were collected in the HuMet study [25]. The cohort consists of15 healthy male subjects that have been selected based on following criteria: youngage (22 – 33y), no medication, and no abnormalities in standard clinical parameters.Participants were submitted to a series of different challenges over four days: ex-tended (36h) fasting (FASTING) ingesting only 2.7 liters of mineral water, standardliquid mixed meal (standard liquid diet (SLD)) receiving a fiber-free formula drinksupplying one third of their individual recommended daily energy, oral glucose tole-
23

24 2 Materials and methods
rance test (OGTT) ingesting a commercial solution of 75 g glucose, physical exercise(physical activity test (PAT)) exercising 30 min on a bicycle ergometer at their per-sonal anaerobic power level, oral lipid tolerance test (OLTT) ingesting SLD plus amixture of 35 g lipids per square meter body surface area and stress test (STRESS)immersing one hand in ice water for a maximum of three minutes. Blood plasmasamples were drawn at 56 different time points before, during and after challenges.Plasma metabolite levels from both metabolomics platforms were available for the
samples of four subjects (subject 5 – subject 8) except one time point for subject 7leading to a total number of 223 samples.The Qatar Metabolomics Study on Diabetes (QMDiab), in which we sought re-
plication of our results, consists of 196 diabetic and 202 non-diabetic subjects agedbetween 17 and 82 years. Metabolite levels of 305 non-fasting blood plasma sam-ples (152 male, 153 female) measured on the same two metabolomics platforms wereavailable [152].
2.1.2 PC quantification on the lipid species level (AbsoluteIDQTM)
For quantifying lipid sums, HuMet and QMDiab plasma samples were analyzed usingthe AbsoluteIDQTM p150 kit (BiocratesTM Life Sciences AG, Innsbruck, Austria).Besides PCs (including lysoPCs) and SMs, carnitines, amino acids, and hexoses arequantified by this targeted metabolomics approach. The corresponding analyticalprocedures have been described in detail before [25, 78]. In brief, 10 µl of humanplasma were pipetted onto filter inserts (containing internal standards) in a 96 wellplate. The filters were tried under a nitrogen stream, amino acids were derivatized byaddition of a phenylisothiocyanate reagent (5%), and samples were dried again. Afterextraction with 5 mM ammonium acetate in methanol, the solution was centrifugedthrough a filter membrane and diluted with running solvent. Metabolites were de-tected by direct infusion to a 4000 QTRAP system (SciexTM, Darmstadt, Germany)equipped with a Shimadzu Prominence LC20AD pump and SIL-20AC auto sampler.76 PC, 14 lysoPC, and 15 SM species were measured in positive MRM scan mode se-lective for the common fragment ion of the PC head group (m/z= 184). The isobaricmetabolites (within the mass resolution of the MS device) PC x : y and PC O-x+1 : ycannot be distinguished by this technique. Since odd chain lengths are consideredrare for free fatty acids, measured PCs are principally labeled under the assump-tion of an even number of carbon atoms in the fatty acid chains, i.e., PC aa Cx : y(for PC x : y) is chosen as label in case of even x and PC ae Cx+1 : y (corresponding

2.1 Characterization of PC compositions 25
to PC O-x + 1 : y) in case of odd x. In total, four internal standards were usedfor quantification of the phospholipid species (each one for lysoPC, SM, short chainPC, and long chain PC). Concentrations are calculated by the AbsoluteIDQTM kitsoftware and reported in µmol/L. During QC, metabolites with a coefficient of vari-ation (CV) above 25% and metabolites that showed a significant correlation to therun day and had a CV above 20% were excluded, preserving 68 and 72 PC, 8 and10 lysoPC, and 13 and 14 SM species of HuMet and QMDiab for further analyses.
2.1.3 PC quantification on the fatty acid level (LipidyzerTM)
For quantifying lipids on the fatty acid level, plasma samples were analyzed on theLipidyzerTM platform of AB SciexTM Pte. Ltd., Framingham, USA, and MetabolonTM
Inc., Durham, NC, USA. The method allows quantification of over 1 100 lipid speciesfrom 14 lipid subclasses, including 18 lysoPCs, 109 PCs and 12 SMs [153–156]. Li-pids were extracted from samples using dichloromethane and methanol in a modifiedBligh-Dyer extraction in the presence of internal standards with the lower, organicphase being used for analysis [157]. The extracts were concentrated under nitrogenand reconstituted in 0.25 mL of dichloromethane:methanol (50:50) containing 10 mMammonium acetate. The extracts were placed in vials for infusion-MS analyses, per-formed on a SciexTM 5500 QTRAP equipped with the SelexIONTM differential ionmobility spectrometry (DMS) technology [158, 159]. This additional device addedto the ESI source (applied in positive and negative mode) allows scanning or filter-ing molecules for their ion mobility in alternating high and low electric fields beforeentering the mass spectrometer. With this technology a separation of lipid classes(in PCs, lysoPCs, SMs, etc.), independent of their mass-to-charge ratio (m/z) isachieved. DMS-MS conditions were optimized for lipid classes. PCs are detectedin negative MRM mode, with characteristic mass fragments for the fatty acid sidechains, thus allowing a resolution of the fatty acid composition. Individual lipidspecies were quantified based on the ratio of signal intensity for target compoundsto the signal intensity for an assigned internal standard of known concentration. Forquantification of PCs, 10 labeled compounds with a C16:0 fatty acid side chain inthe sn-1 position and side chains in the range of C16:1 –C22:6 in the sn-2 positionwere used as internal standards [154, 160, 161].

26 2 Materials and methods
2.1.4 Qualitative description of PC sums
For assigning PCs measured by LipidyzerTM to AbsoluteIDQTM PC-sums PC x : y(annotated with PC aa Cx : y and PC ae Cx : y in the kit), we first collected alltheoretically possible lipid isobars of PC x : y of the fatty acid level. To this end, wesystematically distributed the total numbers of carbon atoms x and double bonds yto the two fatty acid chains, using the short hand notation PC x1 : y1_x2 : y2 withx = x1 + x2 and y = y1 + y2 to indicate that we do not distinguish between the sn-1and sn-2 positions of the side chains [162]. Additionally, the isobaric compoundsPC x+ 1 : y+ 7, PC O-x+ 1 : y and PC O-x+ 2 : y+ 7 were considered for PC x : y.Notably, we also included PCs containing odd chain fatty acids or fatty acids withvery high desaturation to generate a comprehensive list of isobaric PCs. The softwarecoming with the AbsoluteIDQTM kit, corrects concentrations of PC-sums for theconcentration of the (within the mass resolution) isobaric SMs [13C1]SM x+4 : y, if thecorresponding SM has been quantified. If the corresponding SM was not quantified bythe kit, i.e., no isotope correction has been performed, we included [13C1]SM x+4 : yin the list of possible lipid species measured under the PC x : y sum.
2.1.5 Quantitative estimation of PC compositions
Both platforms report concentrations of lipid measures in µmol/L. Therefore, to de-termine the fraction of a PC of the fatty acid level (measured on the LipidyzerTM
platform) within a PC-sum (obtained by the AbsoluteIDQTM kit), factors f , we di-vided the concentration of the PC j (LipidyzerTM) by the sum measure that includesthis PC, PC i (AbsoluteIDQTM), according to our qualitative assignment (Equa-tion 2.1).
fij =∑s∈Subjects
∑t∈Timepoints qijst
| Subjects | + | Timepoints | (a)
with qijst = conc.(PCj:fatty acid levelst)
conc.(PCi:lipid species levelst) (b)
Equation 2.1: Factors f describing quantitative compositions of PCsFactors fij describe the mean value of quotients qijst of all subjects and time points.Underlying quotients qijst estimate the quotient of a PC j measured on the fatty acidlevel and the respective PC i measured on the lipid species level for a specific subject sand time point t.

2.1 Characterization of PC compositions 27
The variation of factors fij was specified as 5% and 95% confidence interval, in whichthe 5% interval contains the lowest 5% and the 95% interval the largest 5% of theratio values qijst. Additionally, we determined fractions of isobaric PCs of the fattyacid level with no regard to the respective PC of the lipid species level or non-measured constituents (R): e.g. PC 16:0_20:2 / (PC 16:0_20:2 + PC 18:0_18:2 +PC 18:1_18:1).
2.1.6 Replication of estimated quantitative PC compositions
Factors fij (estimating the ratio of PCs measured on the fatty acid level (j) andthe respective PC measured on the lipid species level (i): PCi:lipid species level · fij =PCj:fatty acid level) were replicated with metabolite levels of the subset of 31 male con-trols aged between 17 and 40 years of the independent QMDiab cohort (to receivesubjects with comparable properties to participants of the HuMet cohort). Afterrunning the cross-platform comparison of the selected QMDiab samples (as describedabove), a Kruskal-Wallis test (function ‘kruskal.test’ of R package ‘stats’ version3.4.0 [151]) tested, if the distributions of quotients q (factors f correspond to themean value of quotients q across all subjects and time points, cf. Equation 2.1) ofHuMet- or QMDiab-sujects are significantly different (significance level α=0.01). Ifdistributions of quotients q of the main compound (i.e., the constituent with the lar-gest f) of a composition are not significantly different, the composition was labeledas replicated.
2.1.7 Imputation of measured PC levels
As complementary analysis, we used factors f determined in HuMet and PCs (lipidspecies level) of male controls aged ≤ 40y of QMDiab to impute PCs of the fatty acidlevel: PCi:lipid species level (QMDiab) · fij(HuMet) = PCj:fatty acid level (Imputed). A Kruskal-Wallis test (function ‘kruskal.test’ of R package ‘stats’ version 3.4.0 [151]) showedwhether distributions of observed and imputed concentrations of PCs (fatty acid level)in QMDiab are significantly different (α=0.01). Imputation of PC compositions waslabeled as successful, if the distributions of concentrations of their main constituentswere not significantly different.

28 2 Materials and methods
2.1.8 Testing variation of compositions across subjects and challenges
The variation of estimated factors fij was tested for each PC j measured on the fattyacid level and the respective PC-sum i (lipid species level) across subjects and duringchallenges.For each subject s in HuMet, a Shapiro-Wilk test (function ‘shapiro.test’ of R
package ‘stats’ version 3.4.0 [151]) was applied to check, if qijst is normally distri-buted within 56 time points t. For normally distributed ratios, an analysis of vari-ance (ANOVA) (function ‘aov’ of R package ‘stats’ version 3.4.0 [151]), otherwise aKruskal-Wallis test (function ‘kruskal.test’ of R package ‘stats’ version 3.4.0 [151])was performed to test if quotients q originate from the same distribution. If the nullhypothesis with an a-level of 0.01 could not be rejected, distributions were consideredas stable over samples.In addition, cross-platform comparisons were run using three subsets of the QMDiab
cohort: male controls, female controls and cases. A Kruskal-Wallis test was used tocheck, if factors f (distributions of quotients q) between those three groups weresignificantly different.To investigate the stability of factors f during challenges, we used metabolite levels
of the three HuMet challenges with relation to lipid metabolism, namely FASTING,PAT, and OLTT. For each challenge, we considered ‘baseline’ samples denotingsamples drawn before the challenges and ‘intervention’ samples at the time point withlargest changes of the total metabolome compared to baseline: FASTING: baseline at8 am after 12h overnight fasting; intervention at 36h fasting; PAT: baseline at 4 pm(4h after last meal); intervention after 30 min exercise; OLTT: baseline at 8 am after12h overnight fasting; intervention at noon.Central trends of quotients q for baseline and intervention time points were sub-
stantiated by a Wilcoxon signed-rank test (function ‘wilcox.test’ with options ‘twosided’ and ‘paired’ of R package ‘stats’ version 3.4.0 [151]), since both time pointsconsist of a maximum of four samples. Even in case of large differences betweendistributions of quotients q of baseline and intervention, the null hypothesis was notrejected at an a-level of 0.05.
2.1.9 Estimation of unmapped constituents of PC sums
To estimate to what extent the PC-sum measure is explained by all measured PCspecies of the fatty acid level, we applied linear models and Bland-Altman analyses.

2.2 Annotation of metabolites measured by non-targeted metabolomics 29
The formulas for linear models were constructed by
PClipid species level ∼ b ·∑
PCfatty acid level
and evaluated by the ‘lm’ function of the R package ‘stats’, version 3.4.0 [151].Thereby, PCs of the fatty acid level were weighted equally within one formula. In theBland-Altman plots, the difference of PC-sums (lipid species level) and cumulatedrespective PCs of the fatty acid level
conc. (PClipid species level)−∑
conc. (PCfatty acid level)
were opposed to the mean of concentrations
[conc. (PClipid species level) +
∑conc. (PCfatty acid level)
]/2
of both platforms.
2.2 Annotation of metabolites measured by non-targetedmetabolomics
Non-targeted MS techniques incorporate measurements of metabolites, whose che-mical structures are unknown. Besides identification of the molecular structure ofan unknown metabolite, annotation of these metabolites includes for instance clas-sification into biochemical pathways and determination of substrates or products ofrelated enzymatic reations to elucidate their biochemical function. The modules ofour automated approach characterize these unknown metabolites by estimation ofGGMs, integration of generated and public data, pathway and reaction prediction,and automated selection of specific candidate molecules. Figure 1.3 and Figure B.1show an overview of the complete workflow. We demonstrated the applicability of ourmethod on metabolomics data that was produced by a non-targeted LC-MS analysisin the course of the SUMMIT project and on further data of cohort studies includingKORA F4, TwinsUK, or GCKD. Implementations of all modules in R are providedin Supplemental File B.1 along with the data on which the here presented analysesare based. Candidate molecules that our method predicted for selected unknown me-tabolites were confirmed (or excluded) by an experimental validation. I previouslypublished (parts of) materials and methods described in Sections 2.2.1 to 2.2.6, 2.2.8,

30 2 Materials and methods
and 2.2.10 in Quell et al. 2017 [150].
2.2.1 Study cohorts
Serum samples of n=2 279 patients with type 2 diabetes from seven population stu-dies, FINRISK1997 (n=242), FINRISK2002 (n=92), FINRISK2007 (n=28) [19],Go-DARTS (n=1 200) [20], IMPROVE (n=44) [21], 60 years-olds (n=20) [22], andSDR (n=653) [23], all participating in the SUMMIT project, were analyzed using thecommonly used (established) non-targeted metabolomics platform of MetabolonTM
Inc. (Durham, USA). 1 147 of the type 2 diabetes patients were also diagnosed withcardiovascular disease, while 1 132 did not suffer from cardiovascular disease. Be-sides the type 2 diabetes and cardiovascular disease state, patients provided furtherclinical information such as age, sex, duration of type 2 diabetes, height, BMI, trigly-ceride, HDL, LDL, DBP, SBP, smoking status, hemoglobin A1c, baseline estimatedglomerular filtration rate, insulin status, and medication information including ACEinhibitors, angiotensin receptor blockers, calcium channel blockers, diuretics, lipid rx,blood pressure lowering drugs, beta blockers, alpha blockers, and aspirin.As second data set, we used metabolite levels measured on the new high-resolution
non-targeted LC-MS platform of MetabolonTM in 1 209 samples of the GCKD studyto demonstrate our module for automated selection of candidate molecules. In to-tal, the GCKD cohort consists of about 5 000 patients (aged 17 – 74y) with chronickidney disease of various aetiologies. Patients are under nephrological care and theirpathogeny will be followed during a 10-year period, in which matrix samples (bloodserum, plasma, urine) are collected at regular intervals. Besides matrix samples, pa-tients provide information concerning their demography, anthropometric data, renaland cardiovascular history, renal biopsy history, comorbidities, medication, life style,family history, heart failure, angina pectoris/dyspnoea, and intermittent claudica-tion. [18]
2.2.2 Metabolomics measurements
The non-targeted metabolomics platform comprises LC-MS (in positive and nega-tive mode) as well as MS coupled to GC and has been described in detail previ-ously [163, 164]. Briefly, samples were thawed on ice and extracted with methanolcontaining internal standards to control extraction efficiency. Extracts were split intoaliquots for positive and negative LC-MS and GC-MS mode and dried under nitro-

2.2 Annotation of metabolites measured by non-targeted metabolomics 31
gen. LC-MS analyses were performed on an LTQ XL mass spectrometer (ThermoFisher Scientific Inc., Waltham, MA, USA) coupled to a Waters Acquity UPLC sys-tem (Waters Corporation, Milford, MA, USA). For LC-MS positive (negative) ionanalysis 0.1% formic acid (6.5 mM ammonium bicarbonate [pH 8.0]) in water wasused as solvent A and 0.1% formic acid in methanol (6.5 mM ammonium bicarbo-nate in 95% methanol) as solvent B. After sample reconstitution with solvent A andinjection, the column (2.1 mm × 100 mm Waters BEH C18, 1.7 µm particle-size)was developed with a gradient of 99.5% solvent A to 98% solvent B. The flow ratewas set to 350 µL/min for a run time of 11 minutes each. The eluent was directlyconnected to the ESI source of the mass spectrometer. Full MS scans were recordedfrom 80 to 1 000 m/z, alternating with data dependent MS/MS fragmentation scanswith dynamic exclusion. GC-MS analyses were performed on a Finnigan Trace DSQsingle quadrupole mass spectrometer (Thermo Fisher Scientific Inc., Waltham, MA,USA) containing a GC column (20 m × 0.18 mm, 1.8 µm film phase consisting of5% phenyldimethyl silicone). The GC was performed during a temperature gradientfrom 60 to 340°C with helium as carrier gas. MS scans with electron impact ioniza-tion (70 eV) and a 50 to 750 m/z scan range were used. The metabolite identificationhas been semi-automated performed by MetabolonTM Inc. using a reference spectralibrary. Further details for the LC-MS part are also given below the description ofthe experimental validation of the selected candidates. [163, 164]The non-targeted high-resolution platform of MetabolonTM performs LC-MS mea-
surements (in positive and negative mode) with a mass resolution of 5 ppm. Inaddition to the procedure described above, chemical separation was performed on ahydrophilic interaction liquid chromatography (HILIC) system 2.1 mm × 150 mmWaters BEH Amide 1.7 µm (at a temperature of 40°C). The column was developedwith a gradient from 95% solvent A (10 mM ammonium formate in 15% water,5% methanol, and 80% acetonitrile [pH 10.16]) to 95% solvent B (10 mM ammo-nium formate in 50% water, 50% acetonitrile [pH 10.60]) within 5.5 min. and back to95% solvent A until min. 11. The flow rate was set to 500 µL/min. Up to nine fullMS scans per second (repeated sequences of MS and MS/MS scans) were recordedfrom 80 to 1 000 m/z on a Q-Exactive (orbitrap) mass spectrometer (Thermo FisherScientific Inc.). [165, 166].In total, the levels of 758 metabolites were determined for the 2 279 subjects in our
cohorts. For 319 of the metabolites the chemical identity was not known at time ofanalysis. The 439 known metabolites are assigned to a simplified two-level metabolite

32 2 Materials and methods
ontology, consisting of 8 super pathways and 102 more precise sub pathways, whichis similar to the ontology used by KEGG [38]. In 1 209 samples of a second cohort,1 456 metabolites (796 known, 660 unknown) were quantified by the high-resolutionnon-targeted LC-MS platform of MetabolonTM.
2.2.3 Public data sources and data types
For integrating metabolite-metabolite and metabolite-gene links based on known bio-chemical reactions into our model, we used Recon (Virtual Metabolic Human Data-base) [110], a community driven reconstruction of the human metabolism incorpora-ting reactions between metabolites and functional gene annotations, as a representa-tive among available metabolic databases including KEGG [38] or HumanCyc [115].Furthermore, we used a published GGM based on the population cohort KORA F4(n=1 768) [147], and metabolite-gene associations of a published mGWAS based onKORA F4 and TwinsUK (n=6 056) [167].Our module for automated candidate selection requires access to chemical struc-
tures of public data bases. We used 1 995 Recon-structures [110] and 112 770 HMDB-structures [71], provided as chemical fingerprints or 2D-substructures (cf. Chap-ter 2.2.7).
2.2.4 Data processing and integration
Preprocessing
Metabolite concentrations were normalized by the median per metabolite and runday. Afterwards, metabolite concentrations were Gaussianized, meaning that valuesper metabolite were sorted and transferred to values of a normal distribution [168].
GGM generation
Based on the metabolomics data of the 2 279 subjects of our SUMMIT-cohorts, wecreated a GGM as backbone of our network model, since they are known to re-construct biochemical pathways from measured metabolite levels [118]. First, weexcluded metabolites with more than 20% and samples with more than 10% missingvalues leaving 625 metabolites for GGM generation. To generate a complete datamatrix as required for the following analyses, we utilized the R package ‘mice’ [169]with standard parameters to impute the remaining missing values. ‘mice’ imple-

2.2 Annotation of metabolites measured by non-targeted metabolomics 33
ments algorithms for multivariate imputation by chained equations. The standardmethod ‘pmm’ (predictive mean matching) in the mice-package estimates missingvalues of a variable x by applying regression models incorporating all other vari-ables in the input matrix. A missing value in x is finally imputed as the valuebelonging to one of the 5 cases with observed values in x, for which the valuethat is predicted based on the regression is closest to the predicted value of thecase with missing data on x. To calculate partial correlations between metaboli-tes in the complete data matrix, which form the basis of GGMs, we applied theR package ‘GeneNet’ [170] with the function ‘ggm.estimate.pcor’ and the method‘dynamic’. The function ‘network.test.edges’ extracted 862 significant GGM edgesaccording to the Bonferroni corrected threshold of 0.01. To avoid biases in the net-work model related to covariates that are known or suspected to influence metabolitelevels, in each calculation sex, age, study, and the clinical phenotypes mentionedabove were considered as covariates by including them into the input data matrix for‘ggm.estimate.pcor’.
Data integration
We merged the edges of the newly generated GGM with 398 significant partial corre-lations of the published GGM based on the KORA F4 cohort [147] into one model toend up with 1 040 connections between 637 known and unknown metabolites. Thenwe added 134 metabolite-associated genes of a published mGWAS [167]. Finally, weattached knowledge-based biochemical information extracted from Recon [110] to thenetwork model. To this end, we first added metabolites from Recon if they were func-tionally related to at least one of the 134 genes through a reaction listed in Recon.343 Recon metabolites, of which 37 were mapped to measured metabolites and thuswere already part of the GGM- and mGWAS-based network, showed functional linksto 57 genes, which were added to the network. Secondly, Recon reactions between me-tabolites annotated as ‘baseReactants’ and ‘baseProducts’ in the Recon data file wereattached to the network if at least one of these metabolites could be mapped onto ameasured known metabolite. Following this procedure, we found reactions for 83 mea-sured metabolites and included them into the network. Thereby, 174 metabolites wereadded. In the final step, we complemented the network by incorporating edges be-tween all metabolites in the network that were connected by a Recon reaction. Intotal, the resulting (final) network includes, 1 152 Recon reactions connecting 591 me-tabolites. Please note that by integrating only main metabolites, which are annotated

34 2 Materials and methods
as ‘baseReactants’ and ‘baseProducts’ in Recon, we avoid connecting metabolites viaso-called side metabolites (e.g. cofactors, water) which would lead to biochemicallyincorrect edges in the network. While Recon provides annotation concerning mainand side metabolites making the role of metabolites in a reaction directly accessible,more sophisticated methods (e.g. using chemical similarity between metabolites) areneeded if knowledge on biochemical reactions is extracted from other resources thatdo not include such annotations [171–173]. Please also note that, for our purposes,we ignored the compartment annotations provided with metabolite species in Reconreactions, i.e., each Recon metabolite mapped or added to the GGM- and mGWAS-based network is represented by a single node and two metabolites are connected ifthey are linked through a Recon reaction irrespective of the compartment in whichthe reaction takes place. Reactions that are classified as ‘Transport’ or ‘Exchange’in Recon are omitted when integrating Recon reactions into the network. The dataintegration process is schematically visualized in Figure B.2. The ‘organic’ layout ofthe yEd Graph Editor (yWorks GmbH, Tübingen) was performed to distribute nodesof the visual representations of network models (graphml).
2.2.5 Automated prediction of super and sub pathways
Each known metabolite can be annotated using one of several existing metaboliteontologies (pathway schemes). Estimating the assignment within the ontology forunknown metabolites helps to shrink the list of possible candidate molecules usingthe biochemical context of unknown metabolites. Here, we are using the annotationthat was provided with the metabolomics data, which assigns each metabolite toone of 8 non-overlapping super pathways and a more precise sub pathway. Anyother classification scheme could be applied analogously within our method. While,in general, more fine-grained, and thus more specific pathway definitions can beexpected to allow more precise predictions, they will, at the same time, producemore ambiguous pathway assignments for unknown metabolites, in particular in caseof overlapping pathways where a metabolite can be annotated with various pathways.The idea of our approach is to capture the neighborhood of each known metabolite
and to count the frequencies of their pathways. These frequencies can then be usedto estimate the most probable pathway for each unknown metabolite consideringthe pathways of the known metabolites in its neighborhood (Figure 4.2(b)). Todefine the neighborhood for metabolites, we consider metabolites as neighbors, ifthey are connected by a GGM edge, share a common mGWAS gene, if there is a

2.2 Annotation of metabolites measured by non-targeted metabolomics 35
gene associated to the unknown metabolite and this gene is functionally related to aknown metabolite, or if the unknown metabolite is connected by a GGM edge to aknown metabolite, which is connected through a reaction to a database metabolite(Figure 4.2(a)).Our approach is divided into a training phase based on known metabolites and
a prediction phase, in which the super pathway pi is predicted for each unknownmetabolite i. During the training phase we first determined the a priori probabilitiesPB(p) of each super pathway p ∈ {Amino acid, Carbohydrate, Cofactor and vitamins,Energy, Lipid, Nucleotide, Peptide, Xenobiotics} (Equation 2.2).
PB(p) =∑#neighbors of metabolites with super pathway p
2 ·#neighboring metabolite pairs
Equation 2.2: A priori probability of pathway pThe frequency of pathway p is set into relation to the connectivity (summed node degrees)of metabolites annotated with p in the network model.
For each super pathway p, we calculated the conditional probability PN(pi | pj)based on all known metabolites i with super pathway pi given metabolites j withsuper pathway pj are neighbors of i (Equation 2.3).
PN(pi | pj) = P (pi ∩ pj)PB(pj)
= P (pi and pj are neighbors)background probability of pj
Equation 2.3: Probability of neighboring metabolites having pathways pi and pjThe ratio estimates the conditional probability that metabolites with pathway pi haveneighbors pj .
During the prediction phase we resolve the conditional probability PN(pi | p1∩. . .∩pn)for each super pathway pi of all unknown metabolites i given the pathways p1, . . . ,pn
of n neighboring known metabolites (Equation 2.4). The first transformation followsthe Bayes theorem. For the second transformation we assumed independence of theneighbors 1, . . . ,n. As a consequence of the approximation, a very small value ofone conditional probability results in a very small overall probability for the specificpathway.

36 2 Materials and methods
PN(pi | p1 ∩ . . . ∩ pn)⇔ PN(p1 ∩ . . . ∩ pn | pi) · PB(pi)PB(p1 ∩ . . . ∩ pn)
∼∝ PN(p1 | pi) · . . . · PN(pn | pi) · PB(pi)PB(p1) · . . . · PB(pn)
Equation 2.4: Prediction of pathway pi for metabolite surrounded by p1 to pnThe formula estimates the conditional probability that a metabolite has pathway pi giventhat its neighbors have pathways pi to pn. The probability is estimated for each pathway,keeping the pathway with the largest probability.
For each unknown metabolite i, the predicted super pathway pi with the highestprobability max(PN(pi | p1 ∩ . . . ∩ pn)) is accepted if its probability is at least ztimes higher than the super pathway with the second highest probability. We definedfive classes of confidence and estimated respective values of z empirically based onmultiple 10-fold cross-validations with known metabolites: (a) very high confidence(correct predictions ≥ 97.5% ⇒ z≥ 207.0), (b) high confidence (correct predictions≥ 95% ⇒ z≥ 78.0), (c) medium confidence (correct predictions ≥ 90% ⇒ z≥ 7.1),(d) low confidence (correct predictions ≥ 85%⇒ z≥ 2.7) and (e) very low confidence(correct predictions < 85%⇒ z < 2.7). For metabolites, that are neighbors of furtherunknown metabolites, but not of known metabolites, we used the super pathwaywith the highest a priori probability and assigned the confidence class according tothe criteria above.For each unknown metabolite with a predicted super pathway, we selected the more
specific sub pathway that is most common among neighboring known metabolites. Ifan equal number of neighbors own different sub pathways, we stored each option.We evaluated our approach with a series of 100 10-fold cross-validations using
known metabolites with annotated super and sub pathways.
2.2.6 Automated prediction of reactions connecting metabolites
Knowledge about the reaction connecting a known to an unknown metabolite leadsto the possibility of virtually applying this reaction to the known metabolite to selectcandidate molecules. Here, we focused on the 21 frequently occurring reaction typesthat are shown in Table 4.3. We assumed the presence of a reaction between twometabolites if they were connected directly by a GGM edge or indirectly via a genebased on a mGWAS or via a known reaction according to Recon (Figure 4.2(c)).This assumption is based on the observation that pairs of metabolites that are con-

2.2 Annotation of metabolites measured by non-targeted metabolomics 37
nected by a GGM edge particularly tend to be reactants of a direct reaction [118].Nevertheless, direct edges in the GGM might represent also multi-step-reactions be-tween two metabolites in cases where the intermediate metabolites are not quanti-fied. Following a simplified approach, we then assigned a specific reaction type to aconnected pair of metabolites, if the two metabolites showed an m/z difference indi-cating a difference in molecule mass that is typical for the respective reaction typewith ∆mpair = ∆mexpected ± e [148]. Here, we set e=0.3 to compensate the unitmass resolution of the MS platform, on which the presented data was collected. Weadapted e to 0.01 for our second data set measured on a high-resolution MS platformto yield more specific reaction types.To increase the specificity and to shrink the list of assigned reactions, we additio-
nally filtered the list by differences in RI as a second criterion for the most frequentreaction type, the dehydrogenation reaction. The distribution of differences in RI be-tween all GGM pairs of known metabolites with correctly predicted dehydrogenationreaction (26 true positives) is compared to the respective distribution for wronglypredicted dehydrogenation reaction (8 false positives). Since both distributions donot overlap (Figure B.3), we used the mean difference in RI of the correct predictionsplus/ minus their variances (∆RI≤ 355.9) as threshold.Predicted reactions can be applied to known metabolites to manually select specific
candidate molecules for the connected unknown metabolites that can be verifiedexperimentally.
2.2.7 Comparative annotation of incorporating different platforms
A second data set (GCKD) allowed (i) replication of automated annotations and(ii) assessment of benefits for applying our workflow with merged data sets. Eventhough samples of SUMMIT were measured by the established MetabolonTM plat-form, and samples of GCKD were measured on the new high-resolution platform ofMetabolonTM, a subset of 227 metabolites (168 known, 59 unknown) was mappedand therefore available in both sets.
Merging multiple automated annotations
For comparing automated annotations, we applied our data integration module asdescribed in Chapter 2.2.4. To this end, we filtered levels of 1 382 metabolites and1 209 samples according to a maximum of 20% missing values on the metabolite

38 2 Materials and methods
dimension, and 10% missing values on the metabolite dimension. Levels of remain-ing 986 metabolites (496 known, 490 unknown) were imputed by ‘mice’ (R package‘mice’ [169]) and forwarded to estimation of 1 083 significant pairwise partial corre-lations with age, sex, and BMI as covariates (R package ‘GeneNet’ [170]). The re-sulting GGM and 714 published genome wide significant metabolite-gene associations(pv≤ 1 · 10−6; mGWAS of the GCKD study [174]) were integrated with reactions andfunctional metabolite-gene relations of Recon [110] (cf. Chapter 2.2.4). The modulesfor automated prediction of pathways and reactions were applied on the generatednetwork model as described in Chapters 2.2.5, and 2.2.6.For replication, we considered a subset of 59 unknown metabolites that have been
measured in both sets (samples of SUMMITmeasured on the established MetabolonTM
platform and samples of GCKD measured on the new high-resolution platform ofMetabolonTM), and counted equally predicted super and sub pathways. In case ofsub pathways, comparable predictions (e.g. ‘short chain fatty acid’ and ‘medium chainfatty acid’; ‘androgenic steroids’ and ‘sterol, steroid’; or ‘fatty acid metabolism’ and‘long chain fatty acid’) were labeled as similar. Finally, we recognized different a prioriprobabilities of super pathways among both sets of known metabolites.
Merging data sets for a common automated annotation
In a second step, we searched for benefits resulting from merging both data sets, beforeapplying the automated annotation modules. To this end, we mapped 227 metaboli-tes (168 known, 59 unknown) that were measured in samples of SUMMIT (establishedMetabolonTM platform) and GCKD (new high-resolution platform of MetabolonTM)based on their MetabolonTM-ID, Name, and HMDB-ID. Significant partial corre-lations (GGM) were generated within both sets separately (described previous sec-tions), to prevent biases, and resulting 2 043 GGM edges were subsequently integratedby the automated workflow (cf. Chapter 2.2.4). Furthermore, 978 metabolite-geneassociations of published mGWAS [167, 174] as well as reactions and functional re-lations of Recon were added to the network model. Finally, we applied our modulesfor automated prediction of pathways and reactions to the combined network model‘SUMMIT/GCKD’ (cf. Chapters 2.2.5 and 2.2.6).During this analysis we first compared super and sub pathways of 427 unknown
metabolites that were predicted in at least two of the three sets to test if auto-mated annotations are influenced by changed network models: ‘SUMMIT/GCKD’,SUMMIT, and GCKD (procedure described in the previous section). Special interest

2.2 Annotation of metabolites measured by non-targeted metabolomics 39
was on a subset of 59 unknown metabolites that were measured in both sets. Thesecond focus of this analysis was on 8 unknown metabolites that were automaticallyannotated based on the merged model but could not be annotated based on bothseparate models.
2.2.8 Computer aided manual candidate selection
Automated annotations facilitate the manually selection of specific candidate mo-lecules for unknown metabolites. In case of metabolites measured by the estab-lished MetabolonTM platform, we used our predicted pathways for a first classifica-tion of unknown metabolites. Furthermore, we manually applied predicted reactions(e.g. especially dehydrogenation reactions that passed the ∆RI criterion) to neigh-boring known metabolites by changing their structures (e.g. introduction or removalof a double bound) to receive molecules matching the measured mass of respectiveunknown metabolites. Public data bases (e.g. Recon [110], HMDB [71], ChemSpi-der [73], LipidMaps [175], PubChem [72], or KEGG [38]) were searched to check,whether selected candidates have already been annotated in biochemical contexts.Especially for metabolites measured on the new high-resolution platform of Metabo-
lonTM, we additionally searched HMDB [71] for structures with monoisotopic massescorresponding to the measured mass (m/z ± 0.01, or ± 0.3 for the established Meta-bolonTM platform) and examined the plausibility of the structure in the biochemicalcontext of the network model.
2.2.9 Automated candidate selection procedure
For unknown metabolites that were measured on high mass resolution, we estab-lished an automated candidate selection procedure. This procedure makes use of anincreased structural similarity of neighboring (based on the network model) metabo-lites compared to random pairs. Potential candidate molecules can be selected withinmetabolite-pools of databases such as Recon [110] or HMDB [71].
Integration of chemical structures
Besides the network model described in Chapters 2.2.4 to 2.2.6 this procedure requiresa candidate pool containing metabolites of databases including names, neutral massesand structural information. For 1 995 of 2 625 Recon-compounds, the extensible

40 2 Materials and methods
markup language (XML)-based structure data files (SDFs) including chemical an-notations of molecules were obtained from the PubChem download service [72]. Themetabolite names, their database ID and neutral monoisotopic masses were reador calculated from the SDFs (fields ‘PUBCHEM_IUPAC_NAME ’, ‘PUBCHEM_COMPOUND_CID’, ‘PUBCHEM_MONOISOTOPIC_WEIGHT ’ and ‘PUBCHEM_TOTAL_CHARGE ’) and stored as separate searchable table by our model to builda candidate pool [176].For selection of candidates for unknown metabolites, 112 770 molecules of HMDB
version 4.0 were added to the candidate pool [71]. Information was read from thefields ‘JCHEM_TRADITIONAL_IUPAC ’, ‘HMDB_ID’ and ‘EXACT_MASS ’ foreach compound.
Chemical fingerprints of PubChem compounds
Structural descriptors such as chemical fingerprints and maximum common substruc-tures (MCSs) were used to classify and systematically compare molecules on the basisof common elements. Chemical fingerprints represent typical properties and substruc-tures of metabolites within a standardized format. [177]The PubChem fingerprint consists of a binary 881 bit tuple. Each bit indicates
whether a specific substructure is part of the target molecule (on-bit), or not (off-bit). Some bits contain quantitative information about substructures: While bits0 – 114 refer to single atoms (e.g. ‘>= 4 C ’), bits 115 – 262 incorporate the size, num-ber, and saturation of carbon-, nitrogen-, or heteroatom-containing ring structures(e.g. ‘>= 2 saturated or aromatic carbon-only ring size 3 ’). Bits 263 – 326 test theexistence of simple pairs of bonded atoms with no regard to their count (e.g. ‘C–O’).Bits 327 – 415 and bits 416 – 459 commit nearest neighboring groups of up to fiveatoms without (~) and with regard to their bond order (single (–), double (=), ortriple (#) bond order) (e.g. ‘C(~O)(~O)’ or ‘C(–O)(=O)’). Finally, bits 460 – 712and bits 713 – 880 provide information about simple and complex SMILES arbitrarytarget specification (SMARTS) patterns, respectively, including specific bond orders(e.g. ‘O–C–C=N ’ or ‘Cc1ccc(C)cc1 ’). [176]
Maximum common substructure of chemical structures
Besides structural descriptor based chemical fingerprints, MCSs enable a direct deter-mination of the largest coherent substructure (number of equally connected atoms)that two chemical structures have in common. The function ‘fmcs’ of the R-package

2.2 Annotation of metabolites measured by non-targeted metabolomics 41
‘fmcsR’ (version 1.0) computes the MCS of two molecules (based on SDFs) by itera-tively adding common atoms and bounds of both molecules. Since finding MCSs isNP-complete, a heuristic approach based on search trees solves this task. [178]
Estimation of structural similarity
The similarity of pairwise chemical fingerprints or MCSs is quantified by Tanimotoand overlap coefficients [177–179]. In case of chemical fingerprints, the Tanimotocoefficient describes the fraction of on-bits that both structures have in common(Equation 2.5(a)). The number of common on-bits (c) is divided by the number on-bits of the union of both fingerprints (a+ b− c, in which a and b are the numbers ofon-bits of both fingerprints individually). In case of MCSs, the Tanimoto coefficientis calculated similarly: the size (atom count) of the MCS is divided by the numberof atoms of the union of both structures.As second measure, overlap coefficients quantify the fraction of the smaller struc-
ture that is contained in the larger (super-) structure (Equation 2.5(b)). Since che-mical fingerprints refer to abstract elements, overlap coefficients were only calculatedfor MCSs. The respective atom count was used for the size of structures (a, b) andof the MCS (c).After computation of MCSs, function ‘fmcs’ of the R-package ‘fmcsR’ (version 1.0)
calculates their Tanimoto and overlap coefficients [178]. Tanimoto coefficients of che-mical fingerprints were determined by the function ‘fpSim’ of the R-package ‘Chem-mineR’ (version 2.30.0) [179].
TA,B =∑nj=1 xjA · xjB∑n
j=1 (xjA)2 +∑nj=1 (xjB)2 −∑n
j=1 xjA · xjB?≡ c
a+ b− c(a)
OA,B = c
min (a,b) (b)
Equation 2.5: Tanimoto and overlap coefficientsThe structural similarity of molecules can be quantified by the (a) Tanimoto or (b)overlap coefficient of pairwise MCSs or chemical fingerprints respectively. A,B := theset of on-bits of the fingerprints or the set of atoms of both molecules, x := element ofset A or B, a := |A|, b := |B|, and c := |A ∩ B|. Equivalence(?) applies for dichotomousvariables. Equations adapted from: [177–179]

42 2 Materials and methods
Selection of candidate molecules
Measuring unknown metabolites on a high-resolution platform enables an automa-ted selection of candidate molecules. The procedure consists of three major steps:(i) mass-based preselection, (ii) determination of pairwise similarity, and (iii) filter-ing according to empirically determined cutoffs (Figure 4.6).Complete databases, such as Recon or HMDB were searched for molecules that cor-
respond to the monoisotopic neutral mass of unknown metabolites, with∆mass≤ 0.05.Molecules meeting the mass criterion were preselected and forwarded to the structuralsimilarity check.As second step, the structural similarity was determined for pairs of preselected
candidate molecules and structurally known neighbors of the respective unknownmetabolite. For each candidate, its maximum similarity values were maintained.Missing SDFs were retrieved just-in-time from PubChem by the function ‘getIds’ ofthe R-package ‘ChemmineR’ (version 2.30.0) [179].To obtain final candidates, the set of preselected molecules was filtered according to
cutoffs that were empirically determined during a 10-fold cross-validation. Candidateswere selected, if at least one of their coefficients (fingerprint Tanimoto, MCS Tanimotoor MCS overlap) passes its cutoff criterion.
Cross-validation and optimization of parameters
As proof of principle and for parameter optimization a 10-fold cross-validation wasperformed across known molecules. Initial cutoffs WM were determined for fin-gerprint Tanimoto, MCS Tanimoto, and MCS overlap coefficients by the mean ofeach coefficient-distribution of neighboring versus random pairs of known metaboli-tes weighted by their 25 or 75% quantiles (Equation 2.6, Figure 4.7).
WM = ma + |ma − qa| ·mb −ma
|mb − qb|+ |ma − qa|
with qx =
q[x,25%] ,mx > min (ma,mb)
q[x,75%] , else, and x ∈ {a, b}
Equation 2.6: Weighted mean of distributions of coefficientsThe mean of two coefficient distributions a and b is weighed by the 25 and 75% quantile.mx and qx refer to the mean and respective quantile of distribution a or b.

2.2 Annotation of metabolites measured by non-targeted metabolomics 43
Function ‘createFolds’ of the R-package ‘caret’ version 6.0-78 [180] divided metabo-lites with known chemical structures into one training set and one test set, containing90% and 10% of entries respectively. During each run of the cross-validation initialcutoffs were individually shifted by -0.5 to -5 in steps of 0.5. The final cutoff con-figuration was selected by the mean cutoffs that maximize the performance score,containing weighted sensitivity and specificity (Equation 2.7).
Sensitivity = TP
TP + FNSpecificity = TN
TN + FP(a)
Performance = w · Sensitivity + Specificity
1 + w(b)
Equation 2.7: Statistical measure of performanceFor measuring performance, weight w was set to 2 or 3 to prioritize sensitivity towardsspecificity. TP: true positive, TN: true negative, FP: false positive, FN: false negative.
Prioritizing sensitivity before specificity leads to a larger number of selected candida-tes (positives) and ensures that fewer correct candidates are missed. Indeed, a largernumber of positives induces an increased rate of both, true positives (TPs) and truenegatives (TNs).
2.2.10 Experimental verification of selected candidate molecules
To confirm automatically or manually selected candidate molecules, substances needto pass an experimental measurement (MS, LC-MS, or GC-MS) in a wet-laboratory.Candidate molecules can be substantiated, if candidates and respective unknown me-tabolites are not distinguishable by the suitable MS technique. If measurements ofboth aliquots show differences, candidates may be excluded. We sought experimentalconformation of a selected set of unknown metabolites for which the most frequentlyobserved reaction type, dehydrogenation reactions, were predicted. To verify or fal-sify these candidates of unknown metabolites we purchased all (6) correspondingmolecules that were commercially available as pure substances (Table 2.1).Candidate substances were dissolved in water at a concentration of 1 mg/mL by
ultrasonification and, where appropriate, by addition of several droplets of methanoland diluted with the LC running solvent A to a concentration of 100 ng/mL. Analysesof candidate solutions were performed with LC-MS in negative ionization mode ona LTQ XL mass spectrometer (Thermo Fisher Scientific GmbH, Dreieich, Germany)

44 2 Materials and methods
Candidate molecule Supplier Product number Molar mass9-octadecenedioic acid Anward, Kowloon, Hong Kong ANW-62167 312.23 g/moltrans-2-nonenoic acid Sigma-Aldrich Chemie GmbH,
Steinheim, GermanyS354015 156.12 g/mol
3-nonenoic acid Sigma-Aldrich Chemie GmbH CDS000243 156.12 g/mol8-nonenoic acid Sigma-Aldrich Chemie GmbH 715433 156.12 g/molcis-9-tetradecenoic acid Sigma-Aldrich Chemie GmbH M3525 226.19 g/moltrans-2-dodecenedioic acid VWR International GmbH,
Darmstadt, GermanyCAYM88820 228.14 g/mol
Table 2.1: Candidate molecules for experimental verificationSix commercially available candidate molecules for four unknown metabolites were forwar-ded to the experimental verification. Candidate molecules were selected according to their∆mass and prediction of dehydrogenation reaction (∆m and ∆RI).
coupled to a Waters Acquity UPLC system (Waters GmbH, Eschborn, Germany) atthe Helmholtz Zentrum München. After sample injection the column (2.1 mm × 100mm Waters BEH C18, 1.7 µm particle-size) was developed with a gradient of 99.5%solvent A (6.5 mM ammonium bicarbonate [pH 8.0]) to 98% solvent B (6.5 mMammonium bicarbonate in 95% methanol). The flow rate was set to 350 µL/minfor a run time of 11 minutes. The eluent was directly connected to the electrosprayionization source of the mass spectrometer.For each candidate the pure substance and a spiked mixture with an extracted
reference plasma sample was analyzed. For comparison the reference plasma contai-ning the unknown compounds at natural abundance was measured as well. MS scanswere recorded from 80 to 1000 m/z as well as data dependent MS/MS scans of thecandidate masses.We compared the RT of peaks in the EIC for the three measurements per meta-
bolite. Especially the mixture of the pure substance and reference plasma shouldshow just one peak, because otherwise both compounds could be separated duringthe chromatography and consequently are not identical. Finally, we checked if theMS2 fragment spectra of the pure candidates and of the respective unknown me-tabolite in the matrix sample consisted of the same fragments with equal relativeintensities. Candidates that could not be separated from the respective unknownmetabolite by LC-MS analyses were labeled as verified.

2.2 Annotation of metabolites measured by non-targeted metabolomics 45
2.2.11 Storage of predicted or verified metabolite annotations
Our automated workflow for annotation of unknown metabolites works best withdata sets containing equally sized subsets of measured known and unknown me-tabolites. This is especially the case, if established non-targeted MS platforms(e.g. MetabolonTM) are used for quantification. To enable portability of annota-tions of unknown metabolites that have potentially been measured in several cohorts(and can be easily mapped), these predicted or verified information must be storedin a solid data structure. We designed a conceptual mySQL database consisting oftwo levels: (i) ‘MeasuredMetabolite’ and related tables contain information concer-ning measuring parameters (e.g. RI, mass-to-charge ratio, fragments, tissue, study, orplatform), associations (e.g. GGM, mGWAS, or MWAS), annotations (e.g. predictedpathways, reactions, chemical formulas, or candidates), or identification (e.g. chemi-cal structure and identification level) of (unknown) measured molecules; if (formerlyunknown) measured metabolites are annotated or identified, they can be assignedto compounds of public database (ii) of table ‘MetaboliteDetail’ including variousconnected information (e.g. several database IDs, IUPAC name, synonyms, chemicalformula and structure, monoisotopic and average mass, Simplified Molecular InputLine Entry System (SMILES), International Chemical Identifier (InChI), reactions,functional relations, and ontology information) (Figure 4.13). The suggested data-base helps to aggregate several annotations of overlapping sets of unknown metabo-lites that have been collected independently, or to extract existing annotations for agiven set of unknown metabolites occurring in results of novel experiments.


CHAPTER 3Results and discussion I: Characterization ofPC compositions measured as lipid sums
Labels of some metabolites in targeted as well as in non-targeted mass spectrome-try (MS) indicate ambiguous molecular structures. If the applied analytical methodcannot separate compounds that share equal chemical or physical properties, meta-bolite sums instead of single compounds are measured.With the contents of this chapter (except the imputation of metabolite concentra-
tions) including respective materials and methods I prepared a manuscript that I willsubmit for publication concurrently; Quell et al. [149].
3.1 BackgroundPhosphatidylcholines (PCs) are among the major constituents of cell membranes [129,130], important compounds of lipoproteins [131], and crucial in the energy metabo-lism. PCs consist of a polar head group with phosphocholine and a nonpolar partwith two fatty acid chains (with different lengths and desaturation) connected to thesn-1 or sn-2 positions of the glycerol backbone via an ester (acyl) or ether (alkyl)bond [132–134]. Besides the abundance of total PC, slight changes in the chemicalstructure of PCs imply large functional differences. As an example, stable omega-6 toomega-3 free fatty acid ratios of 4 to 1 are associated with a 70% lower total mortalityof patients suffering from cardiovascular diseases [135]. When fatty acids are bondto PCs, (besides their chain lengths and desaturation,) the fluidity, for instance, ofPC 16:1/16:1 (fatty acyl/alkyl position level; cf. Figure 3.1) is higher than the fluid-ity of PC 16:0/16:1 or PC 16:0/16:0 [136]. Even for PCs with a fixed desaturation,e.g. PC 18:0/18:1, the fluidity is maximized when double bonds are in the delta-9
47

48 Results and discussion I: Characterization of PC compositions
position [137]. Therefore, meaningful biochemical interpretations need to be as closeas possible to the actual chemical structure of lipids.Today, the availability of modern high-throughput lipidomics platforms allows
quantification of numerous lipids in thousands of blood samples of epidemiologi-cal cohorts. In particular, the MS-based targeted AbsoluteIDQTM kit has producedlarge data sets of metabolites, such as amino acids, acylcarnitines, PCs, lysoPCs,and SMs [26, 27, 141, 143, 144, 181–184]. AbsoluteIDQTM measures PCs duringmultiple reaction monitoring (MRM) scans by selecting the total m/z (Q1) and thehead group (Q3) (example in Table 3.1). As a consequence, the total length of both
lipid class level mass PC (745)lipid species level PC 33:1 PC O-34:1fatty acid (acyl/alkyl) level PC 15:0_18:1 PC 17:0_16:1 PC O-16:0_18:1
AbsoluteIDQTM Q1 (total m/z)* 746.6 746.6 746.6Q3 (head group) 184 184 184
LipidyzerTMQ1 (total m/z)* 804.6 804.6 804.6Q3 (1 fatty acid chain) 241.2 269.2 —
Table 3.1: Multiple reaction monitoring leading to different precision levelsAs an example, differently set MRMs are demonstrated on selected isobaric compounds ofPC (745). While AbsoluteIDQTM measures the total m/z (Q1) and the head group (Q3)during MRM scans and cannot separate selected isobaric compounds (lipid species level),LipidyzerTM targets one of both fatty acid chains (Q3) beside the total m/z (fatty acid level).Thus, both chain lengths including their desaturation are determined by LipdyzerTM. Toisolate PC aa from the isobaric PC ae, LipidyzerTM preferably selects the expected massof the odd-chain fatty acid (if applicable; but does not measure PC aes). All masses aregiven in Dalton. *) AbsoluteIDQTM measures PCs in positive mode (+[H]+ =̂ 1 Da);LipidyzerTM measures PCs in negative mode (+[M+OAc]− =̂ 49 Da).
fatty acid chains and number of double bonds is determined, but their division andconfiguration at the sn-1 and sn-2 positions remain unspecified and metabolites areannotated on the lipid species level only (Figure 3.1). Furthermore, PC and isobaricPC-O, in which one fatty acid chain is longer by one and attached by an alkyl bond,are not analytically separated (e.g. PC 33:1 and PC O-34:1 in Table 3.1). In variouslarge-scale mGWAS and MWAS, multiple of these PC measures have been reportedto associate with common genetic variants and various diseases such as Alzheimer’sdisease [142, 143], Type 2 Diabetes [141], coronary artery disease [144], or gastriccancer [145].The gap between the lipid species level and the concrete chemical structure needs

3.1 Background 49
2
Platform precision levels for lipid notation and measurement
Adapted image: Liebisch et al., 2013
LipidMaps: LMGP01020003, LMGP01010541, LMGP01010571
Low precision High precision Chemical structure
PC (745)
PC (745)
PC (745)
Lipid class
level mass
PIS m/z 184
Lipid species
level
PIS m/z 184
Bond type
level
High resolution
Fatty acyl/alkyl
level
FA scans
Fatty acyl/alkyl
position level
Position analysis
Lipid structure
(LIPID MAPS Nomenclature)
*
**
PC 33:1
PC O-34:1
PC 33:1 PC 16:0_17:1 PC 16:0/17:1
PC(16:0/17:1(9Z))
M = 745.56 g/mol
PC(15:0/18:1(11Z))
M = 745.56 g/mol
PC(O-16:0/18:1(9Z))
M = 745.60 g/mol
PC O-16:0/18:1
PC 15:0/18:1
PC O-16:0_18:1
PC 15:0_18:1PC 33:1
PC 33:1
PC 33:1
PC O-34:1
PC O-34:1
PC O-34:1
*
**
*
***** ***
Figure 3.1: Platform precision levels for notation and measurementFatty acids can be specified on different precision levels ranging from the lipid class level(low precision) to the lipid structure (maximum precision). Current mass spectrometryapproaches separate metabolites on the lipid species, or fatty acyl/ alkyl position level.Adapted figure from Liebisch et al. by permission from the Journal of Lipid Research [162],copyright 2013. Chemical structures were taken from Lipid Maps: LMGP01020003,LMGP01010541, LMGP01010571 [175].
to be reduced to use results based on these measured metabolites reasonably, which iscurrently only possible under the following assumptions: even chain lengths are moreabundant than odd chain lengths [138] (e.g. measurement of PC (745) is annotatedas PC O-34:1, in which one of the fatty acids is attached by an alkyl bound, insteadof the isobaric PC 33:1); especially C16:0, C18:0, C18:1, C18:2, and C20:4 fatty acidsare very common in human plasma [139] (e.g. leading to label PC O-16:0_18:1); andfurther more specific expectations regarding their concrete configuration [140, 141](e.g. ordering of fatty acids to sn-1 and sn-2 positions, PC O-16:0/18:1) (Figure 3.1).Recently published experimental non-targeted one or two-dimensional LC-MS tech-
nologies study retention behavior and fragment spectra of complex lipids to discri-minate complex lipids on the more precise fatty acyl/alkyl level, in which the lengthand desaturation of both fatty acid chains is determined, but their ordering (sn-1 orsn-2) and position of double bonds remains unspecified (Figure 3.1). Since currentestablished lipidomics platforms (such as AbsoluteIDQTM) generate measurementson the lipid species level, these studies provide annotations on both precision lev-els. However, they cannot specify quantitative compositions or main constituentsof metabolites measured on the coarser lipid species level in actual biological sam-

50 Results and discussion I: Characterization of PC compositions
ples. [185–187]Developed complex lipidomics FIA platforms, such as LipidyzerTM, perform stan-
dardized targeted high-throughput measurements by an ion trap that targets thetotal m/z (Q1) and one of the two fatty acid chains (Q3) during MRM scans (exam-ple in Table 3.1). Thus, measurements meet the fatty acyl/alkyl level. To improvethe readability, I use the term fatty acid level instead of fatty acyl/alkyl level in thiswork. Although annotations on the fatty acid level are far from the specific molecularstructure, they already allow more precise interpretations by a significantly reducednumber of possible constituents.To prevent remeasurements of samples that have already been quantified on the
lipid species level (that would be unnecessarily expensive, or impossible if samplesare already used up or reserved for further analyses), their composition should be de-termined on the more accurate fatty acid level. Especially for metabolites measurednon-targeted LC-MS devices, there are decision rule based (LipidMatch [188] and Li-pid Data Analyzer (LDA) [189]) or comparative (Greazy [190] and MS-DIAL [191])approaches that use retention times and fragment spectra to predict complex lipids.However, these methods cannot be applied to metabolites of the MRM based FIAplatform AbsoluteIDQTM. Therefore, I compare metabolite levels measured by Abso-luteIDQTM and LipidyzerTM in the same samples of a cohort. In former metabolomicsstudies data of several complementary platforms has been combined to increase thenumber of metabolites or incorporate metabolites covering multiple pathways andmolecular classes [181, 184]. Platform comparisons have successfully been applied tofind the most suitable analytical technique for exemplary use cases [192], and to com-pare metabolite levels (e.g. for replication of scientific results) directly or especiallyin case of non-targeted measurements, based on genetic or inter-metabolome associa-tions [181, 193]. In this work, I perform a comparison of metabolite levels that weremeasured by two platforms covering these precision levels to estimate quantitativecompositions shifting metabolites from the lipid species to the fatty acid level.
Overview of the PC characterization approach introduced
In this study, I introduced an automatic pipeline to characterize ambiguously labeledPC sums that were measured on the lipid species level by identifying their mainconstituents of the fatty acid level and specifying their quantitative contributions.To this end, I used 76 and 109 PCs, respectively, that were quantified on the targetedlipidomics platforms AbsoluteIDQTM and LipidyzerTM in 223 human plasma samples

3.2 Qualitative composition of PC sums 51
of healthy young men. In a first step, I assigned all theoretically possible PCs (fattyacid level) to the 76 PC sums by systematically distributing the total length of theirfatty acid chains and desaturation to the sn-1 and sn-2 positions. The resultingquantitative descriptions of PC compositions were filtered by measured moleculeswith at least 25% coverage to prepare concentration-based quantitative estimations.Quantitative PC compositions and imputation of PC concentrations (fatty acid level)were replicated in an independent cohort to demonstrate their stability. In a last step,I estimated the fraction of PC sums that could not be mapped to any measured PCof the fatty acid level.
3.2 Qualitative composition of PC sumsTo map PCs measured on the fatty acid level to PCs measured on the lipid specieslevel, we systematically distributed the total numbers of carbon atoms and doublebonds to two fatty acid chains and collected all possible isobars (Table 3.2). Wegathered 150 to 456 theoretically possible isobaric PCs of the fatty acid level for 76 PC
PC species Isobaric PC species Example Change in sum formula Change in massPC x : y PC 32:0
PC x+ 1 : y + 7 PC 33:7 +CH2 −14 H − 0.093 900 DaPC O-x+ 1 : y PC O-33:0 +CH2 +2H −O + 0.036 385 DaPC O-x+ 2 : y + 7 PC O-34:7 +2(CH2) −12H −O − 0.057 515 Da[13C1]SM x+ 4 : y [13C1]SM 36:0 +13C +5H +N −2O + 0.055 724 Da
PC O-x : y PC O-32:0PC O-x+ 1 : y + 7 PC O-33:7 +CH2 −14H − 0.093 900 DaPC x− 1 : y PC 31:0 +O −CH2 −2H − 0.036 385 DaPC x : y + 7 PC 32:7 +O −16H − 0.130 285 Da[13C1]SM x+ 3 : y [13C1]SM 35:0 +N +H +13C −12C −O + 0.019 339 Da
Table 3.2: Isobaric phosphatidylcholine sums within mass resolution of the MSdeviceMS platforms that quantify metabolites on the lipid species level cannot separate isobaric PCspecies. Furthermore, fatty acid chain lengths x and double bounds y can be systematicallydistributed to the sn-1 and sn-2 position to receive theoretically possible isobaric PCs onthe fatty acid level. Changes in mass have been calculated according to the changes in sumformulas and monoisotopic atom weights w: w(H)=1.007 825 Da, w(C)=12.000 000 Da,w(13C)=13.003 355 Da, w(O)=15.994 915 Da, w(N)=14.003 074 Da. This table is partof my prepared manuscript as well; Quell et al. [149].

52 Results and discussion I: Characterization of PC compositions
sums measured on the lipid species level (Supplemental Table A.1). BiocratesTM
provides a list with the most probable 2 to 17 PCs (fatty acid level) per PC sumthat are tagged in the supplemental table [194]. In addition, we highlighted 93 of109 compounds in this table that have been quantified on the LipidyzerTM platformin our data set. The isobaric [13C1]SM x+ 4 : y was added as a possible compound,if it has not been quantified with the kit and, thus, has not been subtracted from thePC concentration in the isotope correction step of the AbsoluteIDQTM processing.This was the case for 33 PC aa Cx : y and 38 PC ae Cx+ 1 : y species.
3.3 Quantitative composition of PC sumsFor 38 (25 PC aa and 13 PC ae) out of the 68 PC sums (that were quantified withthe AbsoluteIDQTM and passed the QC), in total, 69 (of 93 mapped) respective PCsof the fatty acid level (LipidyzerTM) were available at sufficient coverage (25%) in theHuMet Study [25] to estimate quantitative compositions. Each PC sum (lipid specieslevel) consists of one to four measured PCs of the fatty acid level, e.g.: PC aa C36:2= PC 16:0_20:2 + PC 18:0_18:2 + PC 18:1_18:1 + R, PC aa C34:3 = PC 14:0_20:3+ PC 16:0_18:3 + PC 18:2_16:1 + R, or PC aa C32:2 = PC 14:0_18:2 + R (Sup-plemental Table A.2). Here, R corresponds to the sum of respective non-measuredPCs of the fatty acid level that are specified in Supplemental Table A.1. Consistentwith the resolution of the MS techniques, we use the fatty acid level of the short handnotation of lipids for PCs, e.g. PC x1 : y1_x2 : y2 (Figure 3.1) [162]. PCs measuredon the lipid species level are labeled according to the BiocratesTM-specific notation,e.g. PC aa Cx : y or PC ae Cx : y, corresponding to PC x : y or PC O-x : y. Notably,PC aa or PC ae labels were chosen under the assumption of even chain lengths offatty acids.
3.3.1 Estimation of factors f
In a first step, we calculated factors f (mean of divided concentrations PCfatty acid levelPClipid species level
)estimating the proportion of each measured PC of the fatty acid level based onthe concentration of the respective PC sum (lipid species level) in the 223 HuMetsamples (Table 3.3). As an example, three measured PCs of the fatty acid level,namely PC 16:0_20:2, PC 18:0_18:2, PC 18:1_18:1, are isobaric constituents of thePC aa C36:2 measured at the lipid species level. The factors f [5% and 95% confidenceintervals] for these three species are 0.037 [0.023, 0.058], 0.967 [0.817, 1.14] and 0.099

3.3 Quantitative composition of PC sums 53
[0.060, 0.147], respectively (Figure 3.2(a)). For 27 out of the 38 investigated PC
●
●
PC 14:0_20:3 PC 16:0_18:3 PC 18:2_16:1
0.0
0.2
0.4
0.6
0.8
1.0
quot
ient
q
median: 0.046 median: 0.4774 median: 0.5526mean: 0.0481 mean: 0.482 mean: 0.5547
sd: 0.015 sd: 0.08 sd: 0.112
PC aa C34:3
●●●●
●
●
PC 16:0_20:2 PC 18:0_18:2 PC 18:1_18:1
0.0
0.2
0.4
0.6
0.8
1.0
1.2
1.4
quot
ient
q
median: 0.0366 median: 0.9575 median: 0.0928mean: 0.0373 mean: 0.967 mean: 0.0988
sd: 0.011 sd: 0.103 sd: 0.028
PC aa C36:2
●
●●●●
0.0
0.2
0.4
0.6
0.8
1.0
quot
ient
q
median: 0.3347mean: 0.3395
sd: 0.077
PC ae C38:3
PC 17:0_20:3
a b c
(a) PC aa C36:2
●
●
PC 14:0_20:3 PC 16:0_18:3 PC 18:2_16:1
0.0
0.2
0.4
0.6
0.8
1.0
quot
ient
q
median: 0.046 median: 0.4774 median: 0.5526mean: 0.0481 mean: 0.482 mean: 0.5547
sd: 0.015 sd: 0.08 sd: 0.112
PC aa C34:3
●●●●
●
●
PC 16:0_20:2 PC 18:0_18:2 PC 18:1_18:1
0.0
0.2
0.4
0.6
0.8
1.0
1.2
1.4
quot
ient
q
median: 0.0366 median: 0.9575 median: 0.0928mean: 0.0373 mean: 0.967 mean: 0.0988
sd: 0.011 sd: 0.103 sd: 0.028
PC aa C36:2
●
●●●●
0.0
0.2
0.4
0.6
0.8
1.0
quot
ient
q
median: 0.3347mean: 0.3395
sd: 0.077
PC ae C38:3
PC 17:0_20:3
a b c
(b) PC aa C34:3
●
●
PC 14:0_20:3 PC 16:0_18:3 PC 18:2_16:1
0.0
0.2
0.4
0.6
0.8
1.0
quot
ient
q
median: 0.046 median: 0.4774 median: 0.5526mean: 0.0481 mean: 0.482 mean: 0.5547
sd: 0.015 sd: 0.08 sd: 0.112
PC aa C34:3
●●●●
●
●
PC 16:0_20:2 PC 18:0_18:2 PC 18:1_18:1
0.0
0.2
0.4
0.6
0.8
1.0
1.2
1.4
quot
ient
q
median: 0.0366 median: 0.9575 median: 0.0928mean: 0.0373 mean: 0.967 mean: 0.0988
sd: 0.011 sd: 0.103 sd: 0.028
PC aa C36:2
●
●●●●
0.0
0.2
0.4
0.6
0.8
1.0
quot
ient
q
median: 0.3347mean: 0.3395
sd: 0.077
PC ae C38:3
PC 17:0_20:3
a b c
(c) PC aa C38:3
Figure 3.2: Quantitative compositions of PCs measured on the lipid species leveland respective PCs measured on the the fatty acid levelThe mean values of quotients of PCs measured on the fatty acid level and the respectivePC sums (lipid species level) estimate factors f (factor f is the mean of quotients q over allsamples). Concentrations of PCs measured on the lipid species level (i) can be multipliedwith fij to impute the concentrations of PCs on the fatty acid level (j). This figure is partof my prepared manuscript as well; Quell et al. [149].
sums, we identified at least one PC measured on the fatty acid level with a factorgreater than 20%. Three PC sums were characterized by at least two PCs measured onthe fatty acid level with f >0.2. As an example, PC aa C34:3 consists of PC 14:0_20:3(0.048 [0.025, 0.073]), PC 16:0_18:3 (0.482 [0.354, 0.617]), and PC 18:2_16:1 (0.555[0.381, 0.741]) (Figure 3.2(b)). In ten cases, we found one major component witha proportion greater than 80%. Interestingly, one PC sum contains a PC of thefatty acid level with an odd numbered fatty acid chain: PC 17:0_20:3 is a majorcomponent of PC ae C38:3 (f =0.34) (Figure 3.2(c)). For 11 PC sums, factors f forall measured constituents sum up to 80 – 120%. In four cases the sum of factors f islarger than 1.2.
3.3.2 Variation of factors f
Since factors f might vary, we were interested in differences of their distributionswithin our data set. To this end, we examined changes in factors f across subjectsand during lipid-related metabolic challenges such as 36h fasting (FASTING), phy-sical activity test (PAT), and after ingestion of a lipid-enriched meal (OLTT). Fortesting differences between subjects, we compared the distributions of quotients qof 56 time points of each of our four subjects (factors f correspond to the mean

54 Results and discussion I: Characterization of PC compositions
Lipid species AbsoluteIDQTM LipidyzerTM R2 of Fraction Factor Conf. interval Cat. Stab. Stab.(neutral mass) Metabolite Metabolite LM [%] [%] f 5% 95% f f | ic Subj.PC 30:0 (705) PC aa C30:0 PC 16:0_14:0 83.3 81.7 0.3584 0.2248 0.5098 I Y
PC 18:0_12:0 18.3 0.0820 0.0462 0.1495 y | yPC 32:0 (733) PC aa C32:0 PC 16:0_16:0 35.3 97.7 1.0218 0.7561 1.3897 IIo
PC 18:0_14:0 2.3 0.0231 0.0138 0.0347 yPC 32:1 (731) PC aa C32:1 PC 14:0_18:1 95.1 27.8 0.2981 0.1773 0.5843 Io | y
PC 16:0_16:1 72.2 0.7669 0.5433 0.9891 I |YPC 32:2 (729) PC aa C32:2 PC 14:0_18:2 78.9 100 1.2713 0.8229 1.7371 II+
PC 34:1 (759) PC aa C34:1 PC 16:0_18:1 86.6 99.5 1.4159 1.1793 1.6821 II+ |Y YPC 18:0_16:1 0.4 0.0057 0.0028 0.0120 | yPC 20:0_14:1 0.1 0.0014 0.0009 0.0022
PC 34:2 (757) PC aa C34:2 PC 14:0_20:2 49.4 < 0.05 0.0006 0.0004 0.0010 + | y yPC 16:0_18:2 98.1 1.5482 1.2968 1.8214 II |Y YPC 18:1_16:1 1.9 0.0247 0.0155 0.0371 y | y
PC 34:3 (755) PC aa C34:3 PC 14:0_20:3 85.4 4.5 0.0481 0.0252 0.0729 o
PC 16:0_18:3 44.7 0.4820 0.3539 0.6165 I Y |YPC 18:2_16:1 50.9 0.5547 0.3811 0.7406 I
PC 34:4 (753) PC aa C34:4 PC 14:0_20:4 53.6 100 0.3681 0.2438 0.5650 IPC 36:0 (789) PC aa C36:0 PC 18:0_18:0 14.3 100 0.4844 0.3066 0.7470 I YPC 36:1 (787) PC aa C36:1 PC 16:0_20:1 79.0 3.5 0.0319 0.0231 0.0447 o | y
PC 18:0_18:1 96.5 0.8819 0.7171 1.0794 II Y |Y YPC 36:2 (785) PC aa C36:2 PC 16:0_20:2 57.9 3.4 0.0373 0.0226 0.0581 o y | y
PC 18:0_18:2 87.7 0.9670 0.8172 1.1362 II Y |Y YPC 18:1_18:1 8.9 0.0988 0.0601 0.1467
PC 36:3 (783) PC aa C36:3 PC 16:0_20:3 80.4 53.6 0.6060 0.3434 0.8409 Io Y |YPC 18:0_18:3 1.5 0.0175 0.0100 0.0279 | yPC 18:1_18:2 44.8 0.5078 0.3177 0.7643 I Y |
PC 36:4 (781) PC aa C36:4 PC 14:0_22:4 65.2 0.4 0.0016 0.0011 0.0025PC 16:0_20:4 78.2 0.2943 0.2393 0.3555 IPC 18:1_18:3 2.5 0.0109 0.0033 0.0220PC 18:2_18:2 18.8 0.0774 0.0354 0.1558 | y
PC 36:5 (779) PC aa C36:5 PC 14:0_22:5 17.2 39.0 0.0172 0.0101 0.0262PC 18:2_18:3 61.0 0.0310 0.0113 0.0615 y
PC 36:6 (777) PC aa C36:6 PC 14:0_22:6 32.3 100 0.8810 0.4947 1.2925 IIo YPC 38:0 (817) PC aa C38:0 PC 18:0_20:0 34.5 100 0.1629 0.1193 0.2153 yPC 38:3 (811) PC aa C38:3 PC 18:0_20:3 80.7 94.3 0.6485 0.4476 0.8496 I Y |Y
PC 18:1_20:2 2.9 0.0197 0.0126 0.0299PC 18:2_20:1 2.7 0.0172 0.0070 0.0436
PC 38:4 (809) PC aa C38:4 PC 16:0_22:4 58.8 18.9 0.0758 0.0504 0.1059 y | yPC 18:0_20:4 59.5 0.2343 0.1971 0.2867 I YPC 18:1_20:3 19.9 0.0808 0.0490 0.1500PC 18:2_20:2 1.6 0.0065 0.0028 0.0126 y |
PC 38:5 (807) PC aa C38:5 PC 16:0_22:5 67.7 80.5 0.5515 0.4380 0.6725 I Y |YPC 18:1_20:4 14.4 0.0983 0.0687 0.1286 yPC 18:2_20:3 5.1 0.0349 0.0201 0.0647 y

3.3 Quantitative composition of PC sums 55
Table continued (p. 2 / 2)Lipid species AbsoluteIDQTM LipidyzerTM R2 of Fraction Factor Conf. interval Cat. Repl. Stab.(neutral mass) Metabolite Metabolite LM [%] [%] f 5% 95% f f | ic Subj.PC 38:6 (805) PC aa C38:6 PC 16:0_22:6 77.1 98.5 1.2431 1.0168 1.5009 II+ Y |Y Y
PC 18:2_20:4 1.5 0.0190 0.0118 0.0279PC 40:3 (839) PC aa C40:3 PC 20:0_20:3 0.2 100 0.4892 0.1980 0.8453 IPC 40:4 (837) PC aa C40:4 PC 18:0_22:4 67.2 88.0 0.7065 0.4936 0.9503 Io |Y
PC 20:0_20:4 12.0 0.0952 0.0644 0.1461 yPC 40:5 (835) PC aa C40:5 PC 18:0_22:5 76.5 93.0 0.7863 0.6343 0.9819 Io
PC 18:1_22:4 7.0 0.0588 0.0373 0.0840 y | yPC 40:6 (833) PC aa C40:6 PC 18:0_22:6 82.7 91.8 1.0540 0.8588 1.2734 IIo |Y Y
PC 18:1_22:5 7.0 0.0718 0.0429 0.1039PC 18:2_22:4 1.1 0.0126 0.0076 0.0186 y
PC 42:6 (861) PC aa C42:6 PC 20:0_22:6 5.9 100 0.8482 0.5587 1.2468 IIo
PC 33:1 (745) PC ae C34:1 PC 15:0_18:1 57.8 69.7 0.0988 0.0705 0.1373 yPC 17:0_16:1 30.3 0.0438 0.0307 0.0601 y
PC 33:2 (743) PC ae C34:2 PC 15:0_18:2 7.1 100 0.1059 0.0698 0.1541PC 35:1 (773) PC ae C36:1 PC 17:0_18:1 64.4 100 0.2147 0.1601 0.2878 I |Y YPC 35:2 (771) PC ae C36:2 PC 17:0_18:2 52.8 100 0.2275 0.1837 0.2799 I YPC 35:3 (769) PC ae C36:3 PC 15:0_20:3 49.9 100 0.0700 0.0458 0.0950PC 35:4 (767) PC ae C36:4 PC 15:0_20:4 26.0 100 0.0526 0.0339 0.0793 y | yPC 37:3 (797) PC ae C38:3 PC 17:0_20:3 64.5 100 0.3395 0.2248 0.4767 I Y |YPC 37:4 (795) PC ae C38:4 PC 17:0_20:4 64.1 100 0.1978 0.1495 0.2547 y | y yPC 37:5 (793) PC ae C38:5 PC 17:0_20:5 2.2 100 0.0263 0.0145 0.0408PC 37:6 (791) PC ae C38:6 PC 15:0_22:6 12.6 100 0.0677 0.0433 0.1084 y | yPC 39:1 (829) PC ae C40:1 PC 18:2_22:6 20.3 100 0.5664 0.3782 0.8648 IPC 39:5 (821) PC ae C40:5 PC 17:0_22:5 19.7 100 0.1234 0.0708 0.1735 y | y yPC 39:6 (819) PC ae C40:6 PC 17:0_22:6 56.3 100 0.1720 0.1216 0.2262 y | y y
Table 3.3: Quantitative composition of phosphatidylcholinesEach PC sum measured on the lipid species level (AbsoluteIDQTM) consists of a compo-sition of PCs measured on the fatty acid level (LipidyzerTM). As AbsoluteIDQTM cannotdistinguish between acyl and alkyl bound types, the isobaric PC (lipid species) followed bythe lipid class level mass is used. A linear model estimated R2 as the percentage of varianceof the PC sum that can be explained by the variances of the PCs of the fatty acid level. Incontrast to factor f , fraction is the quantitative ratio of PCs of the fatty acid level withinthe measured compounds and sums up to 100% (per PC composition). The measured con-centrations of PC sums can be multiplied by the factor f to impute the concentrations ofrespective PCs of the fatty acid level. The percentiles represent (5% and 95%) confidenceintervals of this factor. Categories ‘I’ and ‘II’ correspond to factors f larger than 0.2 orlarger than 0.8 respectively. The symbol ‘o’ was added, if aggregated factors f per PCsum are between 0.9 and 1.1, or ‘+’ if factors f are larger than 1.1. Factors f (or imputedconcentrations (ic)) have been replicated, if distributions of quotients q in HuMet and in asubset of QMDiab, containing healthy men aged ≤ 40y, (or distributions of observed andimputed concentrations of PCs of the fatty acid level in the subset of QMDiab) were notsignificantly different (α=0.01). The stability of the factor f within subjects of HuMetwas calculated by an ANOVA (distributions of quotients q were not significantly differentaccording to an α level of 0.01). Capital letters indicate that replication or stability hasbeen shown for the main compound (constituent with largest f) of a PC composition. Asimilar version of this table is part of my prepared manuscript as well; Quell et al. [149].

56 Results and discussion I: Characterization of PC compositions
value of quotients q across all subjects and time points, cf. Equation 2.1). In 18 of38 PC sums, distributions of quotients of the constituent with the largest f arenot significantly different (Supplemental Table A.3) between subjects. Variationsof f within challenges appear to be smaller compared to variations across subjects(average: SDsubjects =0.100, SDfasting =0.067, SDsport =0.043, SDOLTT =0.058, andSDall time points =0.050; Supplemental Figure A.1). Since only four data points areavailable per baseline and intervention time point in each challenge, the statisticalpower is too low to identify significant differences in f depending on the status oflipid metabolism (Supplemental Table A.3).
3.4 Replication of quantitative compositions in another cohortTo test the transferability of factors f calculated from the HuMet study focusingon healthy male subjects (aged 22 – 33y) of European ethnicity to other cohorts, weanalyzed data from the two metabolomics platforms for participants of QMDiab with151 healthy controls and 154 patients with diabetes (aged 17 – 81y).
3.4.1 Comparison of factors f between data sets
First, we sought replication of the main constituents (largest f) of the 38 PC sumsin the 31 healthy male participants of QMDiab aged below 40y. For 37 PC sums, thesame PCs measured on the fatty acid level were identified as the main constituentswith the largest f . One PC sum was not reported in QMDiab. For 13 PC sums,main factors f showed no significant difference between pairwise distributions of q inthe two cohorts (Table 3.3, Supplemental Figure A.2 and Supplemental Table A.4).In general, factors f tend to be higher in samples of QMDiab, compared to factors fin samples of HuMet (Figure 3.3). Largest differences between factors f in bothcohorts were identified for PCs of the fatty acid level containing C20:4 except fortwo PCs with C20:4 and a second fatty acid chain with an odd number of C-atoms(PC 15:0_20:4, PC 17:0_20:4).QMDiab also allows calculation of factors f based on heterogeneous subsets in-
cluding samples of both genders and patients suffering from type two diabetes. Wecompared the distributions of quotients q of three groups containing male controls,female controls, and cases, to estimate their variation: in 33 of 37 PC sums, factors fof the main compounds are not significantly different for these subsets. In the remain-ing four cases, the main factor is below 0.001 or not available (due to > 75% missing
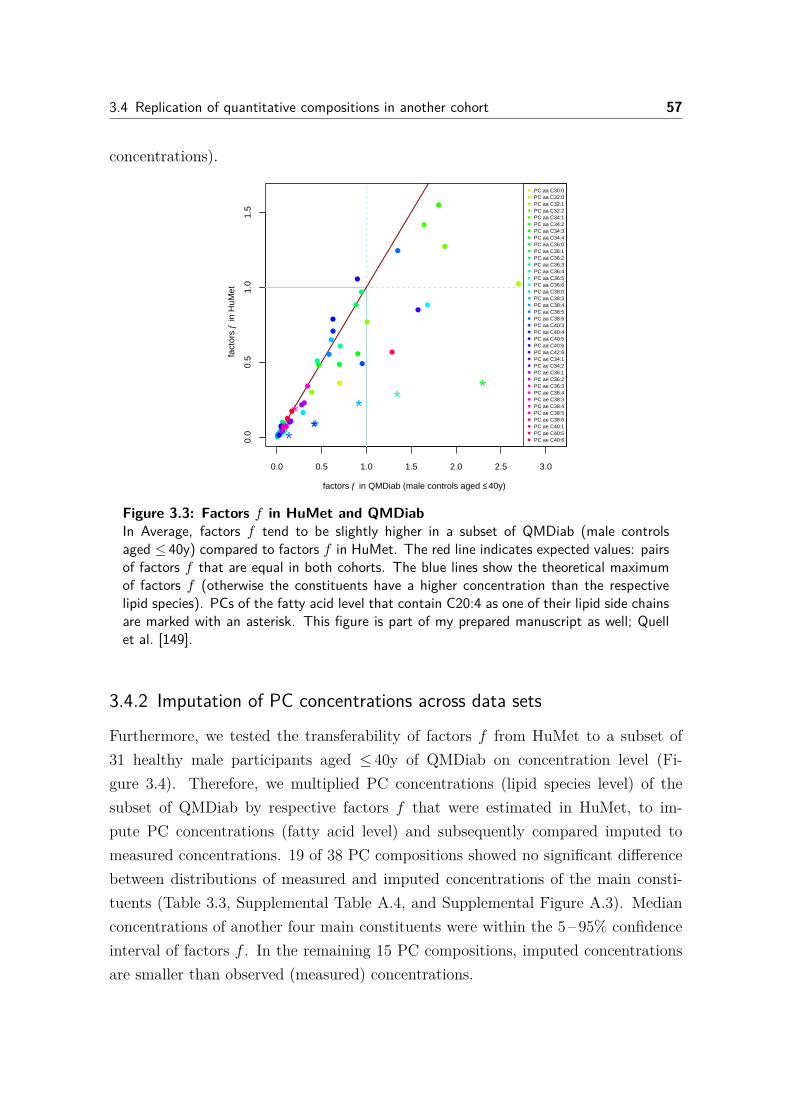
3.4 Replication of quantitative compositions in another cohort 57
concentrations).
0.0 0.5 1.0 1.5 2.0 2.5 3.0
0.0
0.5
1.0
1.5
Factors for Biocrates
●
●
●
●
●
●
●
●
●●
●
●●
●
●
*●
●
●
●
●
●
●
●
●
●
*
●
●
●●
●
●
●
●●
●
*●
●
●
*●
●
*
●
●
*
●
●
●
●
●
●
●
●
●
●●
●
*
●
*●
●
●●
●
●
●
●
●
●
●
●
●
●
●
●
●
●
●
●
●
●
●
●
●
●
●
●
●
●
●
●
●
●
●
●
●
●
●
●
●
●
PC aa C30:0PC aa C32:0PC aa C32:1PC aa C32:2PC aa C34:1PC aa C34:2PC aa C34:3PC aa C34:4PC aa C36:0PC aa C36:1PC aa C36:2PC aa C36:3PC aa C36:4PC aa C36:5PC aa C36:6PC aa C38:0PC aa C38:3PC aa C38:4PC aa C38:5PC aa C38:6PC aa C40:3PC aa C40:4PC aa C40:5PC aa C40:6PC aa C42:6PC ae C34:1PC ae C34:2PC ae C36:1PC ae C36:2PC ae C36:3PC ae C36:4PC ae C38:3PC ae C38:4PC ae C38:5PC ae C38:6PC ae C40:1PC ae C40:5PC ae C40:6
fact
ors
f in
HuM
et
factors f in QMDiab (male controls aged ≤40y)
Figure 3.3: Factors f in HuMet and QMDiabIn Average, factors f tend to be slightly higher in a subset of QMDiab (male controlsaged ≤ 40y) compared to factors f in HuMet. The red line indicates expected values: pairsof factors f that are equal in both cohorts. The blue lines show the theoretical maximumof factors f (otherwise the constituents have a higher concentration than the respectivelipid species). PCs of the fatty acid level that contain C20:4 as one of their lipid side chainsare marked with an asterisk. This figure is part of my prepared manuscript as well; Quellet al. [149].
3.4.2 Imputation of PC concentrations across data sets
Furthermore, we tested the transferability of factors f from HuMet to a subset of31 healthy male participants aged ≤ 40y of QMDiab on concentration level (Fi-gure 3.4). Therefore, we multiplied PC concentrations (lipid species level) of thesubset of QMDiab by respective factors f that were estimated in HuMet, to im-pute PC concentrations (fatty acid level) and subsequently compared imputed tomeasured concentrations. 19 of 38 PC compositions showed no significant differencebetween distributions of measured and imputed concentrations of the main consti-tuents (Table 3.3, Supplemental Table A.4, and Supplemental Figure A.3). Medianconcentrations of another four main constituents were within the 5 – 95% confidenceinterval of factors f . In the remaining 15 PC compositions, imputed concentrationsare smaller than observed (measured) concentrations.

58 Results and discussion I: Characterization of PC compositionsRelative deviation measured vs. imputed concentrations
●●
●●
●●
●●
●●
●●
●●
●●
* ●●
●●
●●
●●
●●
* ●●
●●
●●
●●
●
* ●●
●
* ●●
* ●●
* ●●
●●
●●
●●●
●●
●
* ●
*●●
●●
●
●
●
●
●
●
●
●
●
●
●
●
●
●
●
●
●
●
●
●
●
●
●
●
●
●
●
●
●
●
●
●
●
●
●
●
●
●
●
●
●
●
●
●
●
●
●
●
●
●
●
●
●
●
●
●
●
●
●
●
●
●
●
●
●
●
●
●
●
●
PC aa C30:0 > PC 16:0_14:0PC aa C30:0 > PC 18:0_12:0PC aa C32:0 > PC 16:0_16:0PC aa C32:0 > PC 18:0_14:0PC aa C32:1 > PC 14:0_18:1PC aa C32:1 > PC 16:0_16:1PC aa C32:2 > PC 14:0_18:2PC aa C34:1 > PC 16:0_18:1PC aa C34:1 > PC 18:0_16:1PC aa C34:1 > PC 20:0_14:1PC aa C34:2 > PC 14:0_20:2PC aa C34:2 > PC 16:0_18:2PC aa C34:2 > PC 18:1_16:1PC aa C34:3 > PC 14:0_20:3PC aa C34:3 > PC 16:0_18:3PC aa C34:3 > PC 18:2_16:1PC aa C34:4 > PC 14:0_20:4PC aa C36:0 > PC 18:0_18:0PC aa C36:1 > PC 16:0_20:1PC aa C36:1 > PC 18:0_18:1PC aa C36:2 > PC 16:0_20:2PC aa C36:2 > PC 18:0_18:2PC aa C36:2 > PC 18:1_18:1PC aa C36:3 > PC 16:0_20:3PC aa C36:3 > PC 18:0_18:3PC aa C36:3 > PC 18:1_18:2PC aa C36:4 > PC 14:0_22:4PC aa C36:4 > PC 16:0_20:4PC aa C36:4 > PC 18:1_18:3PC aa C36:4 > PC 18:2_18:2PC aa C36:5 > PC 14:0_22:5PC aa C36:5 > PC 18:2_18:3PC aa C36:6 > PC 14:0_22:6PC aa C38:0 > PC 18:0_20:0PC aa C38:3 > PC 18:0_20:3PC aa C38:3 > PC 18:1_20:2PC aa C38:3 > PC 18:2_20:1PC aa C38:4 > PC 16:0_22:4PC aa C38:4 > PC 18:0_20:4PC aa C38:4 > PC 18:1_20:3PC aa C38:4 > PC 18:2_20:2PC aa C38:5 > PC 16:0_22:5PC aa C38:5 > PC 18:1_20:4PC aa C38:5 > PC 18:2_20:3PC aa C38:6 > PC 16:0_22:6PC aa C38:6 > PC 18:2_20:4PC aa C40:3 > PC 20:0_20:3PC aa C40:4 > PC 18:0_22:4PC aa C40:4 > PC 20:0_20:4PC aa C40:5 > PC 18:0_22:5PC aa C40:5 > PC 18:1_22:4PC aa C40:6 > PC 18:0_22:6PC aa C40:6 > PC 18:1_22:5PC aa C40:6 > PC 18:2_22:4PC aa C42:6 > PC 20:0_22:6PC ae C34:1 > PC 15:0_18:1PC ae C34:1 > PC 17:0_16:1PC ae C34:2 > PC 15:0_18:2PC ae C36:1 > PC 17:0_18:1PC ae C36:2 > PC 17:0_18:2PC ae C36:3 > PC 15:0_20:3PC ae C36:4 > PC 15:0_20:4PC ae C38:3 > PC 17:0_20:3PC ae C38:4 > PC 17:0_20:4PC ae C38:5 > PC 17:0_20:5PC ae C38:6 > PC 15:0_22:6PC ae C40:1 > PC 18:2_22:6PC ae C40:5 > PC 17:0_22:5PC ae C40:6 > PC 17:0_22:6
PC
s (li
pid
spec
ies
leve
l > fa
tty a
cid
leve
l)
−100 −50 0 50 100
deviation [%]
Figure 3.4: Relative deviation of measured vs. imputed median metabolite levelsPC concentrations measured on the lipid species level in QMDiab were multiplied by fac-tors f estimated in HuMet to impute levels on the fatty acid level. In compositions that areclose to the red line, imputed values correspond to measured values. *) PCs cont. C20:4.
3.5 Contribution of non-measured constituents in PC sumsOut of 150 to 456 theoretically possible PCs of the fatty acid level per PC sum,the platform comparison only allowed mapping of one to four of these PCs to therespective sums to determine factors f (Supplemental Table A.1). To estimate thefraction of each PC sum that could be explained by measured PCs of the fatty

3.5 Contribution of non-measured constituents in PC sums 59
acid level in our approach, we generated linear regression models (estimation ofthe explained variance; e.g. PC aa C36:2 ∼ b· (PC 16:0_20:2 + PC 18:0_18:2 +PC 18:1_18:1)) and Bland-Altman plots (comparison of absolute concentrations be-tween both platforms; Figure 3.5) for the 38 PCs listed in Table 3.3.
●
●●
●
●
●
●
●
●
●
●
●
●
●
●
●
●
●
●
●
●
●
●
●
●
●
●
●
●
●
●●
●
●
●
●
●
●
●
●
●
●
●●
●
●
●
●
●
●
●
●
●
●
●
●
●
●
●
●●
●
●
●
●● ●
●
●●●●
●
●●
●
●●
●
●
●
●
●
●
●
●
●
●
●
●
●
●
●●
●
●●
●
● ●●●
●
●
●●●
●
●●
●
●
●
●
●
●
●
●●
●
●
●●
●
●
●
●
●
●
●
●
●
●
●
●
●
●
●
●
●
●
●
●
●●
●
●
●
●
●
●
●
●
●
●
●●
●
●●
●●
●
●
●
●
●●
●
●
●
●●
●
●
●
●
●●
●
●
●
●●
●
●
●●
●
●
●
●
●
●
●
●
● ●
●
●●●● ●
●
●
●
●
●
●●
●
●
●●
●
●
● ●●
●
10 15 20 25
−6
−4
−2
02
4
mean: (AbsoluteIDQTM + sum(LipidyzerTM)) / 2
diffe
renc
e: A
bsol
uteI
DQ
TM −
sum
(Lip
idyz
erT
M)
MEAN:−1.04
+1.96 SD:2.563
−1.96 SD:−4.642
PC aa 34:3 = PC 14:0_20:3 + PC 16:0_18:3 + PC 18:2_16:1
●
●●
●
●
●
●
●●
●
● ●
●
●
●
●●
●
●
●●
●
●
●
●
● ●
●
●
●
●
●
●
●
●●
● ●●
●
●
●
●
●
●
●
●
●
●
●
● ●
●
●
●
●
●
●
● ●
●
●
●
●
●
●
●
●
●
●
●
●
●
●
●● ●
●
●
●
●●
●
●
●
●●
●
●
●●
●
●
●
●
●
●
●
●
●●
●
●
● ●●
●
●
●
●
●
●
●
●●
●
●
●
●
● ●
●
●
●
●
●●
●●
●
●
●●
●
●
●
●
●
●
●
●
●
●
●
●
●
●
●
●
●
●
●
●
●
●
●
●●
●
●
●●
●
●
●●
●
●
●●
● ●
●
●
●
●
●
●
●
●
●
●●●
●
●
●
●
●●
●
●
●
●
●●
●
●
●
●●
●
●
●●
●
●
●
●●
●
●
●
●
●
●
●
●
●
●●
2 3 4 5
−1.
0−
0.5
0.0
0.5
1.0
1.5
2.0
mean: (AbsoluteIDQTM + sum(LipidyzerTM)) / 2
diffe
renc
e: A
bsol
uteI
DQ
TM −
sum
(Lip
idyz
erT
M)
MEAN:0.676
+1.96 SD:1.717
−1.96 SD:−0.365
PC aa40:4 = PC 18:0_22:4 + PC 20:0_20:4
●
●
●
●
subject 5subject 6subject 7subject 8
(a) PC aa 40:4 = PC 18:0_22:4 + PC 20:0_20:4
●
●●
●
●
●
●
●
●
●
●
●
●
●
●
●
●
●
●
●
●
●
●
●
●
●
●
●
●
●
●●
●
●
●
●
●
●
●
●
●
●
●●
●
●
●
●
●
●
●
●
●
●
●
●
●
●
●
●●
●
●
●
●● ●
●
●●●●
●
●●
●
●●
●
●
●
●
●
●
●
●
●
●
●
●
●
●
●●
●
●●
●
● ●●●
●
●
●●●
●
●●
●
●
●
●
●
●
●
●●
●
●
●●
●
●
●
●
●
●
●
●
●
●
●
●
●
●
●
●
●
●
●
●
●●
●
●
●
●
●
●
●
●
●
●
●●
●
●●
●●
●
●
●
●
●●
●
●
●
●●
●
●
●
●
●●
●
●
●
●●
●
●
●●
●
●
●
●
●
●
●
●
● ●
●
●●●● ●
●
●
●
●
●
●●
●
●
●●
●
●
● ●●
●
10 15 20 25
−6
−4
−2
02
4
mean: (AbsoluteIDQTM + sum(LipidyzerTM)) / 2
diffe
renc
e: A
bsol
uteI
DQ
TM −
sum
(Lip
idyz
erT
M)
MEAN:−1.04
+1.96 SD:2.563
−1.96 SD:−4.642
PC aa 34:3 = PC 14:0_20:3 + PC 16:0_18:3 + PC 18:2_16:1
●
●●
●
●
●
●
●●
●
● ●
●
●
●
●●
●
●
●●
●
●
●
●
● ●
●
●
●
●
●
●
●
●●
● ●●
●
●
●
●
●
●
●
●
●
●
●
● ●
●
●
●
●
●
●
● ●
●
●
●
●
●
●
●
●
●
●
●
●
●
●
●● ●
●
●
●
●●
●
●
●
●●
●
●
●●
●
●
●
●
●
●
●
●
●●
●
●
● ●●
●
●
●
●
●
●
●
●●
●
●
●
●
● ●
●
●
●
●
●●
●●
●
●
●●
●
●
●
●
●
●
●
●
●
●
●
●
●
●
●
●
●
●
●
●
●
●
●
●●
●
●
●●
●
●
●●
●
●
●●
● ●
●
●
●
●
●
●
●
●
●
●●●
●
●
●
●
●●
●
●
●
●
●●
●
●
●
●●
●
●
●●
●
●
●
●●
●
●
●
●
●
●
●
●
●
●●
2 3 4 5
−1.
0−
0.5
0.0
0.5
1.0
1.5
2.0
mean: (AbsoluteIDQTM + sum(LipidyzerTM)) / 2
diffe
renc
e: A
bsol
uteI
DQ
TM −
sum
(Lip
idyz
erT
M)
MEAN:0.676
+1.96 SD:1.717
−1.96 SD:−0.365
PC aa40:4 = PC 18:0_22:4 + PC 20:0_20:4
●
●
●
●
subject 5subject 6subject 7subject 8
(b) PC aa 34:3 = PC 14:0_20:3 + PC 16:0_18:3+ PC 18:2_16:1
Figure 3.5: Deviation and mean of PCs measured on different platformsShifts in difference (possibly dependent on the mean) of concentrations of PC sums (lipidspecies level) and respective constituents (fatty acid level) indicate whether both techniquesmeasure the same compounds in a comparable accuracy (Bland-Altman plot). Colors referto four subjects. In 19 of 25 cases the mean difference is within 2 SD of the concentrationof the PC measured on the lipid species level. A similar version of this figure is part of myprepared manuscript as well; Quell et al. [149].
In median, 58% (mean: 52%, SD: 28%) of the variance of PC sums can be explainedby the variances of measured PCs of the fatty acid level (Table 3.3 and SupplementalTable A.5). In consequence, 42% of the variance of PC sums is related to furtherconstituents or other factors such as experimental variation.We investigated systematic differences in metabolite concentrations of both mea-
suring techniques under the assumption that all relevant constituents have beenmeasured (Supplemental Table A.2). Since both platforms reported metabolite lev-els in the same quantitative units (µmol/L), we compared concentrations of PCsums (lipid species level) to concentrations of mapped PCs of the fatty acid level(e.g. conc.(PC aa C36:2) –
(conc.(PC 16:0_20:2) + conc.(PC 18:0_18:2) + conc.(
PC 18:1_18:1))) and the average of both concentrations (Bland-Altman plots). In
19 of 25 PC aa compositions, the mean of this difference is within 2 SD of the PCsum (in 12 of those compositions mean difference is within 1 SD). Small mean dif-
60 Results and discussion I: Characterization of PC compositions
ferences on the y-axis (in relation to absolute concentrations) and small variation(e.g. PC aa C40:4 = PC 18:0_22:4 + PC 20:0_20:4, absolute mean difference: 0.68;mean difference is within 1 SD of the PC sum) indicate concurrent measurementsof both platforms (Figure 3.5(a)). In 10 cases (seven cases within 1 standard devia-tion (SD) and further two cases within 2 SD), in which mean differences are negative,concentrations of PCs measured on the fatty acid level are larger than those of PCsmeasured on the lipid species level (Figure 3.5(b)). All 13 compositions of PC ae sumsshow positive mean deviations larger than two. Mean concentrations on the x-axis ofBland-Altman plots enable identification of trends in differences of measuring meth-ods that depend on absolute values (e.g. PC aa C34:4, PC aa C36:4, PC aa C36:5,PC aa C38:0).
3.6 Discussion
AbsoluteIDQTM has emerged as an established measurement kit for quantification oflipids, such as phosphatidylcholines (PCs), in blood from thousands of participantsin large epidemiological cohorts [26, 27, 141, 144, 145, 181, 183, 184, 195, 196] andin projects using various matrices of human, animal, or plant samples [197–201]. Asthe kit quantifies PCs on the level of lipid species, each PC sum measure can, intheory, consist of 150 to 456 isobaric PCs with different combinations of fatty acidchain lengths and degrees of desaturation for the two residues of which only a smallsubset of one to four PCs (fatty acid level) have been quantified by LipidyzerTM.Behind PCs of the fatty acid level, there are even more molecules on the level ofchemical structures, due to differences in the order of both fatty acid chains, posi-tions of double bounds, or stereo-chemistry. Although reliable interpretations requirechemical structures, since similar compounds with little changes in respect to theirconfiguration or desaturation lead to different biochemical functions, such as changesin their fluidity [136, 137], disturbances in the lipase activity [202], or go along withthe mortality of patients suffering from cardiovascular diseases [135], PCs measuredon the fatty acid level clearly reduce the number of possible constituents and there-fore, enable more differentiating interpretations compared to PC sums of the lipidspecies level.

3.6 Discussion 61
3.6.1 Strategies for structural elucidation of complex lipids
Although there are decision rule based (LipidMatch [188] and Lipid Data Analyzer(LDA) [189]) or comparative (Greazy [190] and MS-DIAL [191]) approaches that useanalytic data to predict complex lipids, these methods cannot be applied to meta-bolites of MRM based FIA platforms, such as AbsoluteIDQTM, since these methodsexpect metabolites measured by non-targeted LC-MS devices. Moreover, these ap-proaches assist characterization of complex lipids on the fatty acid level, but they arenot capable to elucidate the main constituents of PC sums in biological tissues.In contrast to these approaches, our method compares metabolite levels of samples
that were measured on two platforms covering two different precision levels, suchas the lipid species level and the fatty acid level. By this means, constituents ofmeasured lipid sums are identified, and their quantitative contribution determined toserve imputation of other independent data sets.An experimental (non-targeted) two-dimensional LC-MS technique, proposed by
Holčapek et al. (2015) uses a reversed phase (RP) chromatography to separate lipidclasses and a coupled HILIC to identify the lipid species [185]. Resulting fragmentspectra facilitate identification complex lipids on the fatty acid level. Although theyannotated 18 measured PCs with labels on the fatty acid level and on the lipid specieslevel, their experimental design cannot resolve quantitative compositions. The focuswas on the proof of the 2D-LC-MS measuring concept and on the study of the RTbehavior of complex lipids. With our results, we can confirm that 14 of 18 measuredPCs are among our specified main constituents. In the remaining four cases, a minorconstituent was measured, or the measured PC was not available in our data set.In our study, we explained 38 measured PC compositions and moreover specifiedquantitative contributions of constituents.
3.6.2 Attributes of PC compositions in selected cohorts
Estimated PC compositions can be transferred to other samples and cohorts (byimputation of concentrations) under the assumption that factors f are relativelystable across samples. In this study, concentrations were measured in 56 plasmasamples per subject that has been collected during specific timepoints and challenges(HuMet). Within this data basis we demonstrated that the factors f (i.e. distributionsof quotients q) (containing 56 samples) of the main constituents are not significantlydifferent between our four subjects for 18 out of 38 PC compositions. In samples

62 Results and discussion I: Characterization of PC compositions
of a second independent data set (QMDiab), we replicated factors f of the mainconstituents for 13 PC compositions and showed that distributions of quotients qbetween subsets containing male controls, female controls, and cases are not signi-ficantly different for 33 of 37 PC compositions. Therefore, only 4 PC compositionswere significantly different between subsets. The study design of HuMet would evenallow statistical tests regarding to the variation of factors f during challenges, indeedthe small number of four subjects led to no significant results (the null hypothesis[H0 : no difference] will not be rejected due to reduced statistical power). Moreover,statistical tests, including ANOVA or Kruskal-Wallis, determine empirical evidenceabout the difference of two or more distributions, but we were searching for equiva-lence. Thus, we were restricted to the phrase ‘not significantly different’ instead of‘significantly equal’. Because of only four samples per time point, we assessed thestability visually and concluded that there is a variation of factor f across challenges,but this variation is much smaller than the variation across subjects. Furthermore,estimated quantitative compositions are restricted to blood plasma. Ratios may bedifferent in other matrices; however, plasma is the most frequently used tissue withinmetabolomics experiments [40]. In general, we demonstrated the reproducibility ofPC compositions in our data; for an overarching statement further analyses in largeheterogeneous data sets measured in various matrices by lipidomics platforms of thelipid species and fatty acid levels are necessary.Besides small variation in factors f , we checked the consistency of variance that is
explained by linear models and the values of f . In most PC compositions, large R2 andlarge f are co-observed. However, these measures are contradicting in some PC com-positions: e.g. PC aa C42:6 = PC 20:0_22:6 + R and PC aa C40:3 = PC 20:0_20:3+ R showed high factors f of 0.7 and 0.5 (indicating that measured constituents aremain parts of both compositions), but very low R2 of 5.9% and 0.2%, respectively.The increased variations in factors f of 0.85 and 0.49 (mean: 0.33, median: 0.11)suggest that this observation may be traced back to deviating measuring accuraciesof both platforms or to individually flexible compositions of the respective PC sums.Although most factors f are smaller than one, we found four unexpected clearly
larger factors f (between 1.2 to 1.5). In these cases, measured concentrations of con-stituents on the fatty acid level are larger than the concentrations of the respectivePC sums (lipid species level), which would not occur, if both platforms would measurethe denoted compounds exactly. This deviation may be a consequence of measur-ing accuracy, external influences, probe handling, or different compound extraction

3.6 Discussion 63
procedures [78]. Although AbsoluteIDQTM reports concentrations in absolute units,values are marked as semi-quantitative, because only a small number of internal stan-dards is measured. We specified the 5% and 95% confidence interval for each factor fto indicate its variation but could not adjust factors f to a maximum of 1, becauseR that potentially contains several hundred non-measured compounds could not bedetermined on concentration level. However, Bland-Altman plots and linear modelsindicate that PCs measured on the fatty acid level that we classified as main consti-tuents are important factors of respective PC sums (lipid species level) and that inmost cases R is very small. Most of our PC sums consist of one main (measured)constituent measured on the fatty acid level.
3.6.3 Precision levels in lipidomics experiments
In general, assumptions regarding the composition of PCs of the lipid species levelwere derived from the abundance of cellular free fatty acids: e.g. the even numberedC16:0, C18:0, C18:1, C18:2 and C20:4 are common fatty acids in human plasma [138,139, 203, 204]. Based on these assumptions, BiocratesTM provides a list containingprobable 2 – 16 PCs of the fatty acid level for PC sums measured on the lipid specieslevel by AbsoluteIDQTM kit [194]. PCs (fatty acid level) quantified by LipidyzerTM
cover a subset of one to four of these constituents per PC sum. Therefore, it isplausible that main constituents of the fatty acid level are among the measuredcompounds. With our results we can confirm that 47 of 55 PCs measured on thefatty acid level (mapped to 10 of 13 PC aa sums) contain at least one common fattyacid chain listed above. The remaining 8 PCs measured on the fatty acid level eithercontain C14:0 or C20:0.However, we found notable exceptions: 8 PCs of the fatty acid level that were
mapped to PC ae sums contain none of the mentioned common fatty acids. Most ofthese PCs consist of one odd-numbered fatty acid chain and C16, C20, or C22 withvarying desaturation. Although AbsoluteIDQTM MS technology cannot distinguishbetween the isobaric PC O-x : y and PC x− 1 : y, we principally confirm that mostPC ae sums do not consist of our measured isobaric PC (aa)s of the fatty acid level(mean f =0.16). Interestingly, we identified three PC ae sums containing notableamounts of odd-numbered constituents (f between 0.20 and 0.34).In the literature, biochemical interpretations of results containing PC sums (lipid
species level) are regularly based on expected concrete underlying molecular struc-tures [140, 141, 205]. As an example, Suhre et al. 2011 assumed that PC aa C36:4,

64 Results and discussion I: Characterization of PC compositions
PC aa C38:4, PC aa C38:5, and PC ae C38:3 are composed by one saturated ormono-unsaturated fatty acid C16 or C18 and of one poly-unsaturated fatty acid. ForPC aa C30:0, PC aa C30:2, PC aa C32:0 and PC ae C34:1 they expect at least oneC16 or C18 chain to be saturated or mono-unsaturated, but no poly-unsaturatedfatty acids [140]. Now, we confirmed these expectations for 5 of 8 PC sums and evenquantified related compositions: in mean these constituents contribute 49% (factor fbetween 0.23 and 1.02) to the concentrations of respective PC sums. Accordingly,these PCs (fatty acid level) describe in mean 62% (R2 ranges from 35% to 83%) ofthe variance of respective PC sums (lipid species level). Relevant PCs of the fattyacid level for the remaining three PC sums have not been reported by LipidyzerTM.We could relativize the supposition of Floegel et al. 2013 that PC aa C32:1 mainlyconsists of PC 14:0_18:1 [141] and showed that this compound is among its minorconstituents.PC sums (lipid species level) and PCs of the fatty acid level belong to two diffe-
rent resolution levels within a range from the lipid class level to concrete chemicalstructures. PCs measured on the fatty acid level are still classes but not individualmolecules, because the sn-1 and sn-2 positions are not distinguished and the positionsof double bonds and their stereo-chemistry cannot be determined. However, specificside chains prefer one of the sn-1 or sn-2 positions of PCs in human plasma: in 95% ofcases 16:0 is bound to the sn-1 position, 96% of 18:0 to position sn-1, 76% of 18:1to position sn-2, 89% of 18:2 to position sn-2 and almost 100% of 20:4 to positionsn-2 [139]. These variations have a large effect on the biochemical physiology in cellsand tissues [135–137, 202]. Even if PCs annotated on the fatty acid level are notequivalent to concrete chemical structures, they already enable interpretations in amore precise biochemical context compared to PCs measured on the lipid species levelwith an unknown composition of chain lengths and double bonds or usage of assump-tions regarding their composition. Our analysis enables biochemical interpretationson the fatty acid level for a large number of studies that led to data sets containingPCs measured on the lipid species level by AbsoluteIDQTM. On the one hand, de-termined quantitative compositions of PC sums can be used directly for imputationof measured PCs. On the other hand, based on a small subset of samples that aremeasured on both precision levels, our automated workflow can estimate factors ffor imputation of metabolite concentrations of the remaining samples.

3.6 Discussion 65
3.6.4 Summary
AbsoluteIDQTM is a well-established and efficient method for targeted quantificationof lipids and amino acids. Recently, more and more precise MS based lipidomics plat-forms such as LipidyzerTM appeared that quantify metabolites on a better resolutionlevel. In this study, we specified mostly one single PC measured on the fatty acidlevel that is the main constituent of respective (24 of 38) PC sums (lipid species level)measured by AbsoluteIDQTM in human plasma and with metabolite levels of a secondcohort, we replicated 13 and 19 quantitative compositions, respectively, by a directcomparison of factors f or a comparison of measured and imputed concentrations.Thereby, we enable more precise interpretation of scientific results incorporating PCsums, without the necessity of further MS analyses.


CHAPTER 4Results and discussion II: Systems biologymodels for annotation of unknown metabolites
Metabolites with uncharacterized chemical identities measured by non-targeted me-tabolomics often mark dead ends of scientific analyses in metabolomics research.Unknown metabolites cover respective results and cannot be set into a biochemicalcontext. To enable appropriate interpretations and further (e.g. clinical) usage ofrespective results, contained unknown metabolites need to be characterized.I previously published major parts of Chapters 4.2 (data integration), 4.3 (auto-
mated prediction of pathways and reactions), and 4.6 (experimental verification ofcandidates) and minor parts of Chapter 4.5.4 (manual candidate selection) inclu-ding respective materials, methods, and discussion; Quell et al. 2017 [150]. Thiswork is significantly extended by contents of Chapters 4.4 (comparative annotationin different data sets and replication), 4.5 (automated candidate selection), and 4.7(organization of (predicted) metabolite annotations).
4.1 BackgroundAlthough metabolite identification in wet-laboratories is especially successful for char-acterization of selected singular molecules, large sets of unknown metabolites requirehigh-throughput in silico approaches (An overview of current popular methods isprepared in Table 4.1). The most basic approaches compare entire measured MSor MS/MS spectra of unknown metabolites to spectra deposited in public databa-ses [83–85]. Since availability and comparability of fragmentation spectra dependon the measuring device, one of these approaches, MetAssign [86], clusters m/z andintensity of all peaks of measured and target spectra separately and ranks resulting
67

68 Results and discussion II: Annotation of unknown metabolites
Method Comparative FingerID &CSI:FingerID
SIMPLE MetAssign CFM MetFrag compMS2Miner
Meta-MapR
My ap-proach
References Stein et al.1994,Scheubertet al. 2013,Tauten-hahn et al.2012
Heinonenet al. 2012,Shen et al.2014,Dührkop etal. 2015
Nguyenet al.2018
Daly etal. 2014
Allenet al.2015
Ruttkieset al.2016
Edmandset al.2017
Grapovet al.2015
Quell etal. 2017+ ex-tensions
[83–85] [90, 92] [93] [86] [87] [88] [89] [94] [150]Categorysearchingspectrallibraries
yes — — yes — — yes — —
in silico frag-mentation
— — — — yes yes yes — —
machinelearning
— yes yes — yes — — — —
searchingstructureDBs
— yes yes — yes yes — — yes
systemsbiologymodeling
— — — — — — — yes yes
Integratesfrag. spectra yes yes yes yes yes yes yes yes —DB reactions — — — — — — — yes yesDB relations — — — — — — — — yesRT — — — yes — yes yes — yesmet. levels — — — — — — — yes yeschem. FP — yes yes — — — — yes yesDB mets. yes yes yes yes yes yes yes yes yesPredictscandidates yes yes yes yes yes yes yes — yes*bioch. PWs — — — — — — — — yesreactions — — — — — — — — yeschemicalproperties
— yes yes — — — — — —
biochemicalcontext
— — — — — — — yes yes
Table 4.1: Properties of metabolite characterization approachesSelected metabolite characterization approaches are based on spectral libraries, in silicofragmentation, machine learning, structure databases, or systems biology modeling. Mostof the opposed approaches require fragmentation spectra, while reactions or metabolite-generelations, metabolite levels and chemical fingerprints are only rarely used. The biochemicalenvironment (e.g. biochemical pathways or reactions) are predicted by my approach only.*) prediction of specific candidate molecules is restricted to unknown metabolites withmeasured high-resolution mass.

4.1 Background 69
candidates to improve comparability between spectra of different devices.In order to become independent of spectral databases that are focused on specific
measuring techniques or devices, approaches use in silico fragmentation of databasestructures or predict structural properties (e.g. molecular fingerprints) of unknownmetabolites. As an example, CFM (competitive fragmentation modeling) [87] pre-dicts peaks that are most likely observed for chemical structures by a Markov-processthat subsequently estimates the likelihood of possible fragmentation events (fragmen-tation graph). As a result, this method predicts mass spectra given a chemical struc-ture or ranks possible structures of public databases based on an MS/MS spectrum.MetFrag [88] applies in silico fragmentation and calculation of retention times (RTs)to substantiate candidates for unknown metabolites. The compMS2Miner [89] com-bines several methods including in silico reconstruction of fragmentation, noise filtra-tion, substructure annotation by fragmentation spectra and similarities to databasespectra, functional group detection, and nearest neighbor chemical similarity scoring.A significantly different approach is pursued by FingerID [90], CSI:FingerID [91, 92],and SIMPLE [93], which predict molecular fingerprints (e.g. PubChem fingerprint)based on fragmentation spectra of unknown metabolites (in part supported by frag-mentation tree computation) and query structure databases for compounds with si-milar fingerprints (similarity is estimated by the Tanimoto coefficient).As a graph-based tool, the basic concept behind MetMapR [94] is closer to my
approach than the other methods described above: Grapov et al. (2015) started withprior knowledge of biochemical reactions (KEGG RPAIR) to interconnect user de-fined known metabolites. To this network, edges between metabolites with similarPubChem substructure fingerprints are added. Finally, unknown metabolites are at-tached through similarities in pairwise mass spectra, or via empirical (parametricPearson or non-parametric Spearman) correlations determined in measured meta-bolite levels. Although Grapov et al. construct biochemical networks incorporatingunknowns, automated annotation of metabolites is not included.
Overview of the metabolite characterization approach introduced
In this work, I propose a systems biology approach for characterization of unknownmetabolites: By estimation of pairwise partial correlations (Gaussian graphical mo-del (GGM)) between measured metabolite levels, unknown metabolites are directlyincorporated during creation of the network models’ backbone reconstructing bio-chemical pathways. Subsequently, I further extend the network by metabolite-gene

70 Results and discussion II: Annotation of unknown metabolites
associations (mGWAS) and prior biochemical knowledge from public databases. InAddition, I provide modules accessing the constructed network model to transferannotations from known to unknown metabolites, predict pathways, select reactionsthat connect known and unknown metabolites, and choose specific candidate molecu-les (for unknown metabolites with measured high-resolution mass) based on databasestructures that can then be tested experimentally.I applied my approach to unknown metabolites in metabolomics data measured in
blood of 2 279 subjects of SUMMIT [19–23] by the established non-targeted MS plat-form of MetabolonTM that has been widely used for metabolite quantification in largecohorts. To demonstrate the automated candidate selection module, I used unknownmetabolites measured in 1 209 samples of the GCKD cohort by the new non-targetedhigh-resolution platform of MetabolonTM. As a proof of principle, I compared auto-matically generated annotations of 26 unknown metabolites captured by both plat-forms, determined benefits of automated annotations by combing network models ofboth data sets, and tested selected candidates on the LC-MS metabolomics platformfor verification. I finally propose a database structure for organization of known,predicted, or verified information among unknown metabolites to store annotationsdetermined in various data sets, to find consistent or contradictory annotations, andto access annotations for sets of unknown metabolites of future metabolomics studies.A running open source toolbox of this approach including required input files,
sample output files, and instructions is provided in Supplemental File B.1.
4.2 Integration of data from different biological domainsThe network model is the core part of the approach and the basis of analytic andpredictive methods (Figure 4.1). It connects unknown metabolites to complemen-tary functional information from heterogeneous data resources (including data drivenGGMs, associative mGWAS, or data base relations) and allows automated miningof these connections for metabolite identification. As a consequence, edges in thenetwork represent various types of relations, which are integrated into the networkin separate steps using data type specific thresholds (Figure B.2). 637 (388 known,249 unknown) of the 758 metabolites measured by the established MetabolonTM plat-form in 2 279 blood samples of the SUMMIT cohort are connected by 1 040 GGMedges leading to a network model with one large connected component and 17 se-parate sub graphs with a maximum of 7 vertices. Adding genetic associations from

4.2 Integration of data from different biological domains 71
Figure 4.1: Graphical representation of the integrated network modelThe final network model embeds 254 measured unknown metabolites into their biochemicaland functional context. Edge colors indicate the type of connection as follows: GGM (blue),mGWAS (green), functional relation by Recon (red), reaction by Recon (brown). GGMedges are labeled by the mass difference of metabolites and the β is shown for mGWASedges. The shape of nodes indicates the element type: metabolite (oval), gene (diamond)and the border color of nodes indicates if it is a measured metabolite (yellow), a Reconmetabolite (grey), or both (red). Non-connected metabolites and genes are not shown.I previously published a similar version of this figure in Quell et al. 2017; reprinted bypermission from the Journal of Chromatography B [150].
published mGWAS to the network, 186 measured metabolites (136 known, 50 un-known) are linked to 134 genes (169 metabolites directly, 73 metabolites throughratios, and 56 through both). 175 metabolites are connected through a GGM edge aswell as through mGWAS edges via a gene, thus 648 measured metabolites (394 known,254 unknown) of our network model are connected. We then integrated 480 metabo-lites and mapped 139 metabolites and 57 genes of the public database Recon (Vir-

72 Results and discussion II: Annotation of unknown metabolites
tual Metabolic Human Database). 591 of those metabolites are connected through1 152 reactions, of which 343 are functionally related to 57 genes. Only a subset of139 of our measured metabolites in the network could be directly mapped to metabo-lites in Recon. In the final model, 181 unknown metabolites are connected by a GGMedge (171) or via a gene (35) to known metabolites. A graphml file (XML based fileformat for storing graphs; visual representation by publicly available software suchas yEd) of the network model is prepared in Supplemental File B.2.The overall network, which shows a scale-free topology, embeds unknown metaboli-
tes into their biochemical and functional context (Figure 4.1, zoom in) by connectingthem to known metabolites via direct edges (GGM, blue) or indirect edges (mGWAS,green; Recon, red). Thereby metabolites are connected neglecting the compartmen-talization (organ, tissue) of biochemical processes. In contrast to networks aiming ata realistic reconstruction of complete human metabolism for modeling and simula-tion, the network generated in our study is supposed to capture as many functionallinks between metabolites as possible to provide hints for metabolite identificationirrespective of their exchange between compartments or organs.
4.3 Automated workflow-based characterization of unknownmetabolites
The neighborhood of unknown metabolites (consisting of known, annotated metabo-lites) is a common input source for predictions of pathways and reactions. For thisreason, we defined neighborhood of metabolites in the network model (Figure 4.2(a))and demonstrated these modules based on metabolites of SUMMIT that were mea-sured on the established MetabolonTM platform: 171 and 35 unknown metabolitesare neighbors of known metabolites through GGM edges and through common associ-ated genes (mGWAS), respectively; 68 unknown metabolites are neighbors of knownmetabolites, because of an associated or related third metabolite or gene. In total,182 unknown metabolites share 412 neighboring known metabolites. Our modulesfor automated prediction of pathways and reactions prefer data sets with a balancednumber of known and unknown metabolites.

4.3 Automated workflow-based characterization of unknown metabolites 73
GGM GWAS Recon
Unknown 1
Known 2
GeneUnknown 1
Known 3
Gene
Legend Partial correlation
Association (direct or via ratio)
Unknown 1
Known 1
Functional relation
Reaction
Metabolite, measured
Metabolite, database
Δmass = 14
2 → De-hydro- genation14 → Methylation16 → Oxidation
Known 3
Known 1
Unknown 1
Known 2
Known 1
Known Unknown
Unknown 1
Unknown 1
Unknown 1
...
Known 2
Known 3
...
Pathway a
Pathway b Calculateprob. Unknown 1
Pathway b
Collectpairs
Unknown 1
Known 1
...
Filter acc.to Δmass
Methylation
e.g. Cysteine
e.g. Methylcysteine
Known 1
Known 3
Unknown 1
Known 1
Metabolite pair
Unknown 1
(a) Collection of neighboring metaboilte pairsGGM GWAS Recon
Unknown 1
Known 2
GeneUnknown 1
Known 3
Gene
Legend Partial correlation
Association (direct or via ratio)
Unknown 1
Known 1
Functional relation
Reaction
Metabolite, measured
Metabolite, database
Δmass = 14
2 → De-hydro- genation14 → Methylation16 → Oxidation
Known 3
Known 1
Unknown 1
Known 2
Known 1
Known Unknown
Unknown 1
Unknown 1
Unknown 1
...
Known 2
Known 3
...
Pathway a
Pathway b Calculateprob. Unknown 1
Pathway b
Collectpairs
Unknown 1
Known 1
...
Filter acc.to Δmass
Methylation
e.g. Cysteine
e.g. Methylcysteine
Known 1
Known 3
Unknown 1
Known 1
Metabolite pair
Unknown 1
(b) Pathway prediction
GGM GWAS Recon
Unknown 1
Known 2
GeneUnknown 1
Known 3
Gene
Legend Partial correlation
Association (direct or via ratio)
Unknown 1
Known 1
Functional relation
Reaction
Metabolite, measured
Metabolite, database
Δmass = 14
2 → De-hydro- genation14 → Methylation16 → Oxidation
Known 3
Known 1
Unknown 1
Known 2
Known 1
Known Unknown
Unknown 1
Unknown 1
Unknown 1
...
Known 2
Known 3
...
Pathway a
Pathway b Calculateprob. Unknown 1
Pathway b
Collectpairs
Unknown 1
Known 1
...
Filter acc.to Δmass
Methylation
e.g. Cysteine
e.g. Methylcysteine
Known 1
Known 3
Unknown 1
Known 1
Metabolite pair
Unknown 1
(c) Reaction prediction
GGM GWAS Recon
Unknown 1
Known 2
GeneUnknown 1
Known 3
Gene
Legend Partial correlation
Association (direct or via ratio)
Unknown 1
Known 1
Functional relation
Reaction
Metabolite, measured
Metabolite, database
Δmass = 14
2 → De-hydro- genation14 → Methylation16 → Oxidation
Known 3
Known 1
Unknown 1
Known 2
Known 1
Known Unknown
Unknown 1
Unknown 1
Unknown 1
...
Known 2
Known 3
...
Pathway a
Pathway b Calculateprob. Unknown 1
Pathway b
Collectpairs
Unknown 1
Known 1
...
Filter acc.to Δmass
Methylation
e.g. Cysteine
e.g. Methylcysteine
Known 1
Known 3
Unknown 1
Known 1
Metabolite pair
Unknown 1
Figure 4.2: Neighborhood definition and automated annotation schemaFor the prediction of pathways and reactions of unknown metabolites, (a) neighbors of eachmetabolite were collected based on direct partial correlation (GGM) edges, common geneticlinks by mGWAS, or functional connections via a Recon metabolite or gene. The statistics(b), which is calculated among the neighborhood of known metabolites, is applied to eachunknown metabolite to predict the most probable pathway. For the reaction prediction,(c) reactions are assigned to pairs of neighboring metabolites based on their mass difference∆m and a list of typical mass differences that are characteristic for specific reactions. Whilenode labels in the figure indicate unknown or known metabolites known-known neighborsare used for validation of the prediction approach, and unknown-unknown pairs are alsoanalyzed in the reaction prediction. I previously published this figure in Quell et al. 2017;reprinted by permission from the Journal of Chromatography B [150].
4.3.1 Prediction of pathways
Based on known metabolites in the neighborhood of unknown metabolites, we wereable to automatically predict super pathways for 180 and sub pathways for 178 out of183 unknown metabolites that were connected to at least one known metabolite eitherdirectly or indirectly via a gene or a third metabolite (Figure 4.2(b)). To 150 me-tabolites a clear sub pathway was assigned. For further 28 metabolites two (mostlysimilar) sub pathways were suggested. Table 4.2 summarizes the proportion of pre-dicted super and sub pathways per confidence class. In general, unknown metabolitesthat are not well connected or belong to a cluster of other unknown metabolites canbe predicted with only low confidence. From a methods view, the confidence classonly counts for the super pathway prediction, but as shown in Table B.1 the sub

74 Results and discussion II: Annotation of unknown metabolites
pathway prediction behaves similarly. Consequently, the confidence of predicted subpathways increases with a rising confidence of predicted super pathways. A com-plete list of predicted super and sub pathways for unknown metabolites is providedin Table B.2 and the generic output of the annotation workflow is provided in Sup-plemental File B.3. Our approach is able to classify pathways for large amounts ofunknown metabolites automatically.
Confidence Prediction rate [%] Count Count (>1 option)Confidence [%]
label super pathway super pathway sub pathway≥ 97.5 very high 18.3 33 33 (6)≥ 95 high 2.2 4 4 (0)≥ 90 medium 35.0 63 62 (16)≥ 85 low 31.1 56 55 (5)< 85 very low 13.3 24 24 (1)
Table 4.2: Proportion of unknown metabolites with predicted pathwaysPathway prediction on the five confidence levels were determined based on thresholdsamong known metabolites (see Materials and Methods). I previously published this tablein Quell et al. 2017; reprinted by permission from the Journal of Chromatography B [150].
4.3.2 Prediction of reactions
Prediction of reactions, such as methylation, oxidation, hydroxylation, phosphory-lation, carboxylation, or hydrogenation (Table 4.3), between known and unknownmetabolites enables the in silico application of reactions to known metabolites toselect specific candidates for unknown metabolites.We tried the simple approach of assigning reactions to pairs of neighboring metabo-
lites, according to relations in the network model, which we assumed to be connectedby a reaction (Figure 4.2(c)) based on a typical, reaction-specific change in mass.Thereby, we considered all pairs with mass difference ∆mpair within an error intervalof ∆mexpected± 0.3 to compensate for the limited mass resolution in our metabolomicsdata set. As Breitling et al. [148] showed that the accuracy of reaction predictionsignificantly depends on the mass resolution of measuring devices, this interval shouldbe adjusted for platforms with better resolution to allow an improved differentiationof reactions. Table 4.3 shows the number of pairs of known, known/unknown, and un-known metabolites per assigned reaction. In total, we assigned 100 reactions to pairsof unknown and known metabolites. We predicted reactions also between 45 pairs

4.3 Automated workflow-based characterization of unknown metabolites 75
known known unknownReaction ∆mass [Da]
known unknown unknown(Oxidative) deamination 1 31 (23) 6 3(De)hydrogenation 2 79 (53) 15 11(De)methylation or Alkyl-chain-elongation 14 63 (37) 8 9Oxidation, Hydroxylation, or Epoxidation 16 75 (48) 14 4(De)ethylation or Alkyl-chain-elongation 28 64 (37) 5 7Quinone, CH3 to COOH, or Nitro reduction 30 24 (5) 4 1Bis-oxidation 32 24 (3) 9 0(De)acetylation 42 29 (5) 13 2(De)carboxylation 44 26 (10) 13 1Sulfation or Phosphatation 80 or 96 23 (9) 5 4Taurine Conjugation 107 2 (0) 1 1Cys Conjugation 121 or 119 3 (1) 3 1Glucuronidation 176 or 192 10 (4) 3 1GSH Conjugation 307 or 305 0 (0) 1 0∑
assigned reactions 453 (235) 100 45∑neighbors in the network model 5 600 899 223
Table 4.3: Summary of assigned reactions based on ∆mass and neighborshipSelected frequently occurring reactions were assigned to pairs of metabolites (known-known, known-unknown, or unknown-unknown) according to their typical change in mass(∆m± 0.3). The neighborhood definition leads to collection of pairs of metabolites withinthe network model (connected via GGM, mGWAS, or Recon edges). The number in brac-kets in the column of reactions between pairs of neighboring known metabolites indicatesthe number of verified reactions. I previously published this table in Quell et al. 2017;reprinted by permission from the Journal of Chromatography B [150].
of unknown metabolites as it can serve as one element of metabolite characteriza-tion. A complete list of assigned reactions with unknown metabolite is preparedin Table B.3 and Supplemental File B.3 provides the untreated the output of theannotation workflow. During a verification among known metabolites, the assign-ment procedure leads to 58 – 74% correct predictions for reactions with ∆mass lowerthan 30. With 23 true out of 31 assigned (de)amination processes (74%) and 53 trueout of 79 assigned (de)hydrogenation processes (67%), the simplified reaction pre-diction approach worked best for these two types of reactions in our data (Table 4.3).Additionally, we applied a second prediction criterion considering the retention
index (RI) of reactants for the most frequently predicted reaction type, the dehydro-

76 Results and discussion II: Annotation of unknown metabolites
genation reaction. To this end, we used the distribution of differences in RI betweenpairs of known metabolites that are connected by a dehydrogenation reaction com-pared to known metabolites with the same ∆mass but connected via another reaction(Figure B.3). Out of 15 pairs of connected unknown and known metabolites with∆m=2± 0.3 and ∆RI≤ 355.9, we classified 12 pairs to be part of a dehydrogena-tion based on this additional criterion (Table B.4). Beyond that, we also considered11 pairs of unknown metabolites to learn about the relationship among themselves,of which 7 pairs were predicted to be connected by a dehydrogenation.
4.4 Comparative annotation of metabolites measured ondifferent platforms
We had access to a second independent data set of 1 382 metabolite levels (750 known,632 unknown) quantified in 1 209 blood samples of the GCKD cohort by the new non-targeted high-resolution LC-MS platform of MetabolonTM, facilitating comparisonsof independent annotations for unknown metabolites and automatic selection of can-didate molecules.986 of 1 382 metabolites of the GCKD data set with up to 20% missing values
went through the imputation step that is required for estimation of pairwise partialcorrelations (GGM estimation), and were forwarded to the automatic integration andannotation modules described in Chapters 4.2 and 4.3. The resulting network modelcontains 1 032 measured metabolites (550 known, 482 unknown) (note that additio-nal 46 metabolites, not used for GGM generation, were included by the mGWAS),of which 879 metabolites (447 known, 432 unknown) are connected by 1 083 datadriven GGM edges and 396 metabolites (217 known, 179 unknown) are associatedto 435 genes (by 704 metabolite-gene associations; mGWAS). Integration of in-formation from the public database Recon led to 689 metabolites (196 mapped tomeasured metabolites) connected through 665 reactions, and 376 metabolites (inclu-ding 51 measured metabolites) functionally related to 56 genes (609 metabolite-generelations). A subset of 208 measured metabolites could be mapped to compoundsof Recon. In the final network model 1 789 pairs of 282 unknown metabolites arerelated to 647 neighboring known metabolites: 206 unknowns are connected directlyvia a GGM edge, 86 unknowns via an associated gene (mGWAS), and 97 unknownsvia a functionally related and associated third metabolite or gene. A subset of 59 un-known metabolites was measured on both platforms (in the SUMMIT and GCKD

4.4 Comparative annotation of metabolites measured on different platforms 77
cohorts) and mapped by MetabolonTM (Figure 4.3(b)). A visual representation of the
(a) Measured unknowns (b) Predicted pathways
(c) Predicted super pathways (d) Predicted sub pathways
Figure 4.3: Quantities of predicted pathways in SUMMIT and GCKD(a) 59 of 677 mapped unknown molecules (9%) were measured by both MetabolonTMplatforms in SUMMIT (A) and GCKD (B). (b) For 26 of those 59 commonly measuredunknown metabolites (44%) super pathways were independently predicted in both sets.(c) 18 of 26 super pathways (69%) were predicted equally and (d) 6 of 18 sub pathways (withmatching super pathways) were predicted equally and further 10 pathways were predictedsimilarly in both sets.
resulting network model is prepared in Supplemental File B.4. 1 682 of 1 965 nodesare connected in one large coherent scale-free structure. The remaining 283 nodesbelong to 77 components of 2 to 17 nodes without links to the main network.
4.4.1 Comparison of separately performed annotations
Our automated approach annotates 273 and 270 unknown metabolites with super(Table B.5) and sub pathways (Table B.6), respectively (Figure 4.4(d)). According to

78 Results and discussion II: Annotation of unknown metabolites
(a) SUMMIT (b) SUMMIT & GCKD(merged predictions)
(c) SUMMIT & GCKD(merged sets)
(d) GCKD
Super pathways: � amino acid, � carbohydrate, � cofactors and vitamins,� energy, � lipid, � nucleotide, � peptide, � xenobiotics
Figure 4.4: Composition of predicted super pathways in SUMMIT and GCKDThe composition of predicted super pathways varies in both sets: (a) SUMMIT and(d) GCKD. (b) 18 of 26 super pathways were predicted equally in both sets consistsof amino acids, lipids, and xenobiotics. (c) If the data sets were merged before data inte-gration, pathways for 16 additional unknown metabolites were predicted.
∆mass (± 0.05) of neighboring metabolites (cf. Figure 4.2(a)), reactions were selectedfor 297 unknown metabolites to 210 known and 352 unknown metabolites. Thesecond filtering criterion (based on ∆RI) was passed by 56 of 90 cases leading to theprediction of dehydrogenation reactions. Described annotations are summarized inthe generic workflow output in Supplemental File B.5.We compared annotations of 59 of 677 unknown metabolites that were measured
by both platforms in SUMMIT and GCKD (Figure 4.3(a&b) and Table B.5). Asubset of 26 of these unknown metabolites carry predicted super pathways in bothdata sets (Table 4.4), of which 18 annotations (69%) match (Figure 4.3(c)). Matchingsuper pathways consist of 7 amino acids, 7 lipids, and 4 xenobiotics (Figure 4.4(b)).Noting, that in both sets the a priori probabilities of super pathways among knownmetabolites varies clearly. While most frequent super pathways of SUMMIT includelipids (38%), amino acids (23%), xenobiotics (12%), and peptides (11%), metaboli-tes of GCKD are primarily classified as amino acid (41%), lipid (25%), or xenobio-tics (23%) (Figure 4.4(a&d)). If equal and similar (cf. definition in Chapter 2.2.7)annotations are considered jointly, the numbers of predicted super pathways corre-spond to those of 16 of 24 matching (67%) predicted sub pathways (Figure 4.3(d)).

4.4 Comparative annotation of metabolites measured on different platforms 79
Metabolite SUMMIT GCKD EqualX-12093 amino acid amino acid e / eX-12511 amino acid amino acid e / eX-13835 amino acid amino acid e / eX-11334 amino acid amino acid e / sX-11787 amino acid amino acid e / sX-15461 amino acid amino acid e / sX-12704 amino acid amino acid e / –X-16071 amino acid lipid dX-12543 amino acid xenobiotics dX-14095 amino acid xenobiotics dX-17685 amino acid xenobiotics dX-14056 cofactors and vitamins amino acid dX-11440 lipid lipid e / sX-11470 lipid lipid e / sX-11540 lipid lipid e / sX-13866 lipid lipid e / sX-14662 lipid lipid e / sX-16654 lipid lipid e / sX-14626 lipid lipid e / dX-02249 lipid amino acid dX-15492 lipid energy dX-12730 xenobiotics xenobiotics e / eX-12847 xenobiotics xenobiotics e / eX-13728 xenobiotics xenobiotics e / eX-15728 xenobiotics xenobiotics e / sX-15497 xenobiotics lipid d
Table 4.4: Super pathways predicted commonly in SUMMIT and GCKDFor 26 unknown metabolites, super and sub pathways were independently predicted basedon both cohorts: SUMMIT and GCKD. The last column indicates, if super/sub pathwayswere predicted equally (e), differently (d), similarly (s), or not predicted (–). Entries areordered by predicted super pathways and evaluation of sub pathways.
4.4.2 Benefit of annotations within merged sets
Since a subset of 227 metabolites (168 known, 59 unknown) was measured in SUMMITas well as in GCKD, we analyzed if automatically generated annotations profit frommerging two data sets of different MetabolonTM platforms. To this end, we united themetabolite sets of SUMMIT, GCKD, and Recon and integrated data driven GGMssuccessively. Note that partial correlations of both sets were estimated separatelyto prevent biases resulting from different non-targeted measuring platforms. Dataintegration and annotation of unknown metabolites was performed by the workflowas described in Chapter 4.2.

80 Results and discussion II: Annotation of unknown metabolites
The resulting network model (graph in Supplemental File B.6) contains 1 431 mea-sured metabolites (754 known, 677 unknown): 2 043 GGM edges connect 1 314 me-tabolites (686 known, 628 unknown) and a subset of 547 metabolites (324 known,223 unknown) is associated to 529 genes (978 mGWAS edges). In addition, 831 data-base-metabolites (222 measured) are connected by 847 reactions of Recon. Finally,484 database-metabolites (71 measured) are functionally related to 95 genes (842 me-tabolite-gene relations). In the resulting network model that consists of one largecoherent structure (2 420 nodes) and 66 encapsulated components of 2 to 8 nodes(200 nodes in total) with no connection to the main network, 443 unknown me-tabolites are connected to 887 known metabolites by 2 811 neighborship relations:359 unknowns via GGM edges, 130 unknowns through a common associated gene(mGWAS), and 173 unknowns over a common gene or third metabolite of Reconthat is associated or functionally related.The automatic annotation modules led to the prediction of 435 super and 434 sub
pathways for unknown metabolites (Tables B.5, and B.6). In addition, 782 reactionswere selected (based on ∆mass ± 0.3 according to the mass resolution of the olderplatform) for 384 unknown metabolites, of which 76 of 121 dehydrogenation reactionspassed the more specific ∆RI criterion. Raw annotations are prepared SupplementalFile B.7.We compared pathway annotations of three sets: SUMMIT/GCKD (merged set),
SUMMIT, and GCKD. Our special interest was on 51 of 59 unknown metabolites thatcarry pathway annotations and were mapped in both sets. For 427 of 677 unknownmetabolites, pathways were predicted in at least two of the three sets (Figure 4.5(a)and Table B.5). Only 26 unknown metabolites had super pathway predictions in allthree sets, of which 17 predictions were matching: 6 amino acid, 7 lipids, and 4 xe-nobiotics (Figure 4.5(a&b) and Table 4.5). The remaining 9 predictions are equalin two of the three sets. Matching pathways are primarily among the most frequentpathways of both cohorts: amino acids, lipids, xenobiotics (Figure 4.4(a&d)). Re-spective predictions of sub pathways match in 6 and 18 cases in all three or in twosets, respectively (Table B.7). The remaining two cases had no sub pathway pre-diction in one set. In total, 407 (95%) super and 377 (88%) of 427 sub pathwaysthat were predicted in two of the three sets match (Figure 4.5(b& c) and Tables B.5and B.6). Further 29 predicted sub pathways are similar, in two sets.

4.4 Comparative annotation of metabolites measured on different platforms 81
Metabolite SUMMIT/GCKD SUMMIT GCKD EqualX-11334 amino acid amino acid amino acid e / e / eX-11787 amino acid amino acid amino acid e / e / eX-12093 amino acid amino acid amino acid e / e / eX-12511 amino acid amino acid amino acid e / e / eX-13835 amino acid amino acid amino acid e / e / eX-15461 amino acid amino acid amino acid e / e / eX-14314 amino acid — amino acid – / – / eX-14095 amino acid amino acid xenobiotics d / e / dX-14056 amino acid cofactors and vitamins amino acid d / d / eX-01911 amino acid cofactors and vitamins — – / d / –X-14302 amino acid peptide — – / d / –X-12007 carbohydrate carbohydrate — – / e / –X-12206 cofactors and vitamins cofactors and vitamins — – / e / –X-17162 cofactors and vitamins cofactors and vitamins — – / e / –X-15492 energy lipid energy d / d / eX-11440 lipid lipid lipid e / e / eX-11470 lipid lipid lipid e / e / eX-11540 lipid lipid lipid e / e / eX-13866 lipid lipid lipid e / e / eX-14626 lipid lipid lipid e / e / eX-14662 lipid lipid lipid e / e / eX-16654 lipid lipid lipid e / e / eX-16947 lipid lipid — – / e / –X-17299 lipid lipid — – / e / –X-17438 lipid lipid — – / e / –X-12822 lipid — lipid – / – / eX-12846 lipid — lipid – / – / eX-12860 lipid — lipid – / – / eX-15486 lipid — lipid – / – / eX-02249 lipid lipid amino acid d / e / dX-16071 lipid amino acid lipid d / d / eX-15497 lipid xenobiotics lipid d / d / eX-11429 nucleotide nucleotide — – / e / –X-12844 nucleotide nucleotide — – / e / –X-12216 peptide amino acid — – / d / –X-12730 xenobiotics xenobiotics xenobiotics e / e / eX-12847 xenobiotics xenobiotics xenobiotics e / e / eX-13728 xenobiotics xenobiotics xenobiotics e / e / eX-15728 xenobiotics xenobiotics xenobiotics e / e / eX-11452 xenobiotics xenobiotics — – / e / –X-12230 xenobiotics xenobiotics — – / e / –X-12231 xenobiotics xenobiotics — – / e / –X-12329 xenobiotics xenobiotics — – / e / –X-12407 xenobiotics xenobiotics — – / e / –X-12830 xenobiotics xenobiotics — – / e / –X-17185 xenobiotics xenobiotics — – / e / –

82 Results and discussion II: Annotation of unknown metabolites
Table continued (p. 2 / 2)Metabolite SUMMIT/GCKD SUMMIT GCKD EqualX-09789 xenobiotics — xenobiotics – / – / eX-12212 xenobiotics — xenobiotics – / – / eX-12543 xenobiotics amino acid xenobiotics d / d / eX-17685 xenobiotics amino acid xenobiotics d / d / eX-12704 xenobiotics amino acid amino acid d / d / d
Table 4.5: Super pathways predicted in merged sets of SUMMIT and GCKDSuper pathways were predicted for 51 of 59 unknown metabolites that are measuredin SUMMIT and in GCKD. The last column indicates, if super pathways were pre-dicted equally (e) or differently (d): in SUMMIT/GCKD, SUMMIT, and GCKD; inSUMMIT/GCKD and SUMMIT; in SUMMIT/GCKD and GCKD; or if there is not pre-diction (–). Respective sub pathway predictions are prepared in Table B.7. Entries areordered by super pathways predicted in SUMMIT/GCKD and by number of equally pre-dicted pathways.
Interestingly, we found that super and sub pathways to additional 8 unknownmetabolites (2 unknowns of SUMMIT and 6 unknowns of GCKD) were only predictedin the merged set, SUMMIT/GCKD (Figure 4.5(a)): 5 lipids, 1 energy, 1 peptide,and 1 xenobiotics (Table 4.6). Merging both data sets enables annotations for those
(a) Predicted pathways (b) Equally predicted super pw (c) Equally predicted sub pw
Figure 4.5: Quantities of commonly predicted pathways in SUMMIT and GCKD(a) Proportion of unknown metabolites with predictions of super pathways in SUMMIT (A),GCKD (B) and SUMMIT/GCKD (C) sets. 26 unknown metabolites (4%) have predictedpathways in all sets, A, B, and C, and further 8 unknown metabolites (1.2%) have predicti-ons only in the merged set C. (b and c) 427 of 677 unknown metabolites carry predictedpathways in at least two sets. In A and C, or in B and C large fractions of predicted superand sub pathways are equal.
unknown metabolites, if: (i) an unknown metabolite is measured in data set A only;(ii) but is not connected to a known metabolite in data set A; (iii) however, the

4.5 Automated selection of candidate molecules 83
Metabolite Predicted super pathway Predicted sub pathway Measured inX-06227 energy oxidative phosphorylation SUMMITX-13431 lipid carnitine metabolism GCKDX-21846 lipid carnitine metabolism GCKDX-24798 lipid carnitine metabolism GCKDX-17705 lipid sterol/steroid GCKDX-24348 lipid sterol/steroid GCKDX-24834 peptide fibrinogen cleavage peptide GCKDX-12092 xenobiotics chemical SUMMIT
Table 4.6: Pathways predicted in only in the merged set of SUMMIT and GCKDSuper and sub pathways of 8 unknown metabolites were only predicted in the merged dataset SUMMIT/GCKD, but not within the individual sets. Entries are sorted by the predictedsuper and sub pathways.
unknown shares a commonly associated gene with a known metabolite of data set B;(iv) which leads to neighboring unknown and known metabolites across both sets,A and B: e.g. X-24834 is only measured in the GCKD set and is associated to twogenes, ‘FUT2’ and ‘ABO’, located in a subnetwork of three nodes with no connectionto the main network (Figure B.4(a)). In the network model of SUMMIT, these genes‘FUT2’ and ‘ABO’ are associated to 4 di- or poly-peptides (directly or via metaboliteratios): leucylalanine, ADpSGEGDFXAEGGGVR, ADSGEGDFXAEGGGVR, andDSGEGDFXAEGGGVR (Figure B.4(b)). Consequently, the unknown metabolite,X-24834, is neighbor of these known metabolites in the merged set, SUMMIT/GCKD,and annotated as peptide (Figure B.4(c) and Table 4.6).
4.5 Automated selection of candidate moleculesThe availability of 1 382 metabolite levels (750 known, 632 unknown) measured by ahigh-resolution LC-MS platform of MetabolonTM within 1 209 samples of the GCKDcohort enables more specific annotations and allows the automatic selection of possi-ble candidate molecules among a pool of database-structures. We used molecules ofRecon and HMDB to generate a suitable pool of structures.As a pilot study for the following automated selection of candidate molecules, we
searched HMDB [71] by the measured mass (m/z ± 0.01 (high-resolution platform),or ± 0.3 (established platform)) and examined the plausibility of the structure in thebiochemical context of the network model. This procedure yields selection of 36 spe-cific candidate molecules for 33 unknown metabolites based on HMDB (Table B.8).

84 Results and discussion II: Annotation of unknown metabolites
One of these candidates, dimethyl-lysine for X-24983, was confirmed in the meantimeby MetabolonTM for proof of concept.
4.5.1 Automated procedure
To receive a large number of neighboring known metabolites for the set of high-resolution unknowns, we used the network model of Chapter 4.4.2 that integrates datadriven information from SUMMIT and GCKD, published associations of KORA F4,and functional relations of Recon. The final network model contains 1 431 metabo-lites (754 known, 677 unknown) and 529 genes. 443 of 677 unknown metabolitesshare 756 neighboring known metabolites (according to neighborhood definition, Fi-gure 4.2(a)). The subset of 315 unknown metabolites that were measured on thehigh-resolution device and were connected to known metabolites in the network mo-del went through our three steps of the automated candidate selection procedure:pre-selection according to ∆mass, estimation of structural similarity, and filtering ofcandidates passing a (similarity-) cutoff (Figure 4.6).
Automated selection of candidate molecules
Legend Pairs of db metabolite xi and known metabolites
Metabolite, measured
Metabolite, database & possibly measured
Unknown Candidate Evidence
Unknown 1 Metabolite 1 Neighbor of Known 1 (MCS Tanimoto = 0.85, ...)
Unknown 1 Metabolite 3 Neighbor of Known 2 (MCS Overlap = 0.99, ...)
... ... ...
Selectcandidates
acc. to cutoffs
Metabolite neighbors
Pairs of unknown & db metabolites
Database
Metabolite 1Metabolite 2Metabolite 3
...
Determine pairwise coefficients
- Fingerprint Tanimoto - MCS Tanimoto - MCS Overlap
Known ...
Known 2
Known 1
Unknown 1
Preselection
Δmass ≤ 0.05
Figure 4.6: Schema of automated selection of candidate moleculesThe preselection of potential candidate molecules is performed by a database search(∆mass≤ 0.05) using the high-resolution mass of unknown molecules. In a second stepthe fingerprint Tanimoto, MCS Tanimoto and MCS Overlap coefficients of the chemicalstructures of pairwise neighboring known and potential candidate metabolites were esti-mated. Resulting candidate molecules were selected according to empirical determinedcutoffs.

4.5 Automated selection of candidate molecules 85
The approach follows the observation that neighboring metabolites of the net-work model are structurally more similar (fingerprint or maximum common sub-structure (MCS)) than random pairs (Figure 4.7). After searching public metabolicdatabases, such as HMDB or Recon by the measured mass of unknown metabolites(∆mass≤ 0.05) to pre-select possible database candidates, the chemical structures ofpairs of pre-selected candidate molecules and known metabolites that are neighbors ofthe respective unknown metabolite are compared by three similarity measures: finger-print Tanimoto, MCS Tanimoto, and MCS overlap coefficients. Candidate moleculeswith at least one similarity coefficient above an empirically determined threshold areselected.
4.5.2 Parameter optimization and performance
For each similarity measure, individual thresholds were determined during a 10-foldcross-validation among 623 known metabolites and 1 995 compounds of Recon. Dur-ing the first fold means of the coefficient distributions of neighboring versus randompairs of known metabolites weighted by their interquartile ranges were estimatedand used as first threshold: WMfingerprint Tanimoto=0.74, WMMCS Tanimoto
=0.66
●
●
●
●
●
●●●
●●●
●
●
●●
●
●
●
●●
●
●
●
●
●●
●
●
●
●
●
●
random pairs neighbors
0.0
0.2
0.4
0.6
0.8
1.0
Max Tanimoto coefficient of finger prints
Molecules
Tani
mot
o co
effic
ient weighted
mean =0.74
cutoff =0.58
t test pv=6.8e−102, TP=398, TN=1157, FP=890, FN=56
other correct
0.0
0.2
0.4
0.6
0.8
1.0
Median Tanimoto coefficient of finger prints
Molecule
Tani
mot
o co
effic
ient
weightedmean =
0.47
cutoff =0.58
t test pv=2.7e−48, TP=238, TN=1689, FP=358, FN=216
(a) Fingerprint Tanimoto
●
●
●
●●●
●●●●●●
0.0
0.2
0.4
0.6
0.8
1.0
Max Tanimoto coefficient of MCS (au=bu=0)
Molecules
Tani
mot
o co
effic
ient
weightedmean =
0.66
cutoff =0.66
t test pv=1.9e−79, TP=339, TN=1490, FP=557, FN=115
●
●
●●●●●●●●
●
●●●●
●
●
●
●●
●●●
●
●
●●
●
●●●
●
●
●
●
●●
other correct
0.0
0.2
0.4
0.6
0.8
1.0
Median Tanimoto coefficient of MCS (au=bu=0)
Molecule
Tani
mot
o co
effic
ient
weightedmean =
0.41
cutoff =0.66
t test pv=1.1e−38, TP=132, TN=1903, FP=144, FN=322
random pairs neighbors
(b) MCS Tanimoto
●
●
●
●
●
●●●●●
●●
●
●
●●
●
●
●
●
●
●
●●
●
●
●
●●●●●
●
●
●●
●
●
●
●
●●●
●
●●●
●
●
●
●
●
0.0
0.2
0.4
0.6
0.8
1.0
Max Overlap coefficient of MCS (au=bu=0)
Molecules
Ove
rlap
coef
ficie
nt
weightedmean =
0.91
cutoff =0.9
t test pv=4.8e−86, TP=348, TN=1502, FP=545, FN=106
●
●●●●
●●
●
●
●
●
●
●●
●
●
●●
●
other correct
0.0
0.2
0.4
0.6
0.8
1.0
Median Overlap coefficient of MCS (au=bu=0)
Molecule
Ove
rlap
coef
ficie
nt
weightedmean =
0.71
cutoff =0.9
t test pv=2.2e−49, TP=140, TN=1912, FP=135, FN=314
random pairs neighbors
(c) MCS Overlap
Figure 4.7: Distributions of coefficients during cross-validationThe maximum of fingerprint Tanimoto, MCS Tanimoto, and MCS overlap coefficientsper metabolite of the test set and preselected database metabolites (Recon) show largedifferences for the neighboring metabolites respective random pairs. The blue lines indicatedetermined cutoffs according to version 2 (sensitivity weighted three-fold and specificityweighted once).

86 Results and discussion II: Annotation of unknown metabolites
and WMMCS overlap=0.91 (Figure 4.7). Thresholds were systematically optimized
over the following nine folds to maximize sensitivity and specificity (Table 4.7 andTable B.9). While specificity was weighted once, sensitivity was weighted twice (ver-
Var. Fingerp. Tanimoto MCS Tanimoto MCS Overlap Sensitivity Specificity Rate Freq. Correct1 0.68 0.66 0.9 0.86 0.62 67% 2.8 93%2 0.58 0.66 0.9 0.89 0.55 69% 3.1 94%
Table 4.7: Empirically determined cutoffs for automated candidate selectionTo determine cutoffs of variant 1 during the cross-validation sensitivity was weighted twiceand of variant 2 sensitivity was weighted three-fold, while specificity was weighted once.Rate is the proportion of metabolites with at least one selected candidate molecule, followedby the average number of candidates per metabolite and the proportion of cases containingthe correct candidate.
sion 1) or three-fold (version 2). Parameter version 2 was maintained for followinganalyzes, because of an increased sensitivity and prediction rate, and still a reaso-nable number of selected candidates (Figure 4.8). The optimized parameter setting
Number of selected candidates per molecule
Fre
quen
cy [m
olec
ules
]
0 2 4 6 8 10 12
050
100
150
200
(a) Parameter variant 1
Number of selected candidates per molecule
Fre
quen
cy [m
olec
ules
]
0 5 10 15
050
100
150
200
(b) Parameter variant 2
Figure 4.8: Number of selected candidates per molecule during validationBoth parameter variants lead to the selection of a maximum of four candidates for mostmolecules. These numbers strongly depend on the size and composition of the selectionpool that contained 1 995 metabolites of MetabolonTM or Recon.
of 0.58, 0.66, and 0.9 for fingerprint Tanimoto, MCS Tanimoto, and MCS overlap,respectively, (version 2) leads to a sensitivity of 89% and a specificity of 55%.During the cross-validation among known metabolites 1 348 candidate molecu-
les were automatically selected for 431 metabolites, corresponding to an average of

4.5 Automated selection of candidate molecules 87
3.1 candidates for 69% of the compounds of the test sets. In 404 of 431 (93.7%) cases,the correct structure was in the set of automatically selected candidates.
4.5.3 Automatically selected candidates
During the first step of the automated procedure, we searched with measured massesof 282 (out of 315) unknown high-resolution metabolites that were connected toknown metabolites with available structural information (fingerprint or molecularstructure) in 1 995 compounds of Recon and 112 770 compounds of HMDB, and re-ceived 255 and 7 243 pre-selected candidate molecules for 132 and 274 unknown me-tabolites, respectively. After estimation of pairwise structural similarity (fingerprintTanimoto, MCS Tanimoto, and MCS overlap scores) and filtering of the second andthird step, 67 and 609 candidate molecules were automatically selected for 45 and126 unknown metabolites based on Recon (Table 4.8, including evidences Table B.10)and HMDB (Table B.11 and Supplemental File B.8), respectively. In median, onecandidate was selected per unknown metabolite within Recon and two candidatesper unknown metabolite within HMDB (Figure 4.9). The maximum number of can-didates per unknown metabolite is four for Recon and 106 for HMDB. Normalized
Number of selected candidates per unknown
Fre
quen
cy
0 1 2 3 4
05
1015
2025
(a) Selection within Recon
Number of selected candidates per unknown
Fre
quen
cy
0 5 10 15 20
020
4060
(b) Selection within HMDB
Figure 4.9: Number of selected candidates per unknown metabolite67 (a) and 609 (b) candidates for 45 and 126 unknown metabolites have been automaticallyselected within 1 995 compounds Recon and 112 770 additional compounds of HMDB,respectively. For the majority of unknowns, one to two candidates were selected based onRecon and one to six candidates were selected based on HMDB. In the second case threesingle unknowns with 30, 40 and 106 candidates were clipped for plotting.

88 Results and discussion II: Annotation of unknown metabolites
Unknown Candidate PubChem CID ∆Mass MFTC MSTC MSOCX-02249 Benzo[a]pyrene-4,5-oxide 37786 0.0351 0.64* 0.48 0.85
Benzo[a]pyrene-9,10-oxide 37456 0.0351 0.64* 0.47 0.77X-11261 octenoyl carnitine 53481667 0.0068 0.61* 0.5 0.91*X-11478 Perillic acid 1256 0.0073 0.61* 0.53 0.75
(4-hydroxy-3-methoxyphenyl)acetaldehyde 151276 0.0291 0.6* 0.53 0.73X-11787 L-4-hydroxyglutamic semialdehyde 25201126 0.0436 0.62* 0.64 0.9*X-12093 L-alanyl-L-leucine 6992388 0.0071 0.94* 0.86* 1*X-12100 5-hydroxy-L-tryptophan 439280 0.0071 0.67* 0.33 0.58X-12170 trans-caffeate 689043 0.0185 0.58* 0.65 0.85
3-Hydroxykynurenamine 440736 0.0291 0.84* 0.65 0.855-Hydroxykynurenamine 164719 0.0291 0.79* 0.56 0.77adrenochrome o-semiquinone 10313383 0.0053 0.61* 0.5 0.69
X-12543 3-Methoxy-4-hydroxyphenylglycolaldehyde 440729 0.0069 0.77* 0.62 0.77X-12688 L-alanyl-L-leucine 6992388 0.0073 0.69* 0.5 0.8X-12860 glutaryl carnitine 53481622 0.0432 0.87* 0.85* 1*X-13684 3-mercaptolactate-cysteine disulfide 193536 0.0068 0.73* 0.5 1*X-13866 N-Ribosylnicotinamide 439924 0.018 0.66* 0.3 0.58X-15497 fructoseglycine 3081391 0.0081 0.61* 0.5 0.69
salsoline-1-carboxylate 320322 0.0071 0.61* 0.58 0.85X-15503 dopachrome o-semiquinone 53481550 0.0309 0.62* 0.65 0.79X-16071 6-amino-2-oxohexanoic acid 439954 0.0284 0.59* 0.56 0.9*
L-allysine 207 0.0284 0.63* 0.47 0.82-oxoglutaramate 48 0.008 0.6* 0.53 0.9*
X-16563 2-acetamido-5-oxopentanoate 192878 0.0295 0.83* 0.71* 1*X-17323 16-hydroxypalmitate 7058075 0.0422 0.64* 0.32 0.58X-18888 2-keto-3-deoxy-D-glycero-D-galactononic acid 22833524 0.0446 0.79* 0.57 0.8X-21831 12-oxo-20-carboxy-leukotriene B4 53481457 0.021 0.7* 0.32 0.82X-22158 hexanoyl carnitine 6426853 0.0068 1* 1* 1*X-22379 5alpha-Dihydrotestosterone glucuronide 44263365 0.0063 0.96* 0.78* 0.88
androsterone 3-glucosiduronic acid 114833 0.0063 1* 1* 1*X-22836 6-amino-2-oxohexanoic acid 439954 0.0073 0.59* 0.5 0.7
L-allysine 207 0.0073 0.64* 0.62 0.8X-23196 5-L-Glutamyl-L-alanine 440103 0.0177 0.94* 0.6 0.8
gama-L-glutamyl-L-alanine 11183554 0.0177 0.94* 0.6 0.8L-leucyl-L-serine 40489070 0.0187 0.73* 0.6 0.8N-acetylserotonin 903 0.0025 0.79* 0.48 0.69
X-23423 2-Amino-3-oxoadipate 440714 0.0289 0.65* 0.56 0.75X-23581 1-piperideine-6-carboxylate 45266761 0.0073 0.57 0.67* 0.89X-23583 D-proline 8988 0.0074 0.61* 0.6 0.75
acetamidopropanal 5460495 0.0074 0.62* 0.45 0.62X-23593 N-(omega)-Hydroxyarginine 440849 0.0043 0.61* 0.43 0.69X-23647 Glycylproline 79101 0.0294 0.79* 0.75* 1*
L-Prolinylglycine 6426709 0.0294 0.74* 0.75* 1*X-23747 N1,N8-diacetylspermidine 389613 0.0074 0.98* 0.71* 1*X-23776 6-amino-2-oxohexanoic acid 439954 0.0435 0.61* 0.67* 0.8
L-allysine 207 0.0435 0.66* 0.67* 0.8

4.5 Automated selection of candidate molecules 89
Table continued (p. 2 / 2)Unknown Candidate PubChem CID ∆Mass MFTC MSTC MSOCX-24330 Porphobilinogen 1021 0.0187 0.42 0.42 1*X-24339 Xanthosine 5’-phosphate 73323 0.0336 0.94* 0.73* 0.92*X-24361 16-Glucuronide-estriol 122281 0.0291 0.63* 0.65 0.79
testosterone 3-glucosiduronic acid 108192 0.0073 0.84* 0.74* 0.85X-24410 D-proline 8988 0.0072 0.62* 0.7* 0.88
acetamidopropanal 5460495 0.0072 0.67* 0.67* 0.86X-24411 D-proline 8988 0.0072 0.62* 0.64 0.88
acetamidopropanal 5460495 0.0072 0.63* 0.5 0.75X-24417 16-Glucuronide-estriol 122281 0.0287 0.63* 0.65 0.79
testosterone 3-glucosiduronic acid 108192 0.0077 0.84* 0.74* 0.85X-24452 3-Hydroxy-N6,N6,N6-trimethyl-L-lysine 439460 0.0071 0.81* 0.93* 1*X-24455 N-acetyl-5-methoxykynuramine 390658 0.0294 0.71* 0.52 0.8
N-formyl-L-kynurenine 910 0.007 1* 1* 1*X-24498 cis-beta-D-Glucosyl-2-hydroxycinnamate 5316113 0.0078 0.64* 0.27 0.53X-24514 putreanine 53477800 0.044 0.59* 0.35 0.55X-24736 Glycylleucine 92843 0.0184 0.71* 0.5 0.73
Leucylglycine 97364 0.0184 0.68* 0.41 0.64X-24766 L-3-Cyanoalanine 439742 0.0437 0.76* 0.7* 0.88X-24798 4-hydroxy-2-nonenal 5283344 0.0074 0.23 0.15 0.91*X-24860 Biotin 171548 0.0466 0.58* 0.41 0.75X-24983 D-argininium(1+) 71070 0.032 0.6* 0.57 0.8
Table 4.8: Selected candidate molecules based on Recon67 candidate molecules have been automatically selected for 45 unknown metabolites basedon fingerprint or structural similarity to neighboring known metabolites within the Recondatabase. The last three columns contain the maximum values of the fingerprint Tanimotocoefficient (MFTC), structure Tanimoto coefficient (MSTC), or structure overlap coefficient(MSOC) across pairs of the candidate molecule and known neighbors of the unknown me-tabolite. An asterisk indicates whether values are beyond the threshold. Detailed evidenceinformation with names of neighboring known metabolites for each unknown metabolite areprovided in Table B.10.
against the database sizes 3.4% of all Recon compounds and 0.5% of all HMDBcompounds were selected as candidates.Within compounds of Recon, 40 of 67 candidates passed the threshold of the fin-
gerprint Tanimoto coefficient solely, and further 24 candidates additionally passedthe thresholds of MCS Tanimoto or MCS overlap (Figure 4.10(a) and Table 4.8). 11of those candidates passed the thresholds of all coefficients. In case of HMDB 548 of609 candidates were selected by the MCS overlap criterion (Figure 4.10(b)). 151 ofthose and 61 further candidates were in addition or solely selected based on the MCSTanimoto criterion. In this demonstration no HMDB-candidate was selected based

90 Results and discussion II: Annotation of unknown metabolites
on the fingerprint Tanimoto coefficient, since fingerprints were not available for thesemolecules. However, molecular structures can be used to calculate fingerprints. Intotal, 676 candidate molecules were automatically selected for 139 unknown metabo-lites.
1 28
115
40
Fingerprint Tanimoto
MCS Tanimoto MCS Overlap
(a) Selection within Recon
0 6100 151
397
MCS Overlap
Fingerprint Tanimoto MCS Tanimoto
(b) Selection within HMDB
Figure 4.10: Number of selected candidates per selection criterionCandidates were selected, if at least one of the selection criteria based on the fingerprintTanimoto, MCS Tanimoto, or MCS Overlap coefficients were beyond the specific cutoffs.(a) 40 of 67 candidates within the Recon Database were selected solely and further 24 candi-dates in combination based on the fingerprint Tanimoto coefficient. 11 of those candidatespassed the selection cutoff of all three criteria. (b) Within HMDB most candidates wereselected based on the MCS overlap and MCS Tanimoto coefficients, since PubChem fin-gerprints were not available for most HMDB compounds.
4.5.4 Computer aided manual candidate selection
In cases, where unknown metabolites were not measured on a high-resolution plat-form, or where the candidate pool did not contain a suitable structure, automatedannotations (of pathways, reactions, and the biochemical context) may assist manualselection of candidate molecules. Here, we were first focused on automated anno-tations, especially containing predictions of dehydrogenation (/reduction) reactions(passing ∆mass and ∆RI criteria) for unknown metabolites measured by the es-tablished MetabolonTM platform in samples of SUMMIT to select most promisingcandidates. As an example, super pathway ‘lipid’ and sub pathway ‘fatty acid, dicar-boxylate’ were predicted for the unknown metabolite X-13891 based on the networkmodel. In addition, our automated procedure assigns a dehydrogenation/ reductionreaction (passing the ∆mass and ∆RI criteria) to the unknown metabolite and theneighbor dodecanedioic acid. Applying probable changes on the structure of dodeca-nedioic acid incorporating predicted information leads to the release of two hydrogen

4.5 Automated selection of candidate molecules 91
atoms in the carbon-strand and formation of a double bond: dodecenedioic acid(Figure 4.11). While positioning the double bound, 5 specific candidate molecu-
Figure 4.11: Neighboring metabolites of X-13891Predicted super and sub pathways and predicted reactions with neighboring metaboliteslead to the candidate molecule dodecenedioic acid. This candidate (with a certain doublebound position) was experimentally verified later on. Multiple reactions, e.g. methylation+ reduction, were added manually. Information in ‘<>’ was predicted.
les were selected for X-13891 (Table 4.9). Further exemplary candidate selection (forunknown metabolites X-11905 and X-11583) incorporating predicted annotations, re-actions, and neighborships is prepared in Figure B.5. In total, we manually selected39 candidate structures for 5 unknown metabolites (classified as lipid (fatty acid: di-carboxylate, medium chain, long chain) with a predicted dehydrogenation reaction),based on these principles (Table 4.9). The double bond cannot be determined byour approach alone as we do not use any information from fragmentation spectra.Thus, after exclusion of candidate structures that are measured as known metabo-lites on our metabolomics platform, 5 – 12 molecules remained as candidates for the5 unknown metabolites. For 4 out of 5 candidates, at least one molecule was com-mercially available. We tested these candidate molecules by LC-MS for experimentalverification (Chapter 4.6).

92 Results and discussion II: Annotation of unknown metabolites
Super SubMetabolite
pathway pathwayReaction Reactant Candidate molecules
X-13891 Lipid Fatty acid,dicarboxylate
dehydro-genation
dodecanedioicacid
2-dodecenedioic acid *, 3-dodecenedioic acid,4-dodecenedioic acid, 5-dodecenedioic acid,6-dodecenedioic acid
X-13069 Lipid Long chainfatty acid
dehydro-genation
5,8-tetradeca-dienoate
2-tetradecenoic acid, 3-tetradecenoic acid,4-tetradecenoic acid, 5-tetradecenoic acid,6-tetradecenoic acid, 7-tetradecenoic acid,8-tetradecenoic acid, 9-tetradecenoic acid *,10-tetradecenoic acid, 11-tetradecenoic acid,12-tetradecenoic acid, 13-tetradecenoic acid
X-11905 Lipid Fatty acid,dicarboxylate
dehydro-genation
hexadecane-dioate
2-hexadecenedioic acid, 3-hexadecenedioic acid,4-hexadecenedioic acid, 5-hexadecenedioic acid,6-hexadecenedioic acid, 7-hexadecenedioic acid,8-hexadecenedioic acid
X-11859 Lipid Mediumchainfatty acid
dehydro-genation
pelargonate 2-nonenoic acid, 3-nonenoic acid,4-nonenoic acid, 5-nonenoic acid,6-nonenoic acid, 7-nonenoic acid,8-nonenoic acid
X-11538 Lipid Fatty acid,dicarboxylate
dehydro-genation
octadecane-dioate
2-octadecenedioic acid, 3-octadecenedioic acid,4-octadecenedioic acid, 5-octadecenedioic acid,6-octadecenedioic acid, 7-octadecenedioic acid,8-octadecenedioic acid, 9-octadecenedioic acid
Procedure: automatic annotation manual selection and verification
Table 4.9: Automatically annotated and manually preselected candidate moleculesCandidate molecules were selected manually for 5 unknown metabolites based on automa-tically predicted fatty acid derivatives and reactants in a dehydrogenation reaction. Thestructure of 5 – 12 candidate molecules per unknown metabolite basically varies in the posi-tion of the predicted double bond. Candidate molecules printed in bold were commerciallyavailable and those molecules marked by an asterisk were verified experimentally. I previ-ously published a similar version of this table in Quell et al. 2017; reprinted by permissionfrom the Journal of Chromatography B [150].
4.6 Experimental verification of selected candidate moleculesSelected candidates usually pass the identification level 3, if the measured unknownmetabolite and the candidate molecule (e.g. found in public databases) share commonspectral, chemical, or physical properties. Before labels of unknown metabolitesare replaced by the respective candidate names and are used for interpretations ofscientific results, the candidate should be verified experimentally. Measurement ofthe pure substance may substantiate the prediction and leads to identification level 1(verified). For a proof of concept, we sought experimental verification for candidatesthat were selected according to the most frequently predicted reaction type, thedehydrogenation reaction (Table 4.9). We bought 6 pure substances, predicted for4 unknown metabolites, which were available at chemical distributors (Table 2.1).Applying LC-MS measurements (negative mode) with these pure substances, we were

4.6 Experimental verification of selected candidate molecules 93
able to verify the predicted identity of two unknown metabolites.2-dodecenedioic acid and X-13891 (m/z: 227.1) share a retention time (RT) peak at
2.77 min in their extracted ion chromatograms (EICs) and show the same fragmentswith equivalent relative intensities in their MS2 fragmentation spectra, leading to averification of this candidate molecule (Figure 4.12).
Candidate molecule: 2-dodecenedioic acidMonoisotopic mass: 228.136
Unknown metabolite: X-13891m/z: 227.1RI: 2716RT: 2.77Mode: LC-MS neg
MS2 Fragmentation spectrum: Unknown metaboliteMS2 Fragmentation spectrum: Candidate molecule
m/z m/z
Inte
nsity
Inte
nsity
Extracted ion chromatogram (EIC)
Base
pea
k in
tens
ity
Retention time
Matrix(unknown metabolite)
Candidate molecule
Candidate molecule+ Matrix
05000
100001500020000250003000035000
2.77
05000
100001500020000250003000035000 2.77
2.77
2.67 2.69 2.71 2.73 2.75 2.77 2.79 2.81 2.83 2.85 2.87
05000
100001500020000250003000035000
0
10
20
30
40
50
60
70
80
90
100
100 110 120 130 140 150 160 170 180 190 200 210 220 230 240 250
111.2 138.3 152.0
165.0
183.0
209.1226.9
0
10
20
30
40
50
60
70
80
90
100
100 110 120 130 140 150 160 170 180 190 200 210 220 230 240 250
111.2 138.3
165.1
183.0
209.1226.9
(a) Basic parameters
Candidate molecule: 2-dodecenedioic acidMonoisotopic mass: 228.136
Unknown metabolite: X-13891m/z: 227.1RI: 2716RT: 2.77Mode: LC-MS neg
MS2 Fragmentation spectrum: Unknown metaboliteMS2 Fragmentation spectrum: Candidate molecule
m/z m/z
Inte
nsity
Inte
nsity
Extracted ion chromatogram (EIC)
Base
pea
k in
tens
ity
Retention time
Matrix(unknown metabolite)
Candidate molecule
Candidate molecule+ Matrix
05000
100001500020000250003000035000
2.77
05000
100001500020000250003000035000 2.77
2.77
2.67 2.69 2.71 2.73 2.75 2.77 2.79 2.81 2.83 2.85 2.87
05000
100001500020000250003000035000
0
10
20
30
40
50
60
70
80
90
100
100 110 120 130 140 150 160 170 180 190 200 210 220 230 240 250
111.2 138.3 152.0
165.0
183.0
209.1226.9
0
10
20
30
40
50
60
70
80
90
100
100 110 120 130 140 150 160 170 180 190 200 210 220 230 240 250
111.2 138.3
165.1
183.0
209.1226.9
(b) Extracted ion chromatogram (EIC)
Candidate molecule: 2-dodecenedioic acidMonoisotopic mass: 228.136
Unknown metabolite: X-13891m/z: 227.1RI: 2716RT: 2.77Mode: LC-MS neg
MS2 Fragmentation spectrum: Unknown metaboliteMS2 Fragmentation spectrum: Candidate molecule
m/z m/z
Inte
nsity
Inte
nsity
Extracted ion chromatogram (EIC)
Base
pea
k in
tens
ity
Retention time
Matrix(unknown metabolite)
Candidate molecule
Candidate molecule+ Matrix
05000
100001500020000250003000035000
2.77
05000
100001500020000250003000035000 2.77
2.77
2.67 2.69 2.71 2.73 2.75 2.77 2.79 2.81 2.83 2.85 2.87
05000
100001500020000250003000035000
0
10
20
30
40
50
60
70
80
90
100
100 110 120 130 140 150 160 170 180 190 200 210 220 230 240 250
111.2 138.3 152.0
165.0
183.0
209.1226.9
0
10
20
30
40
50
60
70
80
90
100
100 110 120 130 140 150 160 170 180 190 200 210 220 230 240 250
111.2 138.3
165.1
183.0
209.1226.9
(c) MS2 fragmentation spectrum: candidate
Candidate molecule: 2-dodecenedioic acidMonoisotopic mass: 228.136
Unknown metabolite: X-13891m/z: 227.1RI: 2716RT: 2.77Mode: LC-MS neg
MS2 Fragmentation spectrum: Unknown metaboliteMS2 Fragmentation spectrum: Candidate molecule
m/z m/z
Inte
nsity
Inte
nsity
Extracted ion chromatogram (EIC)
Base
pea
k in
tens
ity
Retention time
Matrix(unknown metabolite)
Candidate molecule
Candidate molecule+ Matrix
05000
100001500020000250003000035000
2.77
05000
100001500020000250003000035000 2.77
2.77
2.67 2.69 2.71 2.73 2.75 2.77 2.79 2.81 2.83 2.85 2.87
05000
100001500020000250003000035000
0
10
20
30
40
50
60
70
80
90
100
100 110 120 130 140 150 160 170 180 190 200 210 220 230 240 250
111.2 138.3 152.0
165.0
183.0
209.1226.9
0
10
20
30
40
50
60
70
80
90
100
100 110 120 130 140 150 160 170 180 190 200 210 220 230 240 250
111.2 138.3
165.1
183.0
209.1226.9
(d) MS2 fragmentation spectrum: X-13891
Figure 4.12: Analytical comparison of 2-dodecenedioic acid and X-13891The EIC of each aliquot shows the same retention time: candidate molecule, referencematrix (containing the unknown metabolite), and candidate molecule + reference matrix.Both MS2 fragmentation spectra of the candidate molecule and the unknown metaboliteshow the same fragments with equal relative intensities leading to a verification of thecandidate molecule. I previously published this figure in Quell et al. 2017; reprinted bypermission from the Journal of Chromatography B [150].
Based on equal principles, we could verify one further candidate molecule: 9-tetra-decenoic acid for X-13069 (Figure B.6). 9-octadecenedioic acid and X-11538 showa slight shift in their RT peaks so that this candidate molecule could be falsified,although both molecules show very similar fragments in their MS2 fragmentationspectra (Figure B.7). 2-nonenoic acid, 3-noneoic acid, and 8-noneoic acid and therespective unknown metabolite X-11859 have different RT peaks in the EIC so that

94 Results and discussion II: Annotation of unknown metabolites
these candidates could also be falsified (Figure B.8). A detailed overview of theevaluation results (RT peaks and MS2 signals) of all selected candidate molecules isprovided in Table B.12.
4.7 Concepts to organize predicted or verified metaboliteannotations
Our automated workflow for characterization of unknown metabolites expects a set ofmeasured known and unknown metabolites (preferably equally sized) that is commonfor established non-targeted MS platforms such as MetabolonTM. The network modelcan integrate several sets of independently measured metabolites and organizes char-acterized information, but it focuses on data analysis. Therefore, the transferabilityof automatically predicted or manually curated annotations of unknown metabolitesmeasured in several cohorts requires an external organizational structure for storagethat is independent form the characterization approach. Here, we propose a concep-tual data structure and prototyped the database for storing annotation informationof unknown metabolites including links to public databases for known or identifiedcompounds (Figure 4.13).In total, the database prototype contains 388 and 750 known, and 249 and 632 un-
known metabolites measured on the established (SUMMIT cohort) or high-resolution(GCKD cohort) platform of MetabolonTM, respectively. 59 unknown metabolitescontain information of the measurement on both platforms. Predicted super and subpathways are stored for 435 unknown metabolites and reactions connecting knownsto unknowns are stored for 384 unknown metabolites. 75 manually and 676 automa-tically selected candidate molecules are stored for 156 unknown metabolites. Finally,2 candidates for formerly unknown metabolites are stored with identification level 1including links to compounds of public databases, since selected candidates were ver-ified experimentally (2-dodecenedioic acid for X-13891, and 9-tetradecenoic acid forX-13069). 831 of 984 measured known metabolites could be mapped to compoundsof Recon, PubChem, or HMDB. Our suggested database aggregates annotations ofoverlapping sets of unknown metabolites that have been collected independently, andenables extraction of existing annotations for a given set of unknown metabolitesoccurring in results of novel experiments.

4.7 Concepts to organize predicted or verified metabolite annotations 95
Figure 4.13: UML diagram of Metabolite Collection databaseThe Metabolite Collection database consists of two core parts: tables around ‘MeasuredMe-tabolite’ contain information regarding measurement, predictions, assumptions, verification,or identification of measured metabolites, whereas tables around ‘MetaboliteDetail’ containinformation about molecules and molecule relations retrieved from public databases.

96 Results and discussion II: Annotation of unknown metabolites
4.8 DiscussionExperimental identification of single unknown metabolites in wet-laboratories hasgradually been superseded by complementary algorithm-based in silico approaches forperforming high-throughput characterization of unknown metabolites in non-targetedMS-based metabolomics [127]. Here, we present a novel holistic method that inte-grates biochemical and genetic relations of unknown and known metabolites ratherthan their chemical or physical properties derived from spectra to annotate unknownmetabolites and select candidate molecules. Our automated approach consists of in-dependent modules that construct a systems biology model and access the networkmodel for metabolite characterization: First, we identify the biochemical and geneticneighborhood of unknown metabolites that is imprinted in the correlation and asso-ciation among measured metabolite levels and between these levels and the genotypeof subjects in large cohorts. To this end, we construct the backbone of our networkmodel, which already incorporates unknown and known metabolites, by pairwise par-tial correlations (GGM that are known to reconstruct biochemical pathways basedon measured metabolite levels [147, 167]) and connect metabolites to genes basedon genetic associations derived from a (published or performed) mGWAS. Duringthe next step, our data integration module expands the data-driven network modelby known biochemical reactions and metabolite-gene relations of the public databaseRecon [110]. While in principle other metabolic databases such as KEGG [38] orHumanCyc [115] can also be used as resources for previous biochemical information,interfaces or parsers need to be adapted for these databases.The final network model is accessed by several automated metabolite characteri-
zation modules: We predict pathways by transferring annotations from known tounknown metabolites and assign reactions connecting known to unknown metabo-lites based on their local environment in the network model. Moreover, we auto-matically select isobaric candidate molecules for unknown metabolites (measured onhigh-resolution LC-MS devices) according to structural similarities of their neighborswith known structure (in the network model) to molecules of public databases, suchas Recon [110] and HMDB [71].To assess the quality of these predictions, we evaluated our approach based on
the characterizations that our method produced for the set of metabolite pairs withknown chemical structures. We demonstrated the flexibility of our approach with me-tabolite levels that were measured by a high-resolution MS platform in samples of a

4.8 Discussion 97
second independent cohort, replicated annotations within unknown metabolites (thatcould be mapped between both platforms), and showed that an integrated network ofboth data sets leads to annotations of additional unknown metabolites that could notbe characterized separately. For verification of selected candidates, we tested severalcommercially available pure substances by LC-MS measurements in a wet-laboratoryto search for experimental evidence. Finally, we proposed a database structure toorganize generated metabolite annotations, to compare annotations of unknown me-tabolites between several data sets, and to characterize unknown metabolites of anew data set based on previous (predicted or verified) annotations.
4.8.1 Large scale metabolite characterization without fragment spectra
Our systems biology approach complements existing methods in various ways: Byfocusing on metabolite levels measured in samples of a cohort study, as well asgenetic associations and functional relations of metabolites, we derive orthogonalinformation in our network model. This information is typically omitted in exis-ting approaches that primarily rely on signals from fragmentation spectra (e.g. Fin-gerID [90], CSI:FingerID [91, 92], SIMPLE [93], MetAssign [86], CFM [87], Met-Frag [88], compMS2Miner [89], and MetMapR [94]). Current approaches apply insilico fragmentation [87–89], calculation of RT [88, 89], or prediction of molecularfingerprints [90–93] to find candidate molecules with similar predicted structural pro-perties based on compounds of public databases. Further concepts utilize networksthat depict the similarity of unknown and known metabolites or signals in terms ofdetected fragments [94, 206], measured mass-to-charge ratios [94, 148], or elementalcomposition [207, 208].As metabolomics measurements of large (e.g. epidemiological) cohort studies are re-
gularly performed on standardized MS platforms by companies (such as MetabolonTM)in a fee-for-service manner, there is usually no in depth spectral information providedthat is needed for the described existing methods. In these cases, in which metabolitelevels of a large number of samples are determined, our method provides an alter-native approach for metabolite identification as it does not require spectral detailsbeyond the reported quantities (cohort study), total mass-to-charge ratios, and RIs:On the one hand, our approach works independently of spectral information. On theother hand, our approach depends on the availability of measurements for a largenumber of samples, while methods that focus on spectral details usually only needthe spectrum of the unknown metabolite from a single sample. Estimation of pairwise

98 Results and discussion II: Annotation of unknown metabolites
partial correlations (for GGMs construction) requires an at least balanced number ofsamples and measured parameters to receive robust relationships. Moreover, metabo-lite values need to be complete for all samples. For the most part, we solve this issuethrough removal of metabolites with more than 20% and samples with more than 10%missing values and imputation of remaining missing values. Nonetheless, unknownmetabolites that show a very high number of missing values across samples cannot beannotated by our approach, since imputation is not applicable in these cases. Also, ifa metabolite is not connected to any known metabolite or gene in our final networkmodel, we cannot provide any further characterization for this unknown metabolite(besides assumed functional relationships to further unknown metabolites). In ourcase that only applied to a very small proportion of unknown metabolites. In classicepidemiology experiments, researchers are frequently interested in the identity (orat least in annotations) of a selected set of unknown metabolites that associate tocertain biomarkers. These unknown metabolites can principally be integrated in ournetwork by their associations to known components (metabolites or genes).As its main strengths, our approach works independently of fragment spectra and
identifies the biochemical environment of unknown metabolites, even if their molecu-lar structure cannot be resolved in any case.
4.8.2 Complementary annotation through orthogonal information
By combining information that is imprinted in the correlation structure of metabo-lite levels and genetic associations with information extracted from spectral featuressuch as mass-to-charge ratios, we were able to use mass differences between pairs ofmetabolites to characterize unknown metabolites even in MS data with low mass re-solution. While mass resolution (even of our high-resolution platform) is insufficientto determine the atomic composition of an unknown metabolite, or to identify speci-fic mass differences that are typical for certain reactions directly [148], our networkallows pre-filtering these pairs by focusing on neighboring metabolites that can beassumed to be biochemically, i.e. functionally, linked.As an integrated data-driven and knowledge-based network method, MetMapR [94]
followed an idea that is similar to our approach. However, there are several differen-ces: MetMapR starts with biochemical reactions between a user defined set of knownmetabolites that need to be available in or mapped to database structures and subse-quently attaches unknown metabolites in a second or third step by spectral similaritiesor parametric Pearson or non-parametric Spearman correlations to (levels of) known

4.8 Discussion 99
metabolites. In part, the problem of missing database compounds is solved by addinghypothetical edges between known metabolites with similar PubChem fingerprints.In contrast, our approach profits from a direct inclusion of unknown metabolitesby pairwise partial correlations that build a GGM, which is known to reconstructbiochemical pathways. Thus, most metabolites of the data set are directly includedinto the data-driven backbone of the network model and unknown metabolites areinto their biochemically appropriate environment. While MetMapR applies differentstrategies to include known or unknown metabolites (the primary network containsknown metabolites only; edges to unknown metabolites are added later on), the ini-tial data-driven part of my network model includes known and unknown metabolitesthat were commonly integrated by the same principles, insuring a homogeneous andunbiased topology of known and unknown compounds. My approach is primarily fo-cused on measured data, while database information is only used to support alreadyexisting structures in the network model. Metabolites that cannot be connected toparts of the previous network model will not be included to avoid unnecessarily largenetwork substructures that cannot assist characterization of unknown metabolites.Although both methods, MetMapR and my approach, connect metabolites and genesaccording to common biochemical contexts, procedures, applied rules, and utilized in-formation are different. The main focus of MetMapR is not (only) on identification ofunknown metabolites but also on combining biochemical previous knowledge, struc-tural similarity, and spectral similarity or reconstruct pathways, e.g. for diseases. Incontrast to MetMapR, the main target of our approach consists of characterizationof unknown metabolites that is performed by several automatized modules, whileidentification of health-, diseases, or environment related pathways are subordinategoals.In general, our approach presupposes a similar behavior of unknown and known me-
tabolites, which ignores potential biases in their distribution (e.g. if complete classesor pathways of metabolites are unknown). Moreover, in data sets where the numberof unknown metabolites is much larger than the number of known metabolites, someunknown metabolites will only be connected to further unknown metabolites, whichresults in clusters of unknown metabolites. As a consequence, a transfer of pathway,reaction, and structural information to unknown molecules that are not connected toknown compounds is limited.Finally, while methods that do not rely on networks, are focused on the identifica-
tion of a specific unknown metabolite, network-based methods such as our approach,

100 Results and discussion II: Annotation of unknown metabolites
provide annotations for most unknown metabolites in a metabolomics data set in asingle run. Even metabolites, whose molecular structure cannot be elucidated, arecharacterized with information such as their biochemical environments. If new datasets from the same or a similar metabolomics platform become available, this datacan easily be included to an existing network model. We showed that combined net-work models of several cohorts improve characterization of metabolites also for theprevious data set.
4.8.3 Strategies to select specific candidate molecules
Most in silico approaches for automated selection of specific candidate molecules,including our method, search through a pool of molecular structures retrieved frompublic databases. However, searching criteria and strategies vary: While primaryapproaches compare measured spectra to spectra of databases [83–85], methods ofnext generations consider inter-peak dependency structures [86], or apply in silicofragmentation to compare observed and predicted spectra [87, 88]. Further meth-ods (such as CSI:FingerID [90–92] or SIMPLE [93]) search public databases withPubChem fingerprints that were predicted based on measured fragment spectra ofunknown metabolites. In contrast, our method avoids possible causes of errors or bi-ases that may occur during prediction of fingerprints by searching with fingerprints ofknown metabolites that are located in the local environment of unknown metabolitesaccording to the topology of our network model. We have shown, that metabolitesthat are connected in our network model are structurally more similar to each otherthan random pairs. Similarity of fingerprints is regularly estimated by the Tanimotocoefficient, which is used by CSI:FingerID and SIMPLE, and is also among the simi-larity measures of our approach. In general, fingerprints are appropriate to comparemolecular structures, since they are fast to determine, common substructures can beidentified, and the distance of fingerprints can be calculated easily and objectively.While searching in a pool of structures, correct candidates can only be selected, if
they are part of this pool. Therefore, a large candidate pool leads to an increasingnumber of selected candidates. With our method, we presuppose that considered re-actions lead to minor structural changes of molecules, but the most similar structureis not necessarily the correct identity of an unknown metabolite in any case. How-ever, we demonstrated the performance of our selection procedure based on finger-print Tanimoto, MCS Tanimoto, and MCS overlap similarity scores in a set of known(measured) metabolites. The power of our metabolite selection module is in accessing

4.8 Discussion 101
the network model that is intended to connect functionally related and structurallysimilar metabolites as demonstrated in this study. Finally, our candidate selectionmodule is only applicable for unknown metabolites measured on a high-resolutionMS device to ensure an adequate pre-filtering by measured masses. Although (de-pending on the database) very specific molecules are selected, structurally similar(isotopic, isobaric, or stereo-isomeric) compounds should also be considered as mole-cules behind unknown metabolites. However, as one of our characterization modules,automatically selected candidates provide a solid idea about the possible biochemicalidentity of an unknown metabolite.In general, automatically selected candidates should be evaluated manually or ver-
ified by experimental measurements, since automated selection approaches are re-stricted to compounds of a predefined set and to applied selection criteria that cannotcapture the biochemically entirety that is in part modeled in our network. Even ifthe candidates have to be verified experimentally, the data driven selection of candi-date molecules is a big gain, since a specific hint beyond the underlying molecule isprovided for a large number of unknown metabolites and the manual work in the wet-laboratory is drastically reduced (compared to an experimental de novo identificationof one single metabolite).
4.8.4 Future directions of metabolite characterization approaches
In future, advanced MS technologies that measure on the accurate mass resolutionlevel will open the possibility to calculate the unambiguous chemical formula (ele-mental composition) based on the measured mass and possibly on a restricted setof atoms (which are frequently contained in biochemically active substances) [209].Determined chemical formulas and predicted annotations will be used to search da-tabases for a more precise filtering of candidate structures [210, 211].Future inference of the sub- and super-pathways can potentially be based on less
stringent independence assumptions. Although we receive a reasonable accuracy withour simplified approach of reaction prediction by solely relying on differences in themass-to-charge ratio (and partially in the RI), this step can be improved by applyingchemometric methods for in silico reaction prediction that take functional groupsof the known metabolite into account [212]. In addition, the currently tested listof possible enzymatic reactions only covers the most frequent reactions and can beextended by multiple reactions (leading to an increase in the false positive rate andtherefore requiring an advanced filtering).

102 Results and discussion II: Annotation of unknown metabolites
4.8.5 Summary
Identification of metabolites measured on non-targeted MS-based platforms is amongthe major challenges of current metabolomics research [127]. Here we described amethod that uses biochemical and genetic information as imprinted in the correla-tion structure of measured metabolite levels to characterize unknown metabolites.Integration of these metabolite-metabolite and metabolite-gene pairs with functionalprevious knowledge including enzymatic reactions and functional metabolite-gene re-lations of public databases in a network model embeds unknown metabolites intotheir metabolic contexts. Predicted pathways of unknown metabolites and reactionsconnecting known to unknown metabolites based on their local environment in thenetwork model facilitates identification of unknown metabolites by both procedu-res, automated or manually. For unknown metabolites measured on high-resolutionMS platforms, our approach automatically proposes specific candidate molecules ofa database that are structurally similar to neighboring known metabolites within thenetwork model. In future studies, metabolite identification will be largely improvedby combining our approach with current spectra-based methods to incorporate com-plementary strategies.

CHAPTER 5Summary and outlook
In the last decades, metabolomics has captured increasing importance in research ofhealth and disease. The outcome of metabolomics analyses strongly depends on thequality of data produced by high-throughput technologies, such as mass spectrome-try (MS) or nuclear magnetic resonance (NMR). Non-targeted approaches includemeasurements of metabolites whose chemical structures remain unknown and thus al-low a hypothesis-free detection of unexpected relations. In MS, unknown metabolitesare typically described by their analytical properties (e.g. m/z, retention time (RT),and features of fragmentation spectra), but lack any (bio-) chemical characterization.Even if measured metabolites carry some annotations, they are specified on specificprecision levels that depend on the separation capacity of targeted as well as of non-targeted MS devices and on the analytical methodology used (e.g. multiple reactionmonitoring (MRM) in tandem mass spectrometry (MS/MS)). In this regard, the to-tal concentration of a mixture of several molecules may be measured and annotatedas single metabolite. As an example, phosphatidylcholines (PCs) are often measuredon the lipid species level, in which the total length and desaturation is determined,but their distribution to the sn-1 and sn-2 positions are not captured. Interpretationof scientific results that contain unknown or ambiguously annotated metabolites islimited. Frequently, these metabolites cannot be mapped to biochemical pathways orconstituents of measured metabolite sums may have contrary biochemical functions.For biological interpretations and for further usage (e.g. clinical applications), thesemetabolites need to be characterized precisely.
103

104 5 Summary and outlook
5.1 Achieved goals in metabolite characterizationIn this work, I introduced two automated metabolite characterization methods: In thefirst part, a comparison of two targeted MS platforms led to uncovering the main con-stituent on the fatty acid level (detection of fatty acid chain lengths and desaturation,but not their order (sn-1 or sn-2), position of double bounds, and stereo-chemistry)for PCs measured on the lipid species level. To this end, I first systematically dividedchain lengths and double bonds of 76 PCs measured by AbsoluteIDQTM (lipid specieslevel) between their sn-1 and sn-2 positions and received 150 to 456 theoretically pos-sible constituents of the fatty acid level. For a subset of 38 PCs sums (lipid specieslevel) at least one constituent was measured among 109 PCs of the fatty acid level(LipidyzerTM) that were quantified in the same 223 human plasma samples of HuMet.For 10 PCs measured on the lipid species level, I identified one single main consti-tuent with a relative contribution of at least 80% in the sum. Further 14 and 3 PCsums consisted of one or two measured constituents, respectively, with a contributionof 20 – 80%. Finally, I demonstrated the stability of the quantitative contribution ofconstituents through replication in 305 samples of an independent cohort (QMDiab):13 of 38 quantitative PC compositions by comparing their estimated contributiondirectly (factors f) and based on measured and imputed concentrations (fatty acidlevel) 19 PC compositions. Determined stable factors can thus be used to imputePC concentrations (fatty acid level) of further studies based on PC concentrationsmeasured on the lipid species level (e.g. AbsoluteIDQTM).In the second part, I generated a systems biology model that integrated data-driven
and database relations between characterized and uncharacterized metabolites in non-targeted MS). By transferring annotations from known to neighboring unknown me-tabolites, I identified the biochemical context of unknown metabolites. For this pur-pose, I estimated pairwise partial correlations between 637 metabolites (338 known,249 unknown) measured by the established platform of MetabolonTM in 2 279 sam-ples of SUMMIT, since resulting interactions are known to reconstruct biochemicalpathways [118]. The resulting GGM (862 edges) was combined with 398 publishedpartial correlations of metabolites (KORA) [147] and 299 metabolite-gene associa-tions of a published mGWAS (KORA and TwinsUK) [167]. Thereby, common edgeswere collected, common metabolites were mapped, and new metabolites were added.Finally, I attached 306 metabolites and 57 genes connected via 1 152 reactions and495 metabolite-gene relations from the public database Recon [110] to the data-driven

5.2 Biological benefit of precise metabolite annotations 105
network model. The resulting network model was the basis for several metabolitecharacterization modules: (i) 180 unknown metabolites were labeled with predictedpathways that were transferred from metabolites in the local biochemical environ-ment according to the network model. (ii) Mass differences that were typical for21 reaction types were used to assign 100 potential enzymatic reactions to pairs ofneighboring (acc. to the network model) known and unknown metabolites. In caseof mass difference 2, I applied an additional ∆RI criterion and thus predicted de-hydrogenation reactions for 12 of the 100 pairs. (iii) For 139 out of 315 unknownmetabolites that were measured on the new high-resolution platform of MetabolonTM
in 1 209 samples of a second cohort (GCKD) and were connected to known metabolitesin the data-driven network model, I automatically selected 676 candidate moleculesby scanning compounds of Recon [110] and HMDB [71] for similar masses of unknownmetabolites and similar chemical structures to their local environment in the networkmodel. (iv) Finally, I prototyped a database structure for storing (predicted, verified,or known) annotations of unknown metabolites.To demonstrate applications of my automated workflow, I manually selected 5 –
12 candidate molecules for 5 unknown metabolites based on described automaticannotations, of which I verified two candidates experimentally in a wet-laboratory.For replication of automatic metabolite characterizations, I mapped 59 of 632 un-known metabolites that were measured in the second cohort to metabolites of themain data set (SUMMIT). Thus, I replicated pathway predictions for 18 out of26 unknown metabolites that carried predictions in both cohorts and I showed thatpredictions can be improved by integration of two data sets into a common networkmodel (enabled pathway predictions for another 8 unknown metabolites). The des-cribed systems biology approach covers automated steps from data integration toannotation of pathways, prediction of reactions, and selection of specific candidates,while reducing manual work to a minimum.
5.2 Biological benefit of precise metabolite annotationsNon-targeted MS technologies are established label-free approaches to quantify me-tabolites in easily extractable tissues (e.g. blood plasma, serum, urine, or saliva) andto explore unexpected relations without specific hypotheses. Current epidemiologystudies (e.g. association analyses, mGWAS, or MWAS) frequently exclude the subsetof unknown metabolites from experiments [34], or report results including unknown

106 5 Summary and outlook
metabolites without further interpretations [167]. Only a few studies search for hintsconcerning the identity of unknown metabolites [213]. Uncharacterized metabolitesin research results mark dead ends with a limited scientific value. Annotations enableinterpretations and illumination of the biochemical background of results that con-tain unknown metabolites. If unknown metabolites should, as an example, serve asbiomarkers they need to be identified for exploration of functional relations to specifictraits (e.g. diseases).Besides unknown metabolites, some annotated metabolites carry ambiguous labels,
since they consist of several chemical structures that have similar chemical or physicalproperties according to the separation capacity of the MS device or of the identifica-tion analysis (precision level). To enable interpretations of results containing thesemetabolites, they often use assumptions regarding the underlying chemical structure(e.g. even chain lengths are much more abundant than odd chain lengths [138]; es-pecially C16:0, C18:0, C18:1, C18:2, and C20:4 are common fatty acids in humanplasma [139]). Based on the platform comparison described in this work, I couldpartially confirm or falsify respective expectations in published studies: as an ex-ample, Suhre et al. 2011 supposed that PC aa C36:4, PC aa C38:4, PC aa C38:5and PC ae C38:3 consist of one saturated or mono-unsaturated fatty acid with chainlength C16 or C18 and of one poly-unsaturated fatty acid [140], which correspondsto the results of my analyses. As a second example, Floegel et al. 2013 assumedPC 14:0_18:1 as major constituent of PC aa C32:1 [141], but my data showed thatthis compound is only among its minor constituents. Empirically determined quan-titative PC compositions (fatty acid level) of my study are still not on the levelof chemical structures. However, they enable more substantiated interpretations byreducing the number of possible molecules.Especially in clinical applications metabolomics testing requires precisely charac-
terized metabolites, since missing or ambiguous annotations are not sufficient to findspecific disease causes, to functionally explore potential treatment targets, to passanalytical and clinical validation, or to meet regulatory frameworks [214]. However,scientific interpretations of results can be supported by placing unknown metaboli-tes in their biochemical environment and label them with functional elements, suchas pathways. While existing spectra-based metabolite annotation approaches try toidentify (parts of) metabolite structures, my approach supplies the local biochemi-cal environment for a large set of unknown metabolites, even for metabolites whoseidentity cannot be resolved. Resulting biochemical context information about un-

5.3 Technical aspects on automated characterization approaches 107
known metabolites is a significant improvement on pure analytical data (m/z, RT, orspectra).On the downside, data-driven construction of systems biology models that depict
biochemical systems including interconnected elements of various layers (e.g. meta-bolites, enzymes, genes, tissues, or external factors) require large data sets. In smallintervention (or case-control) studies, data is often not sufficient to derive an appropri-ate biochemical model and special interest is in identification of particularly selectedsingular unknown metabolites. In these experimental settings, metabolite identifica-tion is preferably focused on fragment spectra (e.g. FingerID [90], CSI:FingerID [91,92], SIMPLE [93], MetAssign [86], CFM [87], MetFrag [88], compMS2Miner [89], andMetMapR [94]).Whenever the data basis is sufficient to model biochemical relations incorpora-
ting unknown metabolites, metabolite characterization should utilize this valuableinformation. In my approach, I construct and access data-driven network models (re-constructing biochemical pathways) to identify the biochemical context of unknownmetabolites, transfer pathway information from known to neighboring unknown me-tabolites, predict reactions between known and unknown compounds, and automati-cally select specific candidate molecules. Automatically selected information concer-ning unknown metabolites helps to understand the biochemical mechanisms behindcomputational results and enables scientific interpretations.Precisely characterized metabolites are crucial for reliable interpretations of meta-
bolomics study-results, especially if they are intended for later clinical applications.Depending on the available data and on the specific use case, it might be an advan-tage to combine several metabolite characterization approaches (based on fragmentspectra and based on the biochemical environment).
5.3 Technical aspects on automated characterizationapproaches
Experimental metabolite identification approaches in wet-laboratories (by non-tar-geted MS) are successfully applied to elucidate the structure of single unknown me-tabolites. However, these approaches are comparatively expensive, time-consuming,and require large probe volumes (because several measurements are necessary). Whilecurrent non-targeted MS platforms measure several hundred or thousand metaboli-tes, upcoming technologies are becoming faster and faster, leading to an increased

108 5 Summary and outlook
throughput of samples and measurement of a growing number of (unknown) meta-bolites (as a comparison, HMDB contains more than 100 000 metabolites that arepresumed to be biochemically active in human metabolism [71]). In theory, all com-pounds of human metabolite databases (such as HMDB) could be sent through anMS measurement of a certain platform and stored in a spectral library to reduce thenumber of unknown metabolites. In practice, this concept is not feasible, since thenumber of database compounds is very large, only a small subset of these compoundsis commercially available, detected unknown metabolites are not necessarily found inpublic databases, synthesis of specific compounds (as fee-for-service manner) is veryexpensive, once identified compounds cannot necessarily be transferred to furtherplatforms, and the procedure would not be fundable for medium-sized MS compa-nies. As a consequence, current non-targeted metabolomics requires high-throughputapproaches that target several unknown metabolites simultaneously.Automated in silico approaches usually transfer information from known to un-
known entities or predict physical as well as chemical properties. While most ap-proaches are driven by fragment spectra [83–94], some methods, such as my systemsbiology model, identify biochemical contexts of unknown metabolites [94, 150]. Themost basic methods compare complete measured MS or MS/MS spectra of an un-known metabolite to reference spectra of databases (e.g. MassBank [215] or MET-LIN [216]), in which availability and transferability of spectral information depend onthe measuring device [83–85]. This procedure can be improved by clustering m/z andintensity of all peaks of unknown metabolites and target molecules of spectral data-bases separately and ranking similar structures (MetAssign [86]). In order to becomeindependent of spectral databases, several approaches apply in silico fragmentationof a predefined set of chemical structures (in part supported by fragmentation trees)and compare resulting predicted spectra to measured spectra of unknown metabolitesto select candidate molecules (CFM [87], MetFrag [88], and compMS2Miner [89]). Be-sides physical properties (e.g. fragmentation spectra), some methods filter candidatemolecules by (partially predicted) chemical properties, such as RT (MetAssign [86],MetFrag [88], compMS2Miner [89], and my approach [150]). Kernel-based machinelearning approaches predict chemical fingerprints (e.g. PubChem fingerprint consistsof a 881 bit tuple) based on fragmentation spectra, and query databases to find candi-date molecules that show a similar fingerprint (FingerID [90], CSI:FingerID [91, 92],MetMapR [94], and SIMPLE [93]). As an example, similarity of chemical fingerprintscan be estimated by the Tanimoto coefficient. In my approach, automated candidate

5.3 Technical aspects on automated characterization approaches 109
selection also employs chemical fingerprints, in which prediction of fingerprints is notnecessary, since fingerprints of known metabolites located in the local biochemicalenvironment of unknown metabolites are used. All of these approaches, including myapproach, have in common that candidates can only be selected for unknown metabo-lites, if the candidate is among accessed database compounds. Unlike approaches thatare restricted to chemical or physical properties of unknown metabolites, systems bi-ology methods characterize unknown metabolites by their biochemical context, evenif no candidate is predicted (MetMapR [94] and my approach [150]). Spectra-basedapproaches are independent from metabolomics experiments and require only themeasurement of one single sample. Admittedly, spectral information must be availa-ble, and methods do not provide annotations of pathways or biochemical relations tofurther metabolites. Some commercially available non-targeted MS platforms (suchas MetabolonTM) that are regularly used for standardized metabolite quantificationin large cohorts do not provide spectral information (except the total m/z). If thesedata sets are used for large-scale hypothesis-free testing (e.g. MWAS or mGWAS),resulting associations can serve for metabolite identification by systems biology ap-proaches that use correlation structures to place unknown metabolites into the correctbiochemical context.My approach is focused on transfer of orthogonal metabolite annotations based on
network models that incorporate known and unknown metabolites connected by asso-ciation or functional information. Data-driven elements, such as partial correlationsbetween pairwise metabolites that reconstruct biochemical pathways incorporatingunknown metabolites (GGM) built the backbone of my model and are integrated withmetabolite-gene associations (mGWAS), whereas GGM generation requires at leastbalanced numbers of samples and variables (metabolites). Therefore, my approach issuitable for characterization of unknown metabolites that appear in results of largecohort studies. The resulting network model is revalued with reactions and functionalmetabolite-gene relations of a public database (e.g. Recon [110]) and provides a basisfor flexible metabolite characterization modules: Pathway annotations are transferredfrom known to neighboring unknown metabolites and reactions are predetermined byco-localization in the network model and characteristic mass changes. For unknownmetabolites with measured high-resolution masses, candidate molecules are automa-tically selected from compounds of a public database (e.g. Recon, HMDB) that arestructurally similar to metabolites located in the biochemical context (acc. to the net-work model) and meet the measured mass of the unknown metabolite. The success

110 5 Summary and outlook
of my approach strongly depends on the availability of large data sets (e.g. cohortstudies), in which fractions (e.g. half) of measured metabolites are known or alreadyidentified.Besides emerging metabolite characterization software, further development of MS
devices leads to an improved metabolite separation capacity (better precision level)(e.g. SelexIONTM technology) and to an increasing mass resolution (high-resolutionMS): First, current lipidomics platforms (such as LipidyzerTM) quantify several thou-sand metabolites on the fatty acid (acyl/alkyl) level, but many data sets of largeepidemiological cohort studies have already been measured by previous platformsmeeting the lipid species level (e.g. AbsoluteIDQTM). While using existing data inscientific analyses, further knowledge about their probable composition (main consti-tuents on a higher precision level), as determined in my study, is useful for satisfyinginterpretations of respective results. Data-driven predictions of constituents decreasethe necessity of remeasuring large numbers of samples on new devices, which is notpossible in any case, if samples are already depleted or reserved for further analyses.Although current platforms that measure on the fatty acid level apply a much betterseparation of metabolites, they are far from measuring the chemical structure (e.g. incase of fatty acids, position of double bonds, stereo-chemistry, etc. is not detected).Therefore, prediction of probable constituents will still be necessary (even if platformswith even better precision levels are developed).The second aspect of evolving MS devices is about the measured mass resolution.
Detection of the accurate mass enables determination of the atomic composition ofmolecules, in which precision decreases with the measured mass (e.g. m1 =100± 0.01and m2 =1000± 0.1) and the number of combinatorically possible atomic compo-sitions increases exponentially (with the number of atoms) for large metabolites.Developing MS technologies (high-resolution measurements or better metabolite se-paration capacity) require adaptation of metabolite characterization approaches, butin silico metabolite characterization cannot be replaced by recent MS devices yet.Recent MS platforms usually cover more extensive sets of known and unknown
metabolites (e.g. established MetabolonTM platform: ∼ 750 metabolites, new high-resolution MetabolonTM platform: ∼ 1 450 metabolites). Large numbers of unknownmetabolites require high-throughput approaches that annotate a complete set of un-known metabolites during a single run. Especially metabolite characterization proce-dures that focus the local biochemical environment of unknown metabolites (insteadof fragment spectra), such as my approach, profit from large numbers of samples and

5.4 Future directions in handling structurally uncharacterized metabolites 111
of metabolites, since annotations can be transferred from (more) known to unknownmetabolites via an increased number of neighborhood relations.In summary, available information of the measurement (number of samples, pa-
rameters: m/z, RT or RI, spectra) influences selection of the optimal metabolitecharacterization approach. Unknown metabolites in data sets with few or only onesample should be approached by methods that focus fragment spectra, if spectra areavailable. In cases, where spectra are not available, but metabolite concentrationsare measured in large cohort studies, procedures focusing the biochemical contextof unknown metabolites, such as my method, are suitable. In this case, metabolitecharacterization is approached by the top down principle, in which information is re-trieved from external overlying factors, such as associations or an orthogonal transferfrom known entities.
5.4 Future directions in handling structurally uncharacterizedmetabolites
Novel targeted and non-targeted MS technologies are developed repeatedly accordingto the evolving state of the art. Characterization of unknown metabolites needs tofollow this development. First, more efficient MS technologies realize fast scans dur-ing measurements of large cohort studies within short time spans, e.g. German NAKO(n≈ 200 000) [24]. My metabolite characterization approach benefits from large sam-ple sizes, since estimation of pairwise partial correlations (for GGM generation) requi-res an at least balanced number of variables and instances. In general, the statisticalpower rises by increasing sample sizes, meaning that associations with smaller effectsizes are detected. Second, (most of) recently developed MS technologies achieve ahigher mass resolution, compared to established platforms, and often allow a betterseparation of molecules. As an example, the lipidomics platform LipidyzerTM quan-tifies more than a thousand metabolites on the fatty acid level, leading to a directanalytical selection of metabolites that my approach predicted based on metabolitesmeasured on the lipid species level. Although measurements on higher precision lev-els open new possibilities, the separation capacity is still far from detecting actualchemical structures and therefore justify determination of their constituents. Fur-thermore, emerging high-resolution MS technologies implement precise measurementof metabolite masses. In my approach, high-resolution masses serve as an efficientfiltering criterion for pre-selection of candidate molecules that are structurally similar

112 5 Summary and outlook
to compounds located in the biochemical context of unknown metabolites. Measure-ments of accurate masses even allow the determination of unique atomic compositionsof metabolites.Future trends in metabolite identification will further shift from manual to efficient
in silico approaches that allow high throughputs of large data sets. Limiting factors,i.e. manual tasks, are systematically reduced by introducing automated modules.Several methods employing specific data (e.g. my approach transfers annotations fromknown to unknown metabolites by identification of the biochemical context; othermethods, such as FingerID [90], CSI:FingerID [91, 92], SIMPLE [93], MetAssign [86],CFM [87], MetFrag [88], compMS2Miner [89], or MetMapR [94] utilize fragmentationspectra) will be combined to attain the most precise annotation for each unknownmetabolite. Metabolite identification in wet-laboratories will be focused on singleunknown metabolites of special interest (e.g. promising diagnostic or therapeutictargets) that cannot be annotated by automated approaches (e.g. if they are locatedin a cluster of further unknowns only, or if no fragment can be labeled). However,experimental measurements in wet-laboratories remain important for verification of(automatically) selected candidate molecules to reach identification level 1.Results of metabolomics experiments can only be understood, placed into bio-
chemical contexts, interpreted, or further used in clinical applications, if relevantmetabolites are annotated with their chemical structure. Since novel MS platforms,facing the actual state of technology, are developed, data sets containing new (yetunobserved) unknown metabolites are produced. For this reason, metabolite identi-fication will stay a long-term companion in future metabolomics research [217]. Incase of more and more emerging non-targeted MS platforms, the focus may changefrom de novo identification of unknown metabolites to comparative approaches thattransfer annotations between known and unknown metabolites measured on differentplatforms. With the ability of integrating metabolites of various platforms and illu-minating data-driven biochemical contexts of unknown metabolites, my approach iswell prepared for this future challenge.

Bibliography
[1] Danielle Ryan and Kevin Robards. Metabolomics: The greatest omics of themall? Analytical chemistry, 78:7954–7958, 2006. doi:10.1021/ac0614341.
[2] Igor Stagljar. Editorial for “advances in OMICs-based disciplines”.Biochemical and biophysical research communications, 445:681–682, 2014.doi:10.1016/j.bbrc.2014.03.040.
[3] Andrea D Weston and Leroy Hood. Systems biology, proteomics, and the fu-ture of health care: toward predictive, preventative, and personalized medicine.Journal of proteome research, 3:179–196, 2004. doi:10.1021/pr0499693.
[4] Ina Aretz and David Meierhofer. Advantages and pitfalls of mass spectrome-try based metabolome profiling in systems biology. International journal ofmolecular sciences, 17(5):632, 2016. doi:10.3390/ijms17050632.
[5] Santo Fortunato, Carl T Bergstrom, Katy Börner, James A Evans, DirkHelbing, Staša Milojević, Alexander M Petersen, Filippo Radicchi, Ro-berta Sinatra, Brian Uzzi, Alessandro Vespignani, Ludo Waltman, DashunWang, and Albert-László Barabási. Science of science. Science, 359, 2018.doi:10.1126/science.aao0185.
[6] Noha A Yousri, Gabi Kastenmüller, Christian Gieger, So-Youn Shin, Idil Erte,Cristina Menni, Annette Peters, Christa Meisinger, Robert P Mohney, ThomasIllig, Jerzy Adamski, Nicole Soranzo, Tim D Spector, and Karsten Suhre. Longterm conservation of human metabolic phenotypes and link to heritability. Me-tabolomics : Official journal of the Metabolomic Society, 10:1005–1017, 2014.doi:10.1007/s11306-014-0629-y.
[7] M E Lacruz, A Kluttig, D Tiller, D Medenwald, I Giegling, D Rujescu, C Prehn,J Adamski, K H Greiser, and G Kastenmüller. Instability of personal human
113

114 Bibliography
metabotype is linked to all-cause mortality. Scientific reports, 8:9810, 2018.doi:10.1038/s41598-018-27958-1.
[8] Simone Rochfort. Metabolomics reviewed: a new “omics” platform technologyfor systems biology and implications for natural products research. Journal ofnatural products, 68:1813–1820, 2005. doi:10.1021/np050255w.
[9] Kedir N Turi, Lindsey Romick-Rosendale, Kelli K Ryckman, and Tina V Har-tert. A review of metabolomics approaches and their application in identifyingcausal pathways of childhood asthma. The Journal of allergy and clinical im-munology, 141:1191–1201, 2018. doi:10.1016/j.jaci.2017.04.021.
[10] Drupad K Trivedi, Katherine A Hollywood, and Royston Goodacre. Me-tabolomics for the masses: The future of metabolomics in a persona-lized world. New horizons in translational medicine, 3:294–305, 2017.doi:10.1016/j.nhtm.2017.06.001.
[11] Christopher B Newgard. Metabolomics and Metabolic Diseases: Where Do WeStand? Cell metabolism, 25:43–56, 2017. doi:10.1016/j.cmet.2016.09.018.
[12] Ioanna Tzoulaki, Timothy M D Ebbels, Ana Valdes, Paul Elliott, and JohnP A Ioannidis. Design and analysis of metabolomics studies in epidemiologicresearch: a primer on -omic technologies. American journal of epidemiology,180:129–139, 2014. doi:10.1093/aje/kwu143.
[13] Marianne C Walsh, Lorraine Brennan, J Paul G Malthouse, Helen M Roche,and Michael J Gibney. Effect of acute dietary standardization on the urinary,plasma, and salivary metabolomic profiles of healthy humans. The Americanjournal of clinical nutrition, 84:531–539, 2006. doi:10.1093/ajcn/84.3.531.
[14] J A Carrillo, M Christensen, S I Ramos, C Alm, M L Dahl, J Benitez, andL Bertilsson. Evaluation of caffeine as an in vivo probe for CYP1A2 usingmeasurements in plasma, saliva, and urine. Therapeutic drug monitoring, 22:409–417, 2000.
[15] Mónica Calderón-Santiago, Feliciano Priego-Capote, Natacha Turck, XavierRobin, Bernabé Jurado-Gámez, Jean C Sanchez, and María D Luque de Cas-tro. Human sweat metabolomics for lung cancer screening. Analytical andbioanalytical chemistry, 407:5381–5392, 2015. doi:10.1007/s00216-015-8700-8.

115
[16] R Holle, M Happich, H Löwel, H E Wichmann, and MONICA/KORA StudyGroup. KORA–a research platform for population based health research.Gesundheitswesen (Bundesverband der Arzte des Offentlichen Gesundheitsdien-stes (Germany)), 67 Suppl 1:S19–S25, 2005. doi:10.1055/s-2005-858235.
[17] Wolfgang Rathmann, Bernd Kowall, Teresa Tamayo, Guido Giani, Rolf Holle,Barbara Thorand, Margit Heier, Cornelia Huth, and Christa Meisinger. He-moglobin A1c and glucose criteria identify different subjects as having type2 diabetes in middle-aged and older populations: the KORA S4/F4 Study.Annals of medicine, 44:170–177, 2012. doi:10.3109/07853890.2010.531759.
[18] Kai-Uwe Eckardt, Barbara Bärthlein, Seema Baid-Agrawal, Andreas Beck,Martin Busch, Frank Eitner, Arif B Ekici, Jürgen Floege, Olaf Gefeller, Her-mann Haller, Robert Hilge, Karl F Hilgers, Jan T Kielstein, Vera Krane, AnnaKöttgen, et al. The German Chronic Kidney Disease (GCKD) study: designand methods. Nephrology, dialysis, transplantation : official publication of theEuropean Dialysis and Transplant Association - European Renal Association,27:1454–1460, 2012. doi:10.1093/ndt/gfr456.
[19] Katja Borodulin, Erkki Vartiainen, Markku Peltonen, Pekka Jousilahti,Anne Juolevi, Tiina Laatikainen, Satu Männistö, Veikko Salomaa, JoukoSundvall, and Pekka Puska. Forty-year trends in cardiovascular risk fac-tors in Finland. European journal of public health, 25:539–546, 2015.doi:10.1093/eurpub/cku174.
[20] Ewan R Pearson, Louise A Donnelly, Charlotte Kimber, Adrian Whitley, AlexS F Doney, Mark I McCarthy, Andrew T Hattersley, Andrew D Morris, and Co-lin N A Palmer. Variation in TCF7L2 influences therapeutic response to sulfo-nylureas: a GoDARTs study. Diabetes, 56:2178–2182, 2007. doi:10.2337/db07-0440.
[21] Damiano Baldassarre, Kristiina Nyyssönen, Rainer Rauramaa, Ulf de Faire,Anders Hamsten, Andries J Smit, Elmo Mannarino, Steve E Humphries, Phi-lippe Giral, Enzo Grossi, Fabrizio Veglia, Rodolfo Paoletti, Elena Tremoli, andIMPROVE study group. Cross-sectional analysis of baseline data to identifythe major determinants of carotid intima-media thickness in a European po-pulation: the IMPROVE study. European heart journal, 31:614–622, 2010.doi:10.1093/eurheartj/ehp496.

116 Bibliography
[22] Axel C Carlsson, Per E Wändell, Gunilla Journath, Ulf de Faire, and Mai-LisHellénius. Factors associated with uncontrolled hypertension and cardiovascularrisk in hypertensive 60-year-old men and women–a population-based study.Hypertension research : official journal of the Japanese Society of Hypertension,32:780–785, 2009. doi:10.1038/hr.2009.94.
[23] T S Ahluwalia, E Lindholm, and L C Groop. Common variants in CNDP1and CNDP2, and risk of nephropathy in type 2 diabetes. Diabetologia, 54:2295–2302, 2011. doi:10.1007/s00125-011-2178-5.
[24] German National Cohort (GNC) Consortium. The German National Cohort:aims, study design and organization. European journal of epidemiology, 29:371–382, 2014. doi:10.1007/s10654-014-9890-7.
[25] Susanne Krug, Gabi Kastenmüller, Ferdinand Stückler, Manuela J Rist, Tho-mas Skurk, Manuela Sailer, Johannes Raffler, Werner Römisch-Margl, JerzyAdamski, Cornelia Prehn, Thomas Frank, Karl-Heinz Engel, Thomas Hofmann,Burkhard Luy, Ralf Zimmermann, et al. The dynamic range of the human me-tabolome revealed by challenges. FASEB journal : official publication of theFederation of American Societies for Experimental Biology, 26:2607–2619, 2012.doi:10.1096/fj.11-198093.
[26] Christian Gieger, Ludwig Geistlinger, Elisabeth Altmaier, Martin Hrabé deAngelis, Florian Kronenberg, Thomas Meitinger, Hans-Werner Mewes, H-Erich Wichmann, Klaus M Weinberger, Jerzy Adamski, Thomas Illig, andKarsten Suhre. Genetics meets metabolomics: a genome-wide associationstudy of metabolite profiles in human serum. PLoS genetics, 4:e1000282, 2008.doi:10.1371/journal.pgen.1000282.
[27] Thomas Illig, Christian Gieger, Guangju Zhai, Werner Römisch-Margl, RuiWang-Sattler, Cornelia Prehn, Elisabeth Altmaier, Gabi Kastenmüller, Ber-net S Kato, Hans-Werner Mewes, Thomas Meitinger, Martin Hrabé de Angelis,Florian Kronenberg, Nicole Soranzo, H-Erich Wichmann, et al. A genome-wideperspective of genetic variation in human metabolism. Nature genetics, 42:137–141, 2010. doi:10.1038/ng.507.
[28] Gabi Kastenmüller, Johannes Raffler, Christian Gieger, and Karsten Suhre.Genetics of human metabolism: an update. Human molecular genetics, 24:R93–R101, 2015. doi:10.1093/hmg/ddv263.

117
[29] Karsten Suhre, Johannes Raffler, and Gabi Kastenmüller. Biochemical insightsfrom population studies with genetics and metabolomics. Archives of bioche-mistry and biophysics, 589:168–176, 2016. doi:10.1016/j.abb.2015.09.023.
[30] Anna Köttgen, Johannes Raffler, Peggy Sekula, and Gabi Kastenmül-ler. Genome-Wide Association Studies of Metabolite Concentrations (mG-WAS): Relevance for Nephrology. Seminars in nephrology, 38:151–174, 2018.doi:10.1016/j.semnephrol.2018.01.009.
[31] Jeremy K. Nicholson, Elaine Holmes, and Paul Elliott. The Metabolome-WideAssociation Study: A New Look at Human Disease Risk Factors. Journalof Proteome Research, 7(9):3637–3638, 2008. doi:10.1021/pr8005099. PMID:18707153.
[32] Ann-Kristin Petersen, Jan Krumsiek, Brigitte Wägele, Fabian J Theis, H-ErichWichmann, Christian Gieger, and Karsten Suhre. On the hypothesis-free tes-ting of metabolite ratios in genome-wide and metabolome-wide association stu-dies. BMC bioinformatics, 13:120, 2012. doi:10.1186/1471-2105-13-120.
[33] Marc Chadeau-Hyam, Timothy M D Ebbels, Ian J Brown, Queenie Chan, Jere-miah Stamler, Chiang Ching Huang, Martha L Daviglus, Hirotsugu Ueshima,Liancheng Zhao, Elaine Holmes, Jeremy K Nicholson, Paul Elliott, and Ma-ria De Iorio. Metabolic profiling and the metabolome-wide association study:significance level for biomarker identification. Journal of proteome research, 9:4620–4627, 2010. doi:10.1021/pr1003449.
[34] Karsten Suhre, So-Youn Shin, Ann-Kristin Petersen, Robert P Mohney, DavidMeredith, Brigitte Wägele, Elisabeth Altmaier, CARDIoGRAM, Panos De-loukas, Jeanette Erdmann, Elin Grundberg, Christopher J Hammond, Mar-tin Hrabé de Angelis, Gabi Kastenmüller, Anna Köttgen, et al. Human me-tabolic individuality in biomedical and pharmaceutical research. Nature, 477:54–60, 2011. doi:10.1038/nature10354.
[35] Matthias Arnold, Johannes Raffler, Arne Pfeufer, Karsten Suhre, andGabi Kastenmüller. SNiPA: an interactive, genetic variant-centered an-notation browser. Bioinformatics (Oxford, England), 31:1334–1336, 2015.doi:10.1093/bioinformatics/btu779.

118 Bibliography
[36] ENCODE Project Consortium. An integrated encyclopedia of DNA elementsin the human genome. Nature, 489:57–74, 2012. doi:10.1038/nature11247.
[37] Idan Gabdank, Esther T Chan, Jean M Davidson, Jason A Hilton, Carrie ADavis, Ulugbek K Baymuradov, Aditi Narayanan, Kathrina C Onate, KeenanGraham, Stuart R Miyasato, Timothy R Dreszer, J Seth Strattan, Otto Jolanki,Forrest Y Tanaka, Benjamin C Hitz, et al. Prevention of data duplication forhigh throughput sequencing repositories. Database : the journal of biologicaldatabases and curation, 2018, 2018. doi:10.1093/database/bay008.
[38] Minoru Kanehisa, Miho Furumichi, Mao Tanabe, Yoko Sato, and Kanae Mo-rishima. KEGG: new perspectives on genomes, pathways, diseases and drugs.Nucleic acids research, 45:D353–D361, 2017. doi:10.1093/nar/gkw1092.
[39] Shujiro Okuda, Takuji Yamada, Masami Hamajima, Masumi Itoh, ToshiakiKatayama, Peer Bork, Susumu Goto, and Minoru Kanehisa. KEGG Atlasmapping for global analysis of metabolic pathways. Nucleic acids research, 36:W423–W426, 2008. doi:10.1093/nar/gkn282.
[40] Werner Römisch-Margl, Cornelia Prehn, Ralf Bogumil, Cornelia Röhring,Karsten Suhre, and Jerzy Adamski. Procedure for tissue sample preparationand metabolite extraction for high-throughput targeted metabolomics. Meta-bolomics, 8(1):133–142, 2012. doi:10.1007/s11306-011-0293-4.
[41] Stephen J Bruce, Isabelle Tavazzi, Véronique Parisod, Serge Rezzi, Sunil Ko-chhar, and Philippe A Guy. Investigation of human blood plasma samplepreparation for performing metabolomics using ultrahigh performance liquidchromatography/mass spectrometry. Analytical chemistry, 81:3285–3296, 2009.doi:10.1021/ac8024569.
[42] Dajana Vuckovic. Current trends and challenges in sample preparation forglobal metabolomics using liquid chromatography-mass spectrometry. Analyti-cal and bioanalytical chemistry, 403:1523–1548, 2012. doi:10.1007/s00216-012-6039-y.
[43] Mark Haid, Caroline Muschet, Simone Wahl, Werner Römisch-Margl, CorneliaPrehn, Gabriele Möller, and Jerzy Adamski. Long-Term Stability of HumanPlasma Metabolites during Storage at -80 ◦C. Journal of proteome research,17:203–211, 2018. doi:10.1021/acs.jproteome.7b00518.

119
[44] Stefan Kg Grebe and Ravinder J Singh. LC-MS/MS in the Clinical Laboratory– Where to From Here? The Clinical biochemist. Reviews, 32:5–31, 2011.
[45] John W Honour. Benchtop mass spectrometry in clinical biochemistry. Annalsof clinical biochemistry, 40:628–638, 2003. doi:10.1258/000456303770367216.
[46] W J Griffiths, A P Jonsson, S Liu, D K Rai, and Y Wang. Electrospray andtandem mass spectrometry in biochemistry. The Biochemical journal, 355:545–561, 2001.
[47] Matthias Wilm. Principles of electrospray ionization. Molecular & cellularproteomics : MCP, 10:M111.009407, 2011. doi:10.1074/mcp.M111.009407.
[48] Matthias S Wilm and Matthias Mann. Electrospray and Taylor-Cone the-ory, Dole’s beam of macromolecules at last? International Journal of MassSpectrometry and Ion Processes, 136(2):167 – 180, 1994. doi:10.1016/0168-1176(94)04024-9.
[49] G J Van Berkel. Electrolytic deposition of metals on to the high-voltagecontact in an electrospray emitter: implications for gas-phase ion formation.Journal of mass spectrometry : JMS, 35:773–783, 2000. doi:10.1002/1096-9888(200007)35:7<773::AID-JMS4>3.0.CO;2-6.
[50] Andreas Wieser, Lukas Schneider, Jette Jung, and Sören Schubert. MALDI-TOF MS in microbiological diagnostics-identification of microorganisms andbeyond (mini review). Applied microbiology and biotechnology, 93:965–974,2012. doi:10.1007/s00253-011-3783-4.
[51] Michael Guilhaus. Special feature: Tutorial. Principles and instrumentation intime-of-flight mass spectrometry. Physical and instrumental concepts. Journalof Mass Spectrometry, 30(11):1519–1532, 1995. doi:10.1002/jms.1190301102.
[52] Jae C Schwartz, Michael W Senko, and John E P Syka. A two-dimensionalquadrupole ion trap mass spectrometer. Journal of the American Society forMass Spectrometry, 13:659–669, 2002. doi:10.1016/S1044-0305(02)00384-7.
[53] Loboda, Krutchinsky, Bromirski, Ens, and Standing. A tandemquadrupole/time-of-flight mass spectrometer with a matrix-assisted laser

120 Bibliography
desorption/ionization source: design and performance. Rapid communica-tions in mass spectrometry : RCM, 14:1047–1057, 2000. doi:10.1002/1097-0231(20000630)14:12<1047::AID-RCM990>3.0.CO;2-E.
[54] Raymond E March. An Introduction to Quadrupole Ion Trap MassSpectrometry. Journal of Mass Spectrometry, 32(4):351–369, 1997.doi:10.1002/(SICI)1096-9888(199704)32:4<351::AID-JMS512>3.0.CO;2-Y.
[55] Mark Hardman and Alexander A Makarov. Interfacing the orbitrap mass ana-lyzer to an electrospray ion source. Analytical chemistry, 75:1699–1705, 2003.doi:10.1021/ac0258047.
[56] Michaela Scigelova and Alexander Makarov. Orbitrap mass analyzer–overview and applications in proteomics. Proteomics, 6 Suppl 2:16–21, 2006.doi:10.1002/pmic.200600528.
[57] Gary L Glish and Richard W Vachet. The basics of mass spectrometry inthe twenty-first century. Nature reviews. Drug discovery, 2:140–150, 2003.doi:10.1038/nrd1011.
[58] Erin J Finehout and Kelvin H Lee. An introduction to mass spectrometryapplications in biological research. Biochemistry and molecular biology educa-tion : a bimonthly publication of the International Union of Biochemistry andMolecular Biology, 32:93–100, 2004. doi:10.1002/bmb.2004.494032020331.
[59] Ángel García-Bermejo, Manuela Ábalos, Jordi Sauló, Esteban Abad, María JoséGonzález, and Belén Gómara. Triple quadrupole tandem mass spectro-metry: A real alternative to high resolution magnetic sector instrumentfor the analysis of polychlorinated dibenzo-p-dioxins, furans and dioxin-like polychlorinated biphenyls. Analytica chimica acta, 889:156–165, 2015.doi:10.1016/j.aca.2015.07.039.
[60] Bo Wen, Li Ma, Sidney D Nelson, and Mingshe Zhu. High-throughput screeningand characterization of reactive metabolites using polarity switching of hybridtriple quadrupole linear ion trap mass spectrometry. Analytical chemistry, 80:1788–1799, 2008. doi:10.1021/ac702232r.
[61] C Borchers, C E Parker, L J Deterding, and K B Tomer. Preliminary compa-rison of precursor scans and liquid chromatography-tandem mass spectrometry

121
on a hybrid quadrupole time-of-flight mass spectrometer. Journal of Chroma-tography A, 854:119–130, 1999. doi:10.1016/S0021-9673(99)00479-3.
[62] Mira Petrović, Maria Dolores Hernando, M Silvia Díaz-Cruz, and Damià Bar-celó. Liquid chromatography–tandem mass spectrometry for the analysis ofpharmaceutical residues in environmental samples: a review. Journal of Chro-matography A, 1067:1–14, 2005. doi:10.1016/j.chroma.2004.10.110.
[63] M Jemal. High-throughput quantitative bioanalysis by LC/MS/MS. Bi-omedical chromatography : BMC, 14:422–429, 2000. doi:10.1002/1099-0801(200010)14:6<422::AID-BMC25>3.0.CO;2-I.
[64] William J Griffiths, Therese Koal, Yuqin Wang, Matthias Kohl, David PEnot, and Hans-Peter Deigner. Targeted metabolomics for biomarker disco-very. Angewandte Chemie (International ed. in English), 49:5426–5445, 2010.doi:10.1002/anie.200905579.
[65] Michaela Breier, Simone Wahl, Cornelia Prehn, Marina Fugmann, Uta Ferrari,Michaela Weise, Friederike Banning, Jochen Seissler, Harald Grallert, JerzyAdamski, and Andreas Lechner. Targeted metabolomics identifies reliable andstable metabolites in human serum and plasma samples. PloS one, 9:e89728,2014. doi:10.1371/journal.pone.0089728.
[66] Juan Manuel Cevallos-Cevallos and José Ignacio Reyes-De-Corcuera. Metabo-lomics in food science. Advances in food and nutrition research, 67:1–24, 2012.doi:10.1016/B978-0-12-394598-3.00001-0.
[67] Zhentian Lei, David V Huhman, and Lloyd W Sumner. Mass spectrometrystrategies in metabolomics. The Journal of biological chemistry, 286:25435–25442, 2011. doi:10.1074/jbc.R111.238691.
[68] Tobias Fuhrer and Nicola Zamboni. High-throughput discoverymetabolomics. Current opinion in biotechnology, 31:73–78, 2015.doi:10.1016/j.copbio.2014.08.006.
[69] Gary J Patti, Oscar Yanes, and Gary Siuzdak. Innovation: Metabolomics: theapogee of the omics trilogy. Nature reviews. Molecular cell biology, 13:263–269,2012. doi:10.1038/nrm3314.

122 Bibliography
[70] Katja Dettmer, Pavel A Aronov, and Bruce D Hammock. Massspectrometry-based metabolomics. Mass spectrometry reviews, 26:51–78, 2007.doi:10.1002/mas.20108.
[71] David S Wishart, Yannick Djoumbou Feunang, Ana Marcu, An Chi Guo, KevinLiang, Rosa Vázquez-Fresno, Tanvir Sajed, Daniel Johnson, Carin Li, NaamaKaru, Zinat Sayeeda, Elvis Lo, Nazanin Assempour, Mark Berjanskii, SandeepSinghal, et al. HMDB 4.0: the human metabolome database for 2018. Nucleicacids research, 46:D608–D617, 2018. doi:10.1093/nar/gkx1089.
[72] Sunghwan Kim, Paul A Thiessen, Evan E Bolton, Jie Chen, Gang Fu, AstaGindulyte, Lianyi Han, Jane He, Siqian He, Benjamin A Shoemaker, JiyaoWang, Bo Yu, Jian Zhang, and Stephen H Bryant. PubChem Substanceand Compound databases. Nucleic acids research, 44:D1202–D1213, 2016.doi:10.1093/nar/gkv951.
[73] Antony Williams and Valery Tkachenko. The Royal Society of Chemistryand the delivery of chemistry data repositories for the community. Journalof computer-aided molecular design, 28:1023–1030, 2014. doi:10.1007/s10822-014-9784-5.
[74] K. Murray Kermit, K. Boyd Robert, N. Eberlin Marcos, Langley G. John, Li Li-ang, and Naito Yasuhide. Definitions of terms relating to mass spectrometry(IUPAC Recommendations 2013), 2013.
[75] Tobias Kind and Oliver Fiehn. Metabolomic database annotations via query ofelemental compositions: mass accuracy is insufficient even at less than 1 ppm.BMC bioinformatics, 7:234, 2006. doi:10.1186/1471-2105-7-234.
[76] Anthony W T Bristow and Kenneth S Webb. Intercomparison study onaccurate mass measurement of small molecules in mass spectrometry. Jour-nal of the American Society for Mass Spectrometry, 14:1086–1098, 2003.doi:10.1016/S1044-0305(03)00403-3.
[77] A Gareth Brenton and A Ruth Godfrey. Accurate mass measurement: ter-minology and treatment of data. Journal of the American Society for MassSpectrometry, 21:1821–1835, 2010. doi:10.1016/j.jasms.2010.06.006.
[78] Alexandros P Siskos, Pooja Jain, Werner Römisch-Margl, Mark Bennett, DavidAchaintre, Yasmin Asad, Luke Marney, Larissa Richardson, Albert Koulman,

123
Julian L Griffin, Florence Raynaud, Augustin Scalbert, Jerzy Adamski, Corne-lia Prehn, and Hector C Keun. Interlaboratory Reproducibility of a TargetedMetabolomics Platform for Analysis of Human Serum and Plasma. Analyticalchemistry, 89:656–665, 2017. doi:10.1021/acs.analchem.6b02930.
[79] André B Canelas, Nicola Harrison, Alessandro Fazio, Jie Zhang, Juha-PekkaPitkänen, Joost van den Brink, Barbara M Bakker, Lara Bogner, JildauBouwman, Juan I Castrillo, Ayca Cankorur, Pramote Chumnanpuen, Pas-cale Daran-Lapujade, Duygu Dikicioglu, Karen van Eunen, et al. Integra-ted multilaboratory systems biology reveals differences in protein metabolismbetween two reference yeast strains. Nature communications, 1:145, 2010.doi:10.1038/ncomms1150.
[80] J T Wu. Screening for inborn errors of amino acid metabolism. Annals ofclinical and laboratory science, 21:123–142, 1991.
[81] Martin Lindner, Andreas Schulze, Siegfried Zabransky, Kurt Engelhorn, andGeorg Friedrich Hoffmann. Früherkennung von Stoffwechselerkrankungen –Neue Entwicklungen im Neugeborenenscreening. Medizinische Genetik, 13(4):342–347, 2001.
[82] Jens Nielsen. Systems Biology of Metabolism. Annual review of biochemistry,86:245–275, 2017. doi:10.1146/annurev-biochem-061516-044757.
[83] S E Stein and D R Scott. Optimization and testing of mass spectral librarysearch algorithms for compound identification. Journal of the American Societyfor Mass Spectrometry, 5:859–866, 1994. doi:10.1016/1044-0305(94)87009-8.
[84] Kerstin Scheubert, Franziska Hufsky, and Sebastian Böcker. Computationalmass spectrometry for small molecules. Journal of cheminformatics, 5:12, 2013.doi:10.1186/1758-2946-5-12.
[85] Ralf Tautenhahn, Kevin Cho, Winnie Uritboonthai, Zhengjiang Zhu, Gary JPatti, and Gary Siuzdak. An accelerated workflow for untargeted metabolo-mics using the METLIN database. Nature biotechnology, 30:826–828, 2012.doi:10.1038/nbt.2348.
[86] Rónán Daly, Simon Rogers, Joe Wandy, Andris Jankevics, Karl E V Burgess,and Rainer Breitling. MetAssign: probabilistic annotation of metabolites from

124 Bibliography
LC-MS data using a Bayesian clustering approach. Bioinformatics (Oxford,England), 30:2764–2771, 2014. doi:10.1093/bioinformatics/btu370.
[87] Felicity Allen, Russ Greiner, and David Wishart. Competitive fragmentationmodeling of ESI-MS/MS spectra for putative metabolite identification. Meta-bolomics, 11(1):98–110, 2015. doi:10.1007/s11306-014-0676-4.
[88] Christoph Ruttkies, Emma L Schymanski, Sebastian Wolf, Juliane Hollen-der, and Steffen Neumann. MetFrag relaunched: incorporating strategiesbeyond in silico fragmentation. Journal of cheminformatics, 8:3, 2016.doi:10.1186/s13321-016-0115-9.
[89] William M B Edmands, Lauren Petrick, Dinesh K Barupal, Augustin Scal-bert, Mark J Wilson, Jeffrey K Wickliffe, and Stephen M Rappaport.compMS2Miner: An Automatable Metabolite Identification, Visualization, andData-Sharing R Package for High-Resolution LC-MS Data Sets. Analytical che-mistry, 89:3919–3928, 2017. doi:10.1021/acs.analchem.6b02394.
[90] Markus Heinonen, Huibin Shen, Nicola Zamboni, and Juho Rousu. Me-tabolite identification and molecular fingerprint prediction through ma-chine learning. Bioinformatics (Oxford, England), 28:2333–2341, 2012.doi:10.1093/bioinformatics/bts437.
[91] Huibin Shen, Kai Dührkop, Sebastian Böcker, and Juho Rousu. Me-tabolite identification through multiple kernel learning on fragmenta-tion trees. Bioinformatics (Oxford, England), 30:i157–i164, 2014.doi:10.1093/bioinformatics/btu275.
[92] Kai Dührkop, Huibin Shen, Marvin Meusel, Juho Rousu, and Sebastian Böc-ker. Searching molecular structure databases with tandem mass spectra usingCSI:FingerID. Proceedings of the National Academy of Sciences of the UnitedStates of America, 112:12580–12585, 2015. doi:10.1073/pnas.1509788112.
[93] Dai Hai Nguyen, Canh Hao Nguyen, and Hiroshi Mamitsuka. SIMPLE: SparseInteraction Model over Peaks of moLEcules for fast, interpretable metaboliteidentification from tandem mass spectra. Bioinformatics (Oxford, England),34:i323–i332, 2018. doi:10.1093/bioinformatics/bty252.

125
[94] Dmitry Grapov, Kwanjeera Wanichthanarak, and Oliver Fiehn. Me-taMapR: pathway independent metabolomic network analysis incorpora-ting unknowns. Bioinformatics (Oxford, England), 31:2757–2760, 2015.doi:10.1093/bioinformatics/btv194.
[95] Jens Nielsen. Systems Biology of Metabolism: A Driver for DevelopingPersonalized and Precision Medicine. Cell metabolism, 25:572–579, 2017.doi:10.1016/j.cmet.2017.02.002.
[96] Thijs Grunhagen, Aboulfazl Shirazi-Adl, Jeremy C T Fairbank, and Jill P GUrban. Intervertebral disk nutrition: a review of factors influencing concentra-tions of nutrients and metabolites. The Orthopedic clinics of North America,42:465–77, vii, 2011. doi:10.1016/j.ocl.2011.07.010.
[97] Nikolaos Psychogios, David D Hau, Jun Peng, An Chi Guo, Rupasri Mandal,Souhaila Bouatra, Igor Sinelnikov, Ramanarayan Krishnamurthy, Roman Eis-ner, Bijaya Gautam, Nelson Young, Jianguo Xia, Craig Knox, Edison Dong,Paul Huang, et al. The human serum metabolome. PloS one, 6:e16957, 2011.doi:10.1371/journal.pone.0016957.
[98] Lindsay M Edwards. Metabolic systems biology: a brief primer. The Journalof physiology, 595:2849–2855, 2017. doi:10.1113/JP272275.
[99] Bensu Karahalil. Overview of Systems Biology and Omics Tech-nologies. Current medicinal chemistry, 23:4221–4230, 2016.doi:10.2174/0929867323666160926150617.
[100] Peter Kohl and Denis Noble. Systems biology and the virtual physiologicalhuman. Molecular systems biology, 5:292, 2009. doi:10.1038/msb.2009.51.
[101] Francis Crick. Central dogma of molecular biology. Nature, 227:561–563, 1970.doi:10.1038/227561a0.
[102] Wolfgang Epstein and Jonathan R Beckwith. Regulation of geneexpression. Annual Review of Biochemistry, 37(1):411–436, 1968.doi:10.1146/annurev.bi.37.070168.002211.
[103] Rudolf Jaenisch and Adrian Bird. Epigenetic regulation of gene expression: howthe genome integrates intrinsic and environmental signals. Nature genetics, 33Suppl:245–254, 2003. doi:10.1038/ng1089.

126 Bibliography
[104] Quan Zhong, Samuel J Pevzner, Tong Hao, Yang Wang, Roberto Mosca, JörgMenche, Mikko Taipale, Murat Taşan, Changyu Fan, Xinping Yang, PatrickHaley, Ryan R Murray, Flora Mer, Fana Gebreab, Stanley Tam, et al. An inter-species protein-protein interaction network across vast evolutionary distance.Molecular systems biology, 12:865, 2016. doi:10.15252/msb.20156484.
[105] Daniel R Hyduke, Nathan E Lewis, and Bernhard Ø Palsson. Analysis of omicsdata with genome-scale models of metabolism. Molecular bioSystems, 9:167–174, 2013. doi:10.1039/c2mb25453k.
[106] Albert-László Barabási. Scale-free networks: a decade and beyond. Science(New York, N.Y.), 325:412–413, 2009. doi:10.1126/science.1173299.
[107] Albert-László Barabási, Natali Gulbahce, and Joseph Loscalzo. Network me-dicine: a network-based approach to human disease. Nature reviews. Genetics,12:56–68, 2011. doi:10.1038/nrg2918.
[108] István A Kovács and Albert-László Barabási. Network science: Destructionperfected. Nature, 524:38–39, 2015. doi:10.1038/524038a.
[109] Albert-László Barabási and Zoltán N Oltvai. Network biology: understandingthe cell’s functional organization. Nature reviews. Genetics, 5:101–113, 2004.doi:10.1038/nrg1272.
[110] Ines Thiele, Neil Swainston, Ronan M T Fleming, Andreas Hoppe, Swaga-tika Sahoo, Maike K Aurich, Hulda Haraldsdottir, Monica L Mo, Ottar Rolfs-son, Miranda D Stobbe, Stefan G Thorleifsson, Rasmus Agren, Christian Böl-ling, Sergio Bordel, Arvind K Chavali, et al. A community-driven global re-construction of human metabolism. Nature biotechnology, 31:419–425, 2013.doi:10.1038/nbt.2488.
[111] Elizabeth Brunk, Swagatika Sahoo, Daniel C Zielinski, Ali Altunkaya, AndreasDräger, Nathan Mih, Francesco Gatto, Avlant Nilsson, German Andres Pre-ciat Gonzalez, Maike Kathrin Aurich, Andreas Prlić, Anand Sastry, Anna DDanielsdottir, Almut Heinken, Alberto Noronha, et al. Recon3D enables athree-dimensional view of gene variation in human metabolism. Nature bio-technology, 36:272–281, 2018. doi:10.1038/nbt.4072.
[112] Antonio Rosato, Leonardo Tenori, Marta Cascante, Pedro RamonDe Atauri Carulla, Vitor A P Martins Dos Santos, and Edoardo Saccenti. From

127
correlation to causation: analysis of metabolomics data using systems biologyapproaches. Metabolomics : Official journal of the Metabolomic Society, 14:37,2018. doi:10.1007/s11306-018-1335-y.
[113] Khuram Shahzad and Juan J. Loor. Application of Top-Down and Bottom-up Systems Approaches in Ruminant Physiology and Metabolism. CurrentGenomics, 13(PMC3401895):379–394, 2012. doi:10.2174/138920212801619269.
[114] Ron Caspi, Richard Billington, Carol A Fulcher, Ingrid M Keseler, AnamikaKothari, Markus Krummenacker, Mario Latendresse, Peter E Midford, QuangOng, Wai Kit Ong, Suzanne Paley, Pallavi Subhraveti, and Peter D Karp. TheMetaCyc database of metabolic pathways and enzymes. Nucleic acids research,46:D633–D639, 2018. doi:10.1093/nar/gkx935.
[115] Pedro Romero, Jonathan Wagg, Michelle L Green, Dale Kaiser, Markus Krum-menacker, and Peter D Karp. Computational prediction of human metabolicpathways from the complete human genome. Genome biology, 6:R2, 2004.doi:10.1186/gb-2004-6-1-r2.
[116] F Hoffmann-La Roche Ltd Corporate Donations and Philanthropy, 4070 Basel,Switzerland. Roche Biochemical Pathways, 4th Edition, 2014. URL http://biochemical-pathways.com.
[117] Sandra Placzek, Ida Schomburg, Antje Chang, Lisa Jeske, Marcus Ulbrich,Jana Tillack, and Dietmar Schomburg. BRENDA in 2017: new perspecti-ves and new tools in BRENDA. Nucleic acids research, 45:D380–D388, 2017.doi:10.1093/nar/gkw952.
[118] Jan Krumsiek, Karsten Suhre, Thomas Illig, Jerzy Adamski, and Fabian JTheis. Gaussian graphical modeling reconstructs pathway reactions fromhigh-throughput metabolomics data. BMC systems biology, 5:21, 2011.doi:10.1186/1752-0509-5-21.
[119] Jeremy K Nicholson and John C Lindon. Systems biology: Metabonomics.Nature, 455(7216):1054–1056, 2008. doi:10.1038/4551054a.
[120] Joseph Loscalzo and Albert-Laszlo Barabasi. Systems biology and the futureof medicine. Wiley interdisciplinary reviews. Systems biology and medicine, 3:619–627, 2011. doi:10.1002/wsbm.144.

128 Bibliography
[121] Mika Gustafsson, Colm E Nestor, Huan Zhang, Albert-László Barabási, SergioBaranzini, Sören Brunak, Kian Fan Chung, Howard J Federoff, Anne-ClaudeGavin, Richard R Meehan, Paola Picotti, Miguel Àngel Pujana, Nikolaus Ra-jewsky, Kenneth Gc Smith, Peter J Sterk, et al. Modules, networks and systemsmedicine for understanding disease and aiding diagnosis. Genome medicine, 6:82, 2014. doi:10.1186/s13073-014-0082-6.
[122] Jörg Menche, Amitabh Sharma, Maksim Kitsak, Susan Dina Ghiassian, MarcVidal, Joseph Loscalzo, and Albert-László Barabási. Disease networks. Uncove-ring disease-disease relationships through the incomplete interactome. Science(New York, N.Y.), 347:1257601, 2015. doi:10.1126/science.1257601.
[123] J Larry Jameson and Dan L Longo. Precision medicine–personalized, proble-matic, and promising. The New England journal of medicine, 372:2229–2234,2015. doi:10.1056/NEJMsb1503104.
[124] Richard D Beger, Warwick Dunn, Michael A Schmidt, Steven S Gross, Jen-nifer A Kirwan, Marta Cascante, Lorraine Brennan, David S Wishart, MatejOresic, Thomas Hankemeier, David I Broadhurst, Andrew N Lane, KarstenSuhre, Gabi Kastenmüller, Susan J Sumner, et al. Metabolomics enables pre-cision medicine: “A White Paper, Community Perspective”. Metabolomics :Official journal of the Metabolomic Society, 12:149, 2016. doi:10.1007/s11306-016-1094-6.
[125] Peiyuan Yin and Guowang Xu. Current state-of-the-art of nontargeted meta-bolomics based on liquid chromatography-mass spectrometry with special emp-hasis in clinical applications. Journal of Chromatography A, 1374:1–13, 2014.doi:10.1016/j.chroma.2014.11.050.
[126] Mark R Viant, Irwin J Kurland, Martin R Jones, and Warwick B Dunn. Howclose are we to complete annotation of metabolomes? Current opinion inchemical biology, 36:64–69, 2017. doi:10.1016/j.cbpa.2017.01.001.
[127] Darren J Creek, Warwick B Dunn, Oliver Fiehn, Julian L Griffin, Robert DHall, Zhentian Lei, Robert Mistrik, Steffen Neumann, Emma L Schymanski,Lloyd W Sumner, Robert Trengove, and Jean-Luc Wolfender. Metabolite iden-tification: are you sure? And how do your peers gauge your confidence? Me-tabolomics, 10(3):350–353, 2014. doi:10.1007/s11306-014-0656-8.
129
[128] Lloyd W Sumner, Zhentian Lei, Basil J Nikolau, Kazuki Saito, UteRoessner, and Robert Trengove. Proposed quantitative and alphanume-ric metabolite identification metrics. Metabolomics, 10(6):1047–1049, 2014.doi:10.1007/s11306-014-0739-6.
[129] Gerrit van Meer, Dennis R Voelker, and Gerald W Feigenson. Membrane lipids:where they are and how they behave. Nature reviews. Molecular cell biology, 9:112–124, 2008. doi:10.1038/nrm2330.
[130] Katharina Leidl, Gerhard Liebisch, Dorothea Richter, and Gerd Schmitz. Massspectrometric analysis of lipid species of human circulating blood cells. Biochi-mica et biophysica acta, 1781:655–664, 2008. doi:10.1016/j.bbalip.2008.07.008.
[131] Laura K Cole, Jean E Vance, and Dennis E Vance. Phosphatidylcholine bi-osynthesis and lipoprotein metabolism. Biochimica et biophysica acta, 1821:754–761, 2012. doi:10.1016/j.bbalip.2011.09.009.
[132] Jelske N van der Veen, John P Kennelly, Sereana Wan, Jean E Vance, Den-nis E Vance, and René L Jacobs. The critical role of phosphatidylcholine andphosphatidylethanolamine metabolism in health and disease. Biochimica etbiophysica acta, 1859:1558–1572, 2017. doi:10.1016/j.bbamem.2017.04.006.
[133] Peiyuan Yin, Patamu Mohemaiti, Jing Chen, Xinjie Zhao, Xin Lu, AdilijiangYimiti, Halmurat Upur, and Guowang Xu. Serum metabolic profiling of ab-normal savda by liquid chromatography/mass spectrometry. Journal of Chro-matography B, Analytical technologies in the biomedical and life sciences, 871:322–327, 2008. doi:10.1016/j.jchromb.2008.05.043.
[134] J Peterson, B E Bihain, G Bengtsson-Olivecrona, R J Deckelbaum, Y A Car-pentier, and T Olivecrona. Fatty acid control of lipoprotein lipase: a linkbetween energy metabolism and lipid transport. Proceedings of the Natio-nal Academy of Sciences of the United States of America, 87:909–913, 1990.doi:10.1073/pnas.87.3.909.
[135] Artemis P Simopoulos. The importance of the omega-6/omega-3 fatty acidratio in cardiovascular disease and other chronic diseases. Experimental biologyand medicine (Maywood, N.J.), 233:674–688, 2008. doi:10.3181/0711-MR-311.

130 Bibliography
[136] Masato Abe, Yoshiki Sawada, Shinpei Uno, Shuhei Chigasaki, Masahide Oku,Yasuyoshi Sakai, and Hideto Miyoshi. Role of Acyl Chain Composition of Phos-phatidylcholine in Tafazzin-Mediated Remodeling of Cardiolipin in Liposomes.Biochemistry, 56:6268–6280, 2017. doi:10.1021/acs.biochem.7b00941.
[137] Masahiro Nagahama, Akiko Otsuka, Masataka Oda, Rajesh K Singh,Zyta M Ziora, Hiroshi Imagawa, Mugio Nishizawa, and Jun Sakurai. Ef-fect of unsaturated bonds in the sn-2 acyl chain of phosphatidylcholineon the membrane-damaging action of Clostridium perfringens alpha-toxintoward liposomes. Biochimica et biophysica acta, 1768:2940–2945, 2007.doi:10.1016/j.bbamem.2007.08.016.
[138] Benjamin Jenkins, James A West, and Albert Koulman. A Review of Odd-Chain Fatty Acid Metabolism and the Role of Pentadecanoic Acid (C15:0)and Heptadecanoic Acid (C17:0) in Health and Disease. Molecules (Basel,Switzerland), 20:2425–2444, 2015. doi:10.3390/molecules20022425.
[139] L Marai and A Kuksis. Molecular species of lecithins from erythrocytes andplasma of man. Journal of Lipid Research, 10:141–152, 1969.
[140] Karsten Suhre, Werner Römisch-Margl, Martin Hrabé de Angelis, JerzyAdamski, Gerd Luippold, and Robert Augustin. Identification of a po-tential biomarker for FABP4 inhibition: the power of lipidomics in pre-clinical drug testing. Journal of biomolecular screening, 16:467–475, 2011.doi:10.1177/1087057111402200.
[141] Anna Floegel, Norbert Stefan, Zhonghao Yu, Kristin Mühlenbruch, DagmarDrogan, Hans-Georg Joost, Andreas Fritsche, Hans-Ulrich Häring, MartinHrabe de Angelis, Annette Peters, Michael Roden, Cornelia Prehn, Rui Wang-Sattler, Thomas Illig, Matthias B Schulze, et al. Identification of serum me-tabolites associated with risk of type 2 diabetes using a targeted metabolomicapproach. Diabetes, 62:639–648, 2013. doi:10.2337/db12-0495.
[142] Luke Whiley, Arundhuti Sen, James Heaton, Petroula Proitsi, Diego García-Gómez, Rufina Leung, Norman Smith, Madhav Thambisetty, Iwona Kloszew-ska, Patrizia Mecocci, Hilkka Soininen, Magda Tsolaki, Bruno Vellas, SimonLovestone, Cristina Legido-Quigley, et al. Evidence of altered phosphatidyl-choline metabolism in Alzheimer’s disease. Neurobiology of aging, 35:271–278,2014. doi:10.1016/j.neurobiolaging.2013.08.001.
131
[143] Jon B Toledo, Matthias Arnold, Gabi Kastenmüller, Rui Chang, Rebecca ABaillie, Xianlin Han, Madhav Thambisetty, Jessica D Tenenbaum, KarstenSuhre, J Will Thompson, Lisa St John-Williams, Siamak MahmoudianDe-hkordi, Daniel M Rotroff, John R Jack, Alison Motsinger-Reif, et al. Metabolicnetwork failures in Alzheimer’s disease: A biochemical road map. Alzheimer’s& dementia : the journal of the Alzheimer’s Association, 13:965–984, 2017.doi:10.1016/j.jalz.2017.01.020.
[144] Harmen H M Draisma, René Pool, Michael Kobl, Rick Jansen, Ann-KristinPetersen, Anika A M Vaarhorst, Idil Yet, Toomas Haller, Ayse Demirkan, TõnuEsko, Gu Zhu, Stefan Böhringer, Marian Beekman, Jan Bert van Klinken,Werner Römisch-Margl, et al. Genome-wide association study identifies novelgenetic variants contributing to variation in blood metabolite levels. Naturecommunications, 6:7208, 2015. doi:10.1038/ncomms8208.
[145] Sergio Lario, Maria José Ramírez-Lázaro, Daniel Sanjuan-Herráez, AnnaBrunet-Vega, Carles Pericay, Lourdes Gombau, Félix Junquera, GuillermoQuintás, and Xavier Calvet. Plasma sample based analysis of gastric can-cer progression using targeted metabolomics. Scientific reports, 7:17774, 2017.doi:10.1038/s41598-017-17921-x.
[146] Erwan Werner, Jean-François Heilier, Céline Ducruix, Eric Ezan, ChristopheJunot, and Jean-Claude Tabet. Mass spectrometry for the identification of thediscriminating signals from metabolomics: current status and future trends.Journal of Chromatography B, Analytical technologies in the biomedical andlife sciences, 871:143–163, 2008. doi:10.1016/j.jchromb.2008.07.004.
[147] Jan Krumsiek, Karsten Suhre, Anne M Evans, Matthew W Mitchell, Robert PMohney, Michael V Milburn, Brigitte Wägele, Werner Römisch-Margl, Tho-mas Illig, Jerzy Adamski, Christian Gieger, Fabian J Theis, and Gabi Kasten-müller. Mining the unknown: a systems approach to metabolite identificationcombining genetic and metabolic information. PLoS genetics, 8:e1003005, 2012.doi:10.1371/journal.pgen.1003005.
[148] Rainer Breitling, Shawn Ritchie, Dayan Goodenowe, Mhairi L Stewart, andMichael P Barrett. Ab initio prediction of metabolic networks using Fouriertransform mass spectrometry data. Metabolomics : Official journal of the Me-tabolomic Society, 2:155–164, 2006. doi:10.1007/s11306-006-0029-z.

132 Bibliography
[149] Jan D Quell, Werner Römisch-Margl, Mark Haid, Jan Krumsiek, ThomasSkurk, Jerzy Adamski, Hans Hauner, Robert Mohney, Hannelore Daniel,Karsten Suhre, and Gabi Kastenmüller. A platform comparison to characterizecompositions of phosphatidylcholines measured as lipid sums in human plasma.Manuscript for concurrent submission to the Journal of Lipid Research.
[150] Jan D Quell, Werner Römisch-Margl, Marco Colombo, Jan Krumsiek, Anne MEvans, Robert Mohney, Veikko Salomaa, Ulf de Faire, Leif C Groop, FelixAgakov, Helen C Looker, Paul McKeigue, Helen M Colhoun, and Gabi Kasten-müller. Automated pathway and reaction prediction facilitates in silico iden-tification of unknown metabolites in human cohort studies. Journal of Chro-matography B, Analytical technologies in the biomedical and life sciences, 1071:58–67, 2017. doi:10.1016/j.jchromb.2017.04.002.
[151] R Core Team. R: A Language and Environment for Statistical Computing. RFoundation for Statistical Computing, Vienna, Austria, R version 3.4.0 edition,2017. URL http://www.R-project.org/.
[152] E Ullah, M Shahzad, R Rawi, M Dehbi, K Suhre, M Selim, and H Bensmail.Integrative 1H-NMR-based Metabolomic Profiling to Identify Type-2 DiabetesBiomarkers: An Application to a Population of Qatar. Metabolomics:OpenAccess, 5(1):1–8, 2015. doi:10.4172/2153-0769.1000136.
[153] Baljit K Ubhi, Alex Conner, Eva Duchoslav, Annie Evans, Richard Robinson,Leo Wang, Paul RS Baker, and Steve Watkins. A Novel Lipid Screening Plat-form that Provides a Complete Solution for Lipidomics Research. AB SCIEXTechnical Application Note, RUO-MKT-02-2871B, 2016.
[154] Baljit K Ubhi. Novel Chemical Standards Kits Enable Facile Lipid Quantita-tion. AB SCIEX Technical Application Note, RUO-MKT-02-3879-A, 2016.
[155] Paul R S Baker, Aaron M Armando, J Larry Campbell, Oswald Quehenber-ger, and Edward A Dennis. Three-dimensional enhanced lipidomics analysiscombining UPLC, differential ion mobility spectrometry, and mass spectro-metric separation strategies. Journal of Lipid Research, 55:2432–2442, 2014.doi:10.1194/jlr.D051581.
[156] Tuulia P I Lintonen, Paul R S Baker, Matti Suoniemi, Baljit K Ubhi, Kaisa MKoistinen, Eva Duchoslav, J Larry Campbell, and Kim Ekroos. Differential mo-

133
bility spectrometry-driven shotgun lipidomics. Analytical chemistry, 86:9662–9669, 2014. doi:10.1021/ac5021744.
[157] E G Bligh and W J Dyer. A rapid method of total lipid extraction and pu-rification. Canadian journal of biochemistry and physiology, 37:911–917, 1959.doi:10.1139/o59-099.
[158] Yves LeBlanc, Doina Caraiman, Mauro Aiello, and Hesham Ghobarah. Se-lexION Technology: A New Solution to Selectivity Challenges in QuantitativeBioanalysis. AB SCIEX Technical Note, RUO-MKT-02-3251-A, 2015.
[159] Paul RS Baker, J Larry Campbell, Eva Duchoslav, and Christie Hunter. Diffe-rential Mobility Separation for Improving Lipidomic Analysis by Mass Spectro-metry. AB SCIEX Technical Application Note, RUO-MKT-02-4802-A, 2017.
[160] Baljit K Ubhi. Direct Infusion-Tandem Mass Spectrometry (DI-MS/MS) Ana-lysis of Complex Lipids in Human Plasma and Serum Using the LipidyzerTM
Platform. Methods in molecular biology (Clifton, N.J.), 1730:227–236, 2018.doi:10.1007/978-1-4939-7592-1_15.
[161] Andras Franko, Dietrich Merkel, Marketa Kovarova, Miriam Hoene, Benja-min A Jaghutriz, Martin Heni, Alfred Königsrainer, Cyrus Papan, Stefan Lehr,Hans-Ulrich Häring, and Andreas Peter. Dissociation of Fatty Liver and In-sulin Resistance in I148M PNPLA3 Carriers: Differences in Diacylglycerol(DAG) FA18:1 Lipid Species as a Possible Explanation. Nutrients, 10, 2018.doi:10.3390/nu10091314.
[162] Gerhard Liebisch, Juan Antonio Vizcaíno, Harald Köfeler, Martin Trötzmüller,William J Griffiths, Gerd Schmitz, Friedrich Spener, and Michael J O Wake-lam. Shorthand notation for lipid structures derived from mass spectrometry.Journal of Lipid Research, 54:1523–1530, 2013. doi:10.1194/jlr.M033506.
[163] Anne M Evans, Corey D DeHaven, Tom Barrett, Matt Mitchell, andEric Milgram. Integrated, nontargeted ultrahigh performance liquid chro-matography/electrospray ionization tandem mass spectrometry platform forthe identification and relative quantification of the small-molecule com-plement of biological systems. Analytical chemistry, 81:6656–6667, 2009.doi:10.1021/ac901536h.

134 Bibliography
[164] Kurt J Boudonck, Matthew W Mitchell, Jacob Wulff, and John A Ryals. Char-acterization of the biochemical variability of bovine milk using metabolomics.Metabolomics, 5(4):375–386, 2009. doi:10.1007/s11306-009-0160-8.
[165] AM Evans, BR Bridgewater, Q Liu, MW Mitchell, RJ Robinson, H Dai,SJ Stewart, CD DeHaven, and LAD Miller. High Resolution Mass Spectrome-try Improves Data Quantity and Quality as Compared to Unit Mass ResolutionMass Spectrometry in High- Throughput Profiling Metabolomics. Metabolo-mics, 4(132):1–7, 2014. doi:10.4172/2153-0769.1000132.
[166] Roman A Zubarev and Alexander Makarov. Orbitrap mass spectrometry. Ana-lytical chemistry, 85:5288–5296, 2013. doi:10.1021/ac4001223.
[167] So-Youn Shin, Eric B Fauman, Ann-Kristin Petersen, Jan Krumsiek, Rita San-tos, Jie Huang, Matthias Arnold, Idil Erte, Vincenzo Forgetta, Tsun-Po Yang,Klaudia Walter, Cristina Menni, Lu Chen, Louella Vasquez, Ana M Valdes,et al. An atlas of genetic influences on human blood metabolites. Naturegenetics, 46:543–550, 2014. doi:10.1038/ng.2982.
[168] Scott Saobing Chen and Ramesh A Gopinath. Gaussianization. In T KLeen, T G Dietterich, and V Tresp, editors, Advances in Neural Informa-tion Processing Systems 13, pages 423–429. MIT Press, 2001. URL http://papers.nips.cc/paper/1856-gaussianization.pdf.
[169] S van Buuren and Karin Groothuis-Oudshoorn. mice: Multivariate imputationby chained equations in R. Journal of statistical software, pages 1–68, 2010.URL https://www.jstatsoft.org/article/view/v045i03.
[170] Juliane Schaefer, Rainer Opgen-Rhein, and Korbinian Strimmer. GeneNet:modeling and inferring gene networks. 1(8), 2013. URL https://cran.r-project.org/web/packages/GeneNet/.
[171] J van Helden, L Wernisch, D Gilbert, and S J Wodak. Graph-based analysisof metabolic networks. Ernst Schering Research Foundation workshop, pages245–274, 2002. doi:10.1007/978-3-662-04747-7_12.
[172] Vincent Lacroix, Ludovic Cottret, Patricia Thébault, and Marie-France Sa-got. An introduction to metabolic networks and their structural analysis.IEEE/ACM transactions on computational biology and bioinformatics, 5:594–617, 2008. doi:10.1109/TCBB.2008.79.

135
[173] Clément Frainay and Fabien Jourdan. Computational methods to identify me-tabolic sub-networks based on metabolomic profiles. Briefings in bioinformat-ics, 18:43–56, 2017. doi:10.1093/bib/bbv115.
[174] Pascal Schlosser, ..., and Anna Köttgen. Genome-wide Association Studies ofUrine Metabolite Concentrations among CKD Patients Identifies Multiple LociRelated to Metabolite Excretion and Detoxification. Manuscript in preparation.
[175] Manish Sud, Eoin Fahy, Dawn Cotter, Alex Brown, Edward A Dennis, Chris-topher K Glass, Alfred H Merrill, Robert C Murphy, Christian R H Raetz,David W Russell, and Shankar Subramaniam. LMSD: LIPID MAPS structuredatabase. Nucleic acids research, 35:D527–D532, 2007. doi:10.1093/nar/gkl838.
[176] PubChem Data Specification. PubChem Substructure Fingerprint, 2009. URLftp://ftp.ncbi.nlm.nih.gov/pubchem/specifications/pubchem_sdtags.pdf.
[177] Dávid Bajusz, Anita Rácz, and Károly Héberger. Why is Tanimoto index anappropriate choice for fingerprint-based similarity calculations? Journal ofcheminformatics, 7:20, 2015. doi:10.1186/s13321-015-0069-3.
[178] Yan Wang, Tyler W H Backman, Kevin Horan, and Thomas Girke. fmcsR: mis-match tolerant maximum common substructure searching in R. Bioinformatics(Oxford, England), 29:2792–2794, 2013. doi:10.1093/bioinformatics/btt475.
[179] Yiqun Cao, Anna Charisi, Li-Chang Cheng, Tao Jiang, and Thomas Girke.ChemmineR: a compound mining framework for R. Bioinformatics (Oxford,England), 24:1733–1734, 2008. doi:10.1093/bioinformatics/btn307.
[180] Max Kuhn. Contributions from Jed Wing, Steve Weston, Andre Williams,Chris Keefer, Allan Engelhardt, Tony Cooper, Zachary Mayer, Brenton Ken-kel, the R Core Team, Michael Benesty, Reynald Lescarbeau, Andrew Ziem,Luca Scrucca, Yuan Tang, Can Candan, et al. caret: Classification and Regres-sion Training, 2017. URL https://CRAN.R-project.org/package=caret. Rpackage version 6.0-78.
[181] Idil Yet, Cristina Menni, So-Youn Shin, Massimo Mangino, Nicole So-ranzo, Jerzy Adamski, Karsten Suhre, Tim D Spector, Gabi Kastenmül-ler, and Jordana T Bell. Genetic Influences on Metabolite Levels: A

136 Bibliography
Comparison across Metabolomic Platforms. PloS one, 11:e0153672, 2016.doi:10.1371/journal.pone.0153672.
[182] Rui Wang-Sattler, Zhonghao Yu, Christian Herder, Ana C Messias, Anna Floe-gel, Ying He, Katharina Heim, Monica Campillos, Christina Holzapfel, BarbaraThorand, Harald Grallert, Tao Xu, Erik Bader, Cornelia Huth, Kirstin Mittel-strass, et al. Novel biomarkers for pre-diabetes identified by metabolomics.Molecular systems biology, 8:615, 2012. doi:10.1038/msb.2012.43.
[183] Janina S Ried, So-Youn Shin, Jan Krumsiek, Thomas Illig, Fabian J Theis,Tim D Spector, Jerzy Adamski, H-Erich Wichmann, Konstantin Strauch, Ni-cole Soranzo, Karsten Suhre, and Christian Gieger. Novel genetic associationswith serum level metabolites identified by phenotype set enrichment analyses.Human molecular genetics, 23:5847–5857, 2014. doi:10.1093/hmg/ddu301.
[184] Karsten Suhre, Christa Meisinger, Angela Döring, Elisabeth Altmaier, PetraBelcredi, Christian Gieger, David Chang, Michael V Milburn, Walter E Gall,Klaus M Weinberger, Hans-Werner Mewes, Martin Hrabé de Angelis, H-ErichWichmann, Florian Kronenberg, Jerzy Adamski, et al. Metabolic footprint ofdiabetes: a multiplatform metabolomics study in an epidemiological setting.PloS one, 5:e13953, 2010. doi:10.1371/journal.pone.0013953.
[185] Michal Holčapek, Magdaléna Ovčačíková, Miroslav Lísa, Eva Cífková,and Tomáš Hájek. Continuous comprehensive two-dimensional liquidchromatography-electrospray ionization mass spectrometry of complex lipi-domic samples. Analytical and bioanalytical chemistry, 407:5033–5043, 2015.doi:10.1007/s00216-015-8528-2.
[186] Magdaléna Ovčačíková, Miroslav Lísa, Eva Cífková, and Michal Holčapek.Retention behavior of lipids in reversed-phase ultrahigh-performance liquidchromatography-electrospray ionization mass spectrometry. Journal of chro-matography. A, 1450:76–85, 2016. doi:10.1016/j.chroma.2016.04.082.
[187] Evelyn Rampler, Harald Schoeny, Bernd M Mitic, Yasin El Abiead, MichaelaSchwaiger, and Gunda Koellensperger. Simultaneous non-polar and polar lipidanalysis by on-line combination of HILIC, RP and high resolution MS. TheAnalyst, 143:1250–1258, 2018. doi:10.1039/c7an01984j.

137
[188] Jeremy P Koelmel, Nicholas M Kroeger, Candice Z Ulmer, John A Bowden,Rainey E Patterson, Jason A Cochran, Christopher W W Beecher, Timothy JGarrett, and Richard A Yost. LipidMatch: an automated workflow for rule-based lipid identification using untargeted high-resolution tandem mass spectro-metry data. BMC bioinformatics, 18:331, 2017. doi:10.1186/s12859-017-1744-3.
[189] Jürgen Hartler, Alexander Triebl, Andreas Ziegl, Martin Trötzmüller, Gerald NRechberger, Oana A Zeleznik, Kathrin A Zierler, Federico Torta, AmauryCazenave-Gassiot, Markus R Wenk, Alexander Fauland, Craig E Wheelock,Aaron M Armando, Oswald Quehenberger, Qifeng Zhang, et al. Decipheringlipid structures based on platform-independent decision rules. Nature methods,14:1171–1174, 2017. doi:10.1038/nmeth.4470.
[190] Michael A Kochen, Matthew C Chambers, Jay D Holman, Alexey I Nesviz-hskii, Susan T Weintraub, John T Belisle, M Nurul Islam, Johannes Griss, andDavid L Tabb. Greazy: Open-Source Software for Automated PhospholipidTandem Mass Spectrometry Identification. Analytical chemistry, 88:5733–5741,2016. doi:10.1021/acs.analchem.6b00021.
[191] Hiroshi Tsugawa, Tomas Cajka, Tobias Kind, Yan Ma, Brendan Higgins,Kazutaka Ikeda, Mitsuhiro Kanazawa, Jean VanderGheynst, Oliver Fiehn,and Masanori Arita. MS-DIAL: data-independent MS/MS deconvolutionfor comprehensive metabolome analysis. Nature methods, 12:523–526, 2015.doi:10.1038/nmeth.3393.
[192] Jörg Martin Büscher, Dominika Czernik, Jennifer Christina Ewald, Uwe Sauer,and Nicola Zamboni. Cross-platform comparison of methods for quantita-tive metabolomics of primary metabolism. Analytical chemistry, 81:2135–2143,2009. doi:10.1021/ac8022857.
[193] Patrick Leuthold, Elke Schaeffeler, Stefan Winter, Florian Büttner, Ute Hof-mann, Thomas E Mürdter, Steffen Rausch, Denise Sonntag, Judith Wahrheit,Falko Fend, Jörg Hennenlotter, Jens Bedke, Matthias Schwab, and MathiasHaag. Comprehensive Metabolomic and Lipidomic Profiling of Human KidneyTissue: A Platform Comparison. Journal of proteome research, 16:933–944,2017. doi:10.1021/acs.jproteome.6b00875.
[194] BIOCRATES Life Sciences AG. Annotation of potential isobaric and iso-meric lipid species measured with the AbsoluteIDQTM p180 Kit (and p150

138 Bibliography
Kit). Technical report, 2018. URL https://www.biocrates.com/images/List-of-Isobaric-and-Isomeric-Lipid-Species_v1_2018.pdf.
[195] Chung-Ho E Lau, Alexandros P Siskos, Léa Maitre, Oliver Robinson, Toby JAthersuch, Elizabeth J Want, Jose Urquiza, Maribel Casas, Marina Vafeiadi,Theano Roumeliotaki, Rosemary R C McEachan, Rafaq Azad, Line S Haug,Helle M Meltzer, Sandra Andrusaityte, et al. Determinants of the urinary andserum metabolome in children from six European populations. BMC medicine,16:202, 2018. doi:10.1186/s12916-018-1190-8.
[196] Séverine Trabado, Abdallah Al-Salameh, Vincent Croixmarie, Perrine Masson,Emmanuelle Corruble, Bruno Fève, Romain Colle, Laurent Ripoll, BernardWalther, Claire Boursier-Neyret, Erwan Werner, Laurent Becquemont, andPhilippe Chanson. The human plasma-metabolome: Reference values in 800French healthy volunteers; impact of cholesterol, gender and age. PloS one, 12:e0173615, 2017. doi:10.1371/journal.pone.0173615.
[197] Therese Koal, Kristaps Klavins, Daniele Seppi, Georg Kemmler, and Chris-tian Humpel. Sphingomyelin SM(d18:1/18:0) is significantly enhanced in ce-rebrospinal fluid samples dichotomized by pathological amyloid-β42, tau, andphospho-tau-181 levels. Journal of Alzheimer’s disease : JAD, 44:1193–1201,2015. doi:10.3233/JAD-142319.
[198] Sven Zukunft, Cornelia Prehn, Cornelia Röhring, Gabriele Möller, MartinHrabě de Angelis, Jerzy Adamski, and Janina Tokarz. High-throughput ex-traction and quantification method for targeted metabolomics in murine tis-sues. Metabolomics : Official journal of the Metabolomic Society, 14:18, 2018.doi:10.1007/s11306-017-1312-x.
[199] Jillian M Hagel, Rupasri Mandal, Beomsoo Han, Jun Han, Donald R Dinsmore,Christoph H Borchers, David S Wishart, and Peter J Facchini. Metabo-lome analysis of 20 taxonomically related benzylisoquinoline alkaloid-producingplants. BMC plant biology, 15:220, 2015. doi:10.1186/s12870-015-0594-2.
[200] Souhaila Bouatra, Farid Aziat, Rupasri Mandal, An Chi Guo, Michael R Wil-son, Craig Knox, Trent C Bjorndahl, Ramanarayan Krishnamurthy, Fozia Sa-leem, Philip Liu, Zerihun T Dame, Jenna Poelzer, Jessica Huynh, Faizath SYallou, Nick Psychogios, et al. The human urine metabolome. PloS one, 8:e73076, 2013. doi:10.1371/journal.pone.0073076.

139
[201] Silvia Turroni, Jessica Fiori, Simone Rampelli, Stephanie L Schnorr, ClarissaConsolandi, Monica Barone, Elena Biagi, Flaminia Fanelli, Marco Mezzullo,Alyssa N Crittenden, Amanda G Henry, Patrizia Brigidi, and Marco Candela.Fecal metabolome of the Hadza hunter-gatherers: a host-microbiome integrativeview. Scientific reports, 6:32826, 2016. doi:10.1038/srep32826.
[202] T Raclot, C Holm, and D Langin. Fatty acid specificity of hormone-sensitivelipase. Implication in the selective hydrolysis of triacylglycerols. Journal ofLipid Research, 42:2049–2057, 2001.
[203] John A Bowden, Alan Heckert, Candice Z Ulmer, Christina M Jones, Je-remy P Koelmel, Laila Abdullah, Linda Ahonen, Yazen Alnouti, Aaron M Ar-mando, John M Asara, Takeshi Bamba, John R Barr, Jonas Bergquist, Chris-toph H Borchers, Joost Brandsma, et al. Harmonizing lipidomics: NIST in-terlaboratory comparison exercise for lipidomics using SRM 1950-Metabolitesin Frozen Human Plasma. Journal of Lipid Research, 58:2275–2288, 2017.doi:10.1194/jlr.M079012.
[204] Oswald Quehenberger, Aaron M Armando, Alex H Brown, Stephen B Milne,David S Myers, Alfred H Merrill, Sibali Bandyopadhyay, Kristin N Jones, Sa-muel Kelly, Rebecca L Shaner, Cameron M Sullards, Elaine Wang, Robert CMurphy, Robert M Barkley, Thomas J Leiker, et al. Lipidomics reveals a re-markable diversity of lipids in human plasma. Journal of Lipid Research, 51:3299–3305, 2010. doi:10.1194/jlr.M009449.
[205] Cornelia Then, Simone Wahl, Anna Kirchhofer, Harald Grallert, SusanneKrug, Gabi Kastenmüller, Werner Römisch-Margl, Melina Claussnitzer, Tho-mas Illig, Margit Heier, Christa Meisinger, Jerzy Adamski, Barbara Thorand,Cornelia Huth, Annette Peters, et al. Plasma metabolomics reveal alterati-ons of sphingo- and glycerophospholipid levels in non-diabetic carriers of thetranscription factor 7-like 2 polymorphism rs7903146. PloS one, 8:e78430, 2013.doi:10.1371/journal.pone.0078430.
[206] Justin Johan Jozias van der Hooft, Joe Wandy, Michael P Barrett, KarlE V Burgess, and Simon Rogers. Topic modeling for untargeted sub-structure exploration in metabolomics. Proceedings of the National Aca-demy of Sciences of the United States of America, 113:13738–13743, 2016.doi:10.1073/pnas.1608041113.

140 Bibliography
[207] Sunghwan Kim, Ryan P Rodgers, and Alan G Marshall. Truly “ex-act” mass: Elemental composition can be determined uniquely from mo-lecular mass measurement at ∼0.1mDa accuracy for molecules up to∼500Da. International Journal of Mass Spectrometry, 251(2):260 – 265, 2006.doi:10.1016/j.ijms.2006.02.001. ULTRA-ACCURATE MASS SPECTROME-TRY AND RELATED TOPICS Dedicated to H.-J. Kluge on the occasion ofhis 65th birthday anniversary.
[208] David G Watson. A rough guide to metabolite identification using high resolu-tion liquid chromatography mass spectrometry in metabolomic profiling in me-tazoans. Computational and structural biotechnology journal, 4(5):e201301005,2013. doi:10.5936/csbj.201301005.
[209] Kate Comstock, Seema Sharma, and Caroline Ding. Ultra high resolution MSfor confident metabolite structure identification. Drug Metabolism and Phar-macokinetics, 33(1, Supplement):S24, 2018. doi:10.1016/j.dmpk.2017.11.095.
[210] Tobias Kind and Oliver Fiehn. Seven Golden Rules for heuristic filtering of mo-lecular formulas obtained by accurate mass spectrometry. BMC bioinformatics,8:105, 2007. doi:10.1186/1471-2105-8-105.
[211] Tobias Kind, Hiroshi Tsugawa, Tomas Cajka, Yan Ma, Zijuan Lai, Sajjan SMehta, Gert Wohlgemuth, Dinesh Kumar Barupal, Megan R Showalter, Masa-nori Arita, et al. Identification of small molecules using accurate mass MS/MSsearch. Mass spectrometry reviews, 2017. doi:10.1002/mas.21535.
[212] Robert Höllering, Johann Gasteiger, Larissa Steinhauer, Klaus-Peter Schulz,and Achim Herwig. Simulation of organic reactions: from the degradationof chemicals to combinatorial synthesis. Journal of chemical information andcomputer sciences, 40:482–494, 2000. doi:10.1021/ci990433p.
[213] Bing Yu, Yan Zheng, Danny Alexander, Alanna C Morrison, Josef Co-resh, and Eric Boerwinkle. Genetic determinants influencing human serummetabolome among African Americans. PLoS genetics, 10:e1004212, 2014.doi:10.1371/journal.pgen.1004212.
[214] Adam D Kennedy, Bryan M Wittmann, Anne M Evans, Luke A D Miller,Douglas R Toal, Shaun Lonergan, Sarah H Elsea, and Kirk L Pappan. Me-tabolomics in the Clinic: A Review of the Shared and Unique Features of

141
Untargeted Metabolomics for Clinical Research and Clinical Testing. Journalof mass spectrometry : JMS, 2018. doi:10.1002/jms.4292.
[215] Hisayuki Horai, Masanori Arita, Shigehiko Kanaya, Yoshito Nihei, TasukuIkeda, Kazuhiro Suwa, Yuya Ojima, Kenichi Tanaka, Satoshi Tanaka, KenAoshima, Yoshiya Oda, Yuji Kakazu, Miyako Kusano, Takayuki Tohge, Fu-mio Matsuda, et al. MassBank: a public repository for sharing mass spectraldata for life sciences. Journal of mass spectrometry : JMS, 45:703–714, 2010.doi:10.1002/jms.1777.
[216] Carlos Guijas, J Rafael Montenegro-Burke, Xavier Domingo-Almenara, Ame-lia Palermo, Benedikt Warth, Gerrit Hermann, Gunda Koellensperger, TaoHuan, Winnie Uritboonthai, Aries E Aisporna, Dennis W Wolan, Mary E Spil-ker, H Paul Benton, and Gary Siuzdak. METLIN: A Technology Platform forIdentifying Knowns and Unknowns. Analytical chemistry, 90:3156–3164, 2018.doi:10.1021/acs.analchem.7b04424.
[217] Ivana Blaženović, Tobias Kind, Jian Ji, and Oliver Fiehn. Software Tools andApproaches for Compound Identification of LC-MS/MS Data in Metabolomics.Metabolites, 8, 2018. doi:10.3390/metabo8020031.


APPENDIX ASupplements: Characterization of PC sums
Supplemental tables and figures of Chapter 3 are provided as online-supplements andon the attached CD (cf. Index of external material on page 239).
Part_I_LipidCompositions/Supplemental_Table_A.1_QualitativeComp.xlsx
Table A.1: Qualitative composition of PCs measured by AbsoluteIDQTM
The chain length and double bonds of 76 PCs measured on the lipid species level weresystematically distributed to the sn-1 and sn-2 positions to collect 150 to 456 theoreticallypossible molecules of the fatty acid level. If the particular SM [13C1]SM x + 4 : y for thePC of the lipid species level PC x : y has not been measured, it was included to the list. Asimilar version of this table is part of my prepared manuscript as well; Quell et al. [149].
Part_I_LipidCompositions/Supplemental_Table_A.2_Ranges.xlsx
Table A.2: Qualitative composition of measured PCs and ranges of metabolitelevels per platformMetabolite levels of PCs measured by AbsoluteIDQTM on the lipid species level are comparedto aggregated levels of related one to four PCs measured by LipidyzerTM on the fatty acidlevel. Metabolites marked by an asterisk were excluded because of missingness > 75%. Thistable is part of my prepared manuscript as well; Quell et al. [149].
143

144 A Supplements: Characterization of PC sums
Part_I_LipidCompositions/Supplemental_Table_A.3_Stability.xlsx
Table A.3: Stability of factors f describing PC compositionsThe stability of factors f of PCs measured on the fatty acid level (LipidyzerTM) and PCsmeasured on the lipid species level (AbsoluteIDQTM) was demonstrated within the distri-butions of subjects (determined by ANOVA or Kruskal-Wallis test) and between the timepoints of baseline and intervention (determined by Wilcoxon signed-rank test) of variouschallenges. Distributions that were not significantly different (α=0.01) were labeled asstable. Due to a small number of instances, the null hypothesis could not be rejected dur-ing tests in connection to challenges. Supplemental Figure A.1 and Supplemental Table A.2indicate that variation of factors f between subjects is larger than during challenges. Thistable is part of my prepared manuscript as well; Quell et al. [149].
Part_I_LipidCompositions/Supplemental_Table_A.4_Replication.xlsx
Table A.4: Replication of factors f and imputation in QMDiabCompositions of PCs measured the fatty acid level are replicated, if factors f (distributionsof quotients q) of the major compound are not significantly different between subjects of theHuMet study and a comparable subset of QMDiab (male controls aged ≤ 40y). In addition,stability of factors f is demonstrated between heterogeneous subsets of QMDiab (malecontrols, female controls and cases). Furthermore, imputation is replicated if distributions ofmeasured PC concentrations (fatty acid level) of the subset of QMDiab are not significantlydifferent to concentrations of PC sums of the subset of QMDiab multiplied by the respectivefactor f determined in HuMet.
Part_I_LipidCompositions/Supplemental_Table_A.5_LinearModel.xlsx
Table A.5: Explained variation of PCs measured on the lipid species levelThe variance of in median 67.2% (R2, mean: 0.586, SD: 0.277) of PCs measured on thelipid species level (AbsoluteIDQTM) can be explained by the sum of related PCs measuredon the fatty acid level (LipidyzerTM). This table is part of my prepared manuscript as well;Quell et al. [149].

145
Part_I_LipidCompositions/Supplemental_Figure_A.1_CompDetails.pdfExemplary excerpt:
PC
aa
C34
:3 =
PC
14:
0_20
:3 +
PC
16:
0_18
:3 +
PC
18:
2_16
:1 +
R
●
PC
14:
0_20
:3P
C 1
6:0_
18:3
PC
18:
2_16
:1
0.00.20.40.60.81.0
Sem
i−Q
uant
itativ
e co
mpo
sitio
n w
ithin
Lip
idyz
erT
M
proportion
med
ian:
0.0
426
med
ian:
0.4
428
med
ian:
0.5
201
mea
n: 0
.044
6m
ean:
0.4
466
mea
n: 0
.508
8 s
d: 0
.014
sd:
0.0
66 s
d: 0
.068
4%45
%51
%
n =
223
● ●
PC
14:
0_20
:3P
C 1
6:0_
18:3
PC
18:
2_16
:1
0.00.20.40.60.81.0
quotient q
Sem
i−Q
uant
itativ
e co
mpo
sitio
n F
acto
rs f
=m
ean
of q
uotie
nts
qm
edia
n: 0
.046
med
ian:
0.4
774
med
ian:
0.5
526
mea
n: 0
.048
1m
ean:
0.4
82m
ean:
0.5
547
sd:
0.0
15 s
d: 0
.08
sd:
0.1
12
n =
221
Sem
i−Q
uant
itativ
e co
mpo
sitio
n: L
ipid
yze
rTM
PC
aa
C34
:3 c
onsi
sts
of:
P
C 1
4:0_
20:3
4.5
%
PC
16:
0_18
:3 4
4.7%
P
C 1
8:2_
16:1
50.
9%an
d of
(no
t qua
ntifi
ed):
P
C 1
4:1_
20:2
, P
C 1
6:1_
18:2
, P
C 1
7:1_
17:2
, P
C O
−18
:1_1
7:2,
an
d fu
rthe
r co
mpo
unds
Line
ar m
odel
PC
aa
C3
4:3
~ b
* (
PC
14
:0_
20
:3 +
PC
16
:0_
18
:3 +
PC
18
:2_
16
:1 )
R2 =
0.8
5431
b =
1.0
004
Ran
ges
Mea
sure
Abs
olut
eID
QT
Msu
m(L
ipid
yzer
TM)
delta
Min
Max
Mea
n
Med
ian
SD
8.23
29 15.6
7
13.9
8
4.82
8.34
29.9
4
16.7
2
15.6
6
4.43
0.11
0.94
1.05
1.68
0.39
●
●●
●
●
●
●●
●●
●
●●
●
●
●
●●
●
●●
●●
●
●
● ●
●●
●●
● ●
●●● ●
●● ●
●●●
●
●●
●
●
●● ●●
●●
●
●●
● ●
●●
●
●●
●●
●
●
●●
● ● ●●●
●●
●
●●
●
●
●●
●
● ●●
●
●●
●●
●
●
●●
●
●
● ●
●●●
●●
●● ●
●
● ●
●
●●
●
●●
●
●
●
●
●
●●
●●
●●
●
●
●
●
●● ●
●
●
●
●●
●
●
●
●●
●
●
●●
●● ●
●
●
●
●
●
● ●
●
●
● ●
●
● ●
●
●
●●
●●●
●●
●
●●
●●●
●● ●
●
●●●
●
●
●
●
●
●●
●
●
● ●
●●
●● ●
●●
●
●●
● ● ●●
●●
●
●●
●
●
1015
2025
0.51.01.52.0
Con
cent
ratio
n: A
bsol
ute
IDQ
TM v
s Li
pidy
zer
TM
PC
aa
C34
:3 (
Abs
olut
eID
QT
M)
[Mic
rom
olar
]
PC 14:0_20:3 (LipidyzerTM) [Micromolar]
com
plet
enes
s =
100%
● ● ● ●
subj
ect 5
subj
ect 6
subj
ect 7
subj
ect 8
●●
●
●●
●
●●
●
●
●
●
●●
●
●
●
●●
●
●
●●
●
●
●●
●●●●
● ●● ●
●●●
●●
●●●
●●
●●
●
●
●● ●●
●
●
●●
●●
●
●●
●●
●●
●●
●●
●●●● ●
●●
●●
●
●●
●
●
●
●●●
●
●●
●●
●●
●
●
●●
●●●●
●●
●
●
● ●●
● ●●
●●
●
●●
●●
●
●
●
●
●●
●●
●
●
●●
●
●
● ●
●
●●
●
●●
●
●
●
●●
●
●●
●● ●
●●
●●
●
● ●
●●
●●
●
● ●
●●
●●
●●●
●●
●
●●
●●
●
●●●
●
●●●
●
●●
●●
●
●
●●
● ●
●●
●
●●●
●●
●●
● ●●●
●
●
●●
●●
●
1015
2025
46810121416C
once
ntra
tion:
Abs
olut
eID
QT
M v
s Li
pidy
zer
TM
PC
aa
C34
:3 (
Abs
olut
eID
QT
M)
[Mic
rom
olar
]
PC 16:0_18:3 (LipidyzerTM) [Micromolar]
com
plet
enes
s =
100%
●
●●
●●
●
●●
●
●
●
●
●
●
●
●●
●
●
●
●
●
●
●
●
●●
●●●●
● ●
● ●
●●●
●●
● ●
●
●
●●
●
●
●
●● ●
●●
●●
●●●
●●
●
●●
●
●●
●●
●● ●● ●
●
●●
●
●
●
●
●●
●●
●●●
●
●●
●●
●
●
●
●●
●
●●
● ●●
●
●
●
● ●●
● ●
●
●
●
●
●
●
●
●
●
●
●
●●
●
●●
●
●
●
●
●
●
● ●
●
●
●
●●
●
●
●
●
●●
●
●
●●
● ●
●
●
●
●●
●●
●
●●●
●
● ●●
●●
●
●
●●
●●
●●
●
●●
●
●
●●
●● ●
●
●
●●
●
●
●
●
●●
● ●●●
●
● ●
●●
●●
●
●●●●
●
●
●●
●
●
●
1015
2025
681012
Con
cent
ratio
n: A
bsol
ute
IDQ
TM v
s Li
pidy
zer
TM
PC
aa
C34
:3 (
Abs
olut
eID
QT
M)
[Mic
rom
olar
]
PC 18:2_16:1 (LipidyzerTM) [Micromolar]
com
plet
enes
s =
100%
●
●●
● ●
●
●
●
●
●
●●
●
●
●
●
●
●
●
●
● ●●
●
●
●
●
●
●
●
●●
●
●
●
●
●●
●
●
●
● ●
●
●
●
●●
●
●
●
●
●
●
●
●
●
●
●
●
●
●
●
●
●●
●
●
●●
● ●●●
●
●
●●
●
●
● ●
●
●
●
●
●
●
●
●
●
●
●●
●
●●
●
●●
●●
● ●
●●
●
●
●●
●
●
●
●
●
●
●
●●
●
●
●●
●
●
●
●
●
●
● ●
●
●
● ●
●
●
●
● ●
● ●
●
●●
●
●
●
●
●
●
●●
●
●
●● ●
● ●
●●
●
●
●
●
●
●
●
●
●
●●
●
●
●●
●●
●
●
●
●●
●
●
● ●
●
●
●
●
●
●
●
●
●●
●
●●
●●
●●
●
●
●
●
●●
●
●
●●
●
●
●●
●
●
1015
2025
−6−4−2024
Bla
nd−A
ltman
Dia
gram
mea
n: (
Abs
olut
eID
QT
M +
sum
(Lip
idyz
erT
M))
/ 2
difference: AbsoluteIDQTM − sum(LipidyzerTM)
ME
AN
:−
1.04
+1.
96 S
D:
2.56
3
−1.
96 S
D:
−4.
642
Sta
bilit
y of
com
posi
tion
Sha
piro
−Wilk
Tes
t of l
og q
uotie
nts,
pv:
0.6
127;
OK
(PC
14:
0_20
:3 +
PC
16:
0_18
:3 +
PC
18:
2_16
:1)
/ PC
aa
C34
:3
SW
: ok;
AN
OV
A: C
omp.
~ S
ubje
ct_I
D −
> p
v =
0.5
2902
; EQ
UA
LW
ilcox
on: C
halle
nge;
fas
ting:
0.3
75;
spor
t: 0.
25;
OLT
T: 0
.375
Sha
piro
−Wilk
Tes
t of l
og q
uotie
nts,
pv:
0.0
0108
; NO
PC
14:
0_20
:3 /
PC
aa
C34
:3
SW
: ok;
AN
OV
A: C
omp.
~ S
ubje
ct_I
D −
> p
v =
4e−
05; D
IFF
ER
EN
CE
Wilc
oxon
: Cha
lleng
e; f
astin
g: 0
.125
; sp
ort:
0.25
; O
LTT
: 0.2
5
Sha
piro
−Wilk
Tes
t of l
og q
uotie
nts,
pv:
0.1
3301
; OK
PC
16:
0_18
:3 /
PC
aa
C34
:3
SW
: ok;
AN
OV
A: C
omp.
~ S
ubje
ct_I
D −
> p
v =
0; D
IFF
ER
EN
CE
Wilc
oxon
: Cha
lleng
e; f
astin
g: 0
.125
; sp
ort:
1; O
LTT
: 0.3
75
Sha
piro
−Wilk
Tes
t of l
og q
uotie
nts,
pv:
0.0
115;
OK
PC
18:
2_16
:1 /
PC
aa
C34
:3
SW
: ok;
AN
OV
A: C
omp.
~ S
ubje
ct_I
D −
> p
v =
2e−
04; D
IFF
ER
EN
CE
Wilc
oxon
: Cha
lleng
e; f
astin
g: 0
.625
; sp
ort:
0.25
; O
LTT
: 0.6
25
●
PC
14:
0_20
:3P
C 1
6:0_
18:3
PC
18:
2_16
:1
0.00.20.40.60.81.0
Qua
nt. c
omp.
, Sub
ject
5
quotient q
med
ian:
0.0
486
med
ian:
0.5
041
med
ian:
0.4
722
mea
n: 0
.051
2m
ean:
0.5
187
mea
n: 0
.467
6 s
d: 0
.015
sd:
0.0
89 s
d: 0
.071
n =
55, 5
5, 5
5; c
omb.
: 55
●
PC
14:
0_20
:3P
C 1
6:0_
18:3
PC
18:
2_16
:1
0.00.20.40.60.81.0
Qua
nt. c
omp.
, Sub
ject
6
quotient q
med
ian:
0.0
475
med
ian:
0.4
781
med
ian:
0.6
616
mea
n: 0
.049
mea
n: 0
.482
8m
ean:
0.6
695
sd:
0.0
14 s
d: 0
.073
sd:
0.0
69
n =
55, 5
5, 5
5; c
omb.
: 55
● ●●●
PC
14:
0_20
:3P
C 1
6:0_
18:3
PC
18:
2_16
:1
0.00.20.40.60.81.0
Qua
nt. c
omp.
, Sub
ject
7
quotient q
med
ian:
0.0
51m
edia
n: 0
.486
1m
edia
n: 0
.472
mea
n: 0
.053
7m
ean:
0.4
908
mea
n: 0
.470
8 s
d: 0
.013
sd:
0.0
59 s
d: 0
.062
n =
55, 5
5, 5
5; c
omb.
: 55
PC
14:
0_20
:3P
C 1
6:0_
18:3
PC
18:
2_16
:1
0.00.20.40.60.81.0
Qua
nt. c
omp.
, Sub
ject
8
quotient q
med
ian:
0.0
355
med
ian:
0.4
444
med
ian:
0.6
133
mea
n: 0
.038
6m
ean:
0.4
365
mea
n: 0
.609
9 s
d: 0
.013
sd:
0.0
74 s
d: 0
.074
n =
56, 5
6, 5
6; c
omb.
: 56
fast
ing
spor
tO
LTT
0.91.01.11.21.31.4
Tren
ds o
f fac
tors
f d
urin
g ch
alle
nges
chal
leng
es
quotient q
●● ●●
●● ● ●
●● ●●
●● ● ●
●● ●●
●● ● ●
●● ●●
●● ● ●
●● ●●
●● ●●
●● ●●
●● ●●
●● ●●
●● ●●
●● ●●
●● ●●
●● ● ●
●● ●●
●● ● ●
●● ●●
●● ● ●
●● ●●
●● ● ●
●● ●●
● ● ●●● ● ● ●
● ●● ●● ●● ●
●● ● ●● ●● ●
● ● ●● ●● ●
●● ● ●● ●● ●
● ●● ●● ●● ●
●● ● ●● ● ● ●
●● ● ●●● ●●
●● ● ●● ● ●
●● ● ●●● ● ●
● ● ●●● ●● ●
● ● ●● ●● ●
● ● ● ●●●● ●
● ● ● ●●● ● ●
●●●●● ●● ●
●●● ●●● ● ●
● ●● ●●●● ●
●●● ●● ●● ●
● ●● ●●●● ●
● ●● ●● ●● ●
●● ● ●●●● ●
●●● ●● ●● ●
● ●● ●●●● ●
●●● ●● ●● ●
●●● ●● ●● ●
●● ● ●●●● ●
● ●● ●● ●● ●
● ●● ●● ●● ●
010
2030
4050
60
0.00.20.40.60.8
Fact
ors
f per
tim
e po
int
time
poin
t
quotient q
●P
C 1
4:0_
20:3
/ P
C a
a C
34:3
PC
16:
0_18
:3 /
PC
aa
C34
:3P
C 1
8:2_
16:1
/ P
C a
a C
34:3
Com
posi
tion:
Fac
tors
f
conc
(PC
aa
C34
:3)
* 0.
0481
= c
onc(
PC
14:
0_20
:3)
[var
(f)=
0.04
81]
Per
cent
iles:
5%
−>
0.02
52, 2
5%−
>0.
0369
, 75%
−>
0.05
88, 9
5%−
>0.
0729
conc
(PC
aa
C34
:3)
* 0.
482
= c
onc(
PC
16:
0_18
:3)
[var
(f)=
0.48
2] P
erce
ntile
s: 5
%−
>0.
3539
, 25%
−>
0.43
12, 7
5%−
>0.
5322
, 95%
−>
0.61
65co
nc(P
C a
a C
34:3
) *
0.55
47 =
con
c(P
C 1
8:2_
16:1
) [v
ar(f
)=0.
5547
] P
erce
ntile
s: 5
%−
>0.
3811
, 25%
−>
0.47
18, 7
5%−
>0.
6377
, 95%
−>
0.74
06
Figure A.1: Details of PC compositionsCollection of all plots and information of each measured PC composition (Chapter 3). Asimilar version of this figure is part of my prepared manuscript as well; Quell et al. [149].

146 A Supplements: Characterization of PC sums
Part_I_LipidCompositions/Supplemental_Figure_A.2_Replication_factor.pdfExemplary excerpt:
0.0
0.5
1.0
1.5
2.0
PC aa 34:3
fatty acid level
quot
ient
q
HuMetQMDiab: male controls age<=40QMDiab: male controlsQMDiab: female controlsQMDiab: casesQMDiab: all
median
Kruskal WallisRel. deviation
0.0
0.5
1.0
1.5
2.0 0.05
0.0
0.5
1.0
1.5
2.0 0.08
093.78%
●
0.0
0.5
1.0
1.5
2.0 0.09
●●
0.0
0.5
1.0
1.5
2.0 0.09
●●●
0.0
0.5
1.0
1.5
2.0 0.09
●●●●●●●
0.0
0.5
1.0
1.5
2.0 0.09
0109.64%
0.481
PC 14:0_20:3
●
●
0.0
0.5
1.0
1.5
2.0 0.48
●
0.0
0.5
1.0
1.5
2.0 0.47
0.2793.1%
●●●●●
0.0
0.5
1.0
1.5
2.0 0.44
●●●
●
●
0.0
0.5
1.0
1.5
2.0 0.41
●●
●
●●
0.0
0.5
1.0
1.5
2.0 0.46
●●●●●
●●
●
●
●
●
0.0
0.5
1.0
1.5
2.0 0.44
0.0030.64%
0.052
PC 16:0_18:3
0.0
0.5
1.0
1.5
2.0 0.55
●
●
0.0
0.5
1.0
1.5
2.0 0.87
062.76%
●
●
●●
0.0
0.5
1.0
1.5
2.0 0.86
●●●
0.0
0.5
1.0
1.5
2.0 0.91
●
●
●●
●
0.0
0.5
1.0
1.5
2.0 0.78
●
●●
●●●
●
●
●
●●
0.0
0.5
1.0
1.5
2.0 0.83
055.61%
0.005
PC 18:2_16:1
Figure A.2: Factors f in HuMet and QMDiab of PC compositionsFactors f (distributions of quotients q) are shown separately for subjects of HuMet andsubsets of QMDiab. The p-values of Kruskal-Wallis tests indicate whether factors f ofHuMet and of a comparable subset of QMDiab (male controls aged ≤ 40y) are significantlydifferent. Further p-values refer to HuMet and complete QMDiab or to subsets of QMDiab(male controls, female controls, cases). This figure is part of my prepared manuscript aswell; Quell et al. [149].

147
Part_I_LipidCompositions/Supplemental_Figure_A.3_Replication_conz.pdfExemplary excerpt:
05
1015
PC aa 34:3
fatty acid level
conc
entr
atio
n [M
icro
mol
ar]
measured concentrationimputed concentration
median
Kruskal Wallis
●
05
1015
●
05
1015
0
0.96 0.572
PC 14:0_20:3
05
1015
●
05
1015
0.435
5.213 5.736
PC 16:0_18:3
●
●
05
1015
●
05
1015
0
9.917 6.601
PC 18:2_16:1
Figure A.3: Distributions of measured and imputed PC concentrationsPC concentrations (lipid species level) of a subset of QMDiab (male controls aged ≤ 40y)were multiplied by respective factors f determined in HuMet to impute concentrations ofPCs of the fatty acid level. P-values of a Kruskal-Wallis test show whether distributions ofmeasured and imputed concentrations are not significantly different (α=0.01).


APPENDIX BSupplements: Annotation of unknownmetabolites
Index of figures, tables, and files of Appendix B
FiguresB.1 Basic elements of the unknown characterization procedure . . . . . . . . . . 151B.2 Network model: stepwise data integration procedure (SUMMIT) . . . . 152B.3 Difference in retention index of dehydrogenation reactants . . . . . . . . . . 165B.4 Neighbors of X-24834 in sets of GCKD and SUMMIT . . . . . . . . . . . . . . . 198B.5 Neighboring metabolites of X-11905 and X-11538 . . . . . . . . . . . . . . . . . . . 198B.6 Analytical comparison of 9-tetradecenoic acid and X-13069 . . . . . . . . . 232B.7 Analytical comparison of 9-octadecenedioic acid and X-11538 . . . . . . . 233B.8 Analytical comparison of 2-, 3-, and 8-nonenoic acid and X-11859 . . . 234
149

150 B Supplements: Annotation of unknown metabolites
TablesB.1 Cross-validation of the pathway prediction module . . . . . . . . . . . . . . . . . . 154B.2 Predicted super and sub pathways of unknown metabolites . . . . . . . . . 155B.3 Predicted reactions based on mass differences and network relations . 160B.4 Predicted dehydrogenation/ reduction reactions . . . . . . . . . . . . . . . . . . . . . 166B.5 Predicted super pathways of unknown metabolites in SUM-
MIT/GCKD, SUMMIT, and GCKD . . . . . . . . . . . . . . . . . . . . . . . . . . . . . . . . 167B.6 Predicted sub pathways of unknown metabolites in SUMMIT/GCKD,
SUMMIT, and GCKD . . . . . . . . . . . . . . . . . . . . . . . . . . . . . . . . . . . . . . . . . . . . . . 183B.7 Predicted sub pathways of unknown metabolites measured in SUMMIT
and GCKD . . . . . . . . . . . . . . . . . . . . . . . . . . . . . . . . . . . . . . . . . . . . . . . . . . . . . . . . . 196B.8 Manually selected candidate molecules basted on HMDB compounds 199B.9 Parameters determined during cross-validation of candidate selection 201B.10 Evidences of automatically selected candidate molecules (Recon) . . . . 202B.11 Automatically selected candidate molecules . . . . . . . . . . . . . . . . . . . . . . . . . 212B.12 Evaluation of manually selected candidate molecules . . . . . . . . . . . . . . . . 235
FilesB.1 Network model with R scripts and example data . . . . . . . . . . . . . . . . . . . . 236B.2 Graphml file of a representation of the network model based on SUM-
MIT . . . . . . . . . . . . . . . . . . . . . . . . . . . . . . . . . . . . . . . . . . . . . . . . . . . . . . . . . . . . . . . . 236B.3 Automatically generated annotations of the SUMMIT data set . . . . . . 236B.4 Graphml file of a representation of the network model based on GCKD 237B.5 Automatically generated annotations of the GCKD data set . . . . . . . . 237B.6 Graphml file of the network model based on merged SUMMIT/GCKD 237B.7 Automatically generated annotations of merged SUMMIT/GCKD . . 237B.8 Evidences for automatically selected candidate molecules . . . . . . . . . . . 238

151
Automated data integration procedure
Published mGWAS Public database ReconGenerate GGM Reactions and genes
Non-targeted metabolomicsdata of a cohort study
Data integrationConstruction of network model
Prediction of super-and sub pathways Prediction of reactions
Summarize characterizationsof unknown metabolites
Apply predicted reactions toknown metabolites to select
candidates for unknown metabolites
Further filtering, manual interpretation, and experimental verification
In silico, automated procedure: Existing / measured: Manual step: In wet-laboratory:
Annotation of network relationships
Automated selection ofspecific candidate molecules
for unknown metabolites
Public database HMDBChemical Structures
Figure B.1: Basic elements of the unknown characterization procedureThe schematic workflow shows the sequential steps of the introduced procedure to char-acterize unknown metabolites. The shape of each element indicates the respective partconsisting of an automated in silico procedure, existing data, manual, or wet laboratorywork. I previously published a similar version this figure in Quell et al. 2017; adapted bypermission from the Journal of Chromatography B [150].

152 B Supplements: Annotation of unknown metabolites
Complete network model
Data integration procedure
Metabolite (measured) Database metabolite Measured + database metabolite Metabolite ratio
Partial correlation Association (direct) Association (ratio) Reaction Functional relation
Metabolite concentrationsof SUMMIT cohort study
Metabolites
Sam
ples
Imputation (MICE)Calculation of partial correlations
with all metabolite pairsFilter significant
GGM SUMMIT
Metabolite 1
Metabolite 2
GGM [Krumsiek et al. 2012]Metabolite 3
Metabolite 2
Map 218 common metabolites
and 220 common partial correlations
Combined network model: GGM
Metabolite 1
Metabolite 2
Metabolite 3
GWAS [Shin et al. 2014]
Based on KORA F4 & Twins UK (n=7824)
Metabolite 3
Metabolite 2
Map 176common metabolites
Merge edges
Data-driven network model: GGM + GWAS
Metabolite 1
Metabolite 2
Metabolite 3
Map 139 metabolites and 57 genes that are functionally related
or associated to measured metabolitesMerge edges
Database [Thiele et al. 2014]
Recon 2
Metabolite 3
Metabolite 4
Metabolite 1
Metabolite 2
Metabolite 3
Metabolite 4
Gene 1
Gene 1
Gene 1
Gene 1
SUMMIT (n=2279)758 metabolites(439 known, 319 unknown)
Based on KORA F4 (n=1768)
398 significant partial correlationswith 303 metabolites
1040 partial correlationswith 637 metabolites(388 known 249 unknown)
187 metabolites associated directely or through 47 ratios to 134 genes
862 significant partial correlationswith 580 metabolites
181 unkonwn metabolites are connected by partial correlations (171) or via genes (35) to known metabolites.
648 metabolites(394 known, 254 unknown)134 genes
2626 metabolites7439 reactions2140 genes

153
Figure continued (p. 2 / 2)
Complete network model
Data integration procedure
Metabolite (measured) Database metabolite Measured + database metabolite Metabolite ratio
Partial correlation Association (direct) Association (ratio) Reaction Functional relation
Metabolite concentrationsof SUMMIT cohort study
Metabolites
Sam
ples
Imputation (MICE)Calculation of partial correlations
with all metabolite pairsFilter significant
GGM SUMMIT
Metabolite 1
Metabolite 2
GGM [Krumsiek et al. 2012]Metabolite 3
Metabolite 2
Map 218 common metabolites
and 220 common partial correlations
Combined network model: GGM
Metabolite 1
Metabolite 2
Metabolite 3
GWAS [Shin et al. 2014]
Based on KORA F4 & Twins UK (n=7824)
Metabolite 3
Metabolite 2
Map 176common metabolites
Merge edges
Data-driven network model: GGM + GWAS
Metabolite 1
Metabolite 2
Metabolite 3
Map 139 metabolites and 57 genes that are functionally related
or associated to measured metabolitesMerge edges
Database [Thiele et al. 2014]
Recon 2
Metabolite 3
Metabolite 4
Metabolite 1
Metabolite 2
Metabolite 3
Metabolite 4
Gene 1
Gene 1
Gene 1
Gene 1
SUMMIT (n=2279)758 metabolites(439 known, 319 unknown)
Based on KORA F4 (n=1768)
398 significant partial correlationswith 303 metabolites
1040 partial correlationswith 637 metabolites(388 known 249 unknown)
187 metabolites associated directely or through 47 ratios to 134 genes
862 significant partial correlationswith 580 metabolites
181 unkonwn metabolites are connected by partial correlations (171) or via genes (35) to known metabolites.
648 metabolites(394 known, 254 unknown)134 genes
2626 metabolites7439 reactions2140 genes
Figure B.2: Network model: stepwise data integration procedure (SUMMIT)The network model is composed by three several types of data that are integrated dur-ing sequential steps. The workflow describes each step together including its input, out-put, and intermediate states of the network model. I previously published this figure inQuell et al. 2017; reprinted by permission from the Journal of Chromatography B [150].

154 B Supplements: Annotation of unknown metabolites
Automated annotation of unknown metabolites
Confidence Total Correct Similar False Ff Nonevery high 10 797 8 354 (77.4%) 953 (8.8%) 1 317 (12.1%) 183 (1.7%) 0 (0.0%)high 1 278 682 (53.4%) 0 (0.0%) 533 (41.7%) 63 (4.9%) 0 (0.0%)medium 9 914 5 932 (59.8%) 1 302 (13.1%) 1 781 (18.0%) 899 (9.1%) 0 (0.0%)low 5 308 1 957 (36.9%) 93 (1.8%) 1 941 (36.6%) 1 218 (22.9%) 99 (1.9%)very low 2 985 827 (27.7%) 305 (10.2%) 691 (23.1%) 1 162 (38.9%) 0 (0.0%)
Table B.1: Cross-validation of the pathway prediction moduleThe pathway prediction module went through 100x 10-fold cross-validation receiving thetotal count of predicted super pathways per confidence level. Following columns refer tothe number of accompanying predicted sub pathways. For the sub pathway prediction,we distinguished between correct, similar (e.g. long-chain fatty acids versus medium-chainfatty acids), false, false because of wrong super pathway (Ff), or no prediction. I previouslypublished this table in Quell et al. 2017; reprinted by permission from the Journal ofChromatography B [150].

155
Name Predicted super pathway Confidence Predicted sub pathway FractionX-11805 peptide very high dipeptide 0.8X-13429 lipid very high sterol, steroid 0.4X-12063 lipid very high sterol, steroid 0.4X-11440 lipid very high sterol, steroid 0.6X-12456 lipid very high sterol, steroid 0.5X-11792 peptide very high dipeptide 0.8X-12850 lipid very high sterol, steroid 0.6X-14086 peptide very high dipeptide 1X-11441 cofactors and vitamins very high hemoglobin and porphyrin metabolism 1X-11442 cofactors and vitamins very high hemoglobin and porphyrin metabolism 1X-11530 cofactors and vitamins very high hemoglobin and porphyrin metabolism 1X-17174 peptide very high dipeptide 0.7X-18601 lipid very high sterol, steroid 0.8X-08988 amino acid very high glycine, serine and threonine metabolism 0.6X-11381 lipid very high carnitine metabolism 0.6X-11438 lipid very high fatty acid, dicarboxylate, or long chain fatty acid 0.4X-11491 lipid very high fatty acid, dicarboxylate, or lysolipid 0.3X-11538 lipid very high fatty acid, dicarboxylate 0.5X-11469 lipid very high sterol, steroid 0.5X-12644 lipid very high lysolipid 0.8X-11529 lipid very high fatty acid, dicarboxylate, or lysolipid 0.4X-14626 lipid very high fatty acid, dicarboxylate, or lysolipid 0.4X-02249 lipid very high essential fatty acid, or fatty acid, dicarboxylate, or
long chain fatty acid0.3
X-11421 lipid very high carnitine metabolism 0.7X-11470 lipid very high sterol/steroid 0.7X-17269 lipid very high medium chain fatty acid 1X-14192 peptide very high dipeptide 1X-14272 peptide very high dipeptide, or gamma-glutamyl amino acid 0.5X-16123 peptide very high dipeptide 1X-16128 peptide very high dipeptide 1X-16132 peptide very high dipeptide 1X-16134 peptide very high fibrinogen cleavage peptide 1X-12556 amino acid very high glycine, serine and threonine metabolism 0.8X-11422 nucleotide high purine metabolism, (hypo)xanthine/inosine contai-
ning0.7
X-13435 lipid high carnitine metabolism 1X-11261 lipid high carnitine metabolism 0.4X-12798 lipid high carnitine metabolism 0.7X-02269 lipid medium fatty acid, dicarboxylate, or long chain fatty acid 0.5X-08402 lipid medium sphingolipid, or sterol/steroid 0.5X-10510 lipid medium sphingolipid, or sterol/steroid 0.5X-11244 lipid medium sterol, steroid 1X-11443 lipid medium sterol, steroid 1X-11820 lipid medium carnitine metabolism, or sterol/steroid 0.5X-11905 lipid medium fatty acid, dicarboxylate 1X-12450 lipid medium essential fatty acid, or fatty acid, monohydroxy 0.5

156 B Supplements: Annotation of unknown metabolites
Table continued (p. 2 / 5)Name Predicted super pathway Confidence Predicted sub pathway FractionX-12465 lipid medium carnitine metabolism, or ketone bodies 0.5X-12627 lipid medium essential fatty acid, or long chain fatty acid 0.5X-13891 lipid medium fatty acid, dicarboxylate 1X-14632 lipid medium bile acid metabolism, or sterol/steroid 0.5X-14658 lipid medium bile acid metabolism 1X-16654 lipid medium bile acid metabolism 1X-17443 lipid medium fatty acid, monohydroxy 1X-11522 cofactors and vitamins medium hemoglobin and porphyrin metabolism 1X-04495 amino acid medium butanoate metabolism, or creatine metabolism, or
cysteine, methionine, sam, taurine metabolism0.3
X-09706 amino acid medium urea cycle; arginine-, proline-, metabolism, or valine,leucine and isoleucine metabolism
0.5
X-11478 amino acid medium phenylalanine & tyrosine metabolism, or tryptophanmetabolism
0.5
X-11837 amino acid medium phenylalanine & tyrosine metabolism 1X-12216 amino acid medium phenylalanine & tyrosine metabolism 1X-14352 amino acid medium urea cycle; arginine-, proline-, metabolism, or valine,
leucine and isoleucine metabolism0.5
X-11838 xenobiotics medium drug 1X-12039 xenobiotics medium food component/plant, or xanthine metabolism 0.5X-14374 xenobiotics medium benzoate metabolism, or xanthine metabolism 0.5X-11429 nucleotide medium purine metabolism, (hypo)xanthine/inosine contai-
ning, or pyrimidine metabolism, uracil containing0.5
X-16674 lipid medium fatty acid, monohydroxy 1X-03094 lipid medium sterol/steroid 1X-10419 lipid medium sterol/steroid 1X-10500 lipid medium sterol/steroid 1X-11247 lipid medium long chain fatty acid 1X-11317 lipid medium lysolipid 1X-11327 lipid medium carnitine metabolism 1X-11450 lipid medium sterol, steroid 1X-11508 lipid medium fatty acid, monohydroxy 1X-11521 lipid medium essential fatty acid 1X-11533 lipid medium medium chain fatty acid 1X-11537 lipid medium glycerolipid metabolism 1X-11540 lipid medium glycerolipid metabolism 1X-11550 lipid medium medium chain fatty acid 1X-11552 lipid medium fatty acid, amide 1X-11859 lipid medium medium chain fatty acid 1X-12051 lipid medium lysolipid 1X-13069 lipid medium long chain fatty acid 1X-14662 lipid medium bile acid metabolism 1X-14939 lipid medium medium chain fatty acid 1X-15222 lipid medium medium chain fatty acid 1X-15492 lipid medium sterol/steroid 1X-16578 lipid medium medium chain fatty acid 1X-16943 lipid medium medium chain fatty acid 1

157
Table continued (p. 3 / 5)Name Predicted super pathway Confidence Predicted sub pathway FractionX-16947 lipid medium inositol metabolism 1X-17254 lipid medium lysolipid 1X-17299 lipid medium carnitine metabolism 1X-17438 lipid medium fatty acid, dicarboxylate 1X-06307 peptide medium dipeptide 1X-12038 peptide medium polypeptide 1X-16130 peptide medium dipeptide 1X-16135 peptide medium fibrinogen cleavage peptide 1X-16137 peptide medium polypeptide 1X-17189 peptide medium dipeptide 1X-17441 peptide medium fibrinogen cleavage peptide 1X-14095 amino acid medium —X-11333 amino acid medium amino fatty acid, or lysine metabolism, or urea cycle;
arginine-, proline-, metabolism0.3
X-11809 cofactors and vitamins low hemoglobin and porphyrin metabolism 1X-12206 cofactors and vitamins low ascorbate and aldarate metabolism 1X-14056 cofactors and vitamins low hemoglobin and porphyrin metabolism 1X-16124 cofactors and vitamins low hemoglobin and porphyrin metabolism 1X-16946 cofactors and vitamins low hemoglobin and porphyrin metabolism 1X-17162 cofactors and vitamins low hemoglobin and porphyrin metabolism 1X-17612 cofactors and vitamins low hemoglobin and porphyrin metabolism 1X-16480 lipid low essential fatty acid, or fatty acid, dicarboxylate 0.5X-12093 amino acid low amino fatty acid, or urea cycle; arginine-, proline-,
metabolism0.5
X-12511 amino acid low amino fatty acid, or urea cycle; arginine-, proline-,metabolism
0.5
X-13477 amino acid low amino fatty acid, or urea cycle; arginine-, proline-,metabolism
0.5
X-03088 amino acid low urea cycle; arginine-, proline-, metabolism 1X-05491 amino acid low butanoate metabolism 1X-06126 amino acid low phenylalanine & tyrosine metabolism 1X-06246 amino acid low alanine and aspartate metabolism 1X-06267 amino acid low urea cycle; arginine-, proline-, metabolism 1X-11334 amino acid low lysine metabolism 1X-11818 amino acid low amino fatty acid 1X-12405 amino acid low tryptophan metabolism 1X-12734 amino acid low phenylalanine & tyrosine metabolism 1X-12749 amino acid low phenylalanine & tyrosine metabolism 1X-12786 amino acid low alanine and aspartate metabolism 1X-12802 amino acid low valine, leucine and isoleucine metabolism 1X-13619 amino acid low urea cycle; arginine-, proline-, metabolism 1X-13835 amino acid low histidine metabolism 1X-14588 amino acid low lysine metabolism 1X-15461 amino acid low phenylalanine & tyrosine metabolism 1X-15667 amino acid low tryptophan metabolism 1X-16071 amino acid low tryptophan metabolism 1X-17138 amino acid low valine, leucine and isoleucine metabolism 1

158 B Supplements: Annotation of unknown metabolites
Table continued (p. 4 / 5)Name Predicted super pathway Confidence Predicted sub pathway FractionX-17685 amino acid low phenylalanine & tyrosine metabolism 1X-12543 amino acid low phenylalanine & tyrosine metabolism 1X-14625 amino acid low glutamate metabolism, or glutathione metabolism 0.5X-13848 amino acid low —X-10810 nucleotide low purine metabolism, (hypo)xanthine/inosine contai-
ning1
X-12094 nucleotide low nad metabolism 1X-12844 nucleotide low nad metabolism 1X-11452 xenobiotics low food component/plant 1X-12040 xenobiotics low food component, plant 1X-12217 xenobiotics low benzoate metabolism 1X-12230 xenobiotics low benzoate metabolism 1X-12231 xenobiotics low food component/plant 1X-12329 xenobiotics low food component/plant 1X-12407 xenobiotics low food component/plant 1X-12730 xenobiotics low food component/plant 1X-12816 xenobiotics low food component/plant 1X-12830 xenobiotics low food component/plant 1X-12847 xenobiotics low food component/plant 1X-13728 xenobiotics low xanthine metabolism 1X-15497 xenobiotics low drug 1X-15728 xenobiotics low benzoate metabolism 1X-16564 xenobiotics low benzoate metabolism 1X-16940 xenobiotics low benzoate metabolism 1X-17150 xenobiotics low food component/plant 1X-17185 xenobiotics low benzoate metabolism 1X-17314 xenobiotics low benzoate metabolism 1X-12544 lipid very low sterol/steroid 1X-02973 cofactors and vitamins very low ascorbate and aldarate metabolism 1X-04357 carbohydrate very low fructose, mannose, galactose, starch, and sucrose
metabolism1
X-12007 carbohydrate very low fructose, mannose, galactose, starch, and sucrosemetabolism
1
X-12056 carbohydrate very low fructose, mannose, galactose, starch, and sucrosemetabolism
1
X-12116 cofactors and vitamins very low ascorbate and aldarate metabolism 1X-12696 carbohydrate very low glycolysis, gluconeogenesis, pyruvate metabolism 1X-13727 carbohydrate very low fructose, mannose, galactose, starch, and sucrose
metabolism1
X-17502 carbohydrate very low glycolysis, gluconeogenesis, pyruvate metabolism 1X-18221 carbohydrate very low glycolysis, gluconeogenesis, pyruvate metabolism 1X-14473 peptide very low dipeptide 1X-11799 lipid very low inositol metabolism 1X-10506 amino acid very low alanine and aspartate metabolism 1X-11315 amino acid very low glutamate metabolism 1X-17145 amino acid very low tryptophan metabolism 1X-15245 carbohydrate very low glycolysis, gluconeogenesis, pyruvate metabolism 1

159
Table continued (p. 5 / 5)Name Predicted super pathway Confidence Predicted sub pathway FractionX-11561 peptide very low dipeptide 1X-14302 peptide very low polypeptide 1X-01911 cofactors and vitamins very low ascorbate and aldarate metabolism 1X-11319 lipid very low long chain fatty acid 1X-13866 lipid very low long chain fatty acid 1X-11787 amino acid very low amino fatty acid, or urea cycle; arginine-, proline-,
metabolism0.5
X-11255 amino acid very low valine, leucine and isoleucine metabolism 1X-12704 amino acid very low phenylalanine & tyrosine metabolism 1
Table B.2: Predicted super and sub pathways of unknown metabolitesSuper and sub pathways were automatically predicted for 180 and 178 unknown metabolites,respectively. Predicted sub pathways come along with their fraction among neighboringmetabolites within the network model (in case of more than one predicted sub pathway,factions of the most frequent one is specified). Entries are ordered by their confidence scoresdecreasingly. I previously published this table in Quell et al. 2017; reprinted by permissionfrom the Journal of Chromatography B [150].

160 B Supplements: Annotation of unknown metabolites
Metabolite Unknown P. super pw P. sub pw ∆mass Predicted reaction11-HpODE X-11421 0.98 Oxidative deamination2-methylbutyroyl-carnitine
X-11255 amino acid valine, leucine and iso-leucine metabolism
1.0* Oxidative deamination
pyroglutamine X-11315 amino acid glutamate metabolism 1.0* Oxidative deamination3-methylhistidine X-13835 amino acid histidine metabolism 1.0* Oxidative deaminationX-14632 X-14658 1.0 Oxidative deaminationGuanine X-11422 1.1 Oxidative deaminationX-11244 X-11443 1.1 Oxidative deaminationX-11443 X-11450 -1.1 Oxidative deaminationN-acetylornithine X-13477 amino acid urea cycle; arginine-,
proline-, metabolism1.1 Oxidative deamination
X-11378 X-16935 1.8 De-hydrogenation/ ReductionX-12217 X-16940 1.8 De-hydrogenation/ ReductionX-11444 X-12844 -1.9 De-hydrogenation/ ReductionX-12230 X-17185 -1.9 De-hydrogenation/ ReductionX-11444 X-17706 -1.9 De-hydrogenation/ Reductionpelargonate (9:0) X-11859 lipid medium chain fatty acid -1.9 De-hydrogenation/ Reductiondecanoylcarnitine X-13435 lipid carnitine metabolism -1.9 De-hydrogenation/ Reductionestrone X-02249 -1.9 De-hydrogenation/ Reductionpseudouridine X-11429 nucleotide pyrimidine metabolism,
uracil containing2.0* De-hydrogenation/ Reduction
3-carboxy-4-methyl-5-propyl 2-furanpro-panoate (CMPF)
X-11469 lipid fatty acid, dicarboxylate -2.0* De-hydrogenation/ Reduction
X-11299 X-11483 -2.0* De-hydrogenation/ Reductionoctadecanedioate X-11538 lipid fatty acid, dicarboxylate -2.0* De-hydrogenation/ Reductionhexadecanedioate X-11905 lipid fatty acid, dicarboxylate -2.0* De-hydrogenation/ Reductionthymol sulfate X-12847 xenobiotics food component/plant -2.0* De-hydrogenation/ ReductionX-11538 X-16480 -2.0 De-hydrogenation/ ReductionL-urobilin X-17162 cofactors
and vitaminshemoglobin and por-phyrin metabolism
-2.0* De-hydrogenation/ Reduction
X-12844 X-17357 2.0 De-hydrogenation/ ReductionX-12846 X-17703 -2.0 De-hydrogenation/ ReductionX-15492 X-17706 -2.0 De-hydrogenation/ Reductionomega hydroxy tetra-decanoate (n C14:0)
X-11438 -2.0 De-hydrogenation/ Reduction
pelargonate (9:0) X-17269 lipid medium chain fatty acid -2.0 De-hydrogenation/ Reductiondehydroisoandroster-one sulfate (DHEA-S)
X-18601 lipid sterol, steroid 2.0 De-hydrogenation/ Reduction
4-hydroxyphenyl-pyruvate
X-12543 amino acid phenylalanine & tyro-sine metabolism
2.1 De-hydrogenation/ Reduction
dodecanedioate X-13891 lipid fatty acid, dicarboxylate -2.1* De-hydrogenation/ ReductionX-17359 X-17706 -2.1 De-hydrogenation/ Reduction5,8-tetradecadien-oate
X-13069 lipid long chain fatty acid 2.3* De-hydrogenation/ Reduction
myristate (14:0) X-11438 lipid long chain fatty acid 14.0 Methylation/ De-methylation,or Alkyl-chain-elongation
X-11317 X-11497 14.0 Methylation/ De-methylation,or Alkyl-chain-elongation

161
Table continued (p. 2 / 5)Metabolite Unknown P. super pw P. sub pw ∆mass Predicted reaction13-cis-retinoate X-11530 14.0 Methylation/ De-methylation,
or Alkyl-chain-elongationall-trans-retinoate X-11530 14.0 Methylation/ De-methylation,
or Alkyl-chain-elongationX-14374 X-14473 14.0 Methylation/ De-methylation,
or Alkyl-chain-elongationX-12212 X-15636 14.0 Methylation/ De-methylation,
or Alkyl-chain-elongationX-11441 X-16946 -14.0 Methylation/ De-methylation,
or Alkyl-chain-elongationX-12734 X-17685 14.0 Methylation/ De-methylation,
or Alkyl-chain-elongationpalmitate (16:0) X-11438 lipid long chain fatty acid -14.0 Methylation/ De-methylation,
or Alkyl-chain-elongationestrone X-02269 -14.1 Methylation/ De-methylation,
or Alkyl-chain-elongation8-hydroxyoctanoate X-11508 lipid fatty acid,
monohydroxy14.1* Methylation/ De-methylation,
or Alkyl-chain-elongation2-aminooctanoicacid
X-11818 amino acid amino fatty acid -14.1* Methylation/ De-methylation,or Alkyl-chain-elongation
X-12039 X-12329 14.1 Methylation/ De-methylation,or Alkyl-chain-elongation
X-11470 X-12844 14.1 Methylation/ De-methylation,or Alkyl-chain-elongation
X-02249 X-13866 -14.1 Methylation/ De-methylation,or Alkyl-chain-elongation
catechol sulfate X-12217 xenobiotics benzoate metabolism 14.2* Methylation/ De-methylation,or Alkyl-chain-elongation
X-12734 X-16940 -14.2 Methylation/ De-methylation,or Alkyl-chain-elongation
urate X-11422 nucleotide purine metabolism,urate metabolism
-15.9 Oxidation, or Hydroxylation,or Epoxidation
3-carboxy-4-methyl-5-propyl-2-furanpro-panoate (CMPF)
X-02269 lipid fatty acid, dicarboxylate 16.0* Oxidation, or Hydroxylation,or Epoxidation
p-cresol sulfate X-06126 amino acid phenylalanine & tyro-sine metabolism
16.0* Oxidation, or Hydroxylation,or Epoxidation
tetradecanedioate X-11438 lipid fatty acid, dicarboxylate -16.0* Oxidation, or Hydroxylation,or Epoxidation
X-11444 X-11470 -16.0 Oxidation, or Hydroxylation,or Epoxidation
4-ethylphenylsul-fate
X-12230 xenobiotics benzoate metabolism 16.0* Oxidation, or Hydroxylation,or Epoxidation
X-12329 X-12730 16.0 Oxidation, or Hydroxylation,or Epoxidation
X-12217 X-12734 16.0 Oxidation, or Hydroxylation,or Epoxidation
2-aminooctanoicacid
X-13477 amino acid amino fatty acid 16.0* Oxidation, or Hydroxylation,or Epoxidation
gamma glutamyl-glutamate
X-14272 peptide gamma-glutamyl aminoacid
-16.0* Oxidation, or Hydroxylation,or Epoxidation
catechol sulfate X-16940 xenobiotics benzoate metabolism 16.0* Oxidation, or Hydroxylation,or Epoxidation

162 B Supplements: Annotation of unknown metabolites
Table continued (p. 3 / 5)Metabolite Unknown P. super pw P. sub pw ∆mass Predicted reactionhypoxanthine X-11422 nucleotide purine metabolism,
(hypo)xanthine/inosinecontaining
16.1 Oxidation, or Hydroxylation,or Epoxidation
estradiol X-02269 -16.1 Oxidation, or Hydroxylation,or Epoxidation
3-phenylpropionate(hydrocinnamate)
X-11478 amino acid phenylalanine & tyro-sine metabolism
16.1* Oxidation, or Hydroxylation,or Epoxidation
5alpha-androstan-3alpha, 17beta-dioldisulfate
X-12544 lipid sterol/steroid -16.1* Oxidation, or Hydroxylation,or Epoxidation
theobromine X-14374 xenobiotics xanthine metabolism 16.1* Oxidation, or Hydroxylation,or Epoxidation
X-11470 X-15492 16.1 Oxidation, or Hydroxylation,or Epoxidation
4-vinylphenolsulfate
X-17185 xenobiotics benzoate metabolism 16.1* Oxidation, or Hydroxylation,or Epoxidation
linoleate (18:2n6) X-12450 lipid essential fatty acid -27.8 De-ethylation, or Alkyl-chain-elongation
docosapentaenoate(n3 DPA; 22:5n3)
X-12627 lipid essential fatty acid 28.0* De-ethylation, or Alkyl-chain-elongation
X-12855 X-12860 28.0 De-ethylation, or Alkyl-chain-elongation
X-16674 X-17438 28.0 De-ethylation, or Alkyl-chain-elongation
3-carboxy-4-methyl-5-propyl-2-furanpro-panoate (CMPF)
X-02249 lipid fatty acid, dicarboxylate 28.1* De-ethylation, or Alkyl-chain-elongation
X-10346 X-11437 -28.1 De-ethylation, or Alkyl-chain-elongation
X-11538 X-11905 -28.1 De-ethylation, or Alkyl-chain-elongation
N-acetylornithine X-12093 amino acid urea cycle; arginine-,proline-, metabolism
28.1 De-ethylation, or Alkyl-chain-elongation
3-methylglutaryl-carnitine (C6)
X-12802 amino acid valine, leucine and iso-leucine metabolism
28.1* De-ethylation, or Alkyl-chain-elongation
X-11787 X-13477 28.1 De-ethylation, or Alkyl-chain-elongation
X-15728 X-16124 -28.1 De-ethylation, or Alkyl-chain-elongation
X-16940 X-17685 28.2 De-ethylation, or Alkyl-chain-elongation
2-hydroxyacetami-nophen sulfate
X-11838 xenobiotics drug 29.9* Quinone, or CH3 to COOH, orNitro reduction
4-ethylphenylsul-fate
X-15728 xenobiotics benzoate metabolism 30.0* Quinone, or CH3 to COOH, orNitro reduction
omega hydroxy hexa-decanoate (n C16:0)
X-11438 -30.0 Quinone, or CH3 to COOH, orNitro reduction
16alpha-Hydroxy-estrone
X-02269 -30.1 Quinone, or CH3 to COOH, orNitro reduction
X-02249 X-11469 -30.1 Quinone, or CH3 to COOH, orNitro reduction
13-cis-retinoate X-11441 31.9 Bis-oxidationall-trans-retinoate X-11441 31.9 Bis-oxidation

163
Table continued (p. 4 / 5)Metabolite Unknown P. super pw P. sub pw ∆mass Predicted reaction13-cis-retinoate X-11442 31.9 Bis-oxidationall-trans-retinoate X-11442 31.9 Bis-oxidationpropionylcarnitine X-11381 lipid fatty acid metabolism
(also bcaa metabolism)-31.9 Bis-oxidation
pregnenolonesulfate
X-12456 lipid sterol/steroid 32.0 Bis-oxidation
estrone X-11469 -32.1 Bis-oxidation2-Hydroxyestradiol-17beta
X-02269 -32.1 Bis-oxidation
linolenate [a or g;(18:3n3 or 6)]
X-16480 lipid essential fatty acid 32.1 Bis-oxidation
lathosterol X-12063 lipid sterol/steroid 41.9 Acetylationlathosterol X-12456 lipid sterol/steroid 41.9 Acetylation5alpha-cholest-8-en-3beta-ol
X-12063 41.9 Acetylation
5alpha-cholest-8-en-3beta-ol
X-12456 41.9 Acetylation
androsterone X-11441 41.9 Acetylationandrosterone X-11442 41.9 Acetylationcarnosine X-11561 42.0 AcetylationX-12253 X-12258 42.0 Acetylation2-aminooctanoicacid
X-12511 amino acid amino fatty acid 42.0* Acetylation
X-12802 X-12860 -42.0 AcetylationIsocitrate X-15245 42.0 Acetylationestradiol X-11530 42.0 Acetylationlaurate X-11438 42.0 Acetylation1-docosahexaenoylgly-cero-phosphocholine
X-12644 lipid lysolipid -42.1* Acetylation
aflatoxin B1 exo-8,9-epoxide
X-18601 42.1 Acetylation
cholesta-5,7-dien-3beta-ol
X-12063 43.9 Decarboxylation
cholesta-5,7-dien-3beta-ol
X-12456 43.9 Decarboxylation
5alpha-cholesta-7,24-dien-3beta-ol
X-12063 43.9 Decarboxylation
5alpha-cholesta-7,24-dien-3beta-ol
X-12456 43.9 Decarboxylation
testosterone X-11441 43.9 Decarboxylationtestosterone X-11442 43.9 Decarboxylationglucose X-12007 carbohydrate glycolysis, gluconeoge-
nesis, pyruvate metabo-lism
43.9 Decarboxylation
hexadecanedioate X-11438 lipid fatty acid, dicarboxylate -44.0* Decarboxylationandro steroid mono-sulfate 2
X-12063 lipid sterol/steroid 44.0* Decarboxylation
oxalatosuccinate(3-) X-15245 44.0 Decarboxylationestrone X-11530 44.0 Decarboxylationacetylcarnitine X-12465 lipid carnitine metabolism 44.1 Decarboxylation

164 B Supplements: Annotation of unknown metabolites
Table continued (p. 5 / 5)Metabolite Unknown P. super pw P. sub pw ∆mass Predicted reactionsebacate (decanedi-oate)
X-17438 lipid fatty acid, dicarboxylate 44.1 Decarboxylation
X-13891 X-17443 44.1* Decarboxylation3-hydroxyhippurate X-12704 xenobiotics benzoate metabolism 79.9* Sulfation, or Phosphatation3-dehydrocarnitine X-12798 lipid carnitine metabolism 79.9* Sulfation, or Phosphatation4 androsten 3beta,17-beta-diol disulfate 2
X-18601 lipid sterol, steroid 80.0 Sulfation, or Phosphatation
X-06126 X-11837 80.0 Sulfation, or PhosphatationX-11308 X-11378 80.1 Sulfation, or PhosphatationX-11378 X-17654 -80.1 Sulfation, or PhosphatationX-14625 X-18221 95.8 Sulfation, or Phosphatationcaproate (6:0) X-16578 lipid medium chain fatty acid 95.9* Sulfation, or Phosphatationp-cresol sulfate X-11837 amino acid phenylalanine & tyro-
sine metabolism96.0* Sulfation, or Phosphatation
alpha-glutamyl-tyrosine
X-11805 peptide dipeptide 107.0* Taurine Conjugation
X-12830 X-17703 107.1 Taurine ConjugationX-11261 X-11478 -119.0 Cys ConjugationS-methylcysteine X-13866 amino acid cysteine, methionine,
sam, taurine metabo-lism
119.1* Cys Conjugation
dehydroisoandroster-one sulfate (DHEA-S)
X-11440 lipid sterol, steroid -120.9 Cys Conjugation
testosterone sulfate X-11440 -120.9 Cys Conjugationdeoxycholate X-11491 lipid bile acid metabolism 176.0 Glucuronidation1-arachidonoylglyce-rophosphoinositol
X-12063 lipid lysolipid -192.2* Glucuronidation
1-arachidonoylglyce-rophosphoinositol
X-12456 lipid lysolipid -192.2* Glucuronidation
X-09789 X-18774 192.2 Glucuronidationphenylalanyl-phenylalanine
X-17189 peptide dipeptide 306.8* GSH Conjugation
Table B.3: Predicted reactions based on mass differences and network relations100 reactions connecting known to unknown and 45 reactions among unknown metaboliteswere automatically selected based on their ∆mass (± 0.3). Pairs of metabolites refer toneighborships in the network model via GGM edges, a common mGWAS gene, or a gene orthird metabolite that is functionally related to a metabolite and associated to an unknownmetabolite. The signs in the mass differences column indicate the direction of predictedreactions, starting with the (known) metabolite of the first column. An asterisk indicatesthat ∆mass is based on the measured mass of known metabolites. The list is ordered byabsolute ∆mass values. I previously published this table in Quell et al. 2017; reprinted bypermission from the Journal of Chromatography B [150].

165
dehydrogenation other
020
040
060
080
010
0012
00
diffe
renc
e in
ret
entio
n in
dex
thresholdat 355.9
Figure B.3: Difference in retention index of dehydrogenation reactantsRIs of metabolite neighbors (according to their location in the network model) differ clearlybetween dehydrogenation reactants and random-pairs (∆mass= 2± 0.3). The thresholdwas determined by the mean of both distributions weighted by their SDs. I previouslypublished this figure in Quell et al. 2017; reprinted by permission from the Journal ofChromatography B [150].

166 B Supplements: Annotation of unknown metabolites
Metabolite Unknown ∆mass ∆RI Predicted reactionpelargonate (9:0) X-11859 -1.9 294 De-hydrogenation/ Reductiondecanoylcarnitine X-13435 -1.9 60 De-hydrogenation/ Reductionpseudouridine X-11429 2.0 47 De-hydrogenation/ Reductionoctadecanedioate X-11538 -2.0 113 De-hydrogenation/ Reductionhexadecanedioate X-11905 -2.0 249 De-hydrogenation/ Reductionthymol sulfate X-12847 -2.0 155 De-hydrogenation/ ReductionL-urobilin X-17162 -2.0 50 De-hydrogenation/ Reductionpelargonate (9:0) X-17269 -2.0 317 De-hydrogenation/ Reductiondehydroisoandrosterone sulfate (DHEA-S) X-18601 2.0 229 De-hydrogenation/ Reduction4-hydroxyphenylpyruvate X-12543 2.1 265 De-hydrogenation/ Reductiondodecanedioate X-13891 -2.1 274 De-hydrogenation/ Reduction5,8-tetradecadienoate X-13069 2.3 94 De-hydrogenation/ Reduction3-carboxy-4-methyl-5-propyl-2-furanpropanoate(CMPF)
X-11469 -2.0 NA measured on different platforms
estrone X-02249 -2.0 NA non-measured metaboliteomega hydroxy tetradecanoate (n-C14:0) X-11438 -2.0 NA non-measured metaboliteX-11444 X-12844 -1.9 185 De-hydrogenation/ ReductionX-12230 X-17185 -1.9 291 De-hydrogenation/ ReductionX-11538 X-16480 -2.0 235 De-hydrogenation/ ReductionX-12844 X-17357 2.0 73 De-hydrogenation/ ReductionX-12846 X-17703 -2.0 70 De-hydrogenation/ ReductionX-15492 X-17706 -2.0 7 De-hydrogenation/ ReductionX-17359 X-17706 -2.1 84 De-hydrogenation/ ReductionX-11378 X-16935 1.8 860 noX-12217 X-16940 1.8 649 noX-11444 X-17706 -1.9 708 noX-11299 X-11483 -2.0 450 no
Table B.4: Predicted dehydrogenation/ reduction reactionsDehydrogenation reactions were assigned to neighboring metabolites (of the network model)with mass difference 2± 0.3 and post-filtered according to ∆RI≤ 355.9. The signs in the∆mass-column indicate the direction of the reaction, starting from the first metabolite. Ipreviously published this table in Quell et al. 2017; reprinted by permission from the Journalof Chromatography B [150].

167
Comparative annotation of several metabolite sets
Metabolite SUMMIT/GCKD SUMMIT GCKDX-01911 amino acid cofactors and vitamins —X-02249 lipid lipid amino acidX-02269 lipid lipid -/-X-02973 cofactors and vitamins cofactors and vitamins -/-X-03088 amino acid amino acid -/-X-03094 lipid lipid -/-X-04357 carbohydrate carbohydrate -/-X-04495 amino acid amino acid -/-X-04498 — — -/-X-05426 — — -/-X-05491 amino acid amino acid -/-X-05907 — — -/-X-06126 xenobiotics amino acid -/-X-06226 — — -/-X-06227 energy — -/-X-06246 amino acid amino acid -/-X-06267 amino acid amino acid -/-X-06307 peptide peptide -/-X-08402 lipid lipid -/-X-08988 amino acid amino acid -/-X-09026 — — -/-X-09706 amino acid amino acid -/-X-09789 xenobiotics — xenobioticsX-10346 — — -/-X-10395 — — -/-X-10419 lipid lipid -/-X-10457 — -/- —X-10500 lipid lipid -/-X-10506 amino acid amino acid -/-X-10510 lipid lipid -/-X-10810 nucleotide nucleotide -/-X-11204 — — -/-X-11244 lipid lipid -/-X-11247 lipid lipid -/-X-11255 amino acid amino acid -/-X-11261 lipid lipid -/-X-11299 — — -/-X-11308 — — -/-X-11315 amino acid amino acid -/-X-11317 lipid lipid -/-X-11319 lipid lipid -/-X-11327 lipid lipid -/-

168 B Supplements: Annotation of unknown metabolites
Table continued (p. 2 / 16)Metabolite SUMMIT/GCKD SUMMIT GCKDX-11333 amino acid amino acid -/-X-11334 amino acid amino acid amino acidX-11357 amino acid -/- amino acidX-11372 — — -/-X-11378 — — -/-X-11381 lipid lipid -/-X-11421 lipid lipid -/-X-11422 nucleotide nucleotide -/-X-11429 nucleotide nucleotide —X-11437 — — -/-X-11438 lipid lipid -/-X-11440 lipid lipid lipidX-11441 cofactors and vitamins cofactors and vitamins -/-X-11442 cofactors and vitamins cofactors and vitamins -/-X-11443 lipid lipid -/-X-11444 — — —X-11450 lipid lipid -/-X-11452 xenobiotics xenobiotics —X-11469 lipid lipid -/-X-11470 lipid lipid lipidX-11478 amino acid amino acid -/-X-11483 — — -/-X-11485 — -/- —X-11491 lipid lipid -/-X-11497 — — -/-X-11508 lipid lipid -/-X-11521 lipid lipid -/-X-11522 cofactors and vitamins cofactors and vitamins -/-X-11529 lipid lipid -/-X-11530 cofactors and vitamins cofactors and vitamins -/-X-11533 lipid lipid -/-X-11537 lipid lipid -/-X-11538 lipid lipid -/-X-11540 lipid lipid lipidX-11550 lipid lipid -/-X-11552 lipid lipid -/-X-11561 amino acid peptide -/-X-11564 — — —X-11612 nucleotide -/- nucleotideX-11640 — -/- —X-11787 amino acid amino acid amino acidX-11792 peptide peptide -/-X-11795 — — -/-X-11799 lipid lipid -/-X-11805 peptide peptide -/-

169
Table continued (p. 3 / 16)Metabolite SUMMIT/GCKD SUMMIT GCKDX-11809 cofactors and vitamins cofactors and vitamins -/-X-11818 amino acid amino acid -/-X-11820 lipid lipid -/-X-11837 peptide amino acid -/-X-11838 xenobiotics xenobiotics -/-X-11843 — — —X-11847 — — -/-X-11849 — — -/-X-11850 — — —X-11852 — -/- —X-11859 lipid lipid -/-X-11880 — — -/-X-11905 lipid lipid -/-X-11979 — -/- —X-12007 carbohydrate carbohydrate —X-12013 — -/- —X-12015 cofactors and vitamins -/- cofactors and vitaminsX-12026 amino acid -/- amino acidX-12027 xenobiotics -/- xenobioticsX-12029 — — -/-X-12038 peptide peptide -/-X-12039 xenobiotics xenobiotics -/-X-12040 xenobiotics xenobiotics -/-X-12051 lipid lipid -/-X-12056 carbohydrate carbohydrate -/-X-12063 lipid lipid -/-X-12092 xenobiotics — -/-X-12093 amino acid amino acid amino acidX-12094 nucleotide nucleotide -/-X-12096 amino acid -/- amino acidX-12097 amino acid -/- amino acidX-12100 cofactors and vitamins -/- cofactors and vitaminsX-12101 — -/- —X-12111 amino acid -/- amino acidX-12112 xenobiotics -/- xenobioticsX-12115 amino acid -/- amino acidX-12116 xenobiotics cofactors and vitamins -/-X-12117 amino acid -/- amino acidX-12119 amino acid -/- amino acidX-12123 xenobiotics -/- xenobioticsX-12124 amino acid -/- amino acidX-12125 amino acid -/- amino acidX-12126 — -/- —X-12127 — -/- —X-12170 amino acid -/- amino acid
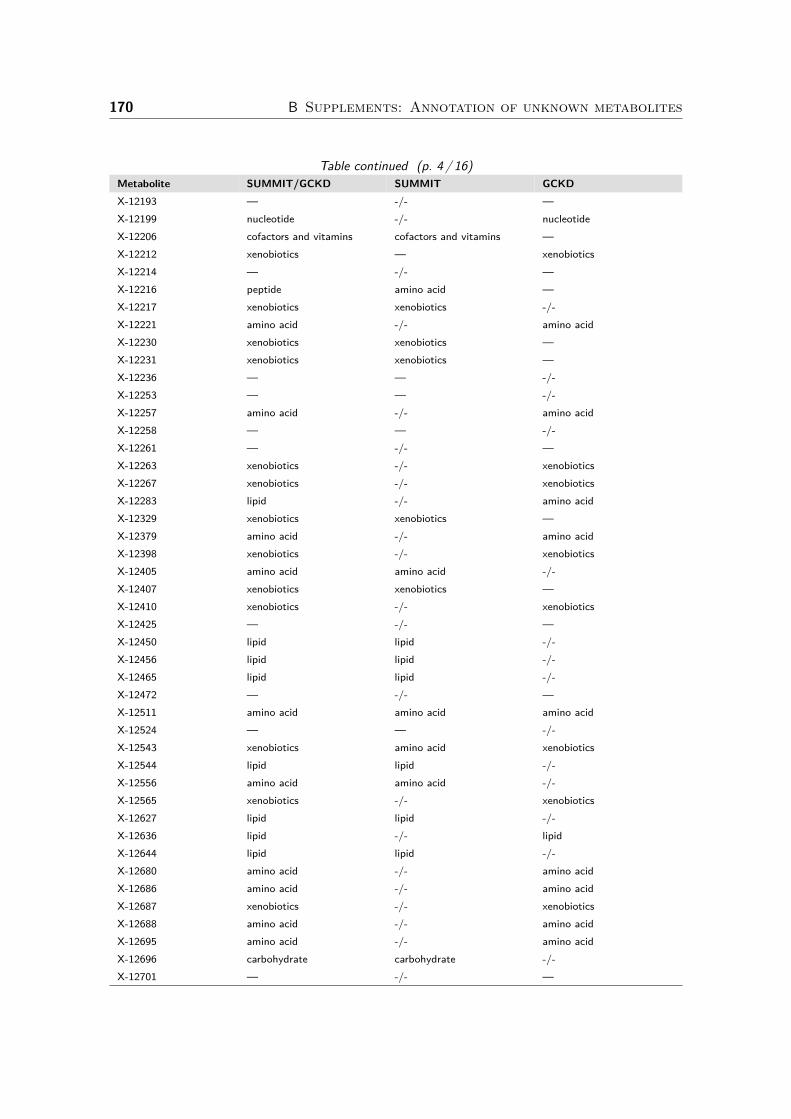
170 B Supplements: Annotation of unknown metabolites
Table continued (p. 4 / 16)Metabolite SUMMIT/GCKD SUMMIT GCKDX-12193 — -/- —X-12199 nucleotide -/- nucleotideX-12206 cofactors and vitamins cofactors and vitamins —X-12212 xenobiotics — xenobioticsX-12214 — -/- —X-12216 peptide amino acid —X-12217 xenobiotics xenobiotics -/-X-12221 amino acid -/- amino acidX-12230 xenobiotics xenobiotics —X-12231 xenobiotics xenobiotics —X-12236 — — -/-X-12253 — — -/-X-12257 amino acid -/- amino acidX-12258 — — -/-X-12261 — -/- —X-12263 xenobiotics -/- xenobioticsX-12267 xenobiotics -/- xenobioticsX-12283 lipid -/- amino acidX-12329 xenobiotics xenobiotics —X-12379 amino acid -/- amino acidX-12398 xenobiotics -/- xenobioticsX-12405 amino acid amino acid -/-X-12407 xenobiotics xenobiotics —X-12410 xenobiotics -/- xenobioticsX-12425 — -/- —X-12450 lipid lipid -/-X-12456 lipid lipid -/-X-12465 lipid lipid -/-X-12472 — -/- —X-12511 amino acid amino acid amino acidX-12524 — — -/-X-12543 xenobiotics amino acid xenobioticsX-12544 lipid lipid -/-X-12556 amino acid amino acid -/-X-12565 xenobiotics -/- xenobioticsX-12627 lipid lipid -/-X-12636 lipid -/- lipidX-12644 lipid lipid -/-X-12680 amino acid -/- amino acidX-12686 amino acid -/- amino acidX-12687 xenobiotics -/- xenobioticsX-12688 amino acid -/- amino acidX-12695 amino acid -/- amino acidX-12696 carbohydrate carbohydrate -/-X-12701 — -/- —

171
Table continued (p. 5 / 16)Metabolite SUMMIT/GCKD SUMMIT GCKDX-12704 xenobiotics amino acid amino acidX-12706 — -/- —X-12707 amino acid -/- amino acidX-12708 amino acid -/- amino acidX-12712 — -/- —X-12713 amino acid -/- amino acidX-12714 xenobiotics -/- xenobioticsX-12718 xenobiotics -/- xenobioticsX-12722 — -/- —X-12726 amino acid -/- amino acidX-12729 — -/- —X-12730 xenobiotics xenobiotics xenobioticsX-12731 — -/- —X-12733 — -/- —X-12734 amino acid amino acid -/-X-12738 xenobiotics -/- xenobioticsX-12739 — -/- —X-12740 — -/- —X-12742 — — -/-X-12745 amino acid -/- amino acidX-12749 xenobiotics amino acid -/-X-12753 xenobiotics -/- xenobioticsX-12776 — — -/-X-12786 amino acid amino acid -/-X-12798 lipid lipid -/-X-12802 amino acid amino acid -/-X-12811 — -/- —X-12812 — -/- —X-12814 — -/- —X-12816 xenobiotics xenobiotics -/-X-12818 xenobiotics -/- xenobioticsX-12819 — -/- —X-12820 — -/- —X-12821 carbohydrate -/- carbohydrateX-12822 lipid — lipidX-12830 xenobiotics xenobiotics —X-12831 — -/- —X-12832 — -/- —X-12834 — -/- —X-12836 xenobiotics -/- xenobioticsX-12839 lipid -/- amino acidX-12840 — -/- —X-12844 nucleotide nucleotide —X-12845 — -/- —X-12846 lipid — lipid

172 B Supplements: Annotation of unknown metabolites
Table continued (p. 6 / 16)Metabolite SUMMIT/GCKD SUMMIT GCKDX-12847 xenobiotics xenobiotics xenobioticsX-12849 — — —X-12850 lipid lipid -/-X-12851 — — -/-X-12855 — — -/-X-12860 lipid — lipidX-12879 cofactors and vitamins -/- cofactors and vitaminsX-12906 — -/- —X-13069 lipid lipid -/-X-13183 — — -/-X-13215 — — -/-X-13255 — -/- —X-13429 lipid lipid -/-X-13430 — -/- —X-13431 lipid -/- —X-13435 lipid lipid -/-X-13477 amino acid amino acid -/-X-13507 — -/- —X-13529 — -/- —X-13548 — — -/-X-13549 — — -/-X-13553 amino acid -/- amino acidX-13619 amino acid amino acid -/-X-13671 — — -/-X-13684 amino acid -/- amino acidX-13688 — -/- —X-13693 — -/- —X-13698 amino acid -/- amino acidX-13703 — -/- —X-13722 — -/- —X-13723 xenobiotics -/- xenobioticsX-13726 xenobiotics -/- xenobioticsX-13727 carbohydrate carbohydrate -/-X-13728 xenobiotics xenobiotics xenobioticsX-13729 amino acid -/- amino acidX-13737 — -/- —X-13834 lipid -/- lipidX-13835 amino acid amino acid amino acidX-13838 — -/- —X-13844 amino acid -/- amino acidX-13846 — -/- —X-13847 — -/- —X-13848 carbohydrate amino acid -/-X-13859 — — -/-X-13866 lipid lipid lipid

173
Table continued (p. 7 / 16)Metabolite SUMMIT/GCKD SUMMIT GCKDX-13874 lipid -/- lipidX-13879 lipid -/- lipidX-13891 lipid lipid -/-X-14056 amino acid cofactors and vitamins amino acidX-14057 — — -/-X-14082 cofactors and vitamins -/- cofactors and vitaminsX-14086 peptide peptide -/-X-14095 amino acid amino acid xenobioticsX-14096 — -/- —X-14099 amino acid -/- amino acidX-14192 peptide peptide -/-X-14196 amino acid -/- amino acidX-14272 peptide peptide -/-X-14302 amino acid peptide —X-14314 amino acid — amino acidX-14352 amino acid amino acid -/-X-14364 — — —X-14374 xenobiotics xenobiotics -/-X-14473 peptide peptide -/-X-14588 amino acid amino acid -/-X-14625 amino acid amino acid -/-X-14626 lipid lipid lipidX-14632 lipid lipid -/-X-14658 lipid lipid -/-X-14662 lipid lipid lipidX-14838 amino acid -/- amino acidX-14939 lipid lipid -/-X-14977 — — -/-X-15136 — -/- —X-15222 lipid lipid -/-X-15245 carbohydrate carbohydrate -/-X-15382 — — -/-X-15461 amino acid amino acid amino acidX-15469 lipid -/- lipidX-15484 — — -/-X-15486 lipid — lipidX-15492 energy lipid energyX-15497 lipid xenobiotics lipidX-15503 amino acid -/- amino acidX-15636 — — -/-X-15646 lipid -/- lipidX-15664 — — -/-X-15666 amino acid -/- amino acidX-15667 amino acid amino acid -/-X-15728 xenobiotics xenobiotics xenobiotics

174 B Supplements: Annotation of unknown metabolites
Table continued (p. 8 / 16)Metabolite SUMMIT/GCKD SUMMIT GCKDX-15754 — -/- —X-15843 — -/- —X-16071 lipid amino acid lipidX-16083 — -/- —X-16087 lipid -/- lipidX-16123 peptide peptide -/-X-16124 cofactors and vitamins cofactors and vitamins -/-X-16125 — — -/-X-16128 peptide peptide -/-X-16130 peptide peptide -/-X-16132 peptide peptide -/-X-16134 peptide peptide -/-X-16135 peptide peptide -/-X-16136 — — -/-X-16137 peptide peptide -/-X-16206 — — -/-X-16394 — — -/-X-16397 amino acid -/- amino acidX-16480 lipid lipid -/-X-16563 amino acid -/- lipidX-16564 xenobiotics xenobiotics -/-X-16567 amino acid -/- lipidX-16570 — -/- —X-16578 lipid lipid -/-X-16580 — -/- —X-16654 lipid lipid lipidX-16674 lipid lipid -/-X-16774 nucleotide -/- nucleotideX-16932 — — -/-X-16934 — — -/-X-16935 — — -/-X-16940 xenobiotics xenobiotics -/-X-16943 lipid lipid -/-X-16946 cofactors and vitamins cofactors and vitamins -/-X-16947 lipid lipid —X-17010 — -/- —X-17137 — — -/-X-17138 amino acid amino acid -/-X-17145 amino acid amino acid -/-X-17150 xenobiotics xenobiotics -/-X-17162 cofactors and vitamins cofactors and vitamins —X-17174 peptide peptide -/-X-17175 — — -/-X-17179 — — -/-X-17185 xenobiotics xenobiotics —

175
Table continued (p. 9 / 16)Metabolite SUMMIT/GCKD SUMMIT GCKDX-17189 peptide peptide -/-X-17254 lipid lipid -/-X-17269 lipid lipid -/-X-17299 lipid lipid —X-17301 — -/- —X-17304 — -/- —X-17314 xenobiotics xenobiotics -/-X-17323 amino acid -/- cofactors and vitaminsX-17324 lipid -/- lipidX-17325 peptide -/- peptideX-17327 — -/- —X-17328 — -/- —X-17335 — -/- —X-17336 — — -/-X-17337 lipid -/- lipidX-17339 — -/- —X-17340 lipid -/- lipidX-17342 xenobiotics -/- xenobioticsX-17343 — -/- —X-17346 — -/- —X-17349 — -/- —X-17350 — -/- —X-17351 amino acid -/- amino acidX-17353 — -/- —X-17354 amino acid -/- amino acidX-17357 — — —X-17358 — -/- —X-17359 — — —X-17361 — -/- —X-17365 amino acid -/- amino acidX-17367 xenobiotics -/- xenobioticsX-17370 — -/- —X-17371 — -/- —X-17393 xenobiotics -/- xenobioticsX-17398 — -/- —X-17438 lipid lipid —X-17441 peptide peptide -/-X-17443 lipid lipid -/-X-17502 carbohydrate carbohydrate -/-X-17612 cofactors and vitamins cofactors and vitamins -/-X-17654 — — -/-X-17673 xenobiotics -/- xenobioticsX-17674 xenobiotics -/- xenobioticsX-17675 — -/- —X-17677 xenobiotics -/- xenobiotics

176 B Supplements: Annotation of unknown metabolites
Table continued (p. 10 / 16)Metabolite SUMMIT/GCKD SUMMIT GCKDX-17682 — -/- —X-17685 xenobiotics amino acid xenobioticsX-17688 amino acid -/- amino acidX-17689 xenobiotics -/- xenobioticsX-17690 xenobiotics -/- xenobioticsX-17692 — -/- —X-17693 — -/- —X-17699 lipid -/- lipidX-17701 — -/- —X-17703 — — -/-X-17704 — -/- —X-17705 lipid -/- —X-17706 — — -/-X-17723 — -/- —X-17735 — -/- —X-17765 lipid -/- lipidX-17807 — -/- —X-18059 — -/- —X-18221 carbohydrate carbohydrate -/-X-18240 xenobiotics -/- xenobioticsX-18249 — — -/-X-18345 — -/- —X-18601 lipid lipid -/-X-18603 amino acid -/- amino acidX-18606 — -/- —X-18752 — — -/-X-18774 — — -/-X-18779 amino acid -/- amino acidX-18838 — -/- —X-18886 — -/- —X-18887 amino acid -/- amino acidX-18888 lipid -/- lipidX-18889 amino acid -/- amino acidX-18935 — -/- —X-18938 lipid -/- lipidX-19141 lipid -/- lipidX-19299 — -/- —X-19434 lipid -/- lipidX-19497 — -/- —X-19561 lipid -/- lipidX-19913 nucleotide -/- nucleotideX-19932 — -/- —X-20624 peptide -/- peptideX-21258 amino acid -/- amino acidX-21283 nucleotide -/- nucleotide

177
Table continued (p. 11 / 16)Metabolite SUMMIT/GCKD SUMMIT GCKDX-21295 — -/- —X-21410 lipid -/- lipidX-21448 — -/- —X-21467 lipid -/- lipidX-21470 lipid -/- lipidX-21474 — -/- —X-21659 — -/- —X-21668 lipid -/- lipidX-21736 — -/- —X-21737 xenobiotics -/- xenobioticsX-21785 amino acid -/- amino acidX-21788 lipid -/- amino acidX-21792 lipid -/- lipidX-21796 — -/- —X-21803 — -/- —X-21804 xenobiotics -/- xenobioticsX-21807 — -/- —X-21815 xenobiotics -/- xenobioticsX-21821 lipid -/- amino acidX-21825 — -/- —X-21826 — -/- —X-21827 lipid -/- lipidX-21828 — -/- —X-21829 lipid -/- lipidX-21830 — -/- —X-21831 lipid -/- lipidX-21834 amino acid -/- amino acidX-21835 — -/- —X-21839 — -/- —X-21840 — -/- —X-21841 — -/- —X-21842 amino acid -/- amino acidX-21844 — -/- —X-21845 — -/- —X-21846 lipid -/- —X-21849 — -/- —X-21850 — -/- —X-21851 lipid -/- lipidX-22035 — -/- —X-22102 — -/- —X-22143 cofactors and vitamins -/- cofactors and vitaminsX-22147 — -/- —X-22158 lipid -/- lipidX-22379 lipid -/- lipidX-22475 amino acid -/- amino acid

178 B Supplements: Annotation of unknown metabolites
Table continued (p. 12 / 16)Metabolite SUMMIT/GCKD SUMMIT GCKDX-22508 xenobiotics -/- xenobioticsX-22509 — -/- —X-22515 — -/- —X-22522 — -/- —X-22755 — -/- —X-22757 lipid -/- lipidX-22834 lipid -/- lipidX-22836 amino acid -/- amino acidX-23039 — -/- —X-23157 — -/- —X-23161 — -/- —X-23164 cofactors and vitamins -/- cofactors and vitaminsX-23193 — -/- —X-23196 lipid -/- lipidX-23291 xenobiotics -/- xenobioticsX-23299 — -/- —X-23304 xenobiotics -/- xenobioticsX-23306 xenobiotics -/- xenobioticsX-23308 — -/- —X-23311 — -/- —X-23314 carbohydrate -/- carbohydrateX-23329 — -/- —X-23331 — -/- —X-23369 — -/- —X-23423 amino acid -/- amino acidX-23429 xenobiotics -/- xenobioticsX-23438 — -/- —X-23445 — -/- —X-23461 — -/- —X-23512 — -/- —X-23518 amino acid -/- amino acidX-23581 amino acid -/- amino acidX-23583 amino acid -/- amino acidX-23584 carbohydrate -/- carbohydrateX-23590 amino acid -/- amino acidX-23593 peptide -/- peptideX-23641 — -/- —X-23644 xenobiotics -/- xenobioticsX-23645 amino acid -/- amino acidX-23647 amino acid -/- amino acidX-23648 amino acid -/- amino acidX-23649 xenobiotics -/- xenobioticsX-23650 — -/- —X-23652 — -/- —X-23653 amino acid -/- amino acid

179
Table continued (p. 13 / 16)Metabolite SUMMIT/GCKD SUMMIT GCKDX-23654 — -/- —X-23655 xenobiotics -/- xenobioticsX-23656 amino acid -/- amino acidX-23657 — -/- —X-23659 xenobiotics -/- xenobioticsX-23662 amino acid -/- amino acidX-23666 — -/- —X-23668 amino acid -/- amino acidX-23678 — -/- —X-23680 — -/- —X-23729 — -/- —X-23739 amino acid -/- amino acidX-23744 — -/- —X-23747 amino acid -/- amino acidX-23748 — -/- —X-23776 xenobiotics -/- xenobioticsX-23780 amino acid -/- amino acidX-23908 amino acid -/- amino acidX-23997 amino acid -/- amino acidX-24228 carbohydrate -/- carbohydrateX-24249 amino acid -/- amino acidX-24270 xenobiotics -/- xenobioticsX-24272 — -/- —X-24293 xenobiotics -/- xenobioticsX-24327 — -/- —X-24328 lipid -/- lipidX-24329 amino acid -/- amino acidX-24330 lipid -/- lipidX-24332 — -/- —X-24333 — -/- —X-24334 — -/- —X-24337 — -/- —X-24338 amino acid -/- amino acidX-24339 lipid -/- lipidX-24340 — -/- —X-24341 — -/- —X-24342 — -/- —X-24343 xenobiotics -/- xenobioticsX-24344 xenobiotics -/- xenobioticsX-24345 peptide -/- peptideX-24346 — -/- —X-24347 lipid -/- amino acidX-24348 lipid -/- —X-24349 lipid -/- lipidX-24350 peptide -/- peptide

180 B Supplements: Annotation of unknown metabolites
Table continued (p. 14 / 16)Metabolite SUMMIT/GCKD SUMMIT GCKDX-24352 — -/- —X-24353 amino acid -/- amino acidX-24354 — -/- —X-24357 lipid -/- lipidX-24358 lipid -/- lipidX-24359 cofactors and vitamins -/- cofactors and vitaminsX-24360 lipid -/- lipidX-24361 lipid -/- lipidX-24362 lipid -/- lipidX-24363 — -/- —X-24387 amino acid -/- amino acidX-24400 cofactors and vitamins -/- cofactors and vitaminsX-24402 amino acid -/- amino acidX-24403 — -/- —X-24406 — -/- —X-24408 nucleotide -/- nucleotideX-24410 amino acid -/- amino acidX-24411 amino acid -/- amino acidX-24412 xenobiotics -/- xenobioticsX-24414 xenobiotics -/- xenobioticsX-24415 — -/- —X-24416 cofactors and vitamins -/- cofactors and vitaminsX-24417 lipid -/- lipidX-24418 — -/- —X-24419 — -/- —X-24422 cofactors and vitamins -/- cofactors and vitaminsX-24431 cofactors and vitamins -/- cofactors and vitaminsX-24432 cofactors and vitamins -/- cofactors and vitaminsX-24452 amino acid -/- amino acidX-24455 amino acid -/- amino acidX-24456 — -/- —X-24460 energy -/- energyX-24462 carbohydrate -/- carbohydrateX-24465 amino acid -/- amino acidX-24466 amino acid -/- amino acidX-24468 amino acid -/- amino acidX-24473 xenobiotics -/- xenobioticsX-24475 xenobiotics -/- xenobioticsX-24490 amino acid -/- amino acidX-24494 lipid -/- lipidX-24497 — -/- —X-24498 xenobiotics -/- xenobioticsX-24512 amino acid -/- amino acidX-24513 amino acid -/- amino acidX-24514 amino acid -/- amino acid

181
Table continued (p. 15 / 16)Metabolite SUMMIT/GCKD SUMMIT GCKDX-24515 — -/- —X-24518 amino acid -/- amino acidX-24519 amino acid -/- amino acidX-24520 — -/- —X-24522 lipid -/- lipidX-24527 — -/- —X-24528 — -/- —X-24542 amino acid -/- amino acidX-24543 xenobiotics -/- xenobioticsX-24546 lipid -/- lipidX-24554 — -/- —X-24556 — -/- —X-24557 — -/- —X-24586 amino acid -/- amino acidX-24587 amino acid -/- amino acidX-24588 lipid -/- lipidX-24590 amino acid -/- amino acidX-24623 — -/- —X-24660 lipid -/- lipidX-24669 lipid -/- lipidX-24680 — -/- —X-24682 — -/- —X-24686 carbohydrate -/- carbohydrateX-24699 — -/- —X-24736 amino acid -/- amino acidX-24738 lipid -/- lipidX-24757 xenobiotics -/- xenobioticsX-24758 amino acid -/- amino acidX-24759 — -/- —X-24760 xenobiotics -/- xenobioticsX-24762 — -/- —X-24764 — -/- —X-24766 amino acid -/- amino acidX-24768 — -/- —X-24795 xenobiotics -/- xenobioticsX-24796 amino acid -/- amino acidX-24798 lipid -/- —X-24799 lipid -/- lipidX-24801 — -/- —X-24807 lipid -/- lipidX-24808 amino acid -/- amino acidX-24809 amino acid -/- amino acidX-24811 xenobiotics -/- xenobioticsX-24812 — -/- —X-24834 peptide -/- —

182 B Supplements: Annotation of unknown metabolites
Table continued (p. 16 / 16)Metabolite SUMMIT/GCKD SUMMIT GCKDX-24838 lipid -/- lipidX-24860 lipid -/- lipidX-24969 amino acid -/- amino acidX-24971 amino acid -/- amino acidX-24983 xenobiotics -/- xenobiotics
Table B.5: Predicted super pathways of unknown metabolites in SUMMIT/GCKD,SUMMIT, and GCKDSuper pathways were predicted with three different network models based on:SUMMIT/GCKD, SUMMIT, or GCKD. A subset of 59 unknown metabolites was mea-sured in SUMMIT as well as in GCKD by the established platform and by the new high-resolution platform of MetabolonTM, respectively. For 427 of 677 unknown metabolites,super pathways were predicted in at least two of three sets. ‘-/-’ and ‘—’ indicate that theunknown metabolite was not measured in the respective cohort, or that the unknown wasmeasured, but no super pathway was predicted, respectively. The table shows all unknownmetabolites measured in SUMMIT or GCKD, even if there is no super pathway prediction.

183
Metabolite SUMMIT/GCKD SUMMIT GCKDX-01911 tyrosine metabolism ascorbate and aldarate metabo-
lism—
X-02249 essential fatty acid, or fatty acid,dicarboxylate, or long chain fattyacid
essential fatty acid, or fatty acid,dicarboxylate, or long chain fattyacid
tryptophan metabolism
X-02269 fatty acid, dicarboxylate, or longchain fatty acid
fatty acid, dicarboxylate, or longchain fatty acid
-/-
X-02973 ascorbate and aldarate metabo-lism
ascorbate and aldarate metabo-lism
-/-
X-03088 urea cycle; arginine and prolinemetabolism
urea cycle; arginine-, proline-, me-tabolism
-/-
X-03094 sterol/steroid sterol/steroid -/-X-04357 fructose, mannose, galactose,
starch, and sucrose metabolismfructose, mannose, galactose,starch, and sucrose metabolism
-/-
X-04495 glutathione metabolism butanoate metabolism, or crea-tine metabolism, or cysteine, me-thionine, sam, taurine metabo-lism
-/-
X-05491 butanoate metabolism butanoate metabolism -/-X-06126 benzoate metabolism phenylalanine & tyrosine metabo-
lism-/-
X-06227 oxidative phosphorylation — -/-X-06246 alanine and aspartate metabolism alanine and aspartate metabolism -/-X-06267 urea cycle; arginine and proline
metabolismurea cycle; arginine-, proline-, me-tabolism
-/-
X-06307 dipeptide dipeptide -/-X-08402 sphingolipid metabolism, or ste-
rol/steroidsphingolipid, or sterol/steroid -/-
X-08988 leucine, isoleucine and valine me-tabolism
glycine, serine and threonine me-tabolism
-/-
X-09706 urea cycle; arginine and prolinemetabolism, or valine, leucine andisoleucine metabolism
urea cycle; arginine-, proline-, me-tabolism, or valine, leucine andisoleucine metabolism
-/-
X-09789 chemical — chemicalX-10419 sterol/steroid sterol/steroid -/-X-10500 sterol/steroid sterol/steroid -/-X-10506 alanine and aspartate metabolism alanine and aspartate metabolism -/-X-10510 sphingolipid metabolism, or ste-
rol/steroidsphingolipid, or sterol/steroid -/-
X-10810 purine metabolism,(hypo)xanthine/inosine con-taining
purine metabolism,(hypo)xanthine/inosine con-taining
-/-
X-11244 androgenic steroids sterol, steroid -/-X-11247 long chain fatty acid long chain fatty acid -/-X-11255 leucine, isoleucine and valine me-
tabolismvaline, leucine and isoleucine me-tabolism
-/-
X-11261 fatty acid metabolism(acyl carni-tine)
carnitine metabolism -/-
X-11315 glutamate metabolism glutamate metabolism -/-X-11317 lysolipid lysolipid -/-X-11319 long chain fatty acid long chain fatty acid -/-X-11327 fatty acid metabolism(acyl carni-
tine)carnitine metabolism -/-

184 B Supplements: Annotation of unknown metabolites
Table continued (p. 2 / 13)Metabolite SUMMIT/GCKD SUMMIT GCKDX-11333 amino fatty acid, or lysine meta-
bolism, or urea cycle; arginine andproline metabolism
amino fatty acid, or lysine meta-bolism, or urea cycle; arginine-,proline-, metabolism
-/-
X-11334 histidine metabolism, or lysinemetabolism
lysine metabolism histidine metabolism
X-11357 urea cycle; arginine and prolinemetabolism
-/- urea cycle; arginine and prolinemetabolism
X-11381 fatty acid metabolism (also bcaametabolism), or fatty acid meta-bolism(acyl carnitine)
carnitine metabolism -/-
X-11421 fatty acid metabolism(acyl carni-tine)
carnitine metabolism -/-
X-11422 purine metabolism,(hypo)xanthine/inosine con-taining
purine metabolism,(hypo)xanthine/inosine con-taining
-/-
X-11429 purine metabolism,(hypo)xanthine/inosine contai-ning, or pyrimidine metabolism,uracil containing
purine metabolism,(hypo)xanthine/inosine contai-ning, or pyrimidine metabolism,uracil containing
—
X-11438 fatty acid, dicarboxylate fatty acid, dicarboxylate, or longchain fatty acid
-/-
X-11440 androgenic steroids sterol, steroid androgenic steroidsX-11441 hemoglobin and porphyrin meta-
bolismhemoglobin and porphyrin meta-bolism
-/-
X-11442 hemoglobin and porphyrin meta-bolism
hemoglobin and porphyrin meta-bolism
-/-
X-11443 androgenic steroids sterol, steroid -/-X-11450 androgenic steroids sterol, steroid -/-X-11452 food component/plant food component/plant —X-11469 fatty acid metabolism (acyl glu-
tamine), or fatty acid, dicarboxy-late, or long chain fatty acid
sterol, steroid -/-
X-11470 progestin steroids sterol/steroid progestin steroidsX-11478 tryptophan metabolism phenylalanine & tyrosine metabo-
lism, or tryptophan metabolism-/-
X-11491 fatty acid, dicarboxylate, or lyso-lipid
fatty acid, dicarboxylate, or lyso-lipid
-/-
X-11508 fatty acid, monohydroxy fatty acid, monohydroxy -/-X-11521 essential fatty acid essential fatty acid -/-X-11522 hemoglobin and porphyrin meta-
bolismhemoglobin and porphyrin meta-bolism
-/-
X-11529 fatty acid, dicarboxylate, or lyso-lipid
fatty acid, dicarboxylate, or lyso-lipid
-/-
X-11530 hemoglobin and porphyrin meta-bolism
hemoglobin and porphyrin meta-bolism
-/-
X-11533 medium chain fatty acid medium chain fatty acid -/-X-11537 phospholipid metabolism glycerolipid metabolism -/-X-11538 fatty acid, dicarboxylate fatty acid, dicarboxylate -/-X-11540 fatty acid metabolism(acyl carni-
tine), or phospholipid metabolismglycerolipid metabolism fatty acid metabolism(acyl carni-
tine)X-11550 medium chain fatty acid medium chain fatty acid -/-X-11552 fatty acid, amide fatty acid, amide -/-X-11561 alanine and aspartate metabolism dipeptide -/-

185
Table continued (p. 3 / 13)Metabolite SUMMIT/GCKD SUMMIT GCKDX-11612 purine metabolism,
(hypo)xanthine/inosine con-taining
-/- purine metabolism,(hypo)xanthine/inosine con-taining
X-11787 urea cycle; arginine and prolinemetabolism
amino fatty acid, or urea cycle;arginine-, proline-, metabolism
guanidino and acetamido meta-bolism
X-11792 dipeptide dipeptide -/-X-11799 inositol metabolism inositol metabolism -/-X-11805 dipeptide dipeptide -/-X-11809 hemoglobin and porphyrin meta-
bolismhemoglobin and porphyrin meta-bolism
-/-
X-11818 amino fatty acid amino fatty acid -/-X-11820 carnitine metabolism, or ste-
rol/steroidcarnitine metabolism, or ste-rol/steroid
-/-
X-11837 acetylated peptides phenylalanine & tyrosine metabo-lism
-/-
X-11838 drug drug -/-X-11859 medium chain fatty acid medium chain fatty acid -/-X-11905 fatty acid, dicarboxylate fatty acid, dicarboxylate -/-X-12007 disaccharides and oligosacchari-
desfructose, mannose, galactose,starch, and sucrose metabolism
—
X-12015 pantothenate and coa metabolism -/- pantothenate and coa metabolismX-12026 histidine metabolism -/- histidine metabolismX-12027 food component/plant -/- food component/plantX-12038 polypeptide polypeptide -/-X-12039 food component/plant, or xan-
thine metabolismfood component/plant, or xan-thine metabolism
-/-
X-12040 food component/plant food component, plant -/-X-12051 lysolipid lysolipid -/-X-12056 fructose, mannose, galactose,
starch, and sucrose metabolismfructose, mannose, galactose,starch, and sucrose metabolism
-/-
X-12063 androgenic steroids sterol, steroid -/-X-12092 chemical — -/-X-12093 urea cycle; arginine and proline
metabolismamino fatty acid, or urea cycle;arginine-, proline-, metabolism
histidine metabolism, or urea cy-cle; arginine and proline metabo-lism
X-12094 nad metabolism nad metabolism -/-X-12096 alanine and aspartate metabo-
lism, or lysine metabolism, or ureacycle; arginine and proline meta-bolism
-/- alanine and aspartate metabo-lism, or lysine metabolism, or ureacycle; arginine and proline meta-bolism
X-12097 alanine and aspartate metabo-lism, or lysine metabolism, or ureacycle; arginine and proline meta-bolism
-/- alanine and aspartate metabo-lism, or lysine metabolism, or ureacycle; arginine and proline meta-bolism
X-12100 nicotinate and nicotinamide me-tabolism, or pterin metabolism
-/- nicotinate and nicotinamide me-tabolism, or pterin metabolism
X-12111 glutamate metabolism, or ureacycle; arginine and proline meta-bolism
-/- glutamate metabolism, or ureacycle; arginine and proline meta-bolism
X-12112 chemical -/- chemicalX-12115 glutamate metabolism, or leucine,
isoleucine and valine metabolism,or polyamine metabolism
-/- glutamate metabolism, or leucine,isoleucine and valine metabolism,or polyamine metabolism

186 B Supplements: Annotation of unknown metabolites
Table continued (p. 4 / 13)Metabolite SUMMIT/GCKD SUMMIT GCKDX-12116 food component/plant ascorbate and aldarate metabo-
lism-/-
X-12117 alanine and aspartate metabo-lism, or lysine metabolism, or ureacycle; arginine and proline meta-bolism
-/- alanine and aspartate metabo-lism, or lysine metabolism, or ureacycle; arginine and proline meta-bolism
X-12119 urea cycle; arginine and prolinemetabolism
-/- urea cycle; arginine and prolinemetabolism
X-12123 food component/plant -/- food component/plantX-12124 urea cycle; arginine and proline
metabolism-/- urea cycle; arginine and proline
metabolismX-12125 urea cycle; arginine and proline
metabolism-/- urea cycle; arginine and proline
metabolismX-12170 tryptophan metabolism -/- tryptophan metabolismX-12199 purine metabolism, guanine con-
taining-/- purine metabolism, guanine con-
tainingX-12206 ascorbate and aldarate metabo-
lismascorbate and aldarate metabo-lism
—
X-12212 food component/plant — food component/plantX-12216 acetylated peptides phenylalanine & tyrosine metabo-
lism—
X-12217 benzoate metabolism benzoate metabolism -/-X-12221 tyrosine metabolism -/- tyrosine metabolismX-12230 benzoate metabolism benzoate metabolism —X-12231 food component/plant food component/plant —X-12257 tyrosine metabolism -/- tyrosine metabolismX-12263 food component/plant -/- food component/plantX-12267 food component/plant -/- food component/plantX-12283 long chain fatty acid -/- tryptophan metabolismX-12329 food component/plant food component/plant —X-12379 urea cycle; arginine and proline
metabolism-/- urea cycle; arginine and proline
metabolismX-12398 drug -/- drugX-12405 tryptophan metabolism tryptophan metabolism -/-X-12407 food component/plant food component/plant —X-12410 xanthine metabolism -/- xanthine metabolismX-12450 essential fatty acid, or fatty acid,
monohydroxyessential fatty acid, or fatty acid,monohydroxy
-/-
X-12456 androgenic steroids sterol, steroid -/-X-12465 fatty acid metabolism(acyl carni-
tine), or ketone bodiescarnitine metabolism, or ketonebodies
-/-
X-12511 urea cycle; arginine and prolinemetabolism
amino fatty acid, or urea cycle;arginine-, proline-, metabolism
urea cycle; arginine and prolinemetabolism
X-12543 benzoate metabolism phenylalanine & tyrosine metabo-lism
benzoate metabolism
X-12544 androgenic steroids sterol/steroid -/-X-12556 glycine, serine and threonine me-
tabolismglycine, serine and threonine me-tabolism
-/-
X-12565 food component/plant -/- food component/plantX-12627 essential fatty acid, or long chain
fatty acidessential fatty acid, or long chainfatty acid
-/-

187
Table continued (p. 5 / 13)Metabolite SUMMIT/GCKD SUMMIT GCKDX-12636 fatty acid metabolism(acyl carni-
tine)-/- fatty acid metabolism (acyl gluta-
mine)X-12644 lysolipid lysolipid -/-X-12680 lysine metabolism -/- lysine metabolismX-12686 creatine metabolism -/- creatine metabolismX-12687 chemical -/- chemicalX-12688 polyamine metabolism -/- histidine metabolism, or polya-
mine metabolismX-12695 urea cycle; arginine and proline
metabolism-/- urea cycle; arginine and proline
metabolismX-12696 glycolysis, gluconeogenesis, and
pyruvate metabolismglycolysis, gluconeogenesis, pyru-vate metabolism
-/-
X-12704 benzoate metabolism phenylalanine & tyrosine metabo-lism
—
X-12707 tyrosine metabolism -/- tyrosine metabolismX-12708 tyrosine metabolism -/- tyrosine metabolismX-12713 tyrosine metabolism -/- tyrosine metabolismX-12714 chemical, or food compo-
nent/plant-/- chemical, or food compo-
nent/plantX-12718 chemical -/- chemicalX-12726 tyrosine metabolism -/- tyrosine metabolismX-12730 food component/plant food component/plant food component/plantX-12734 tyrosine metabolism phenylalanine & tyrosine metabo-
lism-/-
X-12738 benzoate metabolism -/- benzoate metabolismX-12745 tryptophan metabolism -/- tryptophan metabolismX-12749 chemical, or drug phenylalanine & tyrosine metabo-
lism-/-
X-12753 food component/plant -/- food component/plantX-12786 alanine and aspartate metabolism alanine and aspartate metabolism -/-X-12798 fatty acid metabolism(acyl carni-
tine)carnitine metabolism -/-
X-12802 leucine, isoleucine and valine me-tabolism
valine, leucine and isoleucine me-tabolism
-/-
X-12816 food component/plant food component/plant -/-X-12818 food component/plant -/- food component/plantX-12821 pentose metabolism -/- pentose metabolismX-12822 fatty acid metabolism (acyl gluta-
mine)— fatty acid metabolism (acyl gluta-
mine)X-12830 food component/plant food component/plant —X-12836 food component/plant -/- food component/plantX-12839 fatty acid, dicarboxylate, or long
chain fatty acid-/- —
X-12844 nad metabolism nad metabolism —X-12846 androgenic steroids — androgenic steroidsX-12847 food component/plant food component/plant food component/plantX-12850 androgenic steroids sterol, steroid -/-X-12860 fatty acid metabolism(acyl carni-
tine)— fatty acid metabolism (acyl gluta-
mine)X-12879 pantothenate and coa metabo-
lism, or vitamin b6 metabolism-/- pantothenate and coa metabo-
lism, or vitamin b6 metabolism

188 B Supplements: Annotation of unknown metabolites
Table continued (p. 6 / 13)Metabolite SUMMIT/GCKD SUMMIT GCKDX-13069 long chain fatty acid long chain fatty acid -/-X-13429 androgenic steroids sterol, steroid -/-X-13431 carnitine metabolism -/- —X-13435 fatty acid metabolism(acyl carni-
tine)carnitine metabolism -/-
X-13477 urea cycle; arginine and prolinemetabolism
amino fatty acid, or urea cycle;arginine-, proline-, metabolism
-/-
X-13553 tyrosine metabolism -/- tyrosine metabolismX-13619 urea cycle; arginine and proline
metabolismurea cycle; arginine-, proline-, me-tabolism
-/-
X-13684 phenylalanine metabolism -/- phenylalanine metabolism, or ty-rosine metabolism
X-13698 urea cycle; arginine and prolinemetabolism
-/- urea cycle; arginine and prolinemetabolism
X-13723 food component/plant -/- food component/plantX-13726 benzoate metabolism -/- benzoate metabolismX-13727 disaccharides and oligosacchari-
desfructose, mannose, galactose,starch, and sucrose metabolism
-/-
X-13728 xanthine metabolism xanthine metabolism xanthine metabolismX-13729 tryptophan metabolism, or urea
cycle; arginine and proline meta-bolism
-/- tryptophan metabolism, or ureacycle; arginine and proline meta-bolism
X-13834 fatty acid, dicarboxylate -/- fatty acid, dicarboxylateX-13835 histidine metabolism histidine metabolism histidine metabolismX-13844 histidine metabolism -/- histidine metabolismX-13848 fructose, mannose, galactose,
starch, and sucrose metabolism— -/-
X-13866 fatty acid metabolism (acyl gluta-mine)
long chain fatty acid fatty acid metabolism (acyl gluta-mine)
X-13874 fatty acid metabolism (acyl gluta-mine)
-/- fatty acid metabolism (acyl gluta-mine)
X-13879 fatty acid, dicarboxylate -/- fatty acid, dicarboxylateX-13891 fatty acid, dicarboxylate fatty acid, dicarboxylate -/-X-14056 methionine, cysteine, sam and
taurine metabolismhemoglobin and porphyrin meta-bolism
methionine, cysteine, sam andtaurine metabolism
X-14082 nicotinate and nicotinamide me-tabolism
-/- nicotinate and nicotinamide me-tabolism
X-14086 dipeptide dipeptide -/-X-14095 — — xanthine metabolismX-14099 glutamate metabolism -/- glutamate metabolismX-14192 dipeptide dipeptide -/-X-14196 leucine, isoleucine and valine me-
tabolism-/- leucine, isoleucine and valine me-
tabolismX-14272 dipeptide, or gamma-glutamyl
amino aciddipeptide, or gamma-glutamylamino acid
-/-
X-14302 tryptophan metabolism polypeptide —X-14314 glutathione metabolism — glutathione metabolismX-14352 leucine, isoleucine and valine me-
tabolism, or urea cycle; arginineand proline metabolism
urea cycle; arginine-, proline-, me-tabolism, or valine, leucine andisoleucine metabolism
-/-
X-14374 benzoate metabolism, or xanthinemetabolism
benzoate metabolism, or xanthinemetabolism
-/-

189
Table continued (p. 7 / 13)Metabolite SUMMIT/GCKD SUMMIT GCKDX-14473 dipeptide dipeptide -/-X-14588 lysine metabolism lysine metabolism -/-X-14625 glutamate metabolism, or gluta-
thione metabolismglutamate metabolism, or gluta-thione metabolism
-/-
X-14626 fatty acid, dicarboxylate, or se-condary bile acid metabolism
fatty acid, dicarboxylate, or lyso-lipid
secondary bile acid metabolism
X-14632 secondary bile acid metabolism,or sterol/steroid
bile acid metabolism, or ste-rol/steroid
-/-
X-14658 bile acid metabolism, or secon-dary bile acid metabolism
bile acid metabolism -/-
X-14662 secondary bile acid metabolism bile acid metabolism secondary bile acid metabolismX-14838 histidine metabolism -/- histidine metabolismX-14939 medium chain fatty acid medium chain fatty acid -/-X-15222 medium chain fatty acid medium chain fatty acid -/-X-15245 glycolysis, gluconeogenesis, and
pyruvate metabolismglycolysis, gluconeogenesis, pyru-vate metabolism
-/-
X-15461 lysine metabolism phenylalanine & tyrosine metabo-lism
lysine metabolism
X-15469 fatty acid metabolism(acyl carni-tine)
-/- fatty acid metabolism(acyl carni-tine)
X-15486 fatty acid metabolism(acyl gly-cine)
— fatty acid metabolism(acyl gly-cine)
X-15492 tca cycle sterol/steroid tca cycleX-15497 fatty acid metabolism (acyl gluta-
mine)drug fatty acid metabolism (acyl gluta-
mine)X-15503 tryptophan metabolism -/- tryptophan metabolismX-15646 fatty acid metabolism (acyl gluta-
mine), or secondary bile acid me-tabolism
-/- fatty acid metabolism (acyl gluta-mine), or secondary bile acid me-tabolism
X-15666 urea cycle; arginine and prolinemetabolism
-/- urea cycle; arginine and prolinemetabolism
X-15667 tryptophan metabolism tryptophan metabolism -/-X-15728 benzoate metabolism, or food
component/plantbenzoate metabolism food component/plant
X-16071 fatty acid metabolism (acyl gluta-mine)
tryptophan metabolism fatty acid metabolism (acyl gluta-mine)
X-16087 long chain fatty acid -/- long chain fatty acidX-16123 dipeptide dipeptide -/-X-16124 hemoglobin and porphyrin meta-
bolismhemoglobin and porphyrin meta-bolism
-/-
X-16128 dipeptide dipeptide -/-X-16130 dipeptide dipeptide -/-X-16132 dipeptide dipeptide -/-X-16134 fibrinogen cleavage peptide fibrinogen cleavage peptide -/-X-16135 fibrinogen cleavage peptide fibrinogen cleavage peptide -/-X-16137 polypeptide polypeptide -/-X-16397 lysine metabolism -/- lysine metabolismX-16480 essential fatty acid, or fatty acid,
dicarboxylateessential fatty acid, or fatty acid,dicarboxylate
-/-
X-16563 leucine, isoleucine and valine me-tabolism
-/- fatty acid metabolism (acyl gluta-mine)

190 B Supplements: Annotation of unknown metabolites
Table continued (p. 8 / 13)Metabolite SUMMIT/GCKD SUMMIT GCKDX-16564 benzoate metabolism benzoate metabolism -/-X-16567 leucine, isoleucine and valine me-
tabolism-/- fatty acid metabolism (acyl gluta-
mine)X-16578 medium chain fatty acid medium chain fatty acid -/-X-16654 secondary bile acid metabolism bile acid metabolism secondary bile acid metabolismX-16674 fatty acid, monohydroxy fatty acid, monohydroxy -/-X-16774 purine metabolism,
(hypo)xanthine/inosine con-taining
-/- purine metabolism,(hypo)xanthine/inosine con-taining
X-16940 benzoate metabolism benzoate metabolism -/-X-16943 medium chain fatty acid medium chain fatty acid -/-X-16946 hemoglobin and porphyrin meta-
bolismhemoglobin and porphyrin meta-bolism
-/-
X-16947 inositol metabolism inositol metabolism —X-17138 leucine, isoleucine and valine me-
tabolismvaline, leucine and isoleucine me-tabolism
-/-
X-17145 tryptophan metabolism tryptophan metabolism -/-X-17150 food component/plant food component/plant -/-X-17162 hemoglobin and porphyrin meta-
bolismhemoglobin and porphyrin meta-bolism
—
X-17174 dipeptide dipeptide -/-X-17185 benzoate metabolism benzoate metabolism —X-17189 dipeptide dipeptide -/-X-17254 lysolipid lysolipid -/-X-17269 medium chain fatty acid medium chain fatty acid -/-X-17299 carnitine metabolism carnitine metabolism —X-17314 benzoate metabolism benzoate metabolism -/-X-17323 leucine, isoleucine and valine me-
tabolism, or phenylalanine meta-bolism, or polyamine metabolism
-/- nicotinate and nicotinamide me-tabolism
X-17324 long chain fatty acid -/- long chain fatty acidX-17325 acetylated peptides -/- acetylated peptidesX-17337 carnitine metabolism -/- carnitine metabolismX-17340 progestin steroids -/- progestin steroidsX-17342 benzoate metabolism -/- benzoate metabolismX-17351 tryptophan metabolism -/- tryptophan metabolismX-17354 methionine, cysteine, sam and
taurine metabolism-/- methionine, cysteine, sam and
taurine metabolismX-17365 leucine, isoleucine and valine me-
tabolism, or methionine, cysteine,sam and taurine metabolism
-/- leucine, isoleucine and valine me-tabolism, or methionine, cysteine,sam and taurine metabolism
X-17367 benzoate metabolism -/- benzoate metabolismX-17393 chemical, or food compo-
nent/plant-/- chemical, or food compo-
nent/plantX-17438 fatty acid, dicarboxylate fatty acid, dicarboxylate —X-17441 fibrinogen cleavage peptide fibrinogen cleavage peptide -/-X-17443 fatty acid, monohydroxy fatty acid, monohydroxy -/-X-17502 glycolysis, gluconeogenesis, and
pyruvate metabolismglycolysis, gluconeogenesis, pyru-vate metabolism
-/-
X-17612 hemoglobin and porphyrin meta-bolism
hemoglobin and porphyrin meta-bolism
-/-

191
Table continued (p. 9 / 13)Metabolite SUMMIT/GCKD SUMMIT GCKDX-17673 chemical -/- chemicalX-17674 food component/plant -/- food component/plantX-17677 food component/plant -/- food component/plantX-17685 benzoate metabolism phenylalanine & tyrosine metabo-
lismbenzoate metabolism
X-17688 tryptophan metabolism -/- tryptophan metabolismX-17689 benzoate metabolism -/- benzoate metabolismX-17690 food component/plant -/- food component/plantX-17699 fatty acid metabolism(acyl gly-
cine)-/- fatty acid metabolism(acyl gly-
cine)X-17705 sterol/steroid -/- —X-17765 secondary bile acid metabolism -/- secondary bile acid metabolismX-18221 glycolysis, gluconeogenesis, and
pyruvate metabolismglycolysis, gluconeogenesis, pyru-vate metabolism
-/-
X-18240 food component/plant -/- food component/plantX-18601 androgenic steroids sterol, steroid -/-X-18603 glycine, serine and threonine me-
tabolism-/- glycine, serine and threonine me-
tabolismX-18779 tyrosine metabolism -/- tyrosine metabolismX-18887 lysine metabolism, or urea cycle;
arginine and proline metabolism-/- lysine metabolism, or urea cycle;
arginine and proline metabolismX-18888 fatty acid metabolism (acyl gluta-
mine)-/- fatty acid metabolism (acyl gluta-
mine)X-18889 tryptophan metabolism -/- tryptophan metabolismX-18938 fatty acid metabolism (acyl gluta-
mine)-/- fatty acid metabolism (acyl gluta-
mine)X-19141 androgenic steroids -/- androgenic steroidsX-19434 androgenic steroids -/- androgenic steroidsX-19561 fatty acid metabolism (acyl gluta-
mine)-/- fatty acid metabolism (acyl gluta-
mine)X-19913 pyrimidine metabolism, uracil
containing-/- pyrimidine metabolism, uracil
containingX-20624 acetylated peptides -/- acetylated peptidesX-21258 tyrosine metabolism -/- tyrosine metabolismX-21283 purine metabolism, adenine con-
taining-/- purine metabolism, adenine con-
tainingX-21410 androgenic steroids -/- androgenic steroidsX-21467 secondary bile acid metabolism -/- secondary bile acid metabolismX-21470 secondary bile acid metabolism -/- secondary bile acid metabolismX-21668 secondary bile acid metabolism -/- secondary bile acid metabolismX-21737 benzoate metabolism -/- benzoate metabolismX-21785 tyrosine metabolism -/- tyrosine metabolismX-21788 fatty acid synthesis -/- methionine, cysteine, sam and
taurine metabolismX-21792 long chain fatty acid -/- long chain fatty acidX-21804 benzoate metabolism -/- benzoate metabolismX-21815 benzoate metabolism -/- benzoate metabolismX-21821 long chain fatty acid -/- tryptophan metabolismX-21827 fatty acid, dicarboxylate, or long
chain fatty acid-/- long chain fatty acid

192 B Supplements: Annotation of unknown metabolites
Table continued (p. 10 / 13)Metabolite SUMMIT/GCKD SUMMIT GCKDX-21829 fatty acid metabolism (acyl gluta-
mine)-/- fatty acid metabolism (acyl gluta-
mine)X-21831 long chain fatty acid -/- long chain fatty acidX-21834 tyrosine metabolism -/- tyrosine metabolismX-21842 glutathione metabolism, or me-
thionine, cysteine, sam and tau-rine metabolism
-/- glutathione metabolism, or me-thionine, cysteine, sam and tau-rine metabolism
X-21846 carnitine metabolism -/- —X-21851 progestin steroids -/- progestin steroidsX-22143 pantothenate and coa metabolism -/- pantothenate and coa metabolismX-22158 fatty acid metabolism(acyl carni-
tine)-/- fatty acid metabolism(acyl carni-
tine)X-22379 androgenic steroids -/- androgenic steroidsX-22475 leucine, isoleucine and valine me-
tabolism-/- leucine, isoleucine and valine me-
tabolismX-22508 chemical -/- chemicalX-22757 fatty acid, monohydroxy -/- fatty acid, monohydroxyX-22834 pregnenolone steroids, or proges-
tin steroids-/- pregnenolone steroids, or proges-
tin steroidsX-22836 glutamate metabolism -/- glutamate metabolismX-23164 tocopherol metabolism -/- tocopherol metabolismX-23196 fatty acid metabolism (acyl gluta-
mine)-/- fatty acid metabolism (acyl gluta-
mine)X-23291 benzoate metabolism, or food
component/plant-/- benzoate metabolism, or food
component/plantX-23304 benzoate metabolism -/- benzoate metabolismX-23306 food component/plant -/- food component/plantX-23314 glycolysis, gluconeogenesis, and
pyruvate metabolism-/- glycolysis, gluconeogenesis, and
pyruvate metabolismX-23423 urea cycle; arginine and proline
metabolism-/- urea cycle; arginine and proline
metabolismX-23429 food component/plant -/- food component/plantX-23518 tyrosine metabolism -/- tyrosine metabolismX-23581 glutamate metabolism, or urea
cycle; arginine and proline meta-bolism
-/- glutamate metabolism, or ureacycle; arginine and proline meta-bolism
X-23583 glutamate metabolism -/- glutamate metabolismX-23584 glycolysis, gluconeogenesis, and
pyruvate metabolism-/- glycolysis, gluconeogenesis, and
pyruvate metabolismX-23590 urea cycle; arginine and proline
metabolism-/- urea cycle; arginine and proline
metabolismX-23593 gamma-glutamyl amino acid -/- gamma-glutamyl amino acidX-23644 benzoate metabolism -/- benzoate metabolismX-23645 leucine, isoleucine and valine me-
tabolism, or methionine, cysteine,sam and taurine metabolism
-/- leucine, isoleucine and valine me-tabolism, or methionine, cysteine,sam and taurine metabolism
X-23647 urea cycle; arginine and prolinemetabolism
-/- urea cycle; arginine and prolinemetabolism
X-23648 urea cycle; arginine and prolinemetabolism
-/- urea cycle; arginine and prolinemetabolism
X-23649 chemical, or food compo-nent/plant
-/- chemical, or food compo-nent/plant

193
Table continued (p. 11 / 13)Metabolite SUMMIT/GCKD SUMMIT GCKDX-23653 glutamate metabolism, or leucine,
isoleucine and valine metabolism,or polyamine metabolism
-/- glutamate metabolism, or leucine,isoleucine and valine metabolism,or polyamine metabolism
X-23655 chemical -/- chemicalX-23656 polyamine metabolism -/- histidine metabolismX-23659 chemical -/- chemicalX-23662 lysine metabolism -/- lysine metabolismX-23668 polyamine metabolism -/- histidine metabolismX-23739 lysine metabolism -/- lysine metabolismX-23747 polyamine metabolism -/- polyamine metabolismX-23776 chemical -/- chemicalX-23780 glutamate metabolism -/- glutamate metabolismX-23908 alanine and aspartate metabo-
lism, or glycine, serine and thre-onine metabolism
-/- alanine and aspartate metabo-lism, or glycine, serine and thre-onine metabolism
X-23997 tyrosine metabolism -/- tyrosine metabolismX-24228 disaccharides and oligosacchari-
des-/- disaccharides and oligosacchari-
desX-24249 tryptophan metabolism -/- tryptophan metabolismX-24270 benzoate metabolism -/- benzoate metabolismX-24293 food component/plant -/- food component/plantX-24328 fatty acid synthesis -/- fatty acid synthesisX-24329 tryptophan metabolism -/- tryptophan metabolismX-24330 long chain fatty acid -/- long chain fatty acidX-24338 tryptophan metabolism -/- tryptophan metabolismX-24339 fatty acid metabolism (acyl gluta-
mine)-/- fatty acid metabolism (acyl gluta-
mine)X-24343 food component/plant -/- food component/plantX-24344 benzoate metabolism -/- benzoate metabolismX-24345 acetylated peptides -/- acetylated peptidesX-24347 fatty acid metabolism (acyl gluta-
mine)-/- —
X-24348 sterol/steroid -/- —X-24349 corticosteroids -/- corticosteroidsX-24350 acetylated peptides -/- acetylated peptidesX-24353 glutamate metabolism, or leucine,
isoleucine and valine metabolism,or polyamine metabolism
-/- glutamate metabolism, or leucine,isoleucine and valine metabolism,or polyamine metabolism
X-24357 corticosteroids -/- corticosteroidsX-24358 long chain fatty acid -/- long chain fatty acidX-24359 tocopherol metabolism -/- tocopherol metabolismX-24360 long chain fatty acid -/- long chain fatty acidX-24361 androgenic steroids -/- androgenic steroidsX-24362 progestin steroids -/- progestin steroidsX-24387 alanine and aspartate metabo-
lism, or lysine metabolism, or ureacycle; arginine and proline meta-bolism
-/- alanine and aspartate metabo-lism, or lysine metabolism, or ureacycle; arginine and proline meta-bolism
X-24400 pterin metabolism, or tetrahydro-biopterin metabolism
-/- pterin metabolism, or tetrahydro-biopterin metabolism

194 B Supplements: Annotation of unknown metabolites
Table continued (p. 12 / 13)Metabolite SUMMIT/GCKD SUMMIT GCKDX-24402 leucine, isoleucine and valine me-
tabolism-/- leucine, isoleucine and valine me-
tabolismX-24408 pyrimidine metabolism, uracil
containing-/- pyrimidine metabolism, uracil
containingX-24410 glycine, serine and threonine me-
tabolism-/- glycine, serine and threonine me-
tabolismX-24411 glycine, serine and threonine me-
tabolism-/- glycine, serine and threonine me-
tabolismX-24412 benzoate metabolism -/- benzoate metabolismX-24414 chemical -/- chemicalX-24416 tocopherol metabolism -/- tocopherol metabolismX-24417 androgenic steroids -/- androgenic steroidsX-24422 nicotinate and nicotinamide me-
tabolism-/- nicotinate and nicotinamide me-
tabolismX-24431 ascorbate and aldarate metabo-
lism-/- ascorbate and aldarate metabo-
lismX-24432 ascorbate and aldarate metabo-
lism-/- ascorbate and aldarate metabo-
lismX-24452 histidine metabolism, or lysine
metabolism-/- histidine metabolism, or lysine
metabolismX-24455 tryptophan metabolism -/- tryptophan metabolismX-24460 tca cycle -/- tca cycleX-24462 pentose metabolism -/- pentose metabolismX-24465 glutamate metabolism -/- glutamate metabolismX-24466 methionine, cysteine, sam and
taurine metabolism-/- methionine, cysteine, sam and
taurine metabolismX-24468 leucine, isoleucine and valine me-
tabolism-/- leucine, isoleucine and valine me-
tabolismX-24473 food component/plant -/- food component/plantX-24475 food component/plant -/- food component/plantX-24490 phenylalanine metabolism, or ty-
rosine metabolism-/- phenylalanine metabolism, or ty-
rosine metabolismX-24494 androgenic steroids, or corticoste-
roids-/- androgenic steroids, or corticoste-
roidsX-24498 food component/plant -/- food component/plantX-24512 glutathione metabolism -/- glutathione metabolismX-24513 lysine metabolism -/- lysine metabolismX-24514 guanidino and acetamido meta-
bolism-/- guanidino and acetamido meta-
bolismX-24518 alanine and aspartate metabo-
lism, or lysine metabolism, or ureacycle; arginine and proline meta-bolism
-/- alanine and aspartate metabo-lism, or lysine metabolism, or ureacycle; arginine and proline meta-bolism
X-24519 urea cycle; arginine and prolinemetabolism
-/- urea cycle; arginine and prolinemetabolism
X-24522 carnitine metabolism, or fattyacid metabolism (also bcaa me-tabolism), or fatty acid synthesis
-/- carnitine metabolism, or fattyacid metabolism (also bcaa me-tabolism), or fatty acid synthesis
X-24542 tyrosine metabolism -/- tyrosine metabolismX-24543 benzoate metabolism -/- benzoate metabolismX-24546 secondary bile acid metabolism -/- secondary bile acid metabolismX-24586 alanine and aspartate metabolism -/- alanine and aspartate metabolism

195
Table continued (p. 13 / 13)Metabolite SUMMIT/GCKD SUMMIT GCKDX-24587 tyrosine metabolism -/- tyrosine metabolismX-24588 long chain fatty acid -/- long chain fatty acidX-24590 tyrosine metabolism -/- tyrosine metabolismX-24660 secondary bile acid metabolism -/- secondary bile acid metabolismX-24669 secondary bile acid metabolism -/- secondary bile acid metabolismX-24686 glycolysis, gluconeogenesis, and
pyruvate metabolism-/- glycolysis, gluconeogenesis, and
pyruvate metabolismX-24736 lysine metabolism, or urea cycle;
arginine and proline metabolism-/- lysine metabolism
X-24738 inositol metabolism -/- inositol metabolismX-24757 benzoate metabolism -/- benzoate metabolismX-24758 polyamine metabolism -/- polyamine metabolismX-24760 benzoate metabolism -/- benzoate metabolismX-24766 urea cycle; arginine and proline
metabolism-/- urea cycle; arginine and proline
metabolismX-24795 food component/plant -/- food component/plantX-24796 urea cycle; arginine and proline
metabolism-/- urea cycle; arginine and proline
metabolismX-24798 carnitine metabolism -/- —X-24799 long chain fatty acid -/- long chain fatty acidX-24807 phospholipid metabolism -/- phospholipid metabolismX-24808 urea cycle; arginine and proline
metabolism-/- urea cycle; arginine and proline
metabolismX-24809 urea cycle; arginine and proline
metabolism-/- urea cycle; arginine and proline
metabolismX-24811 chemical, or food compo-
nent/plant-/- chemical, or food compo-
nent/plantX-24834 fibrinogen cleavage peptide -/- —X-24838 fatty acid, dicarboxylate, or ke-
tone bodies-/- fatty acid, dicarboxylate, or ke-
tone bodiesX-24860 fatty acid metabolism(acyl carni-
tine)-/- fatty acid metabolism (acyl gluta-
mine)X-24969 glutathione metabolism, or tryp-
tophan metabolism-/- glutathione metabolism, or tryp-
tophan metabolismX-24971 leucine, isoleucine and valine me-
tabolism-/- leucine, isoleucine and valine me-
tabolismX-24983 chemical -/- chemical
Table B.6: Predicted sub pathways of unknown metabolites in SUMMIT/GCKD,SUMMIT, and GCKDSub pathways were predicted with three different network models based on:SUMMIT/GCKD, SUMMIT, or GCKD. For 435 of 677 unknown metabolites, sub pathwayswere predicted in at least one of the three sets. The remaining 242 unknown metabolites(with no sub pathway annotation) are not shown (cf. Table B.5). ‘-/-’ and ‘—’ indicate thatthe unknown metabolite was not measured in the respective cohort, or that the unknownwas measured, but no super pathway was predicted, respectively.

196 B Supplements: Annotation of unknown metabolites
Metabolite SUMMIT/GCKD SUMMIT GCKDX-11334 histidine metabolism, or lysine
metabolismlysine metabolism histidine metabolism
X-11787 urea cycle; arginine and prolinemetabolism
amino fatty acid, or urea cycle;arginine-, proline-, metabolism
guanidino and acetamido meta-bolism
X-12093 urea cycle; arginine and prolinemetabolism
amino fatty acid, or urea cycle;arginine-, proline-, metabolism
histidine metabolism, or urea cy-cle; arginine and proline metabo-lism
X-12511 urea cycle; arginine and prolinemetabolism
amino fatty acid, or urea cycle;arginine-, proline-, metabolism
urea cycle; arginine and prolinemetabolism
X-13835 histidine metabolism histidine metabolism histidine metabolismX-15461 lysine metabolism phenylalanine & tyrosine meta-
bolismlysine metabolism
X-14314 glutathione metabolism — glutathione metabolismX-14095 — — xanthine metabolismX-14056 methionine, cysteine, sam and
taurine metabolismhemoglobin and porphyrin meta-bolism
methionine, cysteine, sam andtaurine metabolism
X-01911 tyrosine metabolism ascorbate and aldarate metabo-lism
—
X-14302 tryptophan metabolism polypeptide —X-12007 disaccharides and oligosacchari-
desfructose, mannose, galactose,starch, and sucrose metabolism
—
X-12206 ascorbate and aldarate metabo-lism
ascorbate and aldarate metabo-lism
—
X-17162 hemoglobin and porphyrin meta-bolism
hemoglobin and porphyrin meta-bolism
—
X-15492 tca cycle sterol/steroid tca cycleX-11440 androgenic steroids sterol, steroid androgenic steroidsX-11470 progestin steroids sterol/steroid progestin steroidsX-11540 fatty acid metabolism(acyl car-
nitine), or phospholipid metabo-lism
glycerolipid metabolism fatty acid metabolism(acyl car-nitine)
X-13866 fatty acid metabolism (acyl glu-tamine)
long chain fatty acid fatty acid metabolism (acyl glu-tamine)
X-14626 fatty acid, dicarboxylate, or se-condary bile acid metabolism
fatty acid, dicarboxylate, or lys-olipid
secondary bile acid metabolism
X-14662 secondary bile acid metabolism bile acid metabolism secondary bile acid metabolismX-16654 secondary bile acid metabolism bile acid metabolism secondary bile acid metabolismX-16947 inositol metabolism inositol metabolism —X-17299 carnitine metabolism carnitine metabolism —X-17438 fatty acid, dicarboxylate fatty acid, dicarboxylate —X-12822 fatty acid metabolism (acyl glu-
tamine)— fatty acid metabolism (acyl glu-
tamine)X-12846 androgenic steroids — androgenic steroidsX-12860 fatty acid metabolism(acyl car-
nitine)— fatty acid metabolism (acyl glu-
tamine)X-15486 fatty acid metabolism(acyl gly-
cine)— fatty acid metabolism(acyl gly-
cine)X-02249 essential fatty acid, or fatty acid,
dicarboxylate, or long chain fattyacid
essential fatty acid, or fatty acid,dicarboxylate, or long chain fattyacid
tryptophan metabolism
X-16071 fatty acid metabolism (acyl glu-tamine)
tryptophan metabolism fatty acid metabolism (acyl glu-tamine)
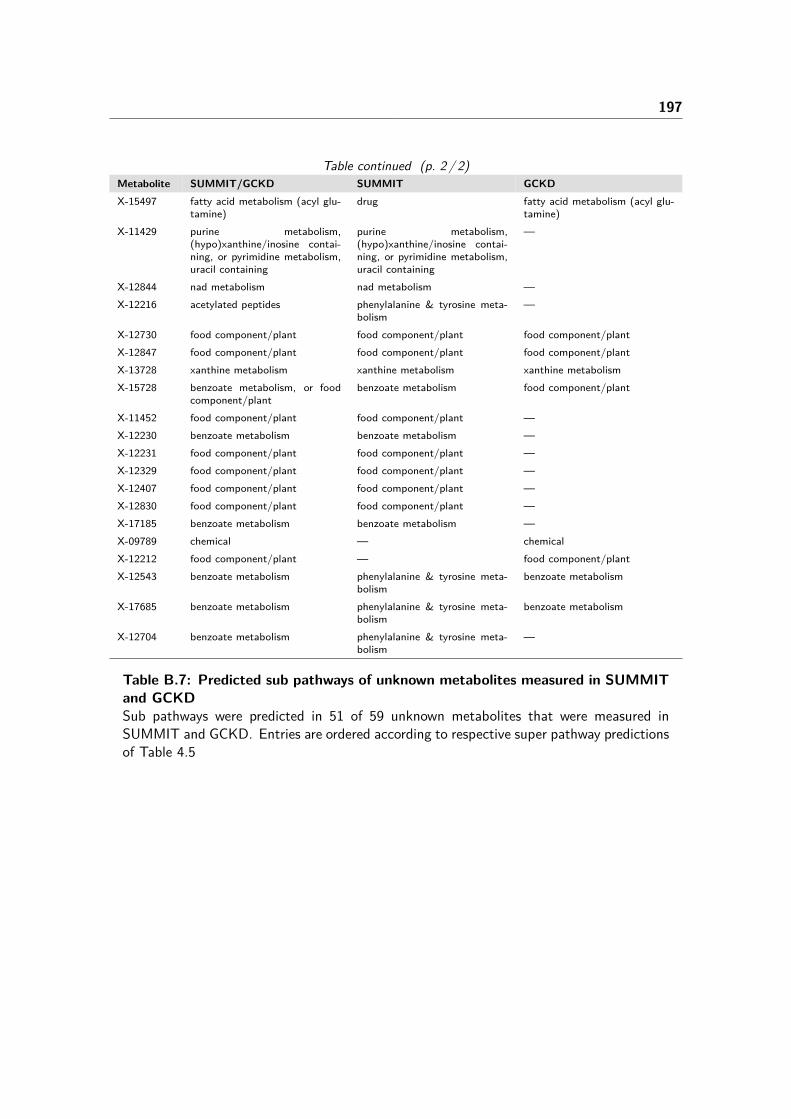
197
Table continued (p. 2 / 2)Metabolite SUMMIT/GCKD SUMMIT GCKDX-15497 fatty acid metabolism (acyl glu-
tamine)drug fatty acid metabolism (acyl glu-
tamine)X-11429 purine metabolism,
(hypo)xanthine/inosine contai-ning, or pyrimidine metabolism,uracil containing
purine metabolism,(hypo)xanthine/inosine contai-ning, or pyrimidine metabolism,uracil containing
—
X-12844 nad metabolism nad metabolism —X-12216 acetylated peptides phenylalanine & tyrosine meta-
bolism—
X-12730 food component/plant food component/plant food component/plantX-12847 food component/plant food component/plant food component/plantX-13728 xanthine metabolism xanthine metabolism xanthine metabolismX-15728 benzoate metabolism, or food
component/plantbenzoate metabolism food component/plant
X-11452 food component/plant food component/plant —X-12230 benzoate metabolism benzoate metabolism —X-12231 food component/plant food component/plant —X-12329 food component/plant food component/plant —X-12407 food component/plant food component/plant —X-12830 food component/plant food component/plant —X-17185 benzoate metabolism benzoate metabolism —X-09789 chemical — chemicalX-12212 food component/plant — food component/plantX-12543 benzoate metabolism phenylalanine & tyrosine meta-
bolismbenzoate metabolism
X-17685 benzoate metabolism phenylalanine & tyrosine meta-bolism
benzoate metabolism
X-12704 benzoate metabolism phenylalanine & tyrosine meta-bolism
—
Table B.7: Predicted sub pathways of unknown metabolites measured in SUMMITand GCKDSub pathways were predicted in 51 of 59 unknown metabolites that were measured inSUMMIT and GCKD. Entries are ordered according to respective super pathway predictionsof Table 4.5

198 B Supplements: Annotation of unknown metabolites
(a) GCKD (b) SUMMIT (c) GCKD/SUMMIT
Figure B.4: Neighbors of X-24834 in sets of GCKD and SUMMIT(a) X-24834 has been measured in the GCKD cohort and is only connected to two genes.(b) In the network model of SUMMIT these two genes are connected to several di- orpoly-peptides. (c) In consequence, X-24834 is neighbor of these metabolites in the networkmodel of the merged set SUMMIT/GCKD.
Manual selection of candidate molecules
Figure B.5: Neighboring metabolites of X-11905 and X-11538Predicted super and sub pathways and predicted reactions with neighboring metaboliteslead to the candidate molecule hexadecenedioic acid and octadecenedioic acid for X-11905and X-11583, respectively. Combined reactions, e.g. methylation + reduction, were addedmanually. Information in ‘<>’ was predicted.

199
Metabolite R Candidate or isomeric compound EvidenceX-11334 H (1-Ribosylimidazole)-4-acetate neighbor of Methylimidazoleacetic acid and pipeco-
late; no direct reaction, but close in pathwayX-11540 H trans-2-Dodecenoylcarnitine similar in maas, structure and RI of neighboring
metabolite octanoylcarnitineX-11787 H hydroxyleucine or hydrosyisoleucine close to amino acid PWX-12212 H isobar of X-21834
isobar of 4-vinylguaiacol sulfateX-12212 (m/z=229.0179) and X-21834(m/z=299.0184); similar m/z and small deltaRI
[4-(3-oxopropyl)phenyl]oxidanesulfonic acid[2-hydroxy-5-(prop-2-en-1-yl)phenyl]oxidanesulfonic acid4-[(1E)-3-hydroxyprop-1-en-1-yl]phenyloxidanesulfonic acid[4-(3-hydroxyprop-1-en-1-yl)phenyl]oxidanesulfonic acid
candidates have similar structure to neighbors;unknowns are not 4-vinylguaiacol sulfate,because it is measured and isobaric
X-12230 H Tyrosol 4-sulfate(5-ethyl-2-hydroxyphenyl)oxidanesulfonic acid
neighbor of 4-ethylpenylsulfate, second-level-neighbor of 4-vinylphenolsulfate
X-12511 H ValproylglycineCapryloylglycine
similar mass, structure of neighboring mea-sured metabolites (especially N-acetylleucine,N-acetylasparagine, N-alpha-acetylornithine, N-acetylarginine, N-acetylcitrulline, of for the fattyacid: 2-hydroxyoctanoate)
X-12543 H isobar of 3-(4-hydroxyphenyl)lactateDihydroxyphenyl-propanoic acidHydroxyphenyllactateDihydroxyhydrocinnamic acidhydroxy-(methoxyphenyl)acetic acidDimethoxybenzoic acidHomovanillic acid
direct neighbors; same mass; very small delta RI of30; cluster member of structurally similar molecules
X-12734 E isobar of 2-methoxyresorcinol sulfateisobar of 3-methoxycatechol sulfate (1)
same maas and similar RI; neighbors over anotherunknown metabolite
X-12749 E O-Phosphotyrosine neighbor of O-sulfo-L-tyrosine similar mass, butmeasured on different platform
X-12847 H Hint: neighbor of thymol sulfate, and very closem/z and RI
X-12860 H Hydroxyhexanoycarnitine neighbor of structurally similar 3-hydroxybutyrylcarnitine (2); similar mass andsmall delta RI
X-13431 H isobar of Nonanoylcarnitine2,6 Dimethylheptanoyl carnitine
neighbor of Nonanoylcarnitine through ACADL;same mass; unknown is not Nonanoylcarnitine, be-cause metabolite is annotated
X-13728 H 6-amino-5[N-methylformylamino]-1-methyluracil
surroundet by similar molecules, equal mass
X-13834 H nonenedioic acid/ nonenedioate neighbor of 4-octenedioate, delta RI=182X-15461 H 5-Acetamidovalerate (N-acetyl-cadaverine) similar structure of neighbors 2-piperidinone, 5-
aminovalerate, N-acetyl-cadaverine; small delta RI,same mass
X-15469 H isobar of heptanoylglutamine neighbors over another unknown; same mass: deltam=0.0008 and small delta RI=145

200 B Supplements: Annotation of unknown metabolites
Table continued (p. 2 / 2)Metabolite R Candidate or isomeric compound EvidenceX-15636 E isobar of eugenol sulfate same mass; small delta RIX-15728 H isobar of X-24343
(4-ethyl-2-methoxyphenyl)oxidanesulfonicacid
X-15728 (m/z=231.0334) and X-24343(m/z=231.0331); similar m/z and very smalldelta RI
X-16071 H 1H-Indole-3-carboxaldehyde in neighborhood of structurally similar metabolites;similar mass and RI
X-16124 H O-methoxycatechol-O-sulphate neighbor over another unknown molecule to euge-nol sulfate
X-16940 E Pyrogallol-1-O-sulphatePyrogallol-2-O-sulphate
neighbor over another unknown to structurally si-milar molecules
X-17162 H Hint: neighbor of L-urobilin; similar m/z and RIX-17185 H (5-ethenyl-2-hydroxyphenyl)oxidanesulfonic
acidneighbor of 4-vinylphenolsulfate; equal mass; verysmall delta RI
X-17337 H (9E)-10-nitrooctadecenoic acid(9E)-9-nitrooctadecenoic acid
similar mass, structure and RI of neighboring (overanother unknown) metabolite octanoylcarnitine
X-17342 H 2-[4-hydroxy-3-(sulfooxy)phenyl]acetic acid neighbor of structurally similar 4-hydroxymandelateX-17685 H (4-ethyl-2,6-dihydroxyphenyl)oxidanesulfonic
acidsourroundet by structurally similar molecules
X-21792 H Methylene suberic acid neighbor of structurally similar stearate, palmitate,arachidonate, and adrenate through a common as-sociated gene, ACOT2
X-21834 H cf. isobaric X-12212X-23423 H similar to 2-Aminoheptanedioic acid neighbor of N-delta-acetylornithine; delta mass of
1 and delta RI of 50X-23641 H isobar of L-Octanoylcarnitine connected over 4 other nodes to L-
Octanoylcarnitine; equal m/z; delta RI=40;similar metabolites in direct neighborhood
X-24343 H cf. isobaric X-15728X-24357 H urocortisone small delta RI and similar structure to neighboring
cortisolX-24983 H Ne,Ne dimethyllysine similar mass, structure and RI of neighboring
(over another unknown) metabolites (especially N-acetylornithine, 2-aminooctanoic acid, homocitrul-line, N-methylpipecolate, N6-carboxyethyllysine);dimethyl-lysine verified by MetabolonTM
Table B.8: Manually selected candidate molecules basted on HMDB compounds36 specific candidate molecules were selected for 33 unknown metabolites based on predictedsuper and sub pathways, predicted reactions, database searches of the absolute massesand structural similarity to neighboring (according to the network model) metabolites.The second column resolution (R) indicates if unknown metabolites were measured on theestablished (E) or on the new high-resolution (H) platform of MetabolonTM.

201
Automated selection of candidate molecules
V. Run Fingerp. Tanimoto MCS Tanimoto MCS Overlap Sensitivity Specificity Mol. True False1 1 0.686 0.647 0.908 0.866 0.607 48 47 841 2 0.686 0.659 0.904 0.868 0.617 45 41 761 3 0.742 0.670 0.905 0.851 0.656 43 40 681 4 0.749 0.677 0.862 0.876 0.636 34 33 681 5 0.693 0.681 0.910 0.866 0.639 40 33 921 6 0.736 0.656 0.900 0.850 0.650 42 40 771 7 0.680 0.645 0.904 0.859 0.612 44 43 851 8 0.686 0.657 0.908 0.869 0.620 47 44 1011 9 0.686 0.668 0.904 0.868 0.609 38 34 431 10 0.686 0.673 0.907 0.865 0.630 37 34 702 1 0.586 0.647 0.908 0.896 0.533 49 48 892 2 0.586 0.659 0.904 0.900 0.544 46 41 842 3 0.742 0.670 0.805 0.881 0.587 46 43 1122 4 0.649 0.677 0.862 0.893 0.590 34 34 782 5 0.543 0.681 0.910 0.912 0.524 40 36 1262 6 0.586 0.656 0.900 0.894 0.542 45 44 972 7 0.580 0.645 0.904 0.893 0.541 44 43 972 8 0.586 0.657 0.908 0.899 0.552 49 45 1212 9 0.586 0.668 0.904 0.897 0.538 40 35 512 10 0.586 0.673 0.907 0.899 0.562 38 35 89
Table B.9: Parameters determined during cross-validation of candidate selectionDuring each run of the 10-fold cross-validation cutoffs for parameters fingerprint Tanimoto,MCS Tanimoto and MCS Overlap were determined based on the maximum of sensitivityand specificity, while sensitivity was weighted twice for variant 1 and three-fold for variant 2,while specificity was weighted once. The last three columns describe the number of test-molecules and the number of true or false selected candidates.

202 B Supplements: Annotation of unknown metabolites
Unknown Candidate PubChem CID ∆Mass MFTC MSTC MSOCX-02249 Benzo[a]pyrene-4,5-oxide 37786 0.0351 0.64* 0.48 0.85
Benzo[a]pyrene-9,10-oxide 37456 0.0351 0.64* 0.47 0.77
X-11261 octenoyl carnitine 53481667 0.0068 0.61* 0.5 0.91*
X-11478 Perillic acid 1256 0.0073 0.61* 0.53 0.75
(4-hydroxy-3-methoxyphenyl)acetaldehyde 151276 0.0291 0.6* 0.53 0.73
X-11787 L-4-hydroxyglutamic semialdehyde 25201126 0.0436 0.62* 0.64 0.9*
X-12093 L-alanyl-L-leucine 6992388 0.0071 0.94* 0.86* 1*
X-12100 5-hydroxy-L-tryptophan 439280 0.0071 0.67* 0.33 0.58
X-12170 trans-caffeate 689043 0.0185 0.58* 0.65 0.85
3-Hydroxykynurenamine 440736 0.0291 0.84* 0.65 0.85
5-Hydroxykynurenamine 164719 0.0291 0.79* 0.56 0.77
adrenochrome o-semiquinone 10313383 0.0053 0.61* 0.5 0.69
X-12543 3-Methoxy-4-hydroxyphenylglycolaldehyde 440729 0.0069 0.77* 0.62 0.77
X-12688 L-alanyl-L-leucine 6992388 0.0073 0.69* 0.5 0.8

203
Evidenceneighbor of 16alpha-Hydroxyestrone (delta mass=18.0681, Structure: Tanimoto Coefficient=0.355, Overlap Coeffi-cient=0.524, Fingerprint: Tanimoto Coefficient=0.6); neighbor of 2-Hydroxyestradiol-17beta (delta mass=20.0837,Structure: Tanimoto Coefficient=0.312, Overlap Coefficient=0.476, Fingerprint: Tanimoto Coefficient=0.61); neighborof estradiol (delta mass=4.0888, Structure: Tanimoto Coefficient=0.367, Overlap Coefficient=0.55, Fingerprint: Ta-nimoto Coefficient=0.644); neighbor of estrone (delta mass=2.0732, Structure: Tanimoto Coefficient=0.367, OverlapCoefficient=0.55, Fingerprint: Tanimoto Coefficient=0.6)neighbor of 16alpha-Hydroxyestrone (delta mass=18.0681, Structure: Tanimoto Coefficient=0.355, Overlap Coeffi-cient=0.524, Fingerprint: Tanimoto Coefficient=0.599); neighbor of 2-Hydroxyestradiol-17beta (delta mass=20.0837,Structure: Tanimoto Coefficient=0.312, Overlap Coefficient=0.476, Fingerprint: Tanimoto Coefficient=0.609); neighborof estradiol (delta mass=4.0888, Structure: Tanimoto Coefficient=0.367, Overlap Coefficient=0.55, Fingerprint: Ta-nimoto Coefficient=0.644); neighbor of estrone (delta mass=2.0732, Structure: Tanimoto Coefficient=0.367, OverlapCoefficient=0.55, Fingerprint: Tanimoto Coefficient=0.599)neighbor of carnitine (delta mass=124.0888, Structure: Tanimoto Coefficient=0.476, Overlap Coefficient=0.909, Finger-print: Tanimoto Coefficient=0.474); neighbor of suberoylcarnitine (C8-DC) (delta mass=31.9971, Structure: TanimotoCoefficient=0.5, Overlap Coefficient=0.7, Fingerprint: Tanimoto Coefficient=0.605)neighbor of 3-phenylpropionate (hydrocinnamate) (delta mass=15.9994, Structure: Tanimoto Coefficient=0.438, Over-lap Coefficient=0.636, Fingerprint: Tanimoto Coefficient=0.607)neighbor of 3-phenylpropionate (hydrocinnamate) (delta mass=15.963, Structure: Tanimoto Coefficient=0.533, OverlapCoefficient=0.727, Fingerprint: Tanimoto Coefficient=0.6)neighbor of N-acetylglutamine (delta mass=41.0192, Structure: Tanimoto Coefficient=0.643, Overlap Coefficient=0.9,Fingerprint: Tanimoto Coefficient=0.616)neighbor of homocitrulline (delta mass=13.0131, Structure: Tanimoto Coefficient=0.421, Overlap Coefficient=0.615,Fingerprint: Tanimoto Coefficient=0.71); neighbor of N-acetylarginine (delta mass=13.9978, Structure: Tanimoto Coef-ficient=0.611, Overlap Coefficient=0.786, Fingerprint: Tanimoto Coefficient=0.736); neighbor of N-acetylasparagine(delta mass=28.0677, Structure: Tanimoto Coefficient=0.625, Overlap Coefficient=0.833, Fingerprint: Tanimoto Coef-ficient=0.739); neighbor of N-acetylcitrulline (delta mass=14.9818, Structure: Tanimoto Coefficient=0.611, OverlapCoefficient=0.786, Fingerprint: Tanimoto Coefficient=0.786); neighbor of N-acetylglutamine (delta mass=14.0593,Structure: Tanimoto Coefficient=0.688, Overlap Coefficient=0.846, Fingerprint: Tanimoto Coefficient=0.783); neigh-bor of N-acetylleucine (delta mass=29.0338, Structure: Tanimoto Coefficient=0.857, Overlap Coefficient=1, Finger-print: Tanimoto Coefficient=0.935); neighbor of N-acetylmethionine sulfoxide (delta mass=4.9321, Structure: Tani-moto Coefficient=0.588, Overlap Coefficient=0.769, Fingerprint: Tanimoto Coefficient=0.662); neighbor of N-alpha-acetylornithine (delta mass=28.0313, Structure: Tanimoto Coefficient=0.733, Overlap Coefficient=0.917, Fingerprint:Tanimoto Coefficient=0.831); neighbor of N-delta-acetylornithine (delta mass=28.0385, Structure: Tanimoto Coeffi-cient=0.444, Overlap Coefficient=0.667, Fingerprint: Tanimoto Coefficient=0.788); neighbor of N-methylpipecolate(delta mass=59.0298, Structure: Tanimoto Coefficient=0.6, Overlap Coefficient=0.9, Fingerprint: Tanimoto Coef-ficient=0.629); neighbor of N2-acetyllysine (delta mass=14.0229, Structure: Tanimoto Coefficient=0.688, OverlapCoefficient=0.846, Fingerprint: Tanimoto Coefficient=0.848)neighbor of quinolinate (delta mass=53.0629, Structure: Tanimoto Coefficient=0.333, Overlap Coefficient=0.583, Fin-gerprint: Tanimoto Coefficient=0.665)neighbor of xanthurenate (delta mass=24.9952, Structure: Tanimoto Coefficient=0.647, Overlap Coefficient=0.846,Fingerprint: Tanimoto Coefficient=0.584)neighbor of kynurenate (delta mass=8.9527, Structure: Tanimoto Coefficient=0.5, Overlap Coefficient=0.692, Fin-gerprint: Tanimoto Coefficient=0.682); neighbor of xanthurenate (delta mass=24.9476, Structure: Tanimoto Coeffi-cient=0.647, Overlap Coefficient=0.846, Fingerprint: Tanimoto Coefficient=0.841)neighbor of kynurenate (delta mass=8.9527, Structure: Tanimoto Coefficient=0.5, Overlap Coefficient=0.692, Fin-gerprint: Tanimoto Coefficient=0.693); neighbor of xanthurenate (delta mass=24.9476, Structure: Tanimoto Coeffi-cient=0.556, Overlap Coefficient=0.769, Fingerprint: Tanimoto Coefficient=0.794)neighbor of xanthurenate (delta mass=24.9714, Structure: Tanimoto Coefficient=0.474, Overlap Coefficient=0.692,Fingerprint: Tanimoto Coefficient=0.607)neighbor of 3-(3-hydroxyphenyl)propionate (delta mass=16.0022, Structure: Tanimoto Coefficient=0.562, Overlap Coef-ficient=0.75, Fingerprint: Tanimoto Coefficient=0.711); neighbor of 3-(4-hydroxyphenyl)lactate (delta mass=0, Struc-ture: Tanimoto Coefficient=0.625, Overlap Coefficient=0.769, Fingerprint: Tanimoto Coefficient=0.773)neighbor of 4-acetamidobutanoate (delta mass=57.0578, Structure: Tanimoto Coefficient=0.5, Overlap Coefficient=0.8,Fingerprint: Tanimoto Coefficient=0.688); neighbor of acisoga (delta mass=18.0178, Structure: Tanimoto Coeffi-cient=0.421, Overlap Coefficient=0.615, Fingerprint: Tanimoto Coefficient=0.588)

204 B Supplements: Annotation of unknown metabolites
Table continued (p. 2 / 5)Unknown Candidate PubChem CID ∆Mass MFTC MSTC MSOCX-12860 glutaryl carnitine 53481622 0.0432 0.87* 0.85* 1*
X-13684 3-mercaptolactate-cysteine disulfide 193536 0.0068 0.73* 0.5 1*
X-13866 N-Ribosylnicotinamide 439924 0.018 0.66* 0.3 0.58
X-15497 fructoseglycine 3081391 0.0081 0.61* 0.5 0.69
salsoline-1-carboxylate 320322 0.0071 0.61* 0.58 0.85
X-15503 dopachrome o-semiquinone 53481550 0.0309 0.62* 0.65 0.79
X-16071 6-amino-2-oxohexanoic acid 439954 0.0284 0.59* 0.56 0.9*
L-allysine 207 0.0284 0.63* 0.47 0.8
2-oxoglutaramate 48 0.008 0.6* 0.53 0.9*
X-16563 2-acetamido-5-oxopentanoate 192878 0.0295 0.83* 0.71* 1*
X-17323 16-hydroxypalmitate 7058075 0.0422 0.64* 0.32 0.58
X-18888 2-keto-3-deoxy-D-glycero-D-galactononic acid 22833524 0.0446 0.79* 0.57 0.8
X-21831 12-oxo-20-carboxy-leukotriene B4 53481457 0.021 0.7* 0.32 0.82

205
Table continued (p. 2 / 5)Evidenceneighbor of 3-hydroxybutyrylcarnitine (2) (delta mass=27.9876, Structure: Tanimoto Coefficient=0.8, Overlap Coeffi-cient=0.941, Fingerprint: Tanimoto Coefficient=0.867); neighbor of acetylcarnitine (C2) (delta mass=72.0211, Struc-ture: Tanimoto Coefficient=0.737, Overlap Coefficient=1, Fingerprint: Tanimoto Coefficient=0.831); neighbor of de-canoylcarnitine (C10) (delta mass=40.1041, Structure: Tanimoto Coefficient=0.708, Overlap Coefficient=0.895, Fin-gerprint: Tanimoto Coefficient=0.765); neighbor of hexanoylcarnitine (delta mass=15.9513, Structure: Tanimoto Coef-ficient=0.85, Overlap Coefficient=0.944, Fingerprint: Tanimoto Coefficient=0.839); neighbor of octanoylcarnitine (C8)(delta mass=12.0728, Structure: Tanimoto Coefficient=0.773, Overlap Coefficient=0.895, Fingerprint: Tanimoto Coef-ficient=0.788)neighbor of aspartate (delta mass=107.9704, Structure: Tanimoto Coefficient=0.353, Overlap Coefficient=0.667,Fingerprint: Tanimoto Coefficient=0.603); neighbor of cysteine (delta mass=119.9881, Structure: Tanimoto Coef-ficient=0.5, Overlap Coefficient=1, Fingerprint: Tanimoto Coefficient=0.731); neighbor of erythro-4-hydroxy-L-glutamate(1-) (delta mass=77.9598, Structure: Tanimoto Coefficient=0.316, Overlap Coefficient=0.545, Fingerprint:Tanimoto Coefficient=0.692)neighbor of indolelactate (delta mass=49.0237, Structure: Tanimoto Coefficient=0.269, Overlap Coefficient=0.467,Fingerprint: Tanimoto Coefficient=0.648); neighbor of Pyridoxal (delta mass=87.032, Structure: Tanimoto Coeffi-cient=0.304, Overlap Coefficient=0.583, Fingerprint: Tanimoto Coefficient=0.656)neighbor of heptanoylglutamine (delta mass=21.0658, Structure: Tanimoto Coefficient=0.478, Overlap Coeffi-cient=0.688, Fingerprint: Tanimoto Coefficient=0.593); neighbor of hexanoylglutamine (delta mass=7.0501, Structure:Tanimoto Coefficient=0.5, Overlap Coefficient=0.688, Fingerprint: Tanimoto Coefficient=0.607)neighbor of ferulic acid 4-sulfate (delta mass=36.9073, Structure: Tanimoto Coefficient=0.4, Overlap Coefficient=0.588,Fingerprint: Tanimoto Coefficient=0.609)neighbor of kynurenate (delta mass=5.0027, Structure: Tanimoto Coefficient=0.647, Overlap Coefficient=0.786, Fin-gerprint: Tanimoto Coefficient=0.621)neighbor of hexanoylglutamine (delta mass=99.0611, Structure: Tanimoto Coefficient=0.35, Overlap Coefficient=0.7,Fingerprint: Tanimoto Coefficient=0.586)neighbor of heptanoylglutamine (delta mass=113.0768, Structure: Tanimoto Coefficient=0.4, Overlap Coefficient=0.8,Fingerprint: Tanimoto Coefficient=0.616); neighbor of hexanoylglutamine (delta mass=99.0611, Structure: TanimotoCoefficient=0.421, Overlap Coefficient=0.8, Fingerprint: Tanimoto Coefficient=0.634)neighbor of heptanoylglutamine (delta mass=113.1132, Structure: Tanimoto Coefficient=0.474, Overlap Coeffi-cient=0.9, Fingerprint: Tanimoto Coefficient=0.583); neighbor of hexanoylglutamine (delta mass=99.0975, Structure:Tanimoto Coefficient=0.5, Overlap Coefficient=0.9, Fingerprint: Tanimoto Coefficient=0.6)neighbor of 2-methylbutyrylglycine (delta mass=13.9793, Structure: Tanimoto Coefficient=0.533, Overlap Coeffi-cient=0.727, Fingerprint: Tanimoto Coefficient=0.719); neighbor of 3-methylcrotonylglycine (delta mass=15.9876,Structure: Tanimoto Coefficient=0.533, Overlap Coefficient=0.727, Fingerprint: Tanimoto Coefficient=0.583); neighborof Ammonium (delta mass=156.0423, Structure: Tanimoto Coefficient=0.083, Overlap Coefficient=1, Fingerprint: Tani-moto Coefficient=0.066); neighbor of glutaroyl carnitine (delta mass=102.0754, Structure: Tanimoto Coefficient=0.348,Overlap Coefficient=0.667, Fingerprint: Tanimoto Coefficient=0.6); neighbor of glycine (delta mass=98.0368, Structure:Tanimoto Coefficient=0.417, Overlap Coefficient=1, Fingerprint: Tanimoto Coefficient=0.443); neighbor of heptanoyl-glutamine (delta mass=85.0819, Structure: Tanimoto Coefficient=0.667, Overlap Coefficient=1, Fingerprint: TanimotoCoefficient=0.803); neighbor of hexanoylglutamine (delta mass=71.0662, Structure: Tanimoto Coefficient=0.706, Over-lap Coefficient=1, Fingerprint: Tanimoto Coefficient=0.826); neighbor of hexanoylglycine (delta mass=0.0291, Struc-ture: Tanimoto Coefficient=0.5, Overlap Coefficient=0.667, Fingerprint: Tanimoto Coefficient=0.738); neighbor of iso-butyrylglycine (delta mass=27.9949, Structure: Tanimoto Coefficient=0.571, Overlap Coefficient=0.8, Fingerprint: Ta-nimoto Coefficient=0.698); neighbor of isovalerylglycine (delta mass=13.9793, Structure: Tanimoto Coefficient=0.533,Overlap Coefficient=0.727, Fingerprint: Tanimoto Coefficient=0.719); neighbor of N-acetylglycine (delta mass=56.0189,Structure: Tanimoto Coefficient=0.667, Overlap Coefficient=1, Fingerprint: Tanimoto Coefficient=0.656); neighbor ofpyroglutamine (delta mass=45.0029, Structure: Tanimoto Coefficient=0.615, Overlap Coefficient=0.889, Fingerprint:Tanimoto Coefficient=0.586); neighbor of tigloylglycine (delta mass=15.9876, Structure: Tanimoto Coefficient=0.533,Overlap Coefficient=0.727, Fingerprint: Tanimoto Coefficient=0.589)neighbor of suberoylcarnitine (C8-DC) (delta mass=45.9638, Structure: Tanimoto Coefficient=0.323, Overlap Coeffi-cient=0.526, Fingerprint: Tanimoto Coefficient=0.644)neighbor of 3-hydroxysebacate (delta mass=49.9713, Structure: Tanimoto Coefficient=0.571, Overlap Coefficient=0.8,Fingerprint: Tanimoto Coefficient=0.789)neighbor of 11,12-EET (delta mass=43.9534, Structure: Tanimoto Coefficient=0.256, Overlap Coefficient=0.435,Fingerprint: Tanimoto Coefficient=0.662); neighbor of 14,15-EET (delta mass=43.9534, Structure: Tanimoto Coef-ficient=0.225, Overlap Coefficient=0.391, Fingerprint: Tanimoto Coefficient=0.649); neighbor of 5,6-EET (deltamass=43.9534, Structure: Tanimoto Coefficient=0.225, Overlap Coefficient=0.391, Fingerprint: Tanimoto Coeffi-cient=0.697); neighbor of arachidonate (20:4n6) (delta mass=59.9484, Structure: Tanimoto Coefficient=0.231, OverlapCoefficient=0.409, Fingerprint: Tanimoto Coefficient=0.652)

206 B Supplements: Annotation of unknown metabolites
Table continued (p. 3 / 5)Unknown Candidate PubChem CID ∆Mass MFTC MSTC MSOCX-22158 hexanoyl carnitine 6426853 0.0068 1* 1* 1*
X-22379 5alpha-Dihydrotestosterone glucuronide 44263365 0.0063 0.96* 0.78* 0.88
androsterone 3-glucosiduronic acid 114833 0.0063 1* 1* 1*
X-22836 6-amino-2-oxohexanoic acid 439954 0.0073 0.59* 0.5 0.7
L-allysine 207 0.0073 0.64* 0.62 0.8
X-23196 5-L-Glutamyl-L-alanine 440103 0.0177 0.94* 0.6 0.8
gama-L-glutamyl-L-alanine 11183554 0.0177 0.94* 0.6 0.8
L-leucyl-L-serine 40489070 0.0187 0.73* 0.6 0.8
N-acetylserotonin 903 0.0025 0.79* 0.48 0.69
X-23423 2-Amino-3-oxoadipate 440714 0.0289 0.65* 0.56 0.75
X-23581 1-piperideine-6-carboxylate 45266761 0.0073 0.57 0.67* 0.89
X-23583 D-proline 8988 0.0074 0.61* 0.6 0.75
acetamidopropanal 5460495 0.0074 0.62* 0.45 0.62
X-23593 N-(omega)-Hydroxyarginine 440849 0.0043 0.61* 0.43 0.69
X-23647 Glycylproline 79101 0.0294 0.79* 0.75* 1*
L-Prolinylglycine 6426709 0.0294 0.74* 0.75* 1*
X-23747 N1,N8-diacetylspermidine 389613 0.0074 0.98* 0.71* 1*
X-23776 6-amino-2-oxohexanoic acid 439954 0.0435 0.61* 0.67* 0.8
L-allysine 207 0.0435 0.66* 0.67* 0.8
X-24330 Porphobilinogen 1021 0.0187 0.42 0.42 1*

207
Table continued (p. 3 / 5)Evidenceneighbor of hexanoylcarnitine (delta mass=0.0072, Structure: Tanimoto Coefficient=1, Overlap Coefficient=1, Finger-print: Tanimoto Coefficient=1)neighbor of epiandrosterone glucuronide (delta mass=0.0073, Structure: Tanimoto Coefficient=0.784, Overlap Coeffi-cient=0.879, Fingerprint: Tanimoto Coefficient=0.961); neighbor of etiocholanolone glucuronide (delta mass=0, Struc-ture: Tanimoto Coefficient=0.784, Overlap Coefficient=0.879, Fingerprint: Tanimoto Coefficient=0.961)neighbor of epiandrosterone glucuronide (delta mass=0.0073, Structure: Tanimoto Coefficient=1, Overlap Coeffi-cient=1, Fingerprint: Tanimoto Coefficient=1); neighbor of etiocholanolone glucuronide (delta mass=0, Structure:Tanimoto Coefficient=1, Overlap Coefficient=1, Fingerprint: Tanimoto Coefficient=1)neighbor of N-methylglutamate (delta mass=15.9876, Structure: Tanimoto Coefficient=0.5, Overlap Coefficient=0.7,Fingerprint: Tanimoto Coefficient=0.587)neighbor of N-methylglutamate (delta mass=15.9876, Structure: Tanimoto Coefficient=0.615, Overlap Coefficient=0.8,Fingerprint: Tanimoto Coefficient=0.641)neighbor of heptanoylglutamine (delta mass=40.0604, Structure: Tanimoto Coefficient=0.571, Overlap Coefficient=0.8,Fingerprint: Tanimoto Coefficient=0.912); neighbor of hexanoylglutamine (delta mass=26.0447, Structure: TanimotoCoefficient=0.6, Overlap Coefficient=0.8, Fingerprint: Tanimoto Coefficient=0.939)neighbor of heptanoylglutamine (delta mass=40.0604, Structure: Tanimoto Coefficient=0.571, Overlap Coefficient=0.8,Fingerprint: Tanimoto Coefficient=0.912); neighbor of hexanoylglutamine (delta mass=26.0447, Structure: TanimotoCoefficient=0.6, Overlap Coefficient=0.8, Fingerprint: Tanimoto Coefficient=0.939)neighbor of heptanoylglutamine (delta mass=40.024, Structure: Tanimoto Coefficient=0.571, Overlap Coefficient=0.8,Fingerprint: Tanimoto Coefficient=0.709); neighbor of hexanoylglutamine (delta mass=26.0083, Structure: TanimotoCoefficient=0.6, Overlap Coefficient=0.8, Fingerprint: Tanimoto Coefficient=0.727)neighbor of indolelactate (delta mass=13.0389, Structure: Tanimoto Coefficient=0.476, Overlap Coefficient=0.667,Fingerprint: Tanimoto Coefficient=0.789); neighbor of Pyridoxal (delta mass=51.0473, Structure: Tanimoto Coeffi-cient=0.333, Overlap Coefficient=0.583, Fingerprint: Tanimoto Coefficient=0.644)neighbor of homocitrulline (delta mass=14.0705, Structure: Tanimoto Coefficient=0.562, Overlap Coefficient=0.75,Fingerprint: Tanimoto Coefficient=0.647); neighbor of N-delta-acetylornithine (delta mass=0.9549, Structure: TanimotoCoefficient=0.5, Overlap Coefficient=0.667, Fingerprint: Tanimoto Coefficient=0.623)neighbor of N-methylglutamate (delta mass=33.9982, Structure: Tanimoto Coefficient=0.667, Overlap Coeffi-cient=0.889, Fingerprint: Tanimoto Coefficient=0.53)neighbor of N-methyl-GABA (delta mass=2.023, Structure: Tanimoto Coefficient=0.6, Overlap Coefficient=0.75, Fin-gerprint: Tanimoto Coefficient=0.614)neighbor of N-methyl-GABA (delta mass=2.023, Structure: Tanimoto Coefficient=0.455, Overlap Coefficient=0.625,Fingerprint: Tanimoto Coefficient=0.625)neighbor of gamma-glutamylisoleucine (delta mass=70.0379, Structure: Tanimoto Coefficient=0.409, Overlap Coef-ficient=0.692, Fingerprint: Tanimoto Coefficient=0.605); neighbor of gamma-glutamylvaline (delta mass=56.0223,Structure: Tanimoto Coefficient=0.429, Overlap Coefficient=0.692, Fingerprint: Tanimoto Coefficient=0.613)neighbor of pro-hydroxy-pro (delta mass=56.0335, Structure: Tanimoto Coefficient=0.75, Overlap Coefficient=1, Fin-gerprint: Tanimoto Coefficient=0.792)neighbor of pro-hydroxy-pro (delta mass=56.0335, Structure: Tanimoto Coefficient=0.75, Overlap Coefficient=1, Fin-gerprint: Tanimoto Coefficient=0.74)neighbor of acisoga (delta mass=45.0651, Structure: Tanimoto Coefficient=0.611, Overlap Coefficient=0.846, Finger-print: Tanimoto Coefficient=0.848); neighbor of N-acetylputrescine (delta mass=99.0684, Structure: Tanimoto Coef-ficient=0.562, Overlap Coefficient=1, Fingerprint: Tanimoto Coefficient=0.897); neighbor of N1,N12-diacetylspermine(delta mass=57.0578, Structure: Tanimoto Coefficient=0.714, Overlap Coefficient=0.938, Fingerprint: Tanimoto Coef-ficient=0.975)neighbor of N-methylpipecolate (delta mass=1.972, Structure: Tanimoto Coefficient=0.667, Overlap Coefficient=0.8,Fingerprint: Tanimoto Coefficient=0.607)neighbor of N-methylpipecolate (delta mass=1.972, Structure: Tanimoto Coefficient=0.667, Overlap Coefficient=0.8,Fingerprint: Tanimoto Coefficient=0.661)neighbor of propionate (delta mass=152.0586, Structure: Tanimoto Coefficient=0.312, Overlap Coefficient=1, Finger-print: Tanimoto Coefficient=0.137)
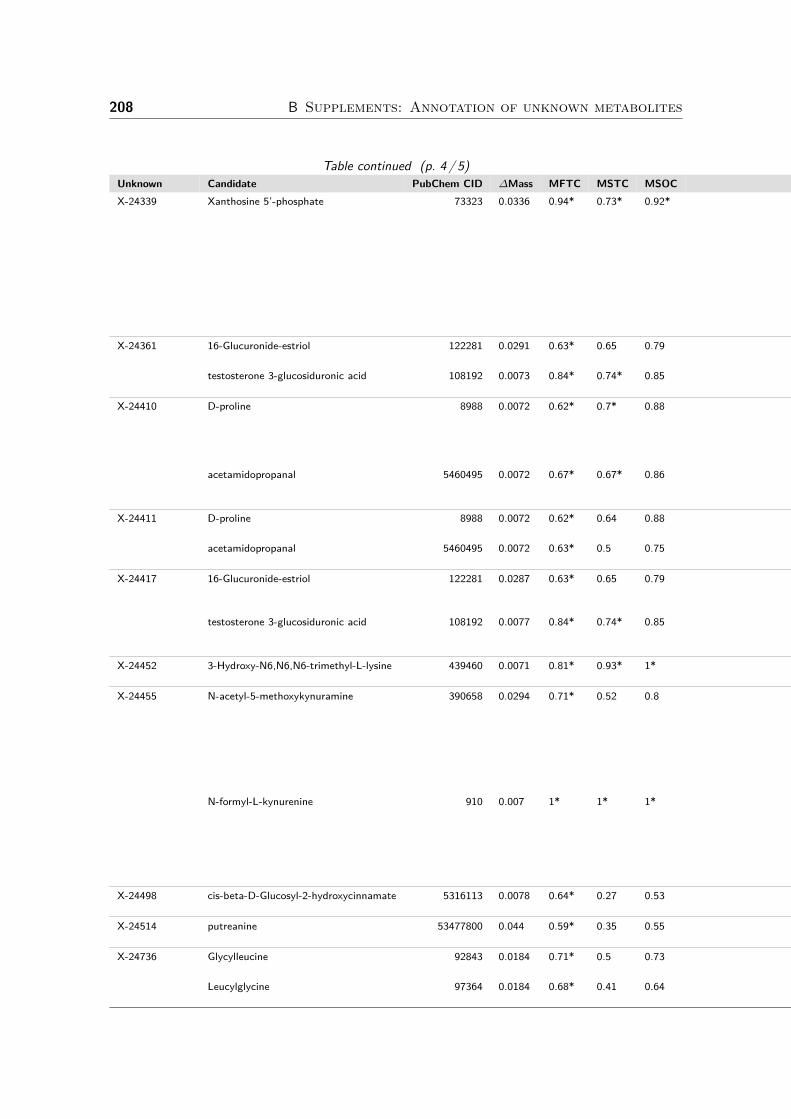
208 B Supplements: Annotation of unknown metabolites
Table continued (p. 4 / 5)Unknown Candidate PubChem CID ∆Mass MFTC MSTC MSOCX-24339 Xanthosine 5’-phosphate 73323 0.0336 0.94* 0.73* 0.92*
X-24361 16-Glucuronide-estriol 122281 0.0291 0.63* 0.65 0.79
testosterone 3-glucosiduronic acid 108192 0.0073 0.84* 0.74* 0.85
X-24410 D-proline 8988 0.0072 0.62* 0.7* 0.88
acetamidopropanal 5460495 0.0072 0.67* 0.67* 0.86
X-24411 D-proline 8988 0.0072 0.62* 0.64 0.88
acetamidopropanal 5460495 0.0072 0.63* 0.5 0.75
X-24417 16-Glucuronide-estriol 122281 0.0287 0.63* 0.65 0.79
testosterone 3-glucosiduronic acid 108192 0.0077 0.84* 0.74* 0.85
X-24452 3-Hydroxy-N6,N6,N6-trimethyl-L-lysine 439460 0.0071 0.81* 0.93* 1*
X-24455 N-acetyl-5-methoxykynuramine 390658 0.0294 0.71* 0.52 0.8
N-formyl-L-kynurenine 910 0.007 1* 1* 1*
X-24498 cis-beta-D-Glucosyl-2-hydroxycinnamate 5316113 0.0078 0.64* 0.27 0.53
X-24514 putreanine 53477800 0.044 0.59* 0.35 0.55
X-24736 Glycylleucine 92843 0.0184 0.71* 0.5 0.73
Leucylglycine 97364 0.0184 0.68* 0.41 0.64

209
Table continued (p. 4 / 5)Evidenceneighbor of 2,4-decadienoylcoa (delta mass=553.1777, Structure: Tanimoto Coefficient=0.258, Overlap Coeffi-cient=0.708, Fingerprint: Tanimoto Coefficient=0.698); neighbor of 3-decenoylcoa (delta mass=555.1933, Struc-ture: Tanimoto Coefficient=0.258, Overlap Coefficient=0.708, Fingerprint: Tanimoto Coefficient=0.7); neighbor ofdADP (delta mass=46.9925, Structure: Tanimoto Coefficient=0.667, Overlap Coefficient=0.833, Fingerprint: Tani-moto Coefficient=0.791); neighbor of dATP (delta mass=126.9588, Structure: Tanimoto Coefficient=0.588, Over-lap Coefficient=0.833, Fingerprint: Tanimoto Coefficient=0.787); neighbor of dGDP (delta mass=62.9874, Structure:Tanimoto Coefficient=0.7, Overlap Coefficient=0.875, Fingerprint: Tanimoto Coefficient=0.92); neighbor of dGTP(delta mass=142.9537, Structure: Tanimoto Coefficient=0.618, Overlap Coefficient=0.875, Fingerprint: TanimotoCoefficient=0.914); neighbor of GDP (delta mass=78.9823, Structure: Tanimoto Coefficient=0.733, Overlap Coeffi-cient=0.917, Fingerprint: Tanimoto Coefficient=0.94); neighbor of GTP (delta mass=158.9486, Structure: TanimotoCoefficient=0.647, Overlap Coefficient=0.917, Fingerprint: Tanimoto Coefficient=0.934)neighbor of etiocholanolone glucuronide (delta mass=2.052, Structure: Tanimoto Coefficient=0.65, Overlap Coeffi-cient=0.788, Fingerprint: Tanimoto Coefficient=0.632)neighbor of etiocholanolone glucuronide (delta mass=2.0157, Structure: Tanimoto Coefficient=0.737, Overlap Coeffi-cient=0.848, Fingerprint: Tanimoto Coefficient=0.836)neighbor of 2-piperidinone (delta mass=15.9876, Structure: Tanimoto Coefficient=0.667, Overlap Coefficient=0.857,Fingerprint: Tanimoto Coefficient=0.574); neighbor of glutarate (pentanedioate) (delta mass=16.9717, Structure: Tani-moto Coefficient=0.7, Overlap Coefficient=0.875, Fingerprint: Tanimoto Coefficient=0.414); neighbor of N-acetylserine(delta mass=31.9971, Structure: Tanimoto Coefficient=0.636, Overlap Coefficient=0.875, Fingerprint: Tanimoto Coef-ficient=0.621)neighbor of 2-piperidinone (delta mass=15.9876, Structure: Tanimoto Coefficient=0.667, Overlap Coefficient=0.857,Fingerprint: Tanimoto Coefficient=0.673); neighbor of N-acetylserine (delta mass=31.9971, Structure: Tanimoto Coef-ficient=0.5, Overlap Coefficient=0.75, Fingerprint: Tanimoto Coefficient=0.632)neighbor of N-acetylserine (delta mass=31.9971, Structure: Tanimoto Coefficient=0.636, Overlap Coefficient=0.875,Fingerprint: Tanimoto Coefficient=0.621)neighbor of N-acetylserine (delta mass=31.9971, Structure: Tanimoto Coefficient=0.5, Overlap Coefficient=0.75, Fin-gerprint: Tanimoto Coefficient=0.632)neighbor of epiandrosterone glucuronide (delta mass=2.0448, Structure: Tanimoto Coefficient=0.65, Overlap Coeffi-cient=0.788, Fingerprint: Tanimoto Coefficient=0.632); neighbor of etiocholanolone glucuronide (delta mass=2.052,Structure: Tanimoto Coefficient=0.65, Overlap Coefficient=0.788, Fingerprint: Tanimoto Coefficient=0.632)neighbor of epiandrosterone glucuronide (delta mass=2.0084, Structure: Tanimoto Coefficient=0.737, Overlap Coeffi-cient=0.848, Fingerprint: Tanimoto Coefficient=0.836); neighbor of etiocholanolone glucuronide (delta mass=2.0157,Structure: Tanimoto Coefficient=0.737, Overlap Coefficient=0.848, Fingerprint: Tanimoto Coefficient=0.836)neighbor of N6,N6,N6-trimethyllysine (delta mass=15.9949, Structure: Tanimoto Coefficient=0.929, Overlap Coeffi-cient=1, Fingerprint: Tanimoto Coefficient=0.806)neighbor of anthranilate (delta mass=99.0684, Structure: Tanimoto Coefficient=0.421, Overlap Coefficient=0.8, Fin-gerprint: Tanimoto Coefficient=0.673); neighbor of kynurenine (delta mass=28.0313, Structure: Tanimoto Coeffi-cient=0.524, Overlap Coefficient=0.733, Fingerprint: Tanimoto Coefficient=0.696); neighbor of N-formyl-L-kynurenine(delta mass=0.0364, Structure: Tanimoto Coefficient=0.478, Overlap Coefficient=0.647, Fingerprint: TanimotoCoefficient=0.713); neighbor of N-formylanthranilate (delta mass=71.0735, Structure: Tanimoto Coefficient=0.381,Overlap Coefficient=0.667, Fingerprint: Tanimoto Coefficient=0.714); neighbor of N-formylanthranilic acid (deltamass=71.0808, Structure: Tanimoto Coefficient=0.381, Overlap Coefficient=0.667, Fingerprint: Tanimoto Coeffi-cient=0.714)neighbor of anthranilate (delta mass=99.032, Structure: Tanimoto Coefficient=0.5, Overlap Coefficient=0.9, Fin-gerprint: Tanimoto Coefficient=0.745); neighbor of kynurenine (delta mass=27.9949, Structure: Tanimoto Coeffi-cient=0.882, Overlap Coefficient=1, Fingerprint: Tanimoto Coefficient=0.902); neighbor of N-formyl-L-kynurenine(delta mass=0, Structure: Tanimoto Coefficient=1, Overlap Coefficient=1, Fingerprint: Tanimoto Coefficient=1);neighbor of N-formylanthranilate (delta mass=71.0371, Structure: Tanimoto Coefficient=0.611, Overlap Coeffi-cient=0.917, Fingerprint: Tanimoto Coefficient=0.851); neighbor of N-formylanthranilic acid (delta mass=71.0444,Structure: Tanimoto Coefficient=0.611, Overlap Coefficient=0.917, Fingerprint: Tanimoto Coefficient=0.851)neighbor of 4-vinylguaiacol sulfate (delta mass=96.0826, Structure: Tanimoto Coefficient=0.267, Overlap Coeffi-cient=0.533, Fingerprint: Tanimoto Coefficient=0.64)neighbor of guanidinosuccinate (delta mass=14.9308, Structure: Tanimoto Coefficient=0.353, Overlap Coeffi-cient=0.545, Fingerprint: Tanimoto Coefficient=0.589)neighbor of homocitrulline (delta mass=1.0025, Structure: Tanimoto Coefficient=0.444, Overlap Coefficient=0.615,Fingerprint: Tanimoto Coefficient=0.71)neighbor of homocitrulline (delta mass=1.0025, Structure: Tanimoto Coefficient=0.368, Overlap Coefficient=0.538,Fingerprint: Tanimoto Coefficient=0.681)

210 B Supplements: Annotation of unknown metabolites
Table continued (p. 5 / 5)Unknown Candidate PubChem CID ∆Mass MFTC MSTC MSOCX-24766 L-3-Cyanoalanine 439742 0.0437 0.76* 0.7* 0.88
X-24798 4-hydroxy-2-nonenal 5283344 0.0074 0.23 0.15 0.91*
X-24860 Biotin 171548 0.0466 0.58* 0.41 0.75
X-24983 D-argininium(1+) 71070 0.032 0.6* 0.57 0.8
Table B.10: Evidences of automatically selected candidate molecules based onRecon67 candidate molecules have been automatically selected for 45 unknown metabolites basedon fingerprint or structural similarity to neighboring known metabolites within the Recondatabase. The last three columns contain the maximum values of the fingerprint Tanimotocoefficient (MFTC), structure Tanimoto coefficient (MSTC), or structure overlap coefficient(MSOC) across pairs of the candidate molecule and known neighbors of the unknownmetabolite. An asterisk indicates whether values are beyond the threshold.

211
Table continued (p. 5 / 5)Evidenceneighbor of N-alpha-acetylornithine (delta mass=60.0575, Structure: Tanimoto Coefficient=0.538, Overlap Coeffi-cient=0.875, Fingerprint: Tanimoto Coefficient=0.607); neighbor of Ornithine (delta mass=18.047, Structure: TanimotoCoefficient=0.7, Overlap Coefficient=0.875, Fingerprint: Tanimoto Coefficient=0.755)neighbor of trans-Hexadec-2-enoyl-CoA (delta mass=847.2142, Structure: Tanimoto Coefficient=0.152, Overlap Coef-ficient=0.909, Fingerprint: Tanimoto Coefficient=0.229)neighbor of heptanoylglutamine (delta mass=14.0625, Structure: Tanimoto Coefficient=0.36, Overlap Coeffi-cient=0.562, Fingerprint: Tanimoto Coefficient=0.581)neighbor of N-methylpipecolate (delta mass=31.0098, Structure: Tanimoto Coefficient=0.571, Overlap Coefficient=0.8,Fingerprint: Tanimoto Coefficient=0.6)

212 B Supplements: Annotation of unknown metabolites
Unknown Candidate Pool Database ID ∆Mass MSTC MSOC MFTCX-01911 Dihydroisomorphine-3-glucuronide H HMDB0060820 0.0067 0.36 1.00* 0.00
Dihydroisomorphine-6-glucuronide H HMDB0061137 0.0067 0.36 1.00* 0.00Dihydromorphine-3-glucuronide H HMDB0060821 0.0067 0.36 1.00* 0.00
X-02249 Benzo[a]pyrene-9,10-oxide R PCID 37456 0.0351 0.47 0.77 0.64*Benzo[a]pyrene-4,5-oxide R PCID 37786 0.0351 0.48 0.85 0.64*
X-11261 octenoyl carnitine R PCID 53481667 0.0068 0.50 0.91* 0.61*2-Octenoylcarnitine H HMDB0013324 0.0068 0.50 0.91* 0.12
X-11334 gamma-L-Glutamyl-L-pipecolic acid H HMDB0038614 0.0295 0.50 1.00* 0.00Imidazoleacetic acid riboside H HMDB0002331 0.0069 0.56 1.00* 0.00
X-11357 Gamma-Aminobutyryl-lysine H HMDB0001959 0.0294 0.81* 1.00* 0.13Glycyl-Arginine H HMDB0028835 0.0042 0.94* 1.00* 0.13Isovalerylglutamic acid H HMDB0000726 0.0182 0.71* 0.92* 0.13Valyl-Asparagine H HMDB0029122 0.0070 0.75* 1.00* 0.13
X-11438 2-Carboxy-4-dodecanolide H HMDB0030987 0.0077 0.82* 1.00* 0.003-Oxotetradecanoic acid H HMDB0010730 0.0441 0.94* 1.00* 0.006-Ketomyristic acid H HMDB0030982 0.0441 0.94* 1.00* 0.00
X-11444 Cortolone-3-glucuronide H HMDB0010320 0.0075 0.51 0.95* 0.00X-11470 Ganosporeric acid A H HMDB0033022 0.0139 0.48 0.90* 0.00X-11478 Perillic acid R PCID 1256 0.0073 0.53 0.75 0.61*
(4-hydroxy-3-methoxyphenyl)acetaldehyde
R PCID 151276 0.0291 0.53 0.73 0.60*
2-[3-(hydroxymethyl)oxiran-2-yl]phenol
H HMDB0134037 0.0291 0.77* 0.91* 0.18
2-hydroxy-3-(2-hydroxyphenyl)propanal
H HMDB0134034 0.0291 0.77* 0.91* 0.18
3-(2-Hydroxyphenyl)propanoic acid H HMDB0033752 0.0291 0.92* 1.00* 0.183-(2,3-dihydroxyphenyl)propanal H HMDB0134032 0.0291 0.77* 0.91* 0.183-(2,5-dihydroxyphenyl)propanal H HMDB0134033 0.0291 0.77* 0.91* 0.183-(4-methoxyphenyl)propan-1-ol H HMDB0135742 0.0073 0.77* 0.91* 0.183-Hydroxy-1-(4-hydroxyphenyl)-1-propanone
H HMDB0040645 0.0291 0.77* 0.91* 0.18
3-hydroxy-3-(2-hydroxyphenyl)propanal
H HMDB0134035 0.0291 0.77* 0.91* 0.18
3-hydroxy-3-phenylpropanoic acid H HMDB0124925 0.0291 0.92* 1.00* 0.184-[3-(hydroxymethyl)oxiran-2-yl]phenol
H HMDB0141766 0.0291 0.77* 0.91* 0.18
D-Phenyllactic acid H HMDB0000563 0.0291 0.92* 1.00* 0.18Desaminotyrosine H HMDB0002199 0.0291 0.92* 1.00* 0.18L-3-Phenyllactic acid H HMDB0000748 0.0291 0.92* 1.00* 0.18
X-11491 (3a,5b,7a)-23-Carboxy-7-hydroxy-24-norcholan-3-yl-b-D-Glucopyranosiduronic acid
H HMDB0002430 0.0059 0.68* 0.97* 0.00
Deoxycholic acid 3-glucuronide H HMDB0002596 0.0059 0.68* 0.97* 0.00X-11612 6-Thioinosinic acid H HMDB0060791 0.0106 0.86* 0.95* 0.00
arabinofuranosylguanine H HMDB0061067 0.0310 0.74* 0.85 0.00X-11787 L-4-hydroxyglutamic semialdehyde R PCID 25201126 0.0436 0.64 0.90* 0.62*
L-lysinium(1+) H HMDB0062809 0.0166 0.77* 1.00* 0.13N-Methyl-D-aspartic acid H HMDB0002393 0.0436 0.69* 0.90* 0.13
X-12026 6-Methyltetrahydropterin H HMDB0002249 0.0433 0.73* 0.85 0.10

213
Table continued (p. 2 / 20)Unknown Candidate Pool Database ID ∆Mass MSTC MSOC MFTCX-12026 8-Hydroxy-7-methylguanine H HMDB0006037 0.0069 0.73* 0.85 0.10X-12093 L-alanyl-L-leucine R PCID 6992388 0.0071 0.86* 1.00* 0.94*
Alanyl-Isoleucine H HMDB0028690 0.0071 0.73* 0.92* 0.20Alanyl-Leucine H HMDB0028691 0.0071 0.86* 1.00* 0.20
X-12096 Isovalerylalanine H HMDB0000747 0.0185 0.65 1.00* 0.13X-12097 Isovalerylalanine H HMDB0000747 0.0185 0.65 1.00* 0.13X-12100 5-hydroxy-L-tryptophan R PCID 439280 0.0071 0.33 0.58 0.67*X-12112 3-(1-Pyrrolidinyl)-2-butanone H HMDB0039840 0.0292 0.67* 0.80 0.08
Conhydrinone H HMDB0033364 0.0292 0.67* 0.80 0.08L-Hypoglycin A H HMDB0029427 0.0072 0.67* 0.80 0.08Physoperuvine H HMDB0030338 0.0292 0.67* 0.80 0.08
X-12115 Hydroxyprolyl-Glutamine H HMDB0028861 0.0320 0.70* 0.89 0.00Isoleucyl-Glutamate H HMDB0028906 0.0194 0.70* 0.89 0.00Leucyl-Glutamate H HMDB0028928 0.0194 0.70* 0.89 0.00
X-12117 Alanyl-Asparagine H HMDB0028682 0.0434 0.50 1.00* 0.13Asparaginyl-Alanine H HMDB0028724 0.0434 0.58 1.00* 0.13Glycyl-Gamma-glutamate H HMDB0028855 0.0434 0.57 1.00* 0.13Glycyl-Glutamine H HMDB0028839 0.0434 0.57 1.00* 0.13Glycyl-Lysine H HMDB0028846 0.0070 0.47 1.00* 0.13N-lactoyl-Leucine H HMDB0062176 0.0182 0.50 1.00* 0.13
X-12125 Hydroxyprolyl-Isoleucine H HMDB0028866 0.0182 0.61 0.92* 0.13Hydroxyprolyl-Leucine H HMDB0028867 0.0182 0.71* 1.00* 0.13Isoleucyl-Isoleucine H HMDB0028910 0.0182 0.61 0.92* 0.13Isoleucyl-Leucine H HMDB0028911 0.0182 0.71* 1.00* 0.13Leucyl-Isoleucine H HMDB0028932 0.0182 0.61 0.92* 0.13Leucyl-Leucine H HMDB0028933 0.0182 0.71* 1.00* 0.13
X-12170 adrenochrome o-semiquinone R PCID 10313383 0.0053 0.50 0.69 0.61*5-Hydroxykynurenamine R PCID 164719 0.0291 0.56 0.77 0.79*3-Hydroxykynurenamine R PCID 440736 0.0291 0.65 0.85 0.84*trans-caffeate R PCID 689043 0.0185 0.65 0.85 0.58*Isonicotinylglycine H HMDB0041912 0.0073 0.85* 1.00* 0.00
X-12212 (4-ethenyl-2-methoxyphenyl)oxidanesulfonic acid
H HMDB0127980 0.0070 0.82* 0.93* 0.07
[3-(3-oxopropyl)phenyl]oxidanesulfonicacid
H HMDB0135299 0.0070 0.71* 0.86 0.07
[4-(3-hydroxyprop-1-en-1-yl)phenyl]oxidanesulfonic acid
H HMDB0135656 0.0070 0.71* 0.86 0.07
[4-(3-oxopropyl)phenyl]oxidanesulfonicacid
H HMDB0135301 0.0070 0.81* 0.93* 0.07
3-[(1E)-3-hydroxyprop-1-en-1-yl]phenyloxidanesulfonic acid
H HMDB0135303 0.0070 0.71* 0.86 0.07
4-[(1E)-3-hydroxyprop-1-en-1-yl]phenyloxidanesulfonic acid
H HMDB0135306 0.0070 0.71* 0.86 0.07
X-12230 (5-ethyl-2-hydroxyphenyl)oxidanesulfonic acid
H HMDB0124986 0.0072 0.69* 0.85 0.05
3-hydroxybenzoic acid-3-O-sulphate H HMDB0059968 0.0292 0.69* 0.85 0.054-hydroxybenzoic acid-4-O-sulphate H HMDB0059982 0.0292 0.80* 0.92* 0.05Tyrosol 4-sulfate H HMDB0041785 0.0072 0.93* 1.00* 0.05

214 B Supplements: Annotation of unknown metabolites
Table continued (p. 3 / 20)Unknown Candidate Pool Database ID ∆Mass MSTC MSOC MFTCX-12257 [4-(4-methyl-3-oxopent-1-en-1-
yl)phenyl]oxidanesulfonic acidH HMDB0132951 0.0106 0.61 1.00* 0.00
5,6-dihydroxy-2-[(4-hydroxyphenyl)methylidene]-2,3-dihydro-1-benzofuran-3-one
H HMDB0137513 0.0140 0.40 1.00* 0.00
5,6,7-trihydroxy-2-phenyl-4H-chromen-4-one
H HMDB0134890 0.0140 0.40 1.00* 0.00
5,6,7-trihydroxy-3-phenyl-4H-chromen-4-one
H HMDB0129963 0.0140 0.40 1.00* 0.00
5,7,8-trihydroxy-2-phenyl-4H-chromen-4-one
H HMDB0130170 0.0140 0.40 1.00* 0.00
6-Hydroxydaidzein H HMDB0031715 0.0140 0.40 1.00* 0.006,7-dihydroxy-2-(3-hydroxyphenyl)-4H-chromen-4-one
H HMDB0133316 0.0140 0.40 1.00* 0.00
6,7-dihydroxy-3-(3-hydroxyphenyl)-4H-chromen-4-one
H HMDB0133990 0.0140 0.40 1.00* 0.00
6,7,8-trihydroxy-3-phenyl-4H-chromen-4-one
H HMDB0132880 0.0140 0.40 1.00* 0.00
7-hydroxy-6-methoxy-3-phenyl-3,4-dihydro-2H-1-benzopyran-4-one
H HMDB0132860 0.0224 0.40 1.00* 0.00
Rhababerone H HMDB0034409 0.0140 0.40 1.00* 0.00X-12263 [4-(3-hydroxybutyl)-2-
methoxyphenyl]oxidanesulfonic acidH HMDB0135717 0.0434 0.68* 0.93* 0.12
[4-(4-hydroxy-3-methoxyphenyl)butan-2-yl]oxysulfonic acid
H HMDB0135718 0.0434 0.68* 0.93* 0.12
3-[4-hydroxy-3-(sulfooxy)phenyl]-2-oxopropanoic acid
H HMDB0125450 0.0294 0.68* 0.93* 0.12
3-[4-methoxy-3-(sulfooxy)phenyl]propanoic acid
H HMDB0131144 0.0070 0.68* 0.93* 0.12
Dihydroferulic acid 4-sulfate H HMDB0041724 0.0070 0.78* 1.00* 0.12X-12379 Aspartyl-Tyrosine H HMDB0028765 0.0303 0.50 0.92* 0.13
Methionyl-Phenylalanine H HMDB0028980 0.0116 0.52 0.92* 0.13Phenylalanyl-Methionine H HMDB0029001 0.0116 0.57 0.92* 0.13Tyrosyl-Aspartate H HMDB0029101 0.0303 0.50 0.92* 0.13
X-12511 2-Hydroxyundecanoate H HMDB0059736 0.0196 0.79* 1.00* 0.13N-Acetylaminooctanoic acid H HMDB0059745 0.0070 0.67* 0.91* 0.13
X-12543 3-Methoxy-4-hydroxyphenylglycolaldehyde
R PCID 440729 0.0069 0.62 0.77 0.77*
(+/-)-2-Hydroxy-3-(2-hydroxyphenyl)propanoic acid
H HMDB0033624 0.0069 0.86* 0.92* 0.00
(+/-)-threo-Anethole glycol H HMDB0032607 0.0433 0.73* 0.85 0.002-hydroxy-2-(3-methoxyphenyl)aceticacid
H HMDB0133494 0.0069 0.73* 0.85 0.00
2-hydroxy-3-(3-hydroxyphenyl)propanoic acid
H HMDB0140892 0.0069 0.86* 0.92* 0.00
3-(2,3-dihydroxyphenyl)propanoic acid H HMDB0134042 0.0069 0.79* 0.92* 0.003-(2,4-dihydroxyphenyl)propanoic acid H HMDB0126386 0.0069 0.86* 0.92* 0.003-(2,5-dihydroxyphenyl)propanoic acid H HMDB0134043 0.0069 0.79* 0.92* 0.003-(3-Hydroxyphenyl)-3-hydroxypropanoic acid
H HMDB0002643 0.0069 0.79* 0.92* 0.00
3-(3,5-dihydroxyphenyl)propanoic acid H HMDB0125533 0.0069 0.92* 1.00* 0.00

215
Table continued (p. 4 / 20)Unknown Candidate Pool Database ID ∆Mass MSTC MSOC MFTCX-12543 3-hydroxy-3-(4-
hydroxyphenyl)propanoic acidH HMDB0124923 0.0069 0.86* 0.92* 0.00
3-Hydroxyphenyllactate H HMDB0029232 0.0069 0.86* 0.92* 0.003,4-Dihydroxyhydrocinnamic acid H HMDB0000423 0.0069 0.92* 1.00* 0.00Verimol J H HMDB0036522 0.0433 0.73* 0.85 0.00
X-12636 (2S,2’S)-Pyrosaccharopine H HMDB0038676 0.0295 0.59 0.92* 0.22gamma-L-Glutamyl-L-pipecolic acid H HMDB0038614 0.0295 0.67* 0.92* 0.22
X-12688 L-alanyl-L-leucine R PCID 6992388 0.0073 0.50 0.80 0.69*X-12707 3,4-Dihydroxyphenylglycol O-sulfate H HMDB0001474 0.0070 0.67* 0.92* 0.00X-12713 3-Methoxy-4-
hydroxyphenylethyleneglycol sulfateH HMDB0000559 0.0070 0.72* 0.93* 0.00
3-Methoxy-4-Hydroxyphenylglycol sul-fate
H HMDB0003332 0.0070 0.72* 0.93* 0.00
X-12818 3-hydroxy-5-methoxy-4-(sulfooxy)benzoic acid
H HMDB0128025 0.0292 0.65 1.00* 0.00
Methylgallic acid-O-sulphate H HMDB0060005 0.0292 0.65 1.00* 0.00X-12821 6-[2-(2H-1,3-benzodioxol-5-yl)-
1-carboxy-2-oxoethyl]-3,4,5-trihydroxyoxane-2-carboxylic acid
H HMDB0129412 0.0240 0.37 1.00* 0.00
6-[3-(2H-1,3-benzodioxol-5-yl)-3-oxopropanoyl]oxy-3,4,5-trihydroxyoxane-2-carboxylic acid
H HMDB0129411 0.0240 0.37 1.00* 0.00
X-12822 Dopaxanthin H HMDB0012221 0.0135 0.41 0.92* 0.10X-12836 Epirosmanol H HMDB0035812 0.0218 0.38 0.91* 0.00
Isorosmanol H HMDB0036661 0.0218 0.38 0.91* 0.00X-12839 Ethylene brassylate H HMDB0040459 0.0315 0.75* 1.00* 0.10X-12844 Tetrahydroaldosterone-3-glucuronide H HMDB0010357 0.0077 0.48 0.90* 0.14X-12847 2-(2,3,6-trihydroxy-4-
methoxyphenyl)propanoic acidH HMDB0125049 0.0246 0.59 0.91* 0.00
X-12860 glutaryl carnitine R PCID 53481622 0.0432 0.85* 1.00* 0.87*Arginyl-Threonine H HMDB0028719 0.0207 0.57 0.92* 0.22gamma-Glutamyllysine H HMDB0029154 0.0320 0.64 0.92* 0.22Glutamyllysine H HMDB0004207 0.0320 0.64 0.92* 0.22Hydroxyhexanoycarnitine H HMDB0013131 0.0068 0.95* 1.00* 0.22
X-13553 3-Methoxy-4-hydroxyphenylethyleneglycol sulfate
H HMDB0000559 0.0070 0.72* 0.93* 0.00
3-Methoxy-4-Hydroxyphenylglycol sul-fate
H HMDB0003332 0.0070 0.72* 0.93* 0.00
X-13684 3-mercaptolactate-cysteine disulfide R PCID 193536 0.0068 0.50 1.00* 0.73*X-13728 6-amino-5[N-methylformylamino]-1-
methyluracilH HMDB0059771 0.0071 0.80* 0.92* 0.00
X-13844 D-altro-D-manno-Heptose H HMDB0029952 0.0168 0.69* 0.85 0.00D-Glucaric acid H HMDB0029881 0.0196 0.80* 0.92* 0.00Fluorocitric acid H HMDB0031255 0.0396 0.69* 0.85 0.00Galactaric acid H HMDB0000639 0.0196 0.80* 0.92* 0.00Sedoheptulose H HMDB0003219 0.0168 0.69* 0.85 0.00
X-13866 N-Ribosylnicotinamide R PCID 439924 0.0180 0.30 0.58 0.66*3-(4,7-dimethoxy-2H-1,3-benzodioxol-5-yl)propanoic acid
H HMDB0137285 0.0293 0.63 0.92* 0.10
3-(6,7-dimethoxy-2H-1,3-benzodioxol-5-yl)propanoic acid
H HMDB0128669 0.0293 0.63 0.92* 0.10

216 B Supplements: Annotation of unknown metabolites
Table continued (p. 5 / 20)Unknown Candidate Pool Database ID ∆Mass MSTC MSOC MFTCX-13866 Acetaminophen cystein H HMDB0060559 0.0358 0.47 1.00* 0.10X-13874 N2-Succinyl-L-ornithine H HMDB0001199 0.0182 0.70* 0.88 0.10X-14196 Histidinyl-Histidine H HMDB0028887 0.0294 0.45 0.91* 0.00
Phenylbutyrylglutamine H HMDB0011687 0.0433 0.45 0.91* 0.00X-14473 L,L-Cyclo(leucylprolyl) H HMDB0034276 0.0068 1.00* 1.00* 0.06X-15461 (+/-)-2-Pentylthiazolidine H HMDB0040057 0.0111 0.67* 0.80 0.00
5-Acetamidovalerate H HMDB0012175 0.0076 0.75* 1.00* 0.00X-15469 3-hydroxyoctanoyl carnitine H HMDB0061634 0.0070 0.95* 1.00* 0.00X-15497 fructoseglycine R PCID 3081391 0.0081 0.50 0.69 0.61*
salsoline-1-carboxylate R PCID 320322 0.0071 0.58 0.85 0.61*X-15503 dopachrome o-semiquinone R PCID 53481550 0.0309 0.65 0.79 0.62*
Monoethyl phthalate H HMDB0002120 0.0183 0.73* 0.92* 0.00X-15646 5-hydroxy-11-methoxy-6,8,19-trio-
xapentacyclo[10.7.0.02,9.03,7.013,17]nonadeca-1(12),2(9),10,13(17)-tetraene-4,16,18-trione
H HMDB0142065 0.0327 0.46 0.92* 0.10
N-(4-aminobutyl)-3-[3-methoxy-4-(sulfooxy)phenyl]prop-2-enimidicacid
H HMDB0139622 0.0183 0.71* 0.94* 0.10
X-15666 Alanyl-Methionine H HMDB0028693 0.0035 0.80* 0.92* 0.13Serylaspartic acid H HMDB0029035 0.0222 0.69* 0.92* 0.13
X-15728 (4-ethenyl-2,6-dihydroxyphenyl)oxidanesulfonicacid
H HMDB0128010 0.0292 0.75* 0.92* 0.07
(4-ethyl-2-methoxyphenyl)oxidanesulfonic acid
H HMDB0127988 0.0071 0.94* 1.00* 0.07
2-[4-(sulfooxy)phenyl]acetic acid H HMDB0132500 0.0292 0.87* 1.00* 0.07Vanillin 4-sulfate H HMDB0041789 0.0292 0.82* 0.93* 0.07
X-16071 L-allysine R PCID 207 0.0284 0.47 0.80 0.63*6-amino-2-oxohexanoic acid R PCID 439954 0.0284 0.56 0.90* 0.59*2-oxoglutaramate R PCID 48 0.0080 0.53 0.90* 0.601H-Indole-3-carboxaldehyde H HMDB0029737 0.0073 0.62 0.91* 0.10N-Butyrylglycine H HMDB0000808 0.0284 0.59 1.00* 0.10
X-16563 2-acetamido-5-oxopentanoate R PCID 192878 0.0295 0.71* 1.00* 0.83*1,2,5,6-Tetrahydro-4H-pyrrolo[3,2,1-ij]quinolin-4-one
H HMDB0037113 0.0142 0.50 1.00* 0.22
4-Amino-2-methyl-1-naphthol H HMDB0032887 0.0142 0.44 1.00* 0.22apo-[3-methylcrotonoyl-CoA:carbon-dioxide ligase (ADP-forming)]
H HMDB0059607 0.0181 0.50 1.00* 0.22
Isovalerylalanine H HMDB0000747 0.0069 0.92* 1.00* 0.22Isovalerylsarcosine H HMDB0002087 0.0069 0.92* 1.00* 0.22
X-16567 2-Hydroxydecanoate H HMDB0094656 0.0201 0.52 0.92* 0.222-Keto-6-acetamidocaproate H HMDB0012150 0.0294 0.56 1.00* 0.222,3-Dihydro-5-(5-methyl-2-furanyl)-1H-pyrrolizine
H HMDB0040012 0.0142 0.41 1.00* 0.22
Amrinone H HMDB0015496 0.0393 0.35 1.00* 0.22N-Heptanoylglycine H HMDB0013010 0.0069 0.92* 1.00* 0.22Selegiline H HMDB0015171 0.0222 0.39 1.00* 0.22
X-17185 (5-ethenyl-2-hydroxyphenyl)oxidanesulfonic acid
H HMDB0124978 0.0072 0.64 1.00* 0.00

217
Table continued (p. 6 / 20)Unknown Candidate Pool Database ID ∆Mass MSTC MSOC MFTCX-17185 Bergapten H HMDB0030637 0.0403 0.56 1.00 0.00
Methoxsalen H HMDB0014693 0.0403 0.56 1.00 0.00X-17299 11-Hydroxy-9-tridecenoic acid H HMDB0035881 0.0182 0.48 0.94* 0.00X-17323 16-hydroxypalmitate R PCID 7058075 0.0422 0.32 0.58 0.64*X-17324 5-Hydroxymethyl tolterodine H HMDB0013973 0.0086 0.38 0.91* 0.00
Propafenone H HMDB0015313 0.0278 0.38 0.91* 0.00X-17342 2-[4-hydroxy-3-(sulfooxy)phenyl]acetic
acidH HMDB0125151 0.0070 0.65 0.92* 0.00
X-17367 3,4,5,6-Tetrahydrohippuric acid H HMDB0061679 0.0066 0.73* 0.85 0.00X-17438 3-Hydroxydodecanedioic acid H HMDB0000413 0.0074 0.72* 0.93* 0.00
Annuolide A H HMDB0037801 0.0137 0.68* 0.93* 0.00X-17685 (4-ethyl-2,6-
dihydroxyphenyl)oxidanesulfonicacid
H HMDB0128030 0.0069 0.75* 1.00* 0.07
2-hydroxy-3-(sulfooxy)benzoic acid H HMDB0134105 0.0295 0.75* 1.00* 0.074-hydroxy-3-(sulfooxy)benzoic acid H HMDB0124993 0.0295 0.73* 1.00* 0.07
X-17688 Indole-3-acetic-acid-O-glucuronide H HMDB0060001 0.0064 0.52 1.00* 0.00X-17689 1-(4-Hydroxy-3-methoxyphenyl)-5-(4-
hydroxyphenyl)-1,4-pentadien-3-oneH HMDB0040931 0.0220 0.41 1.00* 0.00
2-O-Feruloyltartronic acid H HMDB0032957 0.0297 0.43 1.00* 0.005,5’,6,6’-Tetrahydroxy-3,3’-biindolyl H HMDB0029301 0.0032 0.41 1.00* 0.006-(4-ethenylphenoxy)-3,4,5-trihydroxyoxane-2-carboxylic acid
H HMDB0125168 0.0067 0.43 1.00* 0.00
7-Hydroxy-R-phenprocoumon H HMDB0060888 0.0220 0.41 1.00* 0.00Caffeoylmalic acid H HMDB0029318 0.0297 0.43 1.00* 0.00cis-Coutaric acid H HMDB0034620 0.0297 0.43 1.00* 0.00Demethoxyegonol H HMDB0030772 0.0220 0.41 1.00* 0.00Gyrocyanin H HMDB0034126 0.0144 0.41 1.00* 0.00
X-17699 Glutaminylalanine H HMDB0028790 0.0182 0.69* 0.92* 0.00Lysyl-Alanine H HMDB0028944 0.0181 0.80* 1.00* 0.00
X-18240 Alpha-Hydroxyhippuric acid H HMDB0002404 0.0070 0.73* 0.92* 0.00X-18603 Vinylacetylglycine H HMDB0000894 0.0070 0.80* 1.00* 0.00X-18779 1-hydroxy-4-(4-hydroxy-3-
methoxyphenyl)butan-2-oneH HMDB0133535 0.0438 0.65 0.91* 0.09
2-(3,4-dimethoxyphenyl)propanoicacid
H HMDB0130385 0.0438 0.62 0.91* 0.09
2-[(4-hydroxyphenyl)methyl]propanedioicacid
H HMDB0142178 0.0074 0.75* 0.92* 0.09
2-benzyl-2-hydroxypropanedioic acid H HMDB0142180 0.0074 0.67* 0.85 0.092-Methoxy-3-(4-methoxyphenyl)propanoic acid
H HMDB0039428 0.0438 0.76* 0.92* 0.09
3-(3-hydroxy-4-methoxyphenyl)oxirane-2-carboxylicacid
H HMDB0140909 0.0074 0.75* 0.92* 0.09
3-(3,5-dimethoxyphenyl)propanoicacid
H HMDB0127493 0.0438 0.76* 0.87 0.09
3-(4-Hydroxy-3-methoxyphenyl)-2-methylpropionic acid
H HMDB0060737 0.0438 0.75* 0.92* 0.09
3-(4-hydroxy-3-methoxyphenyl)oxirane-2-carboxylicacid
H HMDB0125516 0.0074 0.75* 0.92* 0.09

218 B Supplements: Annotation of unknown metabolites
Table continued (p. 7 / 20)Unknown Candidate Pool Database ID ∆Mass MSTC MSOC MFTCX-18779 3-hydroxy-4-(4-hydroxy-3-
methoxyphenyl)butan-2-oneH HMDB0133478 0.0438 0.67* 0.91* 0.09
3,4-Dihydroxyphenylvaleric acid H HMDB0029233 0.0438 0.62 0.91* 0.094-(2,4-dihydroxy-3-methoxyphenyl)butan-2-one
H HMDB0133526 0.0438 0.65 0.91* 0.09
4-(2,4-dihydroxy-5-methoxyphenyl)butan-2-one
H HMDB0133519 0.0438 0.65 0.91* 0.09
4-(3-methylbut-2-en-1-yl)benzene-1,2,3,5-tetrol
H HMDB0129255 0.0438 0.62 0.91* 0.09
4-(3,4-dihydroxy-5-methoxyphenyl)butan-2-one
H HMDB0133511 0.0438 0.76* 0.91* 0.09
4-hydroxy-4-(4-hydroxy-3-methoxyphenyl)butan-2-one
H HMDB0135671 0.0438 0.65 0.91* 0.09
D-Glucaric acid H HMDB0029881 0.0078 0.67* 0.91* 0.09Galactaric acid H HMDB0000639 0.0078 0.67* 0.91* 0.09Vanilpyruvic acid H HMDB0011714 0.0074 0.87* 1.00* 0.09
X-18888 2-keto-3-deoxy-D-glycero-D-galactononic acid
R PCID 22833524 0.0446 0.57 0.80 0.79*
Seryltyrosine H HMDB0029051 0.0181 0.60 0.92* 0.10X-18889 Asparaginyl-Alanine H HMDB0028724 0.0181 0.73* 0.92* 0.00
Glutaminylglycine H HMDB0028797 0.0181 0.73* 0.92* 0.00Lysyl-Glycine H HMDB0028951 0.0183 0.73* 0.92* 0.00Tryptophanamide H HMDB0013318 0.0028 0.74* 0.93* 0.00
X-18938 3-Hydroxydodecanedioic acid H HMDB0000413 0.0070 0.68* 0.87 0.10X-19561 Dihydroferuloylglycine H HMDB0041725 0.0072 0.63 0.92* 0.10
N-Acetylvanilalanine H HMDB0011716 0.0072 0.63 0.92* 0.10N-lactoyl-Tyrosine H HMDB0062177 0.0072 0.63 0.92* 0.10
X-19913 (2Z)-2-(phenylmethylidene)octanoicacid
H HMDB0134123 0.0475 0.36 1.00* 0.20
(Z)-8-Decene-4,6-diyn-1-yl 3-methylbutanoate
H HMDB0031000 0.0475 0.33 1.00* 0.20
1,3,11(13)-Eudesmatrien-12-oic acid H HMDB0039011 0.0475 0.36 1.00* 0.203-(1,2-dihydroxybut-3-en-1-yl)-1H-isochromen-1-one
H HMDB0130065 0.0252 0.33 1.00* 0.20
3-(3-ethyloxiran-2-yl)-5-hydroxy-1H-isochromen-1-one
H HMDB0130047 0.0252 0.31 1.00* 0.20
3-[(1E)-but-1-en-1-yl]-5,6-dihydroxy-1H-isochromen-1-one
H HMDB0130045 0.0252 0.29 1.00* 0.20
3-[(1E)-but-1-en-1-yl]-5,7-dihydroxy-1H-isochromen-1-one
H HMDB0130046 0.0252 0.29 1.00* 0.20
3-[4-hydroxy-3-(3-methylbut-2-en-1-yl)phenyl]prop-2-enoic acid
H HMDB0135874 0.0111 0.24 1.00* 0.20
3-hydroxy-6-[(E)-2-methoxyethenyl]-7-methyl-2H-chromen-2-one
H HMDB0135798 0.0252 0.26 1.00* 0.20
4-(Glutamylamino) butanoate H HMDB0012161 0.0071 0.38 1.00* 0.205-hydroxy-3-[(1E)-3-hydroxybut-1-en-1-yl]-1H-isochromen-1-one
H HMDB0130044 0.0252 0.29 1.00* 0.20
5-hydroxy-3-[(1E)-4-hydroxybut-1-en-1-yl]-1H-isochromen-1-one
H HMDB0130048 0.0252 0.29 1.00* 0.20
5-hydroxy-6-[(E)-2-methoxyethenyl]-7-methyl-2H-chromen-2-one
H HMDB0135797 0.0252 0.24 1.00* 0.20
6-(3-methoxyoxiran-2-yl)-7-methyl-2H-chromen-2-one
H HMDB0135795 0.0252 0.26 1.00* 0.20

219
Table continued (p. 8 / 20)Unknown Candidate Pool Database ID ∆Mass MSTC MSOC MFTCX-19913 7-(hydroxymethyl)-6-[(E)-2-
methoxyethenyl]-2H-chromen-2-oneH HMDB0135794 0.0252 0.26 1.00* 0.20
7-hydroxy-6-(3-oxobutyl)-2H-chromen-2-one
H HMDB0128959 0.0252 0.26 1.00* 0.20
8-hydroxy-6-[(E)-2-methoxyethenyl]-7-methyl-2H-chromen-2-one
H HMDB0135796 0.0252 0.26 1.00* 0.20
Alantolactone H HMDB0035906 0.0475 0.36 1.00* 0.20Alloalantolactone H HMDB0036119 0.0475 0.36 1.00* 0.20Aspartyl-Valine H HMDB0028766 0.0071 0.35 1.00* 0.20Costunolide H HMDB0036688 0.0475 0.36 1.00* 0.20Dihydrocoriandrin H HMDB0033330 0.0252 0.33 1.00* 0.20Glycerol 1-propanoate diacetate H HMDB0031640 0.0041 0.32 1.00* 0.20Hydroxyprolyl-Threonine H HMDB0028873 0.0071 0.38 1.00* 0.20Isoalantolactone H HMDB0035934 0.0475 0.36 1.00* 0.20Isoleucyl-Threonine H HMDB0028917 0.0435 0.35 1.00* 0.20L-Acetopine H HMDB0039111 0.0184 0.38 1.00* 0.20L-N-(3-Carboxypropyl)glutamine H HMDB0029393 0.0071 0.35 1.00* 0.20Leucyl-Threonine H HMDB0028939 0.0435 0.35 1.00* 0.20Marindinin H HMDB0029504 0.0111 0.42 1.00* 0.20N2-Succinyl-L-ornithine H HMDB0001199 0.0071 0.35 1.00* 0.20Nalidixic Acid H HMDB0014917 0.0140 0.41 1.00* 0.20Pterosin E H HMDB0036605 0.0111 0.33 1.00* 0.20Salfredin B11 H HMDB0041325 0.0252 0.29 1.00* 0.20Spermic acid 2 H HMDB0013075 0.0435 0.31 1.00* 0.20Tetrahydrofurfuryl cinnamate H HMDB0036189 0.0111 0.26 1.00* 0.20Threoninyl-Hydroxyproline H HMDB0029062 0.0071 0.35 1.00* 0.20Threoninyl-Isoleucine H HMDB0029064 0.0435 0.35 1.00* 0.20Threoninyl-Leucine H HMDB0029065 0.0435 0.35 1.00* 0.20Valyl-Aspartate H HMDB0029123 0.0071 0.35 1.00* 0.20
X-21792 (2E,4E)-2,7-Dimethyl-2,4-octadienedioic acid
H HMDB0034099 0.0065 0.36 1.00* 0.21
2-(2,3,4-trihydroxyphenyl)propanoicacid
H HMDB0137823 0.0299 0.36 1.00* 0.21
2-(2,4,5-trihydroxyphenyl)propanoicacid
H HMDB0125024 0.0299 0.36 1.00* 0.21
2-(2,5-dihydroxy-4-methoxyphenyl)acetic acid
H HMDB0130476 0.0299 0.36 1.00* 0.21
2-(3,4-dihydroxy-5-methoxyphenyl)acetic acid
H HMDB0131426 0.0299 0.36 1.00* 0.21
2-hydroxy-2-(2-hydroxy-4-methoxyphenyl)acetic acid
H HMDB0137136 0.0299 0.36 1.00* 0.21
2-hydroxy-2-(4-hydroxy-3-methoxyphenyl)acetic acid
H HMDB0133489 0.0299 0.36 1.00* 0.21
2-hydroxy-3,4-dimethoxybenzoic acid H HMDB0142084 0.0299 0.36 1.00* 0.212,3-Methylene suberic acid H HMDB0059779 0.0065 0.45 1.00* 0.213-(2,4-dihydroxyphenyl)-3-hydroxypropanoic acid
H HMDB0126478 0.0299 0.36 1.00* 0.21
3-(2,4,5-trihydroxyphenyl)propanoicacid
H HMDB0126489 0.0299 0.36 1.00* 0.21
3-(3,4-Dihydroxyphenyl)lactic acid H HMDB0003503 0.0299 0.36 1.00* 0.21

220 B Supplements: Annotation of unknown metabolites
Table continued (p. 9 / 20)Unknown Candidate Pool Database ID ∆Mass MSTC MSOC MFTCX-21792 3-(3,4,5-trihydroxyphenyl)propanoic
acidH HMDB0125529 0.0299 0.36 1.00* 0.21
3-[(1E)-buta-1,3-dien-1-yl]-1H-isochromen-1-one
H HMDB0130034 0.0146 0.33 1.00* 0.21
3-hydroxy-2,4-dimethoxybenzoic acid H HMDB0140947 0.0299 0.36 1.00* 0.213-Hydroxy-4-methoxymandelate H HMDB0029170 0.0299 0.36 1.00* 0.213,4-Methylene suberic acid H HMDB0059768 0.0065 0.45 1.00* 0.213,4-O-Dimethylgallic acid H HMDB0041662 0.0299 0.36 1.00* 0.214-hydroxy-2,3-dimethoxybenzoic acid H HMDB0142087 0.0299 0.36 1.00* 0.215-(3E-Pentenyl)tetrahydro-2-oxo-3-furancarboxylic acid
H HMDB0030991 0.0065 0.41 1.00* 0.21
Ethyl gallate H HMDB0033836 0.0299 0.36 1.00* 0.21Mimosine H HMDB0015188 0.0186 0.36 1.00* 0.21Syringic acid H HMDB0002085 0.0299 0.36 1.00* 0.21
X-21827 Ethylene brassylate H HMDB0040459 0.0429 0.75* 1.00* 0.00X-21831 12-oxo-20-carboxy-leukotriene B4 R PCID 53481457 0.0210 0.32 0.82 0.70*
3-(1,1-Dimethyl-2-propenyl)-8-(3-methyl-2-butenyl)xanthyletin
H HMDB0030730 0.0362 0.41 1.00* 0.00
X-22158 hexanoyl carnitine R PCID 6426853 0.0068 1.00* 1.00* 1.00*L-Hexanoylcarnitine H HMDB0000756 0.0068 1.00* 1.00* 0.00
X-22379 androsterone 3-glucosiduronic acid R PCID 114833 0.0063 1.00* 1.00* 1.00*5alpha-Dihydrotestosterone glucuro-nide
R PCID 44263365 0.0063 0.78* 0.88 0.96*
3-alpha-hydroxy-5-alpha-androstane-17-one 3-D-glucuronide
H HMDB0010365 0.0063 1.00* 1.00* 0.13
X-22475 (-)-Morphine H HMDB0040987 0.0086 0.38 1.00* 0.22Arborinine H HMDB0030177 0.0278 0.29 1.00* 0.22Dihydroisomorphine H HMDB0060929 0.0086 0.38 1.00* 0.22Erysopine H HMDB0030256 0.0086 0.33 1.00* 0.22Glycylprolylhydroxyproline H HMDB0002171 0.0046 0.52 1.00* 0.22Hydromorphone H HMDB0014472 0.0086 0.38 1.00* 0.22Isothipendyl H HMDB0015692 0.0021 0.29 1.00* 0.22Letrozole H HMDB0015141 0.0265 0.27 1.00* 0.22Morphine H HMDB0014440 0.0086 0.38 1.00* 0.22N-Monodesmethyl-rizatriptan H HMDB0060847 0.0311 0.28 1.00* 0.22Norcodeine H HMDB0060657 0.0086 0.38 1.00* 0.22norhydrocodone H HMDB0061070 0.0086 0.38 1.00* 0.22Piperine H HMDB0029377 0.0086 0.33 1.00* 0.22Probenecid H HMDB0015166 0.0244 0.32 1.00* 0.22Secodemethylclausenamide H HMDB0032961 0.0086 0.38 1.00* 0.22
X-22836 L-allysine R PCID 207 0.0073 0.62 0.80 0.64*6-amino-2-oxohexanoic acid R PCID 439954 0.0073 0.50 0.70 0.59*L-cis-4-(Hydroxymethyl)-2-pyrrolidinecarboxylic acid
H HMDB0029425 0.0073 0.75* 0.90* 0.10
L-trans-5-Hydroxy-2-piperidinecarboxylic acid
H HMDB0029426 0.0073 0.75* 0.90* 0.10
X-23196 gama-L-glutamyl-L-alanine R PCID 11183554 0.0177 0.60 0.80 0.94*L-leucyl-L-serine R PCID 40489070 0.0187 0.60 0.80 0.73*5-L-Glutamyl-L-alanine R PCID 440103 0.0177 0.60 0.80 0.94*

221
Table continued (p. 10 / 20)Unknown Candidate Pool Database ID ∆Mass MSTC MSOC MFTCX-23196 N-acetylserotonin R PCID 903 0.0025 0.48 0.69 0.79*
2-Hydroxydecanedioic acid H HMDB0000424 0.0074 0.88* 0.93* 0.10X-23291 3-ethylphenyl Sulfate H HMDB0062721 0.0074 0.79* 0.92* 0.07
4-ethylphenylsulfate H HMDB0062551 0.0074 0.79* 0.92* 0.07X-23304 3,4,5-trihydroxy-6-(4-
hydroxybenzoyloxy)oxane-2-carboxylicacid
H HMDB0125175 0.0071 0.45 1.00* 0.00
6-(4-carboxyphenoxy)-3,4,5-trihydroxyoxane-2-carboxylic acid
H HMDB0125174 0.0071 0.45 1.00* 0.00
X-23306 (R) 2,3-Dihydroxy-3-methylvalerate H HMDB0012140 0.0075 0.90* 1.00* 0.00(R)-mevalonate H HMDB0059629 0.0075 0.73* 0.89 0.00D-Xylono-1,5-lactone H HMDB0011676 0.0289 0.73* 0.89 0.00
X-23423 2-Amino-3-oxoadipate R PCID 440714 0.0289 0.56 0.75 0.65*L-argininium(1+) H HMDB0062762 0.0425 0.71* 0.83 0.20
X-23429 2-Hydroxy-2-(2-oxopropyl)butanedioicacid
H HMDB0059927 0.0291 0.79* 0.92* 0.00
3-Dehydroquinate H HMDB0012710 0.0291 0.67* 0.83 0.00X-23518 4-methoxy-3-(sulfooxy)benzoic acid H HMDB0140929 0.0070 0.65 0.92* 0.10
Vanillic acid 4-sulfate H HMDB0041788 0.0070 0.75* 1.00* 0.10X-23581 1-piperideine-6-carboxylate R PCID 45266761 0.0073 0.67* 0.89 0.57
(+/-)-4-Methylene-2-pyrrolidinecarboxylic acid
H HMDB0029434 0.0073 0.80* 0.89 0.10
(S)-2,3,4,5-tetrahydropyridine-2-carboxylate
H HMDB0059657 0.0073 0.67* 0.89 0.10
X-23583 acetamidopropanal R PCID 5460495 0.0074 0.45 0.62 0.62*D-proline R PCID 8988 0.0074 0.60 0.75 0.61*4-Amino-2-methylenebutanoic acid H HMDB0030409 0.0074 0.78* 0.88 0.08
X-23590 Glycyl-Glutamate H HMDB0028840 0.0196 0.73* 0.92* 0.00Glycyl-Glutamine H HMDB0028839 0.0042 0.86* 1.00* 0.00Glycyl-Lysine H HMDB0028846 0.0406 0.73* 0.92* 0.00N-lactoyl-Leucine H HMDB0062176 0.0294 0.73* 0.92* 0.00
X-23593 N-(omega)-Hydroxyarginine R PCID 440849 0.0043 0.43 0.69 0.61*Alanyl-Threonine H HMDB0028697 0.0069 0.67* 0.92* 0.00N-(gamma-Glutamyl)ethanolamine H HMDB0039222 0.0069 0.76* 1.00* 0.00
X-23644 1H-Indole-3-carboxaldehyde H HMDB0029737 0.0281 0.67* 0.89 0.002,4-Dimethyl-1H-indole H HMDB0032967 0.0082 0.67* 0.89 0.00
X-23647 L-Prolinylglycine R PCID 6426709 0.0294 0.75* 1.00* 0.74*Glycylproline R PCID 79101 0.0294 0.75* 1.00* 0.79*
X-23648 Glutaminylaspartic acid H HMDB0028793 0.0068 0.70* 0.88 0.00Lysyl-Aspartate H HMDB0028947 0.0296 0.70* 0.88 0.00
X-23747 N1,N8-diacetylspermidine R PCID 389613 0.0074 0.71* 1.00* 0.98*X-23776 Allysine R PCID 207 0.0435 0.67* 0.80 0.08
2-Keto-6-aminocaproate R PCID 439954 0.0435 0.67* 0.80 0.08(S)-2-amino-6-oxohexanoate H HMDB0059595 0.0435 0.67* 0.80 0.08(S)-5-Amino-3-oxohexanoate H HMDB0012131 0.0435 0.67* 0.80 0.082-Aminoheptanoate H HMDB0094649 0.0071 0.67* 0.80 0.08L-cis-4-(Hydroxymethyl)-2-pyrrolidinecarboxylic acid
H HMDB0029425 0.0435 0.67* 0.80 0.08

222 B Supplements: Annotation of unknown metabolites
Table continued (p. 11 / 20)Unknown Candidate Pool Database ID ∆Mass MSTC MSOC MFTCX-23776 L-trans-5-Hydroxy-2-
piperidinecarboxylic acidH HMDB0029426 0.0435 0.82* 0.90* 0.08
N-(2-Carboxymethyl)-morpholine H HMDB0061156 0.0435 0.67* 0.80 0.08N-Butyrylglycine H HMDB0000808 0.0435 0.67* 0.80 0.08
X-23908 1-hydroxyhexanoylglycine H HMDB0094718 0.0072 0.57 1.00* 0.00Asparaginyl-Glycine H HMDB0028731 0.0179 0.57 1.00* 0.00Glutarylglycine H HMDB0000590 0.0292 0.57 1.00* 0.00Glycyl-Asparagine H HMDB0028836 0.0179 0.69* 1.00* 0.00N-lactoyl-Valine H HMDB0062181 0.0072 0.69* 1.00* 0.00
X-23997 6-ethoxy-3,4,5-trihydroxyoxane-2-carboxylic acid
H HMDB0131286 5.0e-4 0.75* 1.00* 0.00
Isopropyl beta-D-glucoside H HMDB0032705 0.0358 0.67* 0.93* 0.00X-24270 (1R,2S,5R,6S)-6-(3,4-
Dihydroxyphenyl)-2-(3,4-methylenedioxyphenyl)-3,7-dioxabicyclo-[3,3,0]octane
H HMDB0059746 0.0230 0.42 0.92* 0.00
1,5,8-Trihydroxy-3-methyl-2-prenylxanthone
H HMDB0034182 0.0230 0.42 0.92* 0.00
15,16-dihydroxy-11-methoxy-6,8,20-trioxapentacyclo[10.8.0.02,9.03,7.014,19]icosa-1(12),2(9),10,14(19),15,17-hexaen-13-one
H HMDB0128882 0.0133 0.42 0.92* 0.00
3,4,5-trihydroxy-6-[3-(3-hydroxyphenyl)propanoyl]oxyoxane-2-carboxylic acid
H HMDB0124983 0.0078 0.44 0.92* 0.00
3,4,5-trihydroxy-6-[3-(4-hydroxyphenyl)propanoyl]oxyoxane-2-carboxylic acid
H HMDB0125170 0.0078 0.44 0.92* 0.00
6-[3-(2-carboxyethyl)phenoxy]-3,4,5-trihydroxyoxane-2-carboxylic acid
H HMDB0124982 0.0078 0.44 0.92* 0.00
6-[4-(2-carboxyethyl)phenoxy]-3,4,5-trihydroxyoxane-2-carboxylic acid
H HMDB0125169 0.0078 0.44 0.92* 0.00
X-24328 (S)-carnitinium H HMDB0062634 0.0313 0.65 1.00* 0.00X-24330 Porphobilinogen R PCID 1021 0.0187 0.42 1.00* 0.42
2-(2-hydroxy-3,4-dimethoxyphenyl)propanoic acid
H HMDB0133894 0.0074 0.31 1.00* 0.21
2-Phenylethyl benzoate H HMDB0033946 0.0227 0.29 1.00* 0.213-(2-hydroxy-3,4-dimethoxyphenyl)propanoic acid
H HMDB0142080 0.0074 0.35 1.00* 0.21
3-(3,4-dihydroxy-5-methoxyphenyl)-2-oxopropanoic acid
H HMDB0126510 0.0290 0.35 1.00* 0.21
3-(3,4-dihydroxy-5-methoxyphenyl)oxirane-2-carboxylicacid
H HMDB0125587 0.0290 0.35 1.00* 0.21
3-(4-Hydroxy-3-methoxyphenyl)-2-methyllactic acid
H HMDB0060736 0.0074 0.35 1.00* 0.21
3-Nitrotyrosine H HMDB0001904 0.0177 0.35 1.00* 0.213,4-Dimethoxy-1,2-benzenedicarboxylic acid
H HMDB0033842 0.0290 0.31 1.00* 0.21
3,4-Methylenesebacic acid H HMDB0059729 0.0438 0.55 1.00* 0.214-Hydroxy-(3’,4’-dihydroxyphenyl)-valeric acid
H HMDB0041679 0.0074 0.42 1.00* 0.21
4,5-Dimethoxy-1,2-benzenedicarboxylic acid
H HMDB0033893 0.0290 0.31 1.00* 0.21

223
Table continued (p. 12 / 20)Unknown Candidate Pool Database ID ∆Mass MSTC MSOC MFTCX-24330 5-(3,4,5-trihydroxyphenyl)pentanoic
acidH HMDB0141549 0.0074 0.42 1.00* 0.21
5-(3,5-dihydroxyphenyl)-4-hydroxypentanoic acid
H HMDB0141547 0.0074 0.42 1.00* 0.21
Alanyl-Histidine H HMDB0028689 0.0299 0.32 1.00* 0.21Chorismate H HMDB0012199 0.0290 0.31 1.00* 0.21Dihydrosinapic acid H HMDB0041727 0.0074 0.35 1.00* 0.21Genipin H HMDB0035830 0.0074 0.59 1.00* 0.21Histidinyl-Alanine H HMDB0028878 0.0299 0.32 1.00* 0.21methyl 2-hydroxy-3-(4-hydroxy-3-methoxyphenyl)propanoate
H HMDB0124956 0.0074 0.35 1.00* 0.21
p-Tolyl phenylacetate H HMDB0041564 0.0227 0.29 1.00* 0.21Phenylmethyl benzeneacetate H HMDB0033251 0.0227 0.29 1.00* 0.21Prephenate H HMDB0012283 0.0290 0.42 1.00* 0.21
X-24339 Xanthosine 5’-phosphate R PCID 73323 0.0336 0.73* 0.92* 0.94*3-(3,4-dihydroxy-5-methoxyphenyl)-1-(2,4,6-trihydroxy-3-methoxyphenyl)propane-1,2-dione
H HMDB0128763 0.0038 0.44 0.92* 0.20
5-formamido-1-(5-phospho-D-ribosyl)imidazole-4-carboxamide(2-)
H HMDB0062708 0.0325 0.73* 0.92* 0.20
Xanthylic acid H HMDB0001554 0.0336 0.73* 0.92* 0.20X-24343 (4-ethenyl-2,6-
dihydroxyphenyl)oxidanesulfonicacid
H HMDB0128010 0.0289 0.88* 0.93* 0.07
(4-ethyl-2-methoxyphenyl)oxidanesulfonic acid
H HMDB0127988 0.0074 0.88* 0.93* 0.07
2-[4-(sulfooxy)phenyl]acetic acid H HMDB0132500 0.0289 0.67* 0.80 0.07Vanillin 4-sulfate H HMDB0041789 0.0289 0.88* 0.93* 0.07
X-24344 (5-ethyl-2-hydroxyphenyl)oxidanesulfonic acid
H HMDB0124986 0.0075 0.73* 0.92* 0.04
3-hydroxybenzoic acid-3-O-sulphate H HMDB0059968 0.0289 0.73* 0.92* 0.044-hydroxybenzoic acid-4-O-sulphate H HMDB0059982 0.0289 0.73* 0.92* 0.04Tyrosol 4-sulfate H HMDB0041785 0.0075 0.73* 0.92* 0.04
X-24353 Homofukinolide H HMDB0034659 0.0229 0.34 0.92* 0.00X-24357 11b,17a,21-Trihydroxypreg-nenolone H HMDB0006760 0.0075 0.79* 0.92* 0.13
11b,21-Dihydroxy-3,20-oxo-5b-pregnan-18-al
H HMDB0006754 0.0075 0.73* 0.88 0.13
18-Hydroxy-11-dehydrotetrahydrocorticosterone
H HMDB0013157 0.0075 0.79* 0.88 0.13
3a,11b,21-Trihydroxy-20-oxo-5b-pregnan-18-al
H HMDB0006753 0.0075 0.73* 0.88 0.13
Dihydrocortisol H HMDB0003259 0.0075 0.86* 0.96* 0.13X-24358 19-Noraldosterone H HMDB0041795 0.0230 0.59 0.94* 0.00
Diosbulbin E H HMDB0036779 0.0134 0.53 0.93* 0.00Diosbulbin G H HMDB0036782 0.0134 0.53 0.93* 0.00Gibberellin A113 H HMDB0032819 0.0230 0.60 1.00* 0.00Gibberellin A37 H HMDB0035047 0.0230 0.56 1.00* 0.00Gibberellin A44 H HMDB0036901 0.0230 0.56 1.00* 0.00Gibberellin A64 H HMDB0036894 0.0230 0.60 1.00* 0.00Gibberellin A94 H HMDB0031365 0.0134 0.50 0.93* 0.00

224 B Supplements: Annotation of unknown metabolites
Table continued (p. 13 / 20)Unknown Candidate Pool Database ID ∆Mass MSTC MSOC MFTCX-24361 testosterone 3-glucosiduronic acid R PCID 108192 0.0073 0.74* 0.85 0.84*
16-Glucuronide-estriol R PCID 122281 0.0291 0.65 0.79 0.63*15-Hydroxynorandrostene-3,17-dioneglucuronide
H HMDB0010353 0.0291 0.69* 0.82 0.00
Dehydroepiandrosterone 3-glucuronide H HMDB0010348 0.0073 0.94* 0.97* 0.00Dehydroisoandrosterone 3-glucuronide H HMDB0010327 0.0073 0.94* 0.97* 0.00
X-24400 6-Methyltetrahydropterin H HMDB0002249 0.0442 0.73* 0.85 0.108-Hydroxy-7-methylguanine H HMDB0006037 0.0078 0.73* 0.85 0.10
X-24402 2-(4-Methyl-5-thiazolyl)ethyl formate H HMDB0032420 0.0464 0.40 1.00* 0.222,5-Dihydro-4,5-dimethyl-2-(1-methylpropyl)thiazole
H HMDB0037514 0.0264 0.38 1.00* 0.22
2,5-Dihydro-4,5-dimethyl-2-(2-methylpropyl)thiazole
H HMDB0037159 0.0264 0.38 1.00* 0.22
8-(Methylthio)octanenitrile H HMDB0038438 0.0264 0.35 1.00* 0.22Rasagiline H HMDB0015454 0.0230 0.50 1.00* 0.22Tetrahydrodipicolinate H HMDB0012289 0.0286 0.50 1.00* 0.22Valero-1,5-lactam H HMDB0061932 0.0261 0.54 1.00* 0.22
X-24410 acetamidopropanal R PCID 5460495 0.0072 0.67* 0.86 0.67*D-proline R PCID 8988 0.0072 0.70* 0.88 0.62*Acetamidopropanal H HMDB0012880 0.0072 0.67* 0.86 0.00Caproate (6:0) H HMDB0061883 0.0054 0.70* 0.88 0.00N-(2-Methylpropyl)acetamide H HMDB0034203 0.0292 0.67* 0.86 0.00N-(3-Methylbutyl)acetamide H HMDB0031651 0.0292 0.67* 0.86 0.00
X-24411 acetamidopropanal R PCID 5460495 0.0072 0.50 0.75 0.63*D-proline R PCID 8988 0.0072 0.64 0.88 0.62*
X-24417 testosterone 3-glucosiduronic acid R PCID 108192 0.0077 0.74* 0.85 0.84*16-Glucuronide-estriol R PCID 122281 0.0287 0.65 0.79 0.63*15-Hydroxynorandrostene-3,17-dioneglucuronide
H HMDB0010353 0.0287 0.69* 0.82 0.13
Dehydroepiandrosterone 3-glucuronide H HMDB0010348 0.0077 0.94* 0.97* 0.13Dehydroisoandrosterone 3-glucuronide H HMDB0010327 0.0077 0.94* 0.97* 0.13
X-24452 3-Hydroxy-N6,N6,N6-trimethyl-L-lysine
R PCID 439460 0.0071 0.93* 1.00* 0.81*
N6-Acetyl-5S-hydroxy-L-lysine H HMDB0033891 0.0435 0.69* 0.85 0.00X-24455 N-acetyl-5-methoxykynuramine R PCID 390658 0.0294 0.52 0.80 0.71*
N-formyl-L-kynurenine R PCID 910 0.0070 1.00* 1.00* 1.00*L-Formylkynurenine H HMDB0060485 0.0070 1.00* 1.00* 0.19N’-Formylkynurenine H HMDB0001200 0.0070 1.00* 1.00* 0.19
X-24462 N-Methylcalystegine C1 H HMDB0036394 0.0292 0.73* 1.00* 0.06X-24490 2-hydroxy-3-[4-hydroxy-3-
methoxy-5-(3-methylbut-2-en-1-yl)phenyl]propanoic acid
H HMDB0133288 0.0180 0.48 0.91* 0.00
Valyl-Tyrosine H HMDB0029139 0.0292 0.48 0.91* 0.00X-24494 11-Oxo-androsterone glucuronide H HMDB0010338 0.0082 0.97* 1.00* 0.13X-24498 cis-beta-D-Glucosyl-2-
hydroxycinnamateR PCID 5316113 0.0078 0.27 0.53 0.64*
X-24514 putreanine R PCID 53477800 0.0440 0.35 0.55 0.59*X-24518 Alanyl-Asparagine H HMDB0028682 0.0434 0.50 1.00* 0.13
Asparaginyl-Alanine H HMDB0028724 0.0434 0.58 1.00* 0.13

225
Table continued (p. 14 / 20)Unknown Candidate Pool Database ID ∆Mass MSTC MSOC MFTCX-24518 Glycyl-Gamma-glutamate H HMDB0028855 0.0434 0.57 1.00* 0.13
Glycyl-Glutamine H HMDB0028839 0.0434 0.57 1.00* 0.13Glycyl-Lysine H HMDB0028846 0.0070 0.47 1.00* 0.13N-lactoyl-Leucine H HMDB0062176 0.0182 0.50 1.00* 0.13
X-24542 Vanilloylglycine H HMDB0060026 0.0071 0.65 0.92* 0.00X-24588 3,4,5-trihydroxy-6-3-hydroxy-4-
[(E)-2-(5-hydroxy-2,2-dimethyl-2H-chromen-7-yl)ethenyl]phenoxyoxane-2-carboxylic acid
H HMDB0134169 0.0146 0.33 1.00* 0.21
3,4,5-trihydroxy-6-5-hydroxy-2-[(E)-2-(5-hydroxy-2,2-dimethyl-2H-chromen-7-yl)ethenyl]phenoxyoxane-2-carboxylic acid
H HMDB0134170 0.0146 0.33 1.00* 0.21
6-(7-[(E)-2-(2,4-dihydroxyphenyl)ethenyl]-2,2-dimethyl-2H-chromen-5-yloxy)-3,4,5-trihydroxyoxane-2-carboxylic acid
H HMDB0134168 0.0146 0.33 1.00* 0.21
6-4-[(E)-2-3,5-dihydroxy-4-[(1E)-3-methylbuta-1,3-dien-1-yl]phenylethenyl]-2-hydroxyphenoxy-3,4,5-trihydroxyoxane-2-carboxylicacid
H HMDB0129087 0.0146 0.33 1.00* 0.21
6-5-[(E)-2-(3,4-dihydroxyphenyl)ethenyl]-3-hydroxy-2-[(1E)-3-methylbuta-1,3-dien-1-yl]phenoxy-3,4,5-trihydroxyoxane-2-carboxylic acid
H HMDB0129086 0.0146 0.33 1.00* 0.21
6-5-[(E)-2-3,5-dihydroxy-4-[(1E)-3-methylbuta-1,3-dien-1-yl]phenylethenyl]-2-hydroxyphenoxy-3,4,5-trihydroxyoxane-2-carboxylicacid
H HMDB0129088 0.0146 0.33 1.00* 0.21
Glucosylgalactosyl hydroxylysine H HMDB0000585 0.0389 0.19 1.00* 0.21X-24736 Glycylleucine R PCID 92843 0.0184 0.50 0.73 0.71*
Leucylglycine R PCID 97364 0.0184 0.41 0.64 0.68*X-24738 4-Hydroxystachydrine H HMDB0029230 0.0072 0.91* 1.00* 0.00
Betonicine H HMDB0029412 0.0072 0.91* 1.00* 0.00Turicine H HMDB0029409 0.0072 0.91* 1.00* 0.00
X-24766 L-3-Cyanoalanine R PCID 439742 0.0437 0.70* 0.88 0.76*3-Amino-2-piperidone H HMDB0000323 0.0073 0.70* 0.88 0.00epsilon-Caprolactone H HMDB0060476 0.0185 0.70* 0.88 0.00L-3-Cyanoalanine H HMDB0060245 0.0437 0.70* 0.88 0.00
X-24796 L-2,3-Dihydrodipicolinate H HMDB0012247 0.0400 0.50 1.00* 0.13X-24798 4-Hydroxynonenal R PCID 5283344 0.0074 0.15 0.91* 0.23
(E)-3-decen-1-ol H HMDB0013810 0.0438 0.15 0.91* 0.211-Decen-3-ol H HMDB0039854 0.0438 0.15 0.91* 0.212-Decanone H HMDB0031409 0.0438 0.15 0.91* 0.212-DECENOL H HMDB0032532 0.0438 0.15 0.91* 0.212-Nonenoic acid H HMDB0031271 0.0074 0.15 0.91* 0.213-Decanone H HMDB0032212 0.0438 0.15 0.91* 0.213,4-Epoxynonanal H HMDB0060286 0.0074 0.15 0.91* 0.214-Oxononanal H HMDB0034716 0.0074 0.15 0.91* 0.216-Butyltetrahydro-2H-pyran-2-one H HMDB0031514 0.0074 0.15 0.91* 0.21

226 B Supplements: Annotation of unknown metabolites
Table continued (p. 15 / 20)Unknown Candidate Pool Database ID ∆Mass MSTC MSOC MFTCX-24798 9-Decenol H HMDB0059861 0.0438 0.15 0.91* 0.21
cis-4-Decenol H HMDB0032206 0.0438 0.17 0.91* 0.21Decanal H HMDB0011623 0.0438 0.17 1.00* 0.21Dihydro-5-pentyl-2(3H)-furanone H HMDB0031531 0.0074 0.15 0.91* 0.21
X-24799 (+/-)-2-Hydroxy-3-(2-hydroxyphenyl)propanoic acid
H HMDB0033624 0.0289 0.38 1.00* 0.21
2-(2,4-dihydroxyphenyl)propanoic acid H HMDB0133788 0.0289 0.38 1.00* 0.212-(3-hydroxy-5-methoxyphenyl)aceticacid
H HMDB0131428 0.0289 0.38 1.00* 0.21
2-(3,4-dihydroxyphenyl)propanoic acid H HMDB0129348 0.0289 0.38 1.00* 0.212-hydroxy-2-(3-methoxyphenyl)aceticacid
H HMDB0133494 0.0289 0.38 1.00* 0.21
2-hydroxy-2-(4-methoxyphenyl)aceticacid
H HMDB0140294 0.0289 0.38 1.00* 0.21
2-hydroxy-3-(3-hydroxyphenyl)propanoic acid
H HMDB0140892 0.0289 0.38 1.00* 0.21
2,6-Dimethoxybenzoic acid H HMDB0029273 0.0289 0.38 1.00* 0.213-(2,3-dihydroxyphenyl)propanoic acid H HMDB0134042 0.0289 0.38 1.00* 0.213-(2,4-dihydroxyphenyl)propanoic acid H HMDB0126386 0.0289 0.38 1.00* 0.213-(2,5-dihydroxyphenyl)propanoic acid H HMDB0134043 0.0289 0.38 1.00* 0.213-(3-Hydroxyphenyl)-3-hydroxypropanoic acid
H HMDB0002643 0.0289 0.38 1.00* 0.21
3-(3,5-dihydroxyphenyl)propanoic acid H HMDB0125533 0.0289 0.38 1.00* 0.213-hydroxy-3-(4-hydroxyphenyl)propanoic acid
H HMDB0124923 0.0289 0.38 1.00* 0.21
3-Hydroxyphenyllactate H HMDB0029232 0.0289 0.38 1.00* 0.213,4-Dihydroxyhydrocinnamic acid H HMDB0000423 0.0289 0.38 1.00* 0.213,4-Dimethoxybenzoic acid H HMDB0059763 0.0289 0.38 1.00* 0.213,5-dimethoxybenzoic acid H HMDB0127495 0.0289 0.38 1.00* 0.214-Hydroxy-4-methyl-7-decenoic acidgamma-lactone
H HMDB0036191 0.0439 0.42 1.00* 0.21
5-Pentyl-3h-furan-2-one H HMDB0032463 0.0439 0.38 1.00* 0.216-(3-Hexenyl)tetrahydro-2H-pyran-2-one
H HMDB0037829 0.0439 0.41 1.00* 0.21
Allyl cyclohexylacetate H HMDB0040595 0.0439 0.41 1.00* 0.21cis-3-Hexenyl tiglate H HMDB0038279 0.0439 0.38 1.00* 0.21Furfuryl isovalerate H HMDB0039874 0.0075 0.38 1.00* 0.21Furfuryl pentanoate H HMDB0037727 0.0075 0.38 1.00* 0.21Isohomovanillic acid H HMDB0000333 0.0289 0.38 1.00* 0.21Maltol propionate H HMDB0037274 0.0289 0.38 1.00* 0.21Meta-hydroxyphenylhydracrylic Acid H HMDB0062595 0.0289 0.38 1.00* 0.21Methyl 4,8-decadienoate H HMDB0034708 0.0439 0.38 1.00* 0.21Peperinic acid H HMDB0038181 0.0075 0.38 1.00* 0.21
X-24807 Bethanechol H HMDB0015154 0.0054 0.64 1.00* 0.00Malonyl-Carnitin H HMDB0062496 0.0184 0.64 1.00* 0.00
X-24838 (2E)-1-3-[(3,3-dimethyloxiran-2-yl)methyl]-2,4,6-trihydroxyphenyl-3-phenylprop-2-en-1-one
H HMDB0129262 0.0017 0.22 1.00* 0.13
(2E)-3-(3-hydroxyphenyl)-1-[2,4,6-trihydroxy-3-(3-methylbut-2-en-1-yl)phenyl]prop-2-en-1-one
H HMDB0129266 0.0017 0.15 1.00* 0.13

227
Table continued (p. 16 / 20)Unknown Candidate Pool Database ID ∆Mass MSTC MSOC MFTCX-24838 (2E)-3-phenyl-1-[2,3,4,6-tetrahydroxy-
5-(3-methylbut-2-en-1-yl)phenyl]prop-2-en-1-one
H HMDB0129264 0.0017 0.15 1.00* 0.13
(2E)-3-phenyl-1-[2,4,6-trihydroxy-3-(4-hydroxy-3-methylbut-2-en-1-yl)phenyl]prop-2-en-1-one
H HMDB0129258 0.0017 0.15 1.00* 0.13
(2E)-3-phenyl-1-2,4,6-trihydroxy-3-[(2E)-4-hydroxy-3-methylbut-2-en-1-yl]phenylprop-2-en-1-one
H HMDB0129260 0.0017 0.15 1.00* 0.13
(S)-4’,5,7-Trihydroxy-3’-prenylflavanone
H HMDB0029866 0.0017 0.22 1.00* 0.13
(S)-4’,5,7-Trihydroxy-6-prenylflavanone
H HMDB0037247 0.0017 0.22 1.00* 0.13
1-(2,4-dihydroxyphenyl)-3-[4-hydroxy-3-(4-hydroxy-3-methylbut-2-en-1-yl)phenyl]prop-2-en-1-one
H HMDB0135875 0.0017 0.15 1.00* 0.13
1-(2,4-dihydroxyphenyl)-3-3-[(3,3-dimethyloxiran-2-yl)methyl]-4-hydroxyphenylprop-2-en-1-one
H HMDB0135878 0.0017 0.18 1.00* 0.13
1-(2,4-dihydroxyphenyl)-3-4-hydroxy-3-[(2E)-4-hydroxy-3-methylbut-2-en-1-yl]phenylprop-2-en-1-one
H HMDB0135876 0.0017 0.15 1.00* 0.13
1-(2H-1,3-benzodioxol-5-yl)-3-hydroxy-3-(4-methoxy-1-benzofuran-5-yl)propan-1-one
H HMDB0129367 0.0347 0.22 1.00* 0.13
1-(3,4-dihydroxyphenyl)-7-(3-methoxyphenyl)hept-1-ene-3,5-dione
H HMDB0133503 0.0017 0.26 1.00* 0.13
1-(4-hydroxy-3-methoxyphenyl)-3-(4-methoxy-1-benzofuran-5-yl)propane-1,3-dione
H HMDB0129392 0.0347 0.22 1.00* 0.13
1-[2,4-dihydroxy-6-methoxy-3-(3-methylbut-2-en-1-yl)phenyl]-3-phenylpropan-1-one
H HMDB0124921 0.0381 0.26 1.00* 0.13
1-Hydroxy-3,5-dimethoxy-2-prenylxanthone
H HMDB0041251 0.0017 0.18 1.00* 0.13
1,7-bis(3-methoxyphenyl)heptane-3,5-dione
H HMDB0133470 0.0381 0.34 1.00* 0.13
11-Hydroxytubotaiwine H HMDB0040799 0.0493 0.34 1.00* 0.1315-(3-methylbut-2-en-1-yl)-8,17-dioxatetracyclo[8.7.0.02,7.011,16]heptadeca-2,4,6,11(16),12,14-hexaene-3,5,14-triol
H HMDB0140717 0.0017 0.22 1.00* 0.13
15-(3-methylbut-2-en-1-yl)-8,17-dioxatetracyclo[8.7.0.02,7.011,16]heptadeca-2(7),3,5,11(16),12,14-hexaene-4,5,14-triol
H HMDB0140711 0.0017 0.18 1.00* 0.13
15-(3-methylbut-2-en-1-yl)-8,17-dioxatetracyclo[8.7.0.02,7.011,16]heptadeca-2(7),3,5,11(16),12,14-hexaene-5,13,14-triol
H HMDB0140712 0.0017 0.18 1.00* 0.13
15-(3-methylbut-2-en-1-yl)-8,17-dioxatetracyclo[8.7.0.02,7.011,16]heptadeca-2(7),3,5,11(16),12,14-hexaene-5,6,14-triol
H HMDB0140716 0.0017 0.18 1.00* 0.13
15-(4-hydroxy-3-methylbut-2-en-1-yl)-8,17-dioxatetracyclo[8.7.0.02,7.011,16]heptadeca-2(7),3,5,11(16),12,14-hexaene-5,14-diol
H HMDB0140713 0.0017 0.18 1.00* 0.13

228 B Supplements: Annotation of unknown metabolites
Table continued (p. 17 / 20)Unknown Candidate Pool Database ID ∆Mass MSTC MSOC MFTCX-24838 15-[(3,3-dimethyloxiran-2-yl)methyl]
-8,17-dioxatetracyclo[8.7.0.02,7.011,16]heptadeca-2(7),3,5,11(16),12,14-hexaene-5,14-diol
H HMDB0140715 0.0017 0.22 1.00* 0.13
15-Deacetylneosolaniol H HMDB0036157 0.0228 0.36 1.00* 0.132-O-(4-O-Methyl-a-D-glucopyranuronosyl)-D-xylose
H HMDB0029917 0.0288 0.28 1.00* 0.13
2-O-a-D-Galactopyranuronosyl-L-rhamnose
H HMDB0040159 0.0288 0.28 1.00* 0.13
2,2-Bis[4-(2,3-epoxypropoxy)phenyl]propane
H HMDB0032737 0.0381 0.15 1.00* 0.13
2’,4’-Dihydroxy-7-methoxy-8-prenylflavan
H HMDB0036401 0.0381 0.22 1.00* 0.13
2’,7-Dihydroxy-4’-methoxy-8-prenylflavan
H HMDB0036399 0.0381 0.22 1.00* 0.13
3-(2H-1,3-benzodioxol-5-yl)-3-hydroxy-1-(4-methoxy-1-benzofuran-5-yl)propan-1-one
H HMDB0129366 0.0347 0.22 1.00* 0.13
3-[2,4-dihydroxy-3-(3-methylbut-2-en-1-yl)phenyl]-1-(3,4-dihydroxyphenyl)prop-2-en-1-one
H HMDB0124802 0.0017 0.15 1.00* 0.13
3-[3,4-dihydroxy-5-(3-methylbut-2-en-1-yl)phenyl]-1-(2,4-dihydroxyphenyl)prop-2-en-1-one
H HMDB0135880 0.0017 0.15 1.00* 0.13
3-[4-hydroxy-2-methoxy-3-(3-methylbut-2-en-1-yl)phenyl]-1-(3-hydroxyphenyl)propan-1-one
H HMDB0124820 0.0381 0.22 1.00* 0.13
3-[4-hydroxy-3-(3-methylbut-2-en-1-yl)phenyl]-1-(2,4,5-trihydroxyphenyl)prop-2-en-1-one
H HMDB0135879 0.0017 0.15 1.00* 0.13
3-O-(4-O-Methyl-a-D-glucopyranuronosyl)-L-arabinose
H HMDB0039888 0.0288 0.28 1.00* 0.13
3,4,5-trihydroxy-6-(2-methyl-3-oxo-1-phenylpropoxy)oxane-2-carboxylicacid
H HMDB0133639 0.0136 0.27 1.00* 0.13
3,4,5-trihydroxy-6-(2-oxo-4-phenylbutoxy)oxane-2-carboxylicacid
H HMDB0133767 0.0136 0.27 1.00* 0.13
3,4,5-trihydroxy-6-(3-oxo-1-phenylbutoxy)oxane-2-carboxylicacid
H HMDB0133769 0.0136 0.27 1.00* 0.13
3,4,5-trihydroxy-6-(3-phenyloxirane-2-carbonyloxy)oxane-2-carboxylicacid
H HMDB0126548 0.0500 0.27 1.00* 0.13
3,4,5-trihydroxy-6-[(2-methyl-3-phenyloxiran-2-yl)methoxy]oxane-2-carboxylic acid
H HMDB0133653 0.0136 0.27 1.00* 0.13
3,4,5-trihydroxy-6-[(2-methyl-3-phenylpropanoyl)oxy]oxane-2-carboxylic acid
H HMDB0133675 0.0136 0.27 1.00* 0.13
3,4,5-trihydroxy-6-[(2-oxo-3-phenylpropanoyl)oxy]oxane-2-carboxylic acid
H HMDB0132501 0.0500 0.27 1.00* 0.13
3,4,5-trihydroxy-6-[(2,3,5-trihydroxy-6-methyloxan-4-yl)oxy]oxane-2-carboxylic acid
H HMDB0124752 0.0288 0.28 1.00* 0.13

229
Table continued (p. 18 / 20)Unknown Candidate Pool Database ID ∆Mass MSTC MSOC MFTCX-24838 3,4,5-trihydroxy-6-[(2E)-3-hydroxy-2-
(phenylmethylidene)propoxy]oxane-2-carboxylic acid
H HMDB0133645 0.0136 0.27 1.00* 0.13
3,4,5-trihydroxy-6-[(4-methoxy-1-benzofuran-6-yl)oxy]oxane-2-carboxylic acid
H HMDB0129410 0.0500 0.27 1.00* 0.13
3,4,5-trihydroxy-6-[1-(3-phenyloxiran-2-yl)ethoxy]oxane-2-carboxylic acid
H HMDB0133742 0.0136 0.27 1.00* 0.13
3,4,5-trihydroxy-6-[2-hydroxy-3-(3-oxoprop-1-en-1-yl)phenoxy]oxane-2-carboxylic acid
H HMDB0134051 0.0500 0.27 1.00* 0.13
3,4,5-trihydroxy-6-[2-hydroxy-6-(3-oxoprop-1-en-1-yl)phenoxy]oxane-2-carboxylic acid
H HMDB0134052 0.0500 0.27 1.00* 0.13
3,4,5-trihydroxy-6-[2-methoxy-4-(prop-2-en-1-yl)phenoxy]oxane-2-carboxylic acid
H HMDB0135244 0.0136 0.27 1.00* 0.13
3,4,5-trihydroxy-6-[3-(2-methyl-3-oxopropyl)phenoxy]oxane-2-carboxylicacid
H HMDB0133641 0.0136 0.27 1.00* 0.13
3,4,5-trihydroxy-6-[3-(3-oxobutyl)phenoxy]oxane-2-carboxylicacid
H HMDB0133771 0.0136 0.27 1.00* 0.13
3,4,5-trihydroxy-6-[4-(2-methyl-3-oxopropyl)phenoxy]oxane-2-carboxylicacid
H HMDB0133643 0.0136 0.27 1.00* 0.13
3,4,5-trihydroxy-6-[4-(3-oxobutyl)phenoxy]oxane-2-carboxylicacid
H HMDB0133773 0.0136 0.27 1.00* 0.13
3,4,5-trihydroxy-6-[4-hydroxy-2-(3-oxoprop-1-en-1-yl)phenoxy]oxane-2-carboxylic acid
H HMDB0134057 0.0500 0.27 1.00* 0.13
3,4,5-trihydroxy-6-[4-hydroxy-3-(3-oxoprop-1-en-1-yl)phenoxy]oxane-2-carboxylic acid
H HMDB0134056 0.0500 0.27 1.00* 0.13
3,4,5-trihydroxy-6-[(2E)-3-(3-hydroxyphenyl)prop-2-enoyl]oxyoxane-2-carboxylic acid
H HMDB0124974 0.0500 0.27 1.00* 0.13
3,4,5-trihydroxy-6-[(2E)-3-(4-hydroxyphenyl)prop-2-enoyl]oxyoxane-2-carboxylic acid
H HMDB0125165 0.0500 0.27 1.00* 0.13
3,4,5-trihydroxy-6-[(3E)-1-hydroxy-4-phenylbut-3-en-2-yl]oxyoxane-2-carboxylic acid
H HMDB0133733 0.0136 0.27 1.00* 0.13
3,4,5-trihydroxy-6-[(3E)-2-hydroxy-4-phenylbut-3-en-1-yl]oxyoxane-2-carboxylic acid
H HMDB0133732 0.0136 0.27 1.00* 0.13
3,4,5-trihydroxy-6-[3-(2-hydroxyphenyl)prop-2-enoyl]oxyoxane-2-carboxylic acid
H HMDB0134050 0.0500 0.27 1.00* 0.13
3,4,5-trihydroxy-6-[3-(3-hydroxyphenyl)prop-2-enoyl]oxyoxane-2-carboxylic acid
H HMDB0127984 0.0500 0.27 1.00* 0.13
3,4,5-trihydroxy-6-[3-(4-hydroxyphenyl)prop-2-enoyl]oxyoxane-2-carboxylic acid
H HMDB0128092 0.0500 0.27 1.00* 0.13

230 B Supplements: Annotation of unknown metabolites
Table continued (p. 19 / 20)Unknown Candidate Pool Database ID ∆Mass MSTC MSOC MFTCX-24838 3,4,5-trihydroxy-6-[3-(4-
methoxyphenyl)prop-2-en-1-yl]oxyoxane-2-carboxylic acid
H HMDB0135652 0.0136 0.27 1.00* 0.13
3,4,5-trihydroxy-6-2-[(1E)-3-hydroxy-2-methylprop-1-en-1-yl]phenoxyoxane-2-carboxylic acid
H HMDB0133657 0.0136 0.27 1.00* 0.13
3,4,5-trihydroxy-6-3-[(1E)-3-hydroxy-2-methylprop-1-en-1-yl]phenoxyoxane-2-carboxylic acid
H HMDB0133647 0.0136 0.27 1.00* 0.13
3,4,5-trihydroxy-6-3-[(1E)-3-hydroxybut-1-en-1-yl]phenoxyoxane-2-carboxylic acid
H HMDB0133736 0.0136 0.27 1.00* 0.13
3,4,5-trihydroxy-6-4-[(1E)-3-hydroxy-2-methylprop-1-en-1-yl]phenoxyoxane-2-carboxylic acid
H HMDB0133650 0.0136 0.27 1.00* 0.13
3,4,5-trihydroxy-6-4-[(1E)-3-hydroxybut-1-en-1-yl]phenoxyoxane-2-carboxylic acid
H HMDB0133739 0.0136 0.27 1.00* 0.13
3’-Ketolactose H HMDB0001030 0.0288 0.23 1.00* 0.134-[1-hydroxy-3-(5-methoxy-2,2-dimethyl-2H-chromen-6-yl)propyl]phenol
H HMDB0125851 0.0381 0.22 1.00* 0.13
4-3-[4-hydroxy-3-(3-methylbut-2-en-1-yl)phenyl]oxirane-2-carbonylbenzene-1,3-diol
H HMDB0135877 0.0017 0.22 1.00* 0.13
4-Deacetylneosolaniol H HMDB0036158 0.0228 0.36 1.00* 0.134-O-(4-O-Methyl-alpha-D-glucopyranuronosyl)-L-arabinose
H HMDB0039725 0.0288 0.28 1.00* 0.13
4-O-beta-D-Glucopyranuronosyl-L-fucose
H HMDB0039889 0.0288 0.28 1.00* 0.13
4’,7-Dihydroxy-2’-methoxy-3’-prenylisoflavan
H HMDB0034010 0.0381 0.18 1.00* 0.13
5-Deoxykievitone H HMDB0034214 0.0017 0.18 1.00* 0.135-Deoxymyricanone H HMDB0030799 0.0381 0.34 1.00* 0.136-(2-benzyl-3-oxopropoxy)-3,4,5-trihydroxyoxane-2-carboxylic acid
H HMDB0133636 0.0136 0.27 1.00* 0.13
6-[2-(2-carboxyeth-1-en-1-yl)phenoxy]-3,4,5-trihydroxyoxane-2-carboxylicacid
H HMDB0134049 0.0500 0.27 1.00* 0.13
6-[2-(3-formyloxiran-2-yl)phenoxy]-3,4,5-trihydroxyoxane-2-carboxylicacid
H HMDB0134059 0.0500 0.27 1.00* 0.13
6-[3-(2-carboxyeth-1-en-1-yl)phenoxy]-3,4,5-trihydroxyoxane-2-carboxylicacid
H HMDB0127983 0.0500 0.27 1.00* 0.13
6-[4-(2-carboxyeth-1-en-1-yl)phenoxy]-3,4,5-trihydroxyoxane-2-carboxylicacid
H HMDB0128091 0.0500 0.27 1.00* 0.13
6-2-[(1E)-2-carboxyeth-1-en-1-yl]phenoxy-3,4,5-trihydroxyoxane-2-carboxylic acid
H HMDB0141335 0.0500 0.27 1.00* 0.13
6-3-[(1E)-2-carboxyeth-1-en-1-yl]phenoxy-3,4,5-trihydroxyoxane-2-carboxylic acid
H HMDB0124973 0.0500 0.27 1.00* 0.13
6-4-[(1E)-2-carboxyeth-1-en-1-yl]phenoxy-3,4,5-trihydroxyoxane-2-carboxylic acid
H HMDB0125164 0.0500 0.27 1.00* 0.13

231
Table continued (p. 20 / 20)Unknown Candidate Pool Database ID ∆Mass MSTC MSOC MFTCX-24838 7-(3,4-dihydroxyphenyl)-1-(3-
methoxyphenyl)hept-1-ene-3,5-dioneH HMDB0133497 0.0017 0.26 1.00* 0.13
7-(4-hydroxy-3-methoxyphenyl)-1-(3-hydroxyphenyl)hept-1-ene-3,5-dione
H HMDB0133502 0.0017 0.26 1.00* 0.13
8-Acetyl-T2 tetrol H HMDB0036160 0.0228 0.36 1.00* 0.13Aesculin H HMDB0030820 0.0500 0.23 1.00* 0.13Cichoriin H HMDB0030821 0.0500 0.23 1.00* 0.13Citalopram N-oxide H HMDB0060654 0.0293 0.18 1.00* 0.13Desmethylxanthohumol H HMDB0030610 0.0017 0.15 1.00* 0.13Dihydro-O-methylsterigmatocystin H HMDB0030591 0.0347 0.18 1.00* 0.13Dolichin B H HMDB0029468 0.0017 0.22 1.00* 0.13Glyceollidin I H HMDB0034026 0.0017 0.20 1.00* 0.13Glyceollidin II H HMDB0037916 0.0017 0.20 1.00* 0.13Licocoumarone H HMDB0038755 0.0017 0.15 1.00* 0.13Linocinnamarin H HMDB0030678 0.0136 0.23 1.00* 0.13Lucanthone H HMDB0015607 0.0315 0.22 1.00* 0.13Morachalcone A H HMDB0040306 0.0017 0.15 1.00* 0.13Oenanthoside A H HMDB0035441 0.0136 0.23 1.00* 0.13Propiomazine H HMDB0014915 0.0315 0.22 1.00* 0.13Selinone H HMDB0037585 0.0017 0.22 1.00* 0.13Sulindac sulfide H HMDB0060614 0.0361 0.23 1.00* 0.13trans-isoeugenol-O-glucuronide H HMDB0060021 0.0136 0.27 1.00* 0.13Vulgaxanthin II H HMDB0029841 0.0387 0.26 1.00* 0.13
X-24860 Biotin R PCID 171548 0.0466 0.41 0.75 0.58*Carbidopa H HMDB0014336 0.0289 0.67* 0.92* 0.22gamma-Glutamylproline H HMDB0029157 0.0289 0.62 0.92* 0.22Glutamylproline H HMDB0028827 0.0289 0.62 0.92* 0.22Hydroxyprolyl-Hydroxyproline H HMDB0028864 0.0289 0.62 0.92* 0.22Hydroxyprolyl-Isoleucine H HMDB0028866 0.0075 0.70* 0.92* 0.22Hydroxyprolyl-Leucine H HMDB0028867 0.0075 0.70* 0.92* 0.22Isoleucyl-Hydroxyproline H HMDB0028908 0.0075 0.62 0.92* 0.22Isoleucyl-Isoleucine H HMDB0028910 0.0439 0.70* 0.92* 0.22Isoleucyl-Leucine H HMDB0028911 0.0439 0.70* 0.92* 0.22Leucyl-Hydroxyproline H HMDB0028930 0.0075 0.62 0.92* 0.22Leucyl-Isoleucine H HMDB0028932 0.0439 0.70* 0.92* 0.22Leucyl-Leucine H HMDB0028933 0.0439 0.70* 0.92* 0.22
X-24969 L-Cysteinylglycine disulfide H HMDB0000709 0.0069 0.61 1.00* 0.00X-24983 D-argininium(1+) R PCID 71070 0.0320 0.57 0.80 0.60*
Table B.11: Automatically selected candidate molecules676 candidate molecules (67 within the Recon-pool (R) and further 609 within the HMDB-pool (H)) have been automatically selected for 139 unknown metabolites based structuralsimilarity to neighboring known metabolites of our network model. Database identifierrefer to HMDB or PubChem. The last three columns contain the maximum values ofthe fingerprint Tanimoto (MFTC), structure Tanimoto (MSTC), and structure overlapcoefficients (MSOC). Asterisks point on values passing the threshold. A MFTC of 0.00indicates that the fingerprint of the related candidate was not available. A comprehensiveversion of this table including all evidences is provided in Supplemental File B.8.

232 B Supplements: Annotation of unknown metabolites
Experimental verification of candidate molecules
Candidate molecule: 9-tetradecenoic acidMonoisotopic mass: 226.193
Unknown metabolite: X-13069m/z: 225.4RI: 5380RT: 5.31Mode: LC-MS neg
MS2 Fragmentation spectrum: Unknown metaboliteMS2 Fragmentation spectrum: Candidate molecule
m/z m/z
Inte
nsity
Inte
nsity
Extracted ion chromatogram (EIC)
Base
pea
k in
tens
ity
Retention time
Matrix(unknown metabolite)
Candidate molecule
Candidate molecule+ Matrix
0
10000
20000
30000
40000
50000
60000
5.31
0
10000
20000
30000
40000
50000
60000
5.31
5.31
5.21 5.23 5.25 5.27 5.29 5.31 5.33 5.35 5.37 5.39 5.41
0
10000
20000
30000
40000
50000
60000
0
10
20
30
40
50
60
70
80
90
100
120 130 140 150 160 170 180 190 200 210 220 230 240
181.0 192.1198.2
207.3
225.2
0
10
20
30
40
50
60
70
80
90
100
120 130 140 150 160 170 180 190 200 210 220 230 240
127.0 181.1 191.9198.1
207.1
225.2
(a) Basic parameters
Candidate molecule: 9-tetradecenoic acidMonoisotopic mass: 226.193
Unknown metabolite: X-13069m/z: 225.4RI: 5380RT: 5.31Mode: LC-MS neg
MS2 Fragmentation spectrum: Unknown metaboliteMS2 Fragmentation spectrum: Candidate molecule
m/z m/z
Inte
nsity
Inte
nsity
Extracted ion chromatogram (EIC)
Base
pea
k in
tens
ity
Retention time
Matrix(unknown metabolite)
Candidate molecule
Candidate molecule+ Matrix
0
10000
20000
30000
40000
50000
60000
5.31
0
10000
20000
30000
40000
50000
60000
5.31
5.31
5.21 5.23 5.25 5.27 5.29 5.31 5.33 5.35 5.37 5.39 5.41
0
10000
20000
30000
40000
50000
60000
0
10
20
30
40
50
60
70
80
90
100
120 130 140 150 160 170 180 190 200 210 220 230 240
181.0 192.1198.2
207.3
225.2
0
10
20
30
40
50
60
70
80
90
100
120 130 140 150 160 170 180 190 200 210 220 230 240
127.0 181.1 191.9198.1
207.1
225.2
(b) Extracted ion chromatogram (EIC)
Candidate molecule: 9-tetradecenoic acidMonoisotopic mass: 226.193
Unknown metabolite: X-13069m/z: 225.4RI: 5380RT: 5.31Mode: LC-MS neg
MS2 Fragmentation spectrum: Unknown metaboliteMS2 Fragmentation spectrum: Candidate molecule
m/z m/z
Inte
nsity
Inte
nsity
Extracted ion chromatogram (EIC)
Base
pea
k in
tens
ity
Retention time
Matrix(unknown metabolite)
Candidate molecule
Candidate molecule+ Matrix
0
10000
20000
30000
40000
50000
60000
5.31
0
10000
20000
30000
40000
50000
60000
5.31
5.31
5.21 5.23 5.25 5.27 5.29 5.31 5.33 5.35 5.37 5.39 5.41
0
10000
20000
30000
40000
50000
60000
0
10
20
30
40
50
60
70
80
90
100
120 130 140 150 160 170 180 190 200 210 220 230 240
181.0 192.1198.2
207.3
225.2
0
10
20
30
40
50
60
70
80
90
100
120 130 140 150 160 170 180 190 200 210 220 230 240
127.0 181.1 191.9198.1
207.1
225.2
(c) MS2 fragmentation spectrum: candidate
Candidate molecule: 9-tetradecenoic acidMonoisotopic mass: 226.193
Unknown metabolite: X-13069m/z: 225.4RI: 5380RT: 5.31Mode: LC-MS neg
MS2 Fragmentation spectrum: Unknown metaboliteMS2 Fragmentation spectrum: Candidate molecule
m/z m/z
Inte
nsity
Inte
nsity
Extracted ion chromatogram (EIC)
Base
pea
k in
tens
ityRetention time
Matrix(unknown metabolite)
Candidate molecule
Candidate molecule+ Matrix
0
10000
20000
30000
40000
50000
60000
5.31
0
10000
20000
30000
40000
50000
60000
5.31
5.31
5.21 5.23 5.25 5.27 5.29 5.31 5.33 5.35 5.37 5.39 5.41
0
10000
20000
30000
40000
50000
60000
0
10
20
30
40
50
60
70
80
90
100
120 130 140 150 160 170 180 190 200 210 220 230 240
181.0 192.1198.2
207.3
225.2
0
10
20
30
40
50
60
70
80
90
100
120 130 140 150 160 170 180 190 200 210 220 230 240
127.0 181.1 191.9198.1
207.1
225.2
(d) MS2 fragmentation spectrum: X-13069
Figure B.6: Analytical comparison of 9-tetradecenoic acid and X-13069The EIC of each aliquot shows the same retention time: candidate molecule, referencematrix (containing the unknown metabolite), and candidate molecule + reference matrix.Both MS2 fragmentation spectra of the candidate molecule and the unknown metaboliteshow the same fragments with equal relative intensities leading to a verification of thecandidate molecule. I previously published this figure in Quell et al. 2017; reprinted bypermission from the Journal of Chromatography B [150].

233
Candidate molecule: 9-octadecenedioic acidMonoisotopic mass: 312.230
Unknown metabolite: X-11538m/z: 311.3RI: 4920RT: 4.86Mode: LC-MS neg
MS2 Fragmentation spectrum: Unknown metaboliteMS2 Fragmentation spectrum: Candidate molecule
m/z m/z
Inte
nsity
Inte
nsity
Extracted ion chromatogram (EIC)
Base
pea
k in
tens
ity
Retention time
Matrix(unknown metabolite)
Candidate molecule
Candidate molecule+ Matrix
01000020000300004000050000600007000080000
4.86
01000020000300004000050000600007000080000
4.89
4.89
4.79 4.81 4.83 4.85 4.87 4.89 4.91 4.93 4.95 4.97 4.99
01000020000300004000050000600007000080000
4.86
0
10
20
30
40
50
60
70
80
90
100
200 210 220 230 240 250 260 270 280 290 300 310 320
249.1
267.2
279.0
293.2
311.00
10
20
30
40
50
60
70
80
90
100
200 210 220 230 240 250 260 270 280 290 300 310 320
249.1
267.2 279.0
293.2
311.1
(a) Basic parameters
Candidate molecule: 9-octadecenedioic acidMonoisotopic mass: 312.230
Unknown metabolite: X-11538m/z: 311.3RI: 4920RT: 4.86Mode: LC-MS neg
MS2 Fragmentation spectrum: Unknown metaboliteMS2 Fragmentation spectrum: Candidate molecule
m/z m/z
Inte
nsity
Inte
nsity
Extracted ion chromatogram (EIC)
Base
pea
k in
tens
ity
Retention time
Matrix(unknown metabolite)
Candidate molecule
Candidate molecule+ Matrix
01000020000300004000050000600007000080000
4.86
01000020000300004000050000600007000080000
4.89
4.89
4.79 4.81 4.83 4.85 4.87 4.89 4.91 4.93 4.95 4.97 4.99
01000020000300004000050000600007000080000
4.86
0
10
20
30
40
50
60
70
80
90
100
200 210 220 230 240 250 260 270 280 290 300 310 320
249.1
267.2
279.0
293.2
311.00
10
20
30
40
50
60
70
80
90
100
200 210 220 230 240 250 260 270 280 290 300 310 320
249.1
267.2 279.0
293.2
311.1
(b) Extracted ion chromatogram (EIC)
Candidate molecule: 9-octadecenedioic acidMonoisotopic mass: 312.230
Unknown metabolite: X-11538m/z: 311.3RI: 4920RT: 4.86Mode: LC-MS neg
MS2 Fragmentation spectrum: Unknown metaboliteMS2 Fragmentation spectrum: Candidate molecule
m/z m/z
Inte
nsity
Inte
nsity
Extracted ion chromatogram (EIC)
Base
pea
k in
tens
ity
Retention time
Matrix(unknown metabolite)
Candidate molecule
Candidate molecule+ Matrix
01000020000300004000050000600007000080000
4.86
01000020000300004000050000600007000080000
4.89
4.89
4.79 4.81 4.83 4.85 4.87 4.89 4.91 4.93 4.95 4.97 4.99
01000020000300004000050000600007000080000
4.86
0
10
20
30
40
50
60
70
80
90
100
200 210 220 230 240 250 260 270 280 290 300 310 320
249.1
267.2
279.0
293.2
311.00
10
20
30
40
50
60
70
80
90
100
200 210 220 230 240 250 260 270 280 290 300 310 320
249.1
267.2 279.0
293.2
311.1
(c) MS2 fragmentation spectrum: candidate
Candidate molecule: 9-octadecenedioic acidMonoisotopic mass: 312.230
Unknown metabolite: X-11538m/z: 311.3RI: 4920RT: 4.86Mode: LC-MS neg
MS2 Fragmentation spectrum: Unknown metaboliteMS2 Fragmentation spectrum: Candidate molecule
m/z m/z
Inte
nsity
Inte
nsity
Extracted ion chromatogram (EIC)
Base
pea
k in
tens
ity
Retention time
Matrix(unknown metabolite)
Candidate molecule
Candidate molecule+ Matrix
01000020000300004000050000600007000080000
4.86
01000020000300004000050000600007000080000
4.89
4.89
4.79 4.81 4.83 4.85 4.87 4.89 4.91 4.93 4.95 4.97 4.99
01000020000300004000050000600007000080000
4.86
0
10
20
30
40
50
60
70
80
90
100
200 210 220 230 240 250 260 270 280 290 300 310 320
249.1
267.2
279.0
293.2
311.00
10
20
30
40
50
60
70
80
90
100
200 210 220 230 240 250 260 270 280 290 300 310 320
249.1
267.2 279.0
293.2
311.1
(d) MS2 fragmentation spectrum: X-11538
Figure B.7: Analytical comparison of 9-octadecenedioic acid and X-11538The EIC of 9-octadecenedioic acid and X-11538 show slightly shifted retention times (4.89and 4.86 min). Both MS2 fragmentation spectra are similar, but not identical: two mainpeaks at 249.1 and 293.2 show equal relative intensities, but two smaller peaks at 267.2 and279.1 are much larger for the plasma compared to the candidate aliquot. In summary thiscandidate must be falsified. I previously published this figure in Quell et al. 2017; reprintedby permission from the Journal of Chromatography B [150].

234 B Supplements: Annotation of unknown metabolites
Candidate molecules:
Monoisotopic mass: 156.115
Unknown metabolite: X-11859m/z: 155.2RI: 4553RT: 4.46Mode: LC-MS neg
Extracted ion chromatogram (EIC): 2-nonenoic acid
Base
pea
k in
tens
ity
Retention time
Matrix(unknown metabolite)
Candidate molecule
Candidate molecule+ Matrix
Extracted ion chromatogram (EIC): 8-nonenoic acidExtracted ion chromatogram (EIC): 3-nonenoic acid
Base
pea
k in
tens
ity
Base
pea
k in
tens
ity
Retention timeRetention time
2-nonenoic acid3-nonenoic acid8-nonenoic acid 0
250050007500
100001250015000
4.46
0250050007500
100001250015000 4.55
4.55
4.41 4.43 4.45 4.47 4.49 4.51 4.53 4.55 4.57 4.59 4.61 4.63 4.65
0250050007500
100001250015000
0
5000
10000
15000
20000
4.46
0
5000
10000
15000
20000 4.31
4.31
4.21 4.24 4.27 4.30 4.33 4.36 4.39 4.42 4.45 4.48 4.51 4.54 4.57 4.60
0
5000
10000
15000
20000
0e+00
2e+04
4e+04
6e+04
8e+04
1e+05
4.46
0e+00
2e+04
4e+04
6e+04
8e+04
1e+05 4.54
4.54
4.24 4.27 4.30 4.33 4.36 4.39 4.42 4.45 4.48 4.51 4.54 4.57 4.60 4.63 4.66 4.69 4.72
0e+00
2e+04
4e+04
6e+04
8e+04
1e+05
4.46
4.46
4.31
4.31
4.46
Matrix(unknown metabolite)
Candidate molecule
Candidate molecule+ Matrix
Matrix(unknown metabolite)
Candidate molecule
Candidate molecule+ Matrix
(a) Basic parameters
Candidate molecules:
Monoisotopic mass: 156.115
Unknown metabolite: X-11859m/z: 155.2RI: 4553RT: 4.46Mode: LC-MS neg
Extracted ion chromatogram (EIC): 2-nonenoic acid
Base
pea
k in
tens
ity
Retention time
Matrix(unknown metabolite)
Candidate molecule
Candidate molecule+ Matrix
Extracted ion chromatogram (EIC): 8-nonenoic acidExtracted ion chromatogram (EIC): 3-nonenoic acid
Base
pea
k in
tens
ity
Base
pea
k in
tens
ity
Retention timeRetention time
2-nonenoic acid3-nonenoic acid8-nonenoic acid 0
250050007500
100001250015000
4.46
0250050007500
100001250015000 4.55
4.55
4.41 4.43 4.45 4.47 4.49 4.51 4.53 4.55 4.57 4.59 4.61 4.63 4.65
0250050007500
100001250015000
0
5000
10000
15000
20000
4.46
0
5000
10000
15000
20000 4.31
4.31
4.21 4.24 4.27 4.30 4.33 4.36 4.39 4.42 4.45 4.48 4.51 4.54 4.57 4.60
0
5000
10000
15000
20000
0e+00
2e+04
4e+04
6e+04
8e+04
1e+05
4.46
0e+00
2e+04
4e+04
6e+04
8e+04
1e+05 4.54
4.54
4.24 4.27 4.30 4.33 4.36 4.39 4.42 4.45 4.48 4.51 4.54 4.57 4.60 4.63 4.66 4.69 4.72
0e+00
2e+04
4e+04
6e+04
8e+04
1e+05
4.46
4.46
4.31
4.31
4.46
Matrix(unknown metabolite)
Candidate molecule
Candidate molecule+ Matrix
Matrix(unknown metabolite)
Candidate molecule
Candidate molecule+ Matrix
(b) Extracted ion chromatogram (EIC)
Candidate molecules:
Monoisotopic mass: 156.115
Unknown metabolite: X-11859m/z: 155.2RI: 4553RT: 4.46Mode: LC-MS neg
Extracted ion chromatogram (EIC): 2-nonenoic acid
Base
pea
k in
tens
ity
Retention time
Matrix(unknown metabolite)
Candidate molecule
Candidate molecule+ Matrix
Extracted ion chromatogram (EIC): 8-nonenoic acidExtracted ion chromatogram (EIC): 3-nonenoic acid
Base
pea
k in
tens
ity
Base
pea
k in
tens
ity
Retention timeRetention time
2-nonenoic acid3-nonenoic acid8-nonenoic acid 0
250050007500
100001250015000
4.46
0250050007500
100001250015000 4.55
4.55
4.41 4.43 4.45 4.47 4.49 4.51 4.53 4.55 4.57 4.59 4.61 4.63 4.65
0250050007500
100001250015000
0
5000
10000
15000
20000
4.46
0
5000
10000
15000
20000 4.31
4.31
4.21 4.24 4.27 4.30 4.33 4.36 4.39 4.42 4.45 4.48 4.51 4.54 4.57 4.60
0
5000
10000
15000
20000
0e+00
2e+04
4e+04
6e+04
8e+04
1e+05
4.46
0e+00
2e+04
4e+04
6e+04
8e+04
1e+05 4.54
4.54
4.24 4.27 4.30 4.33 4.36 4.39 4.42 4.45 4.48 4.51 4.54 4.57 4.60 4.63 4.66 4.69 4.72
0e+00
2e+04
4e+04
6e+04
8e+04
1e+05
4.46
4.46
4.31
4.31
4.46
Matrix(unknown metabolite)
Candidate molecule
Candidate molecule+ Matrix
Matrix(unknown metabolite)
Candidate molecule
Candidate molecule+ Matrix
(c) MS2 fragmentation spectrum: candidate
Candidate molecules:
Monoisotopic mass: 156.115
Unknown metabolite: X-11859m/z: 155.2RI: 4553RT: 4.46Mode: LC-MS neg
Extracted ion chromatogram (EIC): 2-nonenoic acid
Base
pea
k in
tens
ity
Retention time
Matrix(unknown metabolite)
Candidate molecule
Candidate molecule+ Matrix
Extracted ion chromatogram (EIC): 8-nonenoic acidExtracted ion chromatogram (EIC): 3-nonenoic acid
Base
pea
k in
tens
ity
Base
pea
k in
tens
ity
Retention timeRetention time
2-nonenoic acid3-nonenoic acid8-nonenoic acid 0
250050007500
100001250015000
4.46
0250050007500
100001250015000 4.55
4.55
4.41 4.43 4.45 4.47 4.49 4.51 4.53 4.55 4.57 4.59 4.61 4.63 4.65
0250050007500
100001250015000
0
5000
10000
15000
20000
4.46
0
5000
10000
15000
20000 4.31
4.31
4.21 4.24 4.27 4.30 4.33 4.36 4.39 4.42 4.45 4.48 4.51 4.54 4.57 4.60
0
5000
10000
15000
20000
0e+00
2e+04
4e+04
6e+04
8e+04
1e+05
4.46
0e+00
2e+04
4e+04
6e+04
8e+04
1e+05 4.54
4.54
4.24 4.27 4.30 4.33 4.36 4.39 4.42 4.45 4.48 4.51 4.54 4.57 4.60 4.63 4.66 4.69 4.72
0e+00
2e+04
4e+04
6e+04
8e+04
1e+05
4.46
4.46
4.31
4.31
4.46
Matrix(unknown metabolite)
Candidate molecule
Candidate molecule+ Matrix
Matrix(unknown metabolite)
Candidate molecule
Candidate molecule+ Matrix
(d) MS2 fragmentation spectrum: X-11859
Figure B.8: Analytical comparison of 2-, 3-, and 8-nonenoic acid and X-11859Candidates 2-nonenoic acid, 3-noneoic acid, or 8-noneoic acid and the unknown metaboliteX-11859 have different retention time peaks in their EICs. Partially, there common mass-to-charge ratios in the MS2 fragmentation spectra (not shown), but their relative intensities aredifferent. In summary these candidates must be falsified. I previously published this figurein Quell et al. 2017; reprinted by permission from the Journal of Chromatography B [150].

235
Unknown Candidate m/z RTU RTC MS2U signals MS2C signals MatchX-13891 2-dodecenedioic acid 227.1 2.77 2.77 165.1, 183.0, 209.1 165.0, 183.0, 209.1 yesX-13069 9-tetradecenoic acid 225.4 5.31 5.31 225.2, 207.1 225.2, 207.3 yesX-11538 9-octadecenedioic acid 311.3 4.86 4.89 249.1, 293.2, 267.2,
279.0249.1, 293.2, 267.2,279.0
no
X-11859 2-nonenoic acid 155.2 4.46 4.55 110.8, 82.0, 155.2,123.1, 136.9
155.0, 111.1 no
X-11859 3-nonenoic acid 155.2 4.46 4.54 110.8, 82.0, 155.2, 111.1, 155.0, 137.1 no4.31 123.1, 136.9 155.0, 137.0 no
X-11859 8 nonenoic acid 155.2 4.46 4.31 110.8, 82.0, 155.2,123.1, 136.9
155.0, 137.0 no
Table B.12: Evaluation of manually selected candidate moleculesRT and main MS2 fragments of LC-MS measurements are juxtaposed for manually selectedcandidate molecules (C) and respective unknown metabolites (U), ordered by intensitydescending. Both characteristics match for two candidate molecules (verification) anddiffers in four cases (falsification). I previously published this table in Quell et al. 2017;reprinted by permission from the Journal of Chromatography B [150].

236 B Supplements: Annotation of unknown metabolites
Supplemental filesSupplemental files of Chapter 4 are provided as online-supplements and on the at-tached CD (cf. Index of external material on page 239).
Part_II_UnknownAnnotation/Supplemental_File_B.1_Network_Model.rar
File B.1: Toolbox with R scripts and example dataThe zip file contains implementations for all modules of the metabolite characterizationapproach in R along with input data, sample outputs, and a instruction. I published partsof this file previously in Quell et al. 2017 [150]. This version is extended by major parts,such as by the automated candidate selection.
Part_II_UnknownAnnotation/Supplemental_File_B.2_Network_SUMMIT.graphml
File B.2: Graphml file of a representation of the network model based on SUMMITThe network model embeds 254 measured unknown metabolites into their biochemicaland functional context. The model was constructed based on 758 measured metabolites(439 known, 319 unknown), 2 626 metabolites of the public database Recon and1 782 genes. For clarity, elements of Recon are incorporated only if they are either directlyor through a gene connected to a measured metabolite. Not-connected metabolites andgenes are not shown. Edge and node colors are equal to the network representation inFigure 4.1. I previously published this file in Quell et al. 2017; republished by permissionfrom the Journal of Chromatography B [150].
Part_II_UnknownAnnotation/Supplemental_File_B.3_unknownAnnotations_SUMMIT.xlsx
File B.3: Automatically generated annotations of the SUMMIT data setThe automatic workflow annotated 180 unknown metabolites with predicted pathwaysand selected reactions for 109 unknown metabolites based on 2 279 blood samples ofSUMMIT. Moreover, the file contains information regarding the measurement of unknownmetabolites and neighboring metabolites and genes within the network model. I previouslypublished this file in Quell et al. 2017; republished by permission from the Journal ofChromatography B [150].

237
Part_II_UnknownAnnotation/Supplemental_File_B.4_Network_GCKD.graphml
File B.4: Graphml file of a representation of the network model based on GCKDThe network model embeds 482 measured unknown metabolites into their biochemicaland functional context. The model was constructed based on 1 456 measured metabolites(796 known, 660 unknown), 706 metabolites of the public database Recon and 435 genes.For clarity, elements of Recon are incorporated only if they are either directly or through agene connected to a measured metabolite. Not-connected metabolites and genes are notshown. Edge and node colors are equal to the network representation in Figure 4.1.
Part_II_UnknownAnnotation/Supplemental_File_B.5_unknownAnnotations_GCKD.xlsx
File B.5: Automatically generated annotations of the GCKD data setThe automatic workflow annotated 273 unknown metabolites with predicted pathwaysand selected reactions for 297 unknown metabolites based on 1 209 blood samples ofGCKD. Moreover, the file contains information regarding the measurement of unknownmetabolites and neighboring metabolites and genes within the network model.
Part_II_UnknownAnnotation/Supplemental_File_B.6_Network_SUMMIT_GCKD.graphml
File B.6: Graphml file of the network model based on merged SUMMIT/GCKDThe network model embeds 677 measured unknown metabolites into their biochemicaland functional context. The model was constructed based on 1 824 measured metabolites(984 known, 840 unknown), 865 metabolites of the public database Recon and 529 genes.For clarity, elements of Recon are incorporated only if they are either directly or through agene connected to a measured metabolite. Not-connected metabolites and genes are notshown. Edge and node colors are equal to the network representation in Figure 4.1.
Part_II_UnknownAnnotation/Supplemental_File_B.7_unknownAnnotations_SUMMIT_GCKD.xlsx
File B.7: Automatically generated annotations of merged SUMMIT/GCKDThe automatic workflow annotated 435 unknown metabolites with predicted pathways andselected reactions for 384 unknown metabolites based on the merged sets of SUMMIT andGCKD. Moreover, the file contains information regarding the measurement of unknownmetabolites and neighboring metabolites and genes within the network model.

238 B Supplements: Annotation of unknown metabolites
Part_II_UnknownAnnotation/Supplemental_File_B.8_autoSelectedCandidates.xlsx
File B.8: Evidences for automatically selected candidate molecules676 candidate molecules (67 within the Recon-pool (R) and further 609 within theHMDB-pool (H)) have been automatically selected for 139 unknown metabolites basedstructural similarity to neighboring known metabolites of our network model. FingerprintTanimoto, structure Tanimoto, and structure overlap coefficients are specified for eachknown neighbor of unknown metabolites to the respective database compound. Afingerprint Tanimoto coefficient of 0.00 indicates that the fingerprint of the relatedcandidate was not available. the Evidences column summarizes information that supportsthe candidate molecule. An overview on automatically selected candidate molecules isprovided in Table B.11.

Index of external materials
Supplemental materials are provided on the attached CD and as online-supplement(stable URL: https://DissertationQuell.page.link/Supplements).
Description Path
Supplemental material of Chapter 3 Part_I_LipidCompositions/Supplemental_
Suppl. Table A.1: Qualitative com-position of PCs measured by Abso-luteIDQTM
..Table_A.1_QualitativeComp.xlsx
Suppl. Table A.2: Qualitative compo-sition of measured PCs and ranges ofmetabolite levels per platform
..Table_A.2_Ranges.xlsx
Suppl. Table A.3: Stability of factorsf describing PC compositions
..Table_A.3_Stability.xlsx
Suppl. Table A.4: Replication of fac-tors f and imputation in QMDiab
..Table_A.4_Replication.xlsx
Suppl. Table A.5: Explained variationof PCs measured on the lipid specieslevel
..Table_A.5_LinearModel.xlsx
Suppl. Figure A.1: Details of PC com-positions
..Figure_A.1_CompDetails.pdf
Suppl. Figure A.2: Factors f in Hu-Met and QMDiab of PC compositions
..Figure_A.2_Replication_factor.pdf
Suppl. Figure A.3: Distributions ofmeasured and imputed PC concentra-tions
..Figure_A.3_Replication_conz.pdf
239

240 Index of external material
Description Path
Supplemental material ofChapter 4
Part_II_UnknownAnnotation/Supplemental_
Suppl. File B.1: Network mo-del with R scripts and exam-ple data
..File_B.1_Network_Model.rar
Suppl. File B.2: Graphml fileof a representation of the net-work model based on SUM-MIT
..File_B.2_Network_SUMMIT.graphml
Suppl. File B.3: Automati-cally generated annotationsof the SUMMIT data set
..File_B.3_unknownAnnotations_SUMMIT.xlsx
Suppl. File B.4: Graphml fileof a representation of the net-work model based on GCKD
..File_B.4_Network_GCKD.graphml
Suppl. File B.5: Automati-cally generated annotationsof the GCKD data set
..File_B.5_unknownAnnotations_GCKD.xlsx
Suppl. File B.6: Graphml fileof the network model basedon merged SUMMIT/GCKD
..File_B.6_Network_SUMMIT_GCKD.graphml
Suppl. File B.7: Automati-cally generated annotationsof merged SUMMIT/GCKD
..File_B.7_unknownAnnotations_SUMMIT_GCKD.xlsx
Suppl. File B.8: Evidences forautomatically selected candi-date molecules
..File_B.8_autoSelectedCandidates.xlsx

List of figures
1.1 Functional elements of a tandem mass spectrometer . . . . . . . . . . . . 41.2 Comparison of correlation networks and Gaussian graphical models . . . 141.3 Process for characterization of unknown metabolites . . . . . . . . . . . . 21
3.1 Platform precision levels for notation and measurement . . . . . . . . . . 493.2 Quantitative compositions of PCs measured on the lipid species level and
respective PCs measured on the the fatty acid level . . . . . . . . . . . . 533.3 Factors f in HuMet and QMDiab . . . . . . . . . . . . . . . . . . . . . . 573.4 Relative deviation of measured vs. imputed median metabolite levels . . 583.5 Deviation and mean of PCs measured on different platforms . . . . . . . 59
4.1 Graphical representation of the integrated network model . . . . . . . . . 714.2 Neighborhood definition and automated annotation schema . . . . . . . . 734.3 Quantities of predicted pathways in SUMMIT and GCKD . . . . . . . . 774.4 Composition of predicted super pathways in SUMMIT and GCKD . . . . 784.5 Quantities of commonly predicted pathways in SUMMIT and GCKD . . 824.6 Schema of automated selection of candidate molecules . . . . . . . . . . . 844.7 Distributions of coefficients during cross-validation . . . . . . . . . . . . 854.8 Number of selected candidates per molecule during validation . . . . . . 864.9 Number of selected candidates per unknown metabolite . . . . . . . . . . 874.10 Number of selected candidates per selection criterion . . . . . . . . . . . 904.11 Neighboring metabolites of X-13891 . . . . . . . . . . . . . . . . . . . . . 914.12 Analytical comparison of 2-dodecenedioic acid and X-13891 . . . . . . . . 934.13 UML diagram of Metabolite Collection database . . . . . . . . . . . . . . 95
A.1 Details of PC compositions . . . . . . . . . . . . . . . . . . . . . . . . . . 145A.2 Factors f in HuMet and QMDiab of PC compositions . . . . . . . . . . . 146A.3 Distributions of measured and imputed PC concentrations . . . . . . . . 147
241

242 List of figures
B.1 Basic elements of the unknown characterization procedure . . . . . . . . 151B.2 Network model: stepwise data integration procedure (SUMMIT) . . . . . 153B.3 Difference in retention index of dehydrogenation reactants . . . . . . . . 165B.4 Neighbors of X-24834 in sets of GCKD and SUMMIT . . . . . . . . . . . 198B.5 Neighboring metabolites of X-11905 and X-11538 . . . . . . . . . . . . . 198B.6 Analytical comparison of 9-tetradecenoic acid and X-13069 . . . . . . . . 232B.7 Analytical comparison of 9-octadecenedioic acid and X-11538 . . . . . . . 233B.8 Analytical comparison of 2-, 3-, and 8-nonenoic acid and X-11859 . . . . 234
List of tables
2.1 Candidate molecules for experimental verification . . . . . . . . . . . . . 44
3.1 Multiple reaction monitoring leading to different precision levels . . . . . 483.2 Isobaric phosphatidylcholine sums within mass resolution of the MS device 513.3 Quantitative composition of phosphatidylcholines . . . . . . . . . . . . . 55
4.1 Properties of metabolite characterization approaches . . . . . . . . . . . 684.2 Proportion of unknown metabolites with predicted pathways . . . . . . . 744.3 Summary of assigned reactions based on ∆mass and neighborship . . . . 754.4 Super pathways predicted commonly in SUMMIT and GCKD . . . . . . 794.5 Super pathways predicted in merged sets of SUMMIT and GCKD . . . . 824.6 Pathways predicted in only in the merged set of SUMMIT and GCKD . 834.7 Empirically determined cutoffs for automated candidate selection . . . . 864.8 Selected candidate molecules based on Recon . . . . . . . . . . . . . . . 894.9 Automatically annotated and manually preselected candidate molecules . 92
A.1 Qualitative composition of PCs measured by AbsoluteIDQTM . . . . . . 143A.2 Qualitative composition of measured PCs and ranges of metabolite levels
per platform . . . . . . . . . . . . . . . . . . . . . . . . . . . . . . . . . 143A.3 Stability of factors f describing PC compositions . . . . . . . . . . . . . 144A.4 Replication of factors f and imputation in QMDiab . . . . . . . . . . . . 144A.5 Explained variation of PCs measured on the lipid species level . . . . . . 144
B.1 Cross-validation of the pathway prediction module . . . . . . . . . . . . 154B.2 Predicted super and sub pathways of unknown metabolites . . . . . . . . 159B.3 Predicted reactions based on mass differences and network relations . . . 164B.4 Predicted dehydrogenation/ reduction reactions . . . . . . . . . . . . . . 166
243

244 List of tables
B.5 Predicted super pathways of unknown metabolites in SUMMIT/GCKD,SUMMIT, and GCKD . . . . . . . . . . . . . . . . . . . . . . . . . . . . 182
B.6 Predicted sub pathways of unknown metabolites in SUMMIT/GCKD,SUMMIT, and GCKD . . . . . . . . . . . . . . . . . . . . . . . . . . . . 195
B.7 Predicted sub pathways of unknown metabolites measured in SUMMITand GCKD . . . . . . . . . . . . . . . . . . . . . . . . . . . . . . . . . . 197
B.8 Manually selected candidate molecules basted on HMDB compounds . . 200B.9 Parameters determined during cross-validation of candidate selection . . 201B.10 Evidences of automatically selected candidate molecules (Recon) . . . . 210B.11 Automatically selected candidate molecules . . . . . . . . . . . . . . . . 231B.12 Evaluation of manually selected candidate molecules . . . . . . . . . . . 235

List of abbreviations
ANOVA analysis of varianceBMI body mass indexCN correlation networkCV coefficient of variationDMS differential ion mobility spectrometryEIC extracted ion chromatogramESI electrospray ionizationFIA flow injection analysisFN false negativeFP false positiveGC gas chromatographyGCKD German chronic kidney diseaseGGM Gaussian graphical modelHILIC hydrophilic interaction liquid chromatographyHMDB Human Metabolome DatabaseHuMet Human MetabolomeInChI International Chemical IdentifierKEGG Kyoto Encyclopedia of Genes and GenomesKORA Cooperative Health Research in the Augsburg RegionLC liquid chromatographylysoPC lysophosphatidylcholineMALDI matrix-assisted laser desorption/ ionizationMCS maximum common substructureMFTC maximum fingerprint Tanimoto coefficientmGWAS metabolite-based genome-wide association studyMRM multiple reaction monitoringMS mass spectrometry
245

246 List of abbreviations
MS/MS tandem mass spectrometryMSOC maximum MCS overlap coefficientMSTC maximum MCS Tanimoto coefficientMWAS metabolome-wide association studyNAKO national cohortNMR nuclear magnetic resonanceOGTT oral glucose tolerance testOLTT oral lipid tolerance testPAT physical activity testPC phosphatidylcholineppm parts per millionQC quality controlQMDiab Qatar Metabolomics Study on DiabetesRI retention indexRP reversed phaseRT retention timeSD standard deviationSDF structure data fileSLD standard liquid dietSM sphingomyelinSMARTS SMILES arbitrary target specificationSMILES Simplified Molecular Input Line Entry SystemSNP single nucleotide polymorphismSUMMIT surrogate markers for micro- and macro-vascular hard endpoints
for innovative Diabetes toolsTIC total ion chromatogramTN true negativeTOF time of flightTP true positiveXML extensible markup language

Teaching activity
Taking care of training students was one of my special concerns during my early stagecareer. I organized, prepared and/ or performed the following lectures, seminars andpractical trainings that were open to bachelor or master students in Bioinformat-ics, Informatics, Biology, or Molecular Biotechnology of the Technical University ofMunich and (co-) supervised the following theses. Furthermore, I absolved didactictrainings to receive the certificate ‘Hochschullehre der Bayerischen Universitäten –Vertiefungsstufe’.
Summer term 2018
• Exercise course ‘Einführung in die Bioinformatik II’
• Guest lecture in ‘Einführung in die Bioinformatik II’, topic: protein structure,June 2018
Winter term 2017/ 18
• Exercise course ‘Einführung in die Bioinformatik I’
Summer term 2017
• Exercise course ‘Einführung in die Bioinformatik II’
• Guest lecture in ‘Einführung in die Bioinformatik II’, topic: protein structuresand -prediction, May 2017
• Supervision of the thesis ‘Gender differences in the effect of medications onhuman blood metabolomes’, Luise Schuller
247

248 Teaching activity
Winter term 2016/ 17
• Exercise course ‘Einführung in die Bioinformatik I’
• Practical training ‘Genomorientierte Bioinformatik’
Summer term 2016
• Exercise course ‘Einführung in die Bioinformatik II’
• Practical training ‘Masterpraktikum Bioinformatik’
• Practical training ‘Angewandte Bioinformatik’
• Guest lecture in ‘Einführung in die Bioinformatik II’, topic: protein structuresand -prediction, Juni 2016
Winter term 2015/ 16
• Exercise course ‘Einführung in die Bioinformatik I’
• Practical training ‘Genomorientierte Bioinformatik’
Summer term 2015
• Supervision of a student’s group for the practical training ‘MasterpraktikumBioinformatik’
Summer term 2014
• Supervision of the thesis ‘Prioritizing pathways and genes linked to rare mi-tochondriopathies based on metabolic extremes in individual patients’, ReneSchoeffel
Winter term 2013/ 14
• Exercise course ‘Einführung in die Bioinformatik I’
• Supervision of a student’s group for the practical training ‘GenomorientierteBioinformatik’
Related Documents


