Technische Universität München Institut für Energietechnik Lehrstuhl für Thermodynamik Deflagration-to-Detonation Transition and Detonation Propagation in H 2 -Air Mixtures with Transverse Concentration Gradients Lorenz Rupprecht Böck Vollständiger Abdruck der von der Fakultät für Maschinenwesen der Technischen Universität München zur Erlangung des akademischen Grades eines DOKTOR –I NGENIEURS genehmigten Dissertation. Vorsitzender: Univ.-Prof. Rafael Macián-Juan, Ph.D. Prüfer der Dissertation: 1. Univ.-Prof. Dr.-Ing. Thomas Sattelmayer 2. Prof. Dag Bjerketvedt, Ph.D. Telemark University College, Porsgrunn/ Norwegen Die Dissertation wurde am 27.03.2015 bei der Technischen Universität München eingereicht und durch die Fakultät für Maschinenwesen am 11.06.2015 angenommen.

Welcome message from author
This document is posted to help you gain knowledge. Please leave a comment to let me know what you think about it! Share it to your friends and learn new things together.
Transcript
Technische Universität MünchenInstitut für Energietechnik
Lehrstuhl für Thermodynamik
Deflagration-to-Detonation Transition and
Detonation Propagation in H2-Air Mixtures with
Transverse Concentration Gradients
Lorenz Rupprecht Böck
Vollständiger Abdruck der von der Fakultät für Maschinenwesen derTechnischen Universität München zur Erlangung des akademischen Gradeseines
DOKTOR – INGENIEURS
genehmigten Dissertation.
Vorsitzender:Univ.-Prof. Rafael Macián-Juan, Ph.D.
Prüfer der Dissertation:1. Univ.-Prof. Dr.-Ing. Thomas Sattelmayer2. Prof. Dag Bjerketvedt, Ph.D.Telemark University College, Porsgrunn/ Norwegen
Die Dissertation wurde am 27.03.2015 bei der Technischen Universität München eingereicht
und durch die Fakultät für Maschinenwesen am 11.06.2015 angenommen.


to Kurt

Acknowledgements
This work has emerged from a research project conducted at the Institute ofThermodynamics, Technical University of Munich, under the supervision ofProf. Thomas Sattelmayer. It was funded by the German Federal Ministry ofEconomic Affairs and Energy (BMWi) on the basis of a decision by the GermanBundestag (project no. 1501425) which is gratefully acknowledged.
I would like to extend my sincere gratitude to Prof. Thomas Sattelmayer whoprovided me with a large degree of freedom to shape the project accordingto my ideas, with outstanding scientific infrastructure and generous supportfor international experiences. Furthermore, I owe my gratitude to Prof. DagBjerketvedt for being the second examiner in my committee, and to Prof.Rafael Macián-Juan for taking over the examination chairmanship.
My time as a visiting researcher at Caltech in 2014 gave me new perspectivesand fresh motivation. Thank you Prof. Joseph E. Shepherd for inviting me towork in your group and for opening doors for the future. Besides research, itwas a truly fulfilling experience to work with Prof. Wolfgang Polifke as a teach-ing assistant for Heat and Mass Transfer at TUM. Last but not least, the inves-tigation at hand benefits greatly from the support of colleagues and students.In particular, I want to thank Frederik Berger, Thomas Fiala, Josef Haßlbergerand Vera Hoferichter for their contributions and their friendship.
This final line is reserved for my mom. I deeply thank you for your love. I amproud of you.
Lorenz R. Böck Garching, 24.06.2015
vi

Kurzfassung
Explosionen in H2–Luft Gemischen stellen ein zentrales Sicherheitsrisikoin Kernkraftwerken dar. Jüngstes Beispiel ist die nukleare Katastrophe inFukushima Daiichi im Jahr 2011. Abhängig von Initialbedingungen sowievon der einschließenden Geometrie können verschiedene Explosionsregimesmit stark unterschiedlichen Auswirkungen erreicht werden. Der sogenannteÜbergang von Deflagration zu Detonation (DDT) bedeutet hierbei denSchlimmstfall.
Bei realen Unfällen liegen vor der Explosion meist räumliche Gradienten derH2 Konzentration vor, da H2 aufgrund seiner geringen Dichte zur Schicht-bildung neigt. Umfassendes Wissen zu Explosionen in homogenen Mischun-gen ist vorhanden, es existiert jedoch ein deutliches Wissensdefizit bezüglichinhomogener Gemische. Die vorliegende Arbeit greift dieses an. Es werdenein-dimensionale Konzentrationsgradienten betrachtet, welche senkrechtzur Hauptausbreitungsrichtung der Explosionsfront orientiert sind. Explo-sionsversuche in H2–Luft wurden in einem Kanal in Laborgröße durchgeführt.Sowohl DDT, als auch Detonationsausbreitung wurden untersucht. Zeitlichhochaufgelöste (laser-) optische Messtechniken kamen zur Anwendung.
Konzentrationsgradienten können verglichen mit homogenen Mischungenzu erheblich stärkeren Explosionen führen und damit höhere Überdrücke,Flammengeschwindigkeiten und höhere DDT-Wahrscheinlichkeit bewirken.Die Annahme homogener Mischung in Sicherheitsbetrachtungen ist dahermeist nicht konservativ. Zugrundeliegende physikalische Mechanismen wer-den identifiziert und quantifiziert. Analytische Verbrennungsmodelle sowieBerechnungen kompressibler Strömung mit detaillierter chemischer Kinetikunterstützen den Aufbau eines umfassenden physikalischen Verständnisses.
viii

Abstract
Explosion of H2–air mixtures portrays a major hazard in nuclear reactors dur-ing severe loss-of-coolant accidents. A recent example is the Fukushima Dai-ichi nuclear disaster in 2011. Depending on initial conditions and features ofthe enclosing geometry, different explosion regimes with a wide range of ex-plosion impact can occur. The so-called deflagration-to-detonation transition(DDT) represents the worst-case scenario.
Spatial gradients in H2 concentration prevail in real-world scenarios, mainlybecause H2 stratifies in air due to its low density. Extensive knowledge onexplosions in homogeneous mixtures has been accumulated over the lastdecades. However, a significant knowledge gap exists regarding the influenceof mixture inhomogeneity.
This knowledge gap is addressed in the present work. H2–air mixtures withone-dimensional concentration gradients, oriented normal to the main di-rection of explosion front propagation, were studied experimentally in a lab-oratory scale explosion channel. Both DDT and the detonation regime wereinvestigated. Advanced (laser-) optical measurement techniques at high tem-poral resolution were applied.
It can clearly be stated that mixture inhomogeneity can lead to significantlystronger explosions in terms of overpressure, flame speed and probability ofDDT than homogeneous mixtures. Assuming homogeneous H2 distributionin explosion safety considerations is therefore often not conservative. The un-derlying physical mechanisms are identified and quantified in the presentwork. Besides experimental results, low-order combustion models and com-putations of compressible flow with detailed chemical kinetics support thedevelopment of a comprehensive physical understanding.
x

Contents
1 Introduction 1
1.1 Deflagration-to-Detonation Transition . . . . . . . . . . . . . . . 31.2 Mixture Inhomogeneity in H2–Air Explosions . . . . . . . . . . . 41.3 Goals and Structure of this Work . . . . . . . . . . . . . . . . . . . 4
2 Physics and Chemical Kinetics of H2–Air Explosions in Tubes 7
2.1 Overview of H2–Air Explosions . . . . . . . . . . . . . . . . . . . . 82.2 Reactive Compressible Flow . . . . . . . . . . . . . . . . . . . . . . 112.3 Chemical Kinetics of the H2–O2 System . . . . . . . . . . . . . . . 132.4 Ignition Mechanisms . . . . . . . . . . . . . . . . . . . . . . . . . . 172.5 Flame Acceleration . . . . . . . . . . . . . . . . . . . . . . . . . . . 21
2.5.1 Laminar Deflagration . . . . . . . . . . . . . . . . . . . . . 222.5.2 Cellular Deflagration . . . . . . . . . . . . . . . . . . . . . . 252.5.3 Slow Turbulent Deflagration . . . . . . . . . . . . . . . . . 302.5.4 Fast Turbulent Deflagration . . . . . . . . . . . . . . . . . . 39
2.6 Onset of Detonation . . . . . . . . . . . . . . . . . . . . . . . . . . 452.7 Detonation . . . . . . . . . . . . . . . . . . . . . . . . . . . . . . . . 50
2.7.1 One-Dimensional Analysis . . . . . . . . . . . . . . . . . . 502.7.2 Three-Dimensional Structure . . . . . . . . . . . . . . . . . 53
2.8 Mixture Inhomogeneity . . . . . . . . . . . . . . . . . . . . . . . . 562.8.1 Parallel Concentration Gradients . . . . . . . . . . . . . . . 562.8.2 Transverse Concentration Gradients . . . . . . . . . . . . . 57
3 Experimental Setup 61
3.1 Overview, Geometry and Configurations . . . . . . . . . . . . . . 613.2 Generation of Transverse Concentration Gradients . . . . . . . . 643.3 Summary of Experimental Procedure . . . . . . . . . . . . . . . . 66
xii
4 Measurement Techniques 68
4.1 Conventional Measurement Techniques . . . . . . . . . . . . . . 684.1.1 Time-of-Arrival Photodiodes . . . . . . . . . . . . . . . . . 694.1.2 Piezoelectric Pressure Transducers . . . . . . . . . . . . . . 704.1.3 Soot-Foils . . . . . . . . . . . . . . . . . . . . . . . . . . . . 74
4.2 Optical Measurement Techniques . . . . . . . . . . . . . . . . . . 754.2.1 Shadowgraphy . . . . . . . . . . . . . . . . . . . . . . . . . 754.2.2 High-Speed OH Planar Laser-Induced Fluorescence . . . 784.2.3 OH* Luminescence . . . . . . . . . . . . . . . . . . . . . . . 91
5 DDT in H2–Air with Transverse Concentration Gradients 94
5.1 Flame Acceleration . . . . . . . . . . . . . . . . . . . . . . . . . . . 955.1.1 Flame Shape and Structure . . . . . . . . . . . . . . . . . . 955.1.2 Flame Speed and Run-Up Distances . . . . . . . . . . . . . 118
5.2 Onset of Detonation . . . . . . . . . . . . . . . . . . . . . . . . . . 1295.2.1 Unobstructed Channel . . . . . . . . . . . . . . . . . . . . . 1305.2.2 Obstructed Channel Configurations . . . . . . . . . . . . . 1345.2.3 Chemical Kinetics of Shock-Induced Strong Ignition . . . 143
5.3 Relation Between Flame Speed and Peak Overpressure . . . . . . 1495.4 Discussion . . . . . . . . . . . . . . . . . . . . . . . . . . . . . . . . 153
5.4.1 Critical Flame Mach Number for Onset of Detonation . . 1535.4.2 Comparison of Unobstructed and Obstructed Channels . 1555.4.3 Comments on the Orientation of Concentration Gradients 159
6 Detonation in H2–Air with Transverse Concentration Gradients 161
6.1 Reference Experiments in Homogeneous Mixtures . . . . . . . . 1636.2 Overview of Propagation Regimes . . . . . . . . . . . . . . . . . . 165
6.2.1 Detonation Velocity . . . . . . . . . . . . . . . . . . . . . . 1656.2.2 Shadowgraph and OH* Luminescence Images . . . . . . . 166
6.3 Single-Headed Propagation . . . . . . . . . . . . . . . . . . . . . . 1686.3.1 Shadowgraph Images . . . . . . . . . . . . . . . . . . . . . 1686.3.2 OH* Luminescence Images . . . . . . . . . . . . . . . . . . 1706.3.3 Soot Foils . . . . . . . . . . . . . . . . . . . . . . . . . . . . . 172
6.4 Multi-Headed Propagation . . . . . . . . . . . . . . . . . . . . . . 1736.5 Discussion . . . . . . . . . . . . . . . . . . . . . . . . . . . . . . . . 175
xiii
7 Summary and Outlook 180
Appendix 185
A Concentration Gradient Profiles 186
B Tunable Dye Laser Absorption Spectroscopy of the OH Q1(6) Line 188
Previous Publications 191
Supervised Student Theses 194
Bibliography 196
xiv
List of Figures
2.1 Overview of the DDT process. . . . . . . . . . . . . . . . . . . . . . 102.2 Definition of states in a shock-reaction zone complex propagat-
ing to the right. . . . . . . . . . . . . . . . . . . . . . . . . . . . . . 112.3 P-T-explosion diagram of H2-O2, adapted from [23, 92]. . . . . . 152.4 Exemplary experimental flame speed plot with characteristic
phases of FA. Measured speed (●) and illustrative fit (red line). . 212.5 Laminar initial flame propagation in 2D. Detail of the laminar
flame front (right). . . . . . . . . . . . . . . . . . . . . . . . . . . . 222.6 Unstretched laminar burning velocity SL of H2–air at standard
temperature and pressure [81]. Data sources: ● [34], � [162], ⋆[146], △ [72], + [149]. Red line: approximation by Eq. (2.29). . . . 24
2.7 OH-PLIF images of cellular flames in homogeneous H2–air mix-tures. . . . . . . . . . . . . . . . . . . . . . . . . . . . . . . . . . . . 25
2.8 Illustration of hydromechanic (Landau-Darrieus) instability. . . 262.9 Illustration of preferential diffusion of limiting component. . . . 272.10 Illustration of diffusive-thermal instability, adapted from [20]. . 282.11 Experimentally determined Lewis number Le of H2–air mixtures
as a function of equivalence ratio Φ [139]. . . . . . . . . . . . . . . 292.12 Experimentally determined Markstein length as a function of
equivalence ratio Φ. Data sources: ● [14], � [29]. . . . . . . . . . 302.13 Combustion regime diagram with representative OH-PLIF im-
ages. Interpretation of FA process (red arrow). . . . . . . . . . . . 322.14 OH-PLIF sequence of a slow turbulent deflagration, unob-
structed channel, 15 vol. %, homogeneous mixture. v̄ = 35 m/s. . 332.15 Shadowgraph and OH-PLIF sequences of a slow turbulent defla-
gration, obstructed channel, 12.5 vol. %, homogeneous mixture.v̄ = 40 m/s. Red box represents OH-PLIF FOV. . . . . . . . . . . . 35
xv
2.16 Shadowgraph and OH-PLIF sequences of a slow turbulent defla-gration, obstructed channel, 15 vol. %, homogeneous mixture. v̄= 120 m/s. Red box represents OH-PLIF FOV. . . . . . . . . . . . . 37
2.17 Shadowgraph and OH-PLIF sequences of a turbulent deflagra-tion, obstructed channel, 20 vol. %, homogeneous mixture. v̄ =300 m/s. Red box represents OH-PLIF FOV. . . . . . . . . . . . . . 38
2.18 Shadowgraph sequence of shock formation process, obstructedchannel, 20 vol. %, homogeneous mixture. v̄ = 300 m/s. . . . . . 40
2.19 Shadowgraph sequence of shock-flame interaction, obstructedchannel, 25 vol. %, homogeneous mixture. v̄ = 440 m/s. . . . . . 41
2.20 Shadowgraph sequence of shocks ahead of a flame approachingan obstacle, obstructed channel, 30 vol. %, homogeneous mix-ture. v̄ = 660 m/s. . . . . . . . . . . . . . . . . . . . . . . . . . . . . 43
2.21 Shadowgraph image of a fast turbulent deflagration, obstructedchannel, 15 vol. %, homogeneous mixture. v̄ = 880 m/s. . . . . . 44
2.22 Shadowgraph image of a fast turbulent deflagration, unob-structed channel, 30 vol. %, homogeneous mixture. v̄ = 860 m/s. 44
2.23 Simulated temperature fields for shock-induced ignition in stoi-chiometric ethylene-air mixture [111]. . . . . . . . . . . . . . . . . 46
2.24 Hugoniot diagram with Rayleigh lines (blue; red) and CJ tan-gency solutions. . . . . . . . . . . . . . . . . . . . . . . . . . . . . . 51
2.25 ZND structure of a CJ detonation, 30 vol. % H2 in air. Temper-ature and dimensionless heat release rate (a), mole fractions ofmajor species (b) and minor species (c). . . . . . . . . . . . . . . 52
2.26 Two-dimensional detonation pattern. Shock waves and shearlayer (blue lines); reaction zones (red regions); cellular pattern(grey lines). Adapted from [93] and [2]. . . . . . . . . . . . . . . . 54
2.27 Experimental detonation cell width λ as a function of equiva-lence ratio Φ for H2–air [69]. Data sources: ♦ [57] (293 K, 101.3kPa), + [143] (298 K, 101.3 kPa), × [5] (293 K, 82.7 kPa). Red line:approximation by Eq. (2.40). . . . . . . . . . . . . . . . . . . . . . 55
3.1 Schematic of experimental setup, exemplary configuration OS5.Facility top view (top) and explosion volume cross section (bot-tom). . . . . . . . . . . . . . . . . . . . . . . . . . . . . . . . . . . . 62
xvi
3.2 Obstacle geometry. Side view. . . . . . . . . . . . . . . . . . . . . . 633.3 Top obstacles BR60 (a), BR30 (b) and injection manifold (c).
Cross sectional cut through injection plane. . . . . . . . . . . . . 633.4 Creation of transverse concentration gradients. Gas injection
(1), deflection (2), diffusion (3), formed gradients (4). Side view. 653.5 H2 injection port pattern in a standard channel segment. Top view. 653.6 Exemplary concentration gradient profiles from CFD simula-
tions [42]. Variation of td between 3 and 60 s at 20 vol. % (a); vari-ation of average H2 concentration between 12.5 and 30 vol. % attd = 3 s (b). . . . . . . . . . . . . . . . . . . . . . . . . . . . . . . . . 66
4.1 Schematic of photodiode (PD, red symbols) and pressure trans-ducer (p1–p7, green symbols) locations. Configuration OS5. Topview. . . . . . . . . . . . . . . . . . . . . . . . . . . . . . . . . . . . . 68
4.2 Mounting of photodiodes, adapted from [40]. . . . . . . . . . . . 704.3 Voltage signals from photodiodes corresponding to velocity plot
Fig. 2.4. . . . . . . . . . . . . . . . . . . . . . . . . . . . . . . . . . . 714.4 Dimensionless amplitude A over dimensionless angular fre-
quency ω for the underdamped driven harmonic oscillator. . . . 724.5 Example for thermal shock. Transducers 1 (green line), 2 (blue
line) and 3 (red line, with thermal shock causing a negative offsetindicated by arrows). . . . . . . . . . . . . . . . . . . . . . . . . . . 73
4.6 Principle of schlieren visualization. Light rays are deflected byspatial gradients in refractive index and blocked by a knife edge. 76
4.7 Schematic of the shadowgraphy setup used in the present work,top view. . . . . . . . . . . . . . . . . . . . . . . . . . . . . . . . . . 77
4.8 Jablonski diagram for the A2Σ+–X2
Πi electronic band system ofOH with fluorescence in (0,0), adapted from [77]. . . . . . . . . . 79
4.9 Excitation scan for OH, LIFBASE [100], T = 2000 K. Wavelengthconversion from vacuum to air according to Morton [107]. . . . 81
4.10 Schematic of the OH-PLIF laser system, adapted from [134]. . . 824.11 OH-PLIF synchronization scheme. Negative edges of camera ex-
posure and trigger signals not depicted. . . . . . . . . . . . . . . . 864.12 OH-PLIF sequence of a slow flame, v̄ = 50 m/s, BR00, OS5, 20 vol.
%, homogeneous, FOV width 98 mm, SNR 20–50. . . . . . . . . . 87
xvii
4.13 OH-PLIF sequence of a fast flame, v̄ = 380 m/s, BR00, OS5, 25 vol.%, homogeneous, FOV width 91 mm, SNR 2–5. . . . . . . . . . . 88
4.14 OH-PLIF sequence of a fast flame, v̄ = 900 m/s, BR00, OS5, 30 vol.%, homogeneous, FOV width 97 mm, SNR < 1. . . . . . . . . . . . 90
4.15 Temperature field shortly before onset of detonation. CFD sim-ulation [42]. 25 vol. %, inhomogeneous mixture, td = 3 s. . . . . . 92
4.16 Schematic of OH* luminescence imaging setups used for deto-nation (a, top) and deflagration (b, bottom) experiments. Top view. 93
5.1 Simulated concentration gradient profiles and derived parame-ters corresponding to experiments presented in Sec. 5.1.1 withtd = 3 s. Flammability limits not considered. . . . . . . . . . . . . 97
5.2 Shadowgraph images, 20 vol. %, OS1 (FOV centered at x = 0.3 m),BR00. Red dashed line represents FOV of OH-PLIF images (Fig.5.3). . . . . . . . . . . . . . . . . . . . . . . . . . . . . . . . . . . . . 98
5.3 OH-PLIF images, 20 vol. %, OS1, BR00. . . . . . . . . . . . . . . . 985.4 Rear parts of flames, td = 3 s, OS1 (FOV centered at x = 0.3 m),
BR00. Variation of XH2. Red dashed line represents approximatedlower bound of flammable region. . . . . . . . . . . . . . . . . . . 99
5.5 Shadowgraph images, 20 vol. %, OS3 (FOV centered at x = 2.1 m),BR00. Red dashed line represents FOV of OH-PLIF images (Figs.5.6, 5.7, 5.8). . . . . . . . . . . . . . . . . . . . . . . . . . . . . . . . 103
5.6 OH-PLIF images, 20 vol. %, OS3, BR00. Variation of td. . . . . . . 1045.7 OH-PLIF images, td = 3 s, OS3, BR00. Variation of XH2. . . . . . . 1055.8 OH-PLIF images, 30 vol. %, td = 3 s, showing Kelvin-Helmholtz
instability. . . . . . . . . . . . . . . . . . . . . . . . . . . . . . . . . 1065.9 Shadowgraph images, 20 vol. %, OS5 (FOV centered at x = 3.9 m),
BR00. Red dashed line represents FOV of OH-PLIF images (Fig.5.10). . . . . . . . . . . . . . . . . . . . . . . . . . . . . . . . . . . . 107
5.10 OH-PLIF images, 20 vol. %, OS5, BR00. Variation of td. . . . . . . 1085.11 Shadowgraph images, 15 vol. %, td = 60 s, OS2 (FOV centered at x
= 1.2 m), BR30S300. Red and green dashed lines represent FOVsof OH-PLIF images (Fig. 5.12). . . . . . . . . . . . . . . . . . . . . 109
5.12 OH-PLIF images, 15 vol. %, td = 60 s, OS2, BR30S300. Upstream(left) and downstream (right) of obstacle. . . . . . . . . . . . . . . 110
xviii
5.13 Shadowgraph images, 15 vol. %, td = 3 s, OS2 (FOV centered at x= 1.2 m), BR30S300. Red and green dashed lines represent FOVsof OH-PLIF images (Fig. 5.14). . . . . . . . . . . . . . . . . . . . . 111
5.14 OH-PLIF images, 15 vol. %, td = 3 s, OS2, BR30S300. Upstream(left) and downstream (right) of obstacle. . . . . . . . . . . . . . . 112
5.15 Shadowgraph images, 15 vol. %, td = 60 s, OS3 (FOV centered atx = 2.1 m), BR30S300. Green dashed line represents FOV of OH-PLIF images (Fig. 5.17). . . . . . . . . . . . . . . . . . . . . . . . . . 113
5.16 Shadowgraph images, 15 vol. %, td = 3 s, OS3 (FOV centered at x =2.1 m), BR30S300. Green dashed line represents FOV of OH-PLIFimages (Fig. 5.17). . . . . . . . . . . . . . . . . . . . . . . . . . . . . 114
5.17 OH-PLIF images, 15 vol. %, OS3, BR30S300. FOV upstream of ob-stacle. . . . . . . . . . . . . . . . . . . . . . . . . . . . . . . . . . . . 115
5.18 Shadowgraph images, 15 vol. %, td = 60 s, OS2 (FOV centered atx = 1.2 m), BR60S300. . . . . . . . . . . . . . . . . . . . . . . . . . . 116
5.19 Shadowgraph images, 15 vol. %, td = 3 s, OS2 (FOV centered at x= 1.2 m), BR60S300. . . . . . . . . . . . . . . . . . . . . . . . . . . . 117
5.20 Flame velocity along the channel at 22.5 vol. % and varying td (a);local flame speed at x = 2.05 m at varying XH2 and td (b). BR00. . 119
5.21 Run-up distances to are (a) and 0.95 apr (b). BR00. . . . . . . . . . 119
5.22 Local flame speed at x = 2.05 m. BR60S300 (a); BR30S300 (b). . . 121
5.23 Run-up distances to are (a) and 0.95 apr (b). BR60S300. . . . . . . 122
5.24 Run-up distances to are (a) and 0.95 apr (b). BR30S300. . . . . . . 122
5.25 Effective expansion ratio σeff (a); effective laminar burning ve-locity SL,eff (b); effective flame speed (SLσ)eff (c). . . . . . . . . . . 125
5.26 Comparison of dimensionless experimental run-up distance Eand calculated effective flame speed M. BR60S300 (a); BR00 (b). 128
5.27 Shadowgraph sequence and pressure traces of onset of detona-tion, 35 vol. %, td = 7.5 s, OS5 (FOV centered at x = 3.9 m, xp4 = 3.2m, xp5 = 3.9 m, xp6 = 4.7 m), BR00. . . . . . . . . . . . . . . . . . . . 131
5.28 Probability of DDT in BR00 as a function of average (a) and max-imum (b) H2 concentration. . . . . . . . . . . . . . . . . . . . . . . 132
xix
5.29 Shadowgraph sequence and pressure traces of onset of detona-tion, 16.5 vol. %, td = 60 s, OS5 (FOV centered at x = 3.9 m, xp4 =3.2 m, xp5 = 3.9 m, xp6 = 4.7 m), BR30S300L. . . . . . . . . . . . . . 135
5.30 Shadowgraph sequence and pressure traces of onset of detona-tion, 17 vol. %, td = 3 s, OS5 (FOV centered at x = 3.9 m, xp4 = 3.2m, xp5 = 3.9 m, xp6 = 4.7 m), BR30S300L. . . . . . . . . . . . . . . . 138
5.31 Shadowgraph sequence of onset of detonation, 22.5 vol. %, td =3 s, OS3 (FOV centered at x = 2.1 m), BR30S300. . . . . . . . . . . 139
5.32 Shadowgraph sequence of onset of detonation, 22.5 vol. %, td =3 s, OS3 (FOV centered at x = 2.1 m), BR60S300. . . . . . . . . . . 139
5.33 Shadowgraph sequence of onset of detonation, 26 vol. %, td = 3s, OS2 (FOV centered at x = 1.2 m), BR60S300. . . . . . . . . . . . 140
5.34 Shadowgraph sequence of onset of detonation, 30 vol. %, td = 3s, OS2 (FOV centered at x = 1.2 m), BR60S300. . . . . . . . . . . . 141
5.35 Shadowgraph sequence of onset of detonation, 35 vol. %, td = 3s, OS2 (FOV centered at x = 1.2 m), BR60S300. . . . . . . . . . . . 141
5.36 Reduced effective activation energy θ (color plot), post-incident(black dashed line) and post-reflected-shock states (red dashedline), extended second explosion limit (black dotted line). 30 vol.% H2–air mixture. . . . . . . . . . . . . . . . . . . . . . . . . . . . . 146
5.37 Reduced effective activation energy θ as a function of post-reflected-shock (p1r,abs) and post-incident-shock (p1,abs) pressure. 147
5.38 Correlation between overpressure p and global flame Machnumber MF in BR00 (a), p and local flame Mach numberMF,y=0.06m in BR00 (b) and p and MF,y=0.06m in BR30S300L (c).Black line: quadratic fit (Eq. (5.11)). Blue dotted line: model byKrok [83]. . . . . . . . . . . . . . . . . . . . . . . . . . . . . . . . . . 151
6.1 Concentration gradient profiles of detonation experiments fromCFD simulations [42]. Variation of td at 25 vol. % (a); variation ofaverage H2 concentration at td = 3 s (b). . . . . . . . . . . . . . . . 161
6.2 Pressure trace diagram, 22.5 vol. %, td = 3 s, BR60S300. Detona-tion velocity measurement between p4 (blue, xp4 = 3.2 m) and p6
(orange, xp6 = 5.0 m). . . . . . . . . . . . . . . . . . . . . . . . . . . 163
xx
6.3 Detonation velocity at different average H2 concentrations andgradients. Dimensional (a) and dimensionless (b) depiction. . . 164
6.4 Shadowgraph images of detonations in homogeneous mixtures. 1646.5 Shadowgraph (left) and OH* luminescence (right) images of det-
onation fronts at varying td and an average H2 concentration of25 vol. %. . . . . . . . . . . . . . . . . . . . . . . . . . . . . . . . . . 167
6.6 Shadowgraph sequences of detonations at an average H2 con-centration of 25 vol. % and td = 3 s. Columns represent two sep-arate experiments. . . . . . . . . . . . . . . . . . . . . . . . . . . . 169
6.7 OH* luminescence sequence of a detonation at an average H2
concentration of 25 vol. % and td = 3 s. . . . . . . . . . . . . . . . . 1716.8 Soot foils of detonations at an average H2 concentration of 30
vol. %. Homogeneous (top) and gradient mixture (bottom, td = 3s). . . . . . . . . . . . . . . . . . . . . . . . . . . . . . . . . . . . . . 172
6.9 Shadowgraph (left) and OH* (right) images of detonation frontsat td = 3 s, 35 (top) and 40 vol. % (bottom). . . . . . . . . . . . . . 173
6.10 Soot foils of detonations at an average H2 concentration of 40vol. %. Homogeneous (top) and gradient mixture (bottom, td = 3s). . . . . . . . . . . . . . . . . . . . . . . . . . . . . . . . . . . . . . 174
6.11 Detonation cell width profiles corresponding to Fig. 6.1. Onlycases with available optical data are displayed. . . . . . . . . . . 176
B.1 TDLAS measurement of a laminar H2–O2 diffusion flame at ele-vated pressure. Absorption α as a function of wavelength λ andpressure. . . . . . . . . . . . . . . . . . . . . . . . . . . . . . . . . . 189
xxi
List of Tables
2.1 Flammability limits of H2–air at standard temperature and pres-sure [24]. . . . . . . . . . . . . . . . . . . . . . . . . . . . . . . . . . 24
3.1 Geometrical configurations discussed in the present work. . . . 64
4.1 Photodiode positions for standard and optical segments, relativeto upstream segment edge. . . . . . . . . . . . . . . . . . . . . . . 69
4.2 Pressure transducer positions for standard and optical seg-ments, relative to upstream segment edge. . . . . . . . . . . . . . 69
5.1 Model constants C for RUDpr in BR00. . . . . . . . . . . . . . . . . 1295.2 Local precursor shock Mach number shortly before onset of det-
onation, corresponding to shadowgraph sequences in Sec. 5.2.2. 154
6.1 Average detonation cell width, detonable height and observeddetonation regimes, corresponding to Fig. 6.11 (a). . . . . . . . . 177
6.2 Average detonation cell width, detonable height and observeddetonation regimes, corresponding to Fig. 6.11 (b). . . . . . . . . 178
A.1 Polynomial coefficients of Eq. (A.1) describing concentrationgradient profiles, deduced from CFD simulations by Ettner [42]. 187
xxii
Nomenclature
Latin Symbols
A Pre-exponential Arrhenius constantA Surface area [m2]a Speed of sound [m/s]a Thermal diffusivity [m2/s]b Damping coefficient [N-s/m]c Speed of light [m/s]cp Specific heat capacity [J/kg-K]D Detonation velocity [m/s]D Diffusion coefficient [m2/s]d Diameter [m]Ea Activation energy [J/mol]F Force [N]f Focal length [m]g0
m Standard-state Gibbs enthalpy [J/mol]H Channel height [m]h Enthalpy [J/kg]h Planck constant [J-s]h Obstacle height [m]k Reaction rate coefficientk Spring constant [N/m]L Length [m]l Length [m]M Molar mass [kg/kmol]m Mass [kg]
xxiii
n Arrhenius constant [-]p Pressure [bar]q Specific heat [J/kg]R Gas constant [J/mol-K]S Burning velocity [m/s]T Temperature [K]t Time [s]U Voltage [V]u Flow velocity [m/s]v Flame speed [m/s]x,y,z Cartesian coordinates [m]
Greek Symbols
α Absorption [-]α Angle [rad]β Zeldovich number [-]γ Specific heat capacity ratio [-]ǫ Viscous dissipation rate [m2/s3]η Dynamic viscosity [Pa-s]θ Reduced effective activation energy [-]λ Detonation cell width [m]λ Wavelength [m]ν Kinematic viscosity [m2/s]ν Specific volume [m3/kg]ρ Density [kg/m3]σ Expansion ratio [-]τ Time [s]Φ Circle of confusion [Px]Φ Equivalence ratio [-]φ Model parameter [-]ω Angular frequency [1/s]
xxiv
Superscripts
∗ Excited state of a molecule′ RMS value
Subscripts
a Activationabs AbsoluteC ChannelCJ Chapman-Jouguetd Diffusioneff EffectiveF Flamegrad Gradienthom Homogeneousind InductionL LaminarM Marksteinpr Productsr Reflectedre ReactantsS Stretchedstoich StoichiometricT TurbulentVN Von Neumannδ Heat release zoneη Kolmogorov parameters
xxv
Nondimensional Parameters
A Dimensionless amplitudeC Flame acceleration model parameterK Karlovitz stretch factorKa Karlovitz numberLe Lewis numberM Mach numberMa Markstein numberX Mole fraction, Volume fraction
Acronyms
BR Obstacle blockage ratioCFD Computational fluid dynamicsCJ Chapman-JouguetDDT Deflagration-to-detonation transitionFA Flame accelerationFOV Field of viewFWHM Full width at half maximumHMPGI Hybrid multiple-prism grazing-incidenceKH Kelvin-HelmholtzLOCA Loss-of-Coolant AccidentMIE Minimum ignition energyNd : YAG Neodymium-doped yttrium aluminium garnetNd : YVO4 Neodynmium-doped yttrium orthovanadateOS Optical segmentPD PhotodiodePLIF Planar laser-induced fluorescenceR6G Rhodamine 6G, Rhodamine 590RET Rotational energy transferRM Richtmyer-MeshkovRT Rayleigh-Taylor
xxvi
RUD Run-up distanceS Obstacle spacingSNR Signal-to-noise ratioSWACER Shock wave amplification by coherent energy releaseTDLAS Tunable dye laser absorption spectroscopyVET Vibrational energy transferZND Zeldovich-von Neumann-Döring
xxvii
1 Introduction
Fuel release—flammable cloud formation—ignition—explosion. This se-quence of events is commonly involved in explosion accidents, posing a majorhazard in industry besides fires and natural catastrophies. Gas, vapor and dustexplosions are most relevant leading to worldwide losses in the billions eachyear. Not only direct damage of industrial plants needs to be considered, butalso secondary costs due to business interruptions in highly globalized valuechain structures with a high degree of consolidation, which may exceed thedirect explosion damage. A high number of severe injuries and fatalities eachyear shows the tragic side of explosion accidents. Large explosion accidentsdraw great public attention and can have unforseeable social and political im-pact.
In the 17th and 18th century, when coal mining developed in Europe, explo-sion of natural gas and coal dusts in coal mines occurred frequently, mostlywith fatal consequences for miners involved. This motivated Sir HumphreyDavy to develop the explosion-safe Davy lamp that reduced the number ofaccidents drastically. However, still nowadays explosion in mines is a serioushazard which cost about 20,000 lives between 1900 and 1970 [38]. Similar toSir Humphrey Davy’s early scientific efforts, explosion accidents have alwaysbeen a source of motivation—and funding—for research programs seeking tounderstand the nature of explosions and to derive preventive and mitigatingmeasures. Besides mining, this particularly concerns process and energy in-dustries. Research programs funded by nuclear energy industry and by on-and offshore oil and gas industry have decisively shaped the scientific land-scape.
A prominent example from nuclear energy industry is the Three Mile Islandaccident in 1979 in Pennsylvania, USA [128]. Loss of coolant (LOCA = loss-of-coolant accident) caused a partial core meltdown. A bubble of H2 formed
1
Introduction
in the dome of the reactor pressure vessel through oxidation of zirconium bywater steam at high temperature. Zirconium is used as a cladding material tocontain the nuclear fuel rods. Explosion of this bubble was apprehended, butno serious explosion occurred due to a lack of oxidizer in the pressure vessel.The imagination of a strong H2 explosion that might have destroyed the re-actor vessel was dismaying. This event raised great concern about explosionof H2 during LOCAs and marked the beginning of intense international re-search campaigns. The Fukushima Daiichi nuclear disaster in 2011 in Japan isa similar, more recent example of a LOCA, where severe H2 explosions in threereactor buildings occurred [138]. Since these explosions took place outside ofthe reactor pressure vessels, the effect in terms of release of radioactive ma-terial was fortunately limited. The disaster sealed the German nuclear powerphase-out and evoked a stronger focus on H2 safety in the explosion researchcommunity.
In the sector of oil and gas production, the Piper Alpha accident in 1988 with167 fatalities demonstrated the hazard related to offshore platforms [113]. Itwas an initiator for extensive safety programs in Norway [38]. Nowadays, Nor-way is considered to have the highest safety standards worldwide.
Sound knowledge of explosion physics is of vital importance for the predic-tion of explosion consequences and for providing engineers with guidelinesfor implementation of preventive and mitigative measures. Depending on vol-ume and composition of the explosive mixture and the degree of confinementand congestion, different explosion regimes with different hazard potentialscan be reached. For a long time, a common approach has been to developpredictive semi-empirical criteria for limits between these explosion regimes.Nowadays, such criteria are more and more substituted by numerical explo-sion simulation tools, which can be embedded in a comprehensive hazardanalysis chain comprising simulation of fuel release and dispersion, explosionand structural response of the confinement. However, the physical complex-ity of explosion processes leads to a high level of mathematical complexityand a large degree of modeling to keep computational costs at a reasonablelevel. Extensive modeling can cause significant uncertainty in explosion sim-ulations on industrial scale.
2
1.1 Deflagration-to-Detonation Transition
Experiments are therefore inevitable not only to further deepen physical in-sight into explosion processes, but also as a means of validation for numeri-cal simulation tools. Both global parameters such as explosion overpressureor explosion front velocity, but also detailed information on explosion frontstructure resolved preferentially by optical measurement techniques is re-quired. High temporal measurement resolution is mandatory due to the smalltime scales of explosion dynamics.
The present work makes a contribution to experimental explosion safety re-search, particularly focused on explosions in non-uniform H2–air mixtures.The research project behind this thesis was dedicated to H2 safety in nuclearreactor containments, funded by the German Ministry of Economic Affairsand Energy (BMWi).
1.1 Deflagration-to-Detonation Transition
Aforementioned explosion regimes include so-called slow deflagrations, fastdeflagrations and detonations. In this order, explosion severity in terms of re-sulting overpressure increases. Ignition in an explosive mixture usually doesnot directly initiate a detonation. A flame acceleration (FA) process is requiredto reach the fast deflagration regime as a precursor for potential onset of deto-nation. The entire process of FA and subsequent onset of detonation is termeddeflagration-to-detonation transition (DDT). If transition to detonation oc-curs, catastrophic damage must be expected. This explains why the presentwork places a particular focus on DDT.
High degree of confinement supports DDT. Tube- or channel-like geometrieswithout lateral openings are therefore most prone to DDT, especially if a highaspect ratio (ratio of length to diameter/width) and additional congestion isprovided. The relevance of such geometries in industry is evident: tubes, tun-nels, rooms highly congested by installations and chains of connected roomsare omnipresent. Also connecting tubes between larger volumes can pose anincreased DDT hazard. A detonation formed in such a connecting tube canemerge into a larger volume and, under appropriate conditions, be sustained.
3
Introduction
The present work investigates such a worst-case configuration of an entirelyclosed high-aspect-ratio channel with and without repeated obstacles.
1.2 Mixture Inhomogeneity in H2–Air Explosions
Extensive knowledge is available on explosions in homogeneous gas mixtures.Mixtures of H2 and air have been investigated particularly in the context ofnuclear reactor safety [12]. However, a major current knowledge gap concernsthe influence of mixture inhomogeneity as emphasized in a comprehensiveOECD report on FA and DDT in nuclear reactor safety [12] and recently under-scored by Bleyer et al. [6] and Kotchourko [82]. Spatial concentration gradientsare omnipresent in real-world accident scenarios since H2 is usually releasedfrom a finite region and stratifies in air due to its low density. Mixture homog-enization through convective mixing may occur in industrial environments,but should not be presupposed in a worst-case based approach. Moleculardiffusion also acts homogenizing, but is comparably slow and thus of minorrelevance in large volumes.
In reality, concentration gradients in clouds of H2 and air must be expectedto be three-dimensional. Explosion in such mixtures is highly complex, whichcomplicates the generation of fundamental physical understanding and isola-tion of dominating physical effects. The strategy in the present work is there-fore to reduce complexity by investigating one-dimensional concentrationgradients. Gradients are oriented perpendicular to the main direction of ex-plosion front propagation, thus termed "transverse concentration gradients".Comparison to other studies addressing gradients parallel to explosion prop-agation will be made.
1.3 Goals and Structure of this Work
This work aims at generating a physical understanding of FA, onset of deto-nation and detonation propagation in H2–air mixtures with transverse con-
4
1.3 Goals and Structure of this Work
centration gradients in entirely closed channels. Since extensive knowledgeon these processes has been built up over the decades for homogeneous mix-tures, the strategy is to identify similarities and differences induced by con-centration gradients. The focus is clearly placed on the influence of mixture,in contrast to the often investigated influence of confining geometry. Broadapplication of advanced optical measurement techniques at high temporalresolution in conjunction with conventional techniques is one of the majorfeatures of the present work.
Experiments have been conducted in a laboratory scale explosion channel.Local flame speed and overpressure were measured by conventional measure-ment techniques. Highly time-resolved optical measurement techniques pro-vide images of explosion fronts at different stages of the explosion process.An approximate number of 3500 conventional and 1500 optical experimentshas been performed to cover a large range of parameters at a high statisticalreliability.
Theoretical approaches have been developed to describe the major exper-imental observations. The high complexity of explosion processes tends tolimit the applicability of simplified models to the prediction of general trends.These models can however make an important contribution to understandingexperimental results.
This work starts by providing the theoretical background of H2–air explosionsin closed tubes in Ch. 2. By utilizing own experimental results already in thischapter, the reader is acquainted with typical measurement results obtainedin the experiment. The chapter ends with a summary of available knowledgeon explosion in mixtures with concentration gradients.
Chapter 3 presents the experimental setup, including the method of trans-verse concentration gradient generation and the investigated geometricalconfigurations.
In Ch. 4, applied measurement techniques are introduced. Both conventionaland optical techniques are discussed. Besides providing theoretical back-ground, hands-on information is given on the practical application of thesetechniques for explosion diagnostics.
5

Introduction
Results and their discussion are split into two chapters: DDT is analysed in Ch.5. This includes the FA process and the onset of detonation. This chapter maybe considered the most safety-relevant part of the present work. Detonationpropagation is discussed separately in Ch. 6, rounding the picture of possibleexplosion regimes.
This work ends with a summary and outlook in Ch. 7.
6
2 Physics and Chemical Kinetics of H2–Air
Explosions in Tubes
This chapter gives an introduction to phenomena involved in confined H2–airexplosions. Note that the scientifically unprecise term "explosion" is used inthe first paragraphs to avoid denomination of all possible explosion regimesand will be refined progressively. The author focuses on entirely closed tubeand channel geometries with a large aspect ratio (length to diameter/ width),filled with premixed H2–air mixture at initially ambient pressure and tempera-ture. For broad background information on fluid mechanics, combustion andgasdynamics, the reader is referred to standard literature like [48], [91] and[98].
This chapter is particularly conceived to provide the scientific base for theanalysis of experimental results presented in Ch. 5 and 6. Transformation ofthe herein discussed physics towards other types of fuels, geometries or initialconditions requires careful validation. Observations from experiments con-ducted within the scope of the present work are already included in this chap-ter, in particular images obtained by means of optical measurement tech-niques. The height of images presented here equals the explosion channelheight of 0.06 m.
Section 2.1 provides a simplified overview of H2–air explosion processes andintroduces common terminology. Fundamental relations of reactive com-pressible flow are presented in Sec. 2.2. Remarks on the chemical kinetics ofthe H2–O2 system are given in Sec. 2.3. A discussion of ignition mechanismsand their relevance for explosion accidents follows in Sec. 2.4. Section 2.5deals with FA and Sec. 2.6 introduces mechanisms of onset of detonation. Det-onation properties are described in Sec. 2.7. The present state of knowledge onthe role of mixture inhomogeneity is finally reviewed in Sec. 2.8.
7
Physics and Chemical Kinetics of H2–Air Explosions in Tubes
2.1 Overview of H2–Air Explosions
Explosions in closed tubes can be diverse in nature, depending on boundaryand initial conditions. Phenomena observable in H2–air mixtures at initiallyambient temperature and pressure range from slow deflagrations with maxi-mum overpressures of around 1 bar and maximum flame speeds of the orderof 100 m/s to detonations with maximum overpressures distinctly higher than10 bar and supersonic propagation velocities of up to 2000 m/s.
Direct initiation of detonation in realistic H2–air explosion scenarios is highlyimprobable since the required ignition energy would be very high. This wouldonly be achievable by very energetic ignition sources like high explosivecharges. Thus, most explosions start with mild ignition by a weak ignitionsource like a spark.
Directly after ignition, a laminar flame front propagates into the mixture. Theterm deflagration is used for this type of flame propagation through diffu-sion of heat and species. Temporal evolution of the flame surface area playsan important role since enlargement results in an increased overall reactionrate, which is the integral of local burning velocity over the flame surface area.Flame surface area enlargement thus accelerates the flame. The laminar de-flagration regime with a smooth, undistorted flame front is typically of shortand thus negligible duration compared to the entire explosion process. Flamefront instability arises quickly, distorting the flame surface and thereby furtherincreasing the flame surface area. The result are so-called cellular flames. Thistype of instability is characteristic for H2–air mixtures, especially under leanconditions.
In a closed tube with end wall ignition, the flame acts like a piston due to ther-mal expansion of the reaction products, pushing fresh mixture ahead of theflame into the direction of flame propagation. Given that sufficiently high flowvelocities and thus high Reynolds numbers are reached ahead of the flame, re-gions of enhanced turbulence appear. Such regions are typically wall bound-ary layers and the wake of obstructions. Interaction of flame and turbulencelocally increases the burning velocity up to a maximum value, which is of the
8
2.1 Overview of H2–Air Explosions
order of 10 times the laminar burning velocity. This leads to an increase inoverall reaction rate in the tube and thus reinforces flow generation in thefresh mixture ahead of the flame.
During acceleration, flames continuously generate acoustic waves whichpropagate into the fresh mixture. These waves can coalesce and form shocks,which precompress and thus heat the fresh mixture. Interactions of shocksand the flame further increase the reaction rate.
This feedback cycle of flow, turbulence and shock generation accompanied byreaction rate enhancement, illustrated in Fig. 2.1, can allow deflagrations inH2–air mixtures to accelerate to the regime of fast deflagrations. Such an ac-celeration process is termed "strong", while "weak" acceleration only resultsin velocities of the order of 100 m/s. Fast deflagrations typically appear as aseries of precursor shocks and the succeeding turbulent flame brush. Accel-eration up to velocities of the order of 1000 m/s in reference to an externalobserver, accompanied by overpressures up to about 10 bar, is possible. How-ever, flame front velocity relative to the gas ahead of the front is still subsonic.
At a critical flame velocity, often approximated by the speed of sound of thereaction products, onset of detonation may occur. This mostly involves a localexplosion that causes high local overpressure and a sudden jump in explosionfront velocity. Various mechanisms are known that can initiate onset of deto-nation. A sequence of criteria needs to be satisfied to allow for DDT. The widerange of effects depending on the respective mixture and geometry explainswhy it has not yet been accomplished to develop a comprehensive model forDDT. One could even disbelieve that such a generalized model would copewith the complexity of DDT processes at all.
After onset of detonation, a detonation wave propagates into the fresh mix-ture. Detonations are supersonic three-dimensional complexes of shocks andreaction zones, where the shocks lead to rapid auto-igntion by compressingand heating the mixture. Flame propagation due to heat and species diffu-sion is of minor importance. In contrast to deflagrations, detonations in H2–air propagate at velocities of up to 2000 m/s.
9
Physics and Chemical Kinetics of H2–Air Explosions in Tubes
mild
ignition
laminar
deflagration
cellular
deflagration
turbulence
generation and
interaction with
flame
shock
formation and
interaction with
flame
crit. cond.
for onset of
detonation
onset of
detonation
reactant flow
generation
fluidmechanic and
gasdynamic feedback
Figure 2.1: Overview of the DDT process.
10
2.2 Reactive Compressible Flow
2.2 Reactive Compressible Flow
This section provides equations of reactive compressible flow, referring toAnderson [1] and Lee [93]. Figure 2.2 shows the denotation of states usedthroughout the present work.
state 0
initial conditions
state 1
shocked reactants
state 2
products
M0
ρ
p
T
0
0
0
ρ
p
T
1
1
1
ρ
p
T
2
2
2
rea
ctio
n z
on
e
sh
ock
Figure 2.2: Definition of states in a shock-reaction zone complex propagatingto the right.
State 0 denotes the initial gas state, defined as p0 = 1 atm and T0 = 293 K inthe present work, resembling laboratory conditions. A shock travels at Machnumber M0 into the gas, yielding post-shock state 1. When shock reflection offa solid wall is considered, the post-reflected-shock state is denoted 1r. Addi-tion of specific heat q through chemical reaction leads to state 2. Specific heatq is calculated as the difference between standard enthalpies of formation ofreactants and products according to Hess’ Law for a multicomponent mixture:
q =∑
i
Xih◦
fi −∑
j
Xjh◦
fj. (2.1)
Xi and Xj denote molar concentrations of reactant and product species, re-spectively, and h◦
f are the standard enthalpies of formation.
We employ the equations of conservation for mass, momentum and energy:
mass: ρ0u0 = ρ1u1, (2.2)
momentum: p0 +ρ0u20 = p1 +ρ1u2
1, (2.3)
energy: h0 +u2
0
2+q = h1 +
u21
2. (2.4)
11
Physics and Chemical Kinetics of H2–Air Explosions in Tubes
The normal shock relations can be derived, assuming calorically perfect gas:
ρ1
ρ0=
(γ+1)M20
(γ−1)M20 +2
, (2.5)
p1
p0= 1+
2γ
γ+1
(
M20 −1
)
. (2.6)
Post-shock temperature can be calculated using the equation of state for per-fect gas,
pM = ρRT. (2.7)
The adiabatic Hugoniot equation,
h1 −h0 =p0 −p1
2
(
1
ρ0+
1
ρ1
)
, (2.8)
describes the change in thermodynamic state across a normal shock. Onlythermodynamic properties are considered in contrast to the normal shock re-lations, Eq. (2.5) and (2.6), which relate post-shock conditions to the shockMach number M0.
The Hugoniot equation can be readily extended for the case of a shock withspecific heat addition q, which will allow for describing state 2 behind a com-plex of shock and reaction zone.
h2 −h0 +q =p0 −p2
2
(
1
ρ0+
1
ρ2
)
(2.9)
The combination of Eqs. (2.2) and (2.3), conservation of mass and momen-tum, yields the Rayleigh relation,
p1
p0=
(
1+γM20
)
−(
γM20
) ρ0
ρ1, (2.10)
constituting the Rayleigh line in a p-ν plane (ν = 1/ρ).
When a normal shock is reflected off a solid wall, the reflected shock Machnumber Mr is a unique function of the incident shock Mach number M0 for a
12
2.3 Chemical Kinetics of the H2–O2 System
given heat capacity ratio γ since flow velocity u1,r must vanish at the reflectingwall. Thus,
Mr
M2r −1
=M0
M20 −1
√
1+2(γ−1)
(γ+1)2(M2
0 −1)
(
γ+1
M20
)
. (2.11)
Post-reflected-shock pressure and temperature can be calculated using the re-flected shock Mach number Mr and the normal shock relations. This yields
p1,r = p1
[
1+2γ
γ+1(M2
r −1)
]
(2.12)
and
T1,r = T1
[
1+2γ
γ+1(M2
r −1)
][
1−2
γ+1
(
1−1
M2r
)]
. (2.13)
The Shock and Detonation Toolbox [133] is employed to solve relations ofcompressible reactive flow and compute zero- and one-dimensional explo-sion problems in the present work. It is coupled with Cantera [55], which isa software tool for simulating chemical kinetics, thermodynamics and trans-port processes. Thermodynamic data is taken from the Chemkin Database[73]. For simulations of chemical kinetics of H2–air, the reaction mechanismof Ó Conaire et al. [109] is applied, which is a well-accepted mechanism forH2–air. It was successfully used by Ettner [42] for CFD simulations of DDT andrecently employed by Hasslberger et al. [61] for large scale explosion simula-tions. Its most important feature for the present work is the broad validationrange: Validated pressure ranges from 0.05 to 87 atm, temperature from 298 to2700 K and equivalence ratio from 0.2 to 6.
2.3 Chemical Kinetics of the H2–O2 System
Chemical reaction of H2 and O2 proceeds through a network of elementaryreactions. For general explanations on combustion chemistry, please refer to[91, 147]. Elementary reactions that influence the overall reaction rate mostsignificantly are listed subsequently [91, 92, 157]. For each elementary reac-tion, Arrhenius chemistry is assumed, so that reaction rate coefficients k aregiven by the modified Arrhenius equation
k = ATne−EaRT (2.14)
13
Physics and Chemical Kinetics of H2–Air Explosions in Tubes
with A being the pre-exponential constant, T the thermodynamic tempera-ture, n a constant describing temperature dependence, Ea the activation en-ergy and R the gas constant.
Chain initiation:
H2 +O2
k2.15−−*)−− HO2 +H (2.15)
Chain propagation:
H+O2
k2.16−−*)−− O+OH (2.16)
O+H2
k2.17−−*)−− H+OH (2.17)
OH+H2
k2.18−−*)−− H+H2O (2.18)
Chain termination:
H+O2 +Mk2.19−−*)−− HO2 +M (2.19)
H2O2 formation and decomposition:
HO2 +HO2
k2.20−−*)−− H2O2 +O2 (2.20)
HO2 +H2
k2.21−−*)−− H2O2 +H (2.21)
H2O2 +Mk2.22−−*)−− OH+OH+M (2.22)
Reaction (2.15) represents the relatively slow chain initiation, forming Hatoms which act as chain carriers for the subsequent chain-branching re-action. Dissociation of H2 may portray another initiation reaction, but be-comes relevant only at very high temperatures [92]. Once the concentration ofchain carriers is sufficient, chain propagation takes over, which is of branchingcharacter in atmospheric H2–O2 flames. Reactions (2.16) and (2.17) are chain-branching reactions since they increase the number of chain carriers H, O andOH. Repetition of chain-branching reactions leads to an exponential growthin reaction rate, termed branched-chain explosion.
14
2.3 Chemical Kinetics of the H2–O2 System
T [K]
p
[
ba
r]10
1
0.1
0.01
660 700680 720 740 760 780 800 820 840
NO EXPLOSION
EXPLOSION
2 explosion limitnd
1 explosion limitst
3 explosion limitrd
2k = k [M]2.16 2.19
extended 2 explosion limitnd
860
ab
s
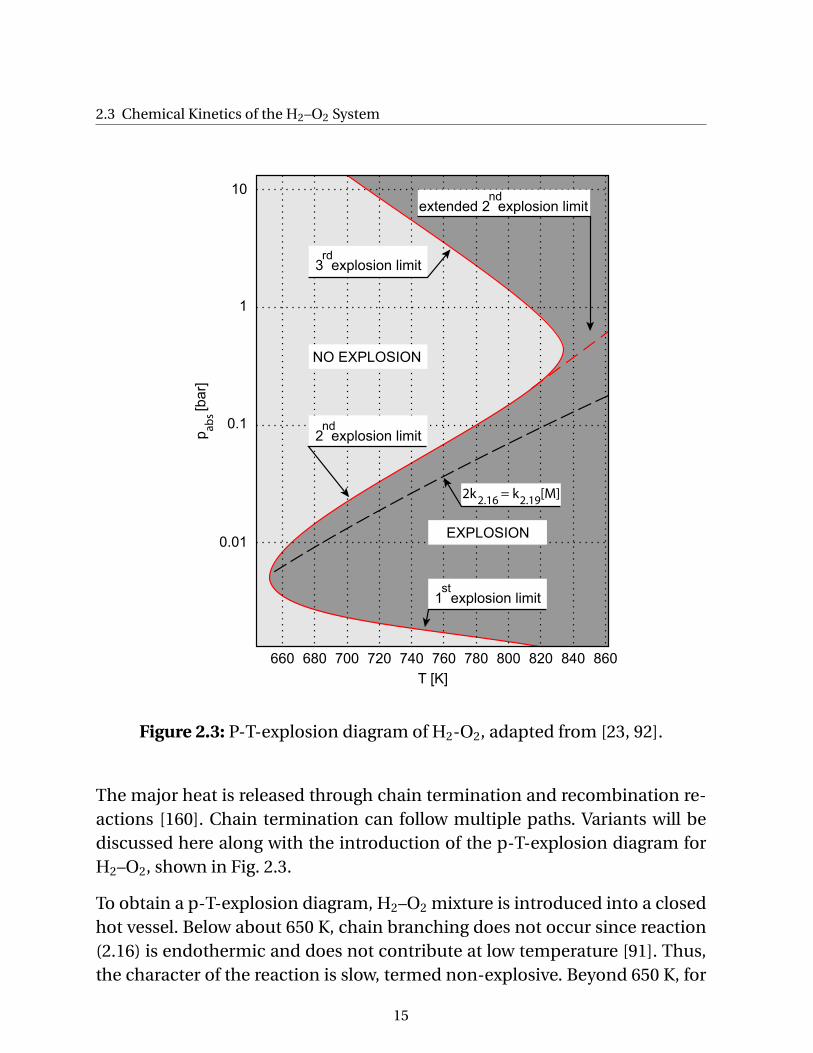
Figure 2.3: P-T-explosion diagram of H2-O2, adapted from [23, 92].
The major heat is released through chain termination and recombination re-actions [160]. Chain termination can follow multiple paths. Variants will bediscussed here along with the introduction of the p-T-explosion diagram forH2–O2, shown in Fig. 2.3.
To obtain a p-T-explosion diagram, H2–O2 mixture is introduced into a closedhot vessel. Below about 650 K, chain branching does not occur since reaction(2.16) is endothermic and does not contribute at low temperature [91]. Thus,the character of the reaction is slow, termed non-explosive. Beyond 650 K, for
15
Physics and Chemical Kinetics of H2–Air Explosions in Tubes
instance at 740 K, variation of pressure leads to the observation of either ex-plosive or non-explosive reaction. Limits between these regimes are depictedin the p-T-explosion diagram as pressure-temperature boundaries and can beinterpreted as limits for auto-ignition1. The time between exposure of the mix-ture to the specific pressure and temperature and ignition is called inductiontime τind. Within the present work, ignition is defined as the moment of max-imum heat release rate, coinciding with the point of maximum temperaturegradient. Note the difference to approaches utilizing emission of radiationfrom excited molecules as a marker2.
Below the first explosion limit, termination of chain reaction occurs due todiffusion of active species H, O and OH to vessel walls. Destruction of thesespecies exceeds their formation by chain-branching reactions and the over-all reaction rate is negligible. Raising pressure, wall termination is overcomesince the higher gas density hinders diffusion of active species to walls. Thus,explosive reaction is observed. With a further increase in pressure, three-bodyreactions become more frequent. Reaction (2.19) can effectively terminatethe chain reaction. Mainly the competition between chain-branching reac-tion (2.16) and chain termination through reaction (2.19) controls the secondexplosion limit. A simplified second limit criterion can be written as a balanceof chain carriers:
2k2.16 = k2.19[M], (2.23)
where ki are the respective rate constants and [M] is the concentration of thirdbody. An effective third body collision efficiency is employed here, taking intoaccount all possible third body species. This simplified limit is shown in Fig.2.3 as a black dashed line. Deviation of this simplified limit from the experi-mentally observed second explosion limit is due to the influence of H2O2 for-mation and decomposition reactions (2.20)–(2.22) [23].
Beyond the third explosion limit, thermal explosion with an exothermal in-duction period and a dominating straight-chain mechanism occurs. This
1Auto-ignition is defined as ignition due to homogeneous heating of a mixture in abscence of an externalignition source.
2This is a common approach in shock-tube experiments. However, the temporal coherence of heat releaseand light emission requires careful analysis, as pointed out by Mével et al. for the excited hydroxyl (OH) radical[106].
16
2.4 Ignition Mechanisms
stands in contrast to the branched chain explosion below the second ex-plosion limit as discussed beforehand, where the induction period is nearlyisothermal [23]. Reactions (2.20)–(2.22) gain in importance beyond the thirdlimit. Recombination of HO2 in reaction (2.20) and abstraction of H throughreaction (2.21) form H2O2, which is decomposed by reaction (2.22) into OH[92].
The three explosion limits discussed so far represent boundaries between re-gions in the T-p-plane where auto-ignition in a mixture occurs, from regionswhere it does not occur. In addition to these three limits, an extension of thesecond explosion limit can be observed in experiments [92]. This limit is in-dicated in Fig. 2.3 as a red dashed line. It extends towards high values of bothpressure and temperature. This region of high pressure and temperature ishighly relevant for the present work. When a shock at high Mach number,distinctly higher than M = 2, propagates into fresh mixture of H2 and air atinitially ambient conditions, post-shock temperature and pressure, Eq. (2.6)and (2.7), reach values that approach or cross this extended second explosionlimit. The character of the extended second explosion limit differs from thethree classical limits discussed beforehand: On both sides of the limit, auto-ignition occurs. However, reaction is distinctly faster on the right side of thelimit (at higher T, dominating branched-chain mechanism [92]) than on theleft side (dominating straight-chain mechanism [92]). This difference in igni-tion behavior and implications for the present work will be discussed in moredetail in the next section.
2.4 Ignition Mechanisms
Two modes of ignition can be discriminated according to the ignition energyinvolved: mild ignition with a moderate ignition energy, leading to a deflagra-tion and strong ignition with a high ignition energy, directly initiating a deto-nation. These two mechanisms are discussed in this section.
Through mild ignition, a flame is initiated locally, propagating from the pointof ignition into the fresh mixture. The combustion mode is deflagration, thus
17
Physics and Chemical Kinetics of H2–Air Explosions in Tubes
diffusion of heat and species dominates flame propagation. The minimum ig-nition energy (MIE) of H2–air mixtures at standard pressure and temperaturedepends on H2 concentration and reaches a minimum of 0.017 mJ close tostoichiometry [84]. Minimum ignition energies of other combustible gases inair are typically in the range of 0.2-0.3 mJ [96]. It is obvious that H2 can beignited comparably easily.
Ignition can be investigated experimentally in shock tubes. A shock of definedstrength, expressed in terms of Mach number, is generated and propagatesinto a measurement section filled with the test gas. At the closed end of thetube, the shock is reflected. At sufficient incident shock Mach number, auto-ignition behind the reflected shock occurs due to shock-induced compressionand related heating of the mixture. Rather weak shocks cause mild ignition
which is characterized by the occurence of randomly distributed flame ker-nels behind the reflected shock [110]. Mild ignition in shock tubes is cruciallydependent on the homogeneity of mixture composition and temperature fieldsince ignition occurs first at the most favorable points. Also formation of hotspots, for example by shock focussing or further non-ideal effects, influenceresults in shock tube experiments with mild ignition (cp. [115, 118]). Flamespropagate as deflagrations in the post-reflected-shock mixture. The separa-tion distance between reflected shock and flame front thus grows continu-ously due to the low flame speed.
Strong ignition occurs if the incident shock is strong enough to cause rapidauto-ignition after reflection, directly leading to explosion at the reflectingwall. A blast wave is produced that can overtake the reflected shock and forma detonation. This process of shock reflection, causing a local explosion thatgenerates a detonation front, is typically observed during onset of detonationin obstructed geometries. Details are given in Sec. 2.6. The range of T and pwhere strong ignition is possible, can be roughly approximated by calculat-ing post-shock conditions of Chapman-Jouguet detonations 3. Temperatureswithin assumed detonability limits of 12 and 70 vol. % H2 range from 1050 K to1550 K, whereas pressures range from 17 to 29 bar4. The extended second ex-
3Properties of detonations are discussed in Sec. 2.7.4Calculated using the Shock and Detonation Toolbox [133], Cantera [55] and thermodynamic data from the
Chemkin database [73].
18
2.4 Ignition Mechanisms
plosion limit crosses this region. As argued by Lee and Hochgreb [92] based onexperiments of several authors, this limit separates mild ignition after shockreflection on its left side from strong ignition on its right side. This finding willbe employed in Sec. 5.2.3 to compute critical incident shock properties thatare required to cause strong ignition and thus onset of detonation after shockreflection in H2–air mixture.
Belles [4] suggested to employ the extended second explosion limit as a limitfor detonation initiation and propagation. He used the simplified descriptiongiven by Eq. (2.23) to determine the extended second explosion limit. Ng etal. [108] recently followed this approach to study detonation hazards in H2 athigh pressure. However, the simplified extended second explosion limit cri-terion does not account for reactions of H2O2 formation and decomposition(reactions (2.20)–(2.22)), which play an important role at this limit. This hasbeen concluded by several authors as summarized by Lee and Hochgreb [92],and also noted by Dove and Tribbeck [33] and Browne et al. [15] for instance.Shepherd [132] likewise shows that reaction around this limit is a coupledchain-branching and thermal explosion. The simplified criterion leads to anoverprediction of temperature necessary to reach strong ignition at a givenpressure, cp. Fig. 2.3. In the present work, the extended second explosion limitwill be determined employing detailed chemical kinetics.
In detonation experiments, strong ignition and thereby direct initiation of det-onation can be achieved for example by means of a high explosive charge.An energy per surface area of about 0.7 MJ/m2 is required to cause directinitiation of a planar detonation in stoichiometric H2–air. As a comparison,propane demands 3.1 MJ/m2 and methane 10 MJ/m2 [8].
In addition to mild and strong ignition, a transient region can be observedin shock tube experiments. In the transient ignition regime, mild ignition ini-tially produces flame kernels, but a subsequent DDT process5, often involvinga violent secondary explosion, leads to detonation as observed optically byWang et al. [156]. Since the flame kernels form at random positions behindthe reflected shock, secondary explosions also emerge from random locationsin the transient regime. Distinction between transient ignition involving DDT
5The DDT pocess is described in detail in Sec. 2.6.
19
Physics and Chemical Kinetics of H2–Air Explosions in Tubes
and strong ignition is often not clearly stated in literature. One may describethe boundary between transient and strong ignition as the point when auto-ignition is firstly observed directly at the reflecting wall and not at randompositions between wall and reflected shock as in the transient regime.
Evaluated from a safety perspective, two conclusions have to be drawn fromthe preceding discussion:
• Due to the low ignition energy required to ignite H2–air mixture, igni-tion in H2–air is highly probable in industrial environments as soon asflammable mixture is present. Potential ignition sources are omnipresentsuch as sparks of different origin (mechanical, electrostatic discharge,etc.), hot surfaces, mechanical friction or auto-ignition in hot environ-ments [38].
• Strong ignition and thereby direct initiation of detonation is improba-ble in real-world accident scenarios. As it has been shown, the energyrequired for direct detonation initiation could in principle be providedby sources like high explosives, which are however seldomly involved inindustrial explosions. Thus, a DDT process is typically required to reachdetonation.
20
2.5 Flame Acceleration
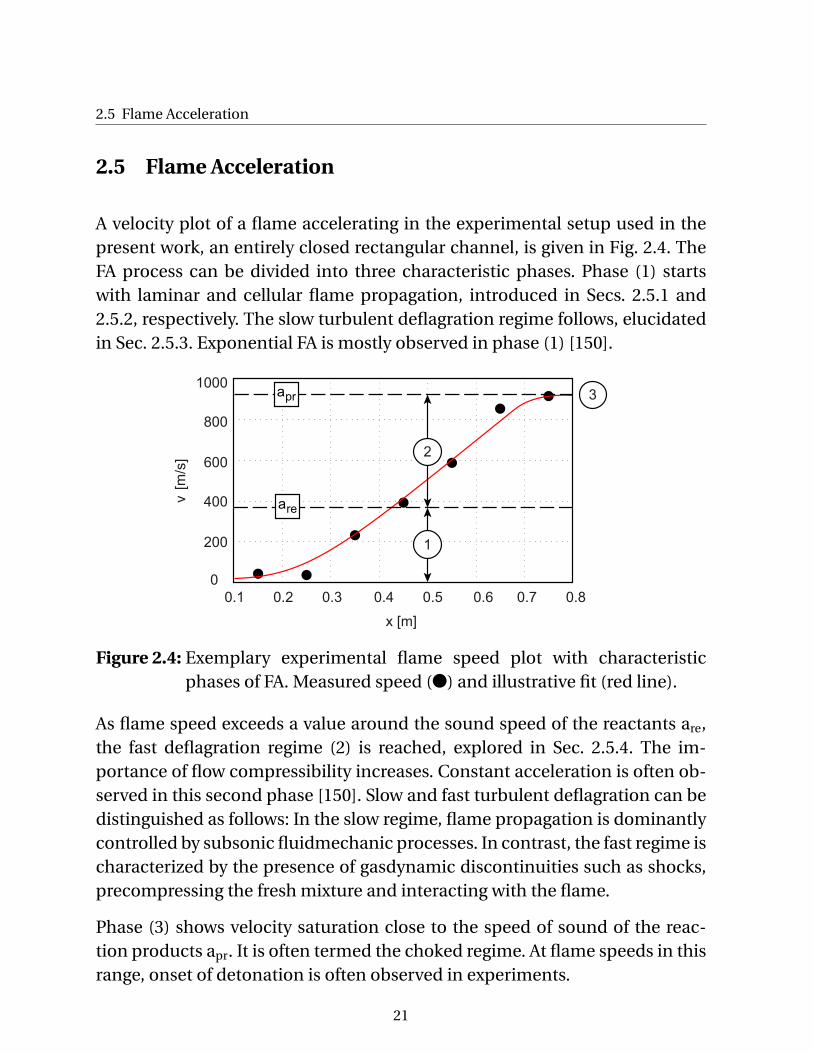
2.5 Flame Acceleration
A velocity plot of a flame accelerating in the experimental setup used in thepresent work, an entirely closed rectangular channel, is given in Fig. 2.4. TheFA process can be divided into three characteristic phases. Phase (1) startswith laminar and cellular flame propagation, introduced in Secs. 2.5.1 and2.5.2, respectively. The slow turbulent deflagration regime follows, elucidatedin Sec. 2.5.3. Exponential FA is mostly observed in phase (1) [150].
0.1 0.2 0.3 0.4 0.5 0.6 0.7 0.8
x [m]
0
200
400
600
800
1000
v [
m/s
]
3
are
apr
1
2
Figure 2.4: Exemplary experimental flame speed plot with characteristicphases of FA. Measured speed (●) and illustrative fit (red line).
As flame speed exceeds a value around the sound speed of the reactants are,the fast deflagration regime (2) is reached, explored in Sec. 2.5.4. The im-portance of flow compressibility increases. Constant acceleration is often ob-served in this second phase [150]. Slow and fast turbulent deflagration can bedistinguished as follows: In the slow regime, flame propagation is dominantlycontrolled by subsonic fluidmechanic processes. In contrast, the fast regime ischaracterized by the presence of gasdynamic discontinuities such as shocks,precompressing the fresh mixture and interacting with the flame.
Phase (3) shows velocity saturation close to the speed of sound of the reac-tion products apr. It is often termed the choked regime. At flame speeds in thisrange, onset of detonation is often observed in experiments.
21
Physics and Chemical Kinetics of H2–Air Explosions in Tubes
2.5.1 Laminar Deflagration
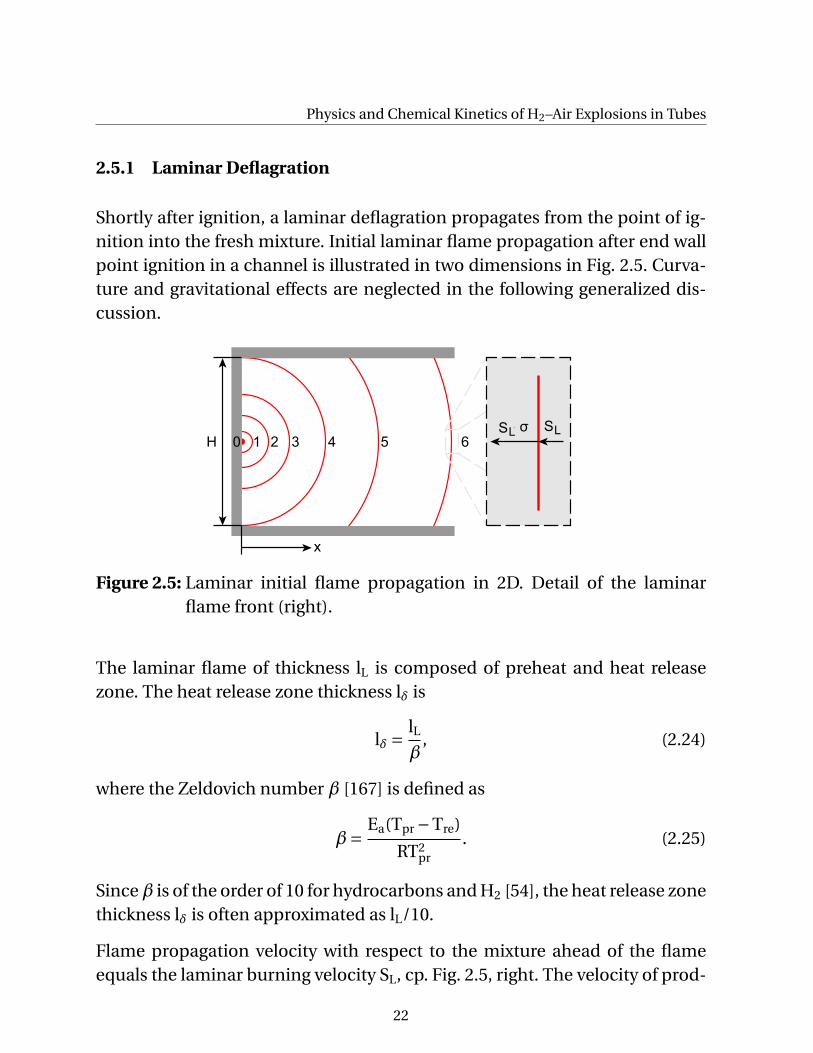
Shortly after ignition, a laminar deflagration propagates from the point of ig-nition into the fresh mixture. Initial laminar flame propagation after end wallpoint ignition in a channel is illustrated in two dimensions in Fig. 2.5. Curva-ture and gravitational effects are neglected in the following generalized dis-cussion.
SLSL σ1 2 3 4 5 60H
x
Figure 2.5: Laminar initial flame propagation in 2D. Detail of the laminarflame front (right).
The laminar flame of thickness lL is composed of preheat and heat releasezone. The heat release zone thickness lδ is
lδ =lL
β, (2.24)
where the Zeldovich number β [167] is defined as
β=Ea(Tpr −Tre)
RT2pr
. (2.25)
Sinceβ is of the order of 10 for hydrocarbons and H2 [54], the heat release zonethickness lδ is often approximated as lL/10.
Flame propagation velocity with respect to the mixture ahead of the flameequals the laminar burning velocity SL, cp. Fig. 2.5, right. The velocity of prod-
22
2.5 Flame Acceleration
ucts behind the flame equals SLσ,
σ=ρre
ρpr, (2.26)
where ρre and ρpr are the densities of reactants and products, respectively, andσ is termed expansion ratio. Since the rear wall boundary condition at x = 0m, namely stagnant flow, needs to be satisfied, the flame propagates with avelocity SLσ, termed flame speed, with respect to an external observer. Flow isinduced ahead of the flame at a velocity u. Thus,
SLσ= u+SL. (2.27)
Flame surface areas AF different from the channel cross-section AC can be con-sidered:
SLσAF = uAC +SLAF. (2.28)
AF would be the flame front length and AC the channel height H in the presenttwo-dimensional example. It is obvious that an enlargement of AF also resultsin an increase of visible flame speed, given by the left side of Eq. (2.28).
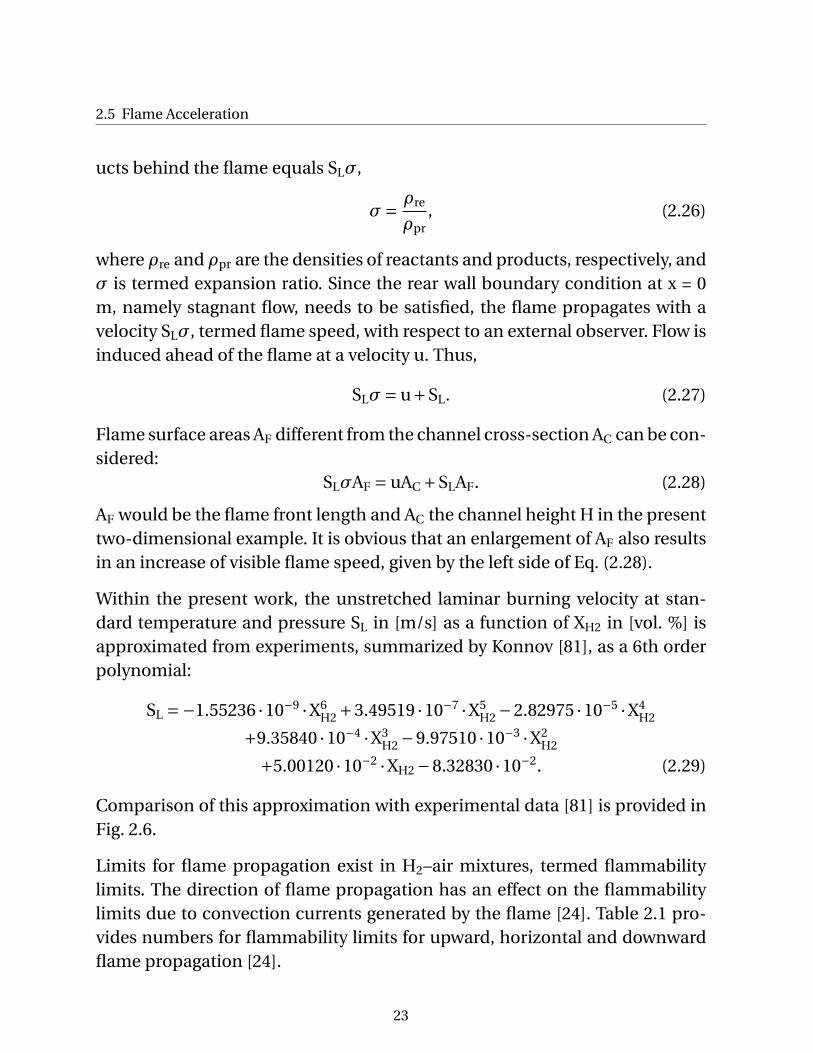
Within the present work, the unstretched laminar burning velocity at stan-dard temperature and pressure SL in [m/s] as a function of XH2 in [vol. %] isapproximated from experiments, summarized by Konnov [81], as a 6th orderpolynomial:
SL =−1.55236 ·10−9·X6
H2 +3.49519 ·10−7·X5
H2 −2.82975 ·10−5·X4
H2
+9.35840 ·10−4·X3
H2 −9.97510 ·10−3·X2
H2
+5.00120 ·10−2·XH2 −8.32830 ·10−2. (2.29)
Comparison of this approximation with experimental data [81] is provided inFig. 2.6.
Limits for flame propagation exist in H2–air mixtures, termed flammabilitylimits. The direction of flame propagation has an effect on the flammabilitylimits due to convection currents generated by the flame [24]. Table 2.1 pro-vides numbers for flammability limits for upward, horizontal and downwardflame propagation [24].
23
Physics and Chemical Kinetics of H2–Air Explosions in Tubes
0.8
1.6
2.4
3.2
S
[m
/s]
L
00 20 40 60 80
X [vol. %]H2
Figure 2.6: Unstretched laminar burning velocity SL of H2–air at standard tem-perature and pressure [81]. Data sources: ● [34], � [162], ⋆ [146],△ [72], + [149]. Red line: approximation by Eq. (2.29).
Table 2.1: Flammability limits of H2–air at standard temperature and pressure[24].
Propagation Lower limit Upper limitdirection [vol. % H2] [vol. % H2]
Upward 4.1 74Horizontal 6.0 n/aDownward 9.0 74
24
2.5 Flame Acceleration
2.5.2 Cellular Deflagration
15 vol. % (L ≈ -0.2 mm) 20 vol.% (L ≈ -0.14 mm) 25 vol. % (L ≈ -0.07 mm)
30 vol. % (L ≈ 0 mm) 40 vol. % (L ≈ 0.06 mm)
M M M
MM
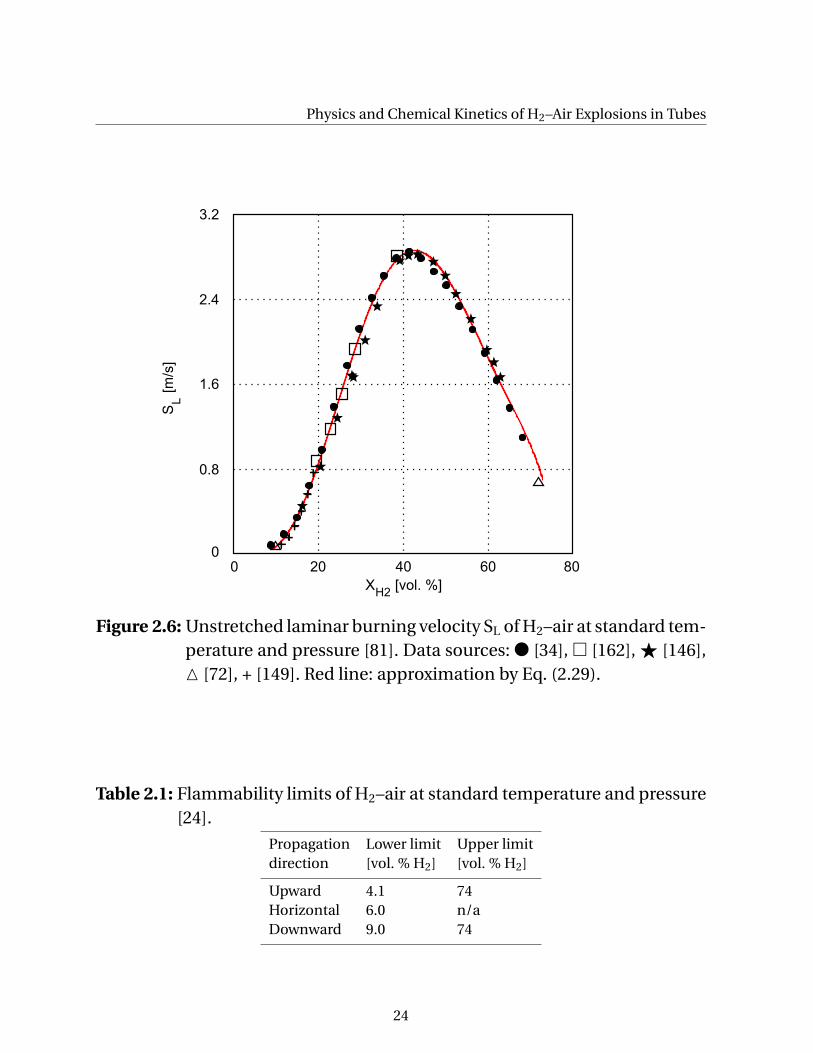
Figure 2.7: OH-PLIF images of cellular flames in homogeneous H2–air mix-tures.
This section first shows the phenomenology of cellular flames, which is thenexplained based on two instability mechanisms. It can be experimentally ob-served that H2–air flames become unstable shortly after ignition although flowis still laminar. Figure 2.7 shows OH-PLIF images6 of flames in mixtures of 15–40 vol. % H2 in air, obtained using the experimental setup described in Ch.3. The image height equals the channel height of 0.06 m. Development of thecellular structure is a dynamic process, which has been widely described in lit-erature, see for instance work of Hertzberg [62], Clavin [22] or Law [90]. After
6For a description of the OH-PLIF measurement technique, please refer to Sec. 4.2.2.
25
Physics and Chemical Kinetics of H2–Air Explosions in Tubes
ReactantsProducts
SL
S σL
Figure 2.8: Illustration of hydromechanic (Landau-Darrieus) instability.
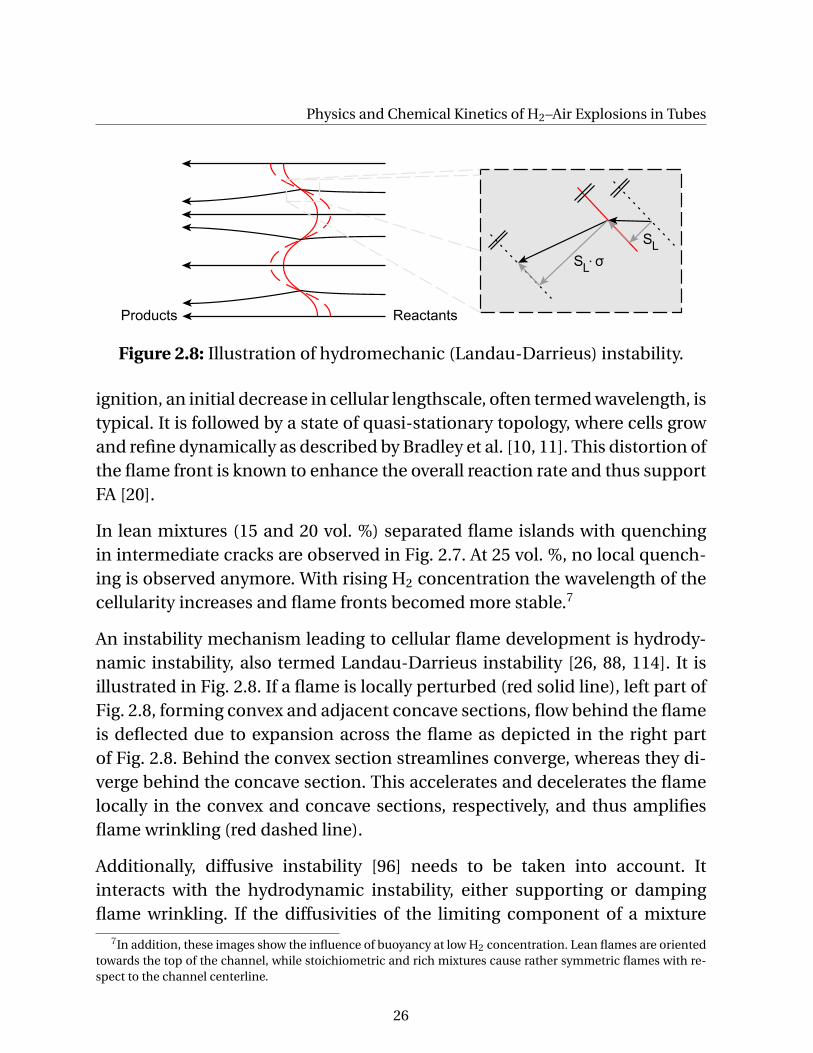
ignition, an initial decrease in cellular lengthscale, often termed wavelength, istypical. It is followed by a state of quasi-stationary topology, where cells growand refine dynamically as described by Bradley et al. [10, 11]. This distortion ofthe flame front is known to enhance the overall reaction rate and thus supportFA [20].
In lean mixtures (15 and 20 vol. %) separated flame islands with quenchingin intermediate cracks are observed in Fig. 2.7. At 25 vol. %, no local quench-ing is observed anymore. With rising H2 concentration the wavelength of thecellularity increases and flame fronts becomed more stable.7
An instability mechanism leading to cellular flame development is hydrody-namic instability, also termed Landau-Darrieus instability [26, 88, 114]. It isillustrated in Fig. 2.8. If a flame is locally perturbed (red solid line), left part ofFig. 2.8, forming convex and adjacent concave sections, flow behind the flameis deflected due to expansion across the flame as depicted in the right partof Fig. 2.8. Behind the convex section streamlines converge, whereas they di-verge behind the concave section. This accelerates and decelerates the flamelocally in the convex and concave sections, respectively, and thus amplifiesflame wrinkling (red dashed line).
Additionally, diffusive instability [96] needs to be taken into account. Itinteracts with the hydrodynamic instability, either supporting or dampingflame wrinkling. If the diffusivities of the limiting component of a mixture
7In addition, these images show the influence of buoyancy at low H2 concentration. Lean flames are orientedtowards the top of the channel, while stoichiometric and rich mixtures cause rather symmetric flames with re-spect to the channel centerline.
26
2.5 Flame Acceleration
limiting
component
increased concentration
of limiting component
excess
component
Reactants
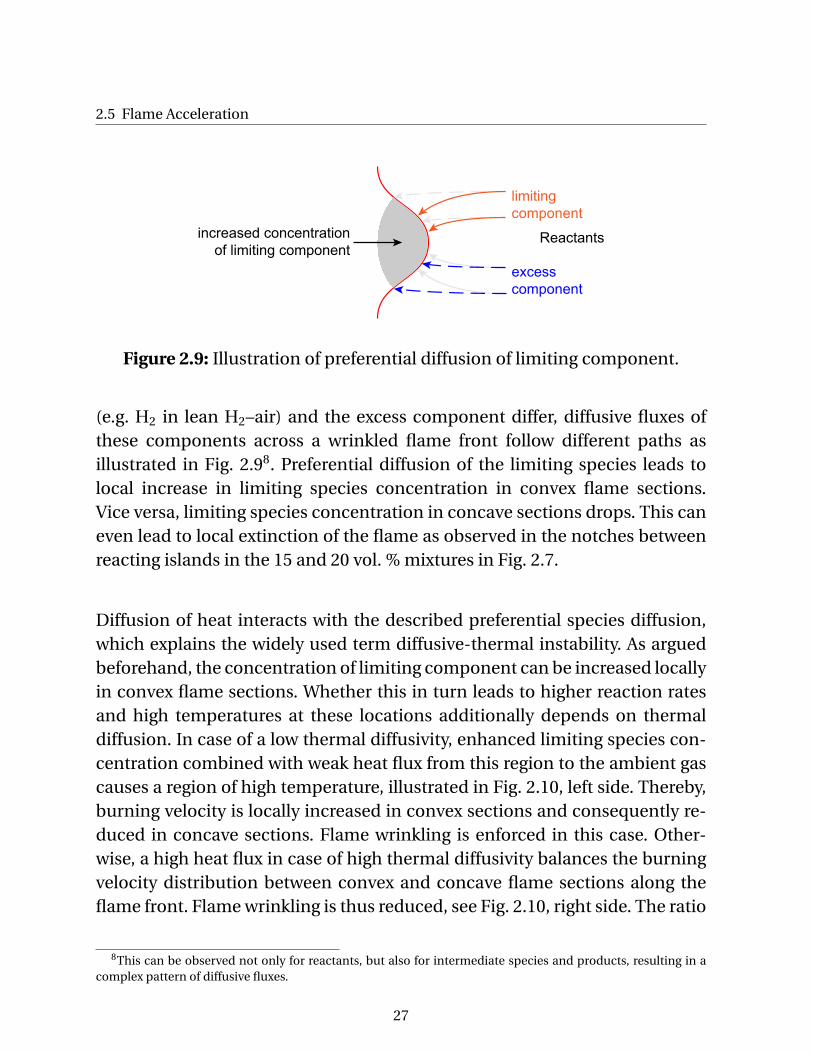
Figure 2.9: Illustration of preferential diffusion of limiting component.
(e.g. H2 in lean H2–air) and the excess component differ, diffusive fluxes ofthese components across a wrinkled flame front follow different paths asillustrated in Fig. 2.98. Preferential diffusion of the limiting species leads tolocal increase in limiting species concentration in convex flame sections.Vice versa, limiting species concentration in concave sections drops. This caneven lead to local extinction of the flame as observed in the notches betweenreacting islands in the 15 and 20 vol. % mixtures in Fig. 2.7.
Diffusion of heat interacts with the described preferential species diffusion,which explains the widely used term diffusive-thermal instability. As arguedbeforehand, the concentration of limiting component can be increased locallyin convex flame sections. Whether this in turn leads to higher reaction ratesand high temperatures at these locations additionally depends on thermaldiffusion. In case of a low thermal diffusivity, enhanced limiting species con-centration combined with weak heat flux from this region to the ambient gascauses a region of high temperature, illustrated in Fig. 2.10, left side. Thereby,burning velocity is locally increased in convex sections and consequently re-duced in concave sections. Flame wrinkling is enforced in this case. Other-wise, a high heat flux in case of high thermal diffusivity balances the burningvelocity distribution between convex and concave flame sections along theflame front. Flame wrinkling is thus reduced, see Fig. 2.10, right side. The ratio
8This can be observed not only for reactants, but also for intermediate species and products, resulting in acomplex pattern of diffusive fluxes.
27
Physics and Chemical Kinetics of H2–Air Explosions in Tubes
heat species
ReactantsProductsReactantsProducts
Le < 1
Ma < 0
(unstable)
Le > 1
Ma > 0
(stable)
heat
species
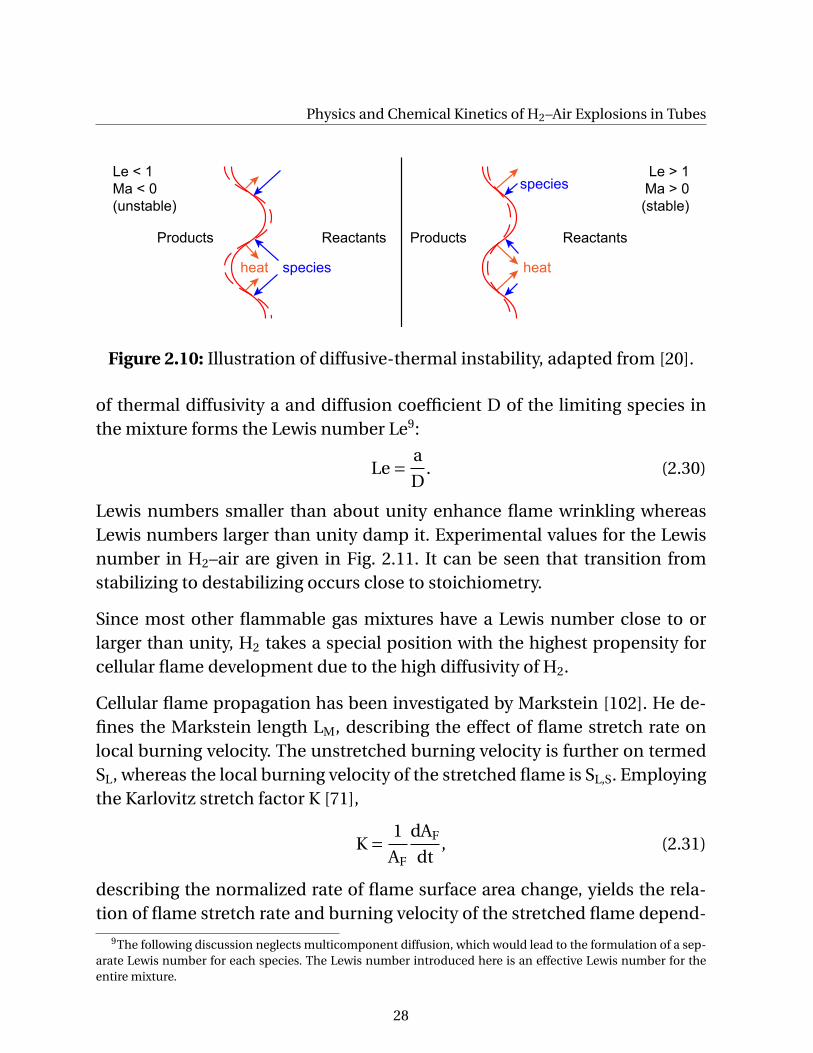
Figure 2.10: Illustration of diffusive-thermal instability, adapted from [20].
of thermal diffusivity a and diffusion coefficient D of the limiting species inthe mixture forms the Lewis number Le9:
Le =a
D. (2.30)
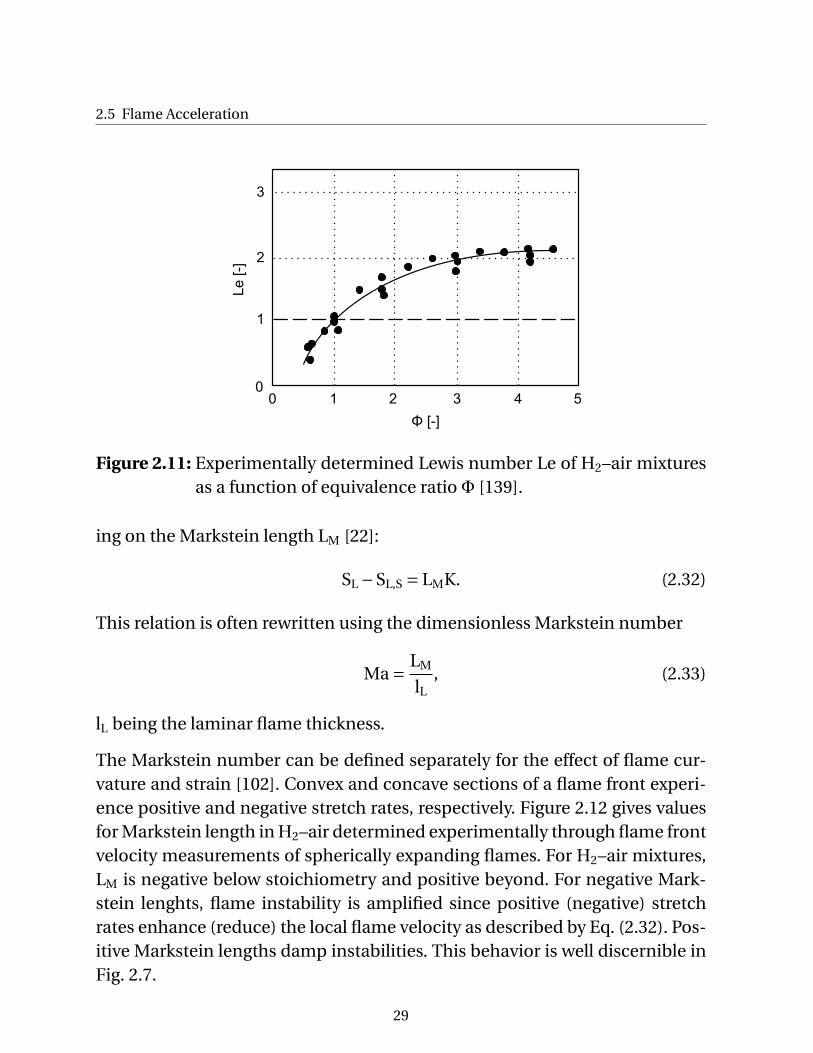
Lewis numbers smaller than about unity enhance flame wrinkling whereasLewis numbers larger than unity damp it. Experimental values for the Lewisnumber in H2–air are given in Fig. 2.11. It can be seen that transition fromstabilizing to destabilizing occurs close to stoichiometry.
Since most other flammable gas mixtures have a Lewis number close to orlarger than unity, H2 takes a special position with the highest propensity forcellular flame development due to the high diffusivity of H2.
Cellular flame propagation has been investigated by Markstein [102]. He de-fines the Markstein length LM, describing the effect of flame stretch rate onlocal burning velocity. The unstretched burning velocity is further on termedSL, whereas the local burning velocity of the stretched flame is SL,S. Employingthe Karlovitz stretch factor K [71],
K =1
AF
dAF
dt, (2.31)
describing the normalized rate of flame surface area change, yields the rela-tion of flame stretch rate and burning velocity of the stretched flame depend-
9The following discussion neglects multicomponent diffusion, which would lead to the formulation of a sep-arate Lewis number for each species. The Lewis number introduced here is an effective Lewis number for theentire mixture.
28
2.5 Flame Acceleration
Le
[-]
Φ [-]
3
2
1
00 1 2 3 4 5
Figure 2.11: Experimentally determined Lewis number Le of H2–air mixturesas a function of equivalence ratio Φ [139].
ing on the Markstein length LM [22]:
SL −SL,S = LMK. (2.32)
This relation is often rewritten using the dimensionless Markstein number
Ma =LM
lL, (2.33)
lL being the laminar flame thickness.
The Markstein number can be defined separately for the effect of flame cur-vature and strain [102]. Convex and concave sections of a flame front experi-ence positive and negative stretch rates, respectively. Figure 2.12 gives valuesfor Markstein length in H2–air determined experimentally through flame frontvelocity measurements of spherically expanding flames. For H2–air mixtures,LM is negative below stoichiometry and positive beyond. For negative Mark-stein lenghts, flame instability is amplified since positive (negative) stretchrates enhance (reduce) the local flame velocity as described by Eq. (2.32). Pos-itive Markstein lengths damp instabilities. This behavior is well discernible inFig. 2.7.
29
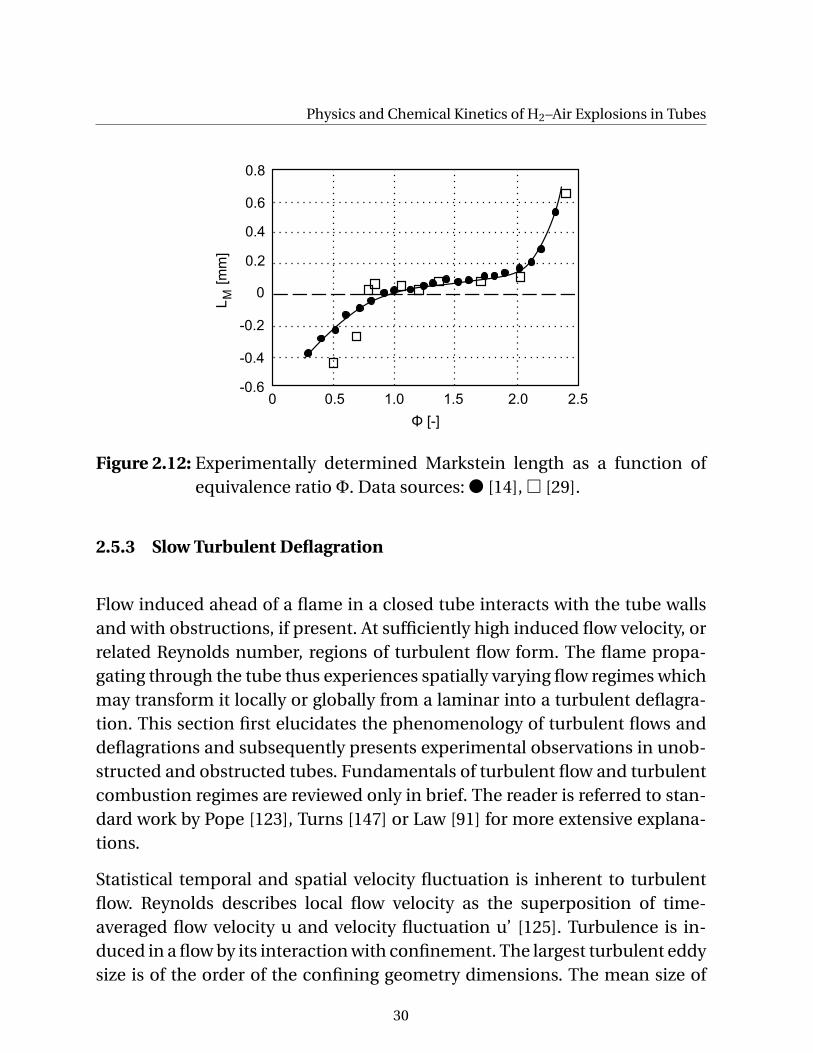
Physics and Chemical Kinetics of H2–Air Explosions in Tubes
L
[m
m]
0.8
0.6
0.4
0.2
0
-0.2
-0.4
-0.60 0.5 1.0 1.5 2.0 2.5
M
Φ [-]
Figure 2.12: Experimentally determined Markstein length as a function ofequivalence ratio Φ. Data sources: ● [14], � [29].
2.5.3 Slow Turbulent Deflagration
Flow induced ahead of a flame in a closed tube interacts with the tube wallsand with obstructions, if present. At sufficiently high induced flow velocity, orrelated Reynolds number, regions of turbulent flow form. The flame propa-gating through the tube thus experiences spatially varying flow regimes whichmay transform it locally or globally from a laminar into a turbulent deflagra-tion. This section first elucidates the phenomenology of turbulent flows anddeflagrations and subsequently presents experimental observations in unob-structed and obstructed tubes. Fundamentals of turbulent flow and turbulentcombustion regimes are reviewed only in brief. The reader is referred to stan-dard work by Pope [123], Turns [147] or Law [91] for more extensive explana-tions.
Statistical temporal and spatial velocity fluctuation is inherent to turbulentflow. Reynolds describes local flow velocity as the superposition of time-averaged flow velocity u and velocity fluctuation u’ [125]. Turbulence is in-duced in a flow by its interaction with confinement. The largest turbulent eddysize is of the order of the confining geometry dimensions. The mean size of
30
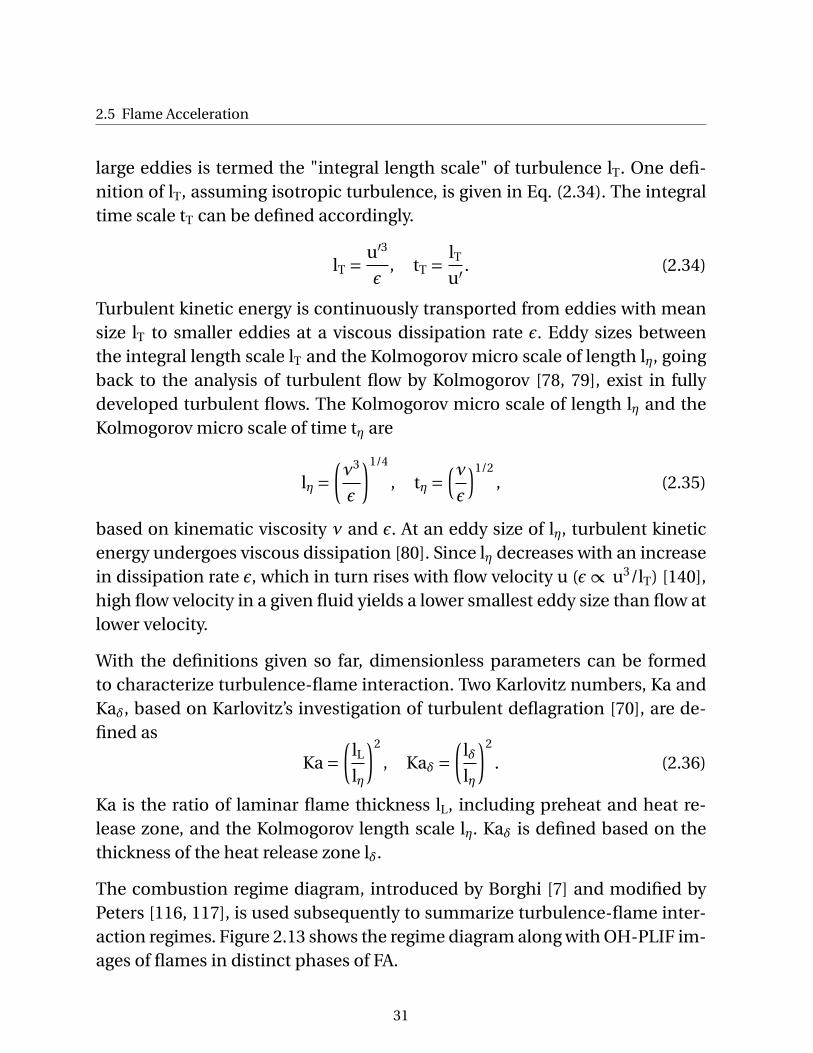
2.5 Flame Acceleration
large eddies is termed the "integral length scale" of turbulence lT. One defi-nition of lT, assuming isotropic turbulence, is given in Eq. (2.34). The integraltime scale tT can be defined accordingly.
lT =u′3
ǫ, tT =
lT
u′. (2.34)
Turbulent kinetic energy is continuously transported from eddies with meansize lT to smaller eddies at a viscous dissipation rate ǫ. Eddy sizes betweenthe integral length scale lT and the Kolmogorov micro scale of length lη, goingback to the analysis of turbulent flow by Kolmogorov [78, 79], exist in fullydeveloped turbulent flows. The Kolmogorov micro scale of length lη and theKolmogorov micro scale of time tη are
lη =
(
ν3
ǫ
)1/4
, tη =(ν
ǫ
)1/2, (2.35)
based on kinematic viscosity ν and ǫ. At an eddy size of lη, turbulent kineticenergy undergoes viscous dissipation [80]. Since lη decreases with an increasein dissipation rate ǫ, which in turn rises with flow velocity u (ǫ∝ u3/lT) [140],high flow velocity in a given fluid yields a lower smallest eddy size than flow atlower velocity.
With the definitions given so far, dimensionless parameters can be formedto characterize turbulence-flame interaction. Two Karlovitz numbers, Ka andKaδ, based on Karlovitz’s investigation of turbulent deflagration [70], are de-fined as
Ka =
(
lL
lη
)2
, Kaδ =
(
lδlη
)2
. (2.36)
Ka is the ratio of laminar flame thickness lL, including preheat and heat re-lease zone, and the Kolmogorov length scale lη. Kaδ is defined based on thethickness of the heat release zone lδ.
The combustion regime diagram, introduced by Borghi [7] and modified byPeters [116, 117], is used subsequently to summarize turbulence-flame inter-action regimes. Figure 2.13 shows the regime diagram along with OH-PLIF im-ages of flames in distinct phases of FA.
31
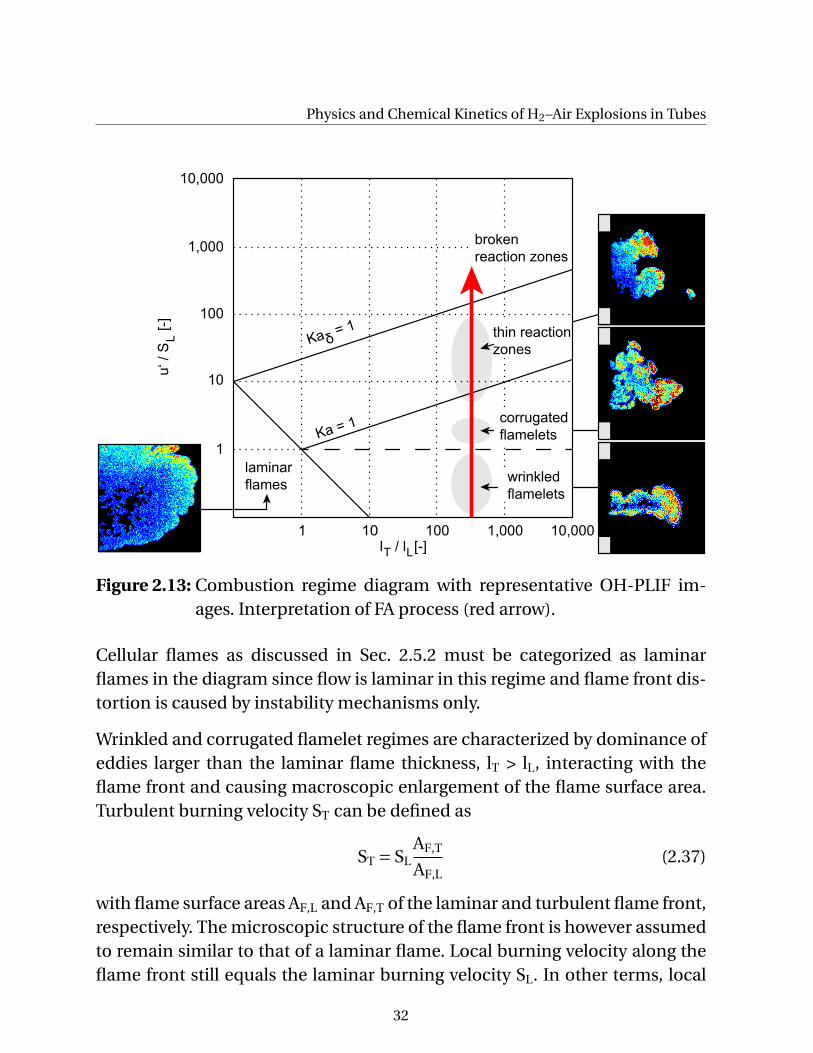
Physics and Chemical Kinetics of H2–Air Explosions in Tubes
laminar
flames
Ka = 1
Ka = 1δ
u‘ /
S
[-]
L
l / l [-]T L
1 10 100 1,000
1
10
100
1,000
wrinkled
flamelets
corrugated
flamelets
broken
reaction zones
thin reaction
zones
10,000
10,000
Figure 2.13: Combustion regime diagram with representative OH-PLIF im-ages. Interpretation of FA process (red arrow).
Cellular flames as discussed in Sec. 2.5.2 must be categorized as laminarflames in the diagram since flow is laminar in this regime and flame front dis-tortion is caused by instability mechanisms only.
Wrinkled and corrugated flamelet regimes are characterized by dominance ofeddies larger than the laminar flame thickness, lT > lL, interacting with theflame front and causing macroscopic enlargement of the flame surface area.Turbulent burning velocity ST can be defined as
ST = SLAF,T
AF,L(2.37)
with flame surface areas AF,L and AF,T of the laminar and turbulent flame front,respectively. The microscopic structure of the flame front is however assumedto remain similar to that of a laminar flame. Local burning velocity along theflame front still equals the laminar burning velocity SL. In other terms, local
32
2.5 Flame Acceleration
t = 0 μs t = 200 μs t = 400 μs
SL
ST
hL
hT,1
hT,2
ST
Figure 2.14: OH-PLIF sequence of a slow turbulent deflagration, unob-structed channel, 15 vol. %, homogeneous mixture. v̄ = 35 m/s.
transport of heat and species is not altered by large eddies.
At Ka > 1, transport of heat and species within the flame front is enhanced, thelocal burning velocity thus exceeds the laminar burning velocity. Eddies canpenetrate the flame front and increase transport of species and heat inside theflame front, which is otherwise only due to diffusion.
Kaδ describes the potential of turbulent eddies to penetrate the heat releasezone of a laminar flame. If Kaδ > 1, chemical reaction cannot be terminatedduring one eddy circulation. Reacting portions of gas are mixed with cold re-actants. Thus, local flame quenching can occur at Kaδ > 1. This poses an up-per boundary to the turbulent burning velocity ST. An approximation of max-imum turbulent burning velocity frequently used in safety analysis is 10 timesthe laminar burning velocity [20]. Even global flame quenching has been ob-served in experiments where flames passed an obstacle with a blockage ratio> 90 % [67]. This regime is however not relevant for the present work.
Turbulent regions in the fresh mixture ahead of the flame in an unobstructed
tube are restricted to the wall boundary layers. The flame front experienceswrinkling by turbulent eddies in these regions, visible in Fig. 2.14. This se-quence of OH-PLIF images was obtained experimentally in an unobstructedchannel configuration. It can be seen that the flame front is compact in the
33
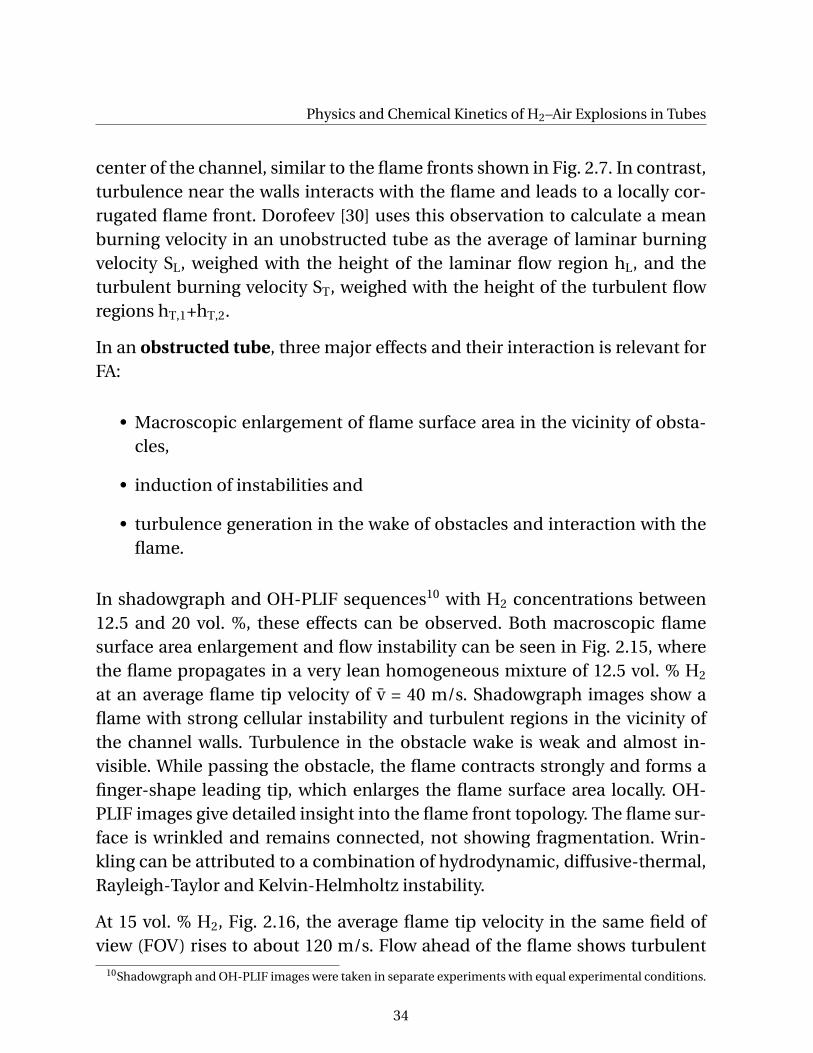
Physics and Chemical Kinetics of H2–Air Explosions in Tubes
center of the channel, similar to the flame fronts shown in Fig. 2.7. In contrast,turbulence near the walls interacts with the flame and leads to a locally cor-rugated flame front. Dorofeev [30] uses this observation to calculate a meanburning velocity in an unobstructed tube as the average of laminar burningvelocity SL, weighed with the height of the laminar flow region hL, and theturbulent burning velocity ST, weighed with the height of the turbulent flowregions hT,1+hT,2.
In an obstructed tube, three major effects and their interaction is relevant forFA:
• Macroscopic enlargement of flame surface area in the vicinity of obsta-cles,
• induction of instabilities and
• turbulence generation in the wake of obstacles and interaction with theflame.
In shadowgraph and OH-PLIF sequences10 with H2 concentrations between12.5 and 20 vol. %, these effects can be observed. Both macroscopic flamesurface area enlargement and flow instability can be seen in Fig. 2.15, wherethe flame propagates in a very lean homogeneous mixture of 12.5 vol. % H2
at an average flame tip velocity of v̄ = 40 m/s. Shadowgraph images show aflame with strong cellular instability and turbulent regions in the vicinity ofthe channel walls. Turbulence in the obstacle wake is weak and almost in-visible. While passing the obstacle, the flame contracts strongly and forms afinger-shape leading tip, which enlarges the flame surface area locally. OH-PLIF images give detailed insight into the flame front topology. The flame sur-face is wrinkled and remains connected, not showing fragmentation. Wrin-kling can be attributed to a combination of hydrodynamic, diffusive-thermal,Rayleigh-Taylor and Kelvin-Helmholtz instability.
At 15 vol. % H2, Fig. 2.16, the average flame tip velocity in the same field ofview (FOV) rises to about 120 m/s. Flow ahead of the flame shows turbulent
10Shadowgraph and OH-PLIF images were taken in separate experiments with equal experimental conditions.
34
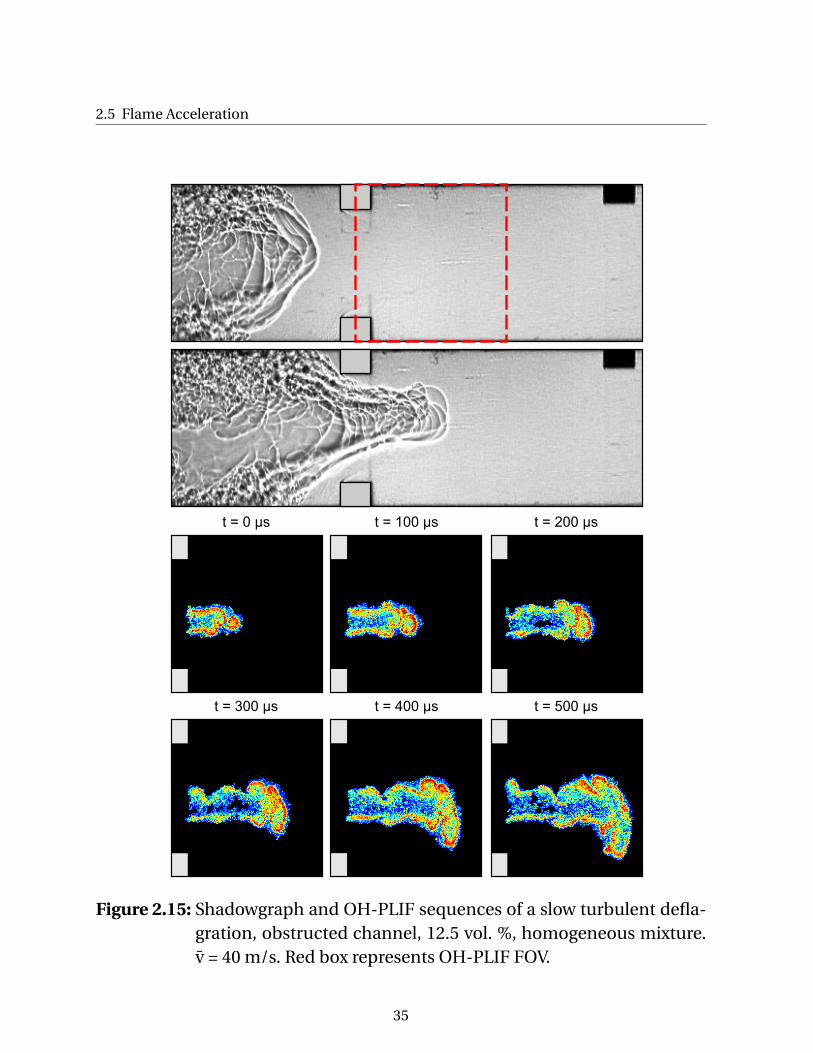
2.5 Flame Acceleration
t = 0 μs t = 100 μs t = 200 μs
t = 300 μs t = 400 μs t = 500 μs
Figure 2.15: Shadowgraph and OH-PLIF sequences of a slow turbulent defla-gration, obstructed channel, 12.5 vol. %, homogeneous mixture.v̄ = 40 m/s. Red box represents OH-PLIF FOV.
35
Physics and Chemical Kinetics of H2–Air Explosions in Tubes
fluctuations, well visible in the shadowgraph images. Wall boundary layer tur-bulence being present uptream of the obstacle is transported into the channelcenter through flow deflection by the obstacle. Additional turbulence is gen-erated by flow separation at the upstream obstacle edge. The flame surfaceis wrinkled on clearly smaller scale than in Fig. 2.15. The OH-PLIF sequenceshows that the flame surface is now fragmented, including separated flameislands. The formation and re-connection of such islands is a dynamic pro-cess. Obviously the two-dimensional OH-PLIF depiction of the flame frontis influenced by three-dimensional motion of flame front elements, so thatflame islands can be sectional images of flame fingers reaching into the imag-ing plane.
At 20 vol. %, Fig. 2.17, where average flame tip velocity equals 300 m/s, theflow pattern ahead of the flame clearly differs from the two preceding H2
concentrations. The most obvious difference is the formation of a turbulentshear layer, originating at the upstream edge of the obstacle plates. Black re-gions at the beginning of the shear layer are signs of expansion fans, indicat-ing transsonic flow. Weak gasdynamic structures can be seen in the obstacleopening. Thus, following the definition of slow and fast regimes given incipi-ently, this case marks transition from slow to fast deflagration. The flame frontis intensely wrinkled at very small scales and the reaction zone seems to bespatially extended. This suggests that turbulence interacts with the flame frontand Kaδ < 1 < Ka.
36
2.5 Flame Acceleration
t = 0 μs t = 50 μs t = 100 μs
t = 150 μs t = 200 μs t = 250 μs
Figure 2.16: Shadowgraph and OH-PLIF sequences of a slow turbulent defla-gration, obstructed channel, 15 vol. %, homogeneous mixture. v̄= 120 m/s. Red box represents OH-PLIF FOV.
37
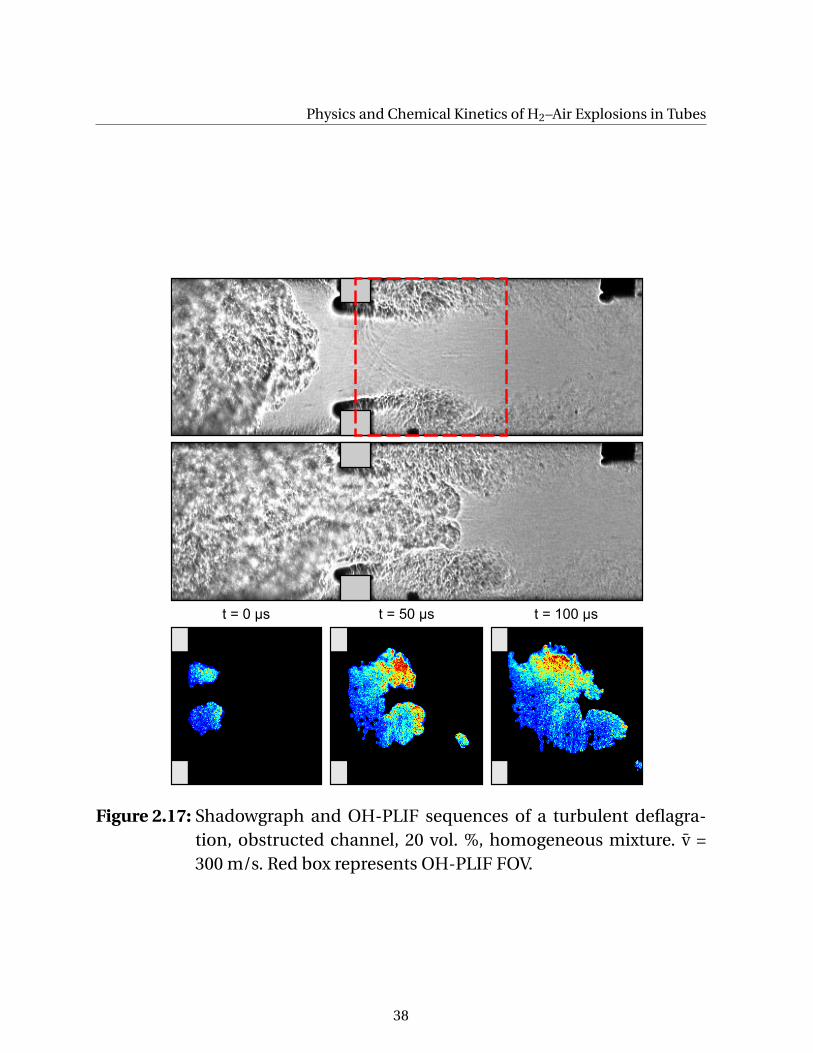
Physics and Chemical Kinetics of H2–Air Explosions in Tubes
t = 0 μs t = 50 μs t = 100 μs
Figure 2.17: Shadowgraph and OH-PLIF sequences of a turbulent deflagra-tion, obstructed channel, 20 vol. %, homogeneous mixture. v̄ =300 m/s. Red box represents OH-PLIF FOV.
38
2.5 Flame Acceleration
2.5.4 Fast Turbulent Deflagration
As defined in Sec. 2.5.3, the fast turbulent deflagration regime differs from theslow deflagration regime in the occurence of gasdynamic discontinuities andtheir interaction with the flame front. Consistent with the preceding sections,experimental results are used to introduce the physics of fast deflagration. TheFOV is equal to the one used in the previous section. To obtain fast deflagra-tions, H2 concentration is increased. At a flame speed of the order of 300–400m/s, shocks start to form. Images shown in Fig. 2.17 mark the transition fromslow to fast deflagration. This is further underscored by analyzing the same ex-periment at higher temporal resolution. Figure 2.18 comprises a shadowgraphsequence. In the first frame, t = 0 µs, turbulent flow in the obstacle wake as dis-cussed in Sec. 2.5.3 is visible. Weak compression waves can be seen upstreamof the obstacle continuously generated in the flame zone and being reflectedoff the obstacle. The second frame shows the formation of shocks by coales-cence of reflected pressure waves. They appear at the upper and lower chan-nel wall upstream of the obstacle. Since each pressure wave travelling at thelocal sound speed raises pressure incrementally, the following pressure wavepropagates in mixture of incrementally higher sound speed and catches upwith the pressure wave running ahead. Subsequent frames in Fig. 2.18 displaythe strengthening of the shocks and eventually their intersection at the chan-nel center line in the last frame. Since pressure wave reflection off an obstacleis involved here, formation of shocks in a channel occurs earlier if obstaclesare present compared to an unobstructed channel. The resulting difference inshock pattern ahead of the turbulent flame brush will be discussed at the endof this section.
At an H2 concentration of 25 vol. %, FA is more advanced in the FOV. Figure2.19 shows a great number of shocks, increasing in strength as the flame ap-proaches the obstacle. Reflected shocks interact with the flame. This shock-flame interaction and precompression of the fresh mixture by shocks is ofcrucial importance for the FA process within the fast deflagration regime. Re-cently Ciccarelli et al. [21] and Johansen [65] discussed the role of shock-flameinteraction, stating that turbulence may not be sufficient for experimentallyobserved strong FA to values of the order of 1000 m/s. Shock-flame interaction
39
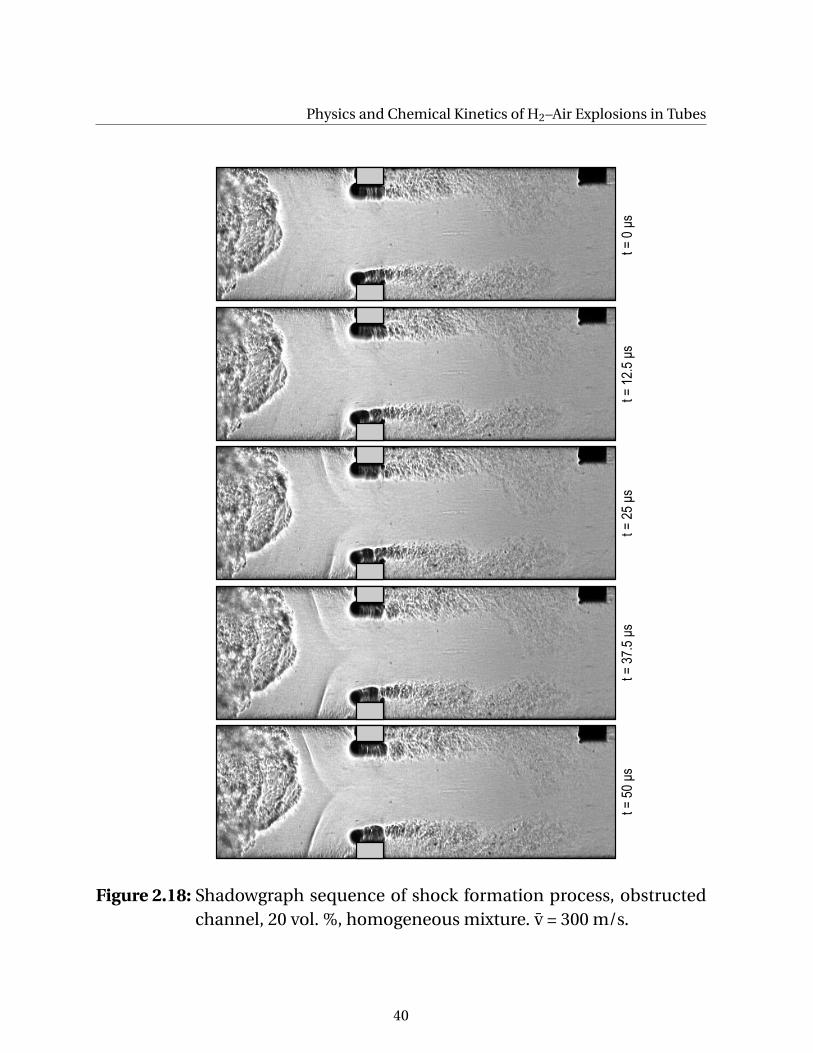
Physics and Chemical Kinetics of H2–Air Explosions in Tubes
t =
0 μ
st
= 1
2.5
μs
t =
25
μs
t =
37
.5 μ
st
= 5
0 μ
s
Figure 2.18: Shadowgraph sequence of shock formation process, obstructedchannel, 20 vol. %, homogeneous mixture. v̄ = 300 m/s.
40
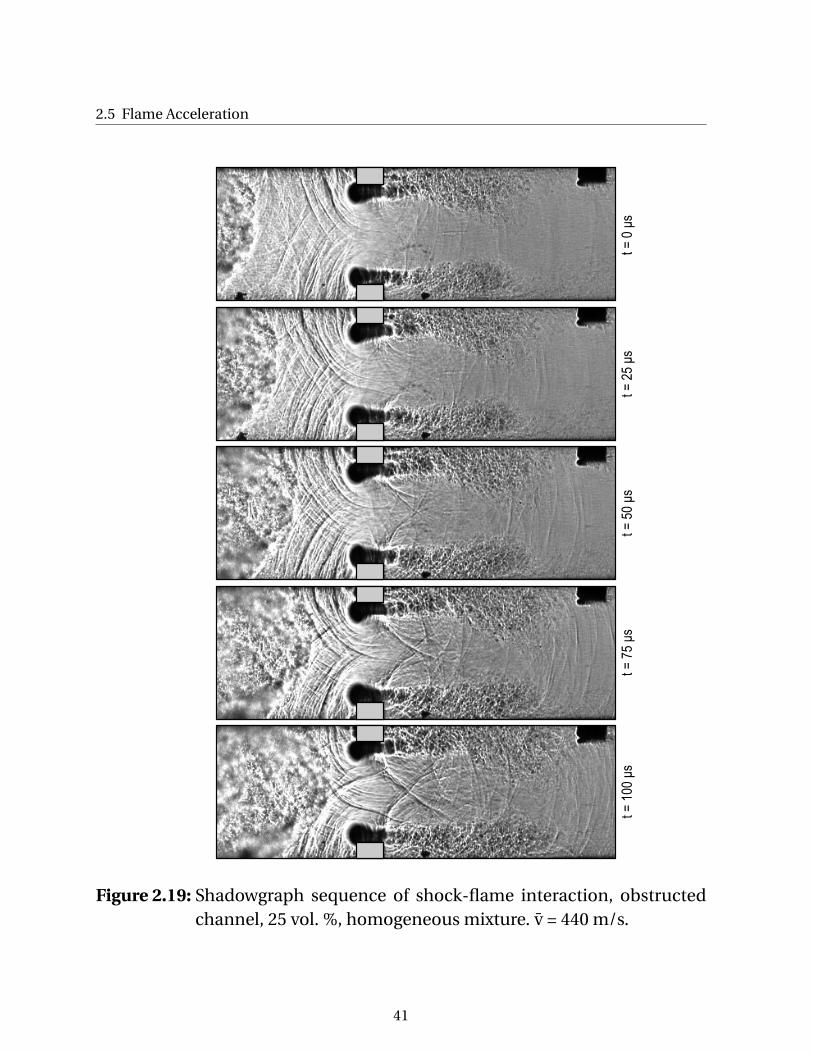
2.5 Flame Acceleration
t =
0 μ
st
= 2
5 μ
st
= 5
0 μ
st
= 7
5 μ
st
= 1
00
μs
Figure 2.19: Shadowgraph sequence of shock-flame interaction, obstructedchannel, 25 vol. %, homogeneous mixture. v̄ = 440 m/s.
41
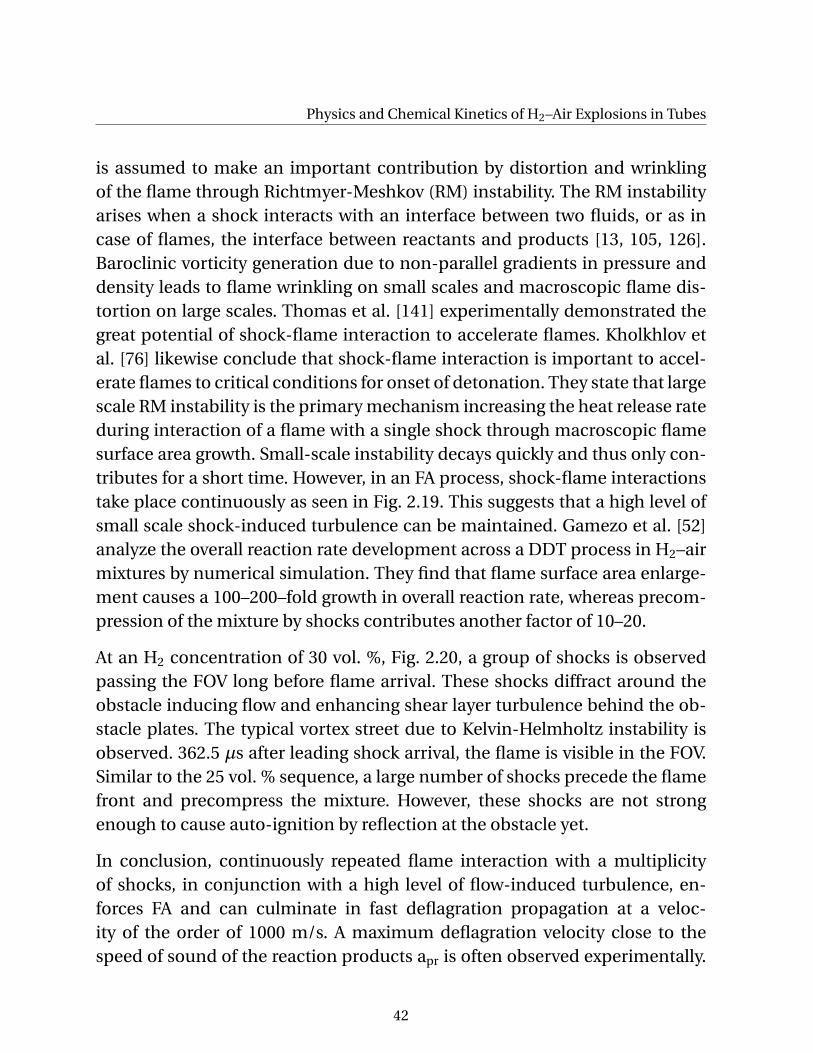
Physics and Chemical Kinetics of H2–Air Explosions in Tubes
is assumed to make an important contribution by distortion and wrinklingof the flame through Richtmyer-Meshkov (RM) instability. The RM instabilityarises when a shock interacts with an interface between two fluids, or as incase of flames, the interface between reactants and products [13, 105, 126].Baroclinic vorticity generation due to non-parallel gradients in pressure anddensity leads to flame wrinkling on small scales and macroscopic flame dis-tortion on large scales. Thomas et al. [141] experimentally demonstrated thegreat potential of shock-flame interaction to accelerate flames. Kholkhlov etal. [76] likewise conclude that shock-flame interaction is important to accel-erate flames to critical conditions for onset of detonation. They state that largescale RM instability is the primary mechanism increasing the heat release rateduring interaction of a flame with a single shock through macroscopic flamesurface area growth. Small-scale instability decays quickly and thus only con-tributes for a short time. However, in an FA process, shock-flame interactionstake place continuously as seen in Fig. 2.19. This suggests that a high level ofsmall scale shock-induced turbulence can be maintained. Gamezo et al. [52]analyze the overall reaction rate development across a DDT process in H2–airmixtures by numerical simulation. They find that flame surface area enlarge-ment causes a 100–200–fold growth in overall reaction rate, whereas precom-pression of the mixture by shocks contributes another factor of 10–20.
At an H2 concentration of 30 vol. %, Fig. 2.20, a group of shocks is observedpassing the FOV long before flame arrival. These shocks diffract around theobstacle inducing flow and enhancing shear layer turbulence behind the ob-stacle plates. The typical vortex street due to Kelvin-Helmholtz instability isobserved. 362.5 µs after leading shock arrival, the flame is visible in the FOV.Similar to the 25 vol. % sequence, a large number of shocks precede the flamefront and precompress the mixture. However, these shocks are not strongenough to cause auto-ignition by reflection at the obstacle yet.
In conclusion, continuously repeated flame interaction with a multiplicityof shocks, in conjunction with a high level of flow-induced turbulence, en-forces FA and can culminate in fast deflagration propagation at a veloc-ity of the order of 1000 m/s. A maximum deflagration velocity close to thespeed of sound of the reaction products apr is often observed experimentally.
42
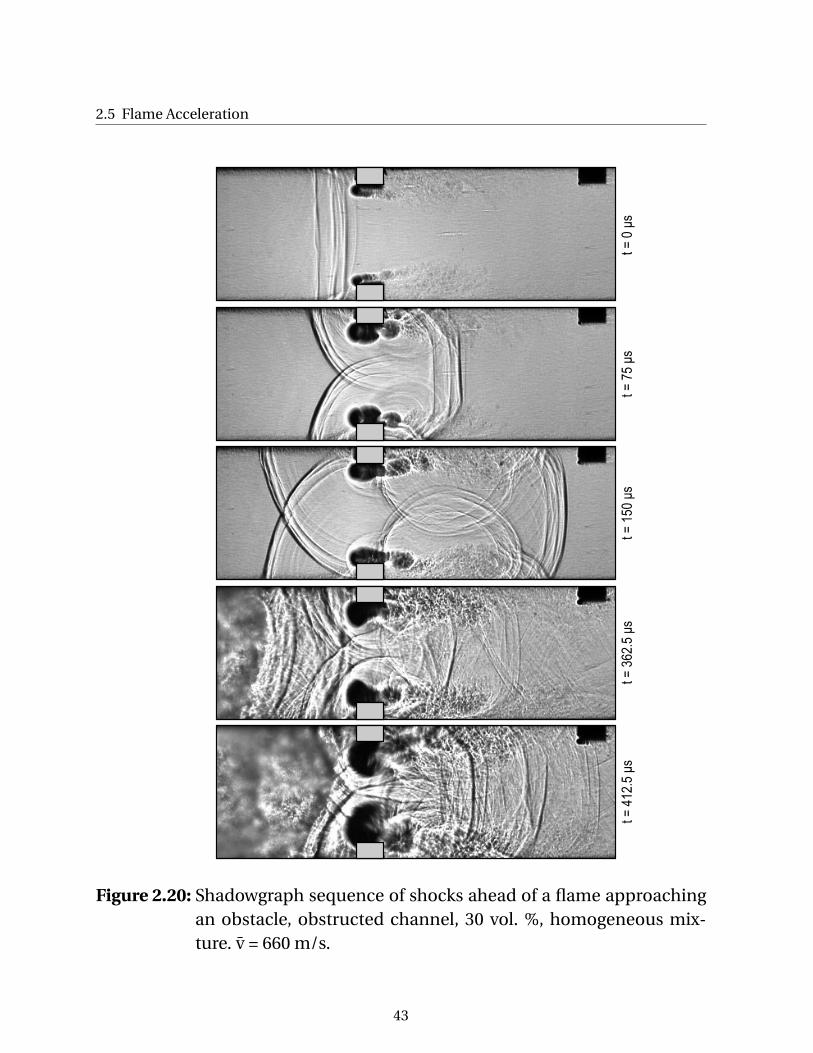
2.5 Flame Acceleration
t =
0 μ
st
= 7
5 μ
st
= 1
50
μs
t =
36
2.5
μs
t =
41
2.5
μs
Figure 2.20: Shadowgraph sequence of shocks ahead of a flame approachingan obstacle, obstructed channel, 30 vol. %, homogeneous mix-ture. v̄ = 660 m/s.
43
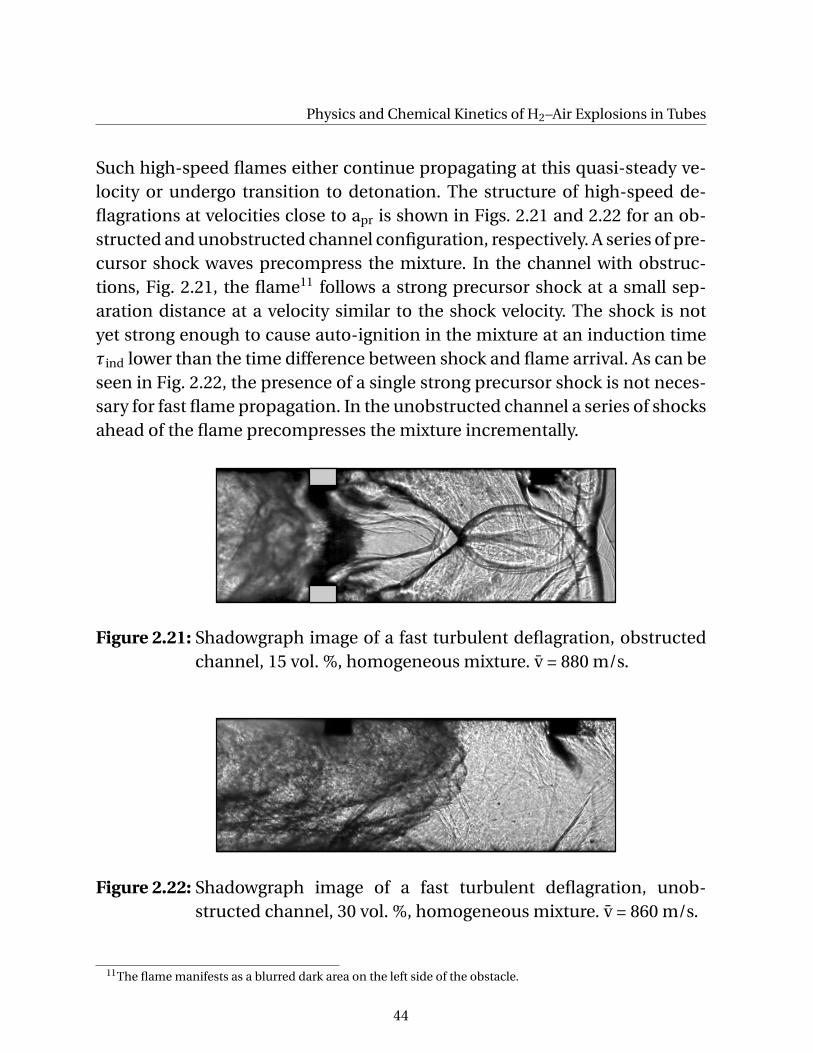
Physics and Chemical Kinetics of H2–Air Explosions in Tubes
Such high-speed flames either continue propagating at this quasi-steady ve-locity or undergo transition to detonation. The structure of high-speed de-flagrations at velocities close to apr is shown in Figs. 2.21 and 2.22 for an ob-structed and unobstructed channel configuration, respectively. A series of pre-cursor shock waves precompress the mixture. In the channel with obstruc-tions, Fig. 2.21, the flame11 follows a strong precursor shock at a small sep-aration distance at a velocity similar to the shock velocity. The shock is notyet strong enough to cause auto-ignition in the mixture at an induction timeτind lower than the time difference between shock and flame arrival. As can beseen in Fig. 2.22, the presence of a single strong precursor shock is not neces-sary for fast flame propagation. In the unobstructed channel a series of shocksahead of the flame precompresses the mixture incrementally.
Figure 2.21: Shadowgraph image of a fast turbulent deflagration, obstructedchannel, 15 vol. %, homogeneous mixture. v̄ = 880 m/s.
Figure 2.22: Shadowgraph image of a fast turbulent deflagration, unob-structed channel, 30 vol. %, homogeneous mixture. v̄ = 860 m/s.
11The flame manifests as a blurred dark area on the left side of the obstacle.
44
2.6 Onset of Detonation
2.6 Onset of Detonation
FA as described in the previous sections can create critical conditions for onsetof detonation. Ciccarelli and Dorofeev [20] divide onset mechanisms that canbe observed experimentally and numerically into the following groups:
• Detonation initiation through shock reflection or shock focusing and
• onset of detonation caused by instabilities and mixing processes (e.g.shock-flame interaction, explosion of a quenched mixture pocket, pres-sure and temperature fluctuations in flow and boundary layers).
An important similarity of all mechanisms has been discovered in numericalsimulations by Oran and co-workers, summarized in [111]. In each DDT sim-ulation they performed, the origin of detonation was a localized hot spot in asensitized mixture region, forming a local explosion which eventually evolvedinto a detonation wave. Urtiew and Oppenheim were the first to recognize thisphenomenon of "explosion in the explosion" [148]. The following discussionis structured by answering three questions, which reflect the sequence of sub-processes during the onset of detonation:
1. How can a hot spot be formed?
2. How can a detonation wave emerge from a hot spot?
3. How does a locally initiated detonation transition into the macroscopicconfining geometry?
The broad spectrum of answers to question (1) is outlined by Ciccarelli andDorofeev [20]. Each of the incipiently named two groups of mechanisms caninvolve the formation of a hot spot. A universal theory to predict the devel-opment of hot spots as a first crucial requirement for the onset of detonationis currently not available. It is typically observed that a change in geometri-cal configuration, for instance obstacle spacing or blockage ratio, changes thedominant onset mechanism. Two examples which are relevant for the present
45
Physics and Chemical Kinetics of H2–Air Explosions in Tubes
Figure 2.23: Simulated temperature fields for shock-induced ignition in stoi-chiometric ethylene-air mixture [111].
work are introduced here, namely shock reflection off a solid wall or obstacleand creation of a hot spot in the turbulent boundary layer behind a leadingshock in an unobstructed tube.
Oran and Gamezo [111] present simulations of ignition after shock reflectionat a solid wall in a stoichiometric ethylene-air mixture with non-slip bound-ary conditions, Fig. 2.23. The near-wall region is depicted after shock reflec-tion. The reflecting wall is located at the righthand image boundaries. Incidentshock Mach number is varied from 2.5 to 2.2. Due to high shock Mach num-bers, shock bifuration occurs after reflection12, which leads to the formationof an oblique shock close to the lower wall (lower image boundaries). This isclearly visible in case of MS = 2.5. For the highest incident shock Mach num-ber of MS = 2.5, ignition occurs directly along the reflecting wall, discernibleas a white area. It is independent of shock bifuration in this case. This corre-sponds to the strong ignition regime as discussed in Sec. 2.4. For lower shockMach numbers, the ignition location first relocates to a higher point at theend wall (MS = 2.4 and 2.3), which is due to the wall jet behind the bifurcatingshock [111]. At MS = 2.2, a hot spot forms at the lower wall in the turbulentwall boundary layer behind the reflected shock. From this hot spot a detona-tion may still evolve, cp. to the transitional regime between mild and strongignition, Sec. 2.4. Since spatial fluctuations in temperature and pressure are
12Shock bifuration occurs as an interaction of reflected shock and wall boundary layer. The higher the incidentshock Mach number and the lower the mixture heat capacity ratio γ, the more pronounced the bifurcation. Itis an important non-ideal effect in shock tubes that can falsify measurements of induction times. Backgroundinformation is given by [101].
46
2.6 Onset of Detonation
present behind the reflected shock and since induction time is highly sensi-tive to temperature in the high temperature regime under consideration, thelocation of hot spot formation is random.
In the wall boundary layer behind a shock travelling in an unobstructed chan-nel, a hot spot may form and cause onset of detonation. It is known that alocal explosion initiating detonation may either occur between the leadingshock and the turbulent flame brush or in the direct vicinity of the flame.Recently Dzieminska and Hayashi [37] showed a numerical investigation ofauto-ignition and DDT by shock-wave boundary layer interaction in H2–O2.They found that the wall boundary layer is continuously compressed by mul-tiple weak shock waves between a leading strong shock and the trailing flame.Auto-ignition occurs and a flame travels in the boundary layer towards theleading shock. At a certain point, a local explosion is observed that initiates adetonation. It is also possible that the initial auto-ignition triggers a detona-tion directly.
To address question (2), Zeldovich et al. [165, 166] proposed the mechanismof spontaneous wave formation in a region with a gradient in temperature andthus induction time ∇τind. They show that the spontaneous wave moves witha velocity DSP that is determined by the induction time gradient:
DSP =1
∇τind. (2.38)
Bartenev and Gelfand [3] give an overview of the large number of investiga-tions related to the Zeldovich gradient mechanism. Oran and Gamezo [111]present numerical simulations of hot spot formation involving spontaneouswave development. If the initial spontaneous wave velocity is higher than theChapman-Jouguet (CJ) velocity DCJ
13, the wave relaxes towards the CJ stateand can transform into a CJ detonation.
Lee et al. [93–95] proposed the SWACER (Shock Wave Amplification by Co-herent Energy Release) mechanism, which might be seen as a generalizationof the Zeldovich mechanism. The SWACER mechanism does not only con-sider gradients in temperature as a cause for gradients in induction time, but
13The concept of Chapman-Jouguet detonations is introduced in Sec. 2.7.
47
Physics and Chemical Kinetics of H2–Air Explosions in Tubes
also allows for other origins. Comparable to the well-known Rayleigh criterion[124], which is used in thermo-acoustics to describe the feedback of fluctua-tions in pressure and heat release rate, Lee et al. state that continuous explo-sion of infinitesimal mixture volumes behind a shock needs to satisfy a coher-ence criterion in order to amplify the shock. Similar to the spontaneous waveconcept, a gradient in induction time leads to the proper synchronization ofenergy release and shock wave motion. Theoretical studies can reproduce theSWACER mechanism, whereas its unambiguous experimental observation isstill missing. Experiments conducted within the scope of the present work donot deliver information on the relevance of the SWACER mechanism.
When a sufficiently strong shock capable of causing rapid auto-ignition is pro-duced in a hot spot explosion, it interacts with confining geometry and thetransient flow field in the vicinity of the hot spot. Initiation of detonation maystill fail at this early stage. Question (3) is treated by giving an example. Forthe present work, detonation initiation by shock reflection off an obstacle sur-face is highly relevant. This problem was studied for instance by Thomas [142]and Kellenberger and Ciccarelli [74]. Their results show the formation of a hotspot at the obstacle surface after shock reflection and an emerging detona-tion wave. This is in good agreement with the beforehand outlined mecha-nisms. Using the terminology introduced in Sec. 2.4, this process can also bedescribed as strong ignition. Thomas [142] provides detailed experiments andsimulations of the interaction of detonation waves produced by strong igni-tion after shock reflection at an obstacle with the flow field in the obstaclevicinity. He concludes that the expansion fan originating at the obstacle edge,as observed in Fig. 2.20 after shock passage at 75 µs, can interact with the det-onation wave emerging from the obstacle surface such that the detonation issubstancially mitigated and eventually fails. This observation leads to a cri-terion for detonation initiation by shock reflection at an obstacle, based oncomparison of obstacle height and induction time. If ϕ in Eq. (2.39) is lowerthat unity, detonation initiation fails.
ϕ=h
a1rτind,1r(2.39)
Here, a1r is speed of sound and τind,1r induction time behind the reflectedshock. Note that this geometrical criterion does not answer questions (1) and
48
2.6 Onset of Detonation
(2), but only addresses transition of a local explosion into the macroscopicgeometry.
A more empirical approach has been presented by Dorofeev et al. [31]. Theauthors suggest the so-called 7λ criterion which expresses that a characteris-tic length scale L of the confining geometry needs to be at least seven timeslarger than the detonation cell width λ. Again, this geometrical interpretationdoes not address questions (1) and (2) and thus does in principle not includethe formation of a local explosion as a requirement. Chemical kinetics of localexplosions is not considered.
To complete the discussion about onset of detonation at this point, it is im-portant to note that characteristic length scales of confining geometry needto be sufficiently large to allow for sustained detonation propagation. This isfurther discussed in Sec. 2.7.
49
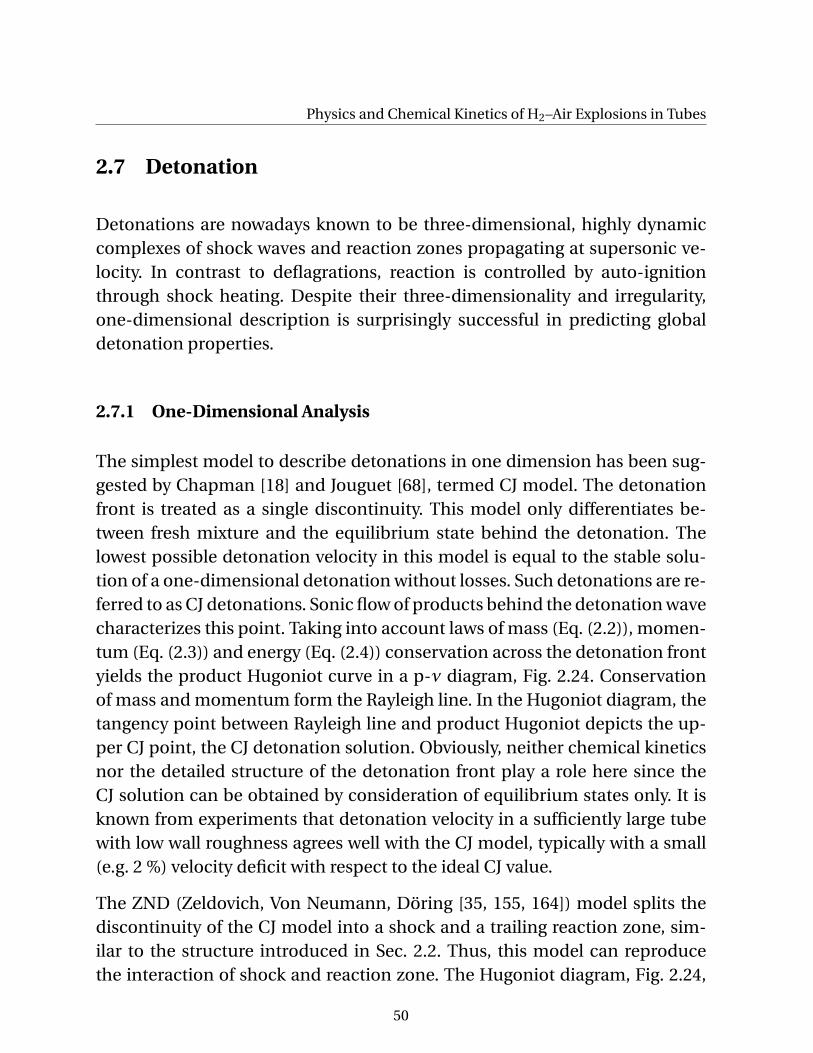
Physics and Chemical Kinetics of H2–Air Explosions in Tubes
2.7 Detonation
Detonations are nowadays known to be three-dimensional, highly dynamiccomplexes of shock waves and reaction zones propagating at supersonic ve-locity. In contrast to deflagrations, reaction is controlled by auto-ignitionthrough shock heating. Despite their three-dimensionality and irregularity,one-dimensional description is surprisingly successful in predicting globaldetonation properties.
2.7.1 One-Dimensional Analysis
The simplest model to describe detonations in one dimension has been sug-gested by Chapman [18] and Jouguet [68], termed CJ model. The detonationfront is treated as a single discontinuity. This model only differentiates be-tween fresh mixture and the equilibrium state behind the detonation. Thelowest possible detonation velocity in this model is equal to the stable solu-tion of a one-dimensional detonation without losses. Such detonations are re-ferred to as CJ detonations. Sonic flow of products behind the detonation wavecharacterizes this point. Taking into account laws of mass (Eq. (2.2)), momen-tum (Eq. (2.3)) and energy (Eq. (2.4)) conservation across the detonation frontyields the product Hugoniot curve in a p-ν diagram, Fig. 2.24. Conservationof mass and momentum form the Rayleigh line. In the Hugoniot diagram, thetangency point between Rayleigh line and product Hugoniot depicts the up-per CJ point, the CJ detonation solution. Obviously, neither chemical kineticsnor the detailed structure of the detonation front play a role here since theCJ solution can be obtained by consideration of equilibrium states only. It isknown from experiments that detonation velocity in a sufficiently large tubewith low wall roughness agrees well with the CJ model, typically with a small(e.g. 2 %) velocity deficit with respect to the ideal CJ value.
The ZND (Zeldovich, Von Neumann, Döring [35, 155, 164]) model splits thediscontinuity of the CJ model into a shock and a trailing reaction zone, sim-ilar to the structure introduced in Sec. 2.2. Thus, this model can reproducethe interaction of shock and reaction zone. The Hugoniot diagram, Fig. 2.24,
50
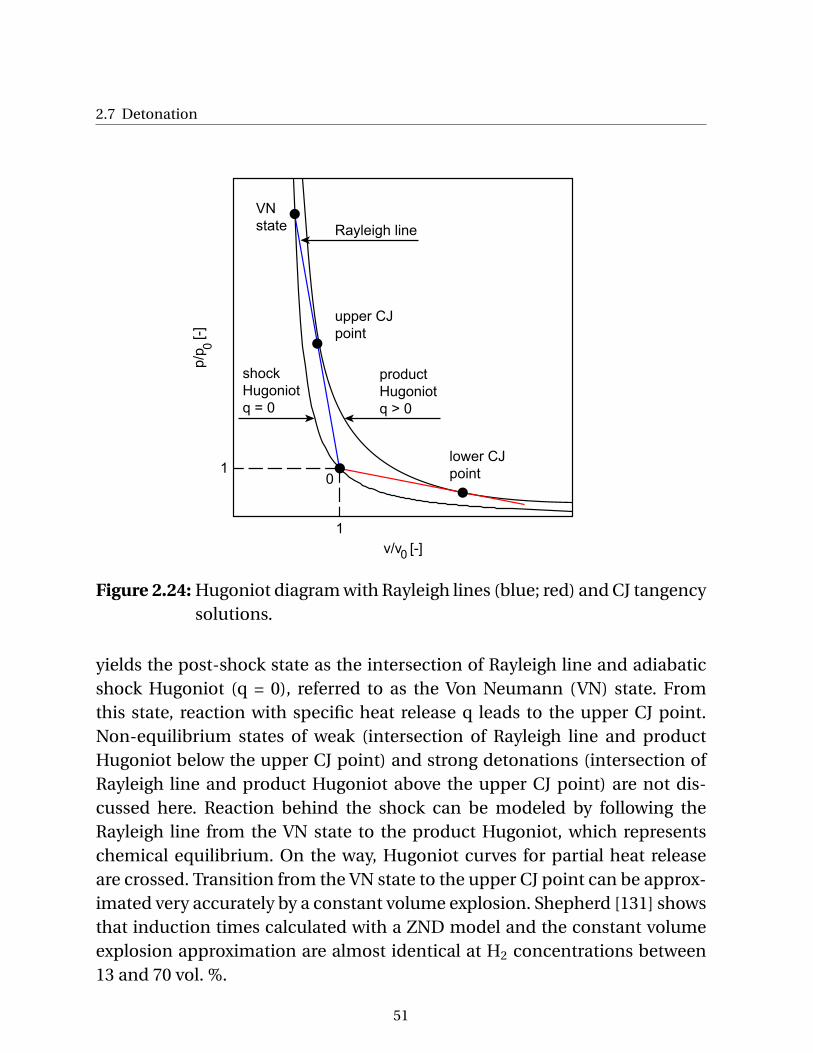
2.7 Detonation
0
v/v [-]
p/p
[-
]
0
0
shock
Hugoniot
q = 0
product
Hugoniot
q > 0
upper CJ
point
lower CJ
point1
1
VN
state Rayleigh line
Figure 2.24: Hugoniot diagram with Rayleigh lines (blue; red) and CJ tangencysolutions.
yields the post-shock state as the intersection of Rayleigh line and adiabaticshock Hugoniot (q = 0), referred to as the Von Neumann (VN) state. Fromthis state, reaction with specific heat release q leads to the upper CJ point.Non-equilibrium states of weak (intersection of Rayleigh line and productHugoniot below the upper CJ point) and strong detonations (intersection ofRayleigh line and product Hugoniot above the upper CJ point) are not dis-cussed here. Reaction behind the shock can be modeled by following theRayleigh line from the VN state to the product Hugoniot, which representschemical equilibrium. On the way, Hugoniot curves for partial heat releaseare crossed. Transition from the VN state to the upper CJ point can be approx-imated very accurately by a constant volume explosion. Shepherd [131] showsthat induction times calculated with a ZND model and the constant volumeexplosion approximation are almost identical at H2 concentrations between13 and 70 vol. %.
51
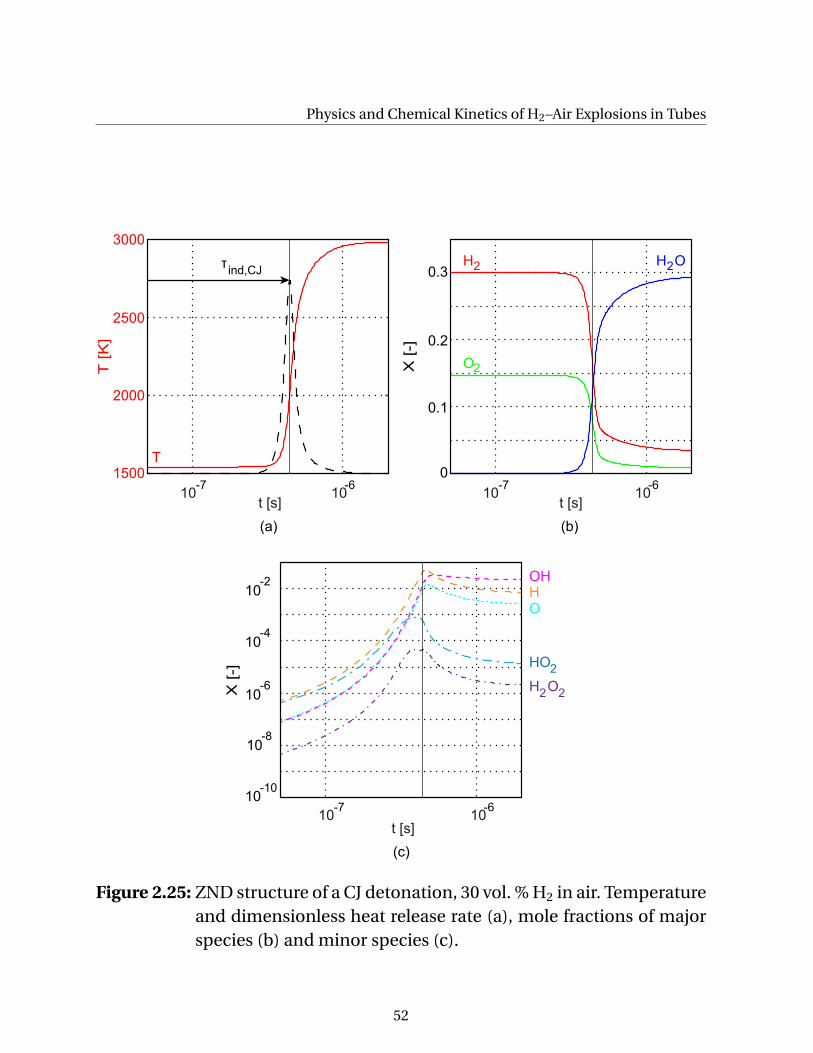
Physics and Chemical Kinetics of H2–Air Explosions in Tubes
τind,CJ
T [K
]
X [-]
1500
0.2
0
(b)
t [s]
2500
10
(a)
t [s]10
(c)
t [s]
2000
3000
0.1
0.3
X [-]
10
10
H
O
H O
OHHO
HO
H O -6
-10
10 -8
10 -4
10 -2
-7 -610 10
-7 -6
10 10-7 -6
2 2
2
2
2
2
T
Figure 2.25: ZND structure of a CJ detonation, 30 vol. % H2 in air. Temperatureand dimensionless heat release rate (a), mole fractions of majorspecies (b) and minor species (c).
52
2.7 Detonation
A ZND calculation of a CJ detonation in 30 vol. % H2 in air is shown in Fig.2.25. The precursor shock propagates at MCJ = 4.9 and heats the gas at t = 0 sto a post-shock temperature of about 1540 K. The induction period is nearlyisothermal. However, chain carriers (minor species) build up exponentially(c). Reaction is of combined thermal and chain-branching character. Induc-tion time τind,CJ is defined as the time difference between shock heating andthe maximum temperature gradient, which coincides with the point of maxi-mum heat release, shown as a dashed line in (a) (dimensionless depiction).
2.7.2 Three-Dimensional Structure
The structure of real detonation fronts greatly differs from beforehand dis-cussed one-dimensional models. A real detonation exhibits transverse insta-bility, which is typically required to sustain detonation propagation. A two-dimensional illustration of a detonation front is shown in Fig. 2.26. Transversewaves oscillate perpendicularly to incident shock sections. Detonations canbe classified according to their number of transverse waves in a given geom-etry as single-headed (one transverse wave) or multi-headed (more than onetransverse wave) detonations. Intersection of incident shocks and transversewaves forms Mach stems and triple points. Triple point trajectories create acellular pattern. Note that a regular pattern as shown in Fig. 2.26 as an in-structive example is only observed in highly stable detonations, for instanceachieved through high dilution with a monoatomic gas like argon [2]. Thewidth of a cell is termed detonation cell width λ. Mach stems exhibit a higherpost-shock pressure and temperature compared to the incident shock. Conse-quently, induction time behind Mach stem sections is lower than behind theincident shock. A shear layer emerges from the triple point due to gas veloc-ity differences behind Mach stem and incident shock. Following the reactionzone progressing through a detonation cell, it starts behind a Mach stem orig-inating at a triple point, which represents the point of transverse wave col-lision. Mach stem and reaction zone initially propagate at overdriven condi-tions with respect to CJ velocity DCJ. Propagation velocity ranges around 1.2DCJ [131]. The Mach stem subsequently decays in strength and thus velocityand transforms into the incident shock. Towards the end of a cell, velocity re-
53
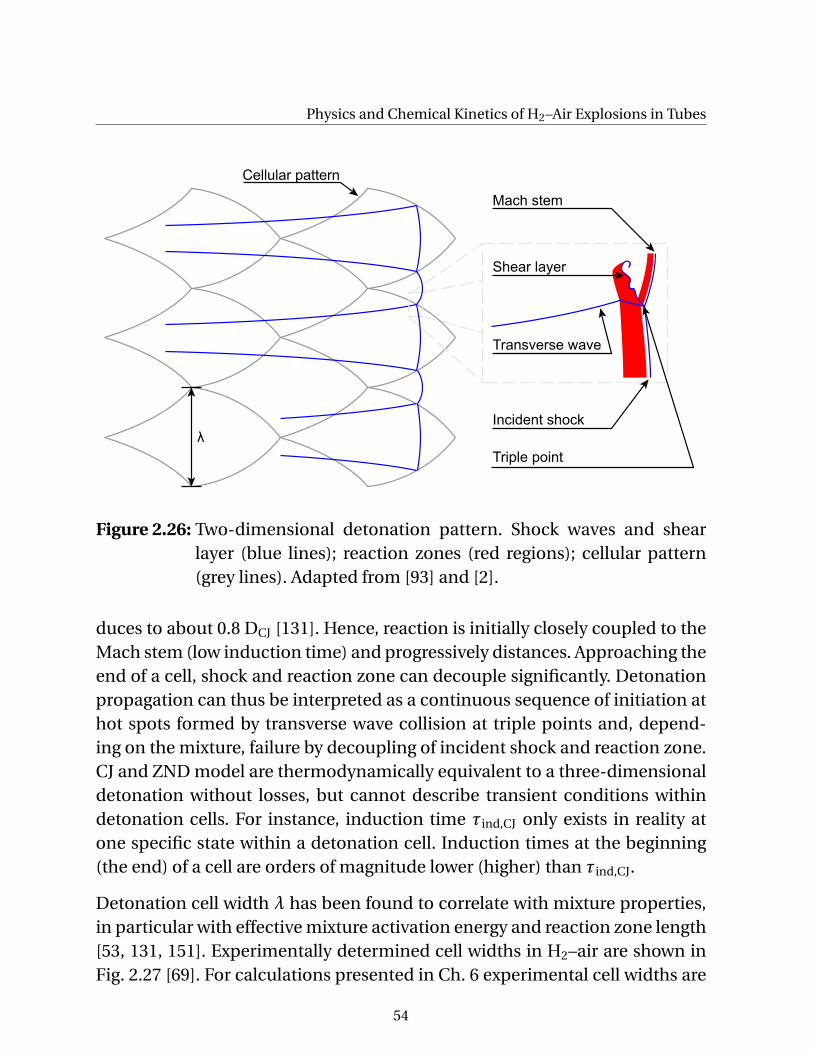
Physics and Chemical Kinetics of H2–Air Explosions in Tubes
λIncident shock
Mach stem
Transverse wave
Shear layer
Cellular pattern
Triple point
Figure 2.26: Two-dimensional detonation pattern. Shock waves and shearlayer (blue lines); reaction zones (red regions); cellular pattern(grey lines). Adapted from [93] and [2].
duces to about 0.8 DCJ [131]. Hence, reaction is initially closely coupled to theMach stem (low induction time) and progressively distances. Approaching theend of a cell, shock and reaction zone can decouple significantly. Detonationpropagation can thus be interpreted as a continuous sequence of initiation athot spots formed by transverse wave collision at triple points and, depend-ing on the mixture, failure by decoupling of incident shock and reaction zone.CJ and ZND model are thermodynamically equivalent to a three-dimensionaldetonation without losses, but cannot describe transient conditions withindetonation cells. For instance, induction time τind,CJ only exists in reality atone specific state within a detonation cell. Induction times at the beginning(the end) of a cell are orders of magnitude lower (higher) than τind,CJ.
Detonation cell width λ has been found to correlate with mixture properties,in particular with effective mixture activation energy and reaction zone length[53, 131, 151]. Experimentally determined cell widths in H2–air are shown inFig. 2.27 [69]. For calculations presented in Ch. 6 experimental cell widths are
54
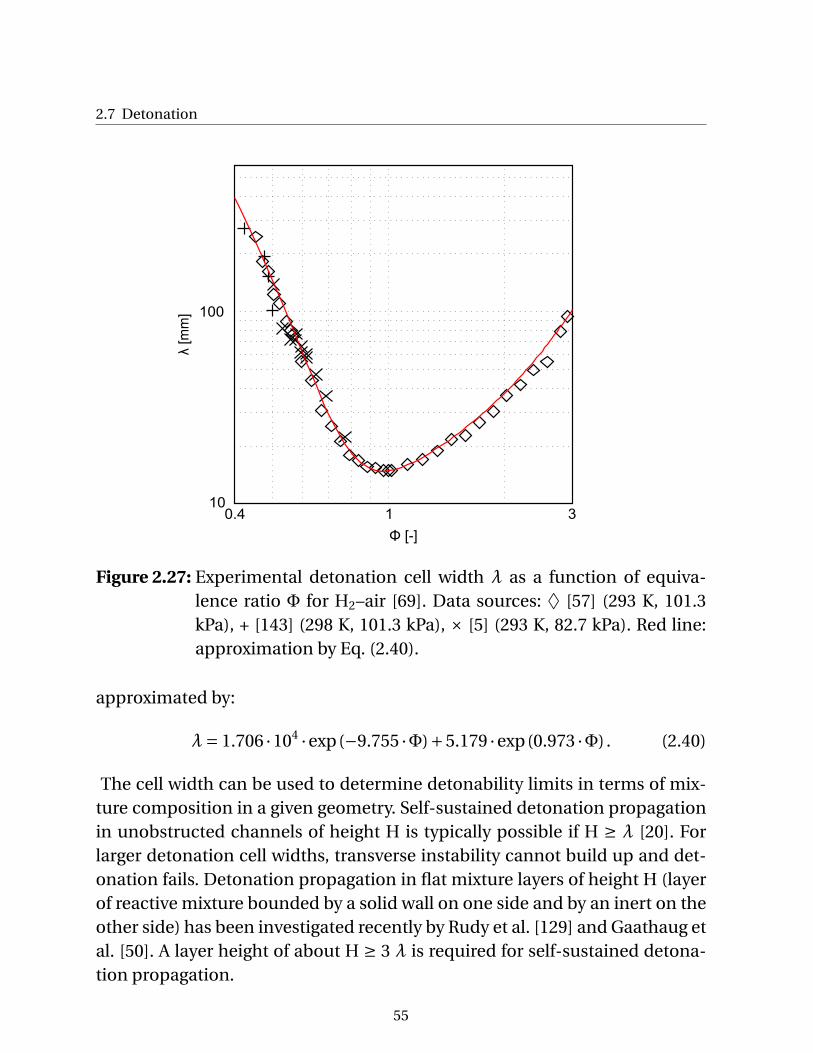
2.7 Detonation
10
100
0.4 1
λ [m
m]
Φ [-]
3
Figure 2.27: Experimental detonation cell width λ as a function of equiva-lence ratio Φ for H2–air [69]. Data sources: ♦ [57] (293 K, 101.3kPa), + [143] (298 K, 101.3 kPa), × [5] (293 K, 82.7 kPa). Red line:approximation by Eq. (2.40).
approximated by:
λ= 1.706 ·104·exp(−9.755 ·Φ)+5.179 ·exp(0.973 ·Φ) . (2.40)
The cell width can be used to determine detonability limits in terms of mix-ture composition in a given geometry. Self-sustained detonation propagationin unobstructed channels of height H is typically possible if H ≥ λ [20]. Forlarger detonation cell widths, transverse instability cannot build up and det-onation fails. Detonation propagation in flat mixture layers of height H (layerof reactive mixture bounded by a solid wall on one side and by an inert on theother side) has been investigated recently by Rudy et al. [129] and Gaathaug etal. [50]. A layer height of about H ≥ 3 λ is required for self-sustained detona-tion propagation.
55
Physics and Chemical Kinetics of H2–Air Explosions in Tubes
2.8 Mixture Inhomogeneity
Although inhomogeneous mixtures are likely to prevail in real-world explo-sion accident scenarios, their scientific investigation has drawn surprisinglylittle attention yet. This knowledge gap has been noticed by various authorsand renowned reports, e.g. [6, 12, 82]. Available studies on the topic can becategorized in terms of the relative orientation between concentration gradi-ents and main direction of flame propagation, parallel or transverse. To studyeither the former or the latter case is an appropriate means of reducing com-plexity compared to directly addressing three-dimensional gradients in explo-sive clouds. Although only transverse gradients are investigated experimen-tally and theoretically in the present work, inclusion of parallel gradients intothe discussion yields important conclusions regarding worst-case and realis-tic three-dimensional accident scenarios.
2.8.1 Parallel Concentration Gradients
Parallel concentration gradients are of particular interest if oriented vertically,thus additionally interacting with gravitational effects. This setting is for ex-ample highly relevant for nuclear reactors where the steam generator with ahigh degree of confinement resembles a long vertical tube, thus being exposedto a high DDT propensity [12]. As shown in Sec. 2.5.1, flammability limits forupward and downward flame propagation differ and can be substancially al-tered for a given volume by the presence of concentration gradients.
In case of globally very lean mixtures, ignition may be possible in a regionof elevated fuel concentration also if the average concentration is below theflammability limit. Combustion can potentially consume a larger share ofmixture and thus cause higher overpressure in an enclosure. Resulting peakoverpressure has been found to increase in globally lean mixtures of H2 andair [17, 158, 159].
It has furthermore been observed that maximum flame speed measured dur-ing flame passage through the gradient field of a mixture entirely within the
56
2.8 Mixture Inhomogeneity
flammability limits can be higher than the velocity observed in a homoge-neous mixture at equal average concentration [19, 161]. This depends on thelocation of ignition and the gradient orientation. Positive vertical gradients,lean at the bottom, with bottom ignition seem to cause stronger accelerationthan negative gradients [19]. Since only very few globally lean mixtures havebeen tested, generalized conclusions should however not be drawn precipi-tately. Detailed insight into the underlying physics has not been provided yet.
Sochet et al. published a series of papers on flame propagation in non-uniform clouds and vertical concentrations gradients [136, 137]. In their studyon vertical gradients in a tube [27], the authors observe potentially strongerFA with gradients, supporting previously outlined results. Only single obser-vations and rough trends are reported.
Sound quantification and modeling of explosions in mixtures with paral-lel concentration gradients is not available yet. A conservative approach forsafety considerations is to predict explosion characteristics based on a homo-geneous mixture of maximum locally existing reactivity. This however leads tounnecessarily high costs due to an overprediction of explosion consequencesand thus very conservative design.
2.8.2 Transverse Concentration Gradients
Major knowledge on the influence of transverse concentration gradients on
DDT in H2–air has been obtained by experimental and numerical work at theInstitute of Thermodynamics, Technical University of Munich, in cooperationwith ProScience GmbH and Karlsruhe Institute of Technology. While the for-mer group focused on entirely confined configurations at laboratory scale, thelatter performed large and laboratory scale semi-confined tests.
Vollmer et al. [153] presented first experiments from the same setup as usedin the present work. They showed that there can be a strong enforcing effectof concentration gradients on FA, particularly in a channel without obstruc-tions. A comprehensive quantitative characterization was not carried out atthat stage. It has been shown by the same authors [154] that probability of
57
Physics and Chemical Kinetics of H2–Air Explosions in Tubes
DDT can be increased by concentration gradients. A clear conclusion couldnot be drawn at this time since results for different geometrical configurationswere ambiguous. The final report of the corresponding research project [40]as well as the respective PhD thesis [152] include first optical observations offlames in gradient mixtures. It can be seen that flames tend to elongate in theunobstructed channel and thus considerably change their macroscopic shapein gradient mixtures.
Kuznetsov et al. [85] recently reported that DDT in mixtures with transversegradients in semi-confined geometries might be governed by the maximumlocal H2 concentration. These studies were carried out in the ProScience largescale explosion experiment. Average H2 concentrations were increased untilonset of detonation occurred. The experimental approach was to comparehomogeneous and inhomogeneous mixtures with equal maximum local hy-drogen concentrations. The overall amount of hydrogen in the explosion vol-ume was therefore different for homogeneous and inhomogeneous mixtures.Grune et al. [56] contribute experiments from a semi-confined small scaleexperiment, confirming the idea that the maximum local H2 concentrationdominates DDT propensity.
The following studies addressed detonation propagation in mixtures withtransverse concentration gradients. Ishii and Kojima [64] examined fuel-leanH2–O2 and H2–O2–N2 mixtures with transverse concentration gradients ex-perimentally in a detonation channel of 40 mm height. Relatively weak gra-dients were used. Local equivalence ratio ranged from about 0.7 to 1 in caseof the steepest gradient in H2–O2. Tilted detonation fronts were observed inschlieren measurements. Soot foils showed detonation cells adapting dynam-ically to the local mixture composition. The authors furthermore found a ve-locity deficit of detonations in gradient mixtures compared to homogeneousmixtures. The average equivalence ratio was not kept constant between differ-ent gradients which complicates the quantitative interpretation of results.
Ettner et al. [41] performed Euler simulations of detonations in H2-air mix-tures with transverse gradients. Curved multi-headed detonation fronts witha Mach-stem in the fuel-lean region were observed. The macroscopic deto-nation front shape remained constant over the propagation distance. Asym-
58
2.8 Mixture Inhomogeneity
metric wall pressure loads occurred, being highest in the region of lowest fuelconcentration due to Mach-stem formation.
Kessler et al. [75] presented simulations in mixtures with varying activationenergy and transverse gradients. They found a complex structure of the reac-tion zone including regions with delayed deflagrative combustion behind thedetonation front. A deficit in propagation velocity of about 5–10 % was ob-served compared to the Chapman-Jouguet velocity DCJ. This was comparedto results by Calhoon and Sinha [16] who computed detonation velocities ofabout 94 % DCJ before the gradients caused failure of the detonation. Localdecoupling of shock and reaction zone was observed.
As will be shown in Ch. 6, detonations in transverse concentration gradientscan exhibit similar characteristics as detonations propagating in two layers ofmixture with different reactivity. More literature exists on such configurations.Dabora et al. [25] reported a velocity deficit of detonations in layers of H2–O2
bounded by N2. A velocity deficit beyond 8–10 % lead to failure of detonation.Near this limit spinning detonations were observed.
Oran et al. [112] numerically studied detonation transmission in H2–O2 froma primary to a secondary mixture. The authors compared their results to ex-perimental work by Liu et al. [99]. Characteristic detonation patterns formeddepending on the relative values of Chapman-Jouguet velocities of primaryand secondary mixture. Detonations either failed or re-initiated in the sec-ondary mixture. The authors pointed out that the unsteadiness of detonationtransmission needs to be considered for predicting the detonation pattern.
Tonello et al. [145] investigated layered H2–O2 mixtures experimentally. Simi-lar to the aforementioned studies different types of diffraction patterns wereobserved depending on the respective reactivities of primary and secondarymixture. The detonation velocity in the mixture of higher reactivity was de-creased while that in the other mixture was increased.
Lieberman and Shepherd [97] investigated detonation interaction with a dif-fuse interface between two mixture layers. They concluded that detonationscurve and decoupling of shock and reaction zone may occur, depending onthe local mixture dilution.
59
Physics and Chemical Kinetics of H2–Air Explosions in Tubes
In a more recent study Rudy et al. [129] investigated critical conditions of lay-ered H2-air detonations in a semi-confined large-scale experiment. The mix-ture was bounded by a solid wall on the top and by air on the bottom. Forhomogeneous layers a minimum layer height for detonation propagation cor-responding to 3 times the detonation cell size was found. They also examinedmixtures with nearly linear transverse concentration gradients. Local concen-trations were kept below stoichiometry. The mean H2 concentration withinthe detonation layer needs to exceed approximately 16.6 vol. % to allow fordetonation propagation. Locally, no detonation is observed if the local H2 con-centration falls below 14 vol. %.
Numerical simulations of detonations in layers of generic mixtures were re-cently presented by Gaathaug et al. [50] with a particular focus on the role ofdetonation front stability. A critical layer height of about 3 detonation cells forlow activation energy mixtures (moderately stable) was determined. Failureand re-initiation of detonation was observed for high activation energy mix-tures (unstable).
60
3 Experimental Setup
The experimental setup used in this work is a classical explosion channel. Itwas developed by and manufactured under supervision of K.G. Vollmer. De-tails are given in the respective PhD thesis [152] and the final project report[40], but shall be reviewed here for completeness. Besides information on de-sign philosophy and geometry, Sec. 3.1 provides a list of geometrical configu-rations discussed in this work. Section 3.2 describes mixture preparation. Theexperimental procedure is outlined in Sec. 3.3. Measurement techniques ap-plied are seperately introduced in Ch. 4.
3.1 Overview, Geometry and Configurations
The explosion channel operated at the Institute of Thermodynamics, Techni-cal University of Munich, is comparable to typical explosion test facilities withhigh aspect ratio (length-to-diameter/width ratio). The basic idea to reach fastcombustion regimes on laboratory scale is to provide a high degree of confine-ment and congestion realized as an entirely closed channel equipped withevenly spaced obstacles. This type of experiment was extended by a mecha-nism for the generation of transverse concentration gradients. Mild ignition isimplemented by means of an electric spark.
Figure 3.1 provides a schematic of the setup. The channel is composed of sixsegments. Solid plates, referred to as ignition and end plate, close the channelat both sides. At this point, the coordinate system used throughout the presentwork is introduced: axial direction x, vertical direction y and lateral directionz as marked in Fig. 3.1. Standard segments with a length of 0.9 m and oneoptical segment (OS) with a length of 0.6 m are available. The channel canbe operated with six standard segments, resulting in a total length of 5.4 m,
61
Experimental Setup
Channel cross-section
0.15 m
0.03 m z
y
Ignition source
0.3 m
0.06 m
Optical segment (OS5)
Ignition
plate
End
plateStandard segment
0.9 m 0.6 m
5.1 m
x
z
Figure 3.1: Schematic of experimental setup, exemplary configuration OS5.Facility top view (top) and explosion volume cross section (bot-tom).
or with five standard segments and the optical segment, giving a total lengthof 5.1 m. The optical segment can be placed at arbitrary positions along thechannel, denoted OS1 (optical segment at position 1, x = 0 m to x = 0.6 m),OS2 etc.
The explosion volume cross-section has a width of 0.3 m and a height of 0.06m. Underneath this volume, an additional volume intended for investigationof transverse venting is located. Explosion volume and venting volume areseparated by solid plates. Only experiments without venting are discussedwithin the present work, thus the separation plates are installed at any time.
Notches in the top and separation plates at an equal spacing of 0.1 m allow forinstallation of obstacles. The channel either remains unobstructed (notchesare covered with H2 injection manifolds at the top and with flat inlays at the
62
3.1 Overview, Geometry and Configurations
12 mm
h
H
Figure 3.2: Obstacle geometry. Side view.
(a)
(c)
(b)
Figure 3.3: Top obstacles BR60 (a), BR30 (b) and injection manifold (c). Crosssectional cut through injection plane.
bottom) or flat plate obstacles with a blockage ratio (BR) of 30 or 60 % are em-ployed. Blockage ratio is defined as BR = 2h / H, cp. Fig. 3.2. Obstacle thicknessis 0.012 m. Figure 3.3 shows the three types of channel top installations.
In the predecessor project conducted by Ettner and Vollmer [40], the channelwas divided into an obstacle section beginning at x = 0.25 m and ending atx = 2.05 m and an unobstructed subsequent section. This setup was initiallyadopted in the present study to ensure comparability with previous results.Limitations due to the short obstacle section length were encountered andovercome by an additional configuration with an extended obstacle sectionbeginning at x = 0.25 m and ending at x = 4.95 m.
The following notation is used to identify geometrical configurations:
BRxxSyyy(L). (3.1)
BR stands for blockage ratio, xx is the respective value in %, S for obstaclespacing, yyy is the spacing value in mm and the long obstacle section con-
63
Experimental Setup
Table 3.1: Geometrical configurations discussed in the present work.
Notation Blockage ratio Spacing Obstacle section[%] [m] [m]
BR00 2BR60S300 60 0.3 0.25-2.05BR30S300 30 0.3 0.25-2.05BR30S300L 30 0.3 0.25-4.95
figuration is identified by the character L. Configurations discussed within thepresent work are listed in Tab. 3.1. Note that the subsequently described H2
injection mechanism effects a small blockage ratio of 2 % in the unobstructedconfiguration BR00.
3.2 Generation of Transverse Concentration Gradients
Figure 3.4 illustrates the generation of concentration gradients. The last ob-stacle of BR60S300 (x = 2.05 m) and the first injection manifold of the unob-structed channel section (x = 2.15 m) are depicted. First, the channel is filledwith ambient air. Using a vacuum pump, the volume is partially evacuated.Initial pressure prior to H2 injection depends on the requested H2 concentra-tion and is calculated by the method of partial pressures. Then, H2 at a pres-sure of 8 bar from a gas cylinder is injected through a regular pattern of in-jection ports in the facility top plate (1). This pattern is shown in Fig. 3.5 for astandard segment. Each row of ports comprises three ports across the channelwidth. Axial positions of rows coincide with notch positions in the top plate.Distributors connect 9 injection ports each to the H2 supply system. In eachdistributor, a 0.9 mm aperture controls the flow rate.
The H2 flow is deflected inside the channel, forming a compact horizontal H2
layer along the channel top (2). At obstacle positions in the obstructed chan-nel section, H2 deflection is achieved by slots in the upper obstacles. Positionsbetween obstacles as well as top plate notches in the unobstructed section areequipped with manifolds protruding into the channel at the upper wall (cp.
64
3.2 Generation of Transverse Concentration Gradients
td
(1) (1)
(2)
(3)(4)
Figure 3.4: Creation of transverse concentration gradients. Gas injection (1),deflection (2), diffusion (3), formed gradients (4). Side view.
100 mm
100 mm
50 mm
distributor
Figure 3.5: H2 injection port pattern in a standard channel segment. Top view.
Fig. 3.3 (c)). These manifolds do not significantly influence the DDT processas will be discussed in Ch. 5. Likewise, they are not responsible for detonationphenomena observed in this work, see Ch. 6. Vertical concentration gradientsform due to diffusion (3). The orientation of resulting gradients (4) is thus nor-mal to the main direction of explosion front propagation.
Gradients of defined slope can be generated by controlling the diffusion timetd between H2 injection and ignition. A diffusion time of 60 s yields a homoge-neous mixture, whereas a diffusion time of 3 s results in a steep concentrationgradient. Further diffusion times of 10 s, 7.5 s and 5 s are investigated in the
65
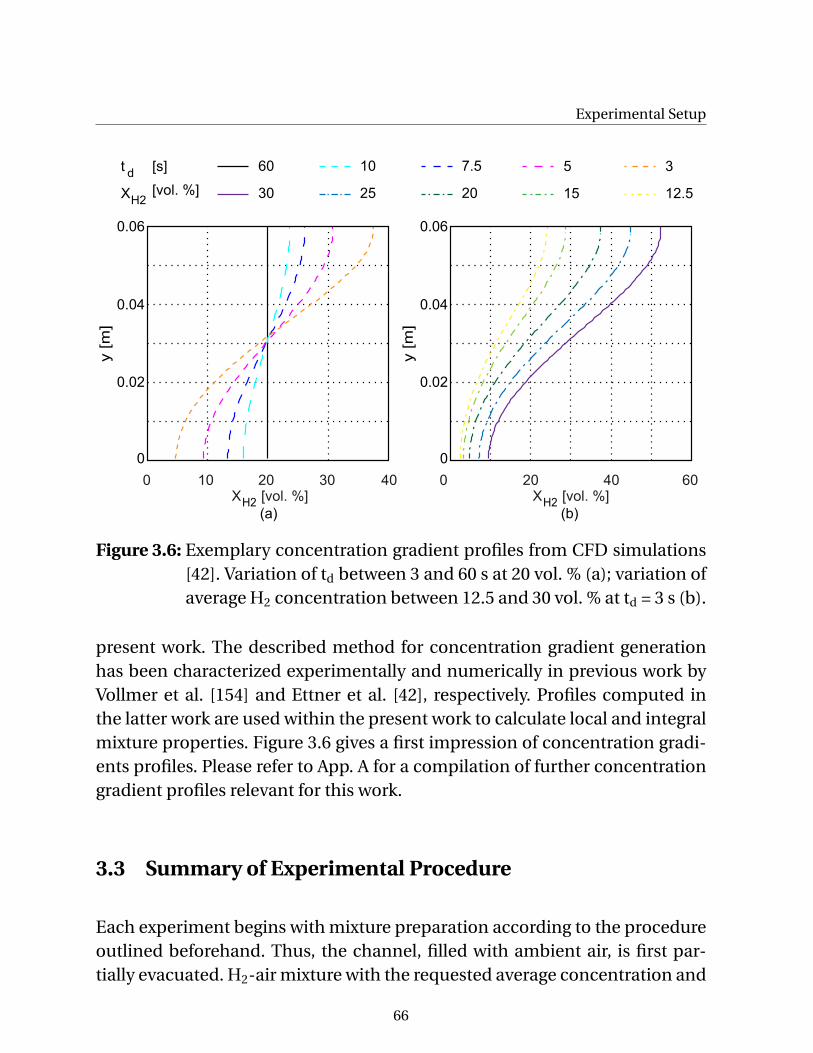
Experimental Setupy [m
]
0
0.04
0.02
0.06
y [m
]
0
0.04
0.02
0.06
0 20 40
(b)
X [vol. %]60
H2
10 20 30
(a)
X [vol. %]40
H2
X H2
30 25 20 15 12.5
t d
60 10 7.5 5 3[s]
[vol. %]
0
Figure 3.6: Exemplary concentration gradient profiles from CFD simulations[42]. Variation of td between 3 and 60 s at 20 vol. % (a); variation ofaverage H2 concentration between 12.5 and 30 vol. % at td = 3 s (b).
present work. The described method for concentration gradient generationhas been characterized experimentally and numerically in previous work byVollmer et al. [154] and Ettner et al. [42], respectively. Profiles computed inthe latter work are used within the present work to calculate local and integralmixture properties. Figure 3.6 gives a first impression of concentration gradi-ents profiles. Please refer to App. A for a compilation of further concentrationgradient profiles relevant for this work.
3.3 Summary of Experimental Procedure
Each experiment begins with mixture preparation according to the procedureoutlined beforehand. Thus, the channel, filled with ambient air, is first par-tially evacuated. H2-air mixture with the requested average concentration and
66
3.3 Summary of Experimental Procedure
transverse gradient is prepared. Subsequently, the mixture is ignited at x = 0m by an electric spark. Measurement systems are triggered off the ignitionsignal. After explosion, the channel is flushed with air for about 5 min to ex-haust combustion products. The setup is then ready for the next experiment.Following this experimental procedure, the setup provides excellent repro-ducibility and a high test repetition rate with a total time for one experimentbelow 10 min.
67
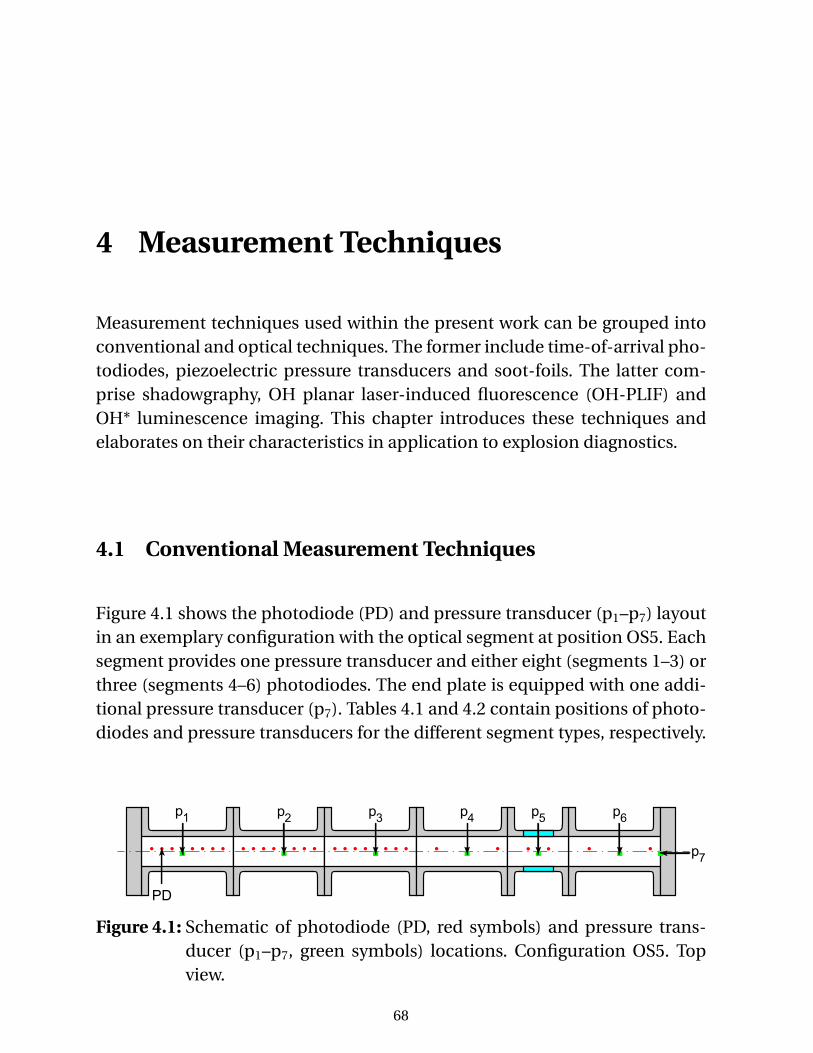
4 Measurement Techniques
Measurement techniques used within the present work can be grouped intoconventional and optical techniques. The former include time-of-arrival pho-todiodes, piezoelectric pressure transducers and soot-foils. The latter com-prise shadowgraphy, OH planar laser-induced fluorescence (OH-PLIF) andOH* luminescence imaging. This chapter introduces these techniques andelaborates on their characteristics in application to explosion diagnostics.
4.1 Conventional Measurement Techniques
Figure 4.1 shows the photodiode (PD) and pressure transducer (p1–p7) layoutin an exemplary configuration with the optical segment at position OS5. Eachsegment provides one pressure transducer and either eight (segments 1–3) orthree (segments 4–6) photodiodes. The end plate is equipped with one addi-tional pressure transducer (p7). Tables 4.1 and 4.2 contain positions of photo-diodes and pressure transducers for the different segment types, respectively.
PD
p1
p2
p3
p4
p5
p6
p7
Figure 4.1: Schematic of photodiode (PD, red symbols) and pressure trans-ducer (p1–p7, green symbols) locations. Configuration OS5. Topview.
68
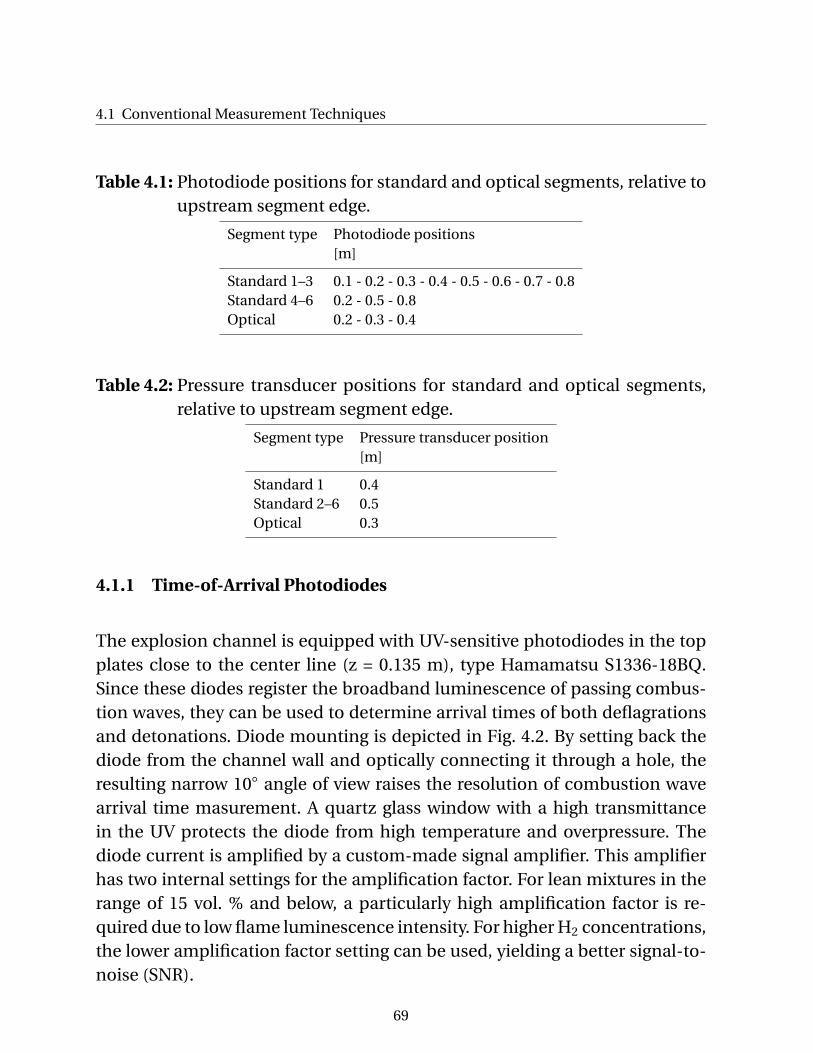
4.1 Conventional Measurement Techniques
Table 4.1: Photodiode positions for standard and optical segments, relative toupstream segment edge.
Segment type Photodiode positions[m]
Standard 1–3 0.1 - 0.2 - 0.3 - 0.4 - 0.5 - 0.6 - 0.7 - 0.8Standard 4–6 0.2 - 0.5 - 0.8Optical 0.2 - 0.3 - 0.4
Table 4.2: Pressure transducer positions for standard and optical segments,relative to upstream segment edge.
Segment type Pressure transducer position[m]
Standard 1 0.4Standard 2–6 0.5Optical 0.3
4.1.1 Time-of-Arrival Photodiodes
The explosion channel is equipped with UV-sensitive photodiodes in the topplates close to the center line (z = 0.135 m), type Hamamatsu S1336-18BQ.Since these diodes register the broadband luminescence of passing combus-tion waves, they can be used to determine arrival times of both deflagrationsand detonations. Diode mounting is depicted in Fig. 4.2. By setting back thediode from the channel wall and optically connecting it through a hole, theresulting narrow 10◦ angle of view raises the resolution of combustion wavearrival time masurement. A quartz glass window with a high transmittancein the UV protects the diode from high temperature and overpressure. Thediode current is amplified by a custom-made signal amplifier. This amplifierhas two internal settings for the amplification factor. For lean mixtures in therange of 15 vol. % and below, a particularly high amplification factor is re-quired due to low flame luminescence intensity. For higher H2 concentrations,the lower amplification factor setting can be used, yielding a better signal-to-noise (SNR).
69
Measurement Techniques
Signal cable
Top plate
Photodiode
Plastic inset
Quartz glass window
Screw-in adapter
Viewing angle10°
Figure 4.2: Mounting of photodiodes, adapted from [40].
Data acquisition is performed using a 50 channel A/D converter at a samplingrate of 250 kS/s.
Typical measured voltage profiles from a representative experiment are shownin Fig. 4.3. It can be seen that a gradual rise in voltage occurs when the flametip passes the first photodiode at x = 0.1 m. The faster the flame propagates,accelerated by obstacles in the exemplary configuration, the steeper the sig-nal rise at respective photodiodes. In signal post-processing, flame arrival isdefined as the point where the measured voltage rise exceeds 1 V. This defini-tion is adopted from the work of Vollmer [40]. For the derivation of profiles offlame tip velocity over x-coordinate, linear interpolation between the photo-diode positions is performed. The velocity plot corresponding to photodiodesignals shown in Fig. 4.3 is given in Fig. 2.4.
4.1.2 Piezoelectric Pressure Transducers
Explosion overpressure is captured by dynamic piezoelectric pressure trans-ducers, type Kistler 601A, combined with Kistler 5011B electrostatic chargeamplifiers. Data acquisition at a maximum rate of 250 kS/s is performed bymeans of a NI PCI-6133 internal multifunction board which allows for simul-taneous measurement of 8 channels. All transducers are mounted flush withthe walls close to the channel center line (z = 0.165 m). All channel segmentsand the end plate alike provide one measurement position. Segment trans-ducers are mounted in the channel top plate.
70
4.1 Conventional Measurement Techniques
U
[
V]
11
9.8
8.6
7.4
6.1
4.9
3.7
2.5
t [ms]
PD
3 4 5 6 7 8 9 10 11 12
Figure 4.3: Voltage signals from photodiodes corresponding to velocity plotFig. 2.4.
The pressure transducers have a measurement range of 0–250 bar overpres-sure and a natural frequency of 150 kHz. A high natural frequency is requiredfor the measurement of highly dynamic pressure loads inherent to explosionprocesses. However, the finite value poses a limitation regarding the maxi-mum useful measurement frequency. This will be explained in the following.
In general, a considerable amplitude overprediction occurs when the physicalpressure signal frequency approaches the transducer’s natural frequency asdemonstrated in a NASA report for several frequently used transducer types[127]. The acceptable amplitude overprediction poses an upper limit to theuseful frequency range of a specific transducer. Since this contradicts the re-quirement of high temporal resolution to accurately capture explosion dy-namics in fast regimes, a tradeoff needs to be made. Theoretical considera-tions to define a meaningful upper frequency limit are outlined here.
The transducer behaves similar to a 1-D underdamped driven harmonic os-cillator. The dynamic response of a flush-mounted14 pressure transducer canbe described in terms of amplitude overprediction by the steady-state under-
14Due to flush mounting, no additional consideration of transmission volumes is required. The dynamic re-sponse of the measurement system is that of the transducer itself [135].
71
Measurement Techniques
0.01 0.1 1
1
1.1
1.2
1.3
1.4
1.5
ω [-]
A [-]
Figure 4.4: Dimensionless amplitude A over dimensionless angular frequencyω for the underdamped driven harmonic oscillator.
damped driven harmonic oscillator solution in complex notation:
A =F
−mω2 + iωb+k. (4.1)
A is the oscillation amplitude, normalized by the amplitude which would oc-cur for ω→ 0, F is the external driver force, m is mass, ω is the angular driverfrequency normalized by the transducer resonance frequency, b is the damp-ing ratio and k is the spring constant. Calculation of this relation assuming asmall damping ratio (b = 0.1)15 yields the graph in Fig. 4.4, showing the dimen-sionless amplitude A as a function of dimensionless angular frequency ω. Theupper useful frequency is defined in the present work such that the maximumamplitude overprediction is 10 %. This is given at frequencies lower than 0.3times the natural frequency, cp. Fig. 4.4, red line. This restriction is realized byretaining a maximum data acquisition rate of 250 kHz and deploying a low-pass filter with a cut-off frequency of 45 kHz within the digital signal post-processing. Highly time-resolved raw data thereby remains available for thedetermination of shock or detonation arrival times.
15Increase of b from 0.1 to 0.5 raises the upper useful dimensionless frequency only by 0.02. Thus, the exactvalue of b is of minor influence for the argumentation outlined here.
72
4.1 Conventional Measurement Techniques
p [
ba
r]
t [ms]
12 15 1913 14 16 17 18 20-20
-10
0
10
40
50
20
30
60
Figure 4.5: Example for thermal shock. Transducers 1 (green line), 2 (blue line)and 3 (red line, with thermal shock causing a negative offset indi-cated by arrows).
Another important source of pressure signal falsification is the effect of ther-mal shock [36]. This effect is caused by non-uniform transient heating of thetransducer during combustion wave passage. The transducer diaphragm hasa low thermal capacity compared to the housing. Since the thin diaphragmheats up quickly and thereby expands, the preloading imposed on the quartzcristal stack inside the transducer at neutral conditions is reduced. This causesan underprediction of overpressure and potentially even negative measuredoverpressure in the long-term response behind a combustion wave. Such re-sults need to be carefully analyzed and their accuracy scrutinized. Since theeffect builds up dynamically over time, beginning with the first contact of thetransducer with hot gas, it is nearly impossible to correctly readjust the over-pressure trace in post-processing. However, the short-term response is ob-served not to be significantly altered in many experiments so that measuredmaximum peak pressures in fast combustion regimes may still be accurate.
Figure 4.5 shows an experiment in which valid pressure curves are obtainedfrom transducers 1 (green line) and 2 (blue line). Transducer 3 (red line) showsobvious signs of thermal shock well visible at the arrow position where the
73
Measurement Techniques
measured pressure of all transducers should assimilate since pressure dif-ferences within the channel decrease after multiple passage of longitudinalshocks and decay of shocks towards the acoustic limit.
This problem is commonly overcome by covering the transducer diaphragmwith a thin flat layer of high-temperature grease or silicone. In the presentwork, both materials were tested and no major difference in the resulting pres-sure signals was detected. Since high-temperature silicone forms a more re-sistant layer and thus remains intact for a larger number of experiments, thismaterial was selected.
Note that data plotted in Fig. 4.5 is unfiltered and thus also represents an il-lustrative example of amplitude overprediction at transducer 3 and t = 13.5 msby a factor of approximately 1.5. In this experiment a local explosion close totransducer 3 occurs, causing the high local peak overpressure. The rapid pres-sure rise due to the blast wave impinging on the transducer causes amplitudeoverprediction and overshoot into the negative pressure range. The overshootclearly supports the assumption of underdamping in the estimation of the up-per useful measurement frequency.
4.1.3 Soot-Foils
Recording the cellular pattern of detonations as introduced in Sec. 2.7 onsooted plates installed at channel side walls helped to discover the three-dimensionality of detonation fronts [28]. This technique is utilized in thepresent work to compare the cellular pattern of detonations in homogeneousand inhomogeneous mixtures. Application is imaginably simple: Thin steelplates are covered with soot, preferrably from a heavy hydrocarbon flame,and installed flush on the channel walls. Trajectories of detonation front triplepoints correlate with the observed soot foil traces as demonstrated by Urtiewand Oppenheim [148]. The exact mechanism of soot removal has not yet beenidentified unambiguously. Mechanisms like sheer stress orientation differ-ences behind triple points may be responsible as shown experimentally [87]and numerically [63].
74
4.2 Optical Measurement Techniques
4.2 Optical Measurement Techniques
Broad application of advanced optical measurement techniques is one of themajor features of the experimental approach pursued in the present work.Three highly time-resolved optical measurement techniques were chosen forthe visualization of explosion processes: Shadowgraphy, OH planar laser-induced fluorescence (OH-PLIF) and OH* luminescence imaging. Optical in-formation is used complementary to conventional measurement data. Sinceeach of the three techniques contributes with its specific properties and as-sociated potentials and limitations, especially the joint or even simultaneousapplication provides valuable insight.
All named techniques depend on scientific high-speed cameras as imagingdevices. Two non-intensified CMOS cameras (Photron SA-5 and SA-X), onemodular external image intensifier (Hamamatsu C10880-03) and one image-intensified camera (Photron APXI2) were used. The non-intensified camerascan be combined with the external image intensifier to form an intensifiedhigh-speed system. Technical specifications can be found in the respectivedatasheets [59, 119–121]. Three different camera lenses were employed, pro-viding transmittance in the visible (Nikkor 85 mm 1:1.4) and ultraviolet (UV-Nikkor 105 mm 1:4.5 and UV-CERCO-SODERN 45 mm 1:1.8) spectrum.
4.2.1 Shadowgraphy
Since shadowgraphy and the schlieren technique are closely related, they areoften described collectively. Toepler [144] first introduced the schlieren tech-nique as a method to visualize spatial non-uniformities in refractive indexin transparent media. The irregular deflection of a collimated beam passinga transverse gradient in refractive index is used in a manner that the non-deflected rays serve as a reference, whereas deflection leads to the depictionof non-uniform regions. Since density gradients effect refractive-index gra-dients via alteration of speed of light, shadowgraphy and schlieren allow forvisualizing gradients in density and thereby in pressure and temperature ofgases. Line-of-sight integration is inherent to the techniques. The fundamen-
75
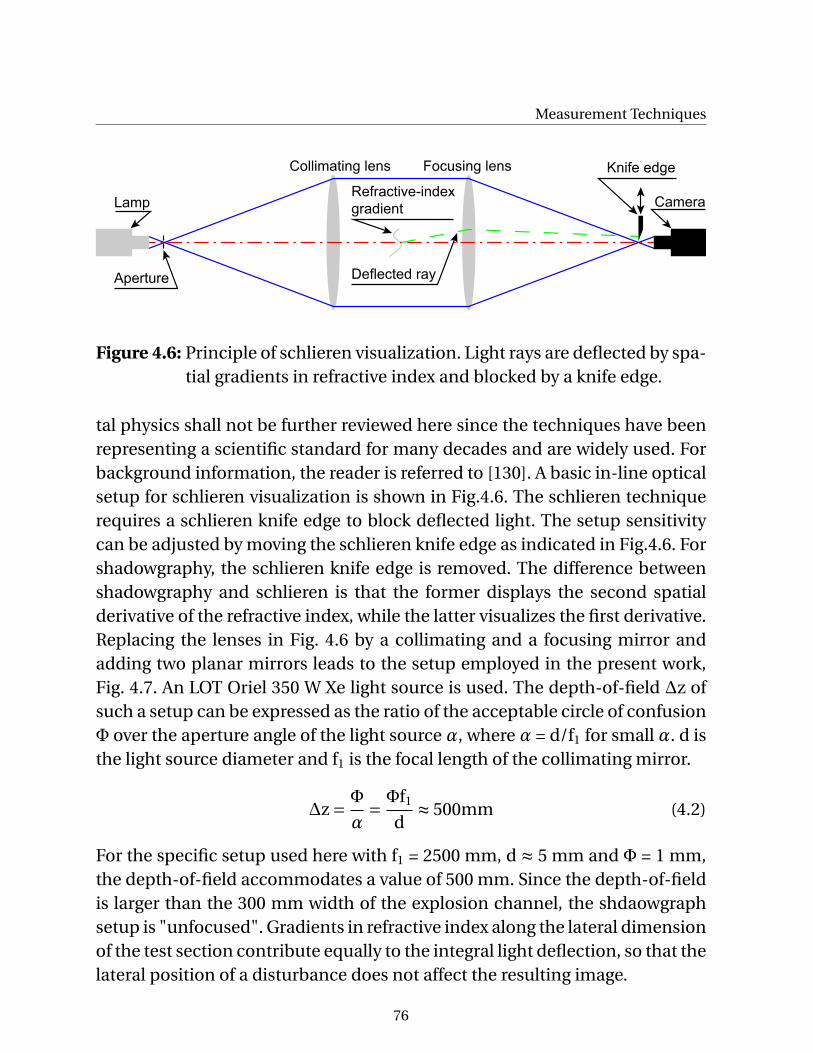
Measurement Techniques
Lamp Camera
Aperture
Collimating lens Focusing lens
Refractive-index
gradient
Knife edge
Deflected ray
Figure 4.6: Principle of schlieren visualization. Light rays are deflected by spa-tial gradients in refractive index and blocked by a knife edge.
tal physics shall not be further reviewed here since the techniques have beenrepresenting a scientific standard for many decades and are widely used. Forbackground information, the reader is referred to [130]. A basic in-line opticalsetup for schlieren visualization is shown in Fig.4.6. The schlieren techniquerequires a schlieren knife edge to block deflected light. The setup sensitivitycan be adjusted by moving the schlieren knife edge as indicated in Fig.4.6. Forshadowgraphy, the schlieren knife edge is removed. The difference betweenshadowgraphy and schlieren is that the former displays the second spatialderivative of the refractive index, while the latter visualizes the first derivative.Replacing the lenses in Fig. 4.6 by a collimating and a focusing mirror andadding two planar mirrors leads to the setup employed in the present work,Fig. 4.7. An LOT Oriel 350 W Xe light source is used. The depth-of-field ∆z ofsuch a setup can be expressed as the ratio of the acceptable circle of confusionΦ over the aperture angle of the light source α, where α = d/f1 for small α. d isthe light source diameter and f1 is the focal length of the collimating mirror.
∆z =Φ
α=Φf1
d≈ 500mm (4.2)
For the specific setup used here with f1 = 2500 mm, d ≈ 5 mm and Φ = 1 mm,the depth-of-field accommodates a value of 500 mm. Since the depth-of-fieldis larger than the 300 mm width of the explosion channel, the shdaowgraphsetup is "unfocused". Gradients in refractive index along the lateral dimensionof the test section contribute equally to the integral light deflection, so that thelateral position of a disturbance does not affect the resulting image.
76
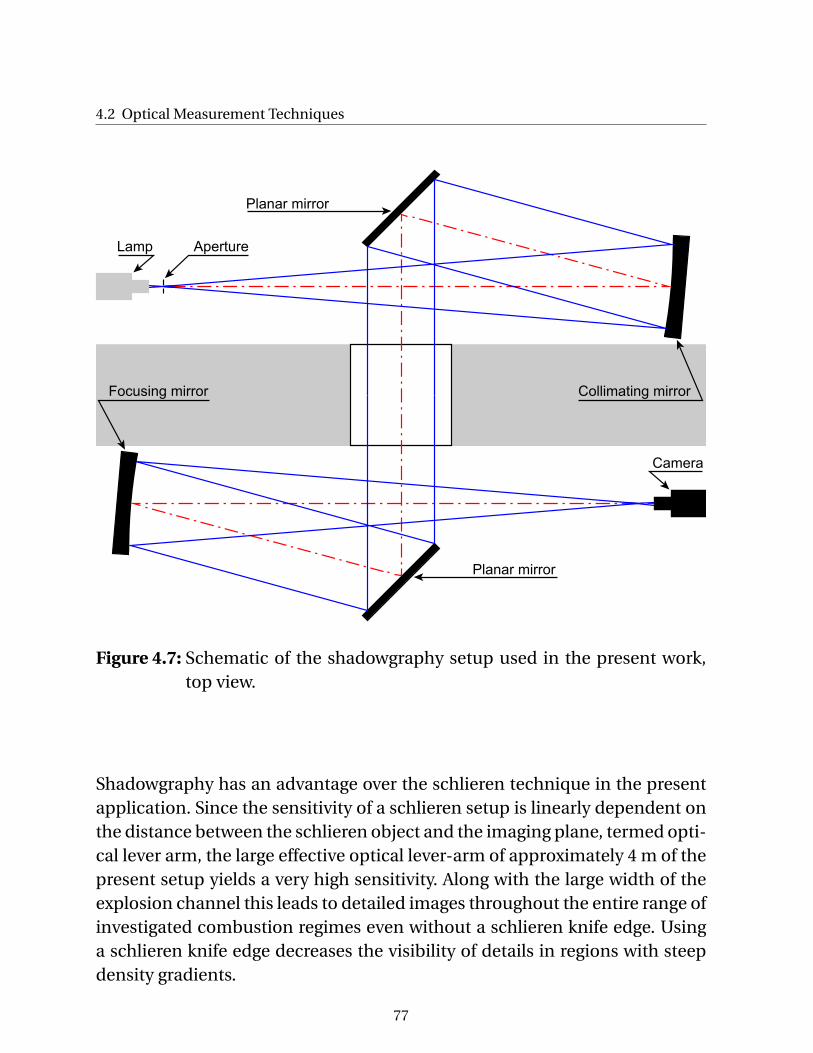
4.2 Optical Measurement Techniques
Lamp
Camera
Collimating mirrorFocusing mirror
Planar mirror
Aperture
Planar mirror
Figure 4.7: Schematic of the shadowgraphy setup used in the present work,top view.
Shadowgraphy has an advantage over the schlieren technique in the presentapplication. Since the sensitivity of a schlieren setup is linearly dependent onthe distance between the schlieren object and the imaging plane, termed opti-cal lever arm, the large effective optical lever-arm of approximately 4 m of thepresent setup yields a very high sensitivity. Along with the large width of theexplosion channel this leads to detailed images throughout the entire range ofinvestigated combustion regimes even without a schlieren knife edge. Usinga schlieren knife edge decreases the visibility of details in regions with steepdensity gradients.
77
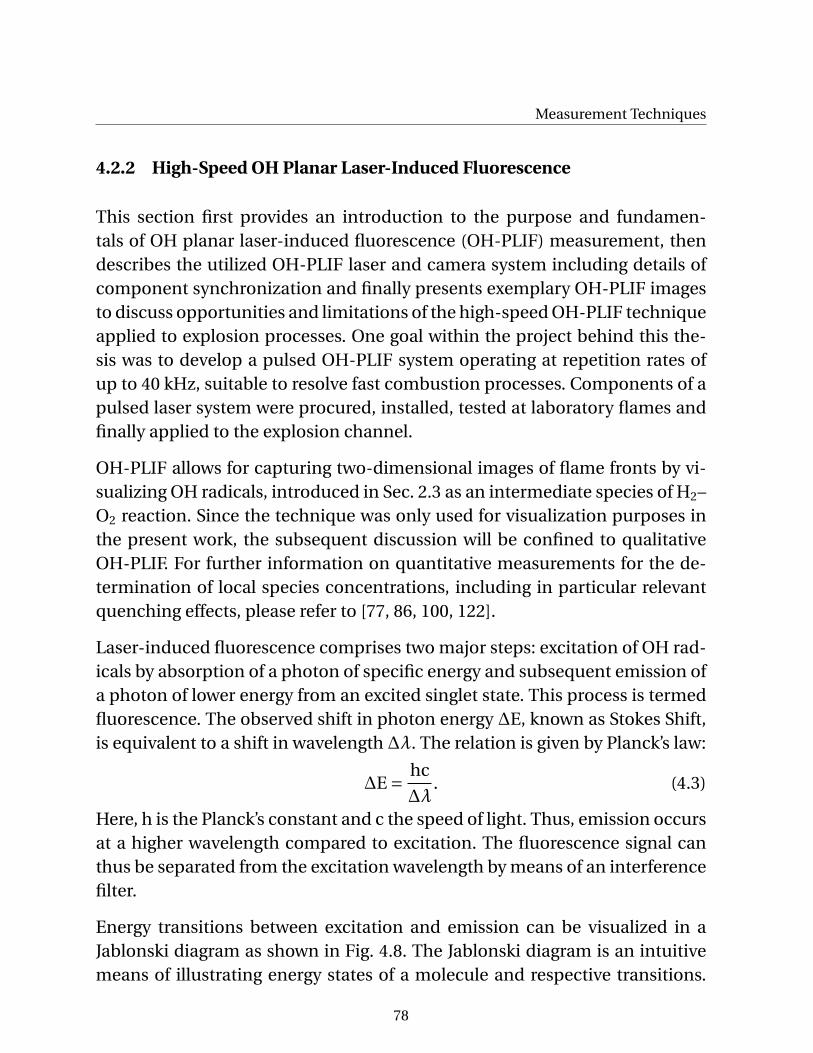
Measurement Techniques
4.2.2 High-Speed OH Planar Laser-Induced Fluorescence
This section first provides an introduction to the purpose and fundamen-tals of OH planar laser-induced fluorescence (OH-PLIF) measurement, thendescribes the utilized OH-PLIF laser and camera system including details ofcomponent synchronization and finally presents exemplary OH-PLIF imagesto discuss opportunities and limitations of the high-speed OH-PLIF techniqueapplied to explosion processes. One goal within the project behind this the-sis was to develop a pulsed OH-PLIF system operating at repetition rates ofup to 40 kHz, suitable to resolve fast combustion processes. Components of apulsed laser system were procured, installed, tested at laboratory flames andfinally applied to the explosion channel.
OH-PLIF allows for capturing two-dimensional images of flame fronts by vi-sualizing OH radicals, introduced in Sec. 2.3 as an intermediate species of H2–O2 reaction. Since the technique was only used for visualization purposes inthe present work, the subsequent discussion will be confined to qualitativeOH-PLIF. For further information on quantitative measurements for the de-termination of local species concentrations, including in particular relevantquenching effects, please refer to [77, 86, 100, 122].
Laser-induced fluorescence comprises two major steps: excitation of OH rad-icals by absorption of a photon of specific energy and subsequent emission ofa photon of lower energy from an excited singlet state. This process is termedfluorescence. The observed shift in photon energy ∆E, known as Stokes Shift,is equivalent to a shift in wavelength ∆λ. The relation is given by Planck’s law:
∆E =hc
∆λ. (4.3)
Here, h is the Planck’s constant and c the speed of light. Thus, emission occursat a higher wavelength compared to excitation. The fluorescence signal canthus be separated from the excitation wavelength by means of an interferencefilter.
Energy transitions between excitation and emission can be visualized in aJablonski diagram as shown in Fig. 4.8. The Jablonski diagram is an intuitivemeans of illustrating energy states of a molecule and respective transitions.
78
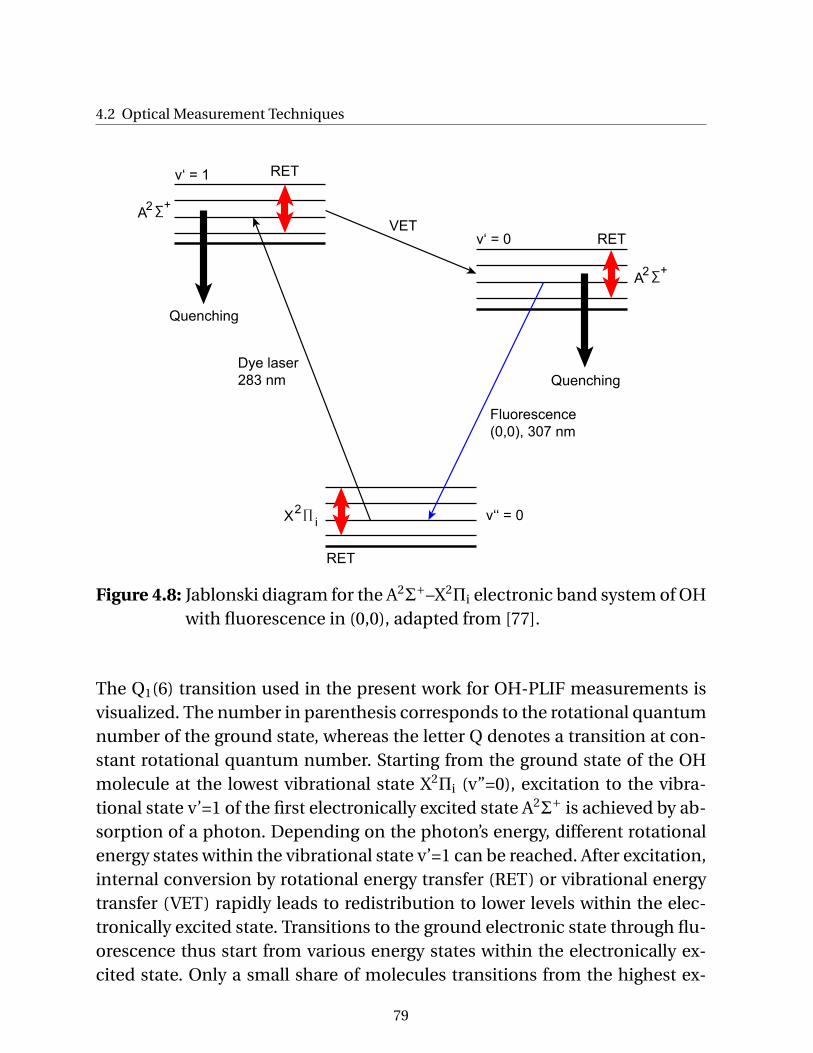
4.2 Optical Measurement Techniques
v‘ = 1
v‘ = 0
v‘‘ = 0
Dye laser
283 nm
Fluorescence
(0,0), 307 nm
Quenching
RET
RET
RET
VET
Quenching
∑ +A2
∏ X2
i
∑ +A2
Figure 4.8: Jablonski diagram for the A2Σ+–X2
Πi electronic band system of OHwith fluorescence in (0,0), adapted from [77].
The Q1(6) transition used in the present work for OH-PLIF measurements isvisualized. The number in parenthesis corresponds to the rotational quantumnumber of the ground state, whereas the letter Q denotes a transition at con-stant rotational quantum number. Starting from the ground state of the OHmolecule at the lowest vibrational state X2
Πi (v”=0), excitation to the vibra-tional state v’=1 of the first electronically excited state A2
Σ+ is achieved by ab-
sorption of a photon. Depending on the photon’s energy, different rotationalenergy states within the vibrational state v’=1 can be reached. After excitation,internal conversion by rotational energy transfer (RET) or vibrational energytransfer (VET) rapidly leads to redistribution to lower levels within the elec-tronically excited state. Transitions to the ground electronic state through flu-orescence thus start from various energy states within the electronically ex-cited state. Only a small share of molecules transitions from the highest ex-
79
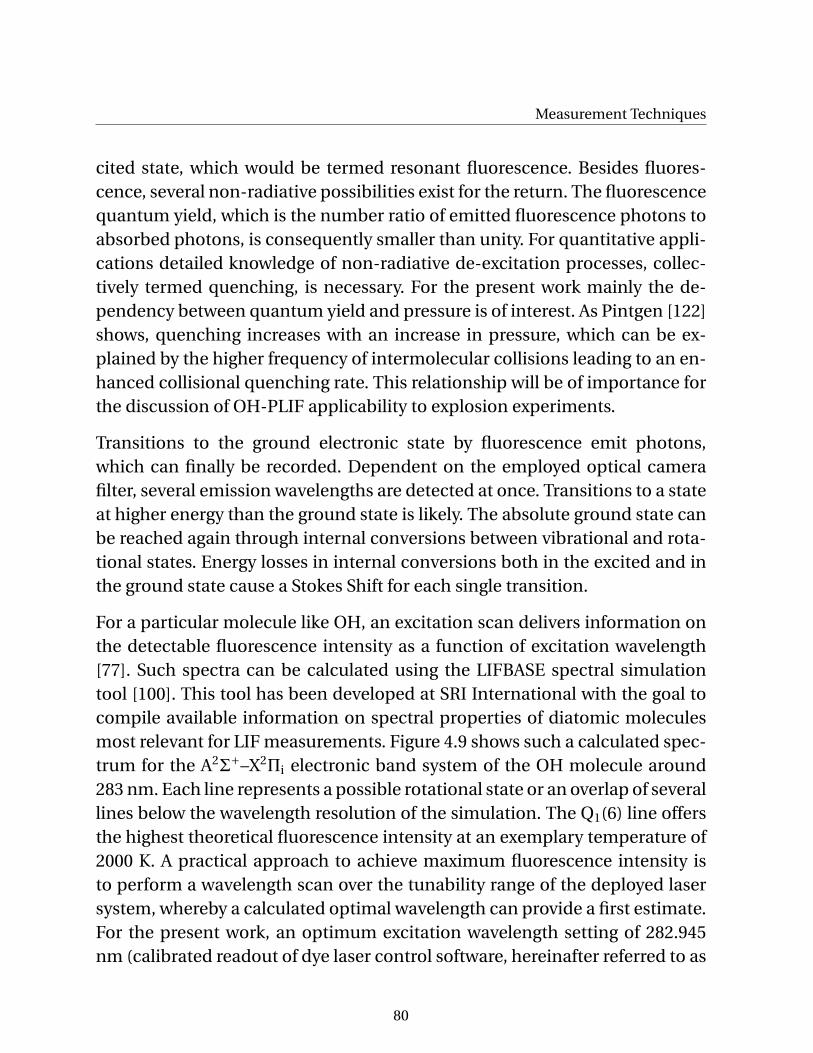
Measurement Techniques
cited state, which would be termed resonant fluorescence. Besides fluores-cence, several non-radiative possibilities exist for the return. The fluorescencequantum yield, which is the number ratio of emitted fluorescence photons toabsorbed photons, is consequently smaller than unity. For quantitative appli-cations detailed knowledge of non-radiative de-excitation processes, collec-tively termed quenching, is necessary. For the present work mainly the de-pendency between quantum yield and pressure is of interest. As Pintgen [122]shows, quenching increases with an increase in pressure, which can be ex-plained by the higher frequency of intermolecular collisions leading to an en-hanced collisional quenching rate. This relationship will be of importance forthe discussion of OH-PLIF applicability to explosion experiments.
Transitions to the ground electronic state by fluorescence emit photons,which can finally be recorded. Dependent on the employed optical camerafilter, several emission wavelengths are detected at once. Transitions to a stateat higher energy than the ground state is likely. The absolute ground state canbe reached again through internal conversions between vibrational and rota-tional states. Energy losses in internal conversions both in the excited and inthe ground state cause a Stokes Shift for each single transition.
For a particular molecule like OH, an excitation scan delivers information onthe detectable fluorescence intensity as a function of excitation wavelength[77]. Such spectra can be calculated using the LIFBASE spectral simulationtool [100]. This tool has been developed at SRI International with the goal tocompile available information on spectral properties of diatomic moleculesmost relevant for LIF measurements. Figure 4.9 shows such a calculated spec-trum for the A2
Σ+–X2
Πi electronic band system of the OH molecule around283 nm. Each line represents a possible rotational state or an overlap of severallines below the wavelength resolution of the simulation. The Q1(6) line offersthe highest theoretical fluorescence intensity at an exemplary temperature of2000 K. A practical approach to achieve maximum fluorescence intensity isto perform a wavelength scan over the tunability range of the deployed lasersystem, whereby a calculated optimal wavelength can provide a first estimate.For the present work, an optimum excitation wavelength setting of 282.945nm (calibrated readout of dye laser control software, hereinafter referred to as
80
4.2 Optical Measurement Techniques
Wavelength λ (Vacuum) [nm]
Wavelength λ (Air) [nm]
283.0 283.5282.5
282.92 283.42282.42
Q (2) 3 4 5 6 7 81
Flu
ore
sce
nce
In
ten
sity [
-]
Figure 4.9: Excitation scan for OH, LIFBASE [100], T = 2000 K. Wavelengthconversion from vacuum to air according to Morton [107].
283 nm) was determined experimentally using an atmospheric premixed H2–air test flame. The wavelength setting of the dye laser has an accuracy of 0.03nm [134]. Thus, the experimental and theoretical optima coincide within thehardware precision.
In most combustion diagnostics applications of OH-PLIF a pulsed laser sys-tem is used, providing high intensity during the short laser pulses [77]. This al-lows for suppressing the contribution of flame luminescence through choos-ing a short camera exposure time. The pulsed laser system used in the presentwork is schematically illustrated in Fig. 4.10. The essential component of thesystem is a pulsed, frequency doubled Nd:YVO4 pumplaser (Edgewave IN-NOSLAB IS8II), emitting light at 532 nm from two cavities. Each of the cav-ities can be individually triggered at repetition rates of up to 20 kHz with apulse length of 8 ns. The design pulse energy is 2 mJ, resulting in an averagepower of 80 W. This laser is combined with a tunable dye laser (Sirah Credo)designed for the respective repetition rates and pulse energies. It consists of aresonator stage, an amplifier stage, a second harmonics generator (SHG) and
81
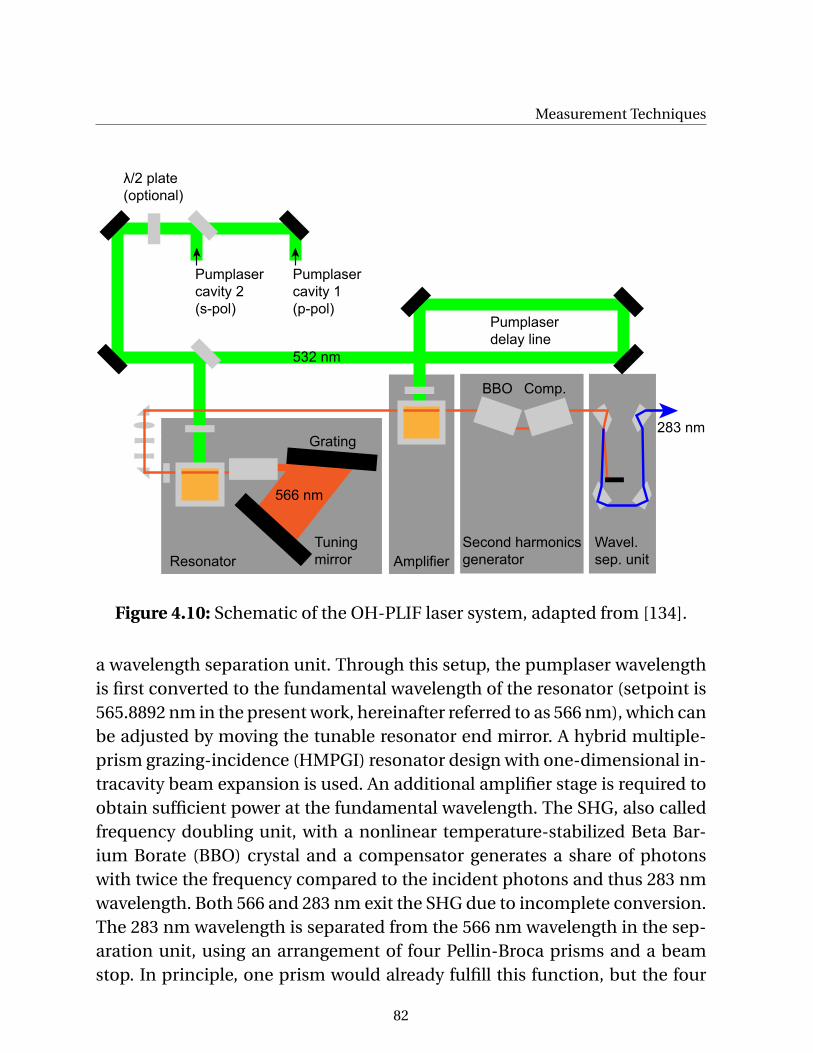
Measurement Techniques
Resonator Amplifier
Second harmonics
generator
Wavel.
sep. unit
Pumplaser
cavity 2
(s-pol)
Pumplaser
cavity 1
(p-pol)
Grating
Tuning
mirror
BBO Comp.
Pumplaser
delay line
λ/2 plate
(optional)
532 nm
566 nm
283 nm
Figure 4.10: Schematic of the OH-PLIF laser system, adapted from [134].
a wavelength separation unit. Through this setup, the pumplaser wavelengthis first converted to the fundamental wavelength of the resonator (setpoint is565.8892 nm in the present work, hereinafter referred to as 566 nm), which canbe adjusted by moving the tunable resonator end mirror. A hybrid multiple-prism grazing-incidence (HMPGI) resonator design with one-dimensional in-tracavity beam expansion is used. An additional amplifier stage is required toobtain sufficient power at the fundamental wavelength. The SHG, also calledfrequency doubling unit, with a nonlinear temperature-stabilized Beta Bar-ium Borate (BBO) crystal and a compensator generates a share of photonswith twice the frequency compared to the incident photons and thus 283 nmwavelength. Both 566 and 283 nm exit the SHG due to incomplete conversion.The 283 nm wavelength is separated from the 566 nm wavelength in the sep-aration unit, using an arrangement of four Pellin-Broca prisms and a beamstop. In principle, one prism would already fulfill this function, but the four
82
4.2 Optical Measurement Techniques
prism arrangement avoids variation of the 283 nm beam output position andangle when the wavelength is varied.
Rhodamine 6G (R6G), also termed Rhodamine 590, dissolved in Ethanol isused as a lasing medium in the dye laser. The spectroscopic characteristics ofsolutions of R6G at different concentrations were recently studied by Zehent-bauer et al. [163]. Tunability of laser emission ranges from about 560 nm to 610nm with a peak around 575 nm. This covers the desired fundamental dye laserwavelength of 566 nm. Maximum absorption is achieved at a pumplaser wave-length of 530 nm, very close to the second harmonics of Nd:YAG and Nd:YV04lasers of 532 nm. The highest laser emission intensity can be expected at R6Gconcentrations around 0.1 g/l. Concentrations of 0.135 and 0.09 g/l in the res-onator and amplifier, respectively, were used in the present work followingrecommendations of the laser manufacturer. Information on different laserdye solutions, their range of applicability and conversion efficiencies is sum-marized in [9].
The dye laser is optimized for being pumped with vertically polarized laserlight (s-pol). Since the two pumplaser cavities have different polarizations (s-pol and p-pol) to allow for beam overlap, the conversion efficiency for s-polis as desired, but the efficiency for p-pol is inadequate. To use both cavitiesand thus obtain a 40 kHz repetition rate, a λ/2 waveplate can be introducedbetween pump and dye laser to rotate the polarization orientation of bothbeams at an angle of 45◦. This is achieved by an angle between the axes ofthe wave plate and the polarization planes of the incident beams of 22.5◦16.The rotational position of the λ/2 plate needs to be precisely adjusted to reachequal dye laser output pulse energies with both pump laser cavities. Utiliza-tion of the λ/2 plate leads a reduction in pulse energy of about 30–40 % com-pared to the performance of the s-pol cavity alone. Since application of theOH-PLIF system to fast combustion regimes requires the maximum achiev-able pulse energy, only the s-pol cavity could be used for the measurementspresented in this thesis. If a smaller FOV is sufficient and self-luminescenceof the investigated flame is low, the double-cavity option with λ/2 plate is ap-
16The Jones calculus [66] allows for description of polarized light passage through a wave plate. It illustratesthat birefringent material of thickness λ/2 rotates the plane of polarization of a linearly polarized incident beamby twice the angle that incident beam polarization plane and the plate’s fast axis confine [60].
83
Measurement Techniques
plicable. The requirement for very exact overlap of the two pumplaser beamshowever complicates the adjustment procedure. Thermal steady state of thepumplaser needs to be reached (after approximately 20 min of operation) be-fore adjustment of the beam overlap unit can be performed. The pumplaserpower during the adjustment procedure needs to equal the final power dur-ing OH-PLIF operation (typically maximum power setting of 80 W). There-fore, highest caution should be exercised and the pumplaser beam intensityreduced by multiple reflection off wedged windows, before passing the laserbeam to an observation target. The target is preferentially placed at a distancefrom the pump laser equal to the distance between pumplaser and amplifiercuvette since precisely parallel beam alignment along the entire beam propa-gation distance is difficult to achieve.
Due to the limited maximum dye efficiency of about 28 % for R6G and con-siderable losses during frequency doubling (maximum SHG efficiency of 20%), the achieved output pulse energy is 120 µJ or less depending on the sys-tem configuration. Well-established low speed OH-PLIF systems deliver pulseenergies ranging from several mJ (pumped dye lasers) up to a few 100 mJ (ex-cimer lasers) [103]. However, the low pulse energy of the high-speed systemdesigned here was found to be sufficient for OH-PLIF imaging in a FOV widthof up to 100 mm. A short camera exposure time of the order of 30 ns is manda-tory to suppress flame luminescence which originates from the same energytransitions as the fluorescence signal and thus cannot be eliminated by meansof optical filters. Measures need to be taken to avoid losses during beam guid-ance (use dielectric UV mirrors with a high reflectance), laser sheet formation(use quartz glass lenses with UV AR coating) and delivery of the laser sheetinto the test section (provide high transmittance at 283 nm, thus low OH con-centration, keep windows clean), as well as to optimize the laser output power,the beam profile and the sensitivity of the imaging system.
The 283 nm dye laser output beam is guided towards the test section by mir-rors with a dielectric coating designed for a reflectance > 98 % at 283 nm. Onlyredirections of 90◦ are permitted to avoid deformation of the oval-shaped UVlaser beam. The vertical dimension of the beam is then expanded by a UV ARcoated -30 mm cylindrical lens and collimated by a UV AR coated 500 mm
84
4.2 Optical Measurement Techniques
spherical lens. The formed light sheet is introduced into the optical segmentthrough a window in the channel top plate. The distance between sphericallens and symmetry line of the explosion channel (y = 0.03 m) is equal to the500 mm focal length of the spherical lens to produce a thin light sheet (about0.1–0.3 mm thick).
For image acquisition, an external image intensifier (Hamamatsu C10880-03)is combined with a high-speed camera (Photron SA-X or SA-5). A SemrockBrightLine HC 320±20 nm bandpass filter is applied to the 45 mm UV cam-era optics for detection of the OH-PLIF signal, which appears mainly between306 and 324 nm due to fluorescence from (0,0) and (1,1) transitions. Synchro-nization of the pump laser cavities, camera and image intensifier as well asoptional further cameras for simultaneous application of other measurementtechniques like OH* luminescence imaging is accomplished by two StanfordResearch Digital Delay Generators (DG535 and DG645). Control signals, laserpulses, camera and image intensifier exposure windows and respective delaysare shown in Fig. 4.11. A first estimation of delays was achieved by using a pho-todiode detecting laser emission and comparing against the camera exposureoutput signal. Fine tuning of the delays in the ns range needs to be performedby adjusting the image intensifier delay at maximum pumplaser power untilstable maximum fluorescence from a test flame is visible on camera images.In this way, the delay between laser pulse and fluorescence emission is ac-counted for. Sufficiently low jitter of the laser pulse output is only reached atmaximum pumplaser power. Image intensifier exposure times lower than 30ns resulted in fluctuations in recorded fluorescence intensity due to jitter.
The raw OH-PLIF images are post-processed in order to reduce image in-tensifier noise and facilitate interpretation. An algorithm for noise reductionhas been implemented based on the MATLAB bwboundaries method. Thismethod identifies small isolated structures with a boundary vector includingless than 20 pixel-size elements and eliminates them by masking. In addition,intensities lower than 5 % of the maximum intensity within a series of imagesare removed. Images are finally shown in false-color depiction for better visi-bility. Examples can be seen in Figs. 4.12, 4.13 and 4.14.
85
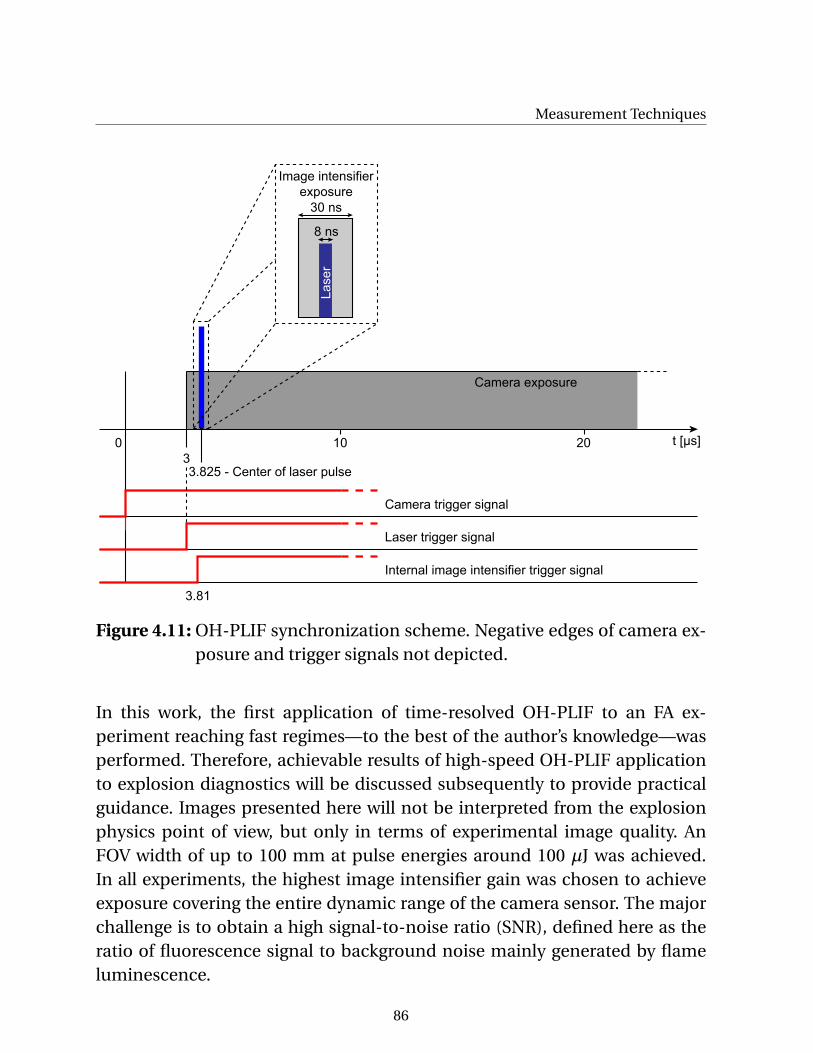
Measurement Techniques
Laser
8 ns
30 ns
Camera exposure
Image intensifier
exposure
0 10 20 t [µs]
33.825 - Center of laser pulse
Camera trigger signal
Laser trigger signal
Internal image intensifier trigger signal
3.81
Figure 4.11: OH-PLIF synchronization scheme. Negative edges of camera ex-posure and trigger signals not depicted.
In this work, the first application of time-resolved OH-PLIF to an FA ex-periment reaching fast regimes—to the best of the author’s knowledge—wasperformed. Therefore, achievable results of high-speed OH-PLIF applicationto explosion diagnostics will be discussed subsequently to provide practicalguidance. Images presented here will not be interpreted from the explosionphysics point of view, but only in terms of experimental image quality. AnFOV width of up to 100 mm at pulse energies around 100 µJ was achieved.In all experiments, the highest image intensifier gain was chosen to achieveexposure covering the entire dynamic range of the camera sensor. The majorchallenge is to obtain a high signal-to-noise ratio (SNR), defined here as theratio of fluorescence signal to background noise mainly generated by flameluminescence.
86
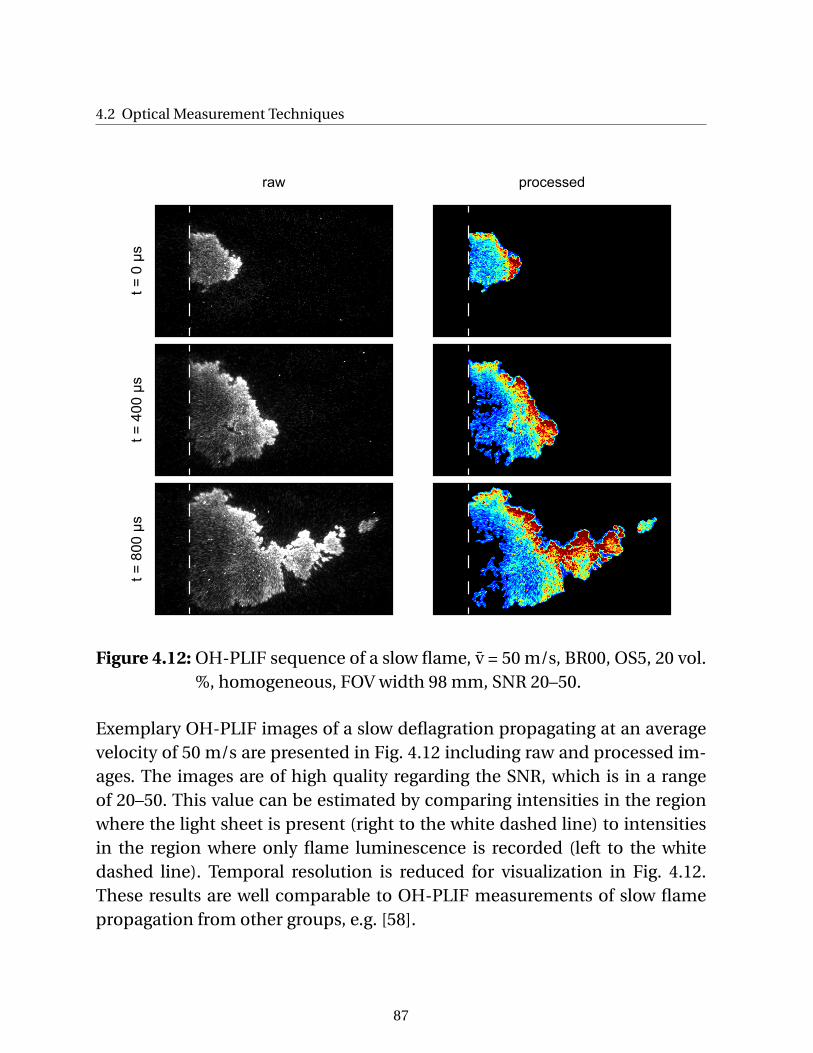
4.2 Optical Measurement Techniques
t =
0 μ
st =
400 μ
st =
800 μ
s
raw processed
Figure 4.12: OH-PLIF sequence of a slow flame, v̄ = 50 m/s, BR00, OS5, 20 vol.%, homogeneous, FOV width 98 mm, SNR 20–50.
Exemplary OH-PLIF images of a slow deflagration propagating at an averagevelocity of 50 m/s are presented in Fig. 4.12 including raw and processed im-ages. The images are of high quality regarding the SNR, which is in a rangeof 20–50. This value can be estimated by comparing intensities in the regionwhere the light sheet is present (right to the white dashed line) to intensitiesin the region where only flame luminescence is recorded (left to the whitedashed line). Temporal resolution is reduced for visualization in Fig. 4.12.These results are well comparable to OH-PLIF measurements of slow flamepropagation from other groups, e.g. [58].
87
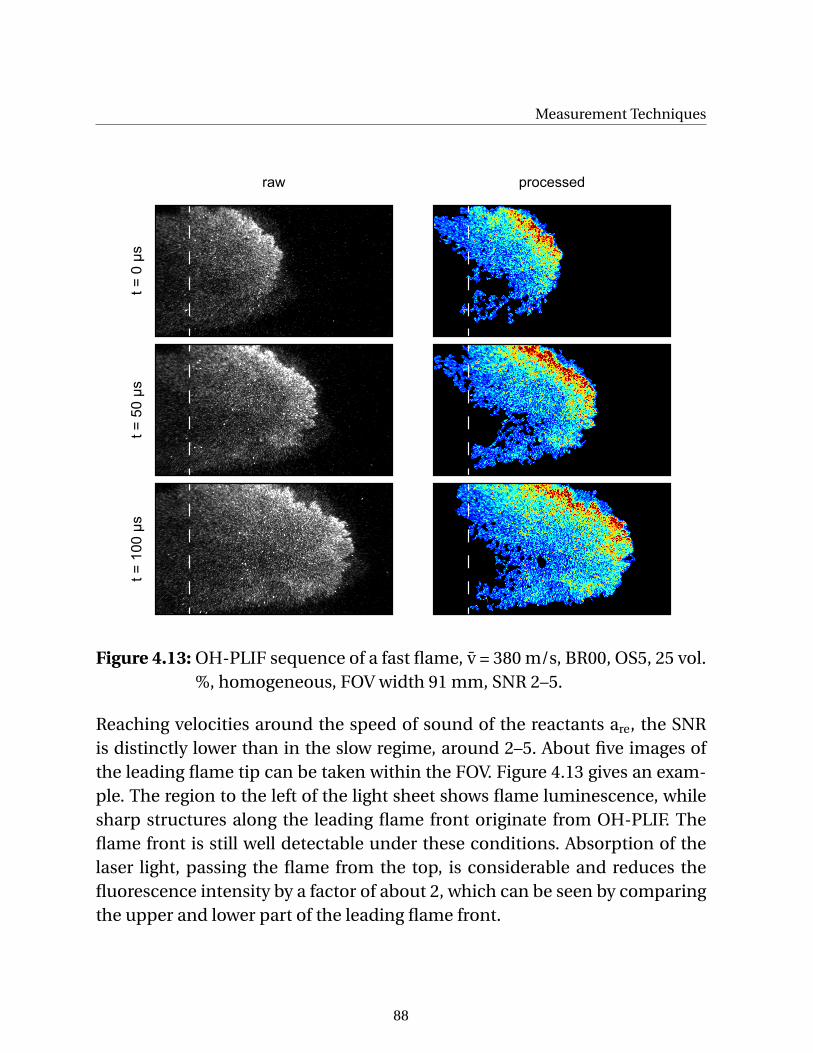
Measurement Techniques
t =
0 μ
st =
50 μ
st =
100 μ
s
raw processed
Figure 4.13: OH-PLIF sequence of a fast flame, v̄ = 380 m/s, BR00, OS5, 25 vol.%, homogeneous, FOV width 91 mm, SNR 2–5.
Reaching velocities around the speed of sound of the reactants are, the SNRis distinctly lower than in the slow regime, around 2–5. About five images ofthe leading flame tip can be taken within the FOV. Figure 4.13 gives an exam-ple. The region to the left of the light sheet shows flame luminescence, whilesharp structures along the leading flame front originate from OH-PLIF. Theflame front is still well detectable under these conditions. Absorption of thelaser light, passing the flame from the top, is considerable and reduces thefluorescence intensity by a factor of about 2, which can be seen by comparingthe upper and lower part of the leading flame front.
88
4.2 Optical Measurement Techniques
When flame speed approaches the speed of sound of the reaction products apr,the SNR decreases sharply to values of unity and below, Fig. 4.14. This makeshigh-speed OH-PLIF with the hardware specifications described beforehandinapplicable. The flame front can no longer be detected in this regime. Natu-rally, this also applies to the detonation regime. In Fig. 4.14, a local explosion atthe channel top additionally overexposes the image. The image intensifier re-acts with extensive blooming. Three effects are believed to be mainly respon-sible for the limitation of OH-PLIF towards fast flame propagation with highlocal pressures and temperatures:
• Increased flame luminescence intensity due to thermal production ofOH*. This is further discussed in Sec. 4.2.3.
• Reduction of fluorescence intensity due to increased collisional quench-ing rates [122].
• Strong absorption of the 283 nm laser sheet already in the upper region ofthe channel. The effect of pressure on absorption was investigated sepa-rately in a high pressure flame absorption experiment, presented in App.B.
Additionally, only about two images can be expected within the FOV. Thisclearly suggests to favor single-shot OH-PLIF for regimes close to onset of det-onation and beyond. Examples of single-shot detonation investigations havebeen published by Eder [39] and Pintgen [122]. The author is not aware of suc-cessful attempts to capture onset of detonation with OH-PLIF.
89
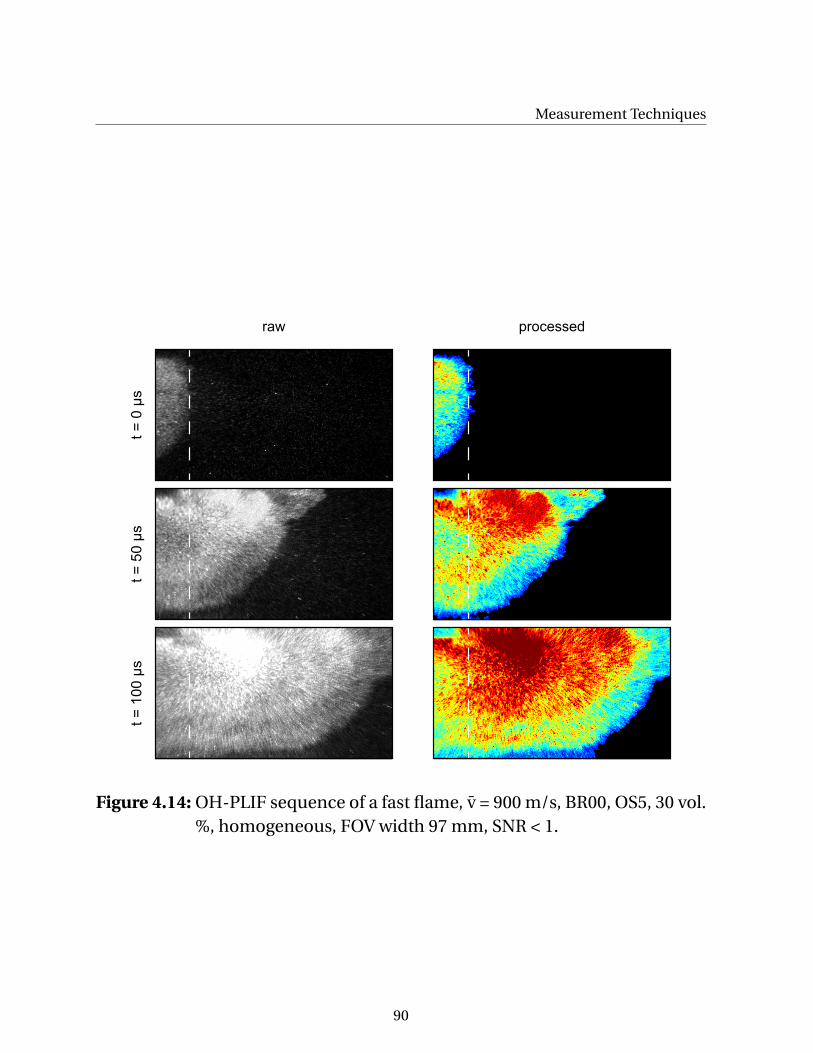
Measurement Techniques
t =
0 μ
st =
50 μ
st =
100 μ
s
raw processed
Figure 4.14: OH-PLIF sequence of a fast flame, v̄ = 900 m/s, BR00, OS5, 30 vol.%, homogeneous, FOV width 97 mm, SNR < 1.
90
4.2 Optical Measurement Techniques
4.2.3 OH* Luminescence
Like shadowgraphy, OH* luminescence imaging is an optical measurementtechnique integrating along the optical path. It is widely used in combustiondiagnostics being simple to apply and cost-effective. Photons emitted duringtransitions of OH radicals from excited states A2
Σ+ (denoted OH*) to ground
states X2Πi can be captured with an image-intensified camera combined with
a UV transmissive camera lens and a 307 ± 5 nm bandpass filter. Althoughthe location of light emission may not exactly coincide with the region of heatrelease and neither correlate linearly with heat release rate in turbulent flamesas discussed by Lauer [89], it is still applicable for the simple visualization ofreaction zones within the present work.
The particular advantage over the OH-PLIF technique is that no laser is re-quired and that the imaging rate and FOV is therefore only limited by theutilized camera. On the other hand, the drawback is line-of-sight integration,hiding details of flames and detonations that can only be recognized in two-dimensional depictions. The technique is therefore used to complement OH-PLIF measurements and replaces it beyond the limits of OH-PLIF applicabil-ity.
Fiala and Sattelmayer [47] recently discussed details of OH* luminescenceimaging. While the technique is commonly referred to as OH* chemilumi-nescence in investigations of deflagrations indicating that excitation of OHradicals is of chemical origin, this assumption does not necessarily prove truein application to fast combustion regimes. As Fiala and Sattelmayer demon-strated by non-premixed counterflow flamelet simulations, thermal excitationdominates over chemical excitation in high temperature flames. Thermal ex-citation exceeds chemical excitation at flame temperatures above 2700 K. Thethermal excitation rate depends exponentially on temperature in the relevantrange, whereas chemical excitation remains fairly constant at a given pressure.According to [45] the molar concentration of OH*, [OH*], can be written as
[OH∗] ∝ [OH] ·e−∆g0
mRT , (4.4)
assuming thermal equilibrium. [OH] is the molar concentration of OH in the
91
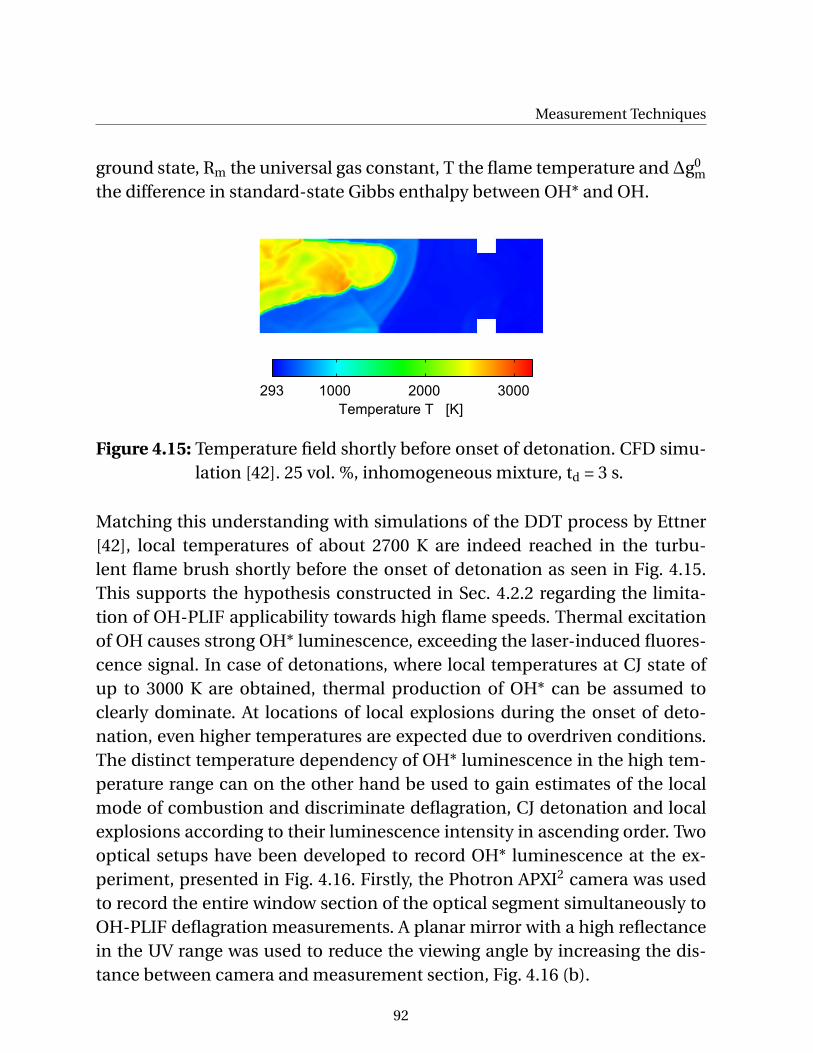
Measurement Techniques
ground state, Rm the universal gas constant, T the flame temperature and ∆g0m
the difference in standard-state Gibbs enthalpy between OH* and OH.
Temperature T [K]
293 1000 2000 3000
Figure 4.15: Temperature field shortly before onset of detonation. CFD simu-lation [42]. 25 vol. %, inhomogeneous mixture, td = 3 s.
Matching this understanding with simulations of the DDT process by Ettner[42], local temperatures of about 2700 K are indeed reached in the turbu-lent flame brush shortly before the onset of detonation as seen in Fig. 4.15.This supports the hypothesis constructed in Sec. 4.2.2 regarding the limita-tion of OH-PLIF applicability towards high flame speeds. Thermal excitationof OH causes strong OH* luminescence, exceeding the laser-induced fluores-cence signal. In case of detonations, where local temperatures at CJ state ofup to 3000 K are obtained, thermal production of OH* can be assumed toclearly dominate. At locations of local explosions during the onset of deto-nation, even higher temperatures are expected due to overdriven conditions.The distinct temperature dependency of OH* luminescence in the high tem-perature range can on the other hand be used to gain estimates of the localmode of combustion and discriminate deflagration, CJ detonation and localexplosions according to their luminescence intensity in ascending order. Twooptical setups have been developed to record OH* luminescence at the ex-periment, presented in Fig. 4.16. Firstly, the Photron APXI2 camera was usedto record the entire window section of the optical segment simultaneously toOH-PLIF deflagration measurements. A planar mirror with a high reflectancein the UV range was used to reduce the viewing angle by increasing the dis-tance between camera and measurement section, Fig. 4.16 (b).
92
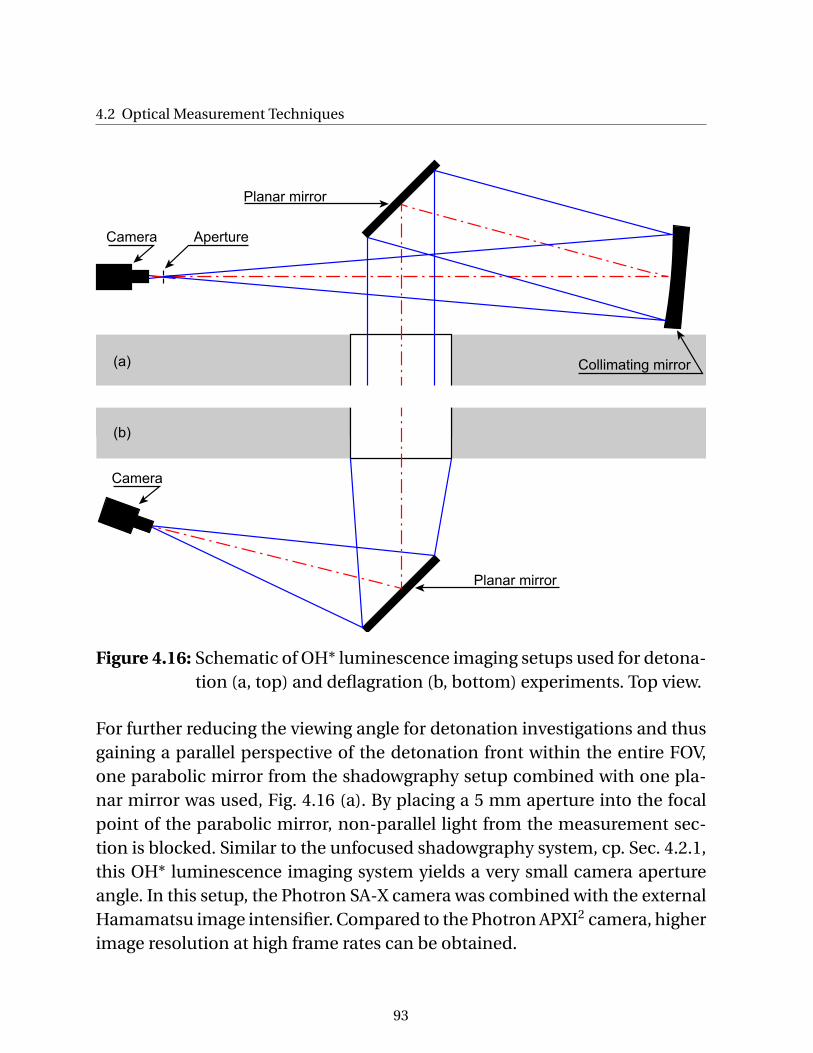
4.2 Optical Measurement Techniques
Camera Aperture
Collimating mirror
(b)
(a)
Camera
Planar mirror
Planar mirror
Figure 4.16: Schematic of OH* luminescence imaging setups used for detona-tion (a, top) and deflagration (b, bottom) experiments. Top view.
For further reducing the viewing angle for detonation investigations and thusgaining a parallel perspective of the detonation front within the entire FOV,one parabolic mirror from the shadowgraphy setup combined with one pla-nar mirror was used, Fig. 4.16 (a). By placing a 5 mm aperture into the focalpoint of the parabolic mirror, non-parallel light from the measurement sec-tion is blocked. Similar to the unfocused shadowgraphy system, cp. Sec. 4.2.1,this OH* luminescence imaging system yields a very small camera apertureangle. In this setup, the Photron SA-X camera was combined with the externalHamamatsu image intensifier. Compared to the Photron APXI2 camera, higherimage resolution at high frame rates can be obtained.
93
5 DDT in H2–Air with Transverse
Concentration Gradients
This chapter aims at developing a comprehensive picture of DDT in H2–airmixtures with transverse concentration gradients. Similar to Ch. 2, DDT is splitinto flame acceleration (FA) and onset of detonation. This division, in contrastto treating DDT as one subject, is of vital importance in particular in the con-text of transverse concentration gradients. The following short summary ofmajor findings is intended to provide orientation and outlines the researchstrategy.
FA is characterized in Sec. 5.1 by means of optical and conventional measure-ments. Flame speed and deduced parameters are used to quantify the influ-ence of concentration gradients. The FA process is strongly influenced by con-centration gradients, in some cases leading to distinctly stronger FA in gradi-ent mixtures. Two effects are of major importance: influence of integral mix-ture properties and development of macroscopic flame shape. The latter con-tributes differently in unobstructed and obstructed channel configurations.These two geometries are compared throughout the entire chapter.
Onset of detonation is analyzed in Sec. 5.2. Shadowgraph sequences and si-multaneous pressure measurements allow for detailed description of onsetmechanisms. Detonation onset occurs as soon as the preceding FA processcreates critical conditions in terms of local overpressure and temperature. On-set mechanisms are similar in homogeneous and gradient mixtures. Simula-tion of detailed chemical kinetics of strong ignition is used to define criticalconditions for onset of detonation.
By finally relating flame speed to overpressure in Sec. 5.3, a comprehensive ex-planation of DDT in H2–air mixtures with transverse concentration gradientsis given in Sec. 5.4.
94
5.1 Flame Acceleration
5.1 Flame Acceleration
This section is divided into two parts: optical characterization of deflagrations(Sec. 5.1.1) and determination of flame velocities and run-up distances (Sec.5.1.2).
The height of all shadowgraph, OH-PLIF and OH* images shown within thischapter equals the channel height H = 0.06 m. Only in case of simultaneousmeasurements, an absolute time scale is used where t = 0 s represents the mo-ment of ignition. Otherwise, for the sake of simplicity, t = 0 s corresponds tothe first image of a sequence. Data points (except in v-x-plots) represent theaverage of five experiments with error bars showing standard deviation. Forinfrequent cases, less than five valid experiments are available. However, thisdoes not pose a constraint to data interpretation since reproducibility of testswas generally high.
5.1.1 Flame Shape and Structure
Optical observations provide a sound base for understanding effects thatemerge in conventional measurement data. About 1500 experiments havebeen conducted involving the optical measurement techniques introduced inSec. 4.2. The author reduces this large amount of optical data to the major re-sults in the context of transverse concentration gradients and jointly discussesthe two following questions:
• How is the macroscopic flame shape influenced by transverse concentra-tion gradients?
• How do flames in gradient mixtures interact with obstacles?
Mainly the steepest concentration gradients (td = 3 s) that can be generated inthe experimantal setup are compared to homogeneous mixtures. First, resultsfrom the unobstructed channel configuration BR00 are presented. Second,representative examples are given for obstructed configurations BR30S300
95
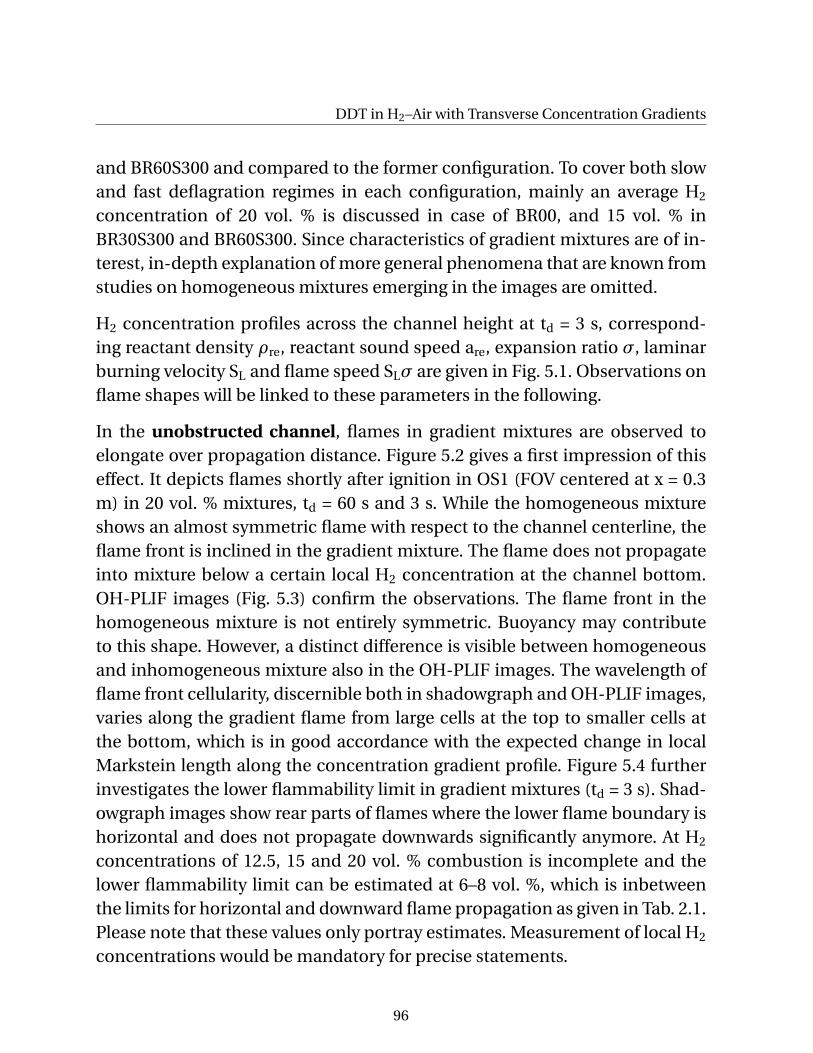
DDT in H2–Air with Transverse Concentration Gradients
and BR60S300 and compared to the former configuration. To cover both slowand fast deflagration regimes in each configuration, mainly an average H2
concentration of 20 vol. % is discussed in case of BR00, and 15 vol. % inBR30S300 and BR60S300. Since characteristics of gradient mixtures are of in-terest, in-depth explanation of more general phenomena that are known fromstudies on homogeneous mixtures emerging in the images are omitted.
H2 concentration profiles across the channel height at td = 3 s, correspond-ing reactant density ρre, reactant sound speed are, expansion ratio σ, laminarburning velocity SL and flame speed SLσ are given in Fig. 5.1. Observations onflame shapes will be linked to these parameters in the following.
In the unobstructed channel, flames in gradient mixtures are observed toelongate over propagation distance. Figure 5.2 gives a first impression of thiseffect. It depicts flames shortly after ignition in OS1 (FOV centered at x = 0.3m) in 20 vol. % mixtures, td = 60 s and 3 s. While the homogeneous mixtureshows an almost symmetric flame with respect to the channel centerline, theflame front is inclined in the gradient mixture. The flame does not propagateinto mixture below a certain local H2 concentration at the channel bottom.OH-PLIF images (Fig. 5.3) confirm the observations. The flame front in thehomogeneous mixture is not entirely symmetric. Buoyancy may contributeto this shape. However, a distinct difference is visible between homogeneousand inhomogeneous mixture also in the OH-PLIF images. The wavelength offlame front cellularity, discernible both in shadowgraph and OH-PLIF images,varies along the gradient flame from large cells at the top to smaller cells atthe bottom, which is in good accordance with the expected change in localMarkstein length along the concentration gradient profile. Figure 5.4 furtherinvestigates the lower flammability limit in gradient mixtures (td = 3 s). Shad-owgraph images show rear parts of flames where the lower flame boundary ishorizontal and does not propagate downwards significantly anymore. At H2
concentrations of 12.5, 15 and 20 vol. % combustion is incomplete and thelower flammability limit can be estimated at 6–8 vol. %, which is inbetweenthe limits for horizontal and downward flame propagation as given in Tab. 2.1.Please note that these values only portray estimates. Measurement of local H2
concentrations would be mandatory for precise statements.
96
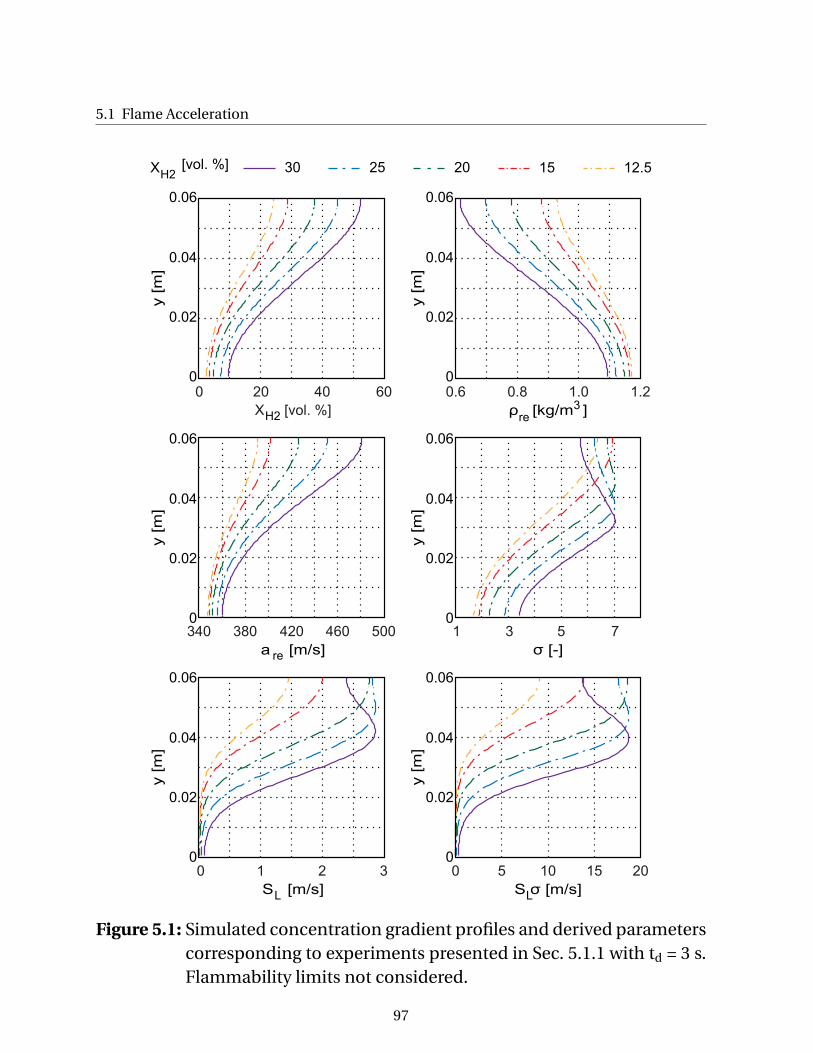
5.1 Flame Acceleration
y [m
]
y [m
]
0
ρ [kg/m ]
0.04
0
X [vol. %]
0.02
0.06
y [m
]
y [m
]
σ [-]a [m/s]
y [m
]
y [m
]
S σ [m/s]S [m/s]
20 40 600
0.04
0.02
0.06
0
0.04
0.02
0.06
0
0.04
0.02
0.06
0
0.04
0.02
0.06
0
0.04
0.02
0.06
L L
re
H2 re3
0.6 0.8 1.0 1.2
1 3 75340 380 460 500420
0 1 32 0 5 15 2010
X H2
30 25 20 15 12.5[vol. %]
Figure 5.1: Simulated concentration gradient profiles and derived parameterscorresponding to experiments presented in Sec. 5.1.1 with td = 3 s.Flammability limits not considered.
97
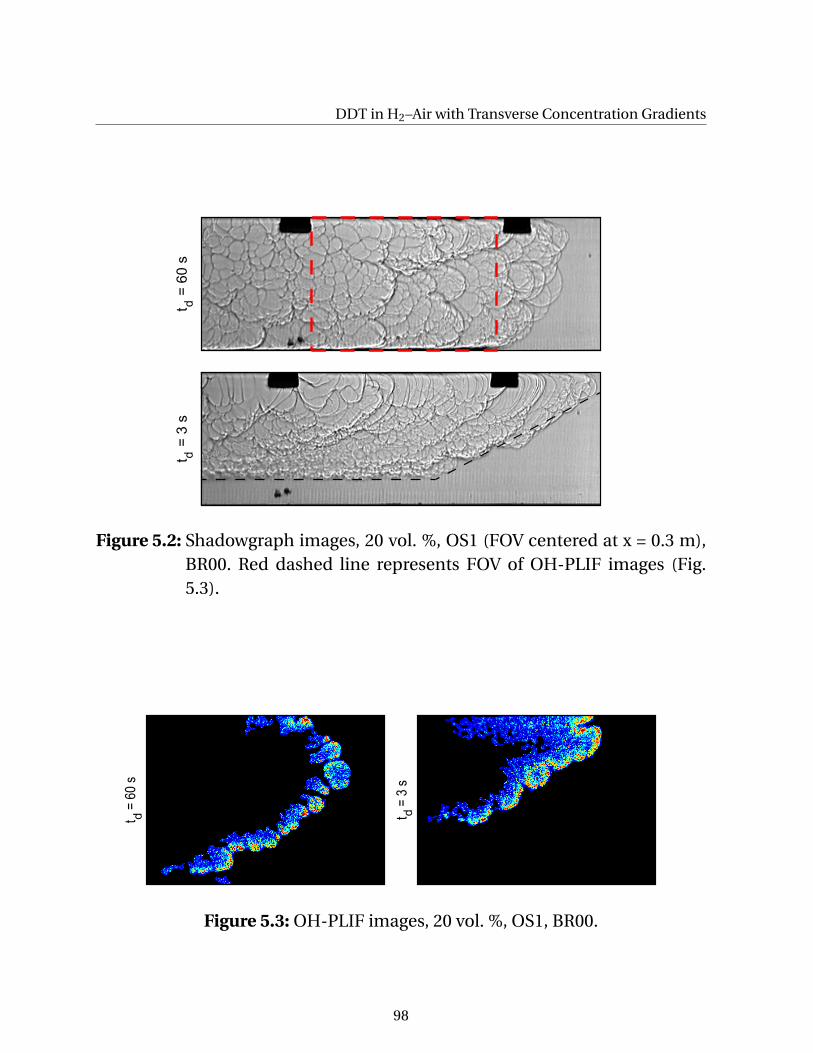
DDT in H2–Air with Transverse Concentration Gradients
t
= 6
0 s
t
= 3
sd
d
Figure 5.2: Shadowgraph images, 20 vol. %, OS1 (FOV centered at x = 0.3 m),BR00. Red dashed line represents FOV of OH-PLIF images (Fig.5.3).
t
= 6
0 s
t
= 3
s
d d
Figure 5.3: OH-PLIF images, 20 vol. %, OS1, BR00.
98
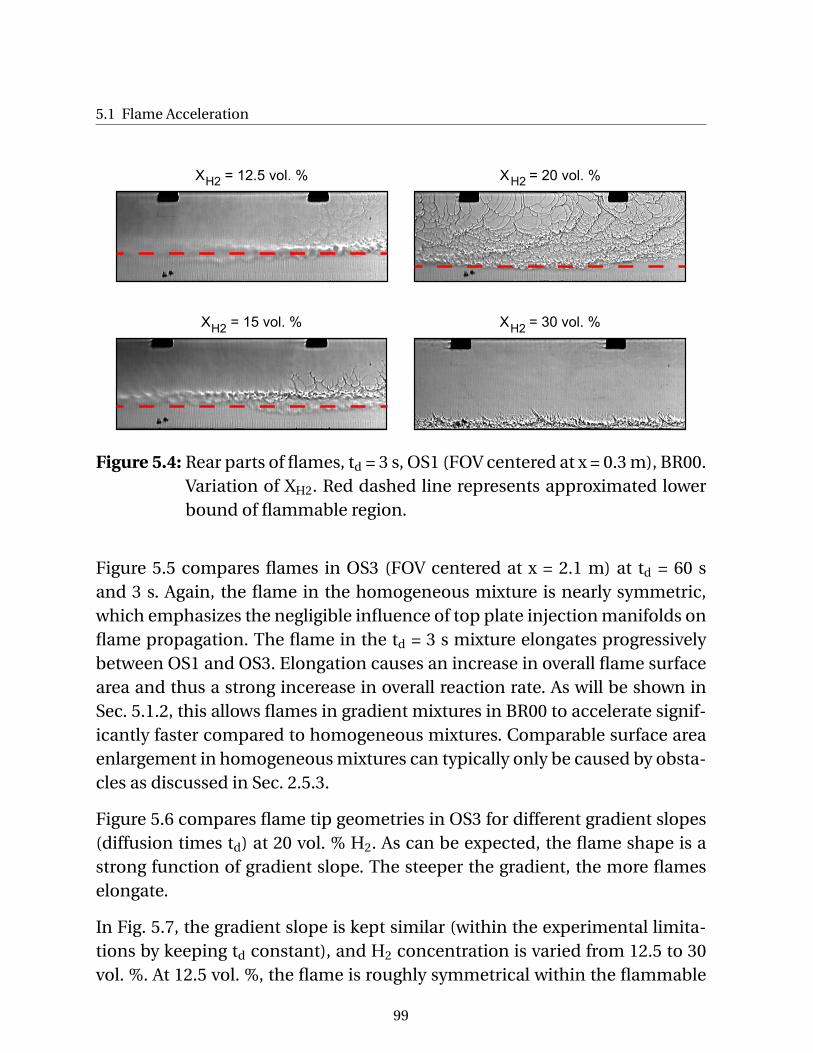
5.1 Flame Acceleration
X = 12.5 vol. % X = 20 vol. %
X = 15 vol. % X = 30 vol. %
H2 H2
H2 H2
Figure 5.4: Rear parts of flames, td = 3 s, OS1 (FOV centered at x = 0.3 m), BR00.Variation of XH2. Red dashed line represents approximated lowerbound of flammable region.
Figure 5.5 compares flames in OS3 (FOV centered at x = 2.1 m) at td = 60 sand 3 s. Again, the flame in the homogeneous mixture is nearly symmetric,which emphasizes the negligible influence of top plate injection manifolds onflame propagation. The flame in the td = 3 s mixture elongates progressivelybetween OS1 and OS3. Elongation causes an increase in overall flame surfacearea and thus a strong incerease in overall reaction rate. As will be shown inSec. 5.1.2, this allows flames in gradient mixtures in BR00 to accelerate signif-icantly faster compared to homogeneous mixtures. Comparable surface areaenlargement in homogeneous mixtures can typically only be caused by obsta-cles as discussed in Sec. 2.5.3.
Figure 5.6 compares flame tip geometries in OS3 for different gradient slopes(diffusion times td) at 20 vol. % H2. As can be expected, the flame shape is astrong function of gradient slope. The steeper the gradient, the more flameselongate.
In Fig. 5.7, the gradient slope is kept similar (within the experimental limita-tions by keeping td constant), and H2 concentration is varied from 12.5 to 30vol. %. At 12.5 vol. %, the flame is roughly symmetrical within the flammable
99
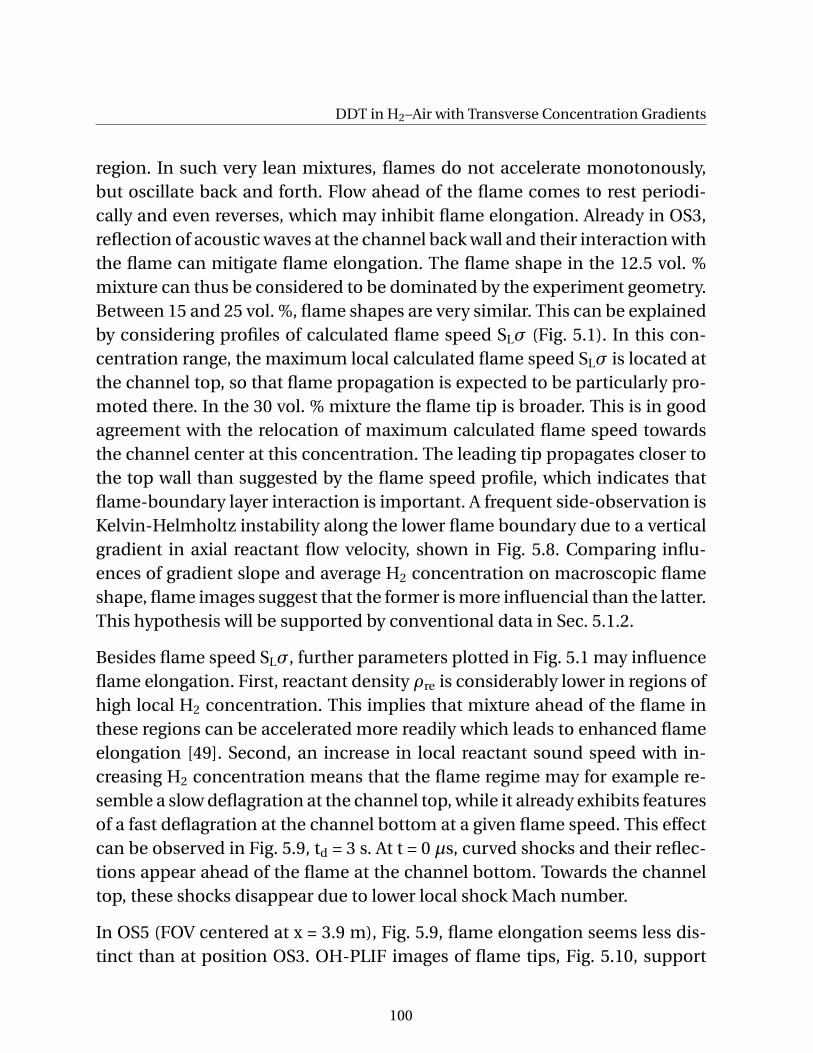
DDT in H2–Air with Transverse Concentration Gradients
region. In such very lean mixtures, flames do not accelerate monotonously,but oscillate back and forth. Flow ahead of the flame comes to rest periodi-cally and even reverses, which may inhibit flame elongation. Already in OS3,reflection of acoustic waves at the channel back wall and their interaction withthe flame can mitigate flame elongation. The flame shape in the 12.5 vol. %mixture can thus be considered to be dominated by the experiment geometry.Between 15 and 25 vol. %, flame shapes are very similar. This can be explainedby considering profiles of calculated flame speed SLσ (Fig. 5.1). In this con-centration range, the maximum local calculated flame speed SLσ is located atthe channel top, so that flame propagation is expected to be particularly pro-moted there. In the 30 vol. % mixture the flame tip is broader. This is in goodagreement with the relocation of maximum calculated flame speed towardsthe channel center at this concentration. The leading tip propagates closer tothe top wall than suggested by the flame speed profile, which indicates thatflame-boundary layer interaction is important. A frequent side-observation isKelvin-Helmholtz instability along the lower flame boundary due to a verticalgradient in axial reactant flow velocity, shown in Fig. 5.8. Comparing influ-ences of gradient slope and average H2 concentration on macroscopic flameshape, flame images suggest that the former is more influencial than the latter.This hypothesis will be supported by conventional data in Sec. 5.1.2.
Besides flame speed SLσ, further parameters plotted in Fig. 5.1 may influenceflame elongation. First, reactant density ρre is considerably lower in regions ofhigh local H2 concentration. This implies that mixture ahead of the flame inthese regions can be accelerated more readily which leads to enhanced flameelongation [49]. Second, an increase in local reactant sound speed with in-creasing H2 concentration means that the flame regime may for example re-semble a slow deflagration at the channel top, while it already exhibits featuresof a fast deflagration at the channel bottom at a given flame speed. This effectcan be observed in Fig. 5.9, td = 3 s. At t = 0 µs, curved shocks and their reflec-tions appear ahead of the flame at the channel bottom. Towards the channeltop, these shocks disappear due to lower local shock Mach number.
In OS5 (FOV centered at x = 3.9 m), Fig. 5.9, flame elongation seems less dis-tinct than at position OS3. OH-PLIF images of flame tips, Fig. 5.10, support
100
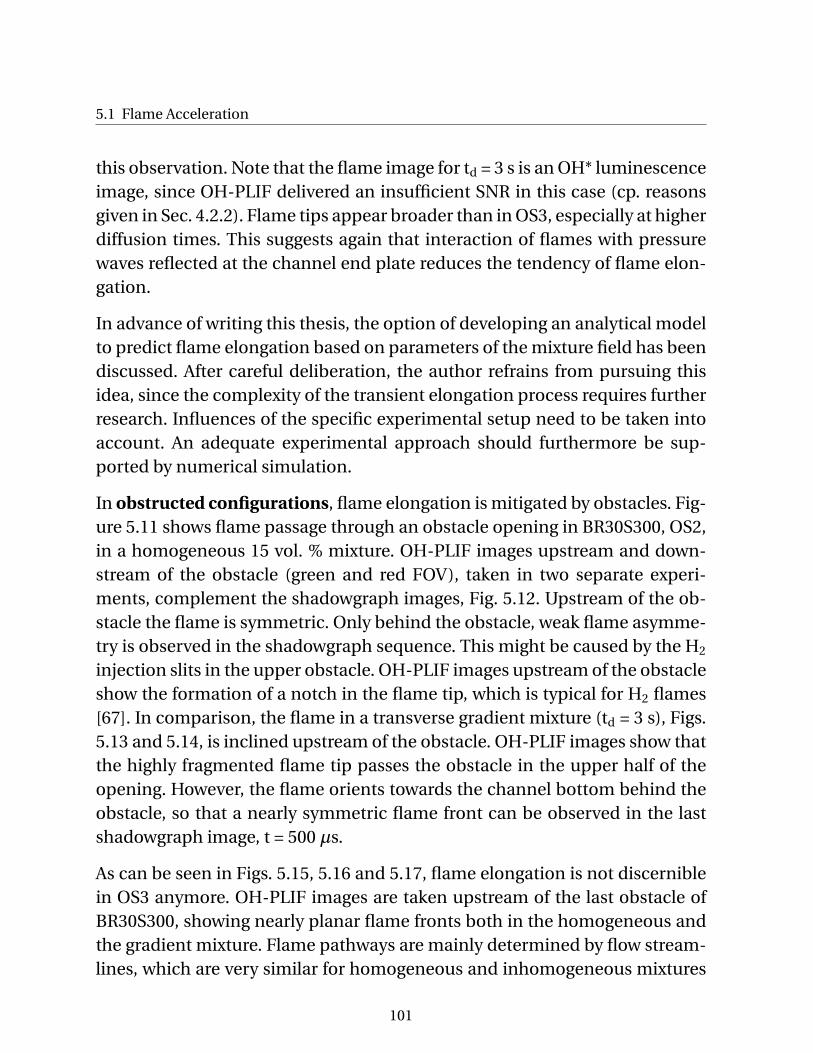
5.1 Flame Acceleration
this observation. Note that the flame image for td = 3 s is an OH* luminescenceimage, since OH-PLIF delivered an insufficient SNR in this case (cp. reasonsgiven in Sec. 4.2.2). Flame tips appear broader than in OS3, especially at higherdiffusion times. This suggests again that interaction of flames with pressurewaves reflected at the channel end plate reduces the tendency of flame elon-gation.
In advance of writing this thesis, the option of developing an analytical modelto predict flame elongation based on parameters of the mixture field has beendiscussed. After careful deliberation, the author refrains from pursuing thisidea, since the complexity of the transient elongation process requires furtherresearch. Influences of the specific experimental setup need to be taken intoaccount. An adequate experimental approach should furthermore be sup-ported by numerical simulation.
In obstructed configurations, flame elongation is mitigated by obstacles. Fig-ure 5.11 shows flame passage through an obstacle opening in BR30S300, OS2,in a homogeneous 15 vol. % mixture. OH-PLIF images upstream and down-stream of the obstacle (green and red FOV), taken in two separate experi-ments, complement the shadowgraph images, Fig. 5.12. Upstream of the ob-stacle the flame is symmetric. Only behind the obstacle, weak flame asymme-try is observed in the shadowgraph sequence. This might be caused by the H2
injection slits in the upper obstacle. OH-PLIF images upstream of the obstacleshow the formation of a notch in the flame tip, which is typical for H2 flames[67]. In comparison, the flame in a transverse gradient mixture (td = 3 s), Figs.5.13 and 5.14, is inclined upstream of the obstacle. OH-PLIF images show thatthe highly fragmented flame tip passes the obstacle in the upper half of theopening. However, the flame orients towards the channel bottom behind theobstacle, so that a nearly symmetric flame front can be observed in the lastshadowgraph image, t = 500 µs.
As can be seen in Figs. 5.15, 5.16 and 5.17, flame elongation is not discerniblein OS3 anymore. OH-PLIF images are taken upstream of the last obstacle ofBR30S300, showing nearly planar flame fronts both in the homogeneous andthe gradient mixture. Flame pathways are mainly determined by flow stream-lines, which are very similar for homogeneous and inhomogeneous mixtures
101
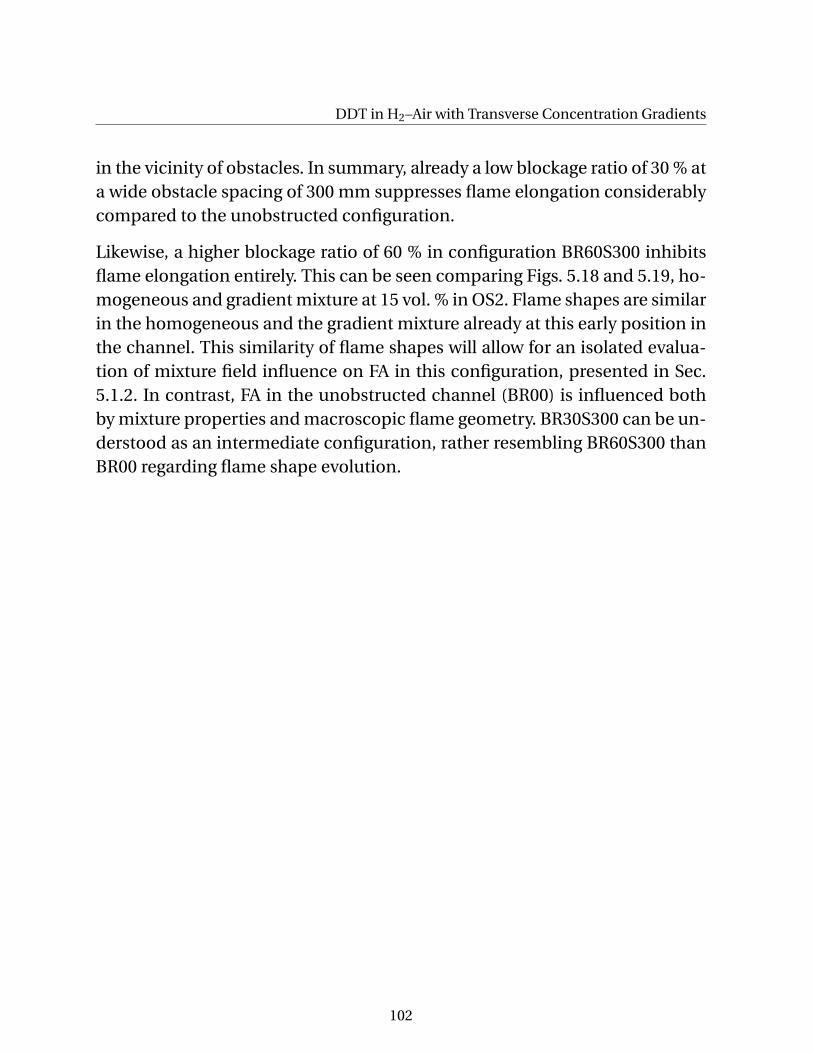
DDT in H2–Air with Transverse Concentration Gradients
in the vicinity of obstacles. In summary, already a low blockage ratio of 30 % ata wide obstacle spacing of 300 mm suppresses flame elongation considerablycompared to the unobstructed configuration.
Likewise, a higher blockage ratio of 60 % in configuration BR60S300 inhibitsflame elongation entirely. This can be seen comparing Figs. 5.18 and 5.19, ho-mogeneous and gradient mixture at 15 vol. % in OS2. Flame shapes are similarin the homogeneous and the gradient mixture already at this early position inthe channel. This similarity of flame shapes will allow for an isolated evalua-tion of mixture field influence on FA in this configuration, presented in Sec.5.1.2. In contrast, FA in the unobstructed channel (BR00) is influenced bothby mixture properties and macroscopic flame geometry. BR30S300 can be un-derstood as an intermediate configuration, rather resembling BR60S300 thanBR00 regarding flame shape evolution.
102
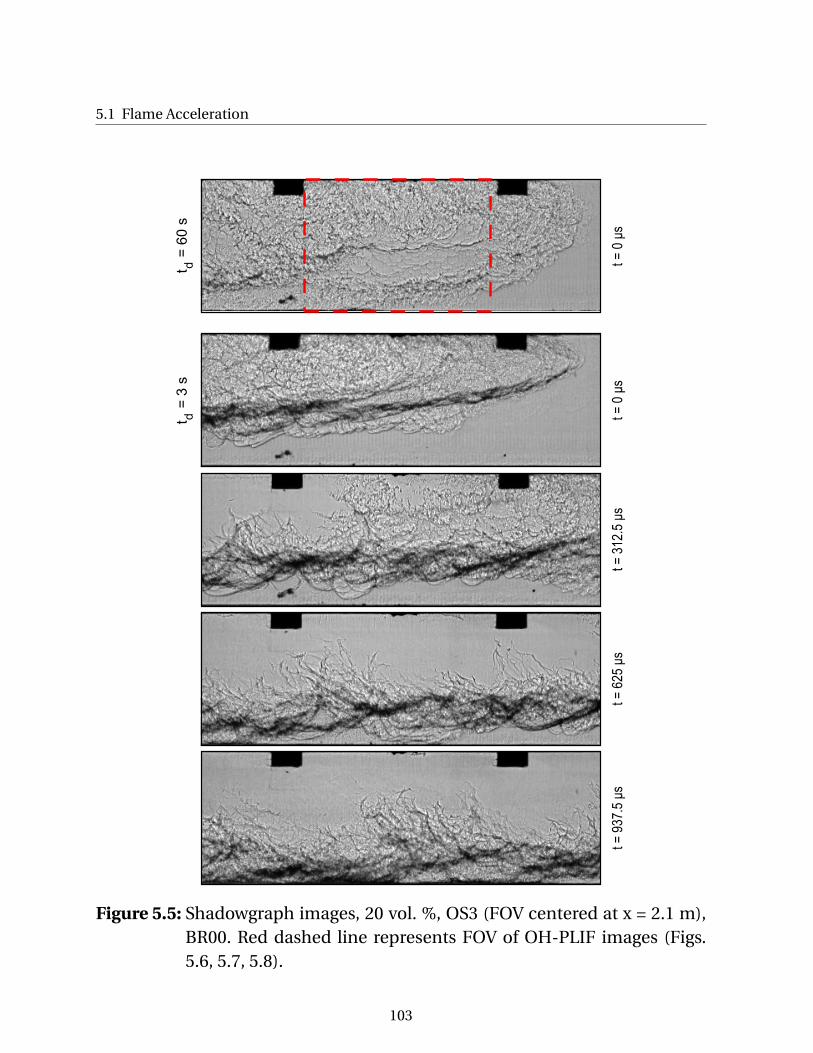
5.1 Flame Acceleration
t
= 6
0 s
t
= 3
sd
d t =
0 μ
st
= 0
μs
t =
31
2.5
μs
t =
62
5 μ
st
= 9
37
.5 μ
s
Figure 5.5: Shadowgraph images, 20 vol. %, OS3 (FOV centered at x = 2.1 m),BR00. Red dashed line represents FOV of OH-PLIF images (Figs.5.6, 5.7, 5.8).
103
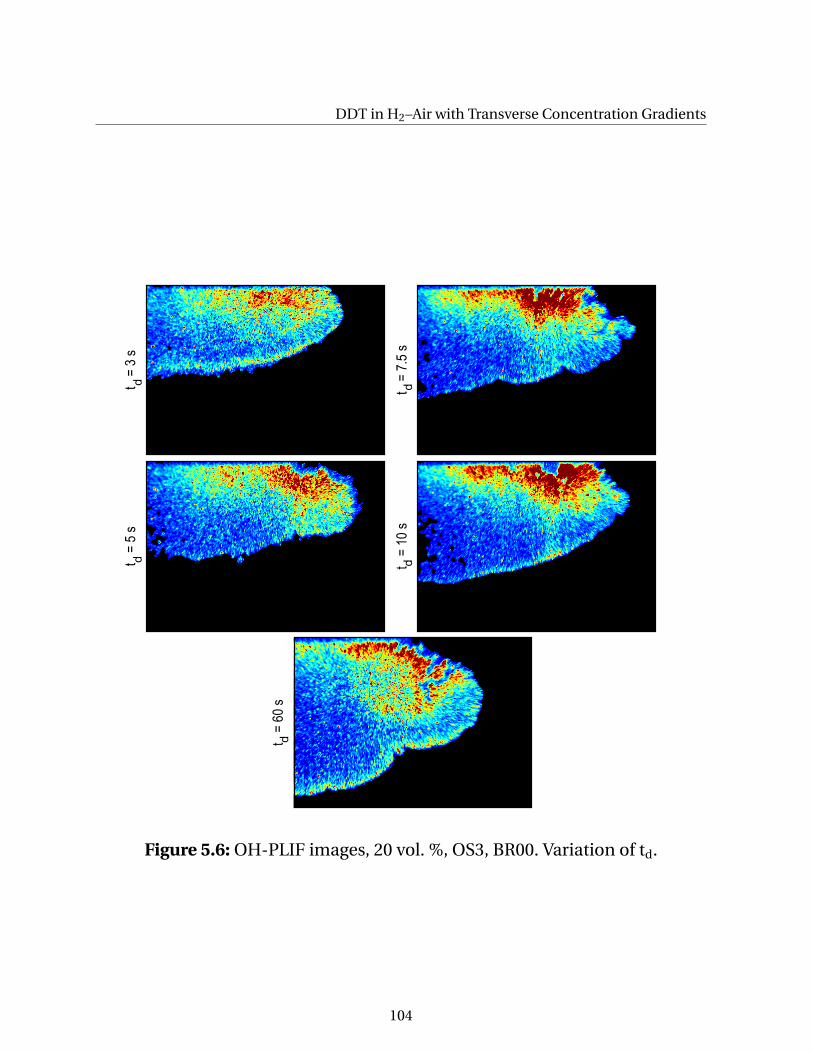
DDT in H2–Air with Transverse Concentration Gradientst
=
3 s
t
= 5
s
t
= 7
.5 s
t
= 1
0 s
dd
dd
t
= 6
0 s
d
Figure 5.6: OH-PLIF images, 20 vol. %, OS3, BR00. Variation of td.
104
5.1 Flame AccelerationX
=
12
.5 v
ol. %
X
= 1
5 v
ol. %
X
= 2
0 v
ol. %
X
= 2
5 v
ol. %
X
= 3
0 v
ol. %
H2
H2
H2
H2
H2
Figure 5.7: OH-PLIF images, td = 3 s, OS3, BR00. Variation of XH2.
105
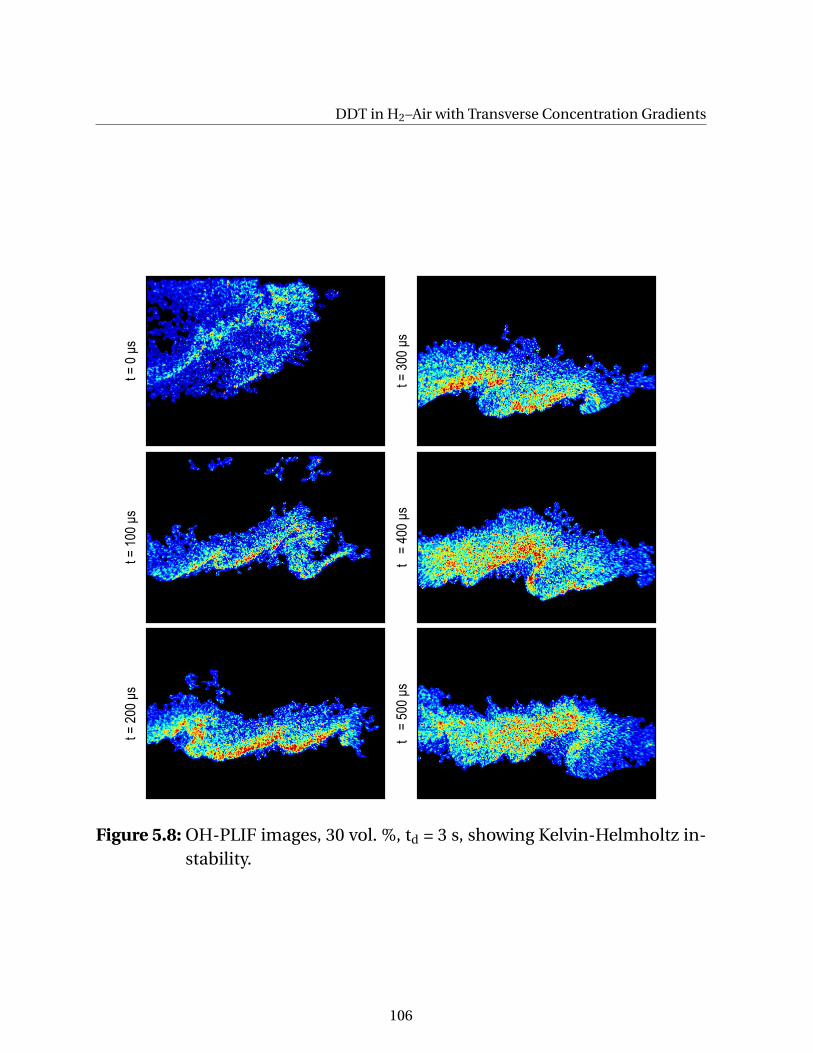
DDT in H2–Air with Transverse Concentration Gradientst
= 0
μs
t =
10
0 μ
s
t =
30
0 μ
st
=
40
0 μ
s
t =
20
0 μ
s
t
= 5
00
μs
Figure 5.8: OH-PLIF images, 30 vol. %, td = 3 s, showing Kelvin-Helmholtz in-stability.
106
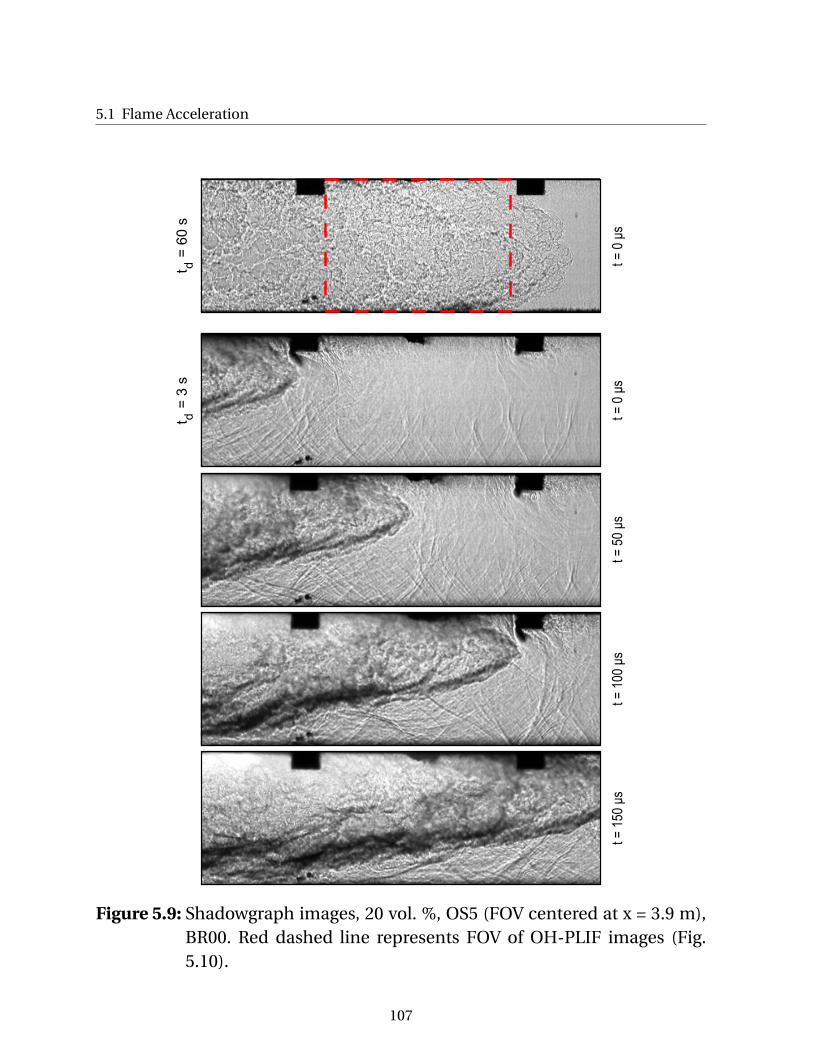
5.1 Flame Acceleration
t
= 6
0 s
t
= 3
sd
d t =
0 μ
st
= 0
μs
t =
50
μs
t =
10
0 μ
st
= 1
50
μs
Figure 5.9: Shadowgraph images, 20 vol. %, OS5 (FOV centered at x = 3.9 m),BR00. Red dashed line represents FOV of OH-PLIF images (Fig.5.10).
107
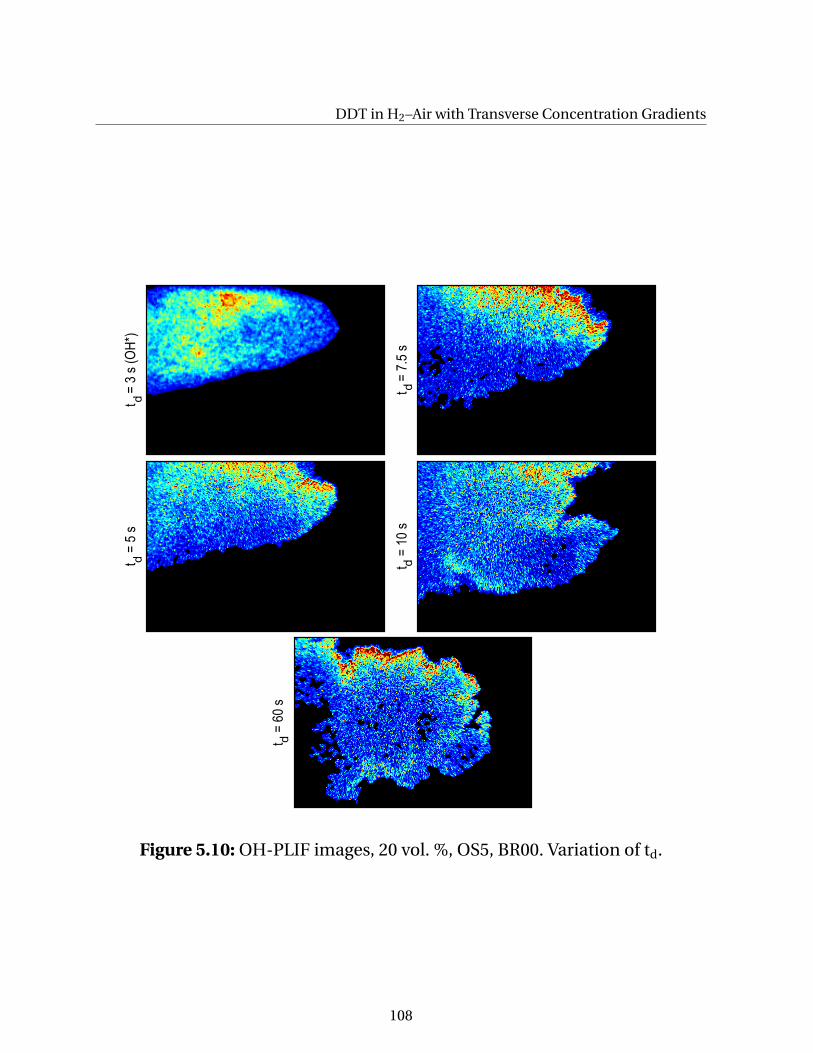
DDT in H2–Air with Transverse Concentration Gradientst
= 3
s (
OH
*)t
= 5
s
t =
7.5
st
= 1
0 s
dd
dd
t =
60
sd
Figure 5.10: OH-PLIF images, 20 vol. %, OS5, BR00. Variation of td.
108
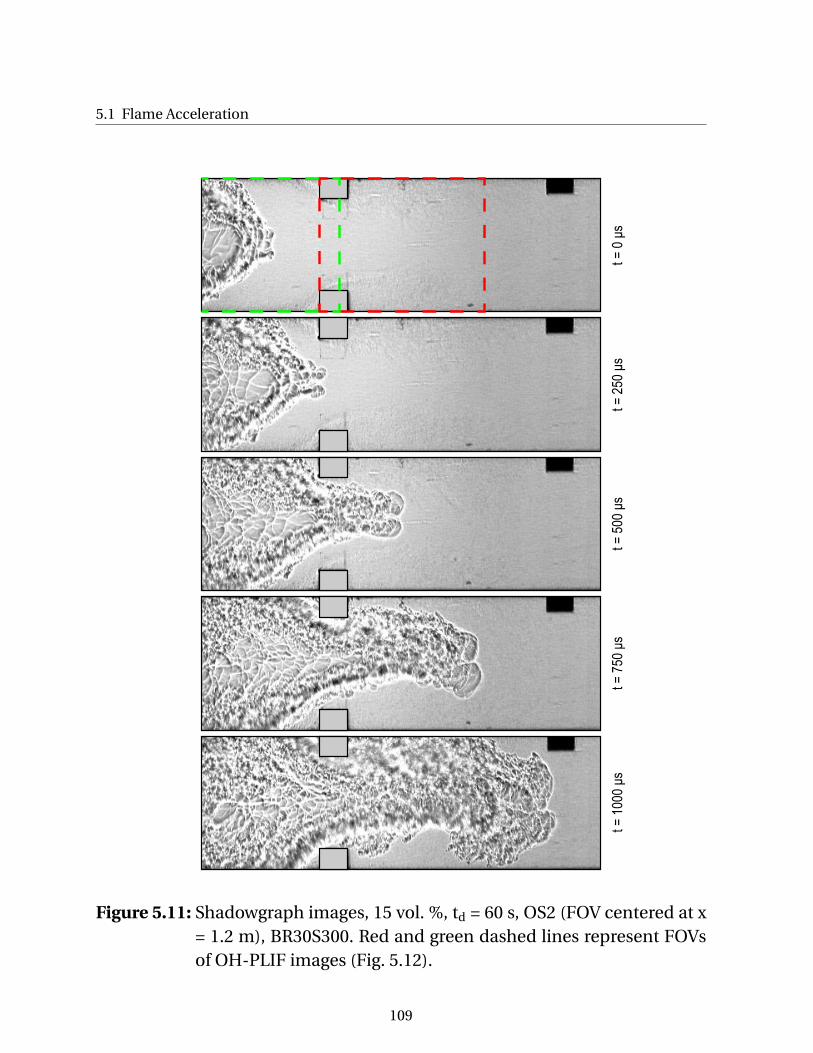
5.1 Flame Acceleration
t =
0 μ
st
= 2
50
μs
t =
50
0 μ
st
= 7
50
μs
t =
10
00
μs
Figure 5.11: Shadowgraph images, 15 vol. %, td = 60 s, OS2 (FOV centered at x= 1.2 m), BR30S300. Red and green dashed lines represent FOVsof OH-PLIF images (Fig. 5.12).
109
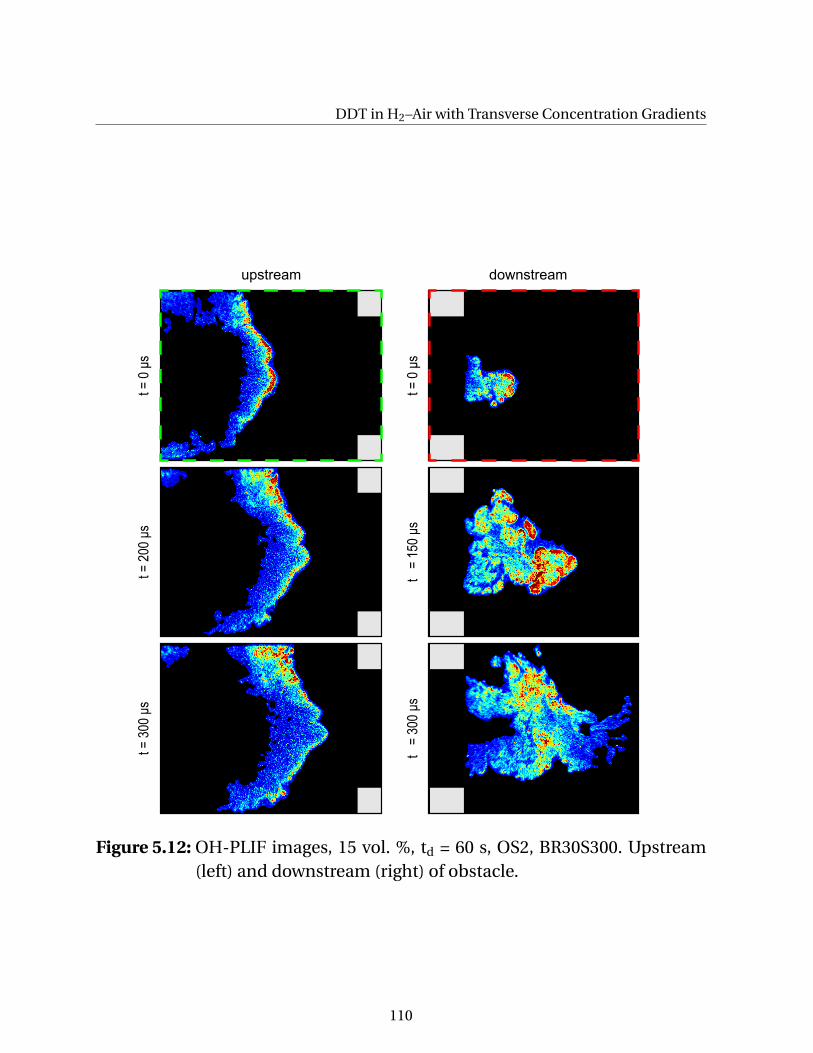
DDT in H2–Air with Transverse Concentration Gradients
t =
0 μ
st
= 2
00
μs
t =
0 μ
st
=
15
0 μ
s
t =
30
0 μ
s
t
= 3
00
μs
upstream downstream
Figure 5.12: OH-PLIF images, 15 vol. %, td = 60 s, OS2, BR30S300. Upstream(left) and downstream (right) of obstacle.
110
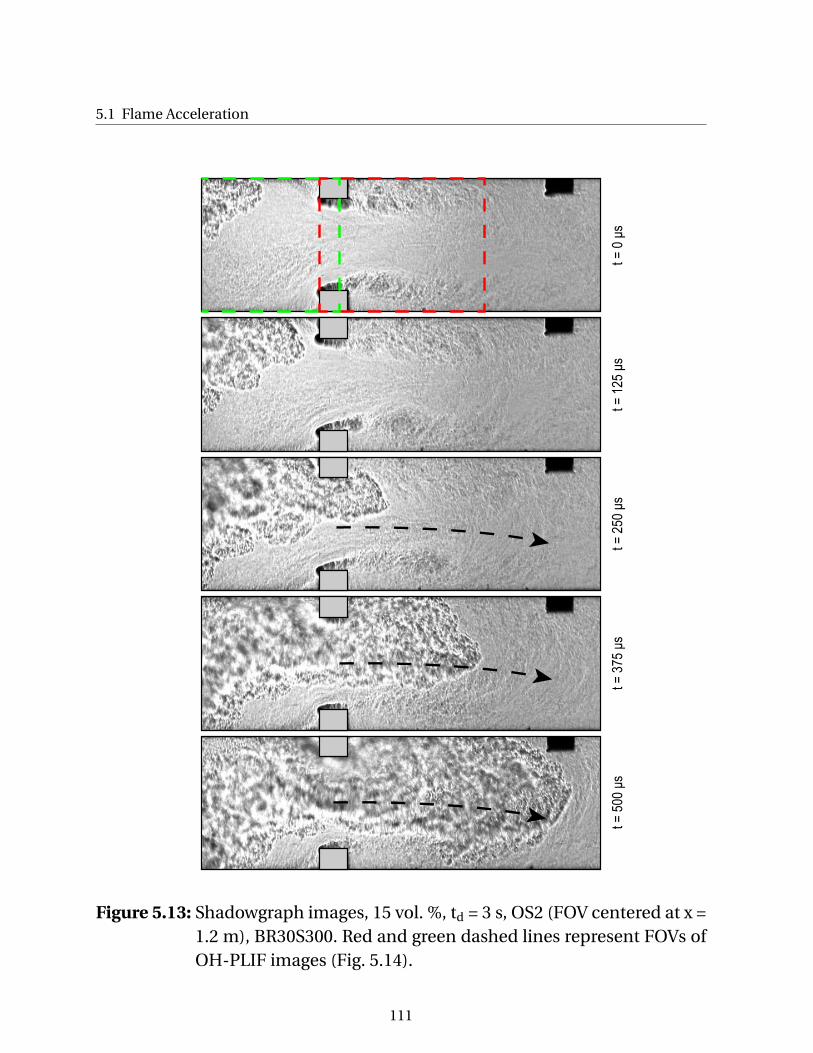
5.1 Flame Acceleration
t =
0 μ
st
= 1
25
μs
t =
25
0 μ
st
= 3
75
μs
t =
50
0 μ
s
Figure 5.13: Shadowgraph images, 15 vol. %, td = 3 s, OS2 (FOV centered at x =1.2 m), BR30S300. Red and green dashed lines represent FOVs ofOH-PLIF images (Fig. 5.14).
111
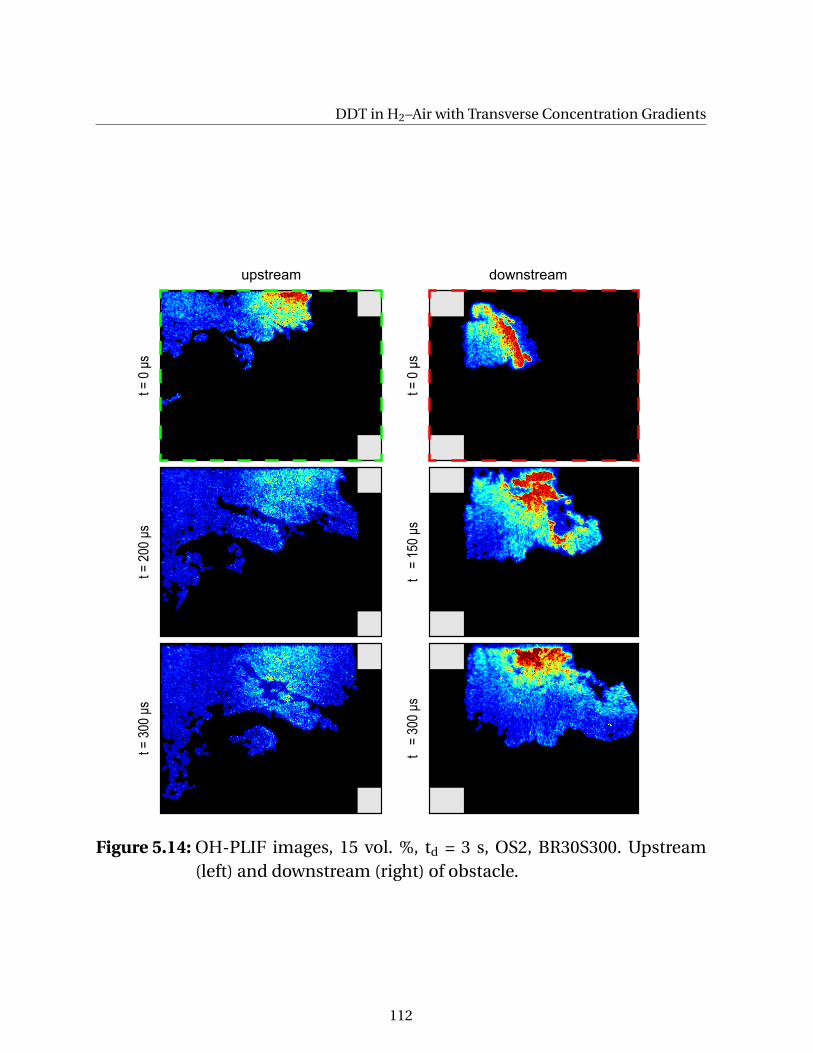
DDT in H2–Air with Transverse Concentration Gradients
t =
0 μ
st
= 2
00
μs
t =
0 μ
st
=
15
0 μ
s
t =
30
0 μ
s
t
= 3
00
μs
upstream downstream
Figure 5.14: OH-PLIF images, 15 vol. %, td = 3 s, OS2, BR30S300. Upstream(left) and downstream (right) of obstacle.
112
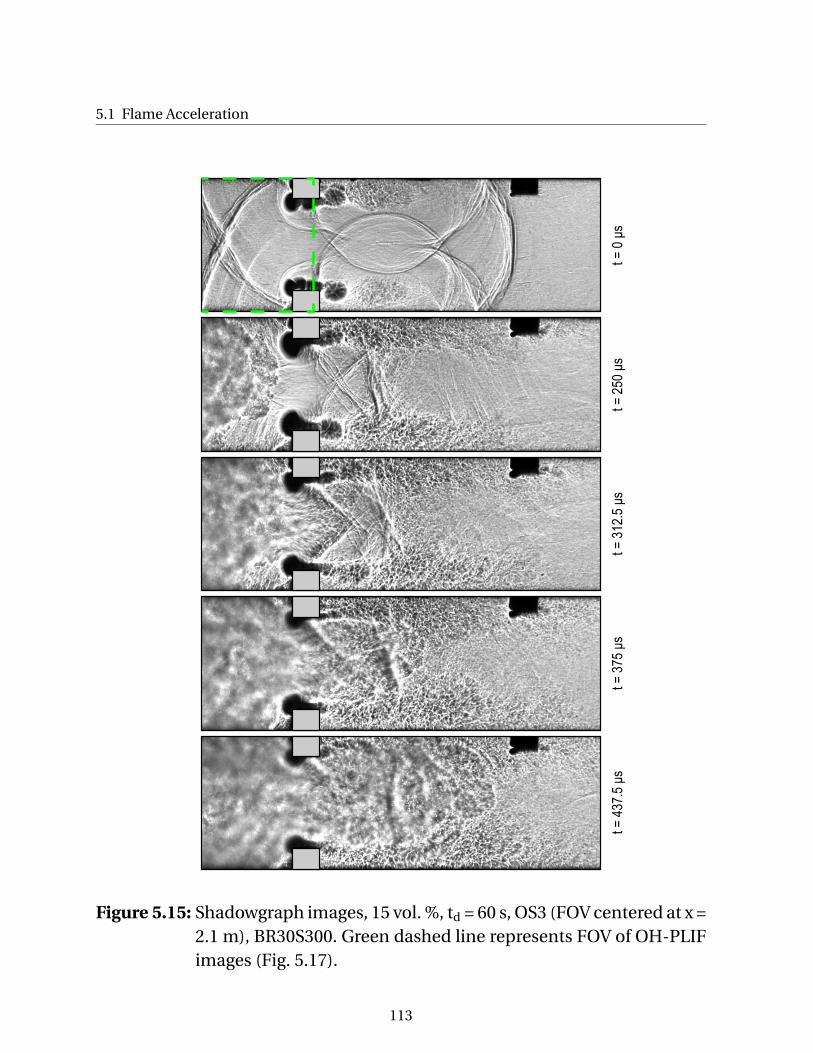
5.1 Flame Acceleration
t =
0 μ
st
= 2
50
μs
t =
31
2.5
μs
t =
37
5 μ
st
= 4
37
.5 μ
s
Figure 5.15: Shadowgraph images, 15 vol. %, td = 60 s, OS3 (FOV centered at x =2.1 m), BR30S300. Green dashed line represents FOV of OH-PLIFimages (Fig. 5.17).
113
DDT in H2–Air with Transverse Concentration Gradients
t =
0 μ
st
= 3
12
.5 μ
st
= 3
75
μs
t =
43
7.5
μs
t =
50
0 μ
s
Figure 5.16: Shadowgraph images, 15 vol. %, td = 3 s, OS3 (FOV centered at x =2.1 m), BR30S300. Green dashed line represents FOV of OH-PLIFimages (Fig. 5.17).
114
5.1 Flame Accelerationt
=
60
s
t
= 3
s
d d
Figure 5.17: OH-PLIF images, 15 vol. %, OS3, BR30S300. FOV upstream of ob-stacle.
115
DDT in H2–Air with Transverse Concentration Gradients
t =
0 μ
st
= 3
75
μs
t =
50
0 μ
st
= 6
25
μs
t =
75
0 μ
s
Figure 5.18: Shadowgraph images, 15 vol. %, td = 60 s, OS2 (FOV centered at x= 1.2 m), BR60S300.
116
5.1 Flame Acceleration
t =
0 μ
st
= 3
75
μs
t =
50
0 μ
st
= 6
25
μs
t =
75
0 μ
s
Figure 5.19: Shadowgraph images, 15 vol. %, td = 3 s, OS2 (FOV centered at x =1.2 m), BR60S300.
117
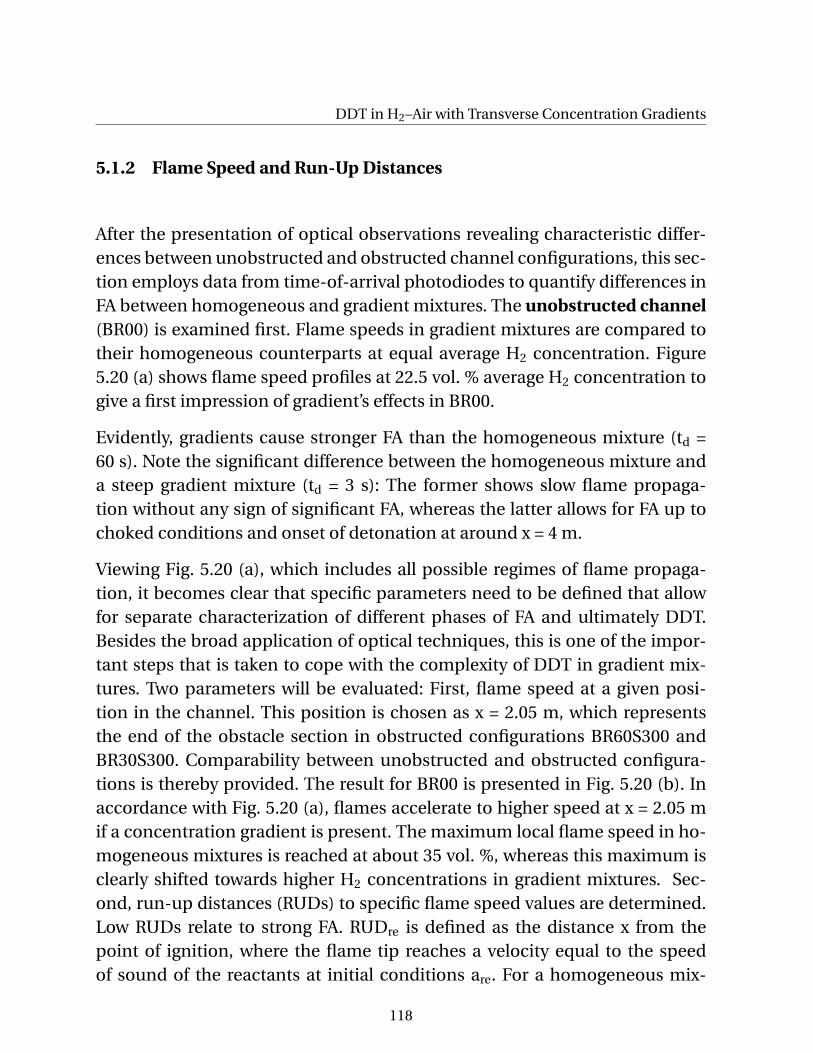
DDT in H2–Air with Transverse Concentration Gradients
5.1.2 Flame Speed and Run-Up Distances
After the presentation of optical observations revealing characteristic differ-ences between unobstructed and obstructed channel configurations, this sec-tion employs data from time-of-arrival photodiodes to quantify differences inFA between homogeneous and gradient mixtures. The unobstructed channel
(BR00) is examined first. Flame speeds in gradient mixtures are compared totheir homogeneous counterparts at equal average H2 concentration. Figure5.20 (a) shows flame speed profiles at 22.5 vol. % average H2 concentration togive a first impression of gradient’s effects in BR00.
Evidently, gradients cause stronger FA than the homogeneous mixture (td =60 s). Note the significant difference between the homogeneous mixture anda steep gradient mixture (td = 3 s): The former shows slow flame propaga-tion without any sign of significant FA, whereas the latter allows for FA up tochoked conditions and onset of detonation at around x = 4 m.
Viewing Fig. 5.20 (a), which includes all possible regimes of flame propaga-tion, it becomes clear that specific parameters need to be defined that allowfor separate characterization of different phases of FA and ultimately DDT.Besides the broad application of optical techniques, this is one of the impor-tant steps that is taken to cope with the complexity of DDT in gradient mix-tures. Two parameters will be evaluated: First, flame speed at a given posi-tion in the channel. This position is chosen as x = 2.05 m, which representsthe end of the obstacle section in obstructed configurations BR60S300 andBR30S300. Comparability between unobstructed and obstructed configura-tions is thereby provided. The result for BR00 is presented in Fig. 5.20 (b). Inaccordance with Fig. 5.20 (a), flames accelerate to higher speed at x = 2.05 mif a concentration gradient is present. The maximum local flame speed in ho-mogeneous mixtures is reached at about 35 vol. %, whereas this maximum isclearly shifted towards higher H2 concentrations in gradient mixtures. Sec-ond, run-up distances (RUDs) to specific flame speed values are determined.Low RUDs relate to strong FA. RUDre is defined as the distance x from thepoint of ignition, where the flame tip reaches a velocity equal to the speedof sound of the reactants at initial conditions are. For a homogeneous mix-
118
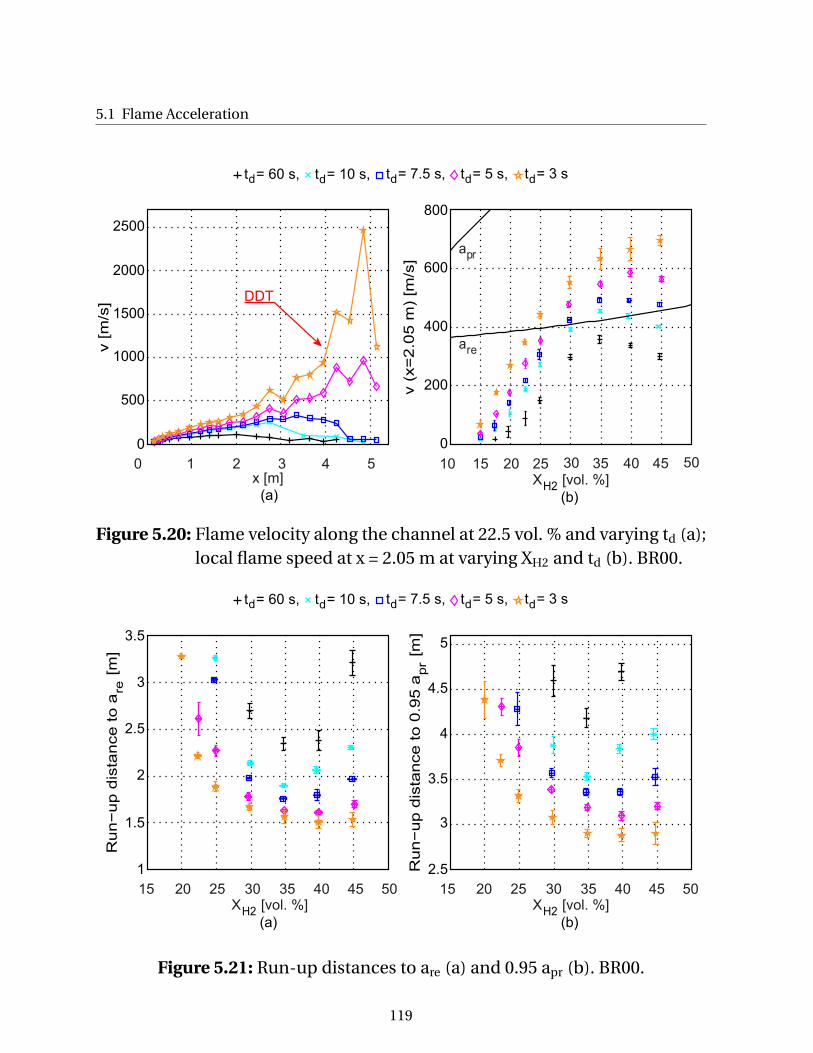
5.1 Flame Acceleration
are
apr
v [m
/s]
v (
x=
2.0
5 m
) [m
/s]
2500
1000
0
800
600
400
200
0
500
1500
0 52 10 15 20 25 30
(a) (b)
x [m] X [vol. %]31 35 40 45 50
H2
2000
4
t = 60 s, t = 10 s, t = 7.5 s, t = 5 s, t = 3 sd d d d d
DDT
Figure 5.20: Flame velocity along the channel at 22.5 vol. % and varying td (a);local flame speed at x = 2.05 m at varying XH2 and td (b). BR00.
Run
−up
dis
tanc
e to
a
[m]
re
Run
−up
dis
tanc
e to
0.9
5 a
[m
]pr
15 20 25 30 40
(b)
X [vol. %]45 50
H2
3515 20 25 30 40
(a)X [vol. %]
45 50H2
35
3.5
3
2.5
2
1.5
1
5
4.5
4
3.5
3
2.5
t = 60 s, t = 10 s, t = 7.5 s, t = 5 s, t = 3 sd d d d d
Figure 5.21: Run-up distances to are (a) and 0.95 apr (b). BR00.
119
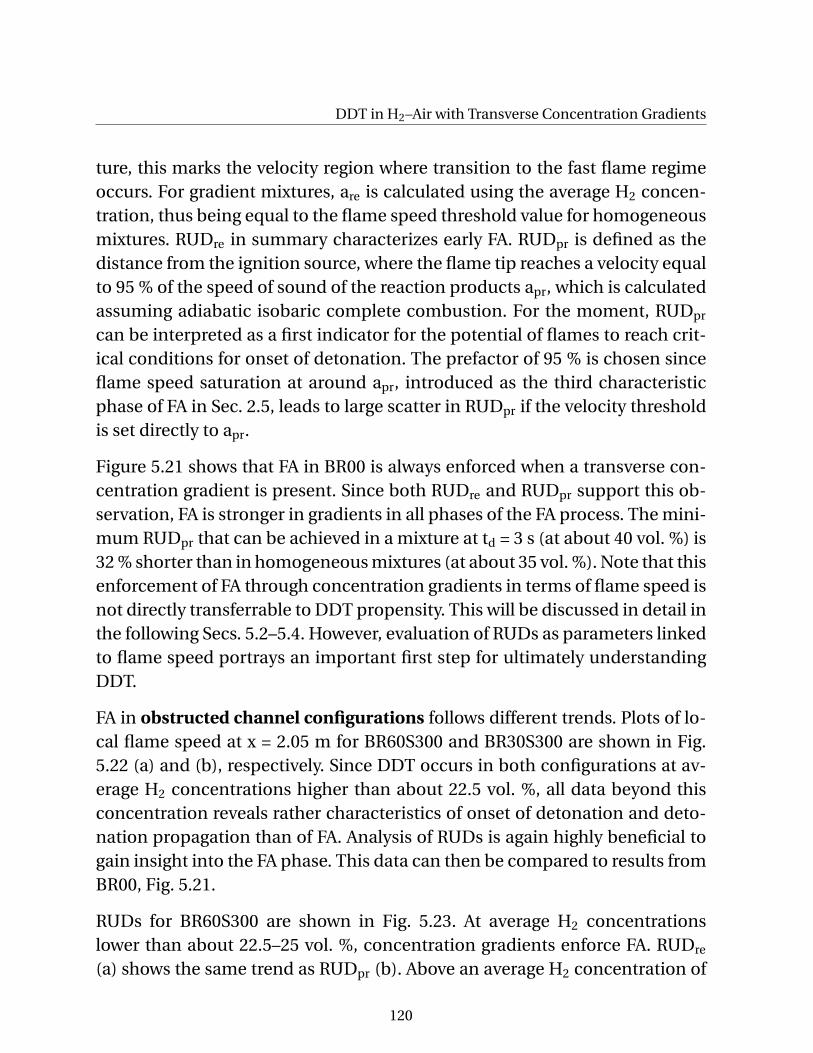
DDT in H2–Air with Transverse Concentration Gradients
ture, this marks the velocity region where transition to the fast flame regimeoccurs. For gradient mixtures, are is calculated using the average H2 concen-tration, thus being equal to the flame speed threshold value for homogeneousmixtures. RUDre in summary characterizes early FA. RUDpr is defined as thedistance from the ignition source, where the flame tip reaches a velocity equalto 95 % of the speed of sound of the reaction products apr, which is calculatedassuming adiabatic isobaric complete combustion. For the moment, RUDpr
can be interpreted as a first indicator for the potential of flames to reach crit-ical conditions for onset of detonation. The prefactor of 95 % is chosen sinceflame speed saturation at around apr, introduced as the third characteristicphase of FA in Sec. 2.5, leads to large scatter in RUDpr if the velocity thresholdis set directly to apr.
Figure 5.21 shows that FA in BR00 is always enforced when a transverse con-centration gradient is present. Since both RUDre and RUDpr support this ob-servation, FA is stronger in gradients in all phases of the FA process. The mini-mum RUDpr that can be achieved in a mixture at td = 3 s (at about 40 vol. %) is32 % shorter than in homogeneous mixtures (at about 35 vol. %). Note that thisenforcement of FA through concentration gradients in terms of flame speed isnot directly transferrable to DDT propensity. This will be discussed in detail inthe following Secs. 5.2–5.4. However, evaluation of RUDs as parameters linkedto flame speed portrays an important first step for ultimately understandingDDT.
FA in obstructed channel configurations follows different trends. Plots of lo-cal flame speed at x = 2.05 m for BR60S300 and BR30S300 are shown in Fig.5.22 (a) and (b), respectively. Since DDT occurs in both configurations at av-erage H2 concentrations higher than about 22.5 vol. %, all data beyond thisconcentration reveals rather characteristics of onset of detonation and deto-nation propagation than of FA. Analysis of RUDs is again highly beneficial togain insight into the FA phase. This data can then be compared to results fromBR00, Fig. 5.21.
RUDs for BR60S300 are shown in Fig. 5.23. At average H2 concentrationslower than about 22.5–25 vol. %, concentration gradients enforce FA. RUDre
(a) shows the same trend as RUDpr (b). Above an average H2 concentration of
120
5.1 Flame Accelerationv (
x=
2.0
5 m
) [m
/s]
2500
1000
0
500
1500
10 15 20 25 35
(b)
X [vol. %]40 45
H2
t = 60 s, t = 10 s, t = 7.5 s, t = 5 s, t = 3 sd d d d d
2000
30
v (
x=
2.0
5 m
) [m
/s]
2500
1000
0
500
1500
2000
10 15 20 25 35
(a)
X [vol. %]40 45
H2
30
areare
aprapr
DCJ DCJ
Figure 5.22: Local flame speed at x = 2.05 m. BR60S300 (a); BR30S300 (b).
22.5–25 vol. %, gradients lead to higher RUDs. FA is clearly retarded by gradi-ents in this region beyond this average H2 concentration, hereinafter termedflame speed cross-over concentration. It is marked in Fig. 5.23 by a red arrow.
A second obstacle configuration (BR30S300) was investigated in order tocheck the universality of findings for obstructed channels. RUDs are shown inFig. 5.24. In general, FA is less effective at such low blockage ratio compared toBR60S300. However, the same effect of average H2 concentration combinedwith concentration gradients on RUDs can be seen. The flame speed cross-over concentration is located at around 25 vol. %, very similar to the result inBR60S300
The major difference in RUDs between unobstructed and obstructed config-urations is caused by a different development of macroscopic flame shape.As it was shown in Sec. 5.1.1, flames in gradient mixtures only elongate sig-nificantly in BR00. Obstacles in contrast hinder the elongation process. Thus,relevant flame surface area enlargement causing a strong increase in overallreaction rate and thereby enforcing FA, only takes place in BR00. In BR60S300
121
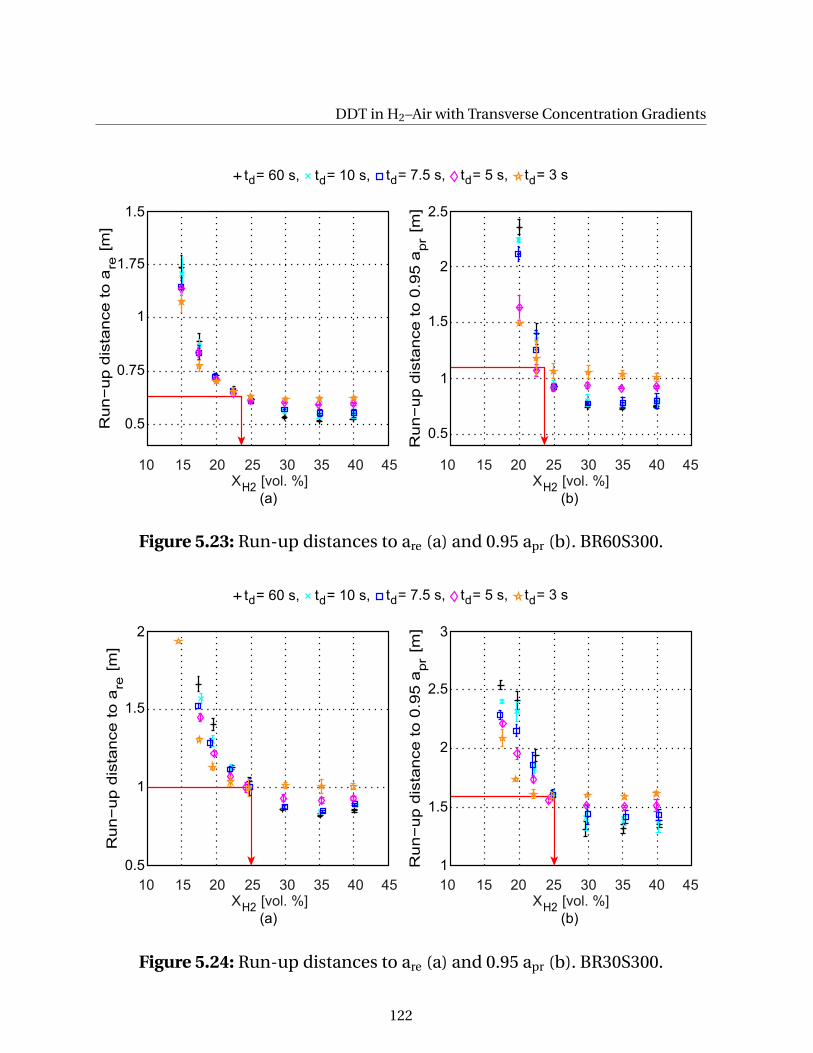
DDT in H2–Air with Transverse Concentration Gradients
10 15 20 25 35
(b)
X [vol. %]40 45
H2
3010 15 20 25 35
(a)
X [vol. %]40 45
H2
30
Run
−up
dis
tanc
e to
a
[m]
re
Run
−up
dis
tanc
e to
0.9
5 a
[m
]pr
1.5
1
0.5
2.5
2
1.5
1
0.5
t = 60 s, t = 10 s, t = 7.5 s, t = 5 s, t = 3 sd d d d d
0.75
1.75
Figure 5.23: Run-up distances to are (a) and 0.95 apr (b). BR60S300.
10 15 20 25 35
(b)
X [vol. %]40 45
H2
3010 15 20 25 35
(a)
X [vol. %]40 45
H2
30
Run
−up
dis
tanc
e to
a
[m]
re
Run
−up
dis
tanc
e to
0.9
5 a
[m
]pr
2
1.5
1
0.5
3
2.5
2
1.5
1
t = 60 s, t = 10 s, t = 7.5 s, t = 5 s, t = 3 sd d d d d
Figure 5.24: Run-up distances to are (a) and 0.95 apr (b). BR30S300.
122
5.1 Flame Acceleration
and BR30S300, differences in FA are mainly caused by mixture properties.
The following theoretical approach primarily aims at explaining the oc-curence of a flame speed cross-over concentration in obstructed configura-tions, based on the analysis of mixture properties. It will be shown that sim-ple analytical considerations can reproduce differences in RUDs between ho-mogeneous and gradient mixtures at a surprisingly high accuracy. However,please keep in mind that this approach is not yet sufficient to describe theentire process of DDT but only focuses on FA as the first phase of DDT.
A central mixture property, the expansion ratio σ = ρre/ρpr, is examined first.The expansion ratio can be employed to describe FA and is especially usefulto predict potential for strong FA [32]. It can be calculated for a homogeneousH2–air mixture as shown in Fig. 5.25 (a), diffusion time td = 60 s. Adiabatic iso-baric complete combustion is assumed as a simplification for the deflagrationregime to obtain the burnt state and thus ρpr.
An integral approach is suggested here to account for the influence of trans-verse concentration gradients. The effective expansion ratio σeff is defined asthe average across the channel height H for a given H2–air distribution, thus
σeff =1
H
∫H
0σ(y)dy, (5.1)
where σ(y) is the local expansion ratio calculated for the corresponding lo-cal mixture composition at a vertical position y. Concentration profiles fromnumerical simulations of the injection process in the facility by Ettner [42] asdescribed in Sec. 3.2 are used for these calculations.
In Fig. 5.25 (a), the effective expansion ratio σeff as a function of average H2
concentration is shown for different gradients labeled by corresponding dif-fusion times td. It remains below the values for homogeneous mixtures at allaverage concentrations due to the non-linear dependency between expansionratio and H2 concentration. As long as nearly point-symmetric concentrationgradients are examined, this trend is principally not dependent on the gradi-ent shape and would be qualitatively similar for linear concentration gradi-ents, for example.
123
DDT in H2–Air with Transverse Concentration Gradients
As a second basic parameter for FA, the laminar burning velocity SL, is exam-ined analogously by defining an effective laminar burning velocity SL,eff. It iswritten as
SL,eff =1
H
∫H
0SL(y)dy. (5.2)
SL,eff is plotted in Fig. 5.25 (b). The polynomial given by Eq. (2.29) yields thecurve for the homogeneous mixture, td = 60 s. Evaluation of gradient profilesusing Eq. (5.2) shows that the effective burning velocity directly reproducesthe flame speed cross-over point, marked by a red arrow. Only in the region ofaverage H2 concentrations lower than about 24 vol. %, gradients lead to highereffective burning velocities. Beyond this concentration, effective burning ve-locity is lower in gradient mixtures than in homogeneous mixtures. The cross-over concentration observed experimentally is reproduced accurately. Notethat the shape or the slope of the concentration gradients does not influencethe flame speed cross-over concentration, as long as nearly point-symmetricprofiles are considered. All gradient profiles investigated show a common in-tersection point.
Two important conclusions can be drawn at this stage:
• The integral approach is verified by the accurate reproduction of flame
speed cross-over concentration. In comparison, consideration of max-imum H2 concentration only as suggested by Kuznetsov et al. [85] andGrune et al. [56] cannot reproduce this very basic effect of concentra-tion gradients in an entirely closed tube. The utilization of numericallydetermined concentration profiles does not influence this conclusion. Itwas possible to gain this insight by separating the influence of mixturefrom the influence of flame elongation by comparing unobstructed andobstructed configurations.
• The relevance of laminar burning velocity for accurate description of
FA in inhomogeneous mixtures is shown. Expansion ratio alone is evi-dently insufficient to account for mixture inhomogeneity in H2–air.
124
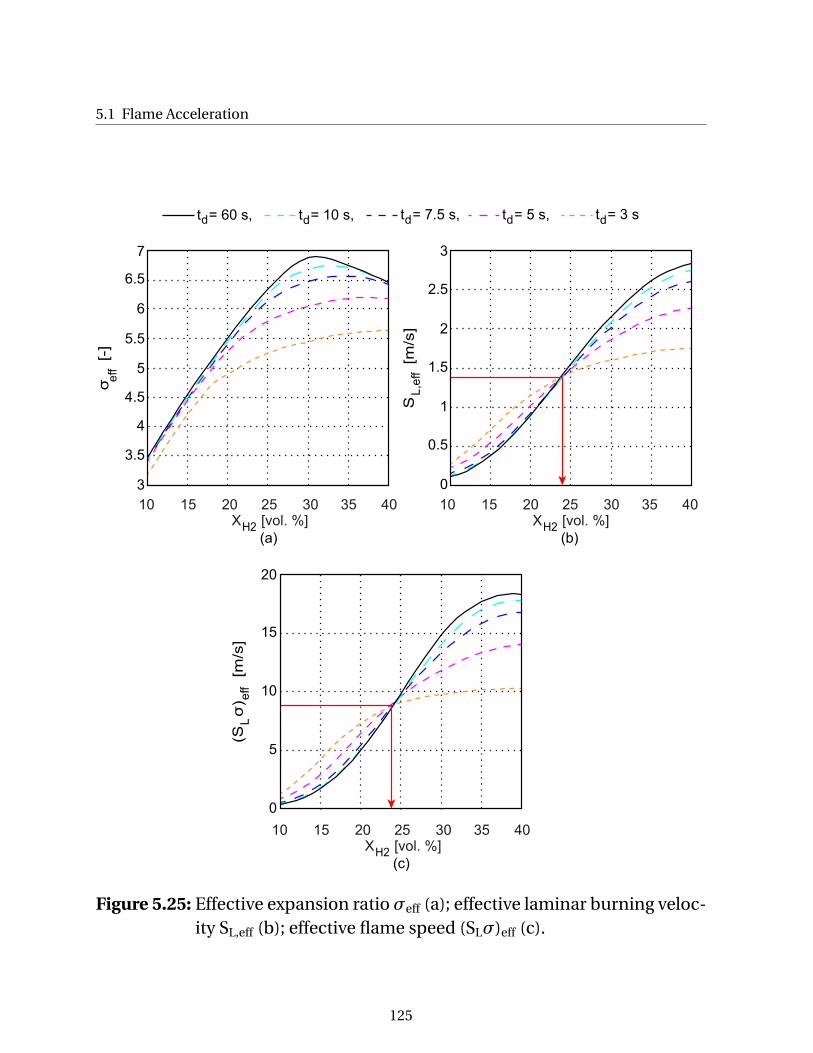
5.1 Flame Accelerationσ
[-
]
S [m
/s]
6.5
4
3
3
2
1.5
1
0
3.5
5.5
10 15 20 25 30
(b)
X [vol. %]35 40
H2
6
t = 60 s, t = 10 s, t = 7.5 s, t = 5 s, t = 3 sd d d d d
10 15 20 25 30
(a)
X [vol. %]35 40
H2
eff
L,e
ff
10 15 20 25 30
(c)
X [vol. %]35 40
H2
4.5
5
7
0.5
2.5
(S σ
) [m
/s]
20
15
10
0
eff
5
L
Figure 5.25: Effective expansion ratio σeff (a); effective laminar burning veloc-ity SL,eff (b); effective flame speed (SLσ)eff (c).
125
DDT in H2–Air with Transverse Concentration Gradients
The last step of this analysis is the combination of expansion ratio σ and lam-inar burning velocity SL. This is motivated by the 1-D balance of mass across aflame front, given in Eq. (2.27), which yields flame speed SLσ. The parametercan again be treated as an effective property according to Eq. (5.3), plotted inFig. 5.25 (c).
(SLσ)eff =1
H
∫H
0[SL(y) ·σ(y)]dy (5.3)
The following summary contains assumptions inherent to the presented ap-proach:
• The combustion behavior of the entire mixture is taken into account inthe integral approach. Understanding the FA process as a self-enforcinggasdynamic and fluiddynamic feedback cycle justifies this approachsince reaction of the entire flammable mixture is the driver for FA in aclosed channel. Consequently, it must be the overall reaction rate in thechannel that governs the process, in contrast to an exclusive considera-tion of distinct regions within gradient profiles.
• Alteration of burning velocity due to turbulence, shock-flame interac-tions and preconditioning of the mixture by shocks is assumed to con-tribute in a similar manner in homogeneous and gradient mixtures. A re-lation between laminar and turbulent burning velocity as well as temper-ature and pressure dependence is not included. Observations like Kelvin-Helmholtz instability at the lower flame boundary are not taken into ac-count. The concept of comparing RUDpr is highly beneficial here sinceflame propagation modes are similar at RUDpr in different types of mix-tures.
• Macroscopic convective mixing in the flame-induced reactant flow is ne-glected. Thus, the flame is assumed to propagate in the initial, undis-turbed gradient field at any time. Ettner [42] provides a numerical studyon mixing ahead of the flame front for the channel configurations inves-tigated in the present work. He concludes that gas is mainly mixed withinpockets in the wake of obstacles. The difference between maximum andminimum local concentrations remains fairly unaltered. Mixing is notsignificant in BR00 and is more intense in BR30S300 than in BR60S300.
126
5.1 Flame Acceleration
• Unreacted portions of H2 behind the flame front in fuel-rich regions areassumed not to react with excess oxygen from fuel-lean regions. Thisseems reasonable since vertical transport of reactants behind the flamefront can be considered much slower than the flame speed. Especially forfast combustion regimes the time available for mixing is very short. Theconcept therefore inherently portrays the effect of incomplete combus-tion due to concentration gradients.
• As a first conservative approach, mixture is considered inert below thelower flammability limit for upward flame propagation. This could beadapted to observations from Sec. 5.1.1, which suggest a lower flamma-bility limit between the limit for horizontal and downward propagation.The choice of flammability limit does not decisively alter effective prop-erties for rather high average H2 concentrations relevant for the presentwork. In very lean mixtures, this point requires reconsideration.
• Perfect molecular mixing is assumed at any position across the channelheight. Validity of this assumption is difficult to prove. However, goodquantitative agreement between model and experiment as shown sub-sequently supports this assumption.
The relative difference in effective flame speed between homogeneous andinhomogeneous mixtures can be directly compared to measured RUDpr. Thiswill emphasize the quantitative validity of the analytical approach in addi-tion to the correct prediction of flame speed cross-over concentration. Datafrom BR60S300 is chosen for this comparison since flame elongation and thusmacroscopic flame surface area enlargement was found to be negligible (Sec.5.1.1). Two dimensionless parameters, M (Eq. (5.4)) and E (Eq. (5.5)), are de-fined representing results of theoretical model and experiments, respectively.
M =1/(SLσ)eff,grad −1/(SLσ)hom
1/(SLσ)hom(5.4)
E =RUDpr,grad −RUDpr,hom
RUDpr,hom(5.5)
127
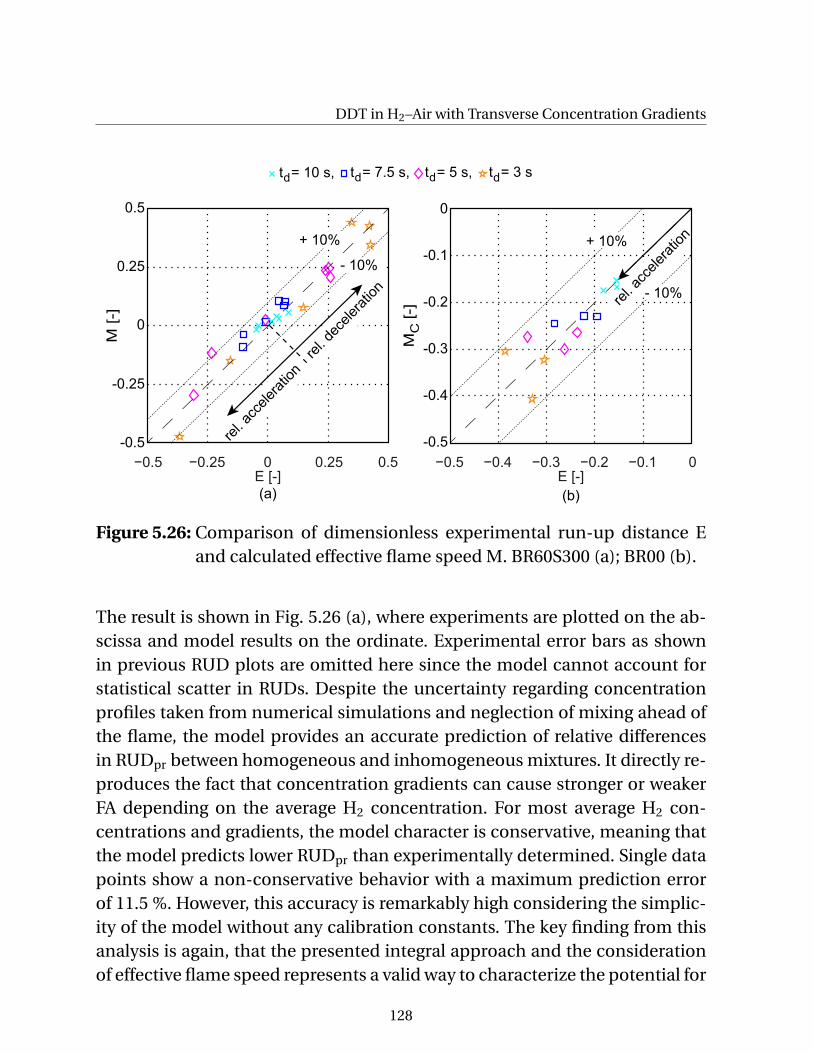
DDT in H2–Air with Transverse Concentration Gradients
−0.5 0.50 −0.5 −0.4 −0.3 −0.2 −0.1 0
(a) (b)
rel. a
ccele
ration
rel. d
ecele
ration
+ 10%
- 10%
rel. a
ccele
ration
E [-] E [-]
+ 10%
- 10%
0.25−0.25
M [-
]
M
[-]
t = 10 s, t = 7.5 s, t = 5 s, t = 3 sd d d d
C
0.5
0
-0.5
0
-0.1
-0.2
-0.3
-0.4
-0.5
-0.25
0.25
Figure 5.26: Comparison of dimensionless experimental run-up distance Eand calculated effective flame speed M. BR60S300 (a); BR00 (b).
The result is shown in Fig. 5.26 (a), where experiments are plotted on the ab-scissa and model results on the ordinate. Experimental error bars as shownin previous RUD plots are omitted here since the model cannot account forstatistical scatter in RUDs. Despite the uncertainty regarding concentrationprofiles taken from numerical simulations and neglection of mixing ahead ofthe flame, the model provides an accurate prediction of relative differencesin RUDpr between homogeneous and inhomogeneous mixtures. It directly re-produces the fact that concentration gradients can cause stronger or weakerFA depending on the average H2 concentration. For most average H2 con-centrations and gradients, the model character is conservative, meaning thatthe model predicts lower RUDpr than experimentally determined. Single datapoints show a non-conservative behavior with a maximum prediction errorof 11.5 %. However, this accuracy is remarkably high considering the simplic-ity of the model without any calibration constants. The key finding from thisanalysis is again, that the presented integral approach and the considerationof effective flame speed represents a valid way to characterize the potential for
128
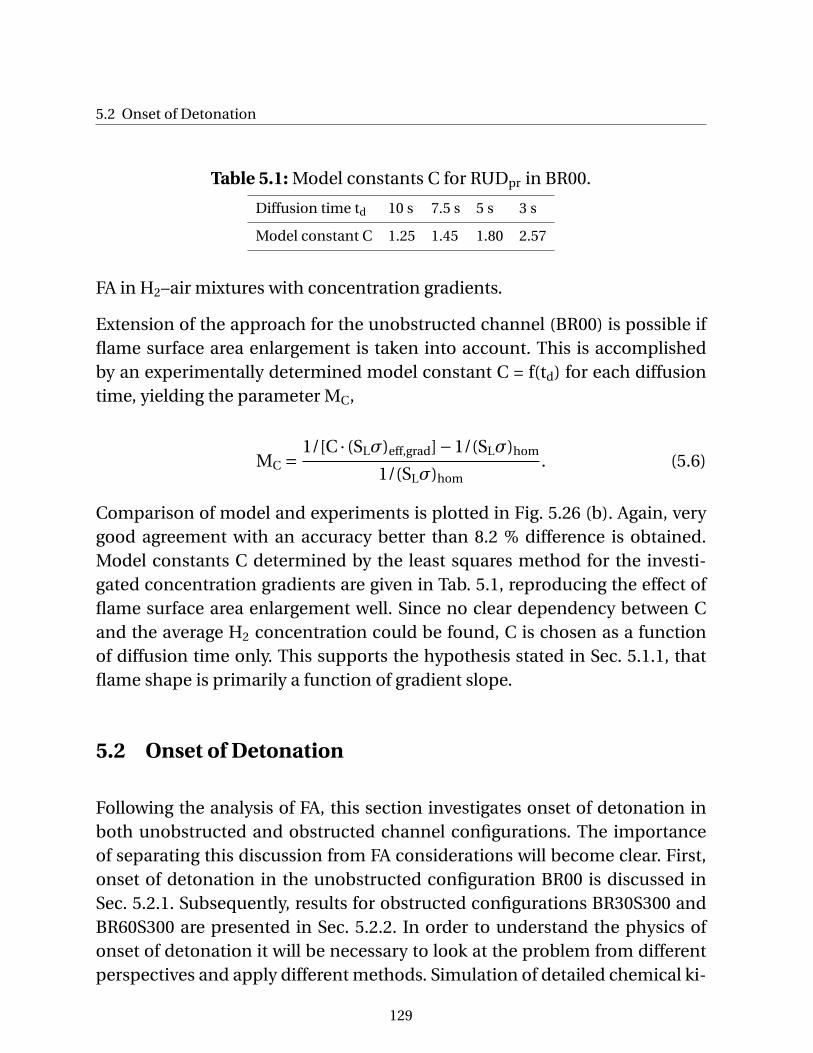
5.2 Onset of Detonation
Table 5.1: Model constants C for RUDpr in BR00.
Diffusion time td 10 s 7.5 s 5 s 3 s
Model constant C 1.25 1.45 1.80 2.57
FA in H2–air mixtures with concentration gradients.
Extension of the approach for the unobstructed channel (BR00) is possible ifflame surface area enlargement is taken into account. This is accomplishedby an experimentally determined model constant C = f(td) for each diffusiontime, yielding the parameter MC,
MC =1/[C · (SLσ)eff,grad]−1/(SLσ)hom
1/(SLσ)hom. (5.6)
Comparison of model and experiments is plotted in Fig. 5.26 (b). Again, verygood agreement with an accuracy better than 8.2 % difference is obtained.Model constants C determined by the least squares method for the investi-gated concentration gradients are given in Tab. 5.1, reproducing the effect offlame surface area enlargement well. Since no clear dependency between Cand the average H2 concentration could be found, C is chosen as a functionof diffusion time only. This supports the hypothesis stated in Sec. 5.1.1, thatflame shape is primarily a function of gradient slope.
5.2 Onset of Detonation
Following the analysis of FA, this section investigates onset of detonation inboth unobstructed and obstructed channel configurations. The importanceof separating this discussion from FA considerations will become clear. First,onset of detonation in the unobstructed configuration BR00 is discussed inSec. 5.2.1. Subsequently, results for obstructed configurations BR30S300 andBR60S300 are presented in Sec. 5.2.2. In order to understand the physics ofonset of detonation it will be necessary to look at the problem from differentperspectives and apply different methods. Simulation of detailed chemical ki-
129
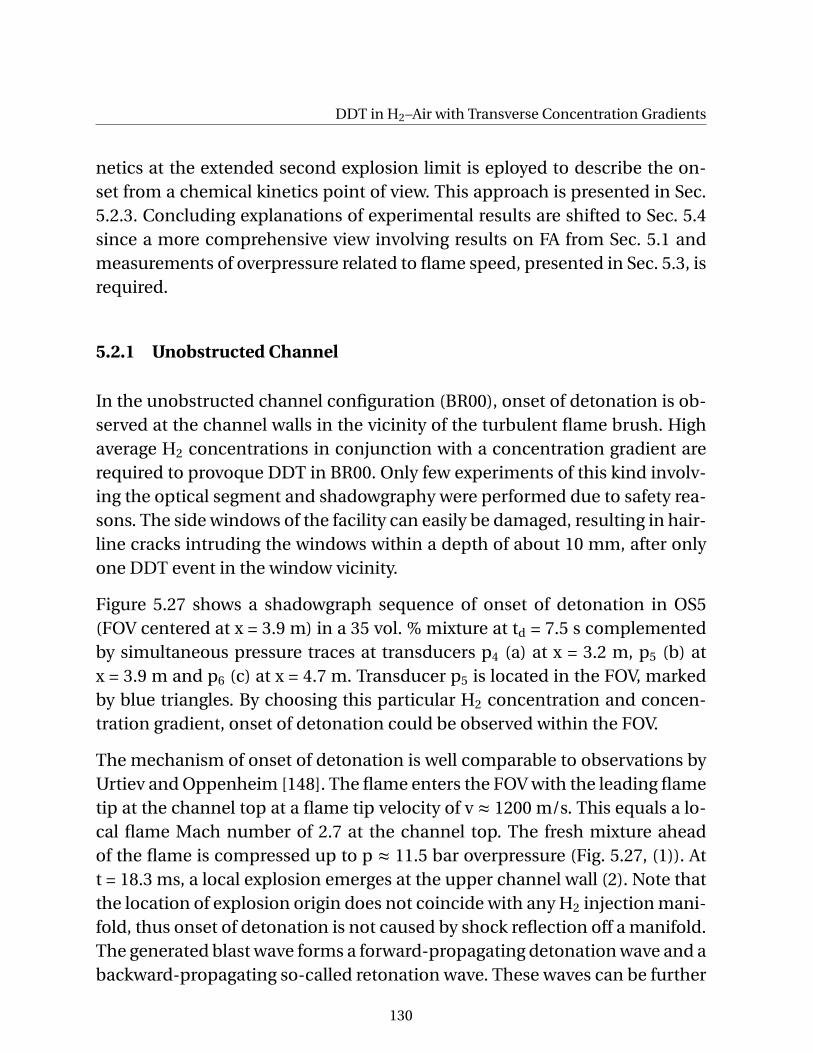
DDT in H2–Air with Transverse Concentration Gradients
netics at the extended second explosion limit is eployed to describe the on-set from a chemical kinetics point of view. This approach is presented in Sec.5.2.3. Concluding explanations of experimental results are shifted to Sec. 5.4since a more comprehensive view involving results on FA from Sec. 5.1 andmeasurements of overpressure related to flame speed, presented in Sec. 5.3, isrequired.
5.2.1 Unobstructed Channel
In the unobstructed channel configuration (BR00), onset of detonation is ob-served at the channel walls in the vicinity of the turbulent flame brush. Highaverage H2 concentrations in conjunction with a concentration gradient arerequired to provoque DDT in BR00. Only few experiments of this kind involv-ing the optical segment and shadowgraphy were performed due to safety rea-sons. The side windows of the facility can easily be damaged, resulting in hair-line cracks intruding the windows within a depth of about 10 mm, after onlyone DDT event in the window vicinity.
Figure 5.27 shows a shadowgraph sequence of onset of detonation in OS5(FOV centered at x = 3.9 m) in a 35 vol. % mixture at td = 7.5 s complementedby simultaneous pressure traces at transducers p4 (a) at x = 3.2 m, p5 (b) atx = 3.9 m and p6 (c) at x = 4.7 m. Transducer p5 is located in the FOV, markedby blue triangles. By choosing this particular H2 concentration and concen-tration gradient, onset of detonation could be observed within the FOV.
The mechanism of onset of detonation is well comparable to observations byUrtiev and Oppenheim [148]. The flame enters the FOV with the leading flametip at the channel top at a flame tip velocity of v ≈ 1200 m/s. This equals a lo-cal flame Mach number of 2.7 at the channel top. The fresh mixture aheadof the flame is compressed up to p ≈ 11.5 bar overpressure (Fig. 5.27, (1)). Att = 18.3 ms, a local explosion emerges at the upper channel wall (2). Note thatthe location of explosion origin does not coincide with any H2 injection mani-fold, thus onset of detonation is not caused by shock reflection off a manifold.The generated blast wave forms a forward-propagating detonation wave and abackward-propagating so-called retonation wave. These waves can be further
130
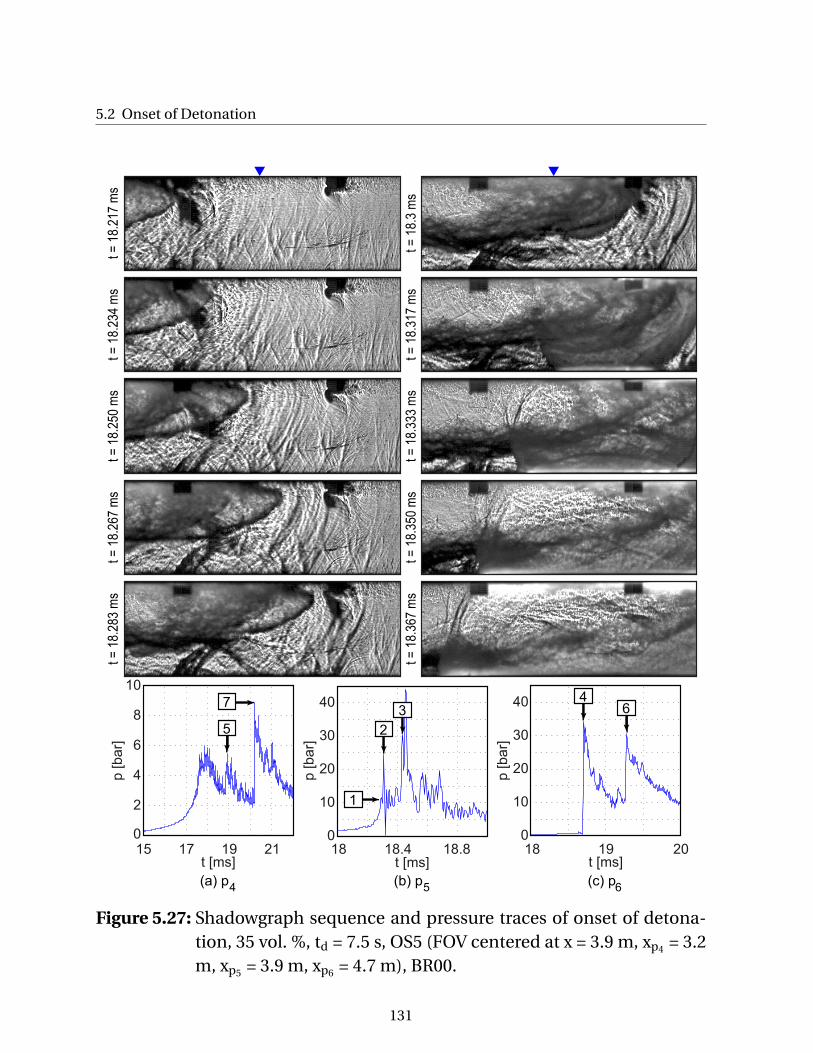
5.2 Onset of Detonation
18 18.4 18.80
10
20
30
40
p [
ba
r]
t [ms]15 17 19 210
2
4
6
8
10
p [
ba
r]
t [ms]18 19 200
10
20
30
40
p [
ba
r]
t [ms]
1
2
37 4
6
5
(a) p (b) p (c) p4 5 6
t = 1
8.21
7 m
st =
18.
234
ms
t = 1
8.25
0 m
st =
18.
267
ms
t = 1
8.28
3 m
s
t = 1
8.3
ms
t = 1
8.31
7 m
st =
18.
333
ms
t = 1
8.35
0 m
st =
18.
367
ms
Figure 5.27: Shadowgraph sequence and pressure traces of onset of detona-tion, 35 vol. %, td = 7.5 s, OS5 (FOV centered at x = 3.9 m, xp4 = 3.2m, xp5 = 3.9 m, xp6 = 4.7 m), BR00.
131
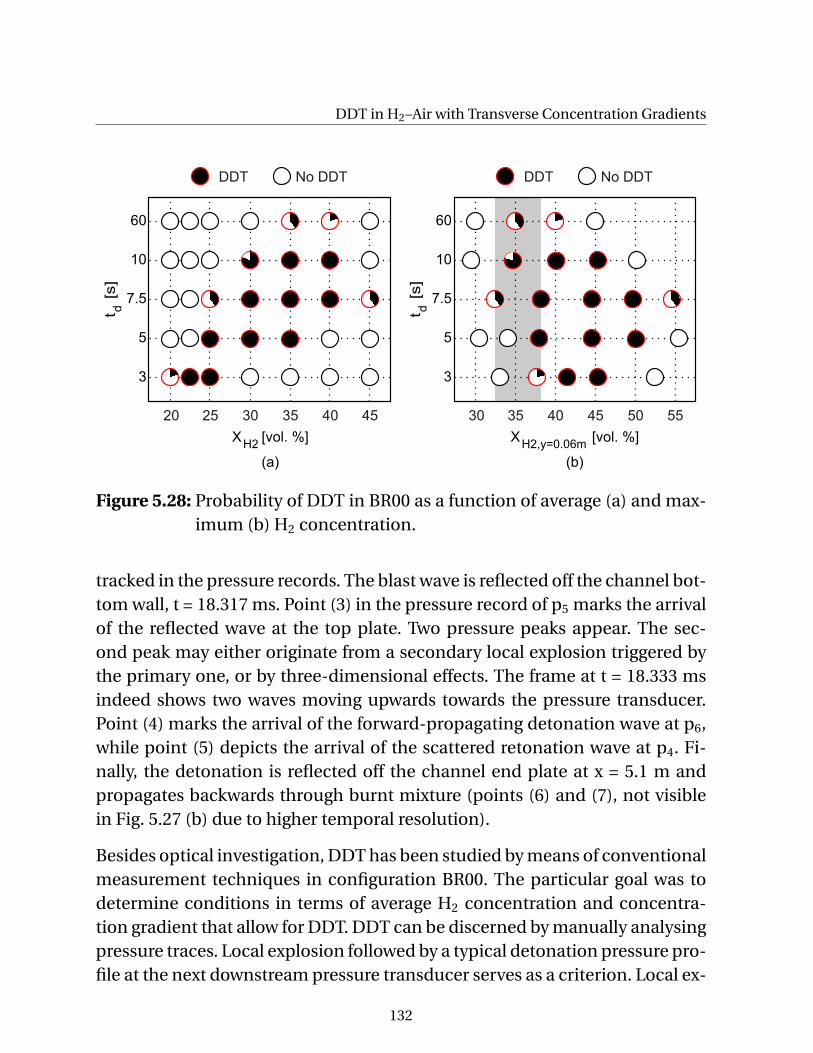
DDT in H2–Air with Transverse Concentration Gradients
t [s
]
5
3
7.5
60
20 25 30 40 4535
10
DDT No DDT
X [vol. %]H2
d
t [s
]
5
3
7.5
60
30 35 40 50 5545
10
DDT No DDT
X [vol. %]H2,y=0.06m
d
(a) (b)
Figure 5.28: Probability of DDT in BR00 as a function of average (a) and max-imum (b) H2 concentration.
tracked in the pressure records. The blast wave is reflected off the channel bot-tom wall, t = 18.317 ms. Point (3) in the pressure record of p5 marks the arrivalof the reflected wave at the top plate. Two pressure peaks appear. The sec-ond peak may either originate from a secondary local explosion triggered bythe primary one, or by three-dimensional effects. The frame at t = 18.333 msindeed shows two waves moving upwards towards the pressure transducer.Point (4) marks the arrival of the forward-propagating detonation wave at p6,while point (5) depicts the arrival of the scattered retonation wave at p4. Fi-nally, the detonation is reflected off the channel end plate at x = 5.1 m andpropagates backwards through burnt mixture (points (6) and (7), not visiblein Fig. 5.27 (b) due to higher temporal resolution).
Besides optical investigation, DDT has been studied by means of conventionalmeasurement techniques in configuration BR00. The particular goal was todetermine conditions in terms of average H2 concentration and concentra-tion gradient that allow for DDT. DDT can be discerned by manually analysingpressure traces. Local explosion followed by a typical detonation pressure pro-file at the next downstream pressure transducer serves as a criterion. Local ex-
132
5.2 Onset of Detonation
plosion at the channel end plate was not considered a relevant DDT event. Theresult is shown in Fig. 5.28 (a). Each pair of average H2 concentration and dif-fusion time td was repeated five times. Shares of experiments with DDT are de-picted as pie charts. DDT in homogeneous mixtures only occurs infrequentlyat 35–40 vol. % H2. The channel length is insufficient to allow for DDT in leanerhomogeneous mixtures. As shown in Sec. 5.1.2, FA is most pronounced in ho-mogeneous mixtures around 35–40 vol. % which consistently leads to DDT inthis concentration range. Gradients lead to earlier DDT in terms of averageH2 concentration compared to homogeneous mixtures. This is in accordancewith the trend in FA, which is enforced by gradients through flame elonga-tion and additionally supported by increased effective flame speed (SLσ)eff inmixtures below 24 vol. % H2. Mixtures at td = 3 s allow for DDT already in a20 vol. % mixture, which is remarkable keeping in mind that the channel isunobstructed. However, the results also show that an effect counteracting theFA enforcement by gradients must exist, since DDT is evidently suppressed inmixtures with steep gradients (td = 3 and 5 s) at high H2 concentrations. Thisposes an upper DDT limit for gradient mixtures in the channel investigatedhere. The effect can be seen most clearly at td = 3 s where no DDT occurs ataverage H2 concentrations of 30 vol. % and higher. The reason for the devia-tion between DDT trends and FA behavior will be given in Sec. 5.4 since fur-ther considerations presented in the following sections are required to give aconcluding explanation. At td = 7.5 s, the range of H2 concentrations with DDTis remarkably wide. The observed effect that suppresses DDT in rich mixtureswith steeper gradients can apparently be overcome by strong FA here.
From a practical perspective, the lower DDT limit is more relevant than the up-per limit if, like in nuclear reactor accident scenarios, low H2 concentrationsprevail. Lower DDT limits in homogeneous and inhomogeneous mixtures canbe approximated by using the maximum local H2 concentration at the chan-nel top, cp. Fig. 5.28 (b), as suggested by Kuznetsov et al. [85] and Grune etal. [56]. Results for different gradients coincide within a band of maximumH2 concentration at the channel top (grey band in Fig. 5.28 (b)). However, thepresent work shows that such an approach does not reflect the physics of DDTin mixtures with transverse concentration gradients and thus represents anempirical criterion only.
133
DDT in H2–Air with Transverse Concentration Gradients
5.2.2 Obstructed Channel Configurations
Figure 5.29 shows onset of detonation in BR30S300L, OS5 (FOV centered atx = 3.9 m), in a homogeneous 16.5 vol % mixture. A shock at a velocity of 1000m/s propagates towards the BR30 obstacle, already causing auto-ignition inthe wall boundary layers. This is a first indication for conditions very closeto possible onset of detonation. The shock is reflected off the obstacle att = 61.438 ms. Primary local explosions can be observed both at the upperand lower obstacle upstream surfaces, t = 61.450 ms. The image at t = 61.463ms shows collision of the explosion fronts at the channel center line. Sub-sequent images do not allow for clear tracking of the fronts during diffrac-tion around the obstacle. Eventually, the detonation front emerges clearly att = 61.525 ms at the channel bottom. Detonation is thus initiated by the forma-tion of a secondary hot spot at the lower channel wall. Asymmetry (initiationonly at the bottom wall) may be supported by the high sensitivity of chemicalreaction rates on temperature in the relevant high temperature and pressurerange. This observed mechanism stands in contrast to recent results by Kel-lenberger and Ciccarelli [74] who observed detonation initiation by center linecollision of the diffracting primary explosion fronts in the obstacle opening. Inthat case, the leading point of the detonation front downstream of the obstacleis located at the channel center line. Presumably, the location of final detona-tion initiation depends on the obstacle spacing and size. If a stronger shockthan observed in the present work incides on the obstacle, detonation maybe initiated at a secondary hot spot at the center line. This suggests that themechanism of onset of detonation with secondary hot spots at the walls canoccur already at lower incident shock Mach number compared to the mech-anism involving center line secondary hot spot explosion. At an even higherincident shock Mach number, the primary hot spot may already be sufficientto initiate a detonation that can successfully diffract around the obstacle. Dif-ferent geometries are also discussed by Gamemzo et al. [51]. Variation of ge-ometry is however not topic of the present work.
Pressure traces of p4, p5 (blue triangle in the FOV) and p6 suggest that theshock-flame complex arrives at the obstacle in the FOV at a Mach numberthat may be already beyond the necessary Mach number to cause onset of
134
5.2 Onset of Detonation
61 62 630
10
20
40
p [
ba
r]
t [ms]60 61 62 630
4
8
12
16
p [
ba
r]
t [ms]62 63
0
5
10
15
20
p [
ba
r]
t [ms]64
25
(a) p (b) p (c) p4 5 6
t = 6
1.41
3 m
st =
61.
425
ms
t = 6
1.43
8 m
st =
61.
450
ms
t = 6
1.46
3 m
s
t = 6
1.47
5 m
st =
61.
488
ms
t = 6
1.5
ms
t = 6
1.51
3 m
st =
61.
525
ms
Figure 5.29: Shadowgraph sequence and pressure traces of onset of detona-tion, 16.5 vol. %, td = 60 s, OS5 (FOV centered at x = 3.9 m, xp4 = 3.2m, xp5 = 3.9 m, xp6 = 4.7 m), BR30S300L.
135
DDT in H2–Air with Transverse Concentration Gradients
detonation by shock reflection. Already at p4, a high pressure level of about 10bar and three distinct pressure spikes can be observed. This suggests that localexplosions already occur at this position, but do not successfully lead to onsetof detonation. High peak pressure at p5 corresponds to the location of onset ofdetonation, while the typical detonation pressure profile with a sharp rise inpressure and subsequent expansion is recorded at p6. Peak pressure exceedsCJ pressure here, which may be due to three-dimensional effects or due to anoverdriven state at the pressure transducer location.
Summarizing the observations, the onset process begins with strong ignitionin post-reflected-shock mixture at the upstream obstacle surfaces. The explo-sion fronts diffract around the obstacle and eventually transform into a deto-nation after secondary hot spot generation at the channel walls. This processreflects well the sequence of events during onset of detonation as discussedin Sec. 2.6. Local explosions represent the first step and thus the first crucialrequirement for this process. Secondary hot spots generated by reflection atchannel walls, finally forming the detonation, may be seen as a consequenceof the primary local explosions. The H2 concentration of 16.5 vol. % is closeto the lower detonability limit in a homogeneous mixture at initial ambientconditions in the experimental setup, since the detonation cell width quicklyexceeds the channel dimensions at lower concentrations, cp. Fig. 2.27.
As will be shown subsequently, transverse concentration gradients did notlead to systematically earlier DDT in terms of average H2 concentration in ob-structed configurations, which stands in evident contrast to the findings forBR00. A diffusion time of td = 3 s will be compared to homogeneous mixtures.
In gradient mixtures, the onset mechanism is similar to the mechanism in ho-mogeneous mixtures. It begins with strong ignition in post-reflected-shockmixture and proceeds through diffraction of emerging blast waves aroundthe obstacle. Detonation initiation finally occurs at a channel wall. Mix-ture inhomogeneity influences the preferred location of primary local explo-sions. To capture onset of detonation in the largest range of H2 concentrationpossible—17–35 vol. %—obstacle configurations and the position of the op-tical segment were varied. Onset events will be discussed beginning with lowaverage H2 concentrations.
136
5.2 Onset of Detonation
Figure 5.30 shows onset of detonation in a 17 vol. % mixture at td = 3 s inBR30S300L, OS5. Note that the average H2 concentration is very close to thecorresponding homogeneous mixture experiment, Fig. 5.29. Precursor shockspeed is 1100 m/s upstream of the obstacle. After precursor shock reflection,local luminescence marks a local explosion at the upper obstacle at t = 27.738ms. No explosion occurs at the lower obstacle. Final detonation initiation maybe caused by merging of two shocks in this experiment, which can be seen inthe last three images of this sequence. The last frame shows the forward prop-agating detonation front. The pressure trace of p5 (blue triangle in the FOV)shows the sharp pressure peak typical for the location of onset of detonation.P4 by contrast still shows the typical fast flame profile. The detonation mightfail inbetween p5 and p6 since p6 shows a double peak pressure trace, suggest-ing a very unstable or currently failing detonation.
For discussion of higher H2 concentrations, selected images from shadow-graph sequences will be used. Images are selected to show the nature of localexplosions and the final formation of detonation. Note that the images are notequidistant in time.
In BR30S300, OS3, onset of detonation can be first observed at 22.5 vol. % bothin homogeneous and gradient mixtures. Figure 5.31 comprises four images ofthe process in the td = 3 s mixture. A strong local explosion, causing clearlyvisible luminescence, can be discerned at the upper obstacle at t = 50 µs. Re-flected shock velocity at the lower obstacle remains low. Thus, no local explo-sion takes place at this position. This is similar to the experiment at 17 vol. %,Fig. 5.30.
To obtain onset of detonation in richer mixtures at the next possible opticalsegment position OS2, configuration BR60S300 needs to be employed sinceBR30S300 allows for onset only further downstream due to weaker FA, cp. Sec.5.1.2. To demonstrate the similarity between BR30S300 and BR60S300, an on-set process in BR60S300, OS3, is shown in Fig. 5.32. Average H2 concentrationis equal to the BR30S300 case. The driving local explosion again occurs at theupper obstacle and final detonation initiation is observed at the channel topwall downstream of the obstacle.
137
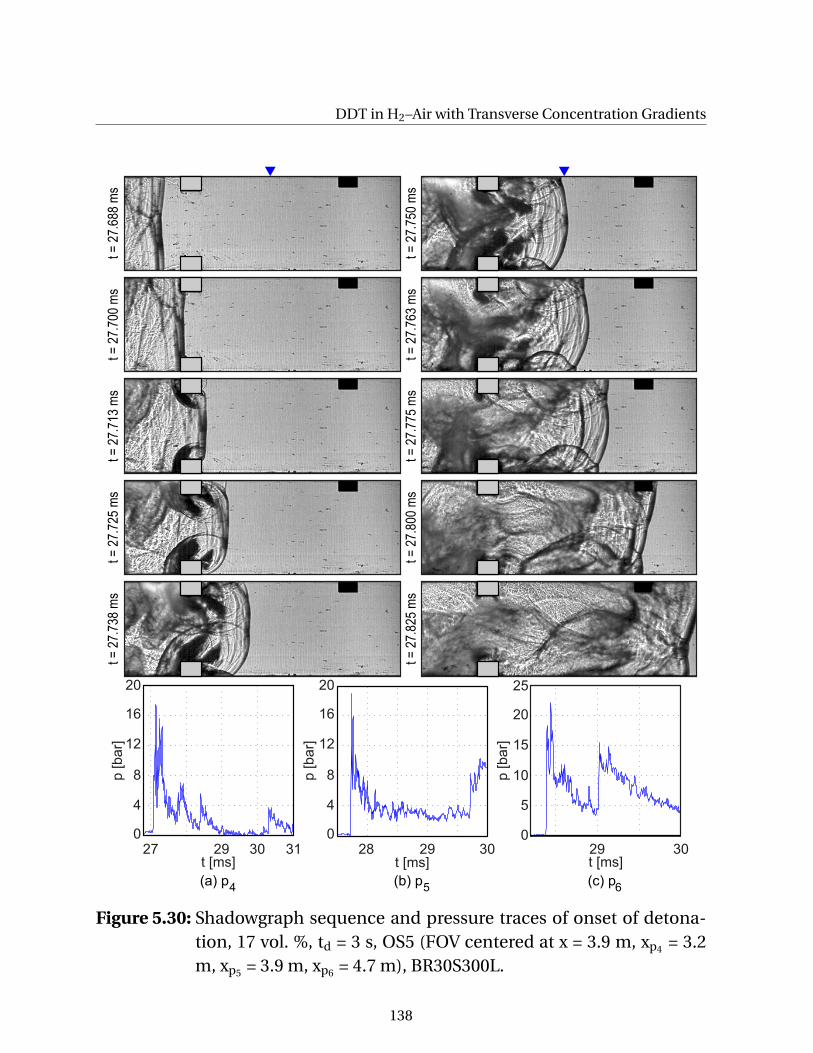
DDT in H2–Air with Transverse Concentration Gradients
28 29 30
p [
ba
r]
t [ms]27 29 30
0
4
8
12
16
p [
ba
r]
t [ms]30
0
5
10
15
20
p [
ba
r]
t [ms]31
25
29
20
0
4
8
12
16
20
(a) p (b) p (c) p4 5 6
t = 2
7.68
8 m
st =
27.
700
ms
t = 2
7.71
3 m
st =
27.
725
ms
t = 2
7.73
8 m
s
t = 2
7.75
0 m
st =
27.
763
ms
t = 2
7.77
5 m
st =
27.
800
ms
t = 2
7.82
5 m
s
Figure 5.30: Shadowgraph sequence and pressure traces of onset of detona-tion, 17 vol. %, td = 3 s, OS5 (FOV centered at x = 3.9 m, xp4 = 3.2m, xp5 = 3.9 m, xp6 = 4.7 m), BR30S300L.
138
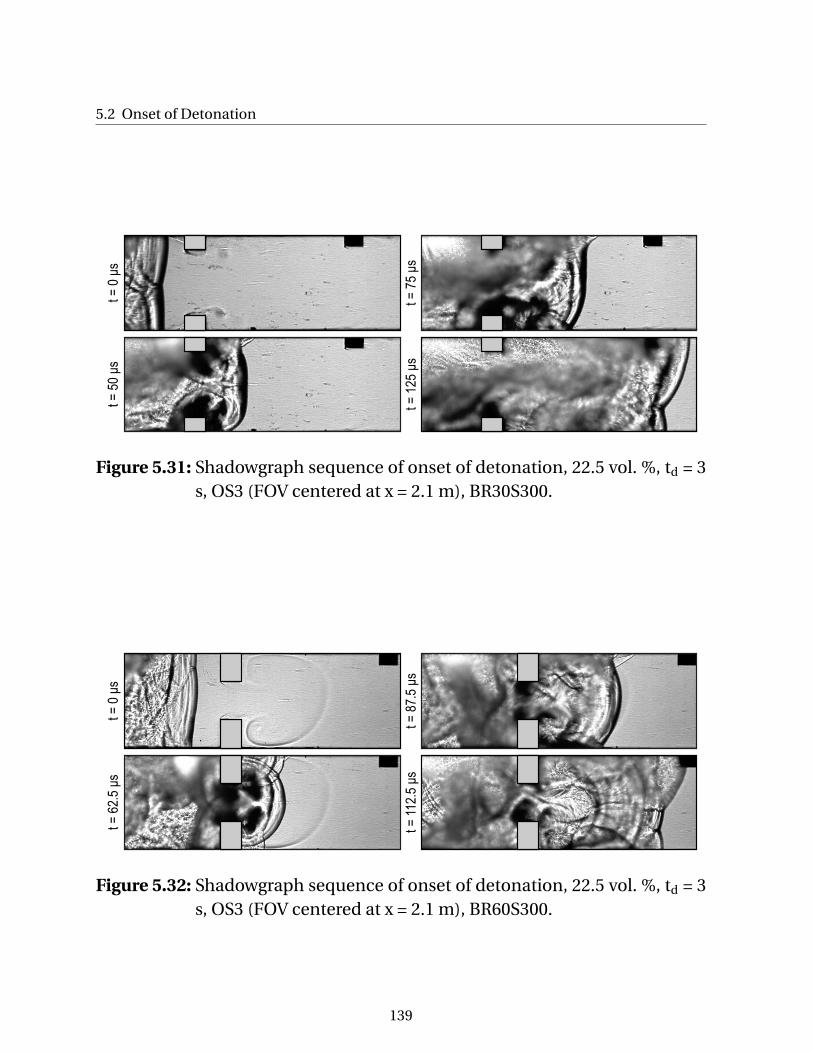
5.2 Onset of Detonationt =
0 μ
st =
50 μ
s
t =
75 μ
st =
125 μ
s
Figure 5.31: Shadowgraph sequence of onset of detonation, 22.5 vol. %, td = 3s, OS3 (FOV centered at x = 2.1 m), BR30S300.
t =
0 μ
st =
62.5
μs
t =
87.5
μs
t =
112.5
μs
Figure 5.32: Shadowgraph sequence of onset of detonation, 22.5 vol. %, td = 3s, OS3 (FOV centered at x = 2.1 m), BR60S300.
139
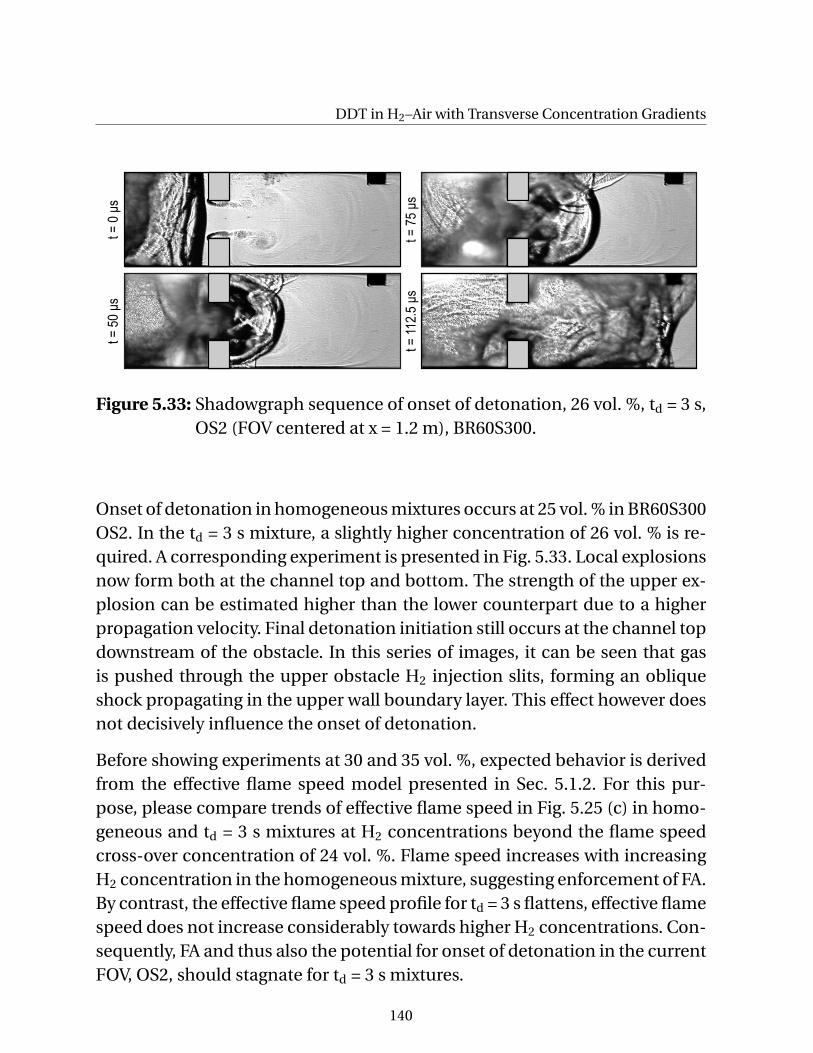
DDT in H2–Air with Transverse Concentration Gradientst =
0 μ
st =
50 μ
s
t =
75 μ
st =
112.5
μs
Figure 5.33: Shadowgraph sequence of onset of detonation, 26 vol. %, td = 3 s,OS2 (FOV centered at x = 1.2 m), BR60S300.
Onset of detonation in homogeneous mixtures occurs at 25 vol. % in BR60S300OS2. In the td = 3 s mixture, a slightly higher concentration of 26 vol. % is re-quired. A corresponding experiment is presented in Fig. 5.33. Local explosionsnow form both at the channel top and bottom. The strength of the upper ex-plosion can be estimated higher than the lower counterpart due to a higherpropagation velocity. Final detonation initiation still occurs at the channel topdownstream of the obstacle. In this series of images, it can be seen that gasis pushed through the upper obstacle H2 injection slits, forming an obliqueshock propagating in the upper wall boundary layer. This effect however doesnot decisively influence the onset of detonation.
Before showing experiments at 30 and 35 vol. %, expected behavior is derivedfrom the effective flame speed model presented in Sec. 5.1.2. For this pur-pose, please compare trends of effective flame speed in Fig. 5.25 (c) in homo-geneous and td = 3 s mixtures at H2 concentrations beyond the flame speedcross-over concentration of 24 vol. %. Flame speed increases with increasingH2 concentration in the homogeneous mixture, suggesting enforcement of FA.By contrast, the effective flame speed profile for td = 3 s flattens, effective flamespeed does not increase considerably towards higher H2 concentrations. Con-sequently, FA and thus also the potential for onset of detonation in the currentFOV, OS2, should stagnate for td = 3 s mixtures.
140
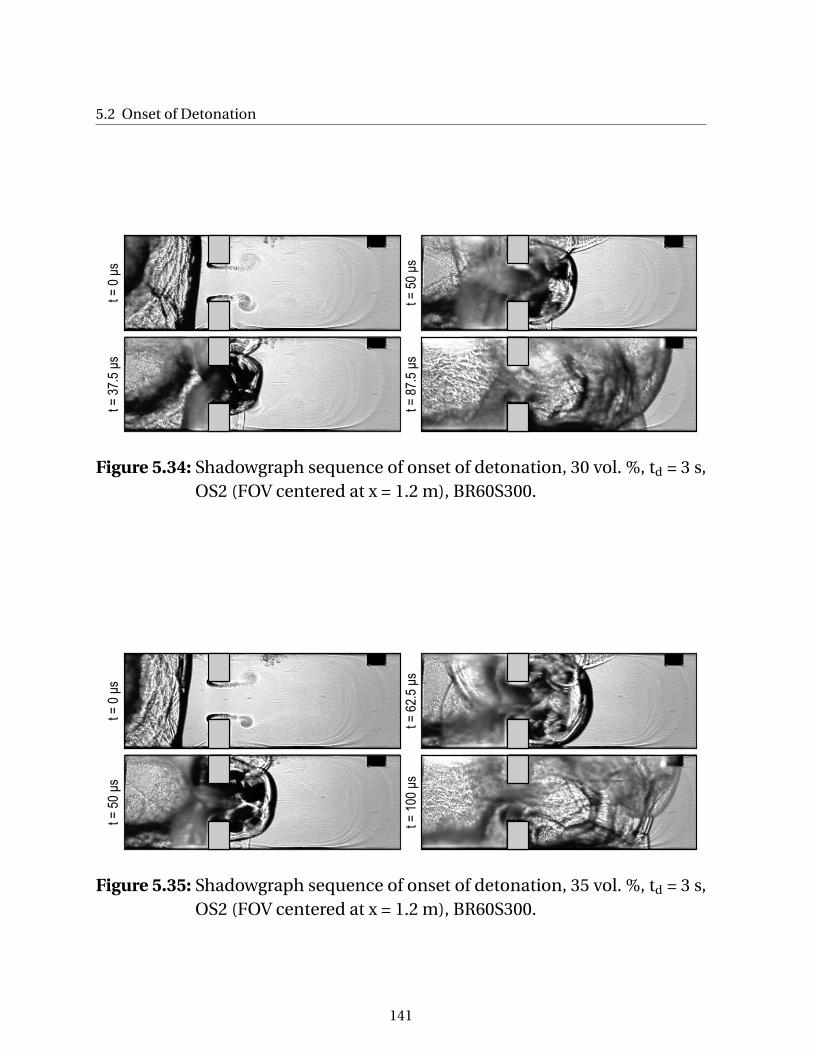
5.2 Onset of Detonationt =
0 μ
st =
37.5
μs
t =
50 μ
st =
87.5
μs
Figure 5.34: Shadowgraph sequence of onset of detonation, 30 vol. %, td = 3 s,OS2 (FOV centered at x = 1.2 m), BR60S300.
t =
0 μ
st =
50 μ
s
t =
62.5
μs
t =
100 μ
s
Figure 5.35: Shadowgraph sequence of onset of detonation, 35 vol. %, td = 3 s,OS2 (FOV centered at x = 1.2 m), BR60S300.
141
DDT in H2–Air with Transverse Concentration Gradients
Figures 5.34 and 5.35 comprise experiments at 30 and 35 vol. %, td = 3 s, re-spectively. Evidently, the state of FA upstream of the obstacle is similar to the26 vol. % experiment, Fig. 5.33. The best indicator is the similar separation dis-tance between precursor shock and flame. This observation again clearly un-derscores the validity of the integral approach for FA utilizing effective flamespeed to characterize FA. In homogeneous mixtures, only detonations are ob-served in OS2 at H2 concentrations beyond 25 vol. %, which is consistent tothe prediction based on effective flame speed. Regarding local explosions,strong ignition at the lower obstacle becomes increasingly important in gra-dient mixtures at such high average H2 concentrations. At 30 vol. %, Fig. 5.34,the frame at t = 50 µs suggests similar strength of upper and lower local explo-sions. At 35 vol. %, Fig. 5.35, the lower local explosion exceeds the upper onein strength, discernible at t = 62.5 µs where the lower front has already reachedthe upper channel wall upstream of the obstacle, while the upper front is cur-rently interacting with the top surface of the lower obstacle.
Experimental observations of onset of detonation in obstructed configura-
tions are summarized as follows:
• Onset of detonation is initiated by local explosions (strong ignition, cp.Sec. 2.4) in post-reflected-shock mixture at upstream obstacle surfaces.
• Diffraction of blast waves emerging from local explosions around the ob-stacle and subsequent reflection of the diffracted waves at the channelwalls finally initiates detonation.
• In gradient mixtures, local explosions preferentially occur at the upperobstacle, thus in the most fuel-rich region, which is consistent with thelocal explosion location in BR00 in gradient mixtures.
• At average H2 concentrations of 22.5 vol. % and below, no local explo-sions are observed at the lower obstacle. At 26 vol. % and beyond, wherethe local H2 concentration at the lower obstacle exceeds about 10 vol. %,local explosions occur both at upper and lower obstacle. An average H2
concentration of 30 vol. % shows similar explosion strengths at both loca-tions. At 35 vol. % the lower explosion exceeds the upper one in strength.
142
5.2 Onset of Detonation
No case has been observed within the investigated range of H2 concen-trations, where local explosion only occurs at the lower obstacle.
• Beyond the flame speed cross-over concentration of 24 vol. %, calculatedeffective flame speed predicts DDT propensity well. On the lean side ofcross-over, promotion of DDT by concentration gradients would be ex-pected. This has, however, not been observed. Homogeneous and gradi-ent mixtures at average H2 concentrations between 17 and 25 vol. % showa similar potential for DDT.
The unexpected DDT behavior below the flame speed cross-over concentra-tion requires further investigation. An understanding of the relation betweendetonation initiation and parameters such as flame speed and local overpres-sure generated by FA needs to be established, which will also help to explainDDT trends observed in BR00, Sec. 5.2.1. This motivates the theoretical ap-proach subsequently presented in Sec. 5.2.3, exploring detailed chemical ki-netics of shock-induced strong ignition in the vicinity of the extended secondexplosion limit.
5.2.3 Chemical Kinetics of Shock-Induced Strong Ignition
Onset of detonation by shock reflection off a flat obstacle surface portraysan attractive case to be analyzed by means of post-reflected-shock detailedchemical kinetics simulations. In comparison, onset in an unobstructed chan-nel depends crucially on small-scale phenomena such as interaction of shocksand wall boundary layer and is therefore difficult to describe analytically. De-pending on blockage ratio and spacing, shock focusing and reflection of Machstems may occur in obstructed channels. Due to the large spacing of 0.3 min configurations discussed in the present work, these effects are not of im-portance. Nearly normal shocks interact with obstacles here. Thus, reflectionof a normal shock off a solid wall is considered in one dimension. Melguizo-Gavilanes and Bauwens [104] have shown that strong ignition behind a re-flected shock can be modeled by a constant volume explosion in a homoge-neous reactor at a high accuracy, compared to spatially resolved modeling.
143
DDT in H2–Air with Transverse Concentration Gradients
This is in good accordance with the similarity between ZND and constant vol-ume explosion modeling of detonations outlined by Shepherd [131].
In experiments in the present work, but also in the work of other authors[74, 111, 142, 156], strong ignition behind a reflected shock can be identifiedas the typical first step of onset of detonation in obstructed channels. Analyz-ing this first step delivers a necessary, but not entirely sufficient criterion foronset, cp. Sec. 2.6. Propagation of a detonation emerging from a local shock-induced explosion into the confining geometry, which then needs to allow forself-sustained detonation propagation, cp. Sec. 2.7, is the subsequent neces-sary step for successful onset of detonation. Since the present work focuses onmixture properties in contrast to the influence of geometrical characteristics,analysis of the initial local explosion is meaningful here. This yields a conser-vative boundary for onset of detonation by shock reflection since the initialand thus crucial step is considered. Geometrical criteria like the well-knownempirical 7λ criterion by Dorofeev et al. [31] cover geometrical influencesonly, but do not consider the actual first requirement in the chain of necessarycriteria for onset. Also the criterion expressed in Eq. (2.39) by Thomas [142] isbased on geometrical considerations and does not answer the question whatthe requirement for the initial necessary local explosion is.
The extended second explosion limit can be interpreted as a boundary be-tween mild and strong ignition as shown by Lee and Hochgreb [92], cp. Secs.2.3 and 2.4. In the following analysis, the limit is determined through detailedchemical kinetics simulations. Discussion is first confined to homogeneousmixtures and eventually transfers insights to mixtures with transverse con-centration gradients. The major goal is the deduction of a criterion for criticalconditions of a fast deflagration precursor shock, that will cause strong igni-tion after reflection at a solid wall such as an upstream obstacle surface.
As shown by Shepherd [132], an approach to determine the location of theextended second explosion limit in terms of temperature and pressure is tocompute the reduced effective activation energy
144
5.2 Onset of Detonation
θ =Ea
RT(5.7)
with T being the initial mixture temperature, by numerical differentiation:
θ =1
T
ln(τind,+)− ln(τind,−)
(1/T+)− (1/T−). (5.8)
τind,+ and τind,− are induction times computed for temperatures T+ and T−,respectively. Temperatures T+ and T− are gained by varying T by a factor of1±0.01. The T–p plane for θ is depicted in color in Fig. 5.36 for a 30 vol. %mixture. Absolute pressure is used here to be consistent with literature on ex-plosion limits and the classical explosion limits diagram, Fig. 2.3, which coverslower T and p compared to Fig. 5.36 as explained in Sec. 2.4. Note that the axisof ordinates is linear in Fig. 5.36 as opposed to the logarithmic scale in Fig.2.3. The region of maximum θ corresponds to the extended second explosionlimit region [132] (dotted black line marks the line of maximum θ). Inductiontime is particularly sensitive to variations in temperature around the extendedsecond explosion limit, cp. Eq. (5.8). Note that the location of the extendedsecond explosion limit is almost independent of H2 concentration as will beshown subsequently in Fig. 5.37.
So far, only a general T-p-plane for θ has been determined. However, in thecontext of shock-induced auto-ignition, only specific T and p can be caused byan incident shock or a reflected shock. Possible post-shock (state 1) and post-reflected-shock states (state 1r) are described by the shock equations, Sec. 2.2.They are depicted in Fig. 5.36 for the 30 % vol. mixture as dashed black (inci-dent shock) and dashed red (reflected shock) lines. These lines are obtainedby variation of shock Mach number. Similar to the location of the extendedsecond explosion limit, these lines are almost independent of H2 concentra-tion since H2 as a diatomic gas has a specific heat capacity ratio γH2 = 1.41,being very close to γAir = 1.40 of air17.
17Heat capacity ratio values at standard conditions.
145
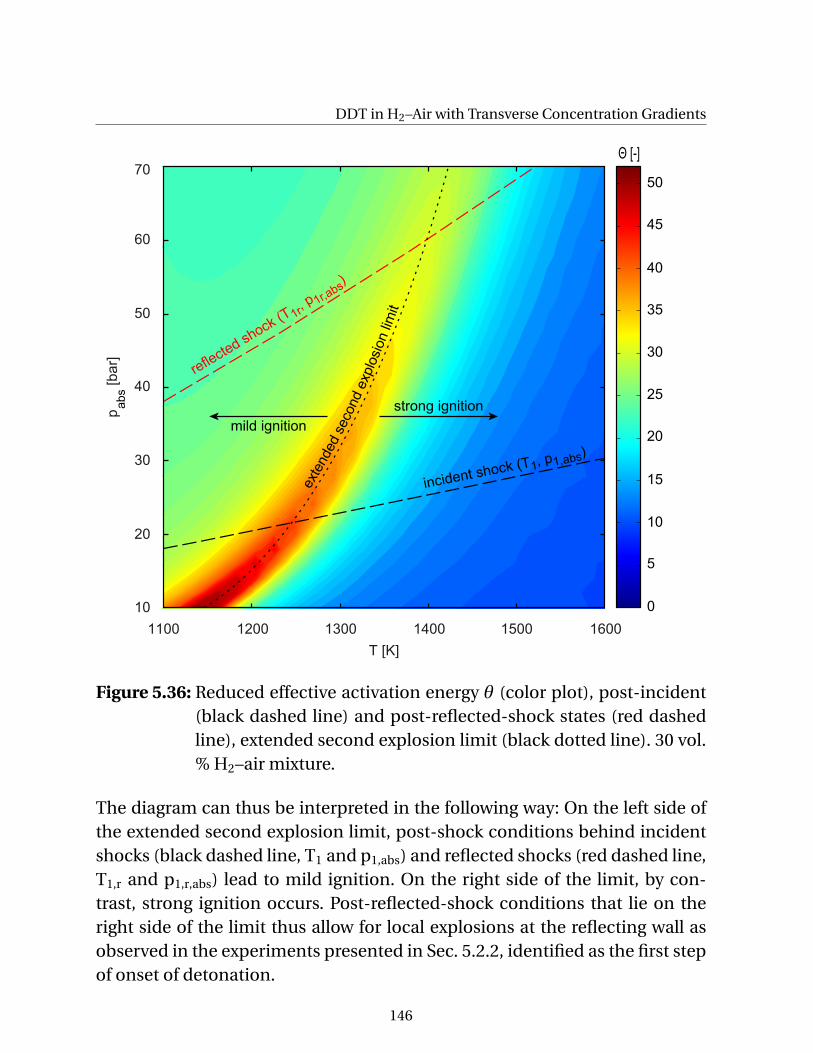
DDT in H2–Air with Transverse Concentration Gradients
Θ [-]
45
20
10
15
35
40
25
30
50
0
5
T [K]
p
[ba
r]
1100 1200 1300 1400 1500 1600
10
20
30
40
50
60
70
abs
incident shock (T1, p1,abs)
reflected shock (T 1r, p 1r,abs)
exte
nded s
eco
nd e
xplo
sion lim
itstrong ignition
mild ignition
Figure 5.36: Reduced effective activation energy θ (color plot), post-incident(black dashed line) and post-reflected-shock states (red dashedline), extended second explosion limit (black dotted line). 30 vol.% H2–air mixture.
The diagram can thus be interpreted in the following way: On the left side ofthe extended second explosion limit, post-shock conditions behind incidentshocks (black dashed line, T1 and p1,abs) and reflected shocks (red dashed line,T1,r and p1,r,abs) lead to mild ignition. On the right side of the limit, by con-trast, strong ignition occurs. Post-reflected-shock conditions that lie on theright side of the limit thus allow for local explosions at the reflecting wall asobserved in the experiments presented in Sec. 5.2.2, identified as the first stepof onset of detonation.
146
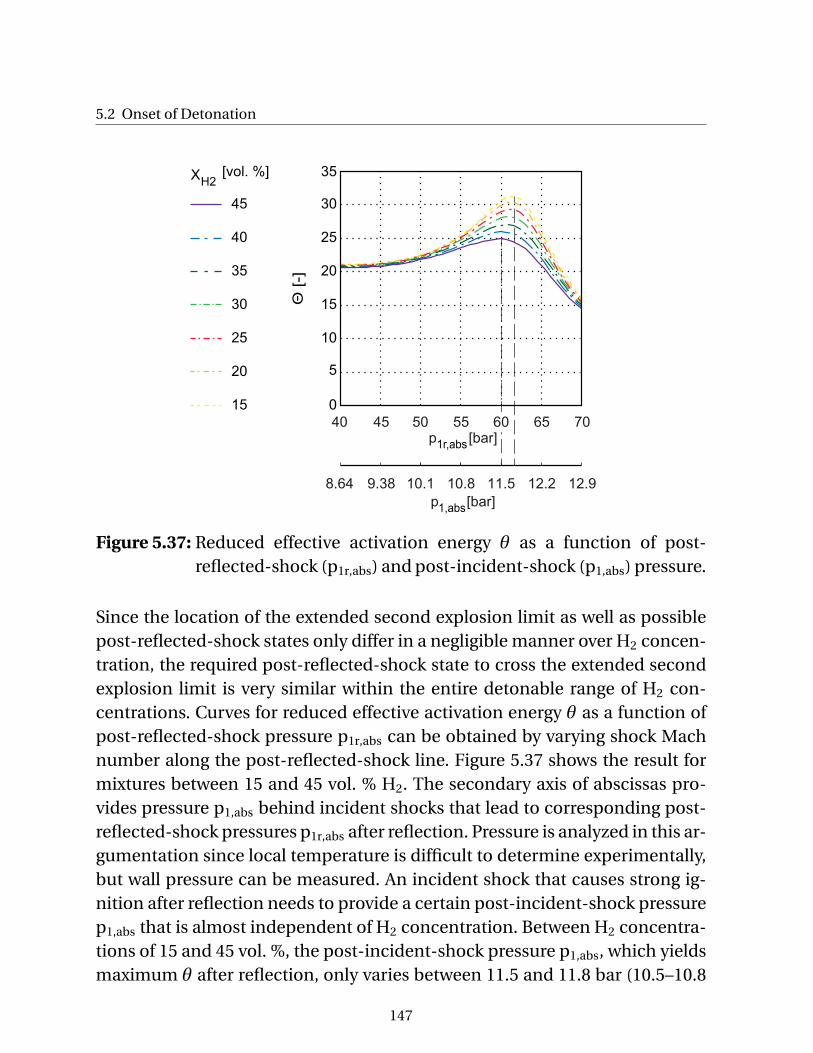
5.2 Onset of Detonation
40 45 50 55 60p [bar]
65 70
1r,abs
Θ [-
]
35
25
15
5
20
0
8.64 9.38 10.1 10.8 11.5 12.2 12.9
p [bar]1,abs
10
30
X H2
45
40
35
30
25
[vol. %]
20
15
Figure 5.37: Reduced effective activation energy θ as a function of post-reflected-shock (p1r,abs) and post-incident-shock (p1,abs) pressure.
Since the location of the extended second explosion limit as well as possiblepost-reflected-shock states only differ in a negligible manner over H2 concen-tration, the required post-reflected-shock state to cross the extended secondexplosion limit is very similar within the entire detonable range of H2 con-centrations. Curves for reduced effective activation energy θ as a function ofpost-reflected-shock pressure p1r,abs can be obtained by varying shock Machnumber along the post-reflected-shock line. Figure 5.37 shows the result formixtures between 15 and 45 vol. % H2. The secondary axis of abscissas pro-vides pressure p1,abs behind incident shocks that lead to corresponding post-reflected-shock pressures p1r,abs after reflection. Pressure is analyzed in this ar-gumentation since local temperature is difficult to determine experimentally,but wall pressure can be measured. An incident shock that causes strong ig-nition after reflection needs to provide a certain post-incident-shock pressurep1,abs that is almost independent of H2 concentration. Between H2 concentra-tions of 15 and 45 vol. %, the post-incident-shock pressure p1,abs, which yieldsmaximum θ after reflection, only varies between 11.5 and 11.8 bar (10.5–10.8
147
DDT in H2–Air with Transverse Concentration Gradients
bar overpressure). Even if the extended second explosion limit is interpretedas a band rather than a sharp boundary, critical post-incident-shock pressurelies in a narrow range of 10–11 bar overpressure.
Due to the minor influence of H2 concentration on gasdynamic relations andchemical kinetics of strong ignition, conclusions can be directly transferred tomixtures with concentration gradients Also here, post-reflected-shock pres-sure and temperature need to exceed the extended second explosion limit tocause local explosions that can lead to onset of detonation.
In conclusion, the presented analysis of strong post-reflected-shock igni-
tion using detailed chemical kinetics simulations shows that:
• The pressure ratio (or Mach number) of the precursor shock of a fast de-flagration needs to exceed a critical value to allow for strong ignition aftershock reflection. Post-incident-shock overpressure will be used as a cri-terion since it is well measurable in experiments and at the same time thecrucial parameter from a safety point of view.
• Critical overpressure values are nearly independent of H2 concentration.
• Critical post-incident-shock overpressure required to cause local explo-sions (strong ignition) after shock reflection as a first and thus crucialstep during onset of detonation ranges between 10 and 11 bar.
Finally, it is interesting to combine the criterion formulated here for strongignition with the criterion for successful transmission of a local explosioninto the macroscopic confining geometry as formulated by Thomas [142], Eq.(2.39). Since this is only a geometrical criterion as explained in Sec. 2.6, a cri-terion for critical incident shock strength to cause strong ignition is not in-cluded. Combination with the kinetics-based criterion found in the presentwork allows for consideration of both chemical kinetics and obstacle geome-try. Relatively independent of H2 concentration, it can be calculated that in-duction time at the extended second explosion limit is of the order of 2 · 10−6
s. At critical post-reflected-shock states, sound speed ranges from 780 m/s (15vol. %) to 860 m/s (30 vol. %). For these conditions, Eq. (2.39) yields a mini-mum obstacle height of the order of 1 mm for successful onset of detonation.
148
5.3 Relation Between Flame Speed and Peak Overpressure
This result suggests that even very small obstacles hold potential for causingonset of detonation in H2–air at initially ambient conditions.
5.3 Relation Between Flame Speed and Peak Overpressure
Flame speed measurements have been used to characterize FA in mixtureswith transverse concentration gradients in Sec. 5.1.2. Simulation of detailedchemical kinetics in post-reflected-shock mixture in Sec. 5.2.3 revealed thatpost-incident-shock overpressure is a useful and physically meaningful pa-rameter to describe critical conditions for onset of detonation both in homo-geneous and gradient mixtures. The present section investigates the relationbetween flame speed and peak overpressure in mixtures with transverse con-centration gradients. This information will then be merged with results on FAand the physics of onset of detonation in Sec. 5.4.
As discussed in Sec. 4.1.2, accurate quantitative explosion overpressure mea-surement in fast regimes is demanding, in particular if a large number of testsis conducted. Manual validation of pressure traces is mandatory. Thus, inves-tigation of overpressure has been confined to two representative configura-tions, BR00 and BR30S300L, with a total number of 346 and 312 tests, respec-tively. Only td = 60 s and td = 3 s are compared to each other. The long obsta-cle path in BR30S300L allows for more efficient acceleration of lean mixturescompared to BR30S300. In addition, more pressure transducers within the ob-stacle path become available for evaluation.
To obtain a relation between flame speed and peak overpressure, pressuretransducers p2–p5 are employed to determine peak pressure and adjacentphotodiodes deliver local flame speed at respective pressure transducer po-sitions. Transducer p1 is omitted since no significant acceleration takes placeat this early position. Measured peak pressure at p1 is dominated by FA thattakes place further downstream in the channel and does therefore not corre-late with local flame speed. Transducer p6 is also omitted since it showed signsof thermal shock because the protective silicone coating repeatedly peeled offdue to generally high pressures and flow velocities at this location.
149
DDT in H2–Air with Transverse Concentration Gradients
The approach to cover a wide range of flame speed and peak overpressurewas to conduct experiments at different average H2 concentrations between12.5 and 40 vol. %. To make these experiments comparable, peak overpressureneeds to be related not to flame speed, but to flame Mach number MF. In a firstapproach, average H2 concentration is employed for the calculation of averagereactant sound speed are. Thus,
MF =v
are. (5.9)
MF will be referred to as the global flame Mach number. Figure 5.38 (a)presents experimental results for td = 60 s and 3 s in BR00. Overpressure is gen-erally higher at a given global flame Mach number in homogeneous mixturesthan in gradient mixtures. In other words, flames need to propagate faster(higher speed of the leading flame tip) in gradient mixtures than in homo-geneous mixtures to reach equal overpressure at the pressure measurementposition (channel top). For a more meaningful comparison, the location ofpressure measurement needs to be taken into account. Since overpressure ismeasured at the channel top, local mixture properties at this position need tobe considered by correlating overpressure data not to a global, but to a localflame Mach number at y = 0.06 m, thus employing the local reactant soundspeed are,y=0.06m. Local flame Mach number at the channel top is calculated as
MF,y=0.06m =v
are,y=0.06m. (5.10)
For homogeneous mixtures, MF equals MF,y=0.06m. This approach yields a com-mon correlation of flame speed and peak overpressure for homogeneous andinhomogeneous mixtures, Fig. 5.38 (b), solid line, with a quadratic fit
p = M2F,y=0.06m ·0.48bar+MF,y=0.06m ·2.8bar+0.22bar. (5.11)
Data from BR30S300L can be correlated similarly, see Fig. 5.38 (c). The correla-tion from BR00 (Eq. (5.11)) is again plotted as a solid line in this figure for com-parison. In general, scatter of data points is more distinct. At local flame Machnumbers higher than unity, peak overpressure systematically exceeds valuesfrom BR00 since transverse shock waves are generated by shock diffractionaround obstacles, impinging on the pressure transducers and thus increasingmeasured peak overpressure.
150
5.3 Relation Between Flame Speed and Peak Overpressure
p [bar]
12
4
0
2
6
10
M [-]F, y=0.06m
0 0.5 1 1.5 2.5 32
8
(c)
p [bar]
12
4
0
2
6
(b)
10
p [bar]
12
4
0
2
6
10
0 0.5 1 1.5 2.5
(a)
3 3.52
t = 60 s, t = 3 sd d
M [-] M [-]F, y=0.06m
0 0.5 1 1.5 2.5 32
8 8
F
Figure 5.38: Correlation between overpressure p and global flame Mach num-ber MF in BR00 (a), p and local flame Mach number MF,y=0.06m
in BR00 (b) and p and MF,y=0.06m in BR30S300L (c). Black line:quadratic fit (Eq. (5.11)). Blue dotted line: model by Krok [83].
151
DDT in H2–Air with Transverse Concentration Gradients
Since the assumption of quadratic data fit is not directly physically motivated,experimental data is compared to an analytical model of a flame driving ashock, propagating from the closed end of a tube. This model is based on thework of Krok [83]. It was implemented in MATLAB, using Cantera [55] and theShock and Detonation Toolbox [133]. Three states are considered:
• Undisturbed state 0, quiescent mixture at initial conditions.
• Post-shock state 1, chemically frozen.
• Post-flame state 2, assuming u2 = 0 (laboratory frame of reference).
As long as flame speed is lower than post-flame sound speed, expansionacross the flame front can bring the flow to rest, thereby satisfying the rearwall boundary condition. No expansion wave forms behind the flame front[83]. This is valid within the entire range of flame Mach numbers investigatedhere.
The change of state across the flame front is determined by the intersectionof Rayleigh line and product Hugoniot for given γ and specific heat releaseq (Eq. (2.1)). These relations are solved using a Newton-Raphson method. Fi-nally, flame speed and flame Mach number are calculated from conservationof mass across the flame front.
Blue dotted curves in Fig. 5.38 depict the model result, assuming a 30 vol. %mixture18. Experimentally observed peak overpressure is generally underpre-dicted by the model. Since the model is based on a 1D approach, thus neglect-ing locally increased pressure due to three-dimensional effects like shock fo-cusing, the result represents a lower bound to the experimental data. Towardsthis bound, experiments approach 1D behavior. Agreement of the model withexperimental data, following this understanding, is very good. In the follow-ing section, the relation between overpressure and flame speed will be mergedwith the beforehand developed understanding of onset of detonation.
18The result varies in a negligible range with a variation of H2 concentration, since γ is very similar in H2 (1.41)and air (1.40), values at standard conditions, and variations of q are of minor influence.
152
5.4 Discussion
5.4 Discussion
This section merges results from experimental and theoretical studies on FAand onset of detonation presented in Secs. 5.1–5.3. A comprehensive pictureof the influence of transverse concentration gradients on DDT is developed.First, critical conditions for onset of detonation in terms of overpressure andflame Mach number are defined in Sec. 5.4.1. Then, the influence of trans-verse concentration gradients in unobstructed and obstructed channels is dis-cussed in Sec. 5.4.2. This section ends with comments on the impact of con-centration gradient orientation, Sec. 5.4.3.
5.4.1 Critical Flame Mach Number for Onset of Detonation
In a fast deflagration at a state close to critical conditions for the onset of det-onation the highest overpressure within the shock-flame complex occurs be-hind the precursor shock (p1). Across the flame, expansion subsequently leadsto pressure decrease. Thus, the relation between peak overpressure ("post-incident-shock overpressure") and local flame Mach number, Sec. 5.3, can belinked to the model for strong ignition behind a reflected shock, Sec. 5.2.3.Since critical conditions for strong ignition can be expressed in terms of post-incident-shock overpressure, a critical local flame Mach number must bereached to achieve strong ignition and thus potentially onset of detonation.This applies to homogeneous and gradient mixtures.
The 1D model of a shock-flame complex by Krok [83] predicts a critical flameMach number of 2.6–2.7 to reach a peak overpressure of 10–11 bar, cp. Fig.5.38. Since this 1D model yields only a lower bound for realistic local over-pressure, these Mach numbers cannot portray a conservative boundary. Reallocal peak pressures tend to be higher. Employing the experimental correla-tion, Eq. (5.11), critical flame Mach number can be estimated slightly lower at2.4–2.6. The shadowgraph sequences of onset of detonation presented in Sec.5.2.2 support these values of critical flame Mach number. It is more accurateto determine the precursor shock Mach number as opposed to flame Machnumber from these shadowgraph sequences since the flame is visible within
153
DDT in H2–Air with Transverse Concentration Gradients
Table 5.2: Local precursor shock Mach number shortly before onset of deto-nation, corresponding to shadowgraph sequences in Sec. 5.2.2.
Figure XH2 td MS,y=0.06m
[%] [s] [-]
5.29 16.5 60 2.65.30 17 3 2.55.31 22.5 3 2.55.32 22.5 3 2.65.33 26 3 2.45.34 30 3 2.55.35 35 3 2.4
the FOV only for a very short time. Shock and flame propagate at equal veloc-ity within the measurement accuracy (primarily limited by the camera resolu-tion) at that state so that these Mach numbers can be used equivalently. Table5.2 provides values of local Mach number MS,y=0.06m of the precursor shockat the channel top shortly before onset of detonation, corresponding to Figs.5.29–5.35. It can be seen that local shock and thus local flame Mach numberMF,y=0.06m was higher than 2.4 in all of these experiments. Overpressure in therange of 10–11 bar is often observed shortly before onset of detonation as canbe seen in Figs. 5.29 (a) and 5.30 (a), for instance. These values are in very goodagreement with the theoretical predictions.
Distinct scatter in experimental data, in particular visible in Fig. 5.38, clearlyshows the stochastic nature of DDT: In single experiments—and of course inreal-world explosions—local pressure can exceed values predicted by theo-retical or experimental correlations. Shock focusing may be a major reason.Critical flame Mach numbers determined here thus need to be understoodas statistic mean values and be used only with an appropriate safety margin.Note that the approach using the extended second explosion limit could beextended for more complex scenarios of shock-induced strong ignition, forexample involving shock focusing.
It is a common assumption in DDT research that the speed of sound of thereaction products apr can be used to estimate critical conditions for the onsetof detonation. In that argumentation, flame speed needs to reach this sound
154
5.4 Discussion
speed, thus v = apr. This approach does not take into account the physics ofonset of detonation, but is rather of empirical origin. The important ques-tion is how apr should be calculated. Isobaric or isochoric combustion may beassumed. Neither of them yields realistic post-flame equilibrium states thatare observed in a fast deflagration. Considering a shock-flame structure likein Krok’s model [83] might give more realistic values. In comparison, the ap-proach to determine critical conditions for onset of detonation presented inthe present work is based on a combination of experimental observations andsimulation of detailed chemical kinetics. Since the sound speed of unburntmixture can be readily calculated, no uncertainty is related to this step here.An uncertainty is however the exact value of critical local flame Mach numberfor real-world situations. This uncertainty originates from three-dimensionaleffects in the first place as outlined beforehand. This poses a general problemfor every analytical criterion that defines critical conditions for the onset ofdetonation.
5.4.2 Comparison of Unobstructed and Obstructed Channels
In experiments presented in Secs. 5.1–5.2, it has been found that mixtures withtransverse concentration gradients can pose a considerably higher explosionhazard in closed channels than homogeneous mixtures at equal average H2
concentrations. This hazard manifests through stronger FA and earlier DDTin terms of average H2 concentration.
Clearly different conclusions must be drawn for unobstructed and obstructedconfigurations. In the former, flame elongation leads to flame surface areaenlargement, which allows flames in gradient mixtures to accelerate muchstronger than flames in homogeneous mixtures. Flame elongation likewiseleads to earlier DDT in terms of average H2 concentration. Already a mix-ture of 20 vol. % with a steep concentration gradient was observed to undergoDDT, which would be the case in a homogeneous mixture only if obstructionswere present. In contrast to this shift of the lower DDT limit towards lower H2
concentrations, gradients were found to suppress DDT at higher concentra-tions and thus pose an initially unexpected upper DDT limit. This can now
155
DDT in H2–Air with Transverse Concentration Gradients
be explained by merging findings from Secs. 5.2.3, 5.3 and 5.4.1. It has beenshown that flames in gradient mixtures need to accelerate to an equal localflame Mach number as homogeneous mixtures to cause certain values of localoverpressure. Critical overpressure for the onset of detonation was derived forobstructed configurations. A similar argumentation may also apply to unob-structed channels. Local explosions in gradient mixtures, leading to the onsetof detonation, were observed at the upper channel wall in BR00. Local pres-sure and temperature is increased by a series of shocks preceding the flame.When critical values are reached, the mixture can auto-ignite. This mecha-nism was introduced in Sec. 2.6 based on the work of Dzieminska and Hayashi[37]. Details of mixture preconditioning may be complex involving interac-tion of shocks and boundary layer, but eventually the buildup of overpressuredominates this process. In Fig. 5.27, it was observed that continuous mixturecompression leads to a local overpressure of about 11.5 bar before a local ex-plosion occurs. This value is only slightly higher than the critical overpressuredetermined for the onset of detonation in obstructed channels (10–11 bar). Alocal flame Mach number of 2.7 was measured in BR00 shortly before onset,which is in good accordance with the determined relation between overpres-sure and local flame Mach number, Eq. (5.11).
In summary, two mechanisms compete regarding DDT propensity:
• Enforcement of FA through flame surface area enlargement and, belowthe flame speed cross-over concentration of 24 vol. %, due to increasedeffective flame speed (SLσ)eff.
• Requirement for acceleration of the leading flame tip, which propagatesat the channel top, to a critical local flame Mach number. Since reactantsound speed increases with increasing H2 concentration, higher flamespeed must be reached in gradient mixtures to allow for onset of deto-nation, which retards onset by causing a need for further accelerationdistance.
The upper DDT limit in experimentally observed probabilities of DDT inBR00, Fig. 5.28, can be explained by this competition. In mixtures of td = 3 s,effective flame speed (SLσ)eff remains fairly constant beyond the flame speed
156
5.4 Discussion
cross-over concentration, cp. Fig. 5.25. At the same time, the required flamespeed for onset of detonation continuously increases with increasing H2 con-centration. Critical flame speed, or flame Mach number, cannot be reachedwithin the channel length in mixtures of 30 vol. % and higher at td = 3 s. In com-parison, effective flame speed still increases considerably in td = 7.5 s mixturesbeyond the flame speed cross-over concentration, so that this increase over-comes the requirement for higher critical flame speed and leads to a broadrange of concentrations that undergo DDT.
From a practical perspective, DDT propensity at low H2 concentrations in anunobstructed channel can be estimated by using the maximum local H2 con-centration at the channel top. On the one hand, this confirms global obser-vations of Kuznetsov et al. [85] and Grune et al. [56]. On the other hand, thepresent work shows that such an approach does not reflect the physics of DDTin mixtures with transverse concentration gradients and thus represents anempirical criterion only.
Differences between the underlying physics and the simple criterion of max-imum concentration become most obvious in experiments in obstructedchannel configurations. Even at a low blockage ratio of 30 % and a large obsta-cle spacing of 300 mm, DDT is not promoted by gradients in the entire deto-nating range of H2 concentrations tested (17–40 vol. %). It was found that mit-igation of flame elongation by obstructions is responsible for this major dif-ference to BR00. Comparison of unobstructed and obstructed configurationsallowed for separating the role of mixture properties and the flame elongationprocess. It was thereby understood that only global consideration of mixtureproperties, in contrast to local properties, yields an accurate description of theFA process in entirely closed channels. At average H2 concentrations of 24 vol.% and lower, FA in terms of flame speed is stronger in mixtures with gradientsdue to higher effective flame speed (SLσ)eff. Beyond this concentration, FA isweakened by gradients due to lower (SLσ)eff.
In mixtures with transverse concentration gradients, local explosions that areresponsible for the onset of detonation were mainly observed at the upperobstacles, thus in the most fuel-rich region in the channel. Only if local H2
concentrations at lower obstacles exceed about 10 vol. %, local explosions
157
DDT in H2–Air with Transverse Concentration Gradients
originating from lower obstacles additionally support the onset of detonation.No situation has been observed where only a local explosion at the lower ob-stacle, but none at the upper one occurred. The strength of local explosions,estimated based on their propagation velocity in shadowgraph sequences, ishigher at the channel top than at the bottom in a wide range of average H2
concentrations. This is presumably due to the higher energy release in theseexplosions at locations of high local H2 concentration. Thus, these upper ex-plosions dominate the process of onset of detonation in mixtures with trans-verse concentration gradients.
Evidently, the flame speed cross-over concentration of 24 % can only predicta rough trend for DDT propensity of gradient mixtures in obstructed config-urations where flame elongation is mitigated. Beyond the cross-over concen-tration, FA is slowed down by gradients. DDT propensity is clearly reduced.Below the cross-over concentration, gradients cause stronger FA in terms offlame speed, but not necessarily a higher propensity for DDT. No case ofsignificantly earlier DDT in gradients in terms of average H2 concentrationhas been found in obstructed configurations at H2 concentrations as low as17 vol. %. It might be expected that this changes at even lower average H2
concentrations, where enforced FA may overcome the requirement for highercritical flame speed for onset of detonation. This could however not be sub-stantiated in the present work since larger channel dimensions, both in termsof cross-section (cp. detonation cell width, Fig. 2.7.2) and length (high RUD),would be necessary to reach DDT in such mixtures.
In conclusion, concentration gradients primarily lead to higher DDT propen-sity in closed channels if flame elongation is possible. This mechanism re-quires a low degree of blockage and is most effective in entirely unbstructedchannels. Already a low degree of blockage (BR30S300) effectively mitigatesflame elongation and leads to a similar lower DDT limit in homogeneous andgradient mixtures. It is not yet clear what minimum degree of blockage issufficient to achieve this effect. Flame elongation is believed to proceed dif-ferently in different unobstructed channel configurations (e.g. dimensions,cross-section shape, wall roughness). A generalized model for the elongationprocess cannot be deduced from only one experimental setup, particularly if
158
5.4 Discussion
a limited channel length as in the present work suggests that effects of theend plate might not be negligible. Deeper insight into the process of flameelongation in various geometries is required, ideally supported by numeri-cal simulations. Unfortunately, unobstructed channels impose the highest re-quirements on numerical simulations since flame instablilty, turbulence gen-eration in wall boundary layers and turbulence-flame interaction need to becaptured at highest accuracy. DDT simulations in unobstructed channels areoften less accurate than such in obstructed configurations.
5.4.3 Comments on the Orientation of Concentration Gradients
As discussed in Sec. 2.8, three-dimensional concentration gradients may pre-vail in explosive clouds in real-world explosion scenarios. To study only trans-verse or parallel gradients is a helpful simplification that allows for scientificinvestigation and determination of underlying physical phenomena. In spe-cific scenarios like explosions in horizontal or vertical tubes, one of these ori-entations might indeed dominate. Knowledge on both types of gradients maybe merged to identify worst-case scenarios. This is only possible to a limitedextent at present since only a small number of published studies on inhomo-geneous mixtures is available. Quantification of the gradient effect over a suf-ficient range of parameters such as mixture composition, enclosing geome-try or initial conditions is still missing. Interpretation of measurement data isoften bounded to qualitative statements. Based on the information currentlyavailable in literature and knowledge generated within the present work, thefollowing trends can be formulated:
• Both transverse and parallel concentration gradients can increase thehazard of confined explosions, compared to homogeneous mixtures ofequal average H2 concentration. The physics behind FA and DDT hasbeen investigated in more detail for transverse gradients compared toparallel gradients so far.
• Transverse gradients might pose a more severe additional hazard in ge-ometries with a low degree of congestion than parallel gradients due tothe potential for flame elongation. Flame elongation does not occur in
159
DDT in H2–Air with Transverse Concentration Gradients
parallel gradients where the macroscopic flame shape is similar in ho-mogeneous and gradient mixtures throughout the FA process.
• While the maximum local H2 concentration might be used for a firstrough estimation of DDT propensity in transverse gradients in an un-obstructed tube, validity of this method for parallel concentration gradi-ents cannot be assumed. In parallel gradients, the explosion front is incontact with the region of maximum H2 concentration only for a limitedtime during the explosion.
• Overall explosion severity can highly depend on the specific process tak-ing place inside a localized region of high H2 concentration. For example,the onset of detonation might be facilitated in such a region, depend-ing on local mixture reactivity and geometry. A detonation initiated therecould propagate into regions of lower H2 concentrations and potentiallybe sustained.
160
6 Detonation in H2–Air with Transverse
Concentration Gradients
This chapter investigates detonation propagation in H2–air with transverseconcentration gradients and thereby completes the range of possible explo-sion regimes. Detonations in homogeneous mixtures are characterized as areference in Sec. 6.1 before detonations in gradient mixtures are discussed.Two series of measurements are presented: Variation of gradient slope at 25vol. % average H2 concentration (Fig. 6.1 (a)) and variation of average H2 con-centration at td = 3 s (Fig. 6.1 (b)).
y [m
]
0
0.04
0.02
0.06
y [m
]
0
0.04
0.02
0.06
0 40 60
(b)
X [vol. %]80
H2
10 20 30
(a)
X [vol. %]40
H2
X H2
45 40 35 30 25
t d
60 10 7.5 5 3[s]
[vol. %]
0 20
22.5
50
Figure 6.1: Concentration gradient profiles of detonation experiments fromCFD simulations [42]. Variation of td at 25 vol. % (a); variation ofaverage H2 concentration at td = 3 s (b).
161
Detonation in H2–Air with Transverse Concentration Gradients
Detonations were produced in the obstacle section of configuration BR60S300and studied in the unobstructed channel section. Pressure transducers p4
and p6 in the unobstructed section of the channel composed of six standardsegments were used to measure detonation arrival time and thereby deter-mine the detonation velocity. Compared to photodiodes, pressure transducersproved more accurate due to a steeper signal rise. Shadowgraphy, OH* lumi-nescence imaging and soot foils were applied to configuration BR60S300 OS5.The FOVs of all optical measurements and also the soot foils were centered atx = 3.9 m.
For detonation velocity measurements it is essential that a quasi-steady veloc-ity is reached upstream of the velocity measurement section. Among all aver-age H2 concentrations examined subsequently the case 22.5 vol. % yields thehighest run-up distance to the onset of detonation. Onset occurs at the lastobstacle of BR60S300 both in homogeneous and td = 3 s mixtures as alreadyshown in Sec. 5.2, Fig. 5.32. Two insights from this shadowgraphy sequenceare important in the context of detonation characterization: The onset of det-onation occurs directly behind the obstacle. The detonation structure is estab-lished quickly. Second, the detonation propagates into undisturbed, quiescentmixture. The first two images of the sequence show a vortex pair behind theupper and lower obstacle which is a marker for the first significant fluid dis-placement at this location due to the approaching deflagration. Already in thethird image the combustion wave catches up with the leading part of this re-gion. The concentration gradient ahead of the detonation thus maintains theinitially generated profile in the downstream measurement section. Detona-tion velocity attains a stable value already behind pressure transducer p3 ascan be seen in the pressure trace diagram of an exemplary experiment witha 22.5 vol. %, td = 3 s mixture, Fig. 6.2. Each pressure signal is normalized byits maximum value. Transition to detonation can be localized between p2 andp3 (secondary pressure spike at p2; typical detonation pressure signal at p3).The fluctuation of detonation velocity between adjacent pressure transducersis lower than 0.6 % of the finally evaluated velocity between p4 and p6.
162
6.1 Reference Experiments in Homogeneous Mixtures
x [m
]
0
5
2
1
1653 m/s
1636 m/s
1648 m/s3
4
6
14 16 18 2012
t [ms]
22
Figure 6.2: Pressure trace diagram, 22.5 vol. %, td = 3 s, BR60S300. Detonationvelocity measurement between p4 (blue, xp4 = 3.2 m) and p6 (or-ange, xp6 = 5.0 m).
6.1 Reference Experiments in Homogeneous Mixtures
This section begins with detonation velocity measurements shown in Fig. 6.3,td = 60 s. Data points represent the average of five experiments each. Standarddeviations are smaller than 1 % for all data points. A dimensionless depictionin Fig. 6.3 (b) will allow for comparison with literature. Velocities in homoge-neous mixtures are close to the Chapman-Jouguet velocity DCJ of the respec-tive mixtures. Values beyond DCJ are unexpected, but might be explained byan inaccuracy of the CJ model.
Shadowgraph images, Fig. 6.4, show the well-known structure of detonationsin homogeneous mixtures, such as the coupled leading shock and reactionzone as well as triple points (kinks in the leading front) moving in a vertical di-rection. The richer the mixture, within the range discussed here, the less thesetriple points emerge in the shadowgraph images. The reaction zone, which isvisible as a dark area behind the leading shock, becomes narrower. This cor-responds well to the reduction of induction time with an increase in H2 con-centration.
163
Detonation in H2–Air with Transverse Concentration Gradientsv [m
/s]
1600
2200
2000
v/D
[-
]
0.96
0.92
1
1800
1.04
(b)
5 7.510
(a)
15
X H2
45 40 35 30 25[vol. %]
3
22.5
60td
[s]
CJ
20 5 7.510 153 60td
[s]20
Figure 6.3: Detonation velocity at different average H2 concentrations andgradients. Dimensional (a) and dimensionless (b) depiction.
t =
12
.5 μ
st
= 0
μs
22.5 vol. % 25 vol. % 30 vol. % 40 vol. %
Figure 6.4: Shadowgraph images of detonations in homogeneous mixtures.
164
6.2 Overview of Propagation Regimes
6.2 Overview of Propagation Regimes
In this section, a general overview of experimental observations on detona-tion propagation in mixtures with transverse concentration gradients is given.For this purpose, detonation velocities are examined first. Afterwards, a seriesof measurements at a constant average H2 concentration of 25 vol. % with avariation of concentration gradient slope is presented.
6.2.1 Detonation Velocity
Figure 6.3 (a) shows that detonations in mixtures with concentration gradi-ents (td < 60 s) propagate slower than in homogeneous mixtures at equalaverage H2 concentrations. This is a first obvious difference to the defla-gration regime. This velocitiy deficit is further quantified in the dimension-less depiction in Fig. 6.3 (b). The steeper the gradient, the larger the velocitydeficit. Mixtures with average concentrations equal to and lower than 30 vol. %show similar normalized velocity deficits, while richer mixtures yield smallerdeficits. Nevertheless, even the steepest concentration gradients investigated(td = 3 s) do not suppress detonation propagation but cause only moderate ve-locity deficits of less than 9 % compared to DCJ, which is calculated for the av-erage H2 concentration here. Kessler et al. [75] found velocity deficits of about5–10 % compared to DCJ in gradient mixtures and Calhoon and Sinha [16] de-termined a maximum deficit of 6 % before detonation failure occurred.
It has not been possible in the present work to determine whether completefailure of detonation can be caused by a concentration gradient, because alsothe DDT process in the experiment is strongly influenced by the gradient asshown in Ch. 5. This means that the differentiation if a limit for detonationpropagation or for DDT is observed cannot be reliably achieved in this typeof experiment. Formation of a detonation wave in a detonable mixture (forinstance strong ignition with an exploding wire in a driver gas cloud) and sub-sequent exposure of the wave to the gradient mixture would lead to reliableresults here.
165
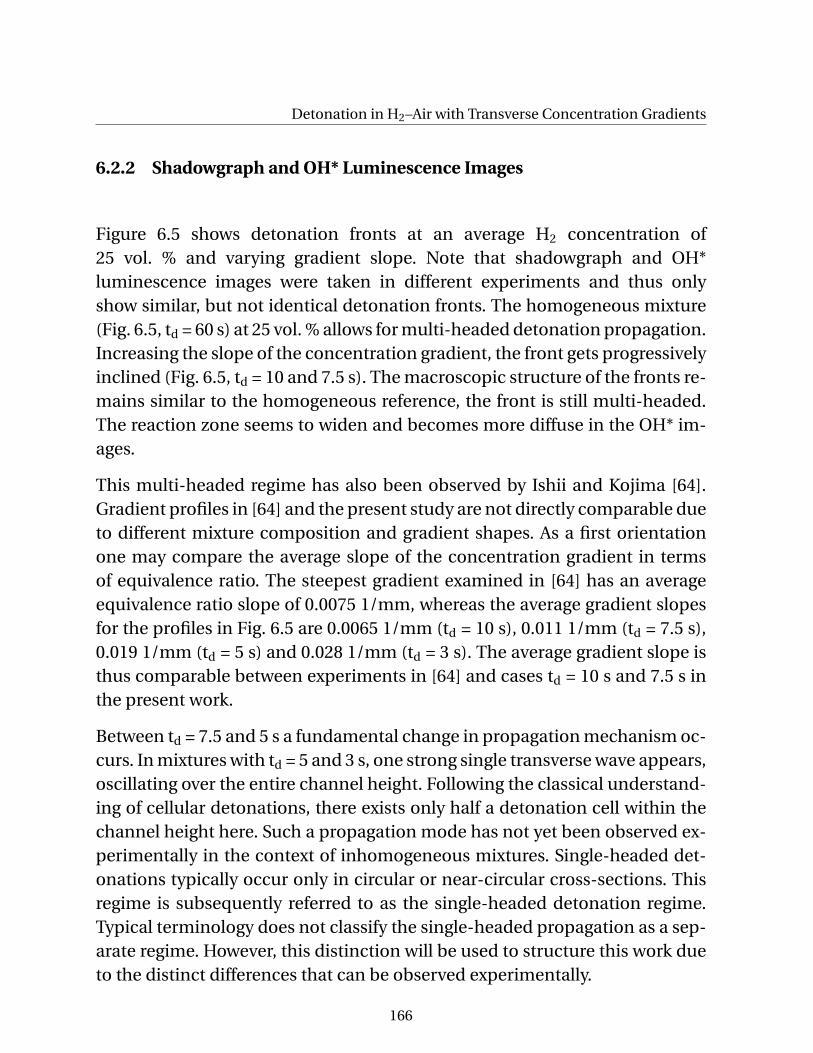
Detonation in H2–Air with Transverse Concentration Gradients
6.2.2 Shadowgraph and OH* Luminescence Images
Figure 6.5 shows detonation fronts at an average H2 concentration of25 vol. % and varying gradient slope. Note that shadowgraph and OH*luminescence images were taken in different experiments and thus onlyshow similar, but not identical detonation fronts. The homogeneous mixture(Fig. 6.5, td = 60 s) at 25 vol. % allows for multi-headed detonation propagation.Increasing the slope of the concentration gradient, the front gets progressivelyinclined (Fig. 6.5, td = 10 and 7.5 s). The macroscopic structure of the fronts re-mains similar to the homogeneous reference, the front is still multi-headed.The reaction zone seems to widen and becomes more diffuse in the OH* im-ages.
This multi-headed regime has also been observed by Ishii and Kojima [64].Gradient profiles in [64] and the present study are not directly comparable dueto different mixture composition and gradient shapes. As a first orientationone may compare the average slope of the concentration gradient in termsof equivalence ratio. The steepest gradient examined in [64] has an averageequivalence ratio slope of 0.0075 1/mm, whereas the average gradient slopesfor the profiles in Fig. 6.5 are 0.0065 1/mm (td = 10 s), 0.011 1/mm (td = 7.5 s),0.019 1/mm (td = 5 s) and 0.028 1/mm (td = 3 s). The average gradient slope isthus comparable between experiments in [64] and cases td = 10 s and 7.5 s inthe present work.
Between td = 7.5 and 5 s a fundamental change in propagation mechanism oc-curs. In mixtures with td = 5 and 3 s, one strong single transverse wave appears,oscillating over the entire channel height. Following the classical understand-ing of cellular detonations, there exists only half a detonation cell within thechannel height here. Such a propagation mode has not yet been observed ex-perimentally in the context of inhomogeneous mixtures. Single-headed det-onations typically occur only in circular or near-circular cross-sections. Thisregime is subsequently referred to as the single-headed detonation regime.Typical terminology does not classify the single-headed propagation as a sep-arate regime. However, this distinction will be used to structure this work dueto the distinct differences that can be observed experimentally.
166
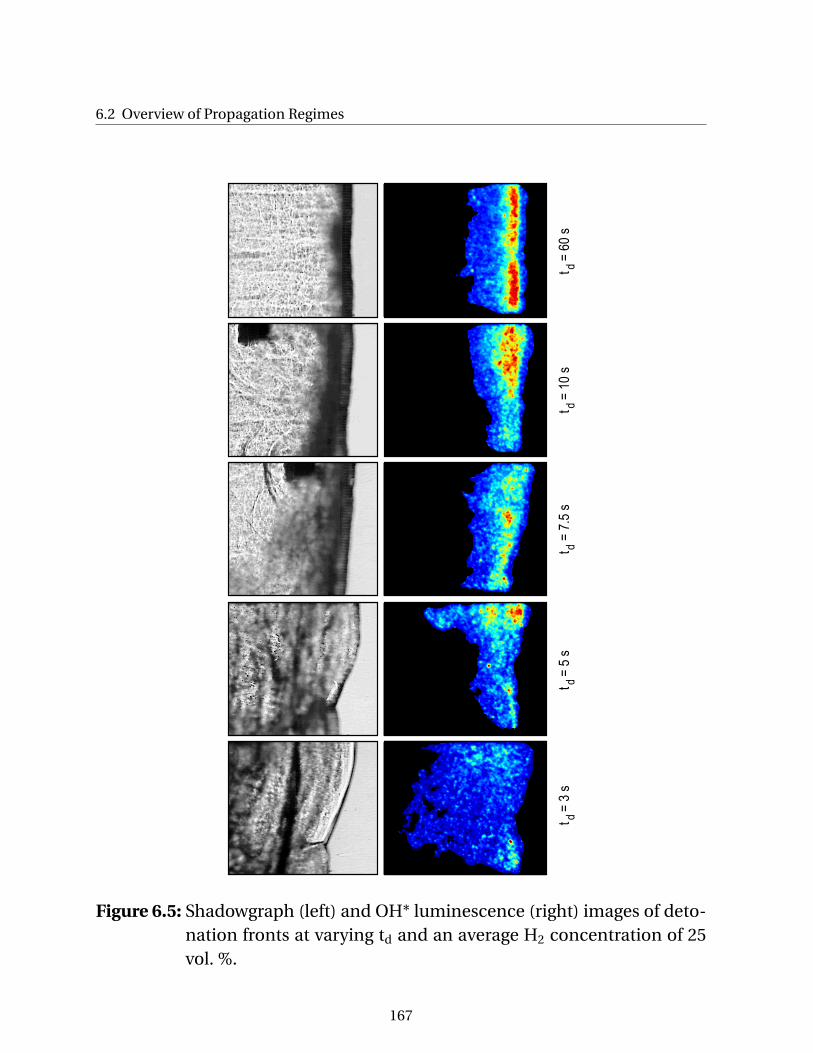
6.2 Overview of Propagation Regimes
t
= 6
0 s
dt
=
10
sd
t
= 7
.5 s
dt
=
5 s
dt
=
3 s
d
Figure 6.5: Shadowgraph (left) and OH* luminescence (right) images of deto-nation fronts at varying td and an average H2 concentration of 25vol. %.
167
Detonation in H2–Air with Transverse Concentration Gradients
6.3 Single-Headed Propagation
This section focuses on the single-headed detonation regime in mixtures withthe steepest gradients examined (td = 3 s). It is characterized by means ofhighly time-resolved shadowgraphy, Sec. 6.3.1, and OH* luminescence imag-ing, Sec. 6.3.2, as well as by soot foils, Sec. 6.3.3.
6.3.1 Shadowgraph Images
At an average H2 concentration of 25 vol. %, highly dynamic detonation prop-agation can be observed. Figure 6.6 shows a corresponding shadowgraph se-quence. Two parts of a characteristic cycle can be seen, recorded in two exper-iments (two columns). This cycle occurs in most of the experiments at averageconcentrations up to 30 vol. % at td = 3 s. The structure of the detonation frontresembles a single-headed detonation. One strong transverse wave appearswhich is periodically reflected off the channel walls. Comparable to the forma-tion of transverse waves in homogeneous mixtures, this wave forms in orderto equilibrate pressure differences behind the leading detonation front, whichare intensified by the H2 concentration gradient. Reflection of this transversewave at the channel top causes strong local explosions and thereby periodicre-initiation of detonation. Note that there is no injection manifold installednear the location of the local explosion. Thus, the single-headed regime isevidently not caused by manifolds but by the concentration gradient. Reac-tion is coupled with the shock within the first frames after the local explosion(Fig. 6.6, left column). When this wave is reflected off the channel bottom,reaction is still coupled behind the Mach-stem but progressively decouplesbehind the incident shock (right column, t = 25–62.5 µs). Arriving at the chan-nel top, transverse wave reflection again causes a local explosion, which com-pletes one cell cycle. Local detonation front velocity oscillates between ap-proximately 1.2 and 0.8 times the average propagation velocity over one oscil-lation cycle, which is very similar to the range observed in detonation cells inhomogeneous mixtures [131]. The grey blurred area behind the leading shock,identified as the reaction zone, extends across the entire shadowgraph image.
168
6.3 Single-Headed Propagation
t =
0 μ
st =
12.5
μs
t =
25 μ
st =
37.5
μs
t =
50 μ
st =
62.5
μs
t =
0 μ
st =
12.5
μs
t =
25 μ
st =
37.5
μs
t =
50 μ
st =
62.5
μs
Figure 6.6: Shadowgraph sequences of detonations at an average H2 concen-tration of 25 vol. % and td = 3 s. Columns represent two separateexperiments.
169
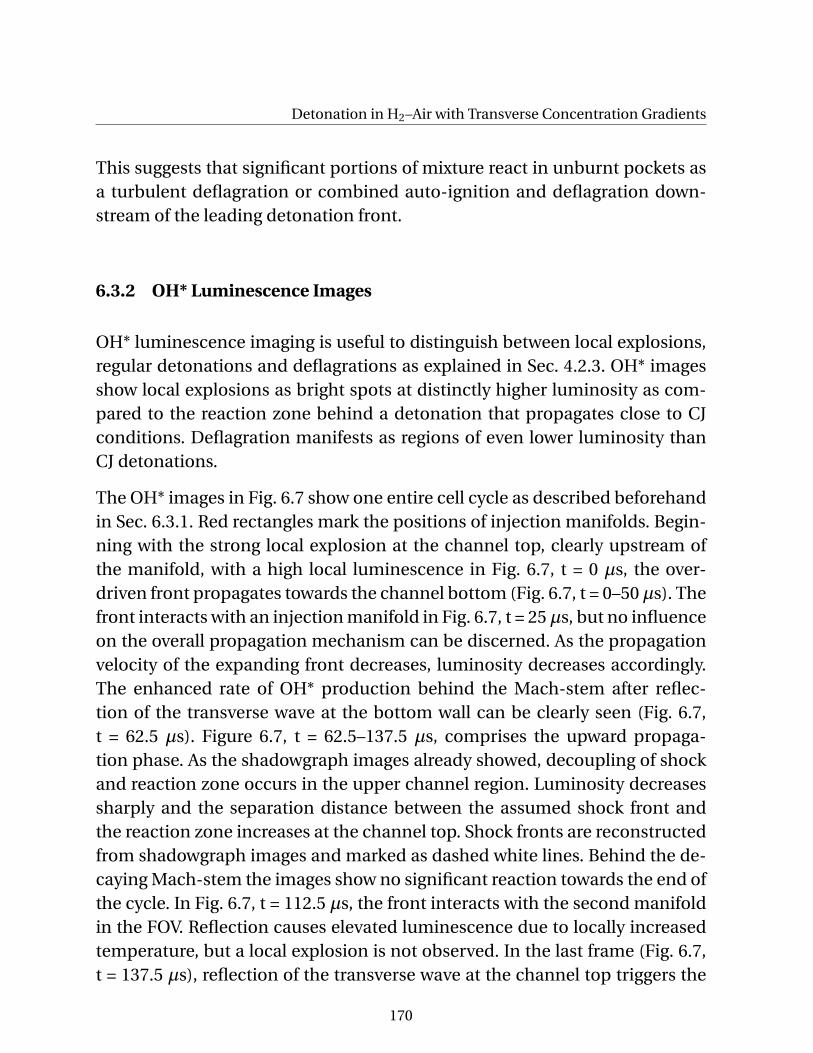
Detonation in H2–Air with Transverse Concentration Gradients
This suggests that significant portions of mixture react in unburnt pockets asa turbulent deflagration or combined auto-ignition and deflagration down-stream of the leading detonation front.
6.3.2 OH* Luminescence Images
OH* luminescence imaging is useful to distinguish between local explosions,regular detonations and deflagrations as explained in Sec. 4.2.3. OH* imagesshow local explosions as bright spots at distinctly higher luminosity as com-pared to the reaction zone behind a detonation that propagates close to CJconditions. Deflagration manifests as regions of even lower luminosity thanCJ detonations.
The OH* images in Fig. 6.7 show one entire cell cycle as described beforehandin Sec. 6.3.1. Red rectangles mark the positions of injection manifolds. Begin-ning with the strong local explosion at the channel top, clearly upstream ofthe manifold, with a high local luminescence in Fig. 6.7, t = 0 µs, the over-driven front propagates towards the channel bottom (Fig. 6.7, t = 0–50 µs). Thefront interacts with an injection manifold in Fig. 6.7, t = 25 µs, but no influenceon the overall propagation mechanism can be discerned. As the propagationvelocity of the expanding front decreases, luminosity decreases accordingly.The enhanced rate of OH* production behind the Mach-stem after reflec-tion of the transverse wave at the bottom wall can be clearly seen (Fig. 6.7,t = 62.5 µs). Figure 6.7, t = 62.5–137.5 µs, comprises the upward propaga-tion phase. As the shadowgraph images already showed, decoupling of shockand reaction zone occurs in the upper channel region. Luminosity decreasessharply and the separation distance between the assumed shock front andthe reaction zone increases at the channel top. Shock fronts are reconstructedfrom shadowgraph images and marked as dashed white lines. Behind the de-caying Mach-stem the images show no significant reaction towards the end ofthe cycle. In Fig. 6.7, t = 112.5 µs, the front interacts with the second manifoldin the FOV. Reflection causes elevated luminescence due to locally increasedtemperature, but a local explosion is not observed. In the last frame (Fig. 6.7,t = 137.5 µs), reflection of the transverse wave at the channel top triggers the
170
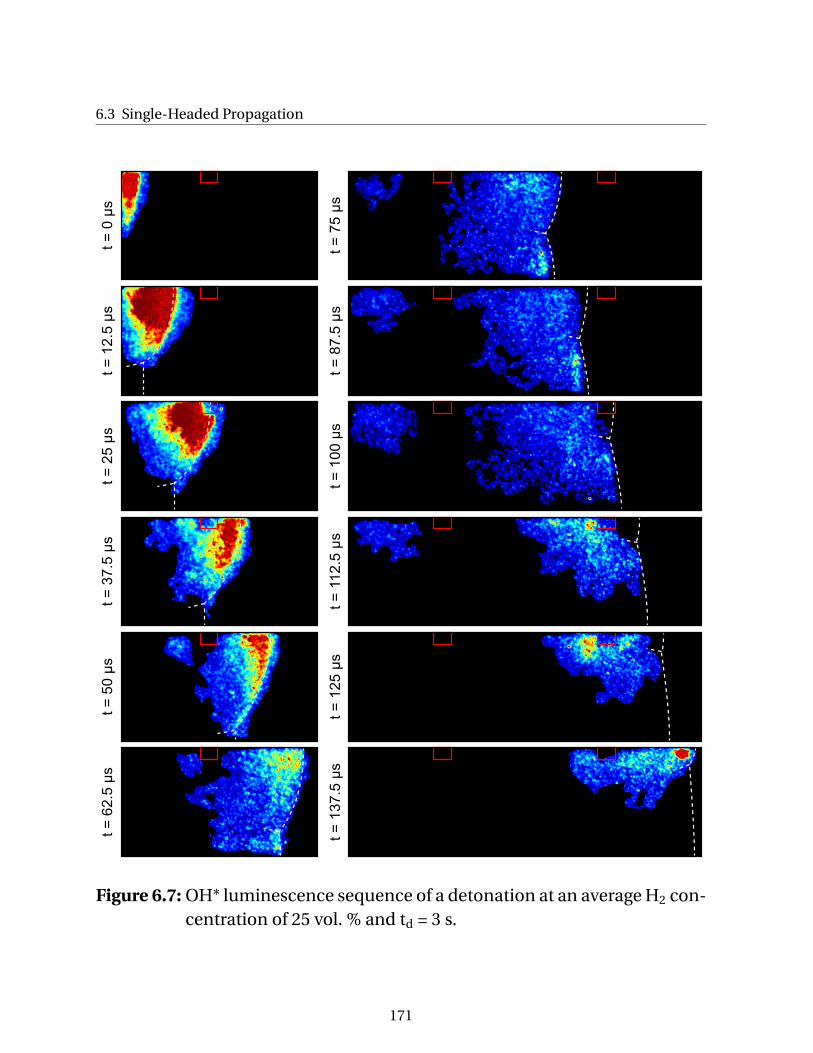
6.3 Single-Headed Propagationt =
0 μ
st =
12.5
μs
t =
25 μ
st =
37.5
μs
t =
50 μ
st =
62.5
μs
t =
75 μ
st =
87.5
μs
t =
100 μ
st =
112.5
μs
t =
125 μ
st =
137.5
μs
Figure 6.7: OH* luminescence sequence of a detonation at an average H2 con-centration of 25 vol. % and td = 3 s.
171
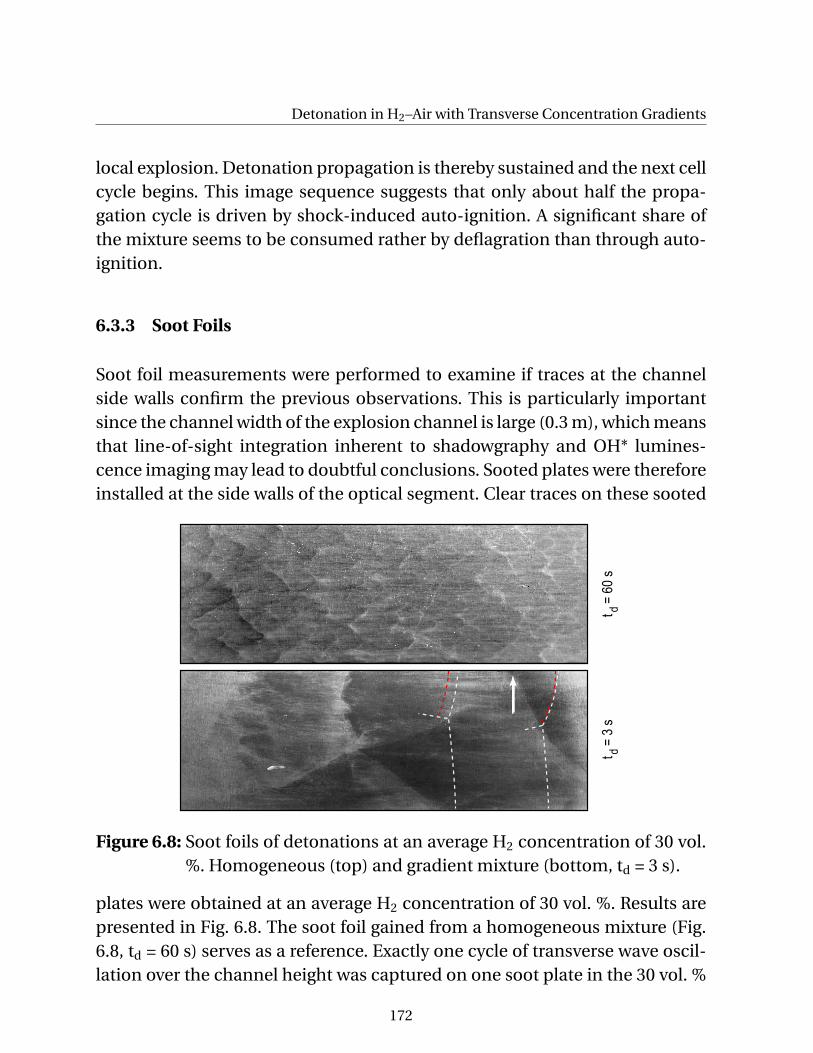
Detonation in H2–Air with Transverse Concentration Gradients
local explosion. Detonation propagation is thereby sustained and the next cellcycle begins. This image sequence suggests that only about half the propa-gation cycle is driven by shock-induced auto-ignition. A significant share ofthe mixture seems to be consumed rather by deflagration than through auto-ignition.
6.3.3 Soot Foils
Soot foil measurements were performed to examine if traces at the channelside walls confirm the previous observations. This is particularly importantsince the channel width of the explosion channel is large (0.3 m), which meansthat line-of-sight integration inherent to shadowgraphy and OH* lumines-cence imaging may lead to doubtful conclusions. Sooted plates were thereforeinstalled at the side walls of the optical segment. Clear traces on these sooted
t
= 6
0 s
dt
=
3 s
d
Figure 6.8: Soot foils of detonations at an average H2 concentration of 30 vol.%. Homogeneous (top) and gradient mixture (bottom, td = 3 s).
plates were obtained at an average H2 concentration of 30 vol. %. Results arepresented in Fig. 6.8. The soot foil gained from a homogeneous mixture (Fig.6.8, td = 60 s) serves as a reference. Exactly one cycle of transverse wave oscil-lation over the channel height was captured on one soot plate in the 30 vol. %
172
6.4 Multi-Headed Propagation
mixture at td = 3 s. The upward-leading trajectory with low inclination corre-sponds to the triple point formed by incident shock, Mach-stem and upward-propagating transverse wave. The transverse wave propagates slowly in thispart of the cycle compared to the incident shock. The steep downward-leadingtrajectory corresponds to the triple point after local explosion at the channeltop. The arrow in Fig. 6.8 highlights the estimated location of local explosion.Furthermore, the soot foils underscore that the injection manifolds are not thecause of the single-headed regime. From the foil, the cell length can be esti-mated at about 0.18 m, not being a multiple of the manifold spacing. Theremay be a second transverse wave visible on this plate, but the interaction withtransverse waves moving in the spanwise direction of the channel, which arevisible as vertical wavy imprints on the plate, complicates the analysis.
6.4 Multi-Headed Propagation
In mixtures richer than 35 vol. % H2 at td = 3 s, detonation propagation is multi-headed. Transverse waves are continuously regenerated by collisions with on-coming transverse waves and with the channel walls. This regime equivalentlyappears in leaner mixtures with weaker gradients as shown already in Fig. 6.5.
35
vo
l. %
40
vo
l. %
Figure 6.9: Shadowgraph (left) and OH* (right) images of detonation fronts attd = 3 s, 35 (top) and 40 vol. % (bottom).
173
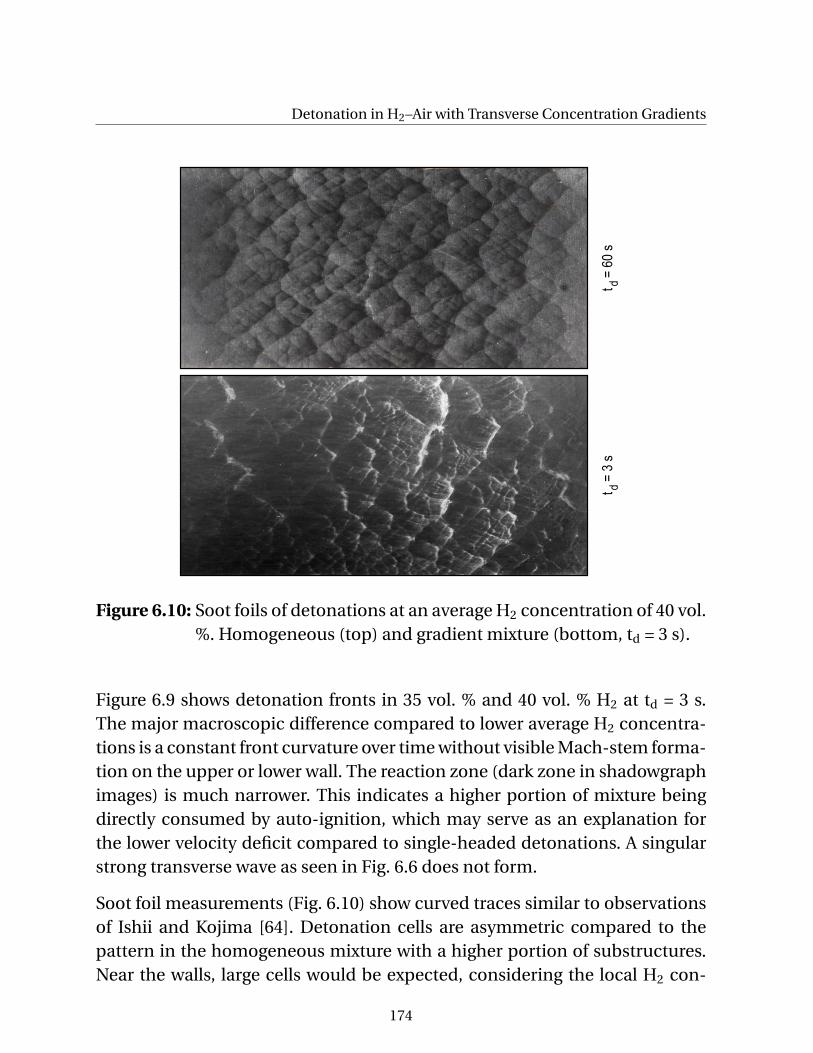
Detonation in H2–Air with Transverse Concentration Gradients
t
= 6
0 s
dt
=
3 s
dFigure 6.10: Soot foils of detonations at an average H2 concentration of 40 vol.
%. Homogeneous (top) and gradient mixture (bottom, td = 3 s).
Figure 6.9 shows detonation fronts in 35 vol. % and 40 vol. % H2 at td = 3 s.The major macroscopic difference compared to lower average H2 concentra-tions is a constant front curvature over time without visible Mach-stem forma-tion on the upper or lower wall. The reaction zone (dark zone in shadowgraphimages) is much narrower. This indicates a higher portion of mixture beingdirectly consumed by auto-ignition, which may serve as an explanation forthe lower velocity deficit compared to single-headed detonations. A singularstrong transverse wave as seen in Fig. 6.6 does not form.
Soot foil measurements (Fig. 6.10) show curved traces similar to observationsof Ishii and Kojima [64]. Detonation cells are asymmetric compared to thepattern in the homogeneous mixture with a higher portion of substructures.Near the walls, large cells would be expected, considering the local H2 con-
174
6.5 Discussion
centrations. It is thus surprising that cells remain very small even far awayfrom the center line. The dynamics of transverse waves thus cannot be de-rived directly from local mixture composition, but requires consideration ofthe entire transverse wave oscillation cycle between the channel walls. Mix-tures beyond 40 vol. % have not been investigated optically. Single-headeddetonations might occur again when the upper detonation limit for the chan-nel geometry is approached.
6.5 Discussion
It has been shown that detonation propagation is possible even in mixtureswith very steep concentration gradients. Propagation velocity is generallylower in a gradient mixture than in a homogeneous mixture at equal averageH2 concentration.
Two detonation regimes were observed experimentally: single-headed prop-agation with one strong transverse wave and multi-headed propagation witha constant macroscopic front curvature over time and numerous weak trans-verse waves. The single-headed regime can be interpreted as a near-limit phe-nomenon similar to the spinning detonation observed by Dabora et al. [25]. Itis also comparable to detonations in mixtures with high activation energy dis-cussed by Gaathaug et al. [50]. The channel height of 0.06 m allows for detona-tion propagation in homogeneous mixtures with an H2 concentration downto 16–17 vol. %. Single-headed propagation already occurs in mixtures withgradients at significantly higher average H2 concentrations. It was induced byeither steepening the gradient at constant average H2 concentration or by de-creasing the average H2 concentration while maintaining the gradient slope(within the experimental limitations by keeping td constant).
Detonation cell width data as shown in Sec. 2.7 is used subsequently to in-terpret the investigated concentration gradient profiles physically. Note thatthese calculated cell widths cannot directly be expected in reality since thedynamics of transverse waves not only depends on local conditions, but onthe entire oscillation cycle of transverse waves between the walls as seen in
175
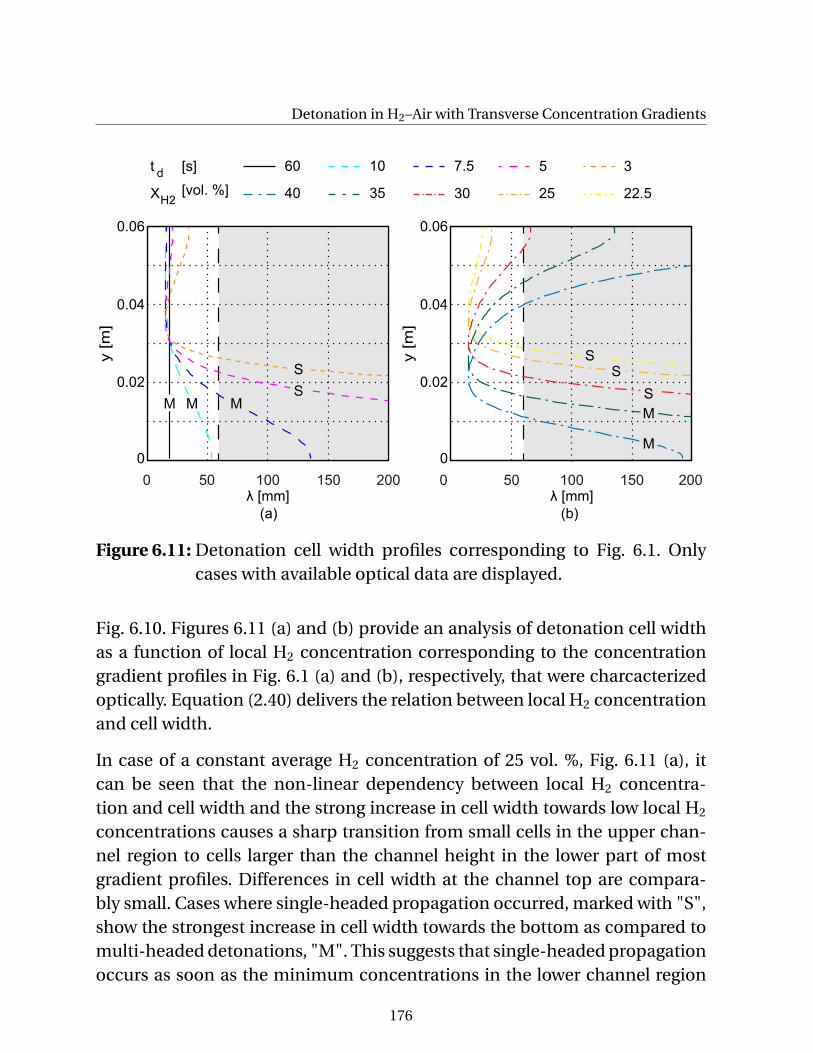
Detonation in H2–Air with Transverse Concentration Gradientsy [m
]
0
0.04
0.02
0.06
y [m
]
0
0.04
0.02
0.06
0 100
(b)
15050 100
(a)
150
X H2
40 35 30 25
t d
60 10 7.5 5 3[s]
[vol. %]
0 50
22.5
λ [mm]200 200
λ [mm]
S
SMMM
SS
S
M
M
Figure 6.11: Detonation cell width profiles corresponding to Fig. 6.1. Onlycases with available optical data are displayed.
Fig. 6.10. Figures 6.11 (a) and (b) provide an analysis of detonation cell widthas a function of local H2 concentration corresponding to the concentrationgradient profiles in Fig. 6.1 (a) and (b), respectively, that were charcacterizedoptically. Equation (2.40) delivers the relation between local H2 concentrationand cell width.
In case of a constant average H2 concentration of 25 vol. %, Fig. 6.11 (a), itcan be seen that the non-linear dependency between local H2 concentra-tion and cell width and the strong increase in cell width towards low local H2
concentrations causes a sharp transition from small cells in the upper chan-nel region to cells larger than the channel height in the lower part of mostgradient profiles. Differences in cell width at the channel top are compara-bly small. Cases where single-headed propagation occurred, marked with "S",show the strongest increase in cell width towards the bottom as compared tomulti-headed detonations, "M". This suggests that single-headed propagationoccurs as soon as the minimum concentrations in the lower channel region
176
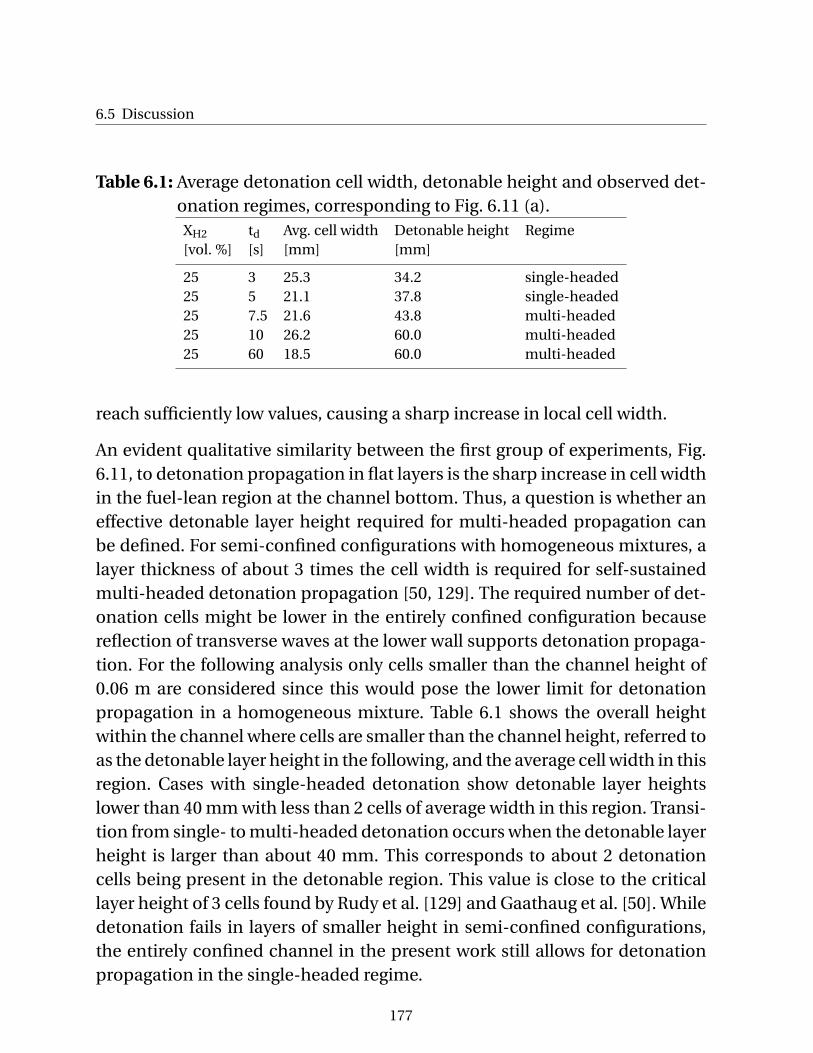
6.5 Discussion
Table 6.1: Average detonation cell width, detonable height and observed det-onation regimes, corresponding to Fig. 6.11 (a).XH2 td Avg. cell width Detonable height Regime[vol. %] [s] [mm] [mm]
25 3 25.3 34.2 single-headed25 5 21.1 37.8 single-headed25 7.5 21.6 43.8 multi-headed25 10 26.2 60.0 multi-headed25 60 18.5 60.0 multi-headed
reach sufficiently low values, causing a sharp increase in local cell width.
An evident qualitative similarity between the first group of experiments, Fig.6.11, to detonation propagation in flat layers is the sharp increase in cell widthin the fuel-lean region at the channel bottom. Thus, a question is whether aneffective detonable layer height required for multi-headed propagation canbe defined. For semi-confined configurations with homogeneous mixtures, alayer thickness of about 3 times the cell width is required for self-sustainedmulti-headed detonation propagation [50, 129]. The required number of det-onation cells might be lower in the entirely confined configuration becausereflection of transverse waves at the lower wall supports detonation propaga-tion. For the following analysis only cells smaller than the channel height of0.06 m are considered since this would pose the lower limit for detonationpropagation in a homogeneous mixture. Table 6.1 shows the overall heightwithin the channel where cells are smaller than the channel height, referred toas the detonable layer height in the following, and the average cell width in thisregion. Cases with single-headed detonation show detonable layer heightslower than 40 mm with less than 2 cells of average width in this region. Transi-tion from single- to multi-headed detonation occurs when the detonable layerheight is larger than about 40 mm. This corresponds to about 2 detonationcells being present in the detonable region. This value is close to the criticallayer height of 3 cells found by Rudy et al. [129] and Gaathaug et al. [50]. Whiledetonation fails in layers of smaller height in semi-confined configurations,the entirely confined channel in the present work still allows for detonationpropagation in the single-headed regime.
177
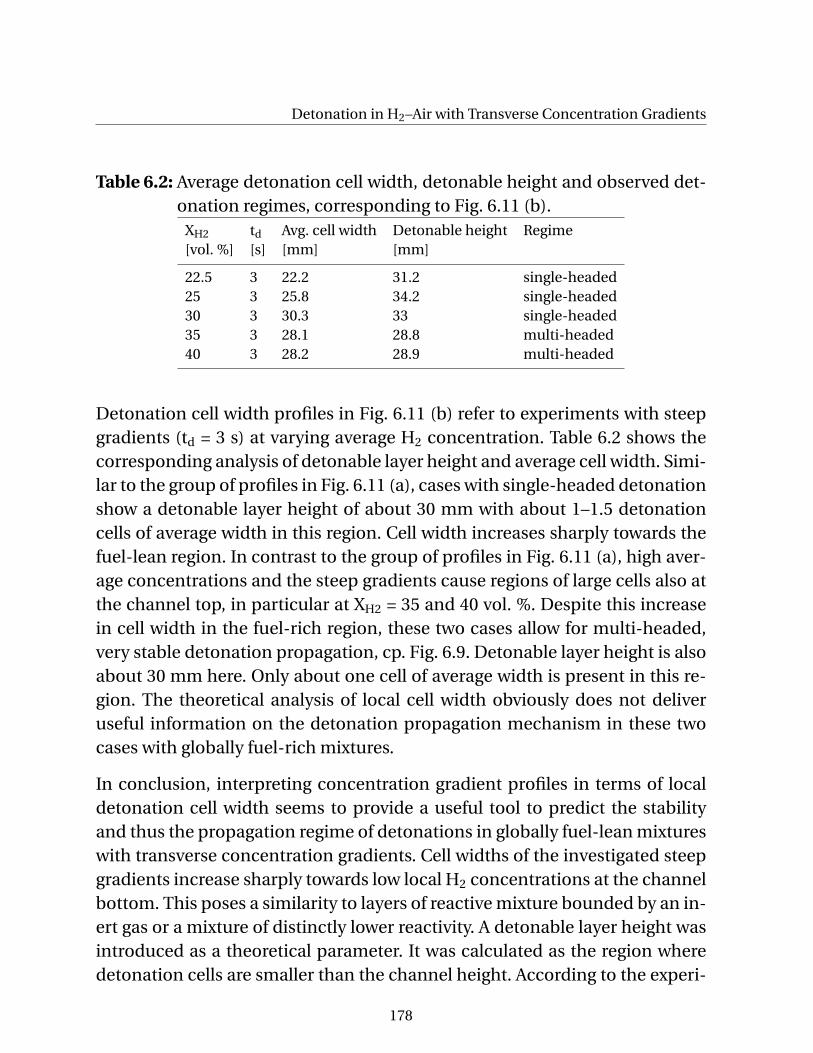
Detonation in H2–Air with Transverse Concentration Gradients
Table 6.2: Average detonation cell width, detonable height and observed det-onation regimes, corresponding to Fig. 6.11 (b).
XH2 td Avg. cell width Detonable height Regime[vol. %] [s] [mm] [mm]
22.5 3 22.2 31.2 single-headed25 3 25.8 34.2 single-headed30 3 30.3 33 single-headed35 3 28.1 28.8 multi-headed40 3 28.2 28.9 multi-headed
Detonation cell width profiles in Fig. 6.11 (b) refer to experiments with steepgradients (td = 3 s) at varying average H2 concentration. Table 6.2 shows thecorresponding analysis of detonable layer height and average cell width. Simi-lar to the group of profiles in Fig. 6.11 (a), cases with single-headed detonationshow a detonable layer height of about 30 mm with about 1–1.5 detonationcells of average width in this region. Cell width increases sharply towards thefuel-lean region. In contrast to the group of profiles in Fig. 6.11 (a), high aver-age concentrations and the steep gradients cause regions of large cells also atthe channel top, in particular at XH2 = 35 and 40 vol. %. Despite this increasein cell width in the fuel-rich region, these two cases allow for multi-headed,very stable detonation propagation, cp. Fig. 6.9. Detonable layer height is alsoabout 30 mm here. Only about one cell of average width is present in this re-gion. The theoretical analysis of local cell width obviously does not deliveruseful information on the detonation propagation mechanism in these twocases with globally fuel-rich mixtures.
In conclusion, interpreting concentration gradient profiles in terms of localdetonation cell width seems to provide a useful tool to predict the stabilityand thus the propagation regime of detonations in globally fuel-lean mixtureswith transverse concentration gradients. Cell widths of the investigated steepgradients increase sharply towards low local H2 concentrations at the channelbottom. This poses a similarity to layers of reactive mixture bounded by an in-ert gas or a mixture of distinctly lower reactivity. A detonable layer height wasintroduced as a theoretical parameter. It was calculated as the region wheredetonation cells are smaller than the channel height. According to the experi-
178
6.5 Discussion
ments, about 2 detonation cells need to be present in the detonable layer to al-low for multi-headed detonation propagation. If the detonable height is lower,single-headed, unstable detonations occur. By further reducing the detonablelayer height by even steeper transverse concentration gradients, failure of det-onation will presumably occur. This could however not be investigated in thepresent work. In globally fuel-rich mixtures an increase in cell size also occursat the channel top. Such profiles are not comparable to a layer of reactive mix-ture anymore. Multi-headed, very stable detonation propagation is possibleeven if the theoretically determined detonable region is rather narrow. Energytransfer between regions of higher and lower reactivity, realized by transversewaves, needs to be investigated in more detail to gain a better understandingof such scenarios.
179
7 Summary and Outlook
The present work investigated the influence of transverse concentration gra-dients on deflagration-to-detonation transition and detonation propagationin H2–air mixtures in a closed rectangular channel. It was part of a German nu-clear reactor safety research program. Only little knowledge is available on thistopic although inhomogeneous mixtures prevail in real-world explosion acci-dent scenarios. This work makes a contribution to explosion safety researchthrough providing a comprehensive experimental study on laboratory scale.This includes all possible explosion regimes from slow deflagration to detona-tion. A particular focus has been placed on the phenomenon of deflagration-to-detonation transition due to its worst-case character. Broad application ofadvanced (laser-) optical measurement techniques at high temporal resolu-tion in conjunction with conventional techniques was one of the major fea-tures of the experimental approach. Separation of the characteristic phases ofdeflagration-to-detonation transition helped to identify the particular influ-ence of gradients in each specific phase. Theoretical approaches supportedthe interpretation of experimental results.
High practical relevance of transverse concentration gradients for
deflagration-to-detonation transition has been found and is summarized
as follows:
• Deflagration-to-detonation transition can be significantly promoted bytransverse concentration gradients. It can occur earlier in terms of aver-age H2 concentration compared to homogeneous mixtures. This means,that an inhomogeneous distribution of a given amount of H2 in air ina given volume may pose a considerably higher explosion hazard thanhomogeneous distribution. Criteria for deflagration-to-detonation tran-sition that are available for homogeneous mixtures can therefore not beconsidered conservative in many real-world situations.
180
• Whether gradients cause stronger explosions mainly depends on theenclosing geometry. It was shown that transverse gradients promotedeflagration-to-detonation transition significantly in an unobstructedchannel. In such a geometry, the maximum local H2 concentration canbe used to compare deflagration-to-detonation transition propensity inhomogeneous and gradient mixtures. By contrast, already a low degree ofobstruction leads to similar lower limits for deflagration-to-detonationtransition in terms of average H2 concentration in gradient and homo-geneous mixtures. The concept of maximum concentration fails in thiscase.
The entire process of deflagration-to-detonation transition was split up intothe flame acceleration phase and the final onset of detonation. These pro-cesses are influenced differently by transverse concentration gradients.
• Transverse concentration gradients influence flame acceleration throughtwo major effects: enlargement of macroscopic flame surface area byflame elongation and variation of effective (integral) flame speed of themixture. The former effect mainly occurs in unobstructed channels andexplains the higher propensity for deflagration-to-detonation transitioncaused by gradients there. Obstructions by contrast hinder flame elonga-tion. The latter has an effect in both unobstructed and obstructed con-figurations.
• When flame elongation is suppressed by the enclosing geometry, like inobstructed configurations, a flame speed cross-over concentration ap-pears at around 24 vol. % H2. This was reproduced analytically by takinginto account the effective (integral) flame speed of the mixture. Flamespeed is defined as the product of laminar burning velocity and expan-sion ratio. Only below the average H2 concentration of 24 vol. %, gradi-ents enforce flame acceleration in terms of flame speed. However, it wasnot observed that gradients promote deflagration-to-detonation in thisconcentration range in obstructed channels. Beyond this point, gradientscause weaker flame acceleration. This automatically reduces the propen-sity for deflagration-to-detonation transition at high H2 concentrations.
181
Summary and Outlook
Trends in deflagration-to-detonation transition propensity were eventuallyexplained by combining insight into the flame acceleration phase, physics anddetailed chemical kinetics of the detonation onset process and the relation be-tween flame Mach number and peak overpressure.
• Onset of detonation by shock reflection at obstacles was studied. Shad-owgraph sequences show that the first and thus crucial step of onset ofdetonation is a strong local explosion at the upstream obstacle surface,caused by reflection of the fast deflagration precursor shock. A 1D modelof shock reflection including detailed chemical kinetics around the ex-tended second explosion limit was used to determine critical conditionsfor the onset of detonation. This showed that local overpressure behindthe fast deflagration precursor shock at the channel top (in the most fuel-rich region) is a crucial parameter that can be used for defining criticalconditions for onset of detonation by shock reflection in an obstructedchannel. It was found that critical local overpressure ranges between 10and 11 bar. This value is nearly independent of H2 concentration andtherefore applies to both homogeneous and gradient mixtures.
• Local overpressure was experimentally correlated with local flame Machnumber at the channel top where the leading tip of flames in gradientmixtures is located. A common correlation for homogeneous and inho-mogeneous mixtures was obtained.
• The preceding steps revealed that flames both in homogeneous and gra-dient mixtures need to accelerate to the same critical flame Mach num-ber to allow for onset of detonation. For gradient mixtures, the localflame Mach number at the channel top needs to be considered. IncreasedH2 concentration at the channel top leads to higher local sound speed.Consequently, higher flame speed needs to be reached in gradient mix-tures compared to homogeneous mixtures before the onset of detona-tion occurs. This can retard the onset of detonation even if flame accel-erarion is enforced by a concentration gradient. This finding directly ex-plains why concentration gradients did not lead to earlier deflagration-to-detonation transition in mixtures below the flame speed cross-overconcentration of 24 vol. % H2 in obstructed configurations.
182
In addition, transverse concentration gradients strongly influence detona-
tion propagation:
• Self-sustained detonation propagation is possible even in mixtures withsteep concentration gradients. Global propagation velocity decreases byup to 9 % in the transverse concentration gradient mixtures under inves-tigation, compared to homogeneous mixtures at equal average H2 con-centration.
• Two detonation regimes were observed experimentally: single-headedpropagation with one strong transverse wave and multi-headed propaga-tion with a constant macroscopic front curvature over time and numer-ous weak transverse waves. The single-headed regime can be interpretedas a near-limit phenomenon similar to spinning detonations. Distinctphases of detonation failure and re-initiation occur, which may explainthe observed global detonation velocity deficit. Low average H2 concen-trations and steep gradients foster the single-headed regime, whereasmixtures at high average H2 concentrations and weak gradients allow formulti-headed detonation propagation.
• A qualitative similarity between detonations in globally fuel-lean mix-tures with transverse concentration gradients to layered mixtures de-scribed in literature was found, which is the sharp increase of theoreti-cally determined local detonation cell width in the most fuel-lean gradi-ent regions. Only if two or more detonation cells are present within thedetonable region (defined as the region where cells are smaller than thechannel height) of a gradient in a globally fuel-lean mixture, detonationsare multi-headed. Globally fuel-rich gradient mixtures cannot be treatedlike layered mixtures anymore since detonation cell width increases bothin the lean and rich parts of the mixture.
Further steps are required to deepen the understanding of transverse con-centration gradient effects. Since flame elongation has been identified as thedominant and thus most hazardous mechanism that enforces flame accelera-tion in gradient mixtures, a particular focus should be placed on this process.
183
Summary and Outlook
Understanding the physics of flame elongation and the transition from elon-gation in unobstructed channels to suppression of elongation in obstructedconfigurations is essential. Small degrees of obstruction should be investi-gated. This work dealt with H2–air mixtures only. A similar influence of trans-verse concentration gradients can be expected for other gases. The final stepswould be to study parallel and multi-dimensional concentration gradients tofurther approach real-world conditions.
184

Appendix
A Concentration Gradient Profiles
Profiles of H2 concentration gradients used in the present work were deter-mined by Ettner [42] by CFD simulation. This appendix provides 4th orderpolynomials describing these profiles for diffusion times td = 3, 5, 7.5 and 10 s.The general notation is as follows:
XH2(y) = p1 ·y4+p2 ·y3
+p3 ·y2+p4 ·y+p5 (A.1)
where y is the vertical position in the channel in [m] according to the coordi-nate system introduced in Sec. 3.1 and pi are polynomial coefficients given inTab. A.1.
186
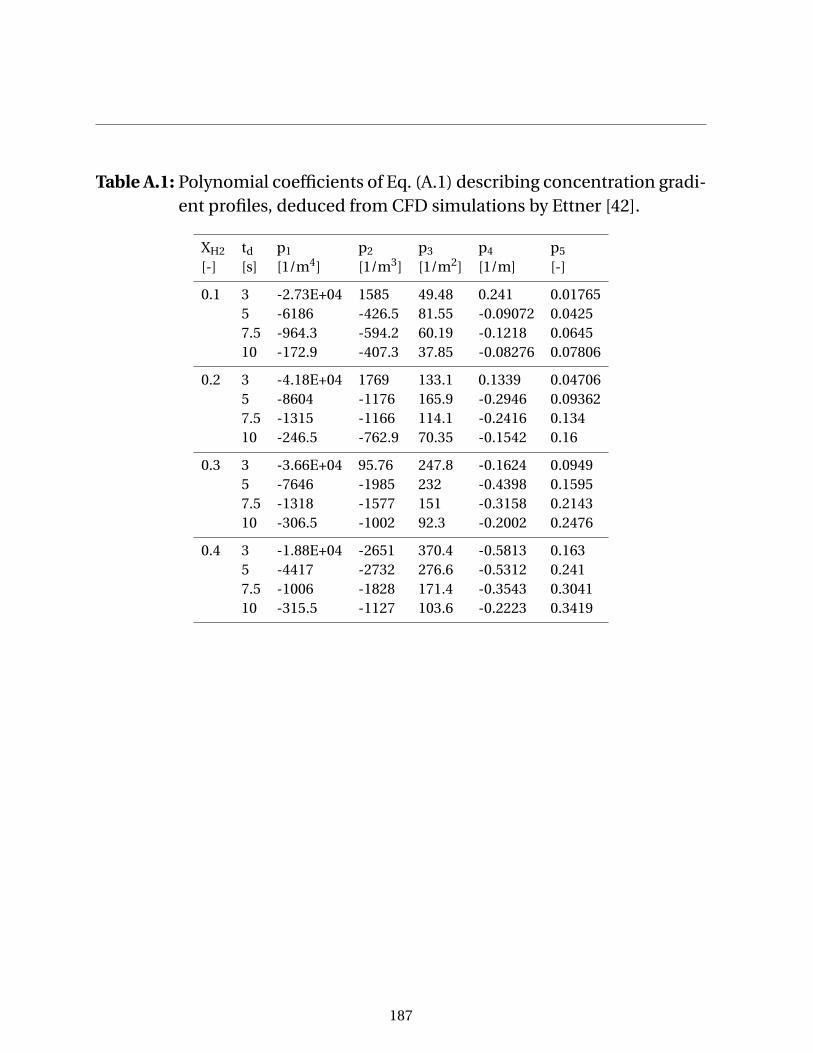
Table A.1: Polynomial coefficients of Eq. (A.1) describing concentration gradi-ent profiles, deduced from CFD simulations by Ettner [42].
XH2 td p1 p2 p3 p4 p5
[-] [s] [1/m4] [1/m3] [1/m2] [1/m] [-]
0.1 3 -2.73E+04 1585 49.48 0.241 0.017655 -6186 -426.5 81.55 -0.09072 0.04257.5 -964.3 -594.2 60.19 -0.1218 0.064510 -172.9 -407.3 37.85 -0.08276 0.07806
0.2 3 -4.18E+04 1769 133.1 0.1339 0.047065 -8604 -1176 165.9 -0.2946 0.093627.5 -1315 -1166 114.1 -0.2416 0.13410 -246.5 -762.9 70.35 -0.1542 0.16
0.3 3 -3.66E+04 95.76 247.8 -0.1624 0.09495 -7646 -1985 232 -0.4398 0.15957.5 -1318 -1577 151 -0.3158 0.214310 -306.5 -1002 92.3 -0.2002 0.2476
0.4 3 -1.88E+04 -2651 370.4 -0.5813 0.1635 -4417 -2732 276.6 -0.5312 0.2417.5 -1006 -1828 171.4 -0.3543 0.304110 -315.5 -1127 103.6 -0.2223 0.3419
187
B Tunable Dye Laser Absorption
Spectroscopy of the OH Q1(6) Line
Spectrally resolved absorption of radiation by OH radicals in an H2–O2 dif-fusion flame at elevated pressure has been investigated by tunable dye laserabsorption spectroscopy (TDLAS) by the author in cooperation with Dipl.-Ing. Thomas Fiala, Institute of Thermodynamics, TUM. A laminar jet flameestablished in an O2 flow and an H2 co-flow was used. The experimental setupallows for raising pressure up to 40 bar. For further details please refer to[43, 44, 46].
The laser system described in Sec. 4.2.2 was employed as source of radiation,delivering a focused beam which was guided through the center of the flame.In this context, the 1.8 pm Full Width at Half Maximum (FWHM) of the UVradiation is of importance since it defines the wavelength resolution of theTDLAS measurement. Wavelength was scanned continuously in the vicinity ofthe Q1(6) transition of the OH radical used in the OH-PLIF measurement in thepresent work. Absorption of radiation through the flame was measured simul-taneously by means of UV-sensitive SiC photodiodes, including one referencediode for correction of variations in laser output power during the wavelengthscanning process.
The purpose of these measurements was to obtain information on the effectof pressure on absorption and furthermore validate simulations presented in[43]. As stated in Sec. 4.2.2, one challenge in conducting OH-PLIF measure-ments of fast flames or even detonations is strong absorption of laser lightwithin the flame.
Figure B.1 shows measured absorption α through the laminar H2–O2 flame asa function of wavelength λ in air and pressure. Absorption strongly dependson pressure. At ambient pressure the absorption characteristics are in good
188
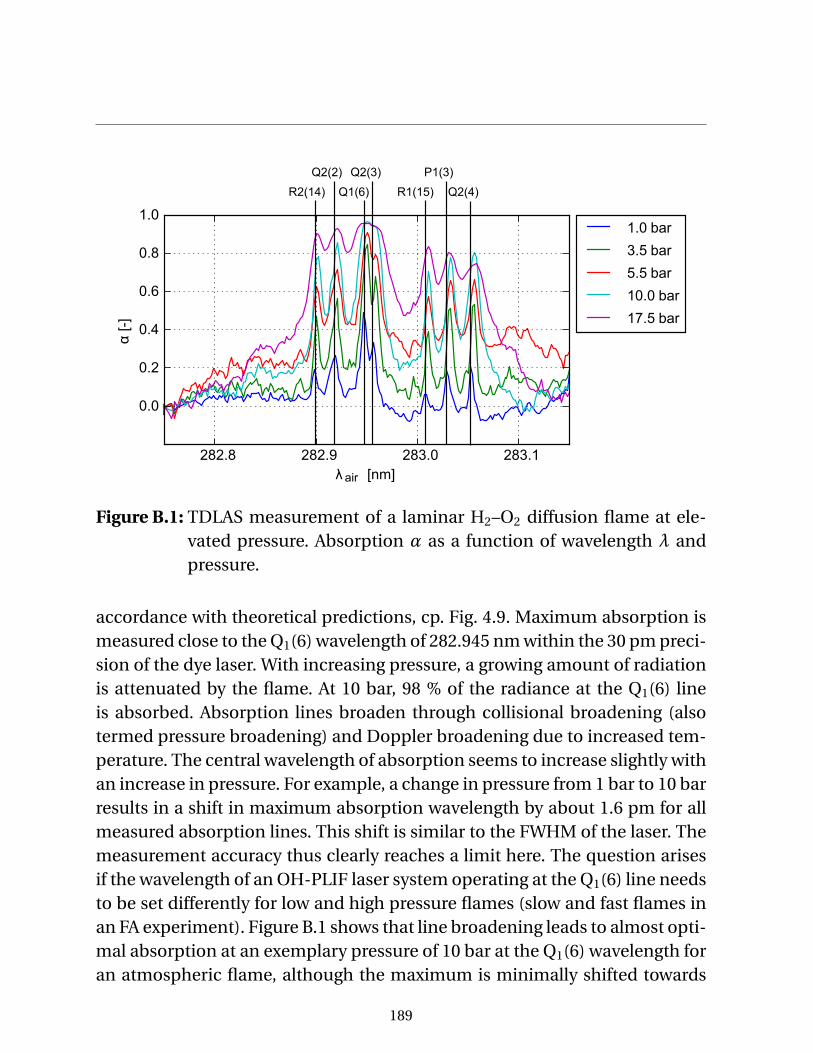
0.0
0.2
0.4
0.6
0.8
1.0
α[-]
282.8 282.9 283.0 283.1
λ air [nm]
1.0 bar
3.5 bar
5.5 bar
10.0 bar
17.5 bar
R2(14)
Q2(2)
Q1(6)
Q2(3)
R1(15)
P1(3)
Q2(4)
Figure B.1: TDLAS measurement of a laminar H2–O2 diffusion flame at ele-vated pressure. Absorption α as a function of wavelength λ andpressure.
accordance with theoretical predictions, cp. Fig. 4.9. Maximum absorption ismeasured close to the Q1(6) wavelength of 282.945 nm within the 30 pm preci-sion of the dye laser. With increasing pressure, a growing amount of radiationis attenuated by the flame. At 10 bar, 98 % of the radiance at the Q1(6) lineis absorbed. Absorption lines broaden through collisional broadening (alsotermed pressure broadening) and Doppler broadening due to increased tem-perature. The central wavelength of absorption seems to increase slightly withan increase in pressure. For example, a change in pressure from 1 bar to 10 barresults in a shift in maximum absorption wavelength by about 1.6 pm for allmeasured absorption lines. This shift is similar to the FWHM of the laser. Themeasurement accuracy thus clearly reaches a limit here. The question arisesif the wavelength of an OH-PLIF laser system operating at the Q1(6) line needsto be set differently for low and high pressure flames (slow and fast flames inan FA experiment). Figure B.1 shows that line broadening leads to almost opti-mal absorption at an exemplary pressure of 10 bar at the Q1(6) wavelength foran atmospheric flame, although the maximum is minimally shifted towards
189
Tunable Dye Laser Absorption Spectroscopy of the OH Q1(6) Line
higher wavelength. This is in good agreement with the author’s experiencewho conducted all OH-PLIF experiments at equal laser wavelength. This con-clusion also applies to detonation investigations.
Please note that absolute numbers of absorption are specific to the particu-lar flame under investigation. General trends are however valid for all flameswhere OH occurs as a minor species. Compared to fast deflagrations in H2–airinvestigated in the present work, the local OH concentration is about one or-der of magnitude higher in the laminar diffusion flame. Absorption has two ef-fects on OH-PLIF measurements: First, laser light is attenuated along its paththrough the flame. This is particularly problematic if the laser light sheet isintroduced transversely into the explosion channel. In the pressure range upto 10 bar, which covers slow and fast deflagrations (cp. Fig. 5.38), absorptionchanges strongly. A clear recommendation is thus to introduce the OH-PLIFlight sheet from the rear wall of an explosion channel, thus in opposite di-rection of flame propagation. This should help to extend the applicability ofOH-PLIF towards faster regimes compared to the present work.
Secondly, fluorescence light is absorbed on its way to the camera (self-absorption), leading to lower signal intensity and quantitative uncertaintybecause of the unknown three-dimensional absorptivity distribution. A thinchannel design or employment of vertical local cookie-cutter plates could beconsidered to decrease self-absorption between the PLIF laser sheet and thecamera. These measures also reduce recorded line-of-sight integrated flameluminescence intensity which tends to exceed the fluorescence intensity infast flame regimes.
190
Previous Publications
Wesentliche Teile dieser Dissertation wurden vom Autor bereits standard-mäßig vorab als Konferenz- und Zeitschriftenbeiträge sowie im Rahmenvon Berichten veröffentlicht. Alle relevanten Vorveröffentlichungen sindentsprechend der gültigen Promotionsordnung ordnungsgemäß gemeldetund anschließend aufgeführt. Sie sind deshalb nicht zwangsläufig im Detaileinzeln referenziert. Vielmehr wurde bei der Referenzierung eigener Vorveröf-fentlichungen Wert auf Verständlichkeit und inhaltlichen Bezug gelegt.
Significant parts of this Ph.D. thesis have been published by the authorbeforehand in conference proceedings, journal papers, and reports. All ofthese relevant prior printed publications are registered according to the validdoctoral regulations and listed below. However, not all of them are quotedexplicitly everywhere as they are part of this present work being official doc-uments. Whether these personal prior printed publications were referenced,depended on maintaining comprehensibility and providing all necessarycontext.
Boeck, L.R., Berger, F.M., Hasslberger, J., Sattelmayer, T., Detonation Propaga-tion in Hydrogen-Air Mixtures with Transverse Concentration Gradients; ShockWaves, Submitted 14/07/2014.
Boeck, L.R., Hasslberger, J., Sattelmayer, T., Flame Acceleration in Hydrogen/AirMixtures with Concentration Gradients; Combustion Science and Technology,Vol. 186, No. 10-11, pages 1650-1661, 2014.
191
PREVIOUS PUBLICATIONS
Boeck, L.R., Berger, F.M., Hasslberger, J., Sattelmayer, T., Detonation Propa-gation in Hydrogen-Air Mixtures with Concentration Gradients; Torus Press,Transient Combustion and Detonation Phenomena: Fundamentals and Appli-cations, 2014.
Boeck, L.R., Msalmi, M., Koehler, F., Hasslberger, J., Sattelmayer, T., Criteria forDDT in Hydrogen-Air Mixtures with Concentration Gradients; 10th Interna-tional Symposium on Hazards, Prevention and Mitigation of Industrial Explo-sions, Bergen, Norway, 2014.
Boeck, L.R., Hasslberger, J., Ettner, F., Sattelmayer, T., Investigation of Peak Pres-sures during Explosive Combustion of Inhomogeneous Hydrogen-Air Mixtures;Proceedings of the 7th International Seminar on Fire and Explosion Hazards,Providence, RI, USA, 2013.
Boeck, L.R., Primbs, A., Hasslberger, J., Ettner, F., Sattelmayer, T., Influence ofConcentration Gradients on Detonation Velocities in Hydrogen-Air Mixtures;International Conference on Combustion and Explosion, Ramsau, Austria,2013.
Boeck, L.R., Hasslberger, J., Sattelmayer, T., Explosive Combustion of Homoge-neous and Inhomogeneous Hydrogen-Air Mixtures – Experimental Observa-tions and Conclusions for Safety Applications; 3rd Colloquium of the MunichSchool of Engineering, Garching, Germany, 2013.
Boeck, L.R., Berger, F.M., Hasslberger, J., Ettner, F., Sattelmayer, T., MacroscopicStructure of Fast Deflagrations and Detonations in Hydrogen-Air Mixtures withConcentration Gradients; 24th International Colloquium on the Dynamics ofExplosions and Reactive Systems, Taipei, Taiwan, 2013.
Boeck, L.R., Hasslberger, J., Ettner, F., Sattelmayer, T., Flame Acceleration inHydrogen-Air Mixtures with Concentration Gradients; 24th International Col-loquium on the Dynamics of Explosions and Reactive Systems, Taipei, Taiwan,2013.
Boeck, L.R., Primbs, A., Hasslberger, J., Sattelmayer, T., Investigation of FlameAcceleration in a Duct Using the OH PLIF Technique at High Repetition Rate;Lasermethoden in der Strömungsmesstechnik, Munich, Germany, 2013.
192
PREVIOUS PUBLICATIONS
Boeck, L.R., Hasslberger, J., Sattelmayer, T., Flammenbeschleunigung undDeflagrations-Detonations-Übergang in Wasserstoff-Luft Gemischen mitKonzentrationsgradienten; 26. Deutscher Flammentag, Duisburg, Germany,2013.
193
Supervised Student Theses
Im Rahmen dieser Dissertation entstanden am Lehrstuhl für Thermody-namik, Technische Universität München, in den Jahren 2011 bis 2014 unterwesentlicher wissenschaftlicher, fachlicher und inhaltlicher Anleitung desAutors die im Folgenden aufgeführten studentischen Arbeiten. In ihnenwurden verschiedene Fragestellungen zur Explosionssicherheit untersucht.Ergebnisse aus diesen Arbeiten sind in Teilen in das vorliegende Doku-ment eingeflossen. Der Autor dankt hiermit explizit allen ehemals betreutenStudenten für ihr Engagement bei der Unterstützung des hier behandeltenForschungsprojekts sowie der damit verknüpften Dissertation.
Several "student theses" emerged from the research project behind thepresent work, listed below. These student projects were conducted at theLehrstuhl für Thermodynamik, Technische Universität München, in the years2011 through 2014 under close supervision of the author of this Ph.D. thesiswith regard to academic, professional, and context-related concerns. Variousissues were investigated contributing to explosion safety research. The authorwould like to express his sincere gratitude to all formerly supervised studentsfor their commitment and support of this research project and of the Ph.D.thesis at hand.
194
SUPERVISED STUDENT THESES
Student Thesis title, submission date
Frederik Berger Fast Deflagration and Detonation Phenomena in Hydrogen-Air Mix-tures with Concentration Gradients, 11/06/2013
Frederik Berger Evaluation of High Pressure Water Atomisation for Detonation Cham-bers Using Fuel-Injection Nozzles, 28/10/2012
Ben Flocke Modellierung von Flammenbeschleunigung in H2-Luft Gemischenmit Konzentrationsgradienten, 01/07/2013
Juan Hasbun Optische Untersuchung des Einflusses von Blockierrate und Konzen-trationsgradienten auf Flammenbeschleunigung und DDT inWasserstoff-Luft-Gemischen, 02/12/2013
Andreas Kink Explosion of Wet Hydrogen-Air Mixtures in a Closed Channel,20/09/2014
Thomas Knapp Entwicklung einer Eindüsungsmethode für Wassertröpfchen in einenExplosionskanal, 20/06/2013
Franziska Köhler Übergang von Deflagration zu Detonation in einem glatten Kanalunter Einfluss von Konzentrationsgradienten, 27/09/2013
Stanislav Mironov Numerische Simulation der Eindüsung flüssigen Wassers in einen Ex-plosionskanal, 15/06/2013
Soumaya Msalmi Velocity and Overpressure of Confined Flame Propagation inHydrogen-Air Mixtures with Concentration Gradients, 04/12/2013
Denizhan Oezdin Theoretische und experimentelle Analyse von Explosionen in H2-LuftGemischen mit flüssigem Wasser, 05/10/2014
Andreas Primbs Anwendung der High-speed OH-PLIF Technik zur Charakterisierungvon Verbrennungsvorgängen, 15/06/2013
Andreas Primbs Implementierung und Anwendung einer Methode zur Auswertungvon Explosionsversuchen, 31/10/2012
Markus Scholz Untersuchung der Flammenausbreitung in H2-Luft-Gemischen mitMischungsgradienten, 30/06/2012
Felix Will Konzeptfindung für die Einbringung disperser Wassertropfen ineinen Explosionskanal mit anschließender experimenteller und nu-merischer Untersuchung, 30/06/2012
195
Bibliography
[1] J. D. Anderson. Modern Compressible Flow with Historical Perspective.McGraw Hill Higher Education, 2004.
[2] J. M. Austin. The Role of Instability in Gaseous Detonation. PhD thesis,California Institute of Technology, 2003.
[3] A. M. Bartenev and B. E. Gelfand. Spontaneous Initiation of Detona-tions. Progress in Energy and Combustion Science, 26:29–55, 2000.
[4] F. E. Belles. Detonability and Chemical Kinetics: Prediction of Limits ofDetonability of Hydrogen. Symposium (International) on Combustion,7:745–751, 1958.
[5] W. B. Benedick, R. Knystautas, and J. H. S. Lee. Large-Scale Experimentson the Transmission of Fuel-Air Detonations from Two-DimensionalChannels. Technical report, Sandia National Labs., Albuquerque, NM(USA); McGill Univ., Montreal, Quebec (Canada). Dept. of MechanicalEngineering, 1983.
[6] A. Bleyer, J. Taveau, N. Djebaïli-Chaumeix, C. E. Paillard, and A. Bentaib.Comparison Between FLACS Explosion Simulations and ExperimentsConducted in a PWR Steam Generator Casemate Scale Down with Hy-drogen Gradients. Nuclear Engineering and Design, 245:189–196, 2012.
[7] R. Borghi. On the Structure and Morphology of Turbulent PremixedFlames. In Recent advances in the Aerospace Sciences, pages 117–138.Springer, 1985.
[8] A. A. Borisov, S. V. Khomik, V. N. Mikhalkin, and E. V. Saneev. Critical
196
BIBLIOGRAPHY
Energy of Direct Detonation Initiation in Gaseous Mixtures. Progress inAstronautics and Aeronautics, 133:142–155, 1991.
[9] U. Brackmann. Lambdachrome Laser Dyes: Data Sheets. Lambda PhysikGmbH, 1994.
[10] D. Bradley and C. M. Harper. The Development of Instabilities in Lami-nar Explosion Flames. Combustion and Flame, 99:562–572, 1994.
[11] D. Bradley, C. G. W. Sheppart, R. Woolley, D. A. Greenhalgh, and R. D.Lockett. The Development and Structure of Flame Instabilities andCellularity at low Markstein Numbers in Explosions. Combustion andFlame, 122:195–209, 2000.
[12] W. Breitung, C. K. Chan, S. B. Dorofeev, A. Eder, B. E. Gelfand, M. Heitsch,R. Klein, A. Malliakos, J. E. Shepherd, and E. Studer. Flame Accelera-tion and Deflagration-to-Detonation Transition in Nuclear Safety. State-of-the-Art Report by a Group of Experts, OECD Nuclear Energy Agency,NEA/CSNI, 2000.
[13] M. Brouillette. The Richtmyer-Meshkov Instability. Annual Review ofFluid Mechanics, 34:445–468, 2002.
[14] M. J. Brown, I. C. McLean, D. B. Smith, and S. C. Taylor. MarksteinLengths of CO/H2/Air Flames, Using Expanding Spherical Flames. InSymposium (International) on Combustion, volume 26, pages 875–881.Elsevier, 1996.
[15] S. Browne, Z. Liang, and J. E. Shepherd. Detailed and Simplified Chemi-cal Reaction Mechanisms for Detonation Simulation. Fall 2005 WesternStates Section of the Combustion Institute, 2005.
[16] W. H. Calhoon and N. Sinha. Detonation Wave Propagation in Concen-tration Gradient. In Proc. 43rd AIAA Aerospace Sciences Meeting and Ex-hibit, Reno, NV, 2005.
[17] M. N. Carcassi. Deflagration Tests of an Air-Hydrogen-Steam Mixturewith not Uniformly Distributed Steam. Technical report, Commissionof the European Communities, 1992.
197
BIBLIOGRAPHY
[18] D. L. Chapman. On the Rate of Explosion in Gases. Philosophical Mag-azine, 47:90–104, 1899.
[19] H. Cheikhravat, M. Yahyaoui, A. Barret, N. Chaumeix, and C. E. Paillard.Influence of Hydrogen Distribution on Flame Propagation. In 3rd Euro-pean Combustion Meeting, 2007.
[20] G. Ciccarelli and S. B. Dorofeev. Flame Acceleration and Transition toDetonation in Ducts. Progress in Energy and Combustion Science, 34:499–550, 2008.
[21] G. Ciccarelli, C. T. Johansen, and M. Parravani. Shock-Flame Interac-tions on Flame Acceleration in an Obstacle Laden Channel. Combustionand Flame, 157:2125–2136, 2010.
[22] P. Clavin. Dynamic Behavior of Premixed Flame Fronts in Laminar andTurbulent Flows. Progress in Energy and Combustion Science, 11:1–59,1985.
[23] N. Cohen. Flammability and Explosion Limits of H2 and H2/CO: A Liter-ature Review. Technical report, DTIC Document, 1992.
[24] H. F. Coward and G. W. Jones. Limits of Flammability of Gases and Va-pors. Technical report, DTIC Document, 1952.
[25] E. K. Dabora, J. A. Nicholls, and R. B. Morrison. The Influence of aCompressible Boundary on the Propagation of Gaseous Detonations. InSymposium (International) on Combustion, volume 10, pages 817–830.Elsevier, 1965.
[26] G. Darrieus. Unpublished work presented at La Technique Moderne,and at Le Congrès de Mécanique Appliquée (1945) and (1938).
[27] J. Daubech, I. Sochet, and C. Proust. Highlights of the Flame Accel-eration in a Confined Nonuniform H2/O2/N2 Mixture. Process SafetyProgress, 29:224–230, 2010.
[28] Y. N. Denisov and Y. K. Troshin. Pulsating and Spinning Detonation ofGaseous Mixtures in Tubes. In Proceedings of the USSR Academy of Sci-ences, volume 125, pages 110–113, 1959.
198
BIBLIOGRAPHY
[29] G. Dixon-Lewis. Kinetic Mechanism, Structure and Properties of Pre-mixed Flames in Hydrogen-Oxygen-Nitrogen Mixtures. PhilosophicalTransactions for the Royal Society of London. Series A, Mathematical andPhysical Sciences, 292:45–99, 1979.
[30] S. B. Dorofeev. Flame Acceleration and Explosion Safety Applications.Proceedings of the Combustion Institute, 33:2161–2175, 2011.
[31] S. B. Dorofeev, V. P. Sidorov, M. S. Kuznetsov, I. D. Matsukov, and V. I.Alekseev. Effect of Scale on the Onset of Detonations. Shock Waves, 10:137–149, 2000.
[32] S. B. Dorofeev, M. S. Kuznetsov, V. I. Alekseev, A. A. Efimenko, and W. Bre-itung. Evaluation of Limits for Effective Flame Acceleration in HydrogenMixtures. Journal of Loss Prevention in the Process Industries, 14:583–589, 2001.
[33] J. E. Dove and T. D. Tribbeck. Computational Study of the Kinetics ofthe Hydrogen-Oxygen Reaction Behind Steady State Shock Waves. Ap-plication to the Composition Limits and Transverse Stability of GaseousDetonations. Acta Astronautica, 15:387–397, 1970.
[34] D. R. Dowdy, D. B. Smith, S. C. Taylor, and A. Williams. The use of ex-panding spherical flames to determine burning velocities and stretcheffects in hydrogen/air mixtures. In Symposium (International) on Com-bustion, volume 23, pages 325–332. Elsevier, 1991.
[35] W. Döring. Über den Detonationsvorgang in Gasen. Annalen der Physik,435:421–436, 1943.
[36] M. P. Dumitrescu, L. Labracherie, Y. Burtschell, and L. Houas. Protect-ing Pressure Gauges with Grease in High Temperature Facilities. ShockWaves, 2:269–271, 1992.
[37] E. Dzieminska and A. K. Hayashi. Auto-ignition and DDT driven byshock wave–Boundary layer interaction in oxyhydrogen mixture. Inter-national Journal of Hydrogen Energy, 38:4185–4193, 2013.
[38] R. Eckhoff. Explosion Hazards in the Process Industries. Elsevier, 2013.
199
BIBLIOGRAPHY
[39] A. Eder. Brennverhalten schallnaher und überschall-schnellerWasserstoff-Luft Flammen. PhD thesis, Lehrstuhl für Thermodynamik,Technische Universität München, 2001.
[40] F. Ettner, K. G. Vollmer, and T. Sattelmayer. Influence of Mixture Gra-dients and Lateral Venting on Flame Acceleration and Detonation inChannels. Technical report, Lehrstuhl für Thermodynamik, TechnischeUniversität München, 2011.
[41] F. Ettner, K. G. Vollmer, and S. T. Mach Reflaction in Detonations Propa-gating Through a Gas With a Concentration Gradient. Shock Waves, 23:201–206, 2013.
[42] F. A. Ettner. Effiziente numerische Simulation des Deflagra-tions–Detonations–Übergangs. PhD thesis, Lehrstuhl für Thermo-dynamik, Technische Universität München, 2013.
[43] T. Fiala. Radiation from High Pressure Hydrogen-Oxygen Flames and itsUse in Assessing Rocket Combustion Instability. PhD thesis, Lehrstuhlfür Thermodynamik, Technische Universität München, 2015.
[44] T. Fiala and T. Sattelmayer. Heat Release and OH* Radiation in Lami-nar Non-Premixed Hydrogen-Oxygen Flames. In American Institute ofAeronautics and Astronautics, 51st AIAA Aerospace Sciences Meeting in-cluding the New Horizons Forum and Aerospace Exposition, 2013.
[45] T. Fiala and T. Sattelmayer. A Posteriori Computation of OH* Radiationfrom Numerical Simulations in Rocket Combustion Chambers. In 5thEuropean Conference for Aeronautics and Space Sciences, 2013.
[46] T. Fiala, M. Nettinger, F. Rieger, A. Kumar, and T. Sattelmayer. Emissionand Absorption Measurement in Enclosed Round Jet Flames. In ISFV16-1138, 16th International Symposium on Flow Visualization, 2014.
[47] T. Fiala and T. Sattelmayer. On the Use of OH* Radiation as a Marker forthe Heat Release Rate in High-Pressure Hydrogen-Oxygen Liquid RocketCombustion. In 49th AIAA/ASME/SAE/ASEE Joint Propulsion Conferenceand Exhibit, 2013.
200
BIBLIOGRAPHY
[48] R. W. Fox, A. T. McDonald, and P. J. Pritchard. Introduction to Fluid Me-chanics, volume 5. John Wiley & Sons New York, 1998.
[49] A. V. Gaathaug. Personal Communication. Telemark University College,Faculty of Technology, Porsgrunn, Norway, June 2014.
[50] A. V. Gaathaug, K. Vaagsaether, and D. Bjerketvedt. Detonation Prop-agation in a Reactive Layer; The Role of Detonation Front Stability. InProceedings of the 10th International Symposium on Hazards, Preven-tion and Mitigation of Industrial Explosions, 2014.
[51] V. N. Gamezo, T. Ogawa, and E. S. Oran. Flame Acceleration and DDT inChannels with Obstacles: Effect of Obstacle Spacing. Combustion andFlame, 155:302–315, 2008.
[52] V. N. Gamezo, T. Ogawa, and E. S. Oran. Deflagration-to-DetonationTransition in H2-Air Mixtures: Effect of Blockage Ratio. AIAA Paper, 440,2009.
[53] A. I. Gavrikov, A. A. Efimenko, and S. B. Dorofeev. A Model for Deto-nation Cell Size Prediction from Chemical Kinetics. Combustion andFlame, 120:19–33, 2000.
[54] I. Glassman. Combustion. Academic press, 1997.
[55] D. G. Goodwin, H. K. Moffat, and R. L. Speth. Cantera: An Object-oriented Software Toolkit for Chemical Kinetics, Thermodynamics, andTransport Processes. ❤tt♣✿✴✴✇✇✇✳❝❛♥t❡r❛✳♦r❣, 2014. Version 2.1.2.
[56] J. Grune, K. Sempert, H. Haberstroh, M. S. Kuznetsov, and T. Jordan.Experimental Investigation of Hydrogen–Air Deflagrations and Detona-tions in Semi-Confined Flat Layers. Journal of Loss Prevention in theProcess Industries, 26:317–323, 2013.
[57] C. M. Guirao, R. Knystautas, J. H. S. Lee, W. Benedick, and M. Berman.Hydrogen-Air Detonations. In Symposium (International) on Combus-tion, volume 19, pages 583–590. Elsevier, 1982.
201
BIBLIOGRAPHY
[58] R. Hall, A. R. Masri, P. Yaroshchyk, and S. S. Ibrahim. Effects of Posi-tion and Frequency of Obstacles on Turbulent Premixed PropagatingFlames. Combustion and Flame, 156:439–446, 2009.
[59] High-Speed Gated Image Intensifier C10880-03. Hamamatsu PhotonicsK.K., Iwata City, Japan, 2014.
[60] P. Hariharan. Basics of Interferometry. Academic Press, 2010.
[61] J. Hasslberger, L. R. Boeck., and T. Sattelmayer. Numerical Simula-tion of Deflagration-to-Detonation Transition in Large Confined Vol-umes. Journal of Loss Prevention in the Process Industries, online first11/28/2014.
[62] M. Hertzberg. Selective Diffusional Demixing: Occurrence and Size ofCellular Flames. Progress in Energy and Combustion Science, 15:203–239, 1989.
[63] K. Inaba, M. Yamamoto, J. E. Shepherd, and A. Matsuo. Soot Track For-mation by Shock Wave Propagation. In International Conference onComputational and Experimental Engineering and Sciences, volume 4,pages 41–46, 2007.
[64] K. Ishii and M. Kojima. Behavior of Detonation Propagation in Mixtureswith Concentration Gradients. Shock Waves, 17:95–102, 2007.
[65] C. T. Johansen. Experimental and Numerical Investigation of Flame Ac-celeration in an Obstructed Channel. PhD thesis, Queen’s University,2009.
[66] R. C. Jones. A new Calculus for the Treatment of Optical Systems. Journalof the Optical Society of America A, 31:488–493, 1941.
[67] M. Jordan. Zündung und Verbrennung in vorgemischten turbulentenFreistrahlen. PhD thesis, Lehrstuhl A für Thermodynamik, TechnischeUniversität München, 1999.
[68] E. Jouguet. Sur la Propagation des Réactions Chimiques dans les Gaz.Journal de Mathématiques Pures et Appliquées, 1:347–425, 1905.
202
BIBLIOGRAPHY
[69] M. Kaneshige and J. E. Shepherd. Detonation Database. Technical re-port, Technical Report FM97-8, GALCIT, 1997.
[70] B. Karlovitz, D. W. Denniston, and F. E. Wells. Investigation of TurbulentFlames. The Journal of Chemical Physics, 19:541–547, 1951.
[71] B. Karlovitz, D. W. Denniston Jr, D. H. Knapschaefer, and F. E. Wells. Stud-ies on Turbulent flames: A. Flame Propagation Across velocity gradientsB. turbulence Measurement in flames. In Symposium (International) onCombustion, volume 4, pages 613–620. Elsevier, 1953.
[72] V. P. Karpov, A. N. Lipatnikov, and P. Wolanski. Finding the Mark-stein Number using the Measurements of Expanding Spherical LaminarFlames. Combustion and Flame, 109:436–448, 1997.
[73] R. J. Kee, F. M. Rupley, and J. A. Miller. The Chemkin ThermodynamicData Base. Technical report, Sandia National Labs., Livermore, CA(USA), 1990.
[74] M. Kellenberger and G. Ciccarelli. Propagation Mechanisms of Super-sonic Combustion Waves. Proceedings of the Combustion Institute, 2014.
[75] D. A. Kessler, V. N. Gamezo, and E. S. Oran. Gas-Phase Detonation Prop-agation in Mixture Composition Gradients. Philosophical Transactionsof the Royal Society A: Mathematical, Physical and Engineering Sciences,370:567–596, 2012.
[76] A. M. Khokhlov, E. S. Oran, and G. O. Thomas. Numerical Simulationof Deflagration-to-Detonation Transition: the Role of Shock–Flame In-teractions in Turbulent Flames. Combustion and Flame, 117:323–339,1999.
[77] K. Kohse-Höinghaus and J. B. Jeffries. Applied Combustion Diagnostics.Taylor & Francis New York, 2002.
[78] A. N. Kolmogorov. A Refinement of Previous Hypotheses Concerning theLocal Structure of Turbulence in a Viscous Incompressible Fluid at HighReynolds Number. Journal of Fluid Mechanics, 13:82–85, 1962.
203
BIBLIOGRAPHY
[79] A. N. Kolmogorov. The Local Structure of Turbulence in IncompressibleViscous Fluid for very Large Reynolds Numbers. In Proceedings of theUSSR Academy of Sciences, volume 30, pages 299–303, 1941.
[80] A. N. Kolmogorov. Dissipation of Energy in Locally Isotropic Turbulence.In Proceedings of the USSR Academy of Sciences, volume 32, pages 16–18,1941.
[81] A. A. Konnov. Remaining Uncertainties in the Kinetic Mechanism of Hy-drogen Combustion. Combustion and Flame, 152:507–528, 2008.
[82] A. Kotchourko. Hydrogen Safety Research Priorities. In InternationalConference on Hydrogen Safety, 2013.
[83] J. C. Krok. One-Dimensional Flame Propagation Mechanisms. Unpub-lished notes on the solution of ideal steady high-speed flames. RPI, Troy,NY., 1991.
[84] A. Kumamoto, H. Iseki, R. Ono, and T. Oda. Measurement of MinimumIgnition Energy in Hydrogen-Oxygen-Nitrogen Premixed Gas by SparkDischarge. In 13th International Conference on Electrostatics, 2011.
[85] M. S. Kuznetsov, T. Jordan, and J. Grune. Combustion Regimes in a Strat-ified Layer of Hydrogen-Air Mixture. In Proceedings of InternationalConference on Advances in Nuclear Power Plants, 2011.
[86] J. R. Lakowicz. Principles of Fluorescence Spectroscopy. Springer, 2007.
[87] A. K. W. Lam, J. Austin, F. Pintgen, E. Wintenberger, J. E. Shepherd, K. In-aba, and A. Matsuo. On the Mechanism of Soot Track Formation: Ex-perimental Study. In 19th International Colloquium on the Dynamics ofExplosions and Reactive Systems, 2003.
[88] L. D. Landau. On the Theory of Slow Combustion. Acta PhysicochimicaURSS, 19:77–85, 1944.
[89] M. R. W. Lauer. Determination of the Heat Release Distribution in Tur-bulent Flames by Chemiluminescence Imaging. PhD thesis, Lehrstuhl fürThermodynamik, Technische Universität München, 2011.
204
BIBLIOGRAPHY
[90] C. K. Law. Dynamics of Stretched Flames. In Symposium (International)on Combustion, volume 22, pages 1381–1402. Elsevier, 1989.
[91] C. K. Law. Combustion Physics. Cambridge University Press, 2006.
[92] D. Lee and S. Hochgreb. Hydrogen Autoignition at Pressures Above theSecond Explosion limit (0.6–4.0 MPa). International Journal of ChemicalKinetics, 30:385–406, 1998.
[93] J. H. S. Lee. The Detonation Phenomenon. Cambridge University Press,2008.
[94] J. H. S. Lee and A. J. Higgins. Comments on Criteria for Direct Initia-tion of Detonation. Philosophical Transactions of the Royal Society ofLondon. Series A: Mathematical, Physical and Engineering Sciences, 357:3503–3521, 1999.
[95] J. H. S. Lee, R. Knystautas, and N. Yoshikawa. Photochemical Initiationof Gaseous Detonations. Acta Astronautica, pages 971–982, 1978.
[96] B. Lewis and G. von Elbe. Combustion, Flames and Explosion of Gases.Academic Press, New York, 1987.
[97] D. H. Lieberman and J. E. Shepherd. Detonation Interaction with a Dif-fuse Interface and Subsequent Chemical Reaction. Shock Waves, 16:421–429, 2007.
[98] H. W. Liepmann and A. Roshko. Elements of Gasdynamics. CourierDover Publications, 1957.
[99] J. C. Liu, M. Sichel, and C. W. Kauffman. The Lateral Interaction of Det-onating and Detonable Gaseous Mixtures. Progress in Astronautics andAeronautics, 114:264–283, 1988.
[100] J. Luque and D. R. Crosley. LIFBASE: Database and Spectral SimulationProgram (Version 1.5). Technical report, SRI International Report MP99-009, 1999.
205
BIBLIOGRAPHY
[101] H. Mark. The Interaction of a Reflected Shock Wave with the BoundaryLayer in a Shock Tube. Technical report, Cornell University, New York,1958.
[102] G. H. Markstein. Experimental and Theoretical Studies of Flame-FrontStability. Journal of the Aeronautical Sciences, 18:199–209, 1951.
[103] F. Mayinger, O. Feldmann, U. Glückert, and R. Schmidt. Optical Mea-surements: Techniques and Applications. Springer, Berlin, 2001.
[104] J. Melguizo-Gavilanes and L. Bauwens. A Comparison Between Con-stant Volume Induction Times and Results from Spatially Resolved Sim-ulation of Ignition Behind Reflected Shocks: Implications for ShockTube Experiments. Shock Waves, 23:221–231, 2013.
[105] E. E. Meshkov. Instability of the Interface of two Gases Accelerated by aShock wave. Fluid Dynamics, 4:101–104, 1969.
[106] R. Mével, S. Pichon, L. Catoire, N. Chaumeix, C. E. Paillard, and J. E.Shepherd. Dynamics of excited hydroxyl radicals in hydrogen-basedmixtures behind reflected shock waves. Proceedings of the CombustionInstitute, 34:677–684, 2013.
[107] D. C. Morton. Atomic Data for Resonance Absorption Lines. I - Wave-lengths Longward of the Lyman Limit. Astrophysical Journal Supple-ment Series, 77:119–202, 1991.
[108] H. D. Ng, Y. Ju, and J. H. S. Lee. Assessment of Detonation Hazards inHigh-Pressure Hydrogen Storage from Chemical Sensitivity Analysis. In-ternational Journal of Hydrogen Energy, 32:93–99, 2007.
[109] M. Ó Conaire, H. J. Curran, J. M. Simmie, W. J. Pitz, and C. K. Westbrook.A Comprehensive Modeling Study of Hydrogen Oxidation. InternationalJournal of Chemical Kinetics, 36:603–622, 2004.
[110] A. K. Oppenheim and R. I. Soloukhin. Experiments in Gasdynamics ofExplosions. Annual Review of Fluid Mechanics, 5:31–58, 1973.
206
BIBLIOGRAPHY
[111] E. S. Oran and V. N. Gamezo. Origins of the Deflagration-to-DetonationTransition in Gas-Phase Combustion. Combustion and Flame, 148:4–47,2007.
[112] E. S. Oran, D. Jones, and M. Sichel. Numerical Simulations of Detona-tion Transmission. Proceedings of the Royal Society of London. Series A:Mathematical and Physical Sciences, 436:267–297, 1992.
[113] M. E. Pate-Cornell. Risk Analysis and Risk Management for OffshorePlatforms: Lessons from the Piper Alpha Accident. Journal of OffshoreMechanics and Arctic Engineering, 115:179–190, 1993.
[114] P. Pelcé and A. Libchaber. Dynamics of Curved Fronts. Elsevier, 1989.
[115] O. G. Penyazkov, K. L. Sevrouk, and K. Allhusan. Auto-Ignition ofHydrogen-Air Mixture at Nonuniform Flow and Boundary Conditions.Proceedings of the European Combustion Meeting, 2009.
[116] N. Peters. The Turbulent Burning Velocity for Large-Scale and Small-Scale Turbulence. Journal of Fluid Mechanics, 384:107–132, 1999.
[117] N. Peters. Turbulent Combustion. Cambridge University Press, 2000.
[118] E. L. Petersen and R. K. Hanson. Nonideal Effects Behind ReflectedShock Waves in a High-Pressure Shock Tube. Shock Waves, 10:405–420,2001.
[119] Ultima APX i2. Photron Inc., San Diego, USA, 2014.
[120] Fastcam SA5. Photron Inc., San Diego, USA, 2014.
[121] Fastcam SA-X. Photron Inc., San Diego, USA, 2014.
[122] F. Pintgen. Detonation Diffraction in Mixtures with Various Degrees ofInstability. PhD thesis, California Institute of Technology, 2004.
[123] S. B. Pope. Turbulent Flows. Cambridge University Press, 2000.
[124] J. W. Rayleigh. The Theory of Sound, volume 2. Macmillan, 1896.
207
BIBLIOGRAPHY
[125] O. Reynolds. On the Dynamical Theory of Incompressible Viscous Flu-ids and the Determination of the Criterion. Philosophical Transactionsof the Royal Society of London. A, pages 123–164, 1895.
[126] R. D. Richtmyer. Taylor Instability in Shock Acceleration of Compress-ible Fluids. Communications on Pure and Applied Mathematics, 13:297–319, 1960.
[127] R. E. Robinson. Dynamic Response of High-Frequency Pressure Trans-ducers to Large Amplitude Sinusoidal Pressure Oscillations. NASA con-tractor report. National Aeronautics and Space Administration, 1972.
[128] M. Rogovin. Three Mile Island: A Report to the Commissioners and tothe Public. Technical report, Nuclear Regulatory Commission, 1979.
[129] W. Rudy, M. S. Kuznetsov, R. Porowski, A. Teodorczyk, J. Grune, andK. Sempert. Critical Conditions of Hydrogen-Air Detonation in PartiallyConfined Geometry. Proceedings of the Combustion Institute, 34:1965–1972, 2013.
[130] G. S. Settles. Toepler’s Schlieren Technique. In Schlieren andShadowgraph Techniques, Experimental Fluid Mechanics, pages 39–75.Springer, 2001.
[131] J. E. Shepherd. Chemical Kinetics of Hydrogen-Air-Diluent Detonations.Dynamics of Explosions, pages 263–293, 1986.
[132] J. E. Shepherd. Detonation in Gases. Proceedings of the CombustionInstitute, 32:83–98, 2009.
[133] J. E. Shepherd. Shock and Detonation Toolbox. ❤tt♣✿✴✴❣❛❧❝✐t✳
❝❛❧t❡❝❤✳❡❞✉✴❊❉▲✴♣✉❜❧✐❝✴❝❛♥t❡r❛✴❤t♠❧✴❙❉❴❚♦♦❧❜♦①✴, Last access30/08/2014.
[134] Credo Dye Laser. Sirah Lasertechnik GmbH, Grevenbroich, Germany,2014.
[135] R. S. Sirohi and H. C. R. Krishna. Mechanical Measurements. Wiley, 1991.
208
BIBLIOGRAPHY
[136] I. Sochet, F. Guelon, and P. Gillard. Deflagrations of Non-Uniform Mix-tures: A First Experimental Approach. Journal de Physique IV, 12:273–279, 2002.
[137] I. Sochet, P. Gillard, and F. Guélon. Effect of the Concentration Distri-bution on the Gaseous Deflagration Propagation in the Case of H2/O2
Mixture. Journal of Loss Prevention in the Process Industries, 19:250–262,2006.
[138] T. N. Srinivasan and T. S. Gopi Rethinaraj. Fukushima and Thereafter:Reassessment of Risks of Nuclear Power. Energy Policy, 52:726–736,2013.
[139] C. J. Sun, C. J. Sung, L. He, and C. K. Law. Dynamics of Weakly StretchedFlames: Quantitative Description and Extraction of Global Flame Pa-rameters. Combustion and Flame, 118:108–128, 1999.
[140] H. Tennekes and J. L. Lumley. A First Course in Turbulence. MIT Press,1972.
[141] G. O. Thomas, R. Bambrey, and C. Brown. Experimental Observationsof Flame Acceleration and Transition to Detonation Following Shock-Flame Interaction. Combustion Theory and Modelling, 5:573–594, 2001.
[142] G. O. Thomas, S. M. Ward, R. L. Williams, and R. J. Bambrey. On CriticalConditions for Detonation Initiation by Shock Reflection from Obsta-cles. Shock Waves, 12:111–119, 2002.
[143] S. R. Tieszen, M. P. Sherman, W. B. Benedick, J. E. Shepherd, and R. Knys-tautas. Detonation Cell Size Measurements in Hydrogen-Air-SteamMixtures. Dynamics of Explosions, pages 205–219, 1986.
[144] A. J. I. Toepler. Beobachtungen nach einer neuen optischen Methode. MaxCohen & Sohn, 1864.
[145] N. A. Tonello, M. Sichel, and C. W. Kauffman. Mechanisms of DetonationTransmission in Layered H2-O2 Mixtures. Shock Waves, 5:225–238, 1995.
209
BIBLIOGRAPHY
[146] S. D. Tse, D. L. Zhu, and C. K. Law. Morphology and Burning rates ofExpanding Spherical Flames in H2/O2/Inert Mixtures up to 60 Atmo-spheres. Proceedings of the Combustion Institute, 28:1793–1800, 2000.
[147] S. R. Turns. An Introduction to Combustion. McGraw-Hill, 2000.
[148] P. A. Urtiew and A. K. Oppenheim. Experimental Observations of theTransition to Detonation in an Explosive Gas. Proceedings of the RoyalSociety of London. Series A: Mathematical and Physical Sciences, pages13–28, 1966.
[149] C. M. Vagelopoulos, F. N. Egolfopoulos, and C. K. Law. Further Consid-erations on the Determination of Laminar Flame Speeds with the Coun-terflow Twin-Flame Technique. Symposium (International) on Combus-tion, 25:1341–1347, 1994.
[150] D. M. Valiev, V. Bychkov, V. Akkerman, and L. E. Eriksson. Different Stagesof Flame Acceleration from Slow Burning to Chapman-Jouguet Defla-gration. Physical Review E, 80, 2009.
[151] A. A. Vasiliev and Y. Nikolaev. Closed Theoretical Model of a DetonationCell. Acta Astronautica, 5:983–996, 1978.
[152] K. G. Vollmer. Einfluss von Mischungsgradienten auf die Flam-menbeschleunigung und die Detonation in Kanälen. PhD thesis,Lehrstuhl für Thermodynamik, Technische Universität München, 2015.
[153] K. G. Vollmer, F. Ettner, and T. Sattelmayer. Influence of Concentra-tion Gradients on Flame Acceleration in Tubes. Science and Technologyof Energetic Materials: Journal of the Japan Explosive Society, 72:74–77,2011.
[154] K. G. Vollmer, F. Ettner, and T. Sattelmayer. Deflagration-to-DetonationTransition in Hydrogen/Air Mixtures with a Concentration Gradient.Combustion Science and Technology, 184:1903–1915, 2012.
[155] J. Von Neumann. Theory of Detonation Waves. Technical report, DTICDocument, 1942.
210
BIBLIOGRAPHY
[156] B. L. Wang, H. Olivier, and H. Grönig. Ignition of Shock-Heated H2-Air-Steam Mixtures. Combustion and Flame, 133:93–106, 2003.
[157] J. Warnatz, U. Maas, and R. W. Dibble. Combustion: Physical and Chem-ical Fundamentals, Modeling and Simulation, Experiments, PollutantFormation. Springer, 2006.
[158] D. R. Whitehouse, D. R. Greig, and G. W. Koroll. Combustion of StratifiedHydrogen-Air Mixtures in the 10.7 m3 Combustion Test Facility Cylinder.Nuclear Engineering and Design, 166:453–462, 1996.
[159] D. R. Whitehouse, C. K. Chan, and D. R. Greig. Combustion of Non-Uniform Hydrogen-Air Mixtures. Technical report, Proceedings of theOECD/NEA/CSNI Workshop on the Implementation of Hydrogen Miti-gation Techniques, 1997.
[160] E. Wiberg and N. Wiberg. Inorganic Chemistry. Academic Press, 2001.
[161] S. K. Willacy, H. N. Phylaktou, G. E. Andrews, and G. Ferrara. StratifiedPropane-Air Explosions in a Duct Vented Geometry: Effect of Concen-tration, Ignition and Injection Position. Process Safety and Environmen-tal Protection, 85:153–161, 2007.
[162] C. K. Wu and C. K. Law. On the Determination of Laminar Flame Speedsfrom Stretched Flames. In Symposium (International) on Combustion,volume 20, pages 1941–1949. Elsevier, 1985.
[163] F. M. Zehentbauer, C. Moretto, R. Stephen, T. Thevar, J. R. Gilchrist,D. Pokrajac, K. L. Richard, and J. Kiefer. Fluorescence Spectroscopy ofRhodamine 6G: Concentration and Solvent Effects. Spectrochimica ActaPart A: Molecular and Biomolecular Spectroscopy, 121:121–147, 2014.
[164] Y. B. Zeldovich. On the Theory of the Propagation of Detonation inGaseous Systems. Technical report, National Advisory Committee forAeronautics Collection, 1950.
[165] Y. B. Zeldovich. Regime Classification of an Exothermic Reaction withNonuniform Initial Conditions. Combustion and Flame, 39:211–214,1980.
211
BIBLIOGRAPHY
[166] Y. B. Zeldovich, V. B. Librovich, G. M. Makhviladze, and G. I. Sivashinskil.On the Onset of Detonation in a Nonuniformly Heated Gas. Journal ofApplied Mechanics and Technical Physics, 11:264–270, 1970.
[167] Y. B. Zeldovich, G. I. Barenblatt, and R. A. Sunyaev. Selected Works ofYakov Borisovich Zeldovich, Volume I: Chemical Physics and Hydrody-nanics. Princeton University Press, 1992.
212
Related Documents