Welcome message from author
This document is posted to help you gain knowledge. Please leave a comment to let me know what you think about it! Share it to your friends and learn new things together.
Transcript


2
11th Arab Energy Conference
As Presented in Marrakesh – Kingdom of Morocco
1 – 4 October 2018
CURRENT AND FUTURE ROLE OF RENEWABLE ENERGY
Opportunities and Challenges for RE and EE in the Pan-Arab Countries along Climate Finance and Climate Actions
Lead author:
Dr. Ahmed BADR, RCREEE
Co-authors:
Rana ELGUINDY, RCREEE
Rawad RIZK, RCREEE
Laura WIEHLER, RCREEE

3
List of Abbreviations
BCM Billion Cubic Meters
CCS Carbon Capture and Storage
COP Conference of Parties
EE Energy Efficiency
EOR Enhanced oil recovery
GHG Greenhouse gas
GTL Gas to Liquid
IEA International Energy Agency
IOC International Oil Company
IMF International Monetary Fund
IRENA International Renewable Energy Agency
MENA Middle East and North Africa
NDC Nationally Determined Contributions
RE Renewable Energy
Sustainable Development Goals
SME Small and Medium Enterprises
UN United Nations

4
List of Abbreviations ............................................................................................................................ 3
INTRODUCTION ................................................................................................................................... 5
1. REDUCTION OF GREENHOUSEGAS EMMISSIONS (GHG) THROUGH RENEWABLE ENERGY
AND ENERGY EFFICIENCY ................................................................................................................. 6
1.1. The role of Renewable Energy in de-carbonization and GHG emissions reduction .......................... 8
1.2. TheroleofEnergyEfficiencyinde-carbonizationandGHGemissionsreduction........................ 10
1.3. RE and EE Best practices and real examples from the region ..................................................... 11
2. CAN IOCs SUPPORT ACCESS TO CLIMATE FINANCING? .................................................................... 13
2.1. Emissions from oil and gas companies in the Arab region .......................................................... 14
2.2. Oil and gas companies investing in renewable technologies ...................................................... 14
CHALLENGES AND BARRIERS .............................................................................................................. 18
CONCLUSION ....................................................................................................................................... 19
REFERENCES ........................................................................................................................................ 20
Table of Contents

5
INTRODUCTION
The Arab region is considered as a unique region in so many aspects like its geography, economics, wealth in natural resources, and climate. The region has almost 42% of global proven oil reserves as of 2017 where Saudi Arabia stands as the leading country in terms of reserves having roughly 15.7% of the world’s oil reser-ves. The region also has 28% of global natural gas reserves where Qatar alone has almost 13% of the world’s natural gas reserves (BP, 2018). Hence, it is clear that the energy mix in the region is heavily dependent on fossil fuels. Oil and gas constitutes around 97% of total primary energy consumption in the Arab region and around 51% of global consumption (BP, 2018). Nevertheless, it is worth mentioning that the share of oil in the regional energy mix has been shrinking, moving from 60% of total energy demand in 1990 to 45% in 2014 (Emanuela Menichetti, 2017).
This endowment in conventional energy sources has enabled several countries in the Arab region to transform their economies, improve their living and support their population growth. Nevertheless, this vast wealth in energy resources, has rendered the region into one of the most energy consuming in the world. This high dependence on oil and gas revenues has led the economies of several countries in the region to fluctuate with oil prices and hence compromising their economic stability (Emanuela Menichetti, 2017).
The Arab region also has an abundance of renewable energy resources namely wind and solar. Seeing that most of the Arab countries are part of the SunBelt (IRENA, 2016)1, global solar irradiation ranges between 1920 kWh/m2/year and 2450 kWh/m2/year and wind speeds that exceed 6.9 m/s in some countries. This high potential for electricity generation from renewable energy sources is vital to meet the region’s rapidly growing energy demand and economic growth while meeting national and regional goals for climate change mitigation and adaptation.
Since oil prices can massively affect the use of alternative fuels in these energy intensive countries, the dra-matic fall of oil prices since 2014 has raised several questions about whether the availability of cheap oil could alter the transition towards clean energy technologies that are known to have high capital costs. If we focus on the power sector, one can say that this decrease in oil prices can hinge the development of the renewable energy as it will render fossil fuel based technologies more competitive, displacing renewables and increasing the emissions of greenhouse gases (GHGs) (Ettlin, 2017). Nevertheless, with the new rises of oil prices, the trend was reversed since oil at the higher prices (still lower than before the 2014 crises) stopped providing investors with the desired returns on their investments, and hence, with recent technological advances in the renewables industry, sustainable energy is now becoming more and more attractive for investors than conventional energy (Ettlin, 2017).
One of the major challenges currently facing the Arab region is their pressing need to reduce their GHGs emissions in order to stick to the Nationally Determined Contribution (NDCs)2 as agreed after the Paris agre-ement during the 21st Conference of Parties (COP). This can partly be achieved by the de-carbonization of the power sector, one of the most emitting sectors in the region. The best way to achieve the desirable amount of de-carbonization is by increasing the share of sustainable energy sources, as well as by reducing the volume of GHG emissions from fossil fuel power stations through Carbon Capture and Storage (CCS). Therefore, it is necessary for the International Oil Companies (IOCs) to start investing in their entire value chain and come up with new and innovative business models that will enable them to use more sustainable energy sources while also reducing their operational costs as well as to support their corporate social responsibility (CSR) efforts.
This paper will first briefly present the role of IOCs in the de-carbonization process and the new business models that are currently used worldwide allowing them to reduce their GHG emissions, operational costs and increase their CSR. The second part of the paper focuses on the role of IOCs in supporting access to capital for climate change mitigation projects. Finally, the paper discusses the challenges and barriers that hinder the investment in the renewable energy and energy efficiency technologies in the region.
1 A geographical region consisting of countries that are situated between 35°N and 35°S and generally characterized by high solar irradiation
2 The Paris Agreement requests each country to outline and communicate their post-2020 climate actions, known as their NDCs. Together, these climate actions determine whether the world achieves the long-term goals of the Paris Agreement and to reach global peaking of greenhouse gas (GHG) emissions as soon as possible and to undertake rapid reductions thereafter in accordance with best available science, so as to achieve a balance between anthropogenic emissions by sources and removals by sinks of GHGs in the second half of this century (UNFCCC, 2017).

6
REDUCTION OF GREENHOUSEGAS EMMISSIONS(GHG) THROUGH RENEWABLE ENERGY AND ENERGY EFFICIENCY

7
REDUCTION OF GREENHOUSEGAS EMMISSIONS 1- REDUCTION OF GREENHOUSEGAS EMMISSIONS (GHG)THROUGH RENEWABLE ENERGY AND ENERGY EFFICIENCY
The electricity sector in the region is still heavily dominated by fossil fuels with oil and gas based power plants producing 94% of the electricity needs (AUE, 2017). The region’s electricity demand is expected to increase by around 62% in the next decade due to its economic growth, expanding energy infrastructure, and surging demand for air conditioning (AUE, 2017). Demand for natural gas in the Middle East alone is expected to grow by 2.4% per year which will be met by an increase in domestic production (IEA, 2017). The power and transportation sectors are responsible for the majority of CO2 emissions, which in turn are the major contributors to global warming.
As the region is one of the most affected regions by the impacts of climate change, Arab countries have committed in their NDCs to reduce GHG mainly through de-carbonization of their power sector by increasing the share of renewable energy technologies and expanding their energy efficiency markets. According to the IEA, around 6.9% of the oil and gas industry’s total energy production is consumed by the energy industry itself. Table 1, below illustrates the future role of technologies in CO2 abatement. Supply efficiency will be responsible for 9% of savings in global CO2 emissions, which includes power plants, petroleum refineries and oil and gas extraction. It is thus exigent for IOCs to invest along their value chain in decarbonizing techno-logies such as renewables and energy efficiency. Sustainable energy will play a major role in reducing IOC’s operational costs during current low global oil prices and thus aiding them to remain competitive in the en-ergy market. Finally, through investment in sustainable energy projects, IOC’s will contribute to their role in combatting climate and reducing GHG emissions.
CO2 abatement 2020 2020
Energy service demand 19% 11%
End-useefficiency 46% 39%
Supplyefficiency 9% 11%
Fuel and technology switching in end-users 2% 3%
Renewable energy 17% 24%
Biofuels 3% 3%
Nuclear 3% 7%
Carbon capture and storage (CCS) 1% 2%
Table 1: World energy related CO2 abatement
Source: (IEA, 2014)
8
1.1 The role of Renewable Energy in de-carboni zation and GHGemissions reduction
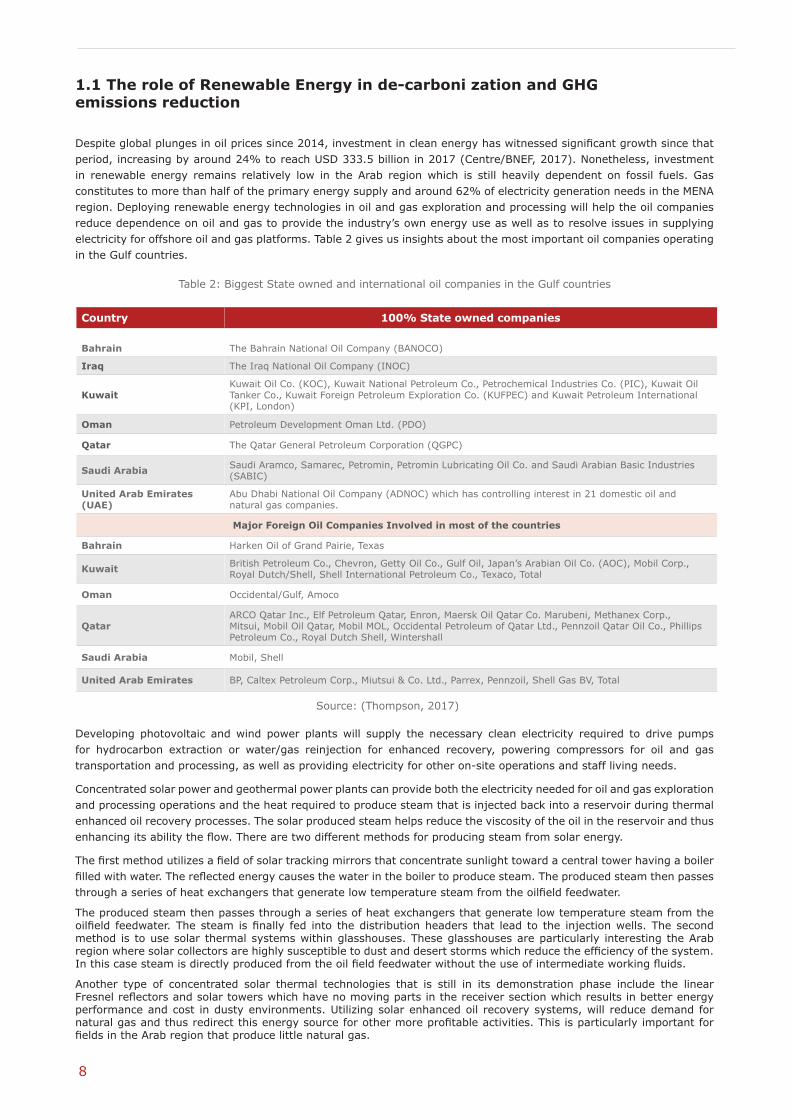
Despite global plunges in oil prices since 2014, investment in clean energy has witnessed significant growth since that period, increasing by around 24% to reach USD 333.5 billion in 2017 (Centre/BNEF, 2017). Nonetheless, investment in renewable energy remains relatively low in the Arab region which is still heavily dependent on fossil fuels. Gas constitutes to more than half of the primary energy supply and around 62% of electricity generation needs in the MENA region. Deploying renewable energy technologies in oil and gas exploration and processing will help the oil companies reduce dependence on oil and gas to provide the industry’s own energy use as well as to resolve issues in supplying electricity for offshore oil and gas platforms. Table 2 gives us insights about the most important oil companies operating in the Gulf countries.
Developing photovoltaic and wind power plants will supply the necessary clean electricity required to drive pumps for hydrocarbon extraction or water/gas reinjection for enhanced recovery, powering compressors for oil and gas transportation and processing, as well as providing electricity for other on-site operations and staff living needs.
Concentrated solar power and geothermal power plants can provide both the electricity needed for oil and gas exploration and processing operations and the heat required to produce steam that is injected back into a reservoir during thermal enhanced oil recovery processes. The solar produced steam helps reduce the viscosity of the oil in the reservoir and thus enhancing its ability the flow. There are two different methods for producing steam from solar energy.
The first method utilizes a field of solar tracking mirrors that concentrate sunlight toward a central tower having a boiler filled with water. The reflected energy causes the water in the boiler to produce steam. The produced steam then passes through a series of heat exchangers that generate low temperature steam from the oilfield feedwater.
The produced steam then passes through a series of heat exchangers that generate low temperature steam from the oilfield feedwater. The steam is finally fed into the distribution headers that lead to the injection wells. The second method is to use solar thermal systems within glasshouses. These glasshouses are particularly interesting the Arab region where solar collectors are highly susceptible to dust and desert storms which reduce the efficiency of the system. In this case steam is directly produced from the oil field feedwater without the use of intermediate working fluids.
Another type of concentrated solar thermal technologies that is still in its demonstration phase include the linear Fresnel reflectors and solar towers which have no moving parts in the receiver section which results in better energy performance and cost in dusty environments. Utilizing solar enhanced oil recovery systems, will reduce demand for natural gas and thus redirect this energy source for other more profitable activities. This is particularly important for fields in the Arab region that produce little natural gas.
Country 100% State owned companies
Bahrain The Bahrain National Oil Company (BANOCO)
Iraq The Iraq National Oil Company (INOC)
KuwaitKuwait Oil Co. (KOC), Kuwait National Petroleum Co., Petrochemical Industries Co. (PIC), Kuwait Oil Tanker Co., Kuwait Foreign Petroleum Exploration Co. (KUFPEC) and Kuwait Petroleum International (KPI, London)
Oman Petroleum Development Oman Ltd. (PDO)
Qatar The Qatar General Petroleum Corporation (QGPC)
Saudi Arabia Saudi Aramco, Samarec, Petromin, Petromin Lubricating Oil Co. and Saudi Arabian Basic Industries (SABIC)
United Arab Emirates (UAE)
Abu Dhabi National Oil Company (ADNOC) which has controlling interest in 21 domestic oil and natural gas companies.
Major Foreign Oil Companies Involved in most of the countries
Bahrain Harken Oil of Grand Pairie, Texas
Kuwait British Petroleum Co., Chevron, Getty Oil Co., Gulf Oil, Japan’s Arabian Oil Co. (AOC), Mobil Corp., Royal Dutch/Shell, Shell International Petroleum Co., Texaco, Total
Oman Occidental/Gulf, Amoco
QatarARCO Qatar Inc., Elf Petroleum Qatar, Enron, Maersk Oil Qatar Co. Marubeni, Methanex Corp., Mitsui, Mobil Oil Qatar, Mobil MOL, Occidental Petroleum of Qatar Ltd., Pennzoil Qatar Oil Co., Phillips Petroleum Co., Royal Dutch Shell, Wintershall
Saudi Arabia Mobil, Shell
United Arab Emirates BP, Caltex Petroleum Corp., Miutsui & Co. Ltd., Parrex, Pennzoil, Shell Gas BV, Total
Table 2: Biggest State owned and international oil companies in the Gulf countries
Source: (Thompson, 2017)

9
Out of a global potential of extracting 750 billion barrels of oil through EOR, the Middle East region has the largest share equivalent to 63% or 475 billion barrels of recoverable oil (GreatPoint, n.d.). Further, utilizing solar enhanced oil recovery has the potential to reduce carbon emissions to less than 1 gCO2/MJ down from 23.8 gCO2/MJ when utilizing natural gas for EOR (Anderson, 2017). As such, Solar EOR provides great potential for exploiting additional oil and gas resources with minimum environmental impacts.
The oil and gas industry requires fresh water to be available whether for staff use or enhanced oil recovery. Knowing that the vast majority of fresh water in the Middle East is provided through energy intensive desalination power plants, renewable energy, namely solar energy technologies provide an opportunity to deliver fresh water utilizing clean energy sources and reducing the industry’s carbon footprint. Some of the technologies available are either to utilize decentralized solar powered desalination units or large thermal power plants in combination with large multi-effect distillation plants (MED) or multistage flash (MSF) plants (Halabi, Al-Qattan, & Al-Otaibi, 2015). In general, water extracted from the reservoir has to be first treated to remove hydrocarbon contaminants, and then desalinated using reverse osmosis. The electricity required to operate the reverse osmosis plants can be supplied by a renewable energy source such as solar, wind, or geothermal (M.A & B.C, 2010).
The downstream industry in oil and gas or petroleum refining is a high density and energy intensive industry. Renewable energy, namely solar thermal technologies, provide a unique opportunity to supply the energy required in various processes such as steam production, hydrogen production or distillation. Nonetheless, utilizing these technologies is still limited by the intermittent nature of solar energy and the limited land are available near refineries.
Figure 1: Global enhanced oil recovery (EOR) potential
Source: Society of Petroleum Engineers

10
1.2.TheroleofEnergyEfficiencyinde-carbonizationandGHGemissionsreduction
Flared gas is considered one of the major contributors to the oil and gas industry’s GHG emissions. Every year around 150 BCM of gas is flared constituting to around 5% of natural gas production globally which is equivalent to 400 million tons of CO2 emission (World Bank, 2016). As seen in Figure 1, seven Arab countries are among the top 30 gas flaring countries. This indicates that there are several opportunities in the Arab region to re-use this wasted gas for both heat and electricity production and through that improving the operational energy efficiency of the oil and gas industry. Today, only four Arab countries are part of the Global Gas Flaring Reduction Partnership, which is a World Bank led initiative that brings together governments as well international and national oil companies in order to support efforts to remove barriers to flaring reduction, conducting research, disseminating best practices, and developing country-specific gas flaring reduction programs (World Bank, 2016).
Natural gas is usually flared because a pipeline transportation system is not available, if there is no option of liquefying the gas, if the gas cannot be injected into reservoir for pressure control, for safety purposes, during well production testing in order to stabilize the pressure, or if there are no regulations in place. Gulf countries alone flare around 27 billion cubic meters of gas every year, which is equivalent to 80 million tons of CO2 (Stanton, 2010). Flared gas can be collected, compressed and reinjected into the well for enhanced oil recovery, used as a fuel source for various on-site operational activities, and used as a feedstock for the petrochemical industry. (Emam, 2015). Flared gas can also be used as a fuel source for incinerators or to recover exhaust heat for further use in steam production and electricity generation. Finally, flared gas can be used in gas to liquid technologies (GTL) in which gas is converted to liquid hydrocarbons (synthetic oil) through various chemical reactions such as the Fisher-Tropsch technologies (Emam, 2015).
Capturing the benefits of flared gas can be achieved by utilizing improved gas recovery systems by collecting the gas from the flare header before reaching the flare, then compressing it. The compressed gas then passes through a mixed phase separator where the gas is separated from the liquid and is transported back to the fuel gas header or other locations for alternative uses. Figure 2 illustrates and example of a flue gas recovery system. A flare gas recovery system developed by Honeywell UOP Callidus for a petroleum refinery in China resulted in preventing 32.5 tons of NOx, 176.8 tons of CO and 67,000 tons of CO2 from being emitted each year. The estimated fuel savings from the recovery system were millions of dollars yearly, resulting in a payback period of less than 9 months.
Figure 2: Top 30 gas flaring countries (2013-2016)
Source: (World Bank, 2016)

11
1.3 RE and EE Best practices and real examples from the region
Around 80% of CO2 emissions generated from offshore oil and gas exploration is spawned from the gas turbines utilized to generate electricity. Utilizing a waste heat recovery unit for the gas turbine could be an effective opportunity for reducing operational costs and the industry’s carbon footprint. Another source of wasted heat is from the intercooling/aftercooling3 required during gas compression (Mazzetti, Nekså, Walnum, & Hemmingsen, 2014). An alternative method to produce electricity is to utilize the recovered flare gas and using it as a primary source for electricity production through a natural gas-based electric power station.
A study proposed and simulated three different potential methods for the recovery of flared gas from the Farashband gas refinery in Iran which included the use of the flared gas in: Gas to Liquid (GTL), electricity production utilizing a gas turbine, and compression and injection into the refinery pipelines. The results showed that from the 4.176 MMSCFD of flared natural gas, 563 barrels/day of valuable GTL products could be produced by the first method, 25 MW of electricity from the second method and the third method provided a compressed natural gas with 129 bar pressure for injection in the refinery’s pipelines (Rahimpour & Jokar, 2012). Furthermore, it was deduced that the use of flared gas for electricity generation gives he highest rate of return (ROR) the lowest payback period, the highest annual profit and a mild capital investment (Rahimpour & Jokar, 2012).
The French oil and gas giant, Total, consumes around 13 Mtoe a year, which is equivalent to 10% of their production. As such, the international oil company planned to improve energy efficiency by 1% every year in all its facilities between 2010 and 2020. Between 2005 and 2014, Total was able to cut gas flaring in its facilities by half and plans to further cut flaring by 80% between 2010 and 2020 and finally terminate the practice by 2030 (Total, n.d.).
Furthermore, DNV-GL is working in partnership with ExxonMobil, ENI Norge, Nexen Petroleum UK Ltd., Statoil, VNG Norge, PG Flow Solutions and ORE Catapult on a project called WIN-WIN which stands for wind powered water injection and comprises an offshore floating wind turbine that supplies an oil and gas rig with electricity for the purpose of water injection (DNV-GL, 2018).
In California, Chevron signed an agreement with BrightSource Energy to build a solar thermal demonstration plant which will generate steam for EOR. The plant produced 29 MWth of steam through 7000 flat mirrors reflecting sunlight toward a boiler located 98 meters above a tower. The plant began operation in 2010 and helped Chevron reduce its carbon footprint by generating a 60% quality steam at 2600C and 48 bars (Halabi, Al-Qattan, & Al-Otaibi, 2015).
Figure 3: Flare gas recovery system
Source: (Gumilar, 2014)
3 Intercoolers are used between compressors to reduce the work required for compression of the gas.Intercoolers reduce the temperature of the compressed gas thus reducing the volume of the gas requiring compression.

12
As Oman uses around 22% of its gas for enhanced oil recovery technologies, Petroleum Development Oman (PDO), which is 60% owned by the Omani government, 34% by Shell group, 4% by Total, and 2% by Partex, and the solar company Glasspoint are building a 1,021 MW large scale solar EOR project (Miraah) in order to reduce dependence on natural gas (OECD, nd) (Miraah & Petroleum Development Oman, 2015). Miraah is expected to generate 6,000 tons of steam per day saving up to 80% or 5.6 trillion BTUs of natural gas utilized in the Amal oilfield in southern Oman, which is the equivalent to serving 209,000 residential consumers with electricity. Upon completion, the mega scale solar project is expected to save over 300,000 tons of CO2 emissions annually (PDO, 2017). The first block of the Miraah Solar Plant has for the first time successfully delivered steam to the Amal West Oilfield in November 2017, and will be one of the biggest solar farms worldwide upon completion (PDO, 2017).
Moreover, and in order to reduce dependence on natural gas, Kuwait is planning a 100 MWth concentrated solar power EOR plant at the Ratqa oil field. The solar plant is expected to supply around 3,000 barrels of solar steam a day (cspfocus, 2017).
In Egypt the two oil and gas companies GUPCO and PETROBEL are using PV systems as a power supply scheme for off-shore gas platforms. While GUPCO is powering one off-shore gas platform PETROBEL is powering three. Egypt’s onshore and offshore oil and gas fields are mostly located in areas with high solar irradiance levels, which makes the utilization of solar PV to power the projects very feasible (Ismael , H.E. Abdel Aleem, & Abdelaziz, 2018).
Finally, it is estimated that Iraq can save up to USD 5.2 billion by reducing the amount of flared gas in the next four years, as the country seeks to eliminate flaring by 2021 (Gnana, 2018). Iraq is planning to build three power plants in order to process the natural gas being flared at its southern oil fields in collaboration with Shell and Mitsubishi (Reuters, 2017).

13
CAN IOCs SUPPORT ACCESS TO CLIMATE FINANCING?

14
REDUCTION OF GREENHOUSEGAS EMMISSIONS 2- CAN IOCs SUPPORT ACCESS TO CLIMATE FINANCING?
Even though the MENA region is considered as one of the most severely affected regions by climate change, only 3.6% of global investments into RE took place in Africa and the Middle East combined in 2017 (Centre/BNEF, 2018). Furthermore, the IEA estimates that the Arab region will contribute to a significant share of the increased global energy demand. These developments reflect the fact that despite the global efforts towards the reduction of GHG emissions and the increase in green energy supply, these efforts still need to be strengthened, especially for a region whose resilience to climate change is yet very little but has such an abundance of RE resources. In order to catalyze the growth of installed RE capacity, the implementation of EE measures, and to cut down on GHG emissions, oil and gas companies can play a vital role. ‘Oil majors’ are a crucial part of the world’s energy system and will continue to be so for the next decades. The global ambitions towards cleaner energy and reduced GHGs also put the oil majors under pressure to adapt their business strategies.
Fossil fuels are the largest source of GHG emission worldwide. More than double the amount of GHG emissions was emitted since 1988 than in the 237 year between the industrial revolution and 1988. If the business as usual is being followed for the next 28 years, the world will face an increase in global temperature of about 4% until the end of the century. Traditionally GHG-emission data have been collected on country level basis, but as of 2013, the Carbon Majors Database is using a new approach and collects the data on fossil fuel producers that belong to the group of highest GHG producers. The database contains 100 active fossil fuel producers that are responsible for 52% of the industrial GHGs that were emitted since the 1750s which is generally the accepted date of the start of the industrial revolution. Moreover, these 100 companies are also responsible for 71% of global GHGs since 1988, which was the year of the establishment of Intergovernmental Panel on Climate Change (IPCC) and thus, the official recognition of the human impact on climate change. More specifically 51% of these GHG emission can even be allocated to just 25 of these governmental and private companies. To the top 50 fossil fuel companies in terms of operational and product GHG emissions that are located in the MENA region belong Saudi Aramco (1), National Iranian Oil (3), Abu Dhabi National Oil Company (8), Sonatrach (12), Kuwait Petroleum (13), Qatar Petroleum (15), and Iraq National Oil (18) (CDP, 2017).
The world energy demand will rise about 50% until the year 2035. Consequently, to meet the global energy demand, oil and gas will play a vital role. The consumption of the industry itself is between 6.9% and 10% of its total energy production which leaves room for Renewable Energy use within the oil and gas industry. The processing of oil and converting it into petroleum products consumes most of the 10% through thermal energy which gives solar and thermal technologies great potential to reduce the GHG emissions (IEA, 2017) (CDP, 2017). With decreasing prices for RE technology their use becomes more attractive for the oil and gas industries who are very well positioned to increase the use of such technology.
technologies great potential to reduce the GHG emissions (IEA, 2017) (CDP, 2017). With decreasing prices for RE technology their use becomes more attractive for the oil and gas industries who are very well positioned to increase the use of such technology.
There is a limit as to how much of existing fossil fuel reserves can be used, and what needs to stay untouched. This leads to the possible amount of carbon that can be produced until the atmospheric temperature increases by 20C before the changes become so drastic that it is too late to preserve the planet’s ecosystem (Lütkenhorst, 2014). This means that 82% of coal deposits, a third of the world’s oil, and half of all known remaining gas reserves, as well as 80% of the potential shale gas reserves in the Middle East, the US, and Africa cannot be used but must remain untouched (Bottoms, El-Refai, & Huzayyin, 2016) (Hare, 2014).
In recent years, a trend in the oil and gas industry can be tracked as it has turned more and more towards investing in renewable energy technologies and energy efficiency measures in order to reduce carbon emissions, follow a more sustainable business strategy and secure a place in the future energy market. Calls for sustainable investments have been increasing among the shareholders in order to support the goal of the Paris Agreement (Minjia, 2018).
2.1. Emissions from oil and gas companies in the Arab region
2.2. Oil and gas companies investing in renewable

15
The International Petroleum Industry Environmental Conservation Association (IPIECA) has launched a report titled “Mapping the oil and gas industry to the Sustainable Development Goals: An Atlas” which discusses how oil and gas companies can support achieving the UN Sustainable Development Goals (SDGs). The Atlas is an instrument in order to mainstream a sustainable approach to advise on how to support access to affordable, reliable, sustainable, and modern energy for all (SDG 7) and to equally support SDG 13 which calls to take urgent action to combat climate change. The Atlas advises that multi-stakeholder approaches are needed in order to collaborate and leverage on combined resources while oil and gas companies need to plan and prepare for net zero emission energy systems the next decades and carefully evaluate the future need for oil and gas while mitigate emissions within company’s operations. Many of the oil majors are already moving towards such approaches and come together under different initiatives and joint ventures (IPIECA, 2017) (Maennling, 2017).
Sustainable Development Goals (SDG) are a set of goals that were set to build upon the Millennium Development Goals and converge with the post-2015 development agenda. They are one of the main outcomes of the Rio +20 Conference, aimed to be achieved by 2030.
Covering Energy Component, the SDG 7 aims to ensure access to affordable, reliable, sustainable and modern energy for all. Its main objective is to meet the RE and EE SE4ALL targets and to improve energy access, which requires creative financing mechanism and bolder policy commitments, together with the willingness of the countries to embrace new technologies on a wider scale.
Also in relation with Energy is the SDG 13 which aims to take urgent actions to combat climate change and its impact. Its works on strengthening the resilience and adaptive capacity to climate-related hazards and natural disasters in all countries and to integrate climate change measures into National policies, strategies and planning. One of its main objectives is to mobilize $100 billion annually by 2020 to address the needs of developing countries and help mitigate climate-related disasters and help more vulnerable regions, such as land locked countries and island states, adapt to climate change effects (United Nations, 2018).
Figure 4: Count of financings with oil and gas participants, by investment type 2008-2017
2008 201720162015
21
1
1
2
201420132012201120102009
Source : (cbinsights, 2018)
Clean Tech Operational Improvement COnventional Energy Other
7
1
11
1
1
13
36
4
4
7
27
4
4
13
13
13
14
11
13
13 24
17
19
24 2919 12
12 2
6

16
Analysis of investment activities of the most active and biggest companies across the oil and gas value chain make it quite clear that the trend to invest in clean technology is rising as well as investments to make operational activities more efficient (cbinsights, 2018). The concrete numbers of recent years are good indicators that demonstrate that oil and gas companies can impact the fulfillment of climate goals. Over a span of 15 years, up to 2016, oil majors have spent USD 6.2 billion by building stakes in clean energy companies and closed over 428 transactions (Hirtenstein, 2017).
The biggest investment volume focused on solar energy while wind energy deals took second place as can be seen in Figure 3 (Hirtenstein, 2017). While around 83% of the world’s off-shore wind energy is installed on the coasts of Europe and traditionally power producers are the main investors, new players, such as oil and gas companies, have entered the marked (IRENA, 2018) (WindEurope, 2018). Oil and gas companies are testing and exploring new ideas while seeking to leverage on their know-how, for example, in off-shore wind investments which are projects that are facing similar obstacles as fossil fuels from seabed’s due to the same environmental conditions (Hirtenstein, 2017). Other investment areas are power storage and electric vehicles.
Many oil and gas companies are taking up responsibility and using private equity and venture capital financing, as well as creating new initiatives, such as the “Oil and Gas Climate Initiative” (OGCI, 2018). The initiative is made up of ten oil and gas companies and aims at catalyzing the reduction of greenhouse gas emissions (GHG) by focusing on: i) carbon capture, utilization, and storage, ii) reduction of methane emissions, iii) reduction of transport emissions, and iv) improving energy efficiency in industry. Saudi Aramco is part of this initiative and is weighing to invest up to USD 5 billion into RE and is generally considered to play a vital role in diversifying Saudi Arabia’s energy mix and reaching the country’s set goal of 9.5 GW until 2023 (Martin, 2017) (aramco, 2018).
Focusing on some of the Arab region’s biggest oil and gas companies an inclination towards RE and climate friendly investments is detectable. In the past years, regional oil and gas companies have invested from their own equity and through joint ventures with other regional and international companies to finance the installation of RE technologies, carbon capture, utilization, and storage and other projects that support climate change mitigation and adaptation.
A joint venture between Qatar Petroleum and Qatar Electricity and Water Company has been established for the installation of solar energy technologies. Siraj Solar Energy plans to install 500 MW in the first phase of the project in Al Kharsaah for which around USD 500 million will be provided by the two shareholders while 40% of the cost is expected to come from international investors through tendering. In total the project is set to reach 1000 MW installed capacity (QWEC, n.d.) (Finn, 2016).
A further joint venture that was established to fight climate change is Al-Reyadah, which is a Carbon Capture Utilization and Storage (CCUS) facility for the steel industry. The joint venture between Masdar, Abu Dhabi’s Future Energy Company and the Abu Dhabi National Oil Company (ADNOC) has implemented Middle East’s first commercial scale CCUS facility for Emirates Steel. 800,000 tons of CO2 are secluded from the plant, injected into oil fields for enhanced oil recovery, replacing natural gas and staying trapped underground. (ADNOC, 2017) (Reyadah, 2017). It is calculated that industrial emissions will account for 45% of global emissions by 2050 making CCUS a favorable technology in order to reduce emissions. The deployment of new projects however, is shrinking contrary to global needs to combat Climate Change (IEA/OECD, 2016).
Figure 5 Oil majors focus investment areas of renewable energy
Oil majors Renewable Energy investment focus areas
Solar Leading
Source: (Hirtenstein, 2017)

17
Also, Algeria’s Sonatrach is reaching out to invest into solar power. In 2017 the Italian oil and gas company Eni and Sonatrach have signed a Memorandum of Understanding in order to localize areas within Sonatrach’s productions sites that are feasible for solar power plants (Reuters 2, 2017). Further, the company’s CEO Abdelmoumene Ould Kaddour said in spring 2018 that Sonatrach has invested to potentially get 1600 MW of solar energy (Chikhi, 2018).
Petroleum Development Oman has announced an Expression of Interest in the beginning of 2018 for a 100 MW solar PV project under the Build-own-operate-transfer scheme with a Power Purchase Agreement of 23 years with tariff based payments (Petroleum Development Oman 1, 2018). The company is also using solar energy to power its own office buildings by installing 19,500 solar PV modules over an area of 37,830m2 (Petroleum Development Oman 2, 2018).
Regional oil and gas companies are exploring their opportunities with utilizing RE and climate friendly technologies for their on-site operations as well as investing in the global RE and EE market. Table 2 Summarizes the findings of this chapter focusing on the Arab region.
Table 3: Climate supportive projects of oil and gas companies in the Arab region on-site
Joint Ventures and equity investments in RE and clean technology
Companies Project Spending / Saving (GHG) / Installed Capacity
Saudi AramcoKingdom of Saudi Arabia
No concrete project planned. Weighing to spend up to USD 5billion. on RE projects
Electricity and Water Company - Siraj Solar (Quatar)
500 MW in the first phasePlanned on 1000 MW in later stage.
USD 500 million are allocated for the project.
Masdar, Abu Dhabi’s Future Energy Company & Abu Dhabi National Oil Company (ADNOC) - Al-Reyadah (Abu Dhabi)
A Carbon Capture Utilisation and Storage (CCUS) facility for the steel industry.
Al Reyedah implemented Middle East’s first commercial scale CCUS facility. Saves 800,000 tons CO2 p.a. and replaces natural gas for EOR
Sonatrach & ENI signed MoU (Algeria) Localize areas within Sonatrach’s productions sites that are feasible for solar power plants.
Sonatrach has invested to get potentially 1,600 MW of solar energy
Petroleum Development Oman (Oman)
Petroleum Development Oman (Oman) • PDO has called for an Expression of Interest.• Is powering own office premises.
• 100 MW solar PV, BOOT, PPA of 23 years• 19,500 solar PV modules over an area of 37,830m2
No concrete project planned. No concrete project planned. No concrete project planned.
No concrete project planned. No concrete project planned. No concrete project planned.
On-site implementations
Companies Project Spending / Saving (GHG) / Installed Capacity
Petroleum Development Oman together with solar company Glasspoint
Miraah project – Enhanced oil recovery Building a 1 GW solar thermal EOR project which will save over 300,000 tons of CO2
Iraq together with SHELL and Mistubishi
Eliminate gas flaring Three power plants to process natural gas being flared at Iraq’s southern oil fields
Kuwait Enhanced oil recovery 100 MWth CSP used for EOR
GUPCO and PETROBEL (Egypt) Powering off-shore gas platforms with solar PV
GUPCO is powering one off- shore gas platformPETROBEL is powering three of their own off-shore gas platforms

18
REDUCTION OF GREENHOUSEGAS EMMISSIONS CHALLENGES AND BARRIERS
First of all, energy subsidies present a huge barrier to the development of the sustainable energy markets in most of the Arab countries. The energy market in the region remains one of the most subsidized markets globally, reaching 92 billion USD in 2015, which is equivalent to almost 28% of global energy subsidies (IMF, 2015). The presence of these subsidies represents a huge burden on Arab countries as energy prices do not reflect the true price of production. Despite the fact that most of the Arab countries have, in the past few years, underwent an exceptional wave of energy subsidy reforms, energy prices remain well below world average (RCREEE, 2017). These extremely low prices, have made the use of conventional fossil fuels in the energy production more attractive for investors and hence reduced the investments in sustainable energy measures and technologies.
In the region, several economic, social, political and environmental, risks have affected the bankability of sustainable energy projects which has affected investors decisions to invest in these markets. Of these risks, we can mention the political instability in most of the countries especially after the Arab spring, the economic turmoil and the fluctuating currencies of several countries made it more difficult for investors to secure their investments in sustainable energy markets. Moreover, the unreliability of the grid in some of the countries has imposed technical problems on connecting RE projects to the grid and hence imposed another technical risk to the investors. Furthermore, one of the most critical risks is the absence of effective regulatory bodies responsible for the electricity sales in the countries, as well as the transparency of the auctioning process. Hence, all these risks have diminished the opportunities to attract foreign investors.
One of the most important things to consider while putting a strategy or an action plan is the executing body. In the Arab region, there is a lack of effective and dedicated RE & EE governing bodies to enforce and implement all the policies, regulations, initiatives and programs. That is why we can see that in most countries, the energy markets still suffer from a high degree of state ownership, monopoly and vertical integration. Moreover, and besides the importance of institutional capacities, strong commitment towards national action plans and targets needs to be enforced. In the region, and despite the fact that most of the countries have set ambitious national energy efficiency and renewable energy action plans and targets, most of them are not yet legally binding since they still lack any comprehensive or clear mechanisms to be enforced and imposed.
Despite the fact of being the most affected region by the severe impacts of climate change, the Arab region is one of the least beneficiary regions of international and regional funds dedicated to mitigation and adaptation to climate change, e.g. the Green Climate fund (GCF), Climate Investment Funds of the World Bank and their funding facilities. This lack of sustainable, reliable and dedicated funds is a barrier to stimulate the sustainable energy markets. It is worth mentioning that this lack of financing is mainly due to the high investment risks mentioned above, as well as the lack of expertise from local small and medium enterprises (SMEs) as well as local banks who still lack the experience to present and asses the bankability of sustainable energy projects.

19
REDUCTION OF GREENHOUSEGAS EMMISSIONS CONCLUSION
Oil and gas companies have recently increased their investments in clean technologies and energy efficiency as their revenues suffered by the recent plunges in oil prices. This, on one hand, comes as a response to increasing global pressures on reducing GHG emissions and mitigating the impacts of climate change and on the other hand, aims to reduce operational costs to remain competitive with rising cleaner and cheaper technologies. With large oil and gas reserves, the Arab region in particular is heavily dependent on fossil fuels especially for power generation. Electricity demand in the region is excepted to increase by around 62% in the next decade, which will further increase demand on oil and gas.
Around 6.9% or more of energy produced by the oil and gas industry is consumed and utilized for the industry’s own energy use. Investing in renewable energy hence plays an important role in de-carbonizing the industry’s exploration and processing operations. Oman and Kuwait for example have started investing in solar thermal EOR in order to reduce dependence on natural gas and thus reducing the associated opportunity costs. Other regional initiatives include reduction and utilization of flared gas since seven Arab countries are among the top 30 flaring countries globally. Gulf countries alone flare around 27 billion cubic meters of gas per year which is equivalent to 80 million tons of CO2. Flared gas can be recovered and re-used for various purposes such as electricity production to be used for on-site operations, feedstock for the petrochemical industry, or used in Gas to Liquid (GTL) technologies.
Furthermore, regional oil and gas companies are taking part in international initiatives, forming joined ventures and investing from their equity in order to explore new technologies and develop their own portfolio and know-how. The investments taken are still minor but the initial steps show that companies have captured the benefits of including RE & EE in their strategies.
Nevertheless, and despite the evolution and the developments that have taken place in the Arab region in the past decade, there is still a number of barriers that are hindering the development of sustainable energy investments. Even with the various energy subsidy reforms that took place in most of the Arab countries, low energy prices remain the biggest barrier to attract private investors to the sustainable energy market.
Hence, throughout the paper it has been laid out that the presence of IOCs in the region is vital, seeing their strong balance sheets that can be utilized to achieve national and regional climate targets. Therefore, it is necessary to work hand in hand in reducing the above mentioned investment risks in order to pave the way for investors to get into the region and increase the share of sustainable energy technologies.

20
REDUCTION OF GREENHOUSEGAS EMMISSIONS REFERENCES
ADNOC. (2017, 1 19). ADNOC and Masdar’s Carbon Capture Facility Holds Key to Limiting Industrial CO2 Emissions. Retrieved from adnoc.ae: https://www.adnoc.ae/en/news-and-media/press-releases/2017/adnoc-and-masdars-carbon-capture-facility-holds-key-to-limiting-industrial-co2-emissions
Anderson, T. (2017). Solar Energy and Oil Recovery. Stanford University.
aramco, s. (2018, 1 15). Saudi Aramco Showcases Innovative Technologies and Initiatives at ADSW 2018. Retrieved from saudiaramco.com: http://www.saudiaramco.com/en/home/news-media/news/Abu-dhabi-sustainability-week-2018.html
AUE. (2017). Arab Union of Electricity statistical bulletin. Amman: Arab Union of Electricity.
AUE. (2017). Arab Union of Electricity statistical bulletin. Amman: Arab Union of Electricity.
Bottoms, I. A., El-Refai, M. K., & Huzayyin, A. (2016). 80 Gigawatts of Change - Egypt’s Future Electricity Pathways. The Egyptian Center for Eco-nomic and Social Rights & Heinrich Böll Stiftung.
BP. (2018). BP statistical review of world energy. London: BP.
BP. (2018). BP statistical review of world energy. London: BP.
cbinsights. (2018, February 1). Oil And Gas Corporates Are Investing In Clean Tech, Analytics, And The Internet Of Things. Retrieved from cbinsights: https://www.cbinsights.com/research/oil-gas-corporate-venture-capital-investment/
CDP. (2017). CDP Carbon Majors Report 2017. The Carbon Majors Database.
Centre/BNEF, F. S.-U. (2017). Global Trends in Renewable Energy Investment 2017. Frankfurt.
Centre/BNEF, F. S.-U. (2018). Global Trends in Renewable Energy Investment 2018. Frankfurt: Frankfurt School of Finance & Management. Frankfurt am Main : Frankfurt School of Finance & Management gGmbH.
Chikhi, L. (2018, 4 14). Algeria’s Sonatrach to invest in digital technology, solar power - CEO. Retrieved from reuters.com: https://www.reuters.com/article/algeria-energy/algerias-sonatrach-to-invest-in-digital-technology-solar-power-ceo-idUSL8N1RT5M3
Climate Policy Initiative . (2017). Global Landscape of Climate Finance. Retrieved from Climate Policy Initiative: http://www.climatefinancelandscape.org/
cspfocus. (2017, 07 05). Kuwait to tender 100MWth solar CSP EOR plant, Middle East oil extraction creates great market for CSP. Retrieved from cspfocus: http://www.cspfocus.cn/en/market/detail_252.htm
DNV-GL. (2018). WIN WIN - Wind-powered water injection. Retrieved from https://www.dnvgl.com/energy/feature-articles/win-win-wind-powered-water-injection.html
Emam, E. A. (2015). Gas flaring in industry: an overview. Petroleum & Coal, 532-555.
Emanuela Menichetti, A. E. (2017). MATERIAL FACTORS FOR THE MENA REGION : ENERGY TRENDS. Barcelona: Middle East and North Africa Regional Architecture: Mapping Geopolitical Shifts, Regional Order and Domestic Transformations.
Ettlin, G. (2017, September 19). How the Oil Price Is Pushing Renewable Energy Forward. Retrieved from the market mogul: https://themarketmogul.com/rising-oil-price-means-renewable-energy/
Finn, T. (2016, 2 21). Qatar plans 1,000 MW of solar power via joint venture. Retrieved from reuters.com: https://af.reuters.com/article/africaTech/idAFL8N1600T3
Gnana, J. (2018, February 14). Iraq could save $5.2bn in four years from flared gas reduction, says Siemens. Retrieved from The National: https://www.thenational.ae/business/energy/iraq-could-save-5-2bn-in-four-years-from-flared-gas-reduction-says-siemens-1.704555
GreatPoint. (n.d.). CO2 for Enhanced Oil Recovery. Retrieved from GreatPoint Energy: http://www.greatpointenergy.com/co2forenhancedoilrecovery.php
Gumilar, A. (2014, 11 17). Flare Gas Recovery (FGR) to Minimize Wastes and Economical Benefits. Retrieved from https://chemeng-processing.blogspot.com/2014/11/flare-gas-recovery-fgr-to-minimize.html: https://chemeng-processing.blogspot.com/2014/11/flare-gas-recovery-fgr-to-minimize.html

21
Hare, B. S.-n. (2014). Rapid phase out of coal essential, but not enough to hold warming below 2°C - Climate Action Tracker Policy Brief. Potsdam Institute for Climate Impact Research: Ecofys – experts in energy / Climate Analytics/.
Heinrich Böll Stiftung. (2016). Climate Finance Regional Briefing: Middle East and North Africa. Washington: Heinrich Böll Stiftung North America.
Hirtenstein, A. (2017, 10 24). Big Oil Is Investing Billions to Gain a Foothold in Clean Energy. Retrieved from Bloomberg,com: https://www.bloomberg.com/news/articles/2017-10-24/big-oil-is-investing-billions-to-gain-a-foothold-in-clean-energy
IEA. (2014). World Energy Outlook 2014. Paris: International Energy Agency.
IEA. (2017). Gas 2017 - Analysis and forcasts to 2022. Paris: International Energy Agency.
IEA/OECD. (2016). 20 Years of Carbon Capture Storage - Accelerating Future Deployment. Paris: IEA/OECD.
IMF. (2015, June 29). How Large are Global Energy Subsidies? - Country level subsidy estimate. Retrieved from Internation Monetary Fund - Fiscal Affairs Department: www.imf.org/external/np/fad/subsidies/data/codata.xlsx
IPIECA, I. U. (2017). Mapping the oil and gas industry to the Sustainable Development Foals: An Altas. International Petroleum Industry Environmental Conservation Association.
IRENA. (2016). Renewable Energy in the Arab Region - Overview of developments. Abu Dhabi: International Renewable Energy Agency.
IRENA. (2018, 5 31). Offshore Wind: From the Margins to the Centre-Ground. Retrieved from irena.com: http://www.irena.org/newsroom/articles/2018/May/Offshore-Wind-From-the-Margins-to-the-Centre-Ground
Ismael , S. M., H.E. Abdel Aleem, S., & Abdelaziz, A. (2018). Renewable Energy Resources in the Egyptian Oil and Gas: Outlook and Challenges. Retrieved from https://www.researchgate.net/publication/324602716_Renewable_Energy_Resources_in_the_Egyptian_Oil_and_Gas_Industry_Outlooks_and_Challenges
Lütkenhorst, W. A. (2014). Green Industrial Policy. Managing Transformation under Uncertainty. Discussion Paper 28. . Bonn: Deutsches Institut für Entwicklungspolitik: German Devel-opment Institut.
M.A, B., & B.C, M. (2010). Evaluation of renewable energy as source of. Paper number 121178-MS presented at the Latin American and Caribbean petroleum engineering conference, 31 May–3 June, 2009, society of petroleum engineers (SPE) projects, facilities & construction, 97-103.
Maennling, N. S. (2017). How the Oil and Gas Compnaies Can Help Meet the Global Goals on Energy and Climate Change. Columbia Center on Sustainable Investment & Sustainable Development Solutions Network.
Martin, M. (2017, 1 29). Saudi Aramco Said to Weigh Up to $5 Billion of Renewable Deals. Retrieved from bloomberg.com: https://www.bloomberg.com/news/articles/2017-01-29/saudi-aramco-said-to-weigh-up-to-5-billion-of-renewable-deals
Mazzetti, M. J., Nekså, P., Walnum, H. T., & Hemmingsen, A. K. (2014). Energy-Efficient Technologies for Reduction of Offshore CO2 Emmissions. SINTEF Energy Research.
Minjia, Z. M. (2018). Contours of the energy transition: Investment by international oil and gas companies in renewable energy. The Electricity Journal , 82-91.
Miraah, & Petroleum Development Oman. (2015). Meet Miraah: The world’s largest solar plant. Retrieved from pdo.co.om: http://www.pdo.co.om/en/news/publications/Publications%20Doc%20Library/_PublicationsFile_%20Miraah%20fact%20sheet_R.pdf
NewEuropeanEconomy. (n.d.). Why invest in off-shore wind energy? Retrieved from NewEuropeanEconomy.com: https://neweuropeaneconomy.com/top-stories/why-invest-in-offshore-wind-energy-2/
OECD. (nd). How can solar energy support more efficient enhanced oil recovery. OECD.
OGCI. (2018). Policy and Strategy. Retrieved from Oil and Gas Climate Initiative: http://oilandgasclimateinitiative.com/policy-and-strategy/
PDO. (2017, 2 11). Miraah Solar Plant Delivers First Steam to Amal West Oilfield. Retrieved from pdo.co.om: http://www.pdo.co.om/en/news/press-releases/Pages/Miraah%20Solar%20Plant%20Delivers%20First%20Steam%20to%20Amal%20West%20Oilfield.aspx
PDO. (2017, 2 11). Miraah Solar Plant Delivers First Steam to Amal West Oilfield. Retrieved from pdo.co.om: http://www.pdo.co.om/en/news/press-releases/Pages/Miraah%20Solar%20Plant%20Delivers%20First%20Steam%20to%20Amal%20West%20Oilfield.aspx

22
PDO. (2017). Miraah Solar Project. Retrieved from Petroleum Development Oman: http://www.pdo.co.om/en/technical-expertise/solar-project-miraah/Pages/default.aspx
Petroleum Development Oman 1. (2018, 2 14). Amin Solar PV IPP Project - Expression of Interest. Retrieved from pdo.co.om: http://www.pdo.co.om/en/business-with-pdo/Pages/IPPSolarProject.aspx
Petroleum Development Oman 2. (2018, 3 1). PDO Inaugurates Solar Car Park. Retrieved from pdo.co.om: http://www.pdo.co.om/en/news/press-releases/Pages/PDO%20Inaugurates%20Solar%20Car%20Park.aspx
Poudineh, R. (2017). Rethinking energy policy in the MENA’s hydrocarbon economies. The Oxford Institute for Energy Studies - A QUARTERLY JOURNAL FOR DEBATING ENERGY ISSUES AND POLICIE, 9.
QWEC. (n.d.). Siraj Solar. Retrieved from Qatar Water and Electricity Company: https://www.qewc.com/qewc/en/subsidiaries/siraj-solar-energy/
Rahimpour, M. R., & Jokar, S. M. (2012). Feasibility of flare gas reformation to practical energy in Farashband gas refinery: No gas flaring. Journal of hazardous materials , 209-210.
RCREEE. (2017). Arab Future Energy Index - Energy Efficiency 2017. Cairo: Regional Center Renewable Energy Center .
Reuters 2. (2017, 12 18). Eni strengthens renewable energy ties with Algeria’s Sonatrach. Retrieved from reuter.com: https://www.reuters.com/article/us-eni-algeria-renewables/eni-strengthens-renewable-energy-ties-with-algerias-sonatrach-idUSKBN1EC20J).
Reuters. (2017, April 17). Iraq plans three gas processing plants to reduce flaring. Retrieved from Reuters: https://af.reuters.com/article/commoditiesNews/idAFL8N1HP1E5
Reyadah, A. (2017, 1 8). Al Reyadah, CCSU Project, Abu Dhabi. Retrieved from masdar.ae: https://masdar.ae/assets/downloads/content/5102/al_reyadah_factsheet-final-jan_8,_2017.pdf
Stanton, C. (2010). The burning question of gas flares. The National.
Thompson, E. V. (2017). Petroleum Archives Project - Arabian Peninsula and Gulf studies program - University of Virginia. Retrieved from www.virginia.edu: http://www.virginia.edu/igpr/APAG/apagoilcompany.html
Total. (n.d.). Improving energy efficiency. Retrieved from Total: https://www.total.com/en/commitment/environmental-issues-challenges/climate-change/energy-efficiency-carbon-reduction
UNFCCC. (2017). Nationally Determined Contributions (NDCs).
Retrieved from UNFCCC: https://unfccc.int/process-and-meetings/the-paris-agreement/nationally-determined-contributions-ndcs
United Nations. (2018). Sustainable Development UN. Retrieved from United Nations website: https://sustainabledevelopment.un.org/topics/sustainabledevelopmentgoals
WindEurope. (2018). Offshore Wind in Europe - Key Trends and Statistics 2017. Brussels: Wind Europe.
World Bank. (2016). Global Gas Flaring Reduction Partnership (GGFR). Retrieved from World Bank: http://www.worldbank.org/en/programs/gasflaringreduction#7

23
Related Documents