CHAPTER 6 Eberhard Jochem (Germany) LEAD AUTHORS: Anthony Adegbulugbe (Nigeria), Bernard Aebischer (Switzerland), Somnath Bhattacharjee (India), Inna Gritsevich (Russia), Gilberto Jannuzzi (Brazil), Tamas Jaszay (Hungary), Bidyut Baran Saha (Japan), Ernst Worrell (United States), and Zhou Fengqi (China) CONTRIBUTING AUTHORS: Mohamed Taoufik Adyel (Morocco), John Akinbami (Nigeria), David Bonilla (Japan), Allen Chen (United States), Alexander Kolesov (Russia), Hans Florentin Krause (United States), Wilhelm Mannsbart (Germany), Tim McIntosch (Canada), Louise Metivier (Canada), Folasade Oketola (Nigeria), David Pelemo (Nigeria), Jean Pierre Des Rosiers (France), Lee Schipper (United States), and XiuJian Hu (China) energy end-use efficiency

Welcome message from author
This document is posted to help you gain knowledge. Please leave a comment to let me know what you think about it! Share it to your friends and learn new things together.
Transcript
CHAPTER 6
Eberhard Jochem (Germany)LEAD AUTHORS: Anthony Adegbulugbe (Nigeria), Bernard Aebischer (Switzerland),Somnath Bhattacharjee (India), Inna Gritsevich (Russia), Gilberto Jannuzzi (Brazil), Tamas Jaszay(Hungary), Bidyut Baran Saha (Japan), Ernst Worrell (United States), and Zhou Fengqi (China)
CONTRIBUTING AUTHORS: Mohamed Taoufik Adyel (Morocco), John Akinbami(Nigeria), David Bonilla (Japan), Allen Chen (United States), Alexander Kolesov (Russia),Hans Florentin Krause (United States), Wilhelm Mannsbart (Germany), Tim McIntosch(Canada), Louise Metivier (Canada), Folasade Oketola (Nigeria), David Pelemo (Nigeria),Jean Pierre Des Rosiers (France), Lee Schipper (United States), and XiuJian Hu (China)
energy end-use efficiency
WORLD ENERGY ASSESSMENT: ENERGY AND THE CHALLENGE OF SUSTAINABILITY
Chapter 6: Energy End-Use Efficiency
174
Since the 1970s more efficient energy use in OECD countries has weakened or
eliminated the link between economic growth andenergy use. At the global level just 37 percent ofprimary energy is converted to useful energy—meaning that nearly two-thirds is lost. The next 20years will likely see energy efficiency gains of25–35 percent in most industrialised countriesand more than 40 percent in transition economies.Dematerialization and recycling will furtherreduce energy intensity. Thus energy efficiency isone of the main technological drivers of sustainabledevelopment world-wide.
Energy policy has traditionally underestimatedthe benefits of end-use efficiency for society, theenvironment, and employment. Achievable levelsof economic efficiency depend on a country’sindustrialisation, motorization, electrification,human capital, and policies. But their realisationcan be slowed by sector- and technology-specificobstacles—including lack of knowledge, legal andadministrative obstacles, and the market power ofenergy industries. Governments and companiesshould recognise innovations that can lower these obstacles. The external costs of energy usecan be covered by energy taxes, environmental legislation, and greenhouse gas emissions trading.There is also an important role for internationalharmonisation of regulations for efficiency of traded products. Rapid growth in demand providesespecially favourable conditions for innovations indeveloping countries—enabling these countries toleapfrog stages of development if market reformsare also in place.
The economic potentials of more efficient energyuse will continue to grow with new technologiesand with cost reductions resulting from economiesof scale and learning effects. Considerations of thesecond law of thermodynamics at all levels ofenergy conversion and technological improvementsat the level of useful energy suggest further potentialfor technical efficiency of almost one order of magnitude that may become available during thiscentury. Finally, structural changes in industrialisedand transition economies—moving to less energy-intensive production and consumption—will likelycontribute to stagnant or lower energy demand percapita in these countries. ■
ABSTRACT

WORLD ENERGY ASSESSMENT: ENERGY AND THE CHALLENGE OF SUSTAINABILITY
Chapter 6: Energy End-Use Efficiency
175
oday more than 400,000petajoules a year of primary
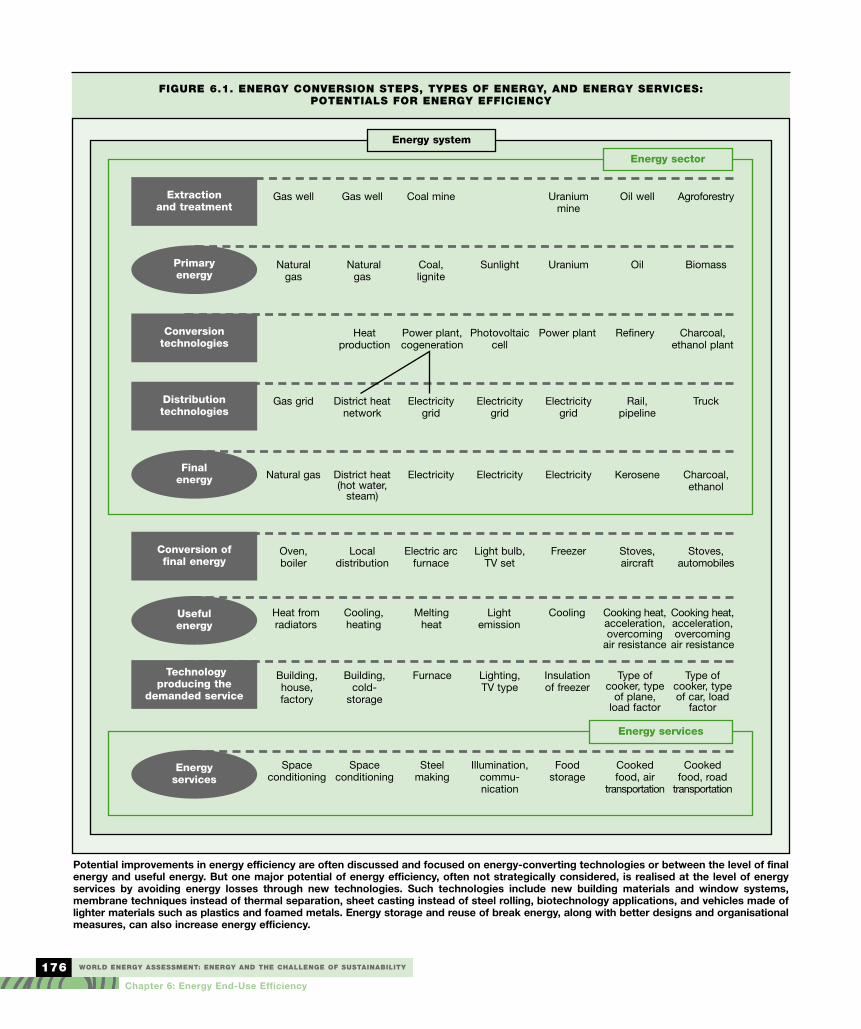
energy deliver almost 300,000 petajoulesof final energy to customers, resulting inan estimated 150,000 petajoules of usefulenergy after conversion in end-use devices.Thus 250,000 petajoules are lost, mostly as low- and medium-temperature heat. Globally, then, the energy efficiency of converting primary to useful energy is estimated at 37 percent. Moreover, considering the capacity to work (that is, theexergy) of primary energy relative to the exergy needed by usefulenergy according to the second law of thermodynamics, the efficiency of today’s energy systems in industrialised countries is less than 15 percent. But energy efficiency can be improved—andenergy losses avoided—during the often overlooked step betweenuseful energy and energy services (figure 6.1).
One main goal of energy analysis in the context of sustainabledevelopment is to explore ways to reduce the amount of energy usedto produce a service or a unit of economic output—and, indirectly,to reduce related emissions. Two questions are key: How tight is thelink between final energy use and the energy service in a given enduse? And what is the potential for technological and organisationalchanges to weaken that link in the next 10–20 years? Because the technologies used in different regions differ substantially, the potential for economic efficiency varies. Still, more efficient energyuse is one of the main options for achieving global sustainabledevelopment in the 21st century.
This chapter focuses on end-use energy efficiency—that is, moreefficient use of final energy or useful energy in industry, services,agriculture, households, transportation, and other areas (see figure6.1). Supply-side energy efficiency (energy extraction, conversion,transportation, and distribution) is treated in chapters 5 and 8.Supply-side efficiency has been the focus of energy investment andresearch and development since the early 20th century. End-use efficiency has received similar attention only since the mid-1970s,having been proven cheaper in many cases but often more difficultto achieve for reasons discussed below.
Energy efficiency—and indirectly, improved material efficiency—alleviates the conflicting objectives of energy policy. Competitive andlow (but full-cost) energy prices support economic development.But they increase the environmental burden of energy use. They alsoincrease net imports of conventional energies and so tend to decreasethe diversity of supply. Using less energy for the same service is oneway to avoid this conflict. The other way is to increase the use ofrenewable energies (chapter 7).
Recent trends in energy intensity in countries and regionsA sector’s energy use, divided by gross domestic product (GDP), isthe starting point for understanding differences in the efficient useof final energy by sector, country, or period. With few exceptions,such analyses have been carried out over long periods only in OECD
countries (IEA, 1997a; Morovic andothers, 1989; Diekmann and others,
1999). These ratios are instructive forwhat they say about energy use in different
economies at a given point in time. Theycan also be used to measure changes in energy
efficiency and other components of energy use—such as changes in the structure and consumption of a given
sector or subsector. Changes in energy efficiency are driven by higherprices, technical improvements, new technologies, cost competition,and energy conservation programmes.
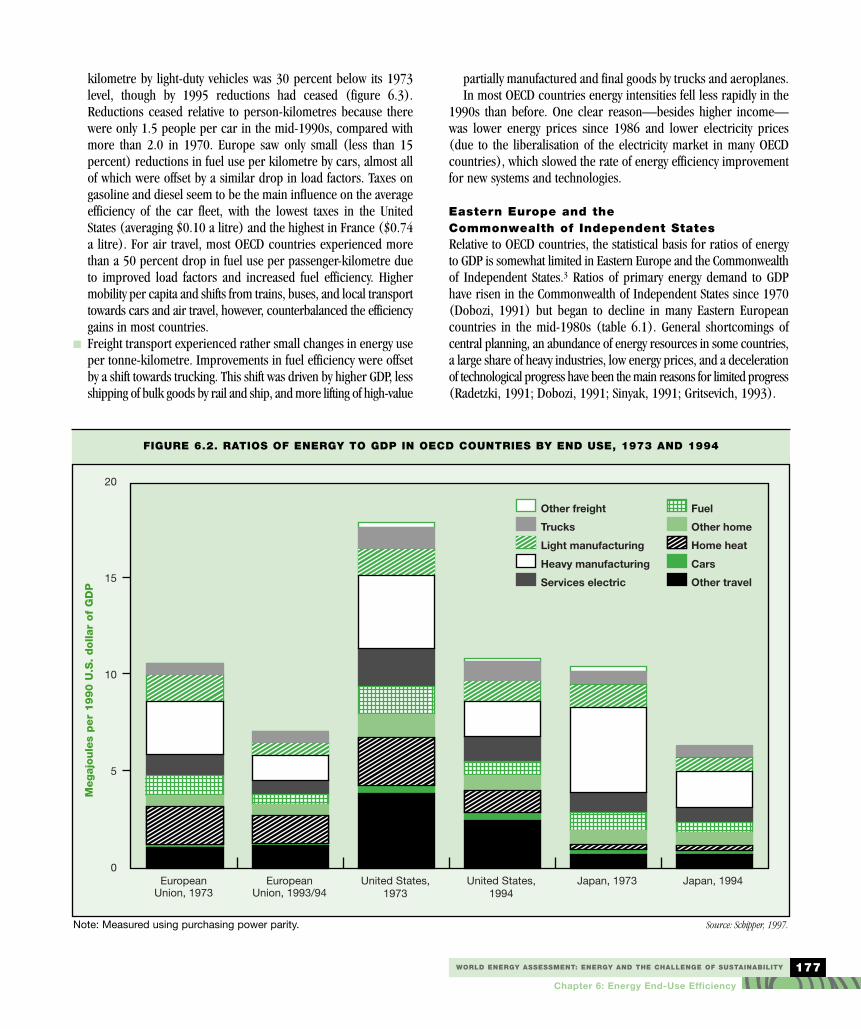
OECD countriesOver the past 30 years every OECD country and region saw a sharpdecline in ratios of energy to GDP (figure 6.2; box 6.1).1 Changesin energy use were distributed unevenly among sectors, however, andonly part of the decline was related to increased energy efficiency:■ Industry experienced the largest reductions in ratios of energy to
GDP—between 20 and 50 percent. Energy efficiency (if structuralchange is excluded by holding constant the mix of output in1990) increased by more than 1 percent a year through the late1980s, after which lower fuel prices caused a slowdown inimprovements (Diekmann and others, 1999). In Japan, theUnited States, and West Germany the absolute demand for energyby industry dropped about 10 percent because of changes in themix of products. In other countries structural changes had littleimpact on energy use.
■ Among households, energy requirements per unit of floor areafell modestly, led by space heating. Despite far more extensiveindoor heating (with more central heating), in almost all OECDcountries energy use was lower in the 1990s than in the early1970s. (The only notable exception was Japan, where income-driven improvements in heating outweighed savings from addedinsulation in new buildings and from more efficient heatingequipment.) In addition, in most countries the unit consumptionof appliances (in kilowatt-hours per year) fell. Increased efficiency outpaced trends towards larger appliances. On thestructural side, however, household size continued to shrink,raising per capita energy use. New homes had larger areas percapita and more appliances, continuing an income effect datingfrom the early 1950s.
■ Space heating in the service sector also required less energy—inheat per square metre—in most OECD countries. Electricity useremained closely tied to service sector GDP, but showed littleupward trend except where electric heating was important. Thisoutcome may be surprising given the enormous importance ofelectrification and office automation in the service sector. Overtime there is a close relationship between electricity use andfloor area.
■ In passenger transportation, energy use is dominated by cars andin a few countries (such as the United States) by light trucks. In Canada and the United States in the early 1990s fuel use per
More efficient energy use is one of the main options for achieving global sustainable
development in the 21st century.
T
WORLD ENERGY ASSESSMENT: ENERGY AND THE CHALLENGE OF SUSTAINABILITY
Chapter 6: Energy End-Use Efficiency
176
FIGURE 6.1. ENERGY CONVERSION STEPS, TYPES OF ENERGY, AND ENERGY SERVICES: POTENTIALS FOR ENERGY EFFICIENCY
Potential improvements in energy efficiency are often discussed and focused on energy-converting technologies or between the level of finalenergy and useful energy. But one major potential of energy efficiency, often not strategically considered, is realised at the level of energyservices by avoiding energy losses through new technologies. Such technologies include new building materials and window systems, membrane techniques instead of thermal separation, sheet casting instead of steel rolling, biotechnology applications, and vehicles made oflighter materials such as plastics and foamed metals. Energy storage and reuse of break energy, along with better designs and organisationalmeasures, can also increase energy efficiency.
Energy system
Energy services
Gas well Gas well Coal mine Uraniummine
Oil well Agroforestry
Natural gas
Naturalgas
Coal,lignite
Sunlight Uranium Oil Biomass
Heat production
Power plant,cogeneration
Photovoltaiccell
Power plant Refinery Charcoal,ethanol plant
Gas grid District heatnetwork
Electricitygrid
Electricitygrid
Electricitygrid
Rail,pipeline
Truck
Natural gas District heat(hot water,
steam)
Electricity Electricity Electricity Kerosene Charcoal,ethanol
Oven, boiler
Local distribution
Electric arcfurnace
Light bulb,TV set
Freezer Stoves, aircraft
Stoves,automobiles
Heat from radiators
Cooling,heating
Melting heat
Light emission
Cooling Cooking heat,acceleration,overcoming
air resistance
Cooking heat,acceleration,overcoming
air resistance
Building,house, factory
Building,cold-
storage
Furnace Lighting,TV type
Insulation of freezer
Type ofcooker, type
of plane,load factor
Type ofcooker, typeof car, load
factor
Space conditioning
Space conditioning
Steel making
Illumination,commu-nication
Food storage
Cookedfood, air
transportation
Cookedfood, road
transportation
Extraction and treatment
Primary energy
Conversion technologies
Distribution technologies
Finalenergy
Conversion of final energy
Usefulenergy
Technology producing the
demanded service
Energyservices
Energy sector
WORLD ENERGY ASSESSMENT: ENERGY AND THE CHALLENGE OF SUSTAINABILITY
Chapter 6: Energy End-Use Efficiency
177
kilometre by light-duty vehicles was 30 percent below its 1973level, though by 1995 reductions had ceased (figure 6.3).Reductions ceased relative to person-kilometres because therewere only 1.5 people per car in the mid-1990s, compared withmore than 2.0 in 1970. Europe saw only small (less than 15 percent) reductions in fuel use per kilometre by cars, almost allof which were offset by a similar drop in load factors. Taxes ongasoline and diesel seem to be the main influence on the averageefficiency of the car fleet, with the lowest taxes in the UnitedStates (averaging $0.10 a litre) and the highest in France ($0.74a litre). For air travel, most OECD countries experienced morethan a 50 percent drop in fuel use per passenger-kilometre dueto improved load factors and increased fuel efficiency. Highermobility per capita and shifts from trains, buses, and local transporttowards cars and air travel, however, counterbalanced the efficiencygains in most countries.
■ Freight transport experienced rather small changes in energy useper tonne-kilometre. Improvements in fuel efficiency were offsetby a shift towards trucking. This shift was driven by higher GDP, lessshipping of bulk goods by rail and ship, and more lifting of high-value
partially manufactured and final goods by trucks and aeroplanes.In most OECD countries energy intensities fell less rapidly in the
1990s than before. One clear reason—besides higher income—was lower energy prices since 1986 and lower electricity prices(due to the liberalisation of the electricity market in many OECDcountries), which slowed the rate of energy efficiency improvementfor new systems and technologies.
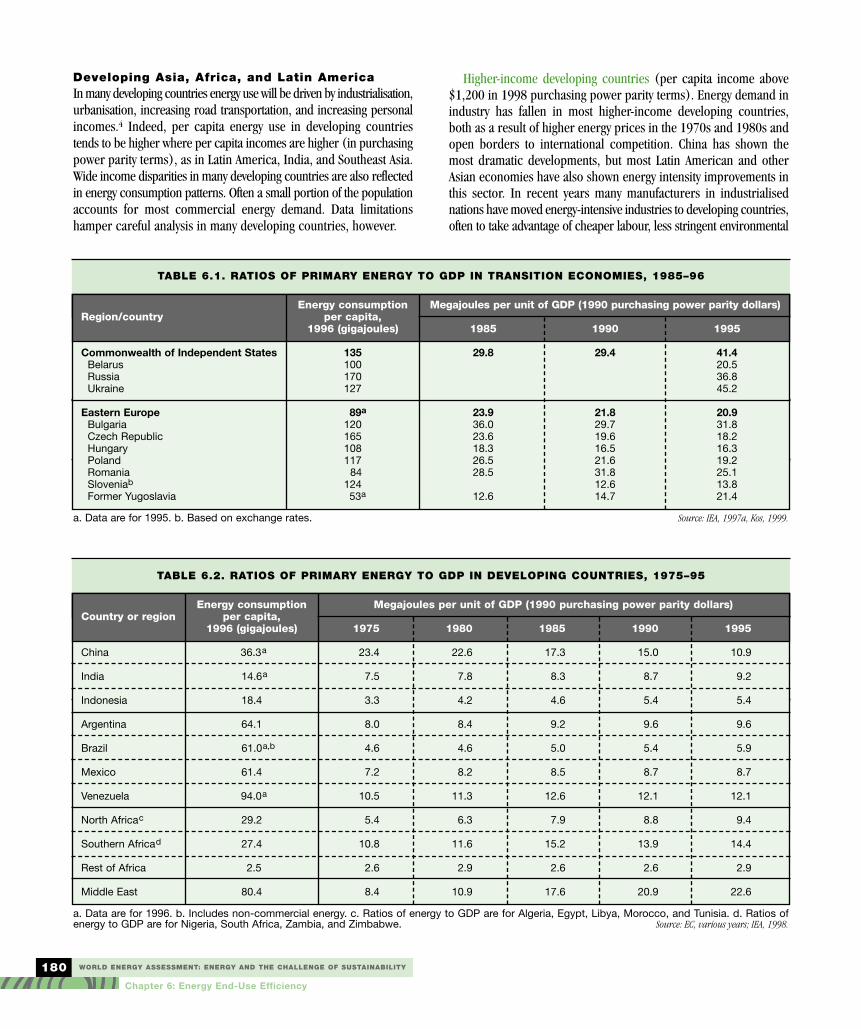
Eastern Europe and the Commonwealth of Independent StatesRelative to OECD countries, the statistical basis for ratios of energyto GDP is somewhat limited in Eastern Europe and the Commonwealthof Independent States.3 Ratios of primary energy demand to GDPhave risen in the Commonwealth of Independent States since 1970(Dobozi, 1991) but began to decline in many Eastern Europeancountries in the mid-1980s (table 6.1). General shortcomings ofcentral planning, an abundance of energy resources in some countries,a large share of heavy industries, low energy prices, and a decelerationof technological progress have been the main reasons for limited progress(Radetzki, 1991; Dobozi, 1991; Sinyak, 1991; Gritsevich, 1993).
FIGURE 6.2. RATIOS OF ENERGY TO GDP IN OECD COUNTRIES BY END USE, 1973 AND 1994
0
5
10
15
20
Other freight
Trucks
Light manufacturing
Heavy manufacturing
Services electric
Fuel
Other home
Home heat
Cars
Other travel
Japan, 1994Japan, 1973United States,1994
United States,1973
EuropeanUnion, 1993/94
EuropeanUnion, 1973
Note: Measured using purchasing power parity. Source: Schipper, 1997.
Megajo
ule
s per
1990 U
.S.
dolla
r of
GD
P
WORLD ENERGY ASSESSMENT: ENERGY AND THE CHALLENGE OF SUSTAINABILITY
Chapter 6: Energy End-Use Efficiency
178
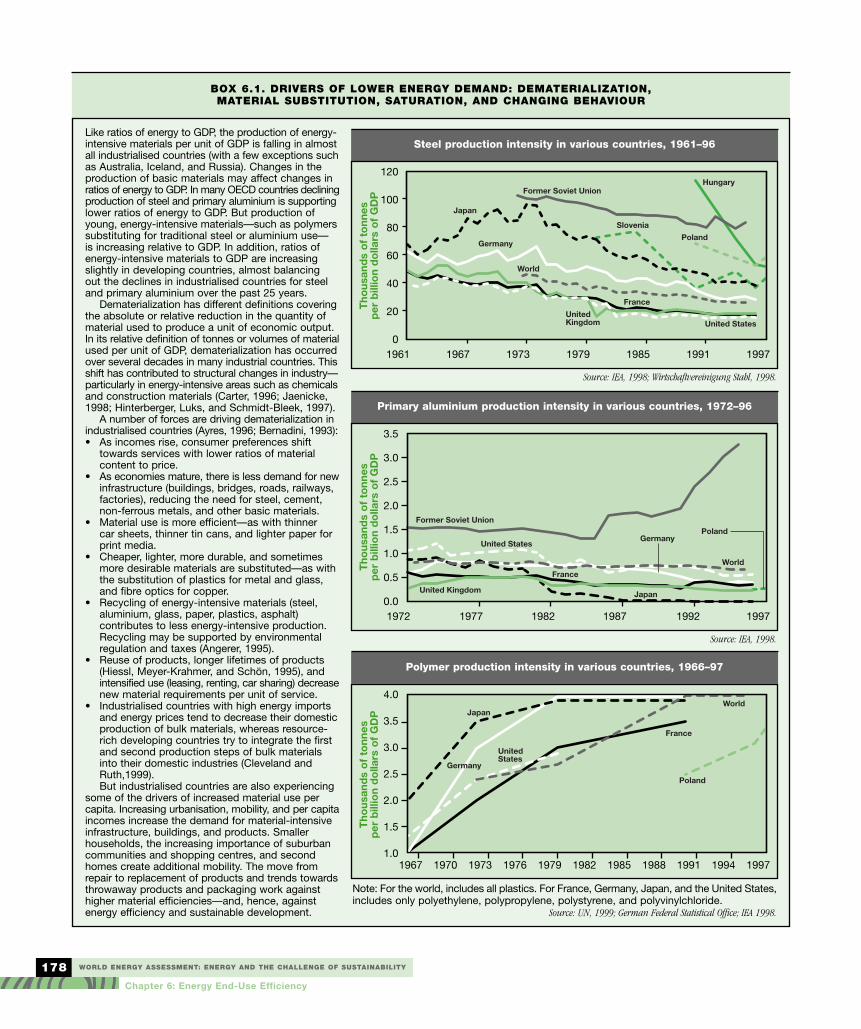
BOX 6.1. DRIVERS OF LOWER ENERGY DEMAND: DEMATERIALIZATION, MATERIAL SUBSTITUTION, SATURATION, AND CHANGING BEHAVIOUR
Like ratios of energy to GDP, the production of energy-intensive materials per unit of GDP is falling in almostall industrialised countries (with a few exceptions suchas Australia, Iceland, and Russia). Changes in theproduction of basic materials may affect changes inratios of energy to GDP. In many OECD countries decliningproduction of steel and primary aluminium is supportinglower ratios of energy to GDP. But production ofyoung, energy-intensive materials—such as polymerssubstituting for traditional steel or aluminium use—is increasing relative to GDP. In addition, ratios ofenergy-intensive materials to GDP are increasingslightly in developing countries, almost balancing out the declines in industrialised countries for steeland primary aluminium over the past 25 years.
Dematerialization has different definitions coveringthe absolute or relative reduction in the quantity ofmaterial used to produce a unit of economic output.In its relative definition of tonnes or volumes of materialused per unit of GDP, dematerialization has occurredover several decades in many industrial countries. Thisshift has contributed to structural changes in industry—particularly in energy-intensive areas such as chemicalsand construction materials (Carter, 1996; Jaenicke,1998; Hinterberger, Luks, and Schmidt-Bleek, 1997).
A number of forces are driving dematerialization inindustrialised countries (Ayres, 1996; Bernadini, 1993): • As incomes rise, consumer preferences shift
towards services with lower ratios of materialcontent to price.
• As economies mature, there is less demand for newinfrastructure (buildings, bridges, roads, railways,factories), reducing the need for steel, cement,non-ferrous metals, and other basic materials.
• Material use is more efficient—as with thinner car sheets, thinner tin cans, and lighter paper forprint media.
• Cheaper, lighter, more durable, and sometimesmore desirable materials are substituted—as withthe substitution of plastics for metal and glass,and fibre optics for copper.
• Recycling of energy-intensive materials (steel, aluminium, glass, paper, plastics, asphalt) contributes to less energy-intensive production.Recycling may be supported by environmentalregulation and taxes (Angerer, 1995).
• Reuse of products, longer lifetimes of products(Hiessl, Meyer-Krahmer, and Schön, 1995), andintensified use (leasing, renting, car sharing) decreasenew material requirements per unit of service.
• Industrialised countries with high energy importsand energy prices tend to decrease their domesticproduction of bulk materials, whereas resource-rich developing countries try to integrate the firstand second production steps of bulk materialsinto their domestic industries (Cleveland andRuth,1999).But industrialised countries are also experiencing
some of the drivers of increased material use percapita. Increasing urbanisation, mobility, and per capitaincomes increase the demand for material-intensiveinfrastructure, buildings, and products. Smallerhouseholds, the increasing importance of suburbancommunities and shopping centres, and secondhomes create additional mobility. The move fromrepair to replacement of products and trends towardsthrowaway products and packaging work againsthigher material efficiencies—and, hence, againstenergy efficiency and sustainable development.
Note: For the world, includes all plastics. For France, Germany, Japan, and the United States,includes only polyethylene, polypropylene, polystyrene, and polyvinylchloride.
Source: UN, 1999; German Federal Statistical Office; IEA 1998.
Source: IEA, 1998; Wirtschaftvereinigung Stahl, 1998.
Steel production intensity in various countries, 1961–96
World
Poland
Hungary
Slovenia
Germany
Former Soviet Union
France
UnitedKingdom
Japan
United States
Tho
usan
ds
of
tonn
es
per
bill
ion
do
llars
of
GD
P
120
100
80
60
40
20
01961 1967 1973 1979 1985 1991 1997
Source: IEA, 1998.
Primary aluminium production intensity in various countries, 1972–96
World
PolandGermany
Former Soviet Union
France
United Kingdom
United States
Japan
Tho
usan
ds
of
tonn
es
per
bill
ion
do
llars
of
GD
P
3.5
3.0
2.5
2.0
1.5
1.0
0.5
0.01972 1977 1982 1987 1992 1997
Polymer production intensity in various countries, 1966–97
World
Poland
France
UnitedStates
Japan
Germany
Tho
usan
ds
of
tonn
es
per
bill
ion
do
llars
of
GD
P
4.0
3.5
3.0
2.5
2.0
1.5
1.01967 1970 1973 1976 1979 1982 1985 1988 1991 1994 1997

WORLD ENERGY ASSESSMENT: ENERGY AND THE CHALLENGE OF SUSTAINABILITY
Chapter 6: Energy End-Use Efficiency
179
Ratios of primary energy to GDP have gone through two phasesin these countries, separated by the onset of economic and politicalreform in the late 1980s and the 1990s. Whereas the ratio increasedin Russia, it declined in Armenia, Belarus, Estonia, Kyrgyzstan, Latvia,and Tajikistan. Among the other members of the Commonwealth ofIndependent States the ratio fluctuated for reasons other thanimprovements in energy efficiency (IEA, 1997a, 1998). Since 1990 theratio has declined in most Eastern European countries (see table 6.1).■ In industry, final energy consumption per unit of output fell less
than 1 percent a year in Eastern Europe in 1990–97 but increasedalmost 7 percent a year in Russia (CENEf, 1998).
■ Transportation saw few changes in energy use per passenger-kilometre or tonne-kilometre for the two main modes, cars and trucks.
■ Among households, small gains in the thermal integrity of buildings could not overcome increasing demands for heatingand comfort. Indeed, in the mid-1980s centrally heated EasternEuropean buildings required 50–100 percent more final energyper unit of area and per degree day (that is, using standardisedwinter outdoor temperatures) than similar buildings in WesternEurope. Moreover, home appliances were often small and inefficient.
In the early 1990s economic reforms began to restructure production and consumption patterns and raise once-subsidisedenergy prices. In the Baltics, the Czech Republic, Hungary, andPoland this phase led to real declines in ratios of primary energy toGDP as efficiency increased and the structure of manufacturingchanged (see table 6.1). Several transition economies also sawlower household fuel use for space and water heating. Such changeswere often not related to efficiency, however, and were insteadcaused by energy shortages, higher energy prices, and relatedchanges in heating behaviour.
Overall, transition economies showed a remarkable contractionin energy use by industry, mostly because of structural changes(Bashmakov, 1997a). But this trend has nearly been outweighed by rapid growth in road transportation and (in some countries) in electricity for appliances and services. Structural changes inindustry, integration with global markets, and investments in newprocesses, buildings, and infrastructure are expected to improveenergy efficiency considerably over the next 20 years. These trendswill likely help stabilise energy demand despite rising incomes andGDP in these countries.
FIGURE 6.3. WEIGHTED AVERAGE OF ON-ROAD AUTOMOBILE GASOLINE AND DIESEL FUEL INTENSITIES IN OECD COUNTRIES, 1970–95
Australia
United States
Japan
France
Italy
Norway
Denmark
Netherlands
Canada
Source: Schipper, 1997.
Lit
res
of
gaso
line p
er
100 k
ilom
etr
es
19
18
17
16
15
14
13
12
11
10
9
8
7
1970 1975 1980 1985 1990 1995
WORLD ENERGY ASSESSMENT: ENERGY AND THE CHALLENGE OF SUSTAINABILITY
Chapter 6: Energy End-Use Efficiency
180
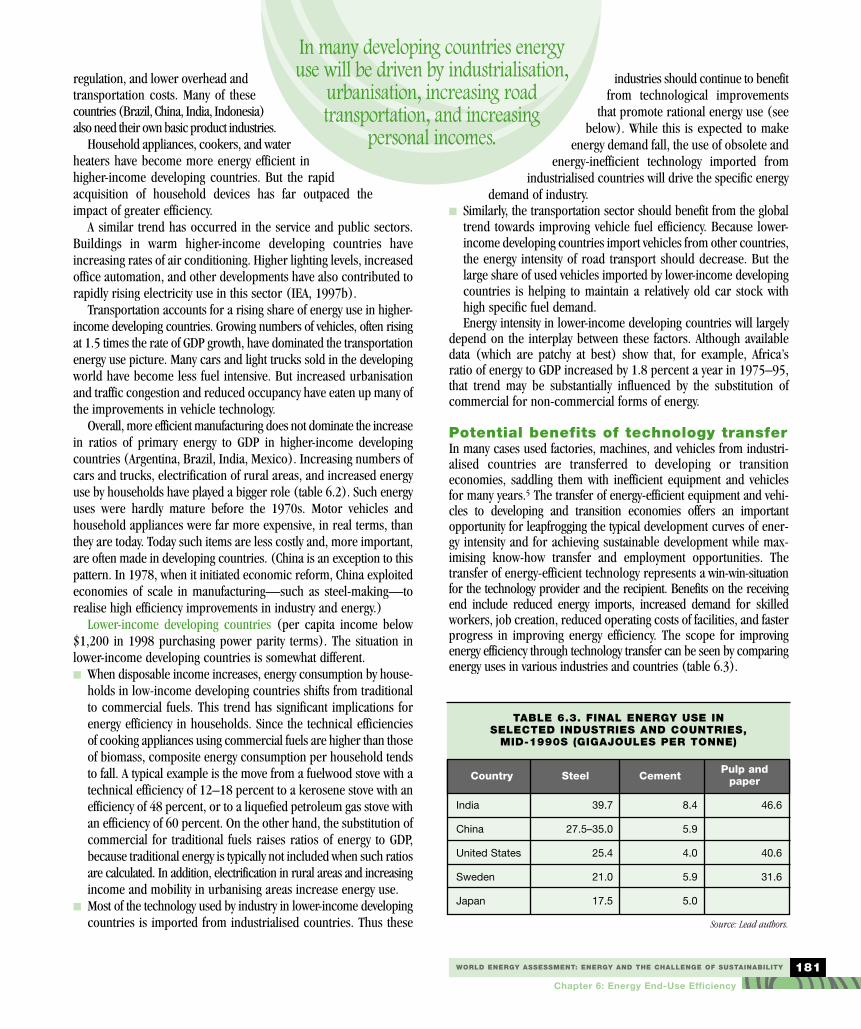
Developing Asia, Africa, and Latin AmericaIn many developing countries energy use will be driven by industrialisation,urbanisation, increasing road transportation, and increasing personalincomes.4 Indeed, per capita energy use in developing countriestends to be higher where per capita incomes are higher (in purchasingpower parity terms), as in Latin America, India, and Southeast Asia.Wide income disparities in many developing countries are also reflectedin energy consumption patterns. Often a small portion of the populationaccounts for most commercial energy demand. Data limitationshamper careful analysis in many developing countries, however.
Higher-income developing countries (per capita income above$1,200 in 1998 purchasing power parity terms). Energy demand inindustry has fallen in most higher-income developing countries,both as a result of higher energy prices in the 1970s and 1980s andopen borders to international competition. China has shown themost dramatic developments, but most Latin American and otherAsian economies have also shown energy intensity improvements inthis sector. In recent years many manufacturers in industrialisednations have moved energy-intensive industries to developing countries,often to take advantage of cheaper labour, less stringent environmental
TABLE 6.2. RATIOS OF PRIMARY ENERGY TO GDP IN DEVELOPING COUNTRIES, 1975–95
Country or region
China
India
Indonesia
Argentina
Brazil
Mexico
Venezuela
North Africac
Southern Africad
Rest of Africa
Middle East
Energy consumptionper capita,
1996 (gigajoules)
36.3a
14.6a
18.4
64.1
61.0a,b
61.4
94.0a
29.2
27.4
2.5
80.4
1975
23.4
7.5
3.3
8.0
4.6
7.2
10.5
5.4
10.8
2.6
8.4
1980
22.6
7.8
4.2
8.4
4.6
8.2
11.3
6.3
11.6
2.9
10.9
1985
17.3
8.3
4.6
9.2
5.0
8.5
12.6
7.9
15.2
2.6
17.6
1990
15.0
8.7
5.4
9.6
5.4
8.7
12.1
8.8
13.9
2.6
20.9
1995
10.9
9.2
5.4
9.6
5.9
8.7
12.1
9.4
14.4
2.9
22.6
Megajoules per unit of GDP (1990 purchasing power parity dollars)
a. Data are for 1996. b. Includes non-commercial energy. c. Ratios of energy to GDP are for Algeria, Egypt, Libya, Morocco, and Tunisia. d. Ratios ofenergy to GDP are for Nigeria, South Africa, Zambia, and Zimbabwe. Source: EC, various years; IEA, 1998.
TABLE 6.1. RATIOS OF PRIMARY ENERGY TO GDP IN TRANSITION ECONOMIES, 1985–96
Region/country
Commonwealth of Independent StatesBelarusRussiaUkraine
Eastern EuropeBulgariaCzech RepublicHungaryPolandRomaniaSloveniab
Former Yugoslavia
Energy consumptionper capita,
1996 (gigajoules)
135100170127
89a
120165108117
8412453a
1985
29.8
23.936.023.618.326.528.5
12.6
1990
29.4
21.829.719.616.521.631.812.614.7
1995
41.420.536.845.2
20.931.818.216.319.225.113.821.4
Megajoules per unit of GDP (1990 purchasing power parity dollars)
a. Data are for 1995. b. Based on exchange rates. Source: IEA, 1997a, Kos, 1999.
regulation, and lower overhead andtransportation costs. Many of thesecountries (Brazil, China, India, Indonesia)also need their own basic product industries.
Household appliances, cookers, and waterheaters have become more energy efficient inhigher-income developing countries. But the rapidacquisition of household devices has far outpaced theimpact of greater efficiency.
A similar trend has occurred in the service and public sectors.Buildings in warm higher-income developing countries haveincreasing rates of air conditioning. Higher lighting levels, increasedoffice automation, and other developments have also contributed torapidly rising electricity use in this sector (IEA, 1997b).
Transportation accounts for a rising share of energy use in higher-income developing countries. Growing numbers of vehicles, often risingat 1.5 times the rate of GDP growth, have dominated the transportationenergy use picture. Many cars and light trucks sold in the developingworld have become less fuel intensive. But increased urbanisationand traffic congestion and reduced occupancy have eaten up many ofthe improvements in vehicle technology.
Overall, more efficient manufacturing does not dominate the increasein ratios of primary energy to GDP in higher-income developingcountries (Argentina, Brazil, India, Mexico). Increasing numbers ofcars and trucks, electrification of rural areas, and increased energyuse by households have played a bigger role (table 6.2). Such energyuses were hardly mature before the 1970s. Motor vehicles andhousehold appliances were far more expensive, in real terms, thanthey are today. Today such items are less costly and, more important,are often made in developing countries. (China is an exception to thispattern. In 1978, when it initiated economic reform, China exploitedeconomies of scale in manufacturing—such as steel-making—torealise high efficiency improvements in industry and energy.)
Lower-income developing countries (per capita income below$1,200 in 1998 purchasing power parity terms). The situation inlower-income developing countries is somewhat different.■ When disposable income increases, energy consumption by house-
holds in low-income developing countries shifts from traditionalto commercial fuels. This trend has significant implications forenergy efficiency in households. Since the technical efficienciesof cooking appliances using commercial fuels are higher than thoseof biomass, composite energy consumption per household tendsto fall. A typical example is the move from a fuelwood stove with atechnical efficiency of 12–18 percent to a kerosene stove with anefficiency of 48 percent, or to a liquefied petroleum gas stove withan efficiency of 60 percent. On the other hand, the substitution ofcommercial for traditional fuels raises ratios of energy to GDP,because traditional energy is typically not included when such ratiosare calculated. In addition, electrification in rural areas and increasingincome and mobility in urbanising areas increase energy use.
■ Most of the technology used by industry in lower-income developingcountries is imported from industrialised countries. Thus these
industries should continue to benefitfrom technological improvements
that promote rational energy use (seebelow). While this is expected to make
energy demand fall, the use of obsolete andenergy-inefficient technology imported from
industrialised countries will drive the specific energydemand of industry.
■ Similarly, the transportation sector should benefit from the globaltrend towards improving vehicle fuel efficiency. Because lower-income developing countries import vehicles from other countries,the energy intensity of road transport should decrease. But thelarge share of used vehicles imported by lower-income developingcountries is helping to maintain a relatively old car stock withhigh specific fuel demand.Energy intensity in lower-income developing countries will largely
depend on the interplay between these factors. Although availabledata (which are patchy at best) show that, for example, Africa’s ratio of energy to GDP increased by 1.8 percent a year in 1975–95,that trend may be substantially influenced by the substitution ofcommercial for non-commercial forms of energy.
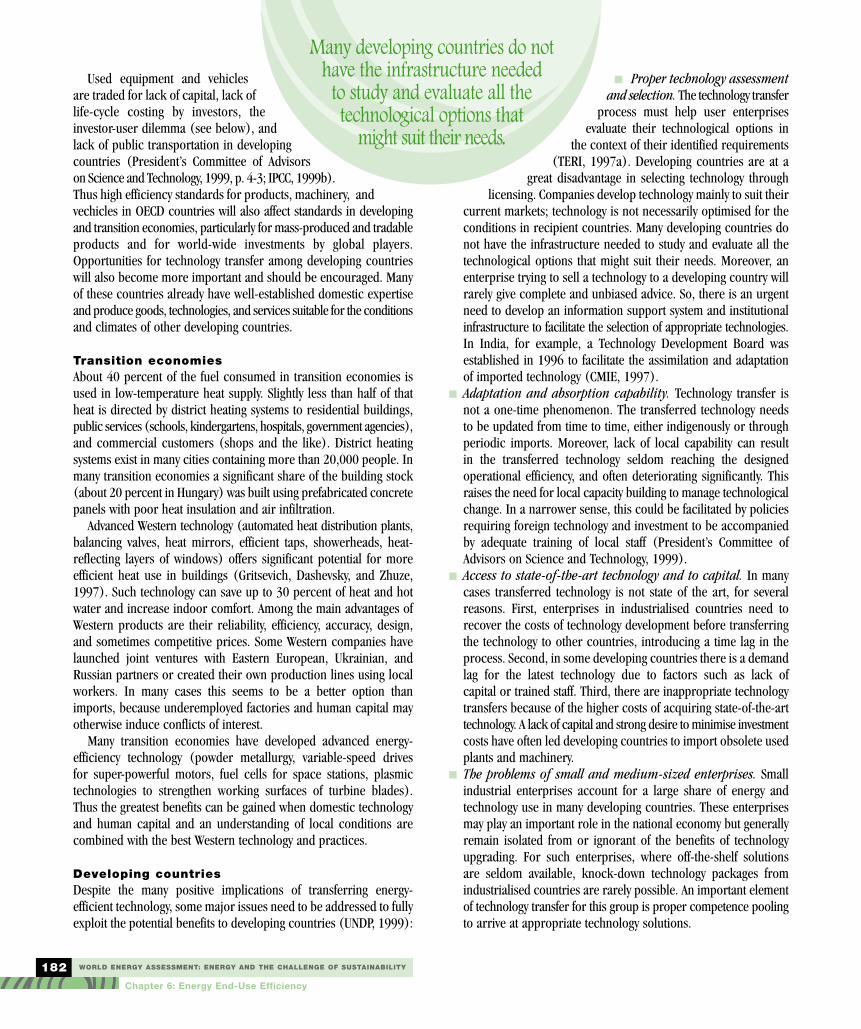
Potential benefits of technology transferIn many cases used factories, machines, and vehicles from industri-alised countries are transferred to developing or transitioneconomies, saddling them with inefficient equipment and vehiclesfor many years.5 The transfer of energy-efficient equipment and vehi-cles to developing and transition economies offers an importantopportunity for leapfrogging the typical development curves of ener-gy intensity and for achieving sustainable development while max-imising know-how transfer and employment opportunities. Thetransfer of energy-efficient technology represents a win-win-situationfor the technology provider and the recipient. Benefits on the receivingend include reduced energy imports, increased demand for skilledworkers, job creation, reduced operating costs of facilities, and fasterprogress in improving energy efficiency. The scope for improvingenergy efficiency through technology transfer can be seen by comparingenergy uses in various industries and countries (table 6.3).
WORLD ENERGY ASSESSMENT: ENERGY AND THE CHALLENGE OF SUSTAINABILITY
Chapter 6: Energy End-Use Efficiency
181
In many developing countries energy use will be driven by industrialisation,
urbanisation, increasing road transportation, and increasing
personal incomes.
Source: Lead authors.
TABLE 6.3. FINAL ENERGY USE IN SELECTED INDUSTRIES AND COUNTRIES,
MID-1990S (GIGAJOULES PER TONNE)
Country
India
China
United States
Sweden
Japan
Steel
39.7
27.5–35.0
25.4
21.0
17.5
Cement
8.4
5.9
4.0
5.9
5.0
Pulp andpaper
46.6
40.6
31.6
WORLD ENERGY ASSESSMENT: ENERGY AND THE CHALLENGE OF SUSTAINABILITY
Chapter 6: Energy End-Use Efficiency
182
Used equipment and vehiclesare traded for lack of capital, lack oflife-cycle costing by investors, theinvestor-user dilemma (see below), andlack of public transportation in developingcountries (President’s Committee of Advisorson Science and Technology, 1999, p. 4-3; IPCC, 1999b).Thus high efficiency standards for products, machinery, andvechicles in OECD countries will also affect standards in developingand transition economies, particularly for mass-produced and tradableproducts and for world-wide investments by global players.Opportunities for technology transfer among developing countrieswill also become more important and should be encouraged. Manyof these countries already have well-established domestic expertiseand produce goods, technologies, and services suitable for the conditionsand climates of other developing countries.
Transition economiesAbout 40 percent of the fuel consumed in transition economies isused in low-temperature heat supply. Slightly less than half of thatheat is directed by district heating systems to residential buildings,public services (schools, kindergartens, hospitals, government agencies),and commercial customers (shops and the like). District heatingsystems exist in many cities containing more than 20,000 people. Inmany transition economies a significant share of the building stock(about 20 percent in Hungary) was built using prefabricated concretepanels with poor heat insulation and air infiltration.
Advanced Western technology (automated heat distribution plants,balancing valves, heat mirrors, efficient taps, showerheads, heat-reflecting layers of windows) offers significant potential for moreefficient heat use in buildings (Gritsevich, Dashevsky, and Zhuze,1997). Such technology can save up to 30 percent of heat and hotwater and increase indoor comfort. Among the main advantages ofWestern products are their reliability, efficiency, accuracy, design,and sometimes competitive prices. Some Western companies havelaunched joint ventures with Eastern European, Ukrainian, andRussian partners or created their own production lines using localworkers. In many cases this seems to be a better option thanimports, because underemployed factories and human capital mayotherwise induce conflicts of interest.
Many transition economies have developed advanced energy-efficiency technology (powder metallurgy, variable-speed drives for super-powerful motors, fuel cells for space stations, plasmictechnologies to strengthen working surfaces of turbine blades).Thus the greatest benefits can be gained when domestic technologyand human capital and an understanding of local conditions arecombined with the best Western technology and practices.
Developing countriesDespite the many positive implications of transferring energy-efficient technology, some major issues need to be addressed to fullyexploit the potential benefits to developing countries (UNDP, 1999):
■ Proper technology assessmentand selection. The technology transfer
process must help user enterprisesevaluate their technological options in
the context of their identified requirements(TERI, 1997a). Developing countries are at a
great disadvantage in selecting technology throughlicensing. Companies develop technology mainly to suit their
current markets; technology is not necessarily optimised for theconditions in recipient countries. Many developing countries donot have the infrastructure needed to study and evaluate all thetechnological options that might suit their needs. Moreover, anenterprise trying to sell a technology to a developing country willrarely give complete and unbiased advice. So, there is an urgentneed to develop an information support system and institutionalinfrastructure to facilitate the selection of appropriate technologies.In India, for example, a Technology Development Board wasestablished in 1996 to facilitate the assimilation and adaptationof imported technology (CMIE, 1997).
■ Adaptation and absorption capability. Technology transfer isnot a one-time phenomenon. The transferred technology needsto be updated from time to time, either indigenously or throughperiodic imports. Moreover, lack of local capability can result in the transferred technology seldom reaching the designedoperational efficiency, and often deteriorating significantly. Thisraises the need for local capacity building to manage technologicalchange. In a narrower sense, this could be facilitated by policiesrequiring foreign technology and investment to be accompaniedby adequate training of local staff (President’s Committee ofAdvisors on Science and Technology, 1999).
■ Access to state-of-the-art technology and to capital. In manycases transferred technology is not state of the art, for severalreasons. First, enterprises in industrialised countries need torecover the costs of technology development before transferringthe technology to other countries, introducing a time lag in theprocess. Second, in some developing countries there is a demandlag for the latest technology due to factors such as lack of capital or trained staff. Third, there are inappropriate technologytransfers because of the higher costs of acquiring state-of-the-arttechnology. A lack of capital and strong desire to minimise investmentcosts have often led developing countries to import obsolete usedplants and machinery.
■ The problems of small and medium-sized enterprises. Smallindustrial enterprises account for a large share of energy andtechnology use in many developing countries. These enterprisesmay play an important role in the national economy but generallyremain isolated from or ignorant of the benefits of technologyupgrading. For such enterprises, where off-the-shelf solutionsare seldom available, knock-down technology packages fromindustrialised countries are rarely possible. An important elementof technology transfer for this group is proper competence poolingto arrive at appropriate technology solutions.
Many developing countries do not have the infrastructure needed
to study and evaluate all the technological options that
might suit their needs.
WORLD ENERGY ASSESSMENT: ENERGY AND THE CHALLENGE OF SUSTAINABILITY
Chapter 6: Energy End-Use Efficiency
183
Again, the situation differs between higher- and lower-incomedeveloping countries. Several countries in Latin America and SoutheastAsia are producing highly efficient technology and vehicles—electricalmotors, refrigerator compressors, cars—through local companiesor subsidiaries of multinational companies. Control systems, super-efficient windows, and new materials that improve the thermal insulationof buildings may offer further opportunities for technology transfer tohigher-income developing countries (Hagler Bailley Services, 1997).
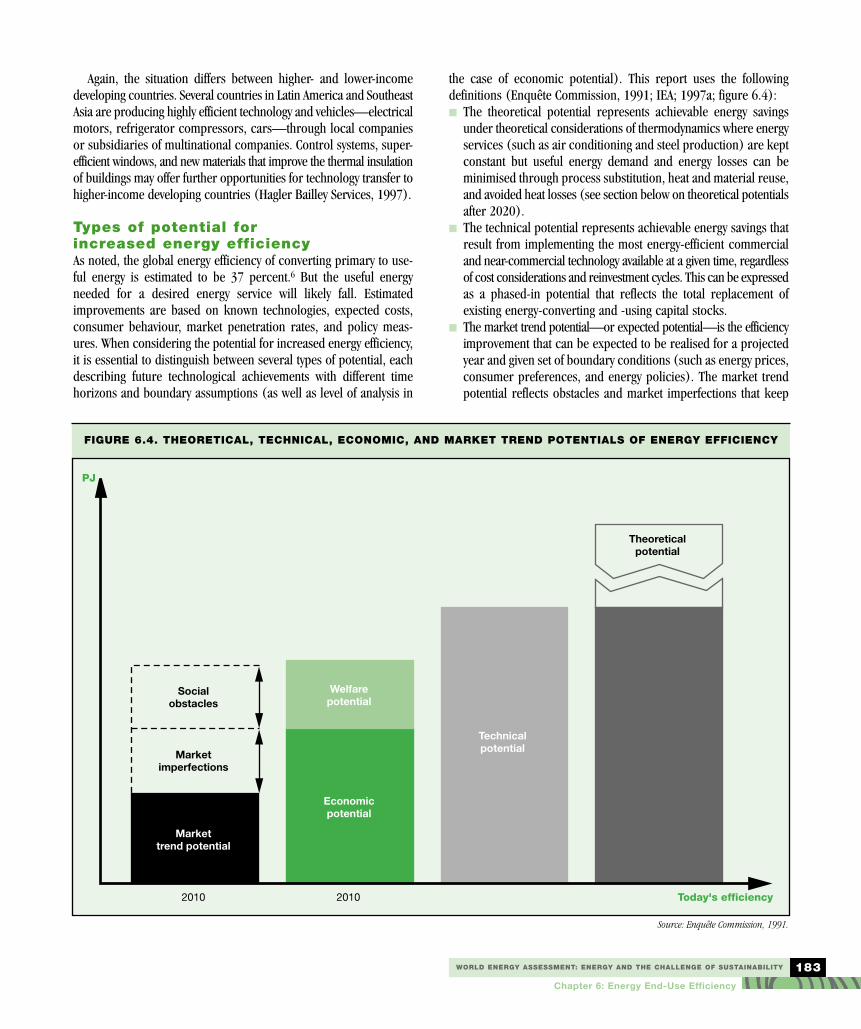
Types of potential for increased energy efficiencyAs noted, the global energy efficiency of converting primary to use-ful energy is estimated to be 37 percent.6 But the useful energyneeded for a desired energy service will likely fall. Estimatedimprovements are based on known technologies, expected costs,consumer behaviour, market penetration rates, and policy meas-ures. When considering the potential for increased energy efficiency,it is essential to distinguish between several types of potential, eachdescribing future technological achievements with different timehorizons and boundary assumptions (as well as level of analysis in
the case of economic potential). This report uses the following definitions (Enquête Commission, 1991; IEA; 1997a; figure 6.4):■ The theoretical potential represents achievable energy savings
under theoretical considerations of thermodynamics where energyservices (such as air conditioning and steel production) are keptconstant but useful energy demand and energy losses can beminimised through process substitution, heat and material reuse,and avoided heat losses (see section below on theoretical potentialsafter 2020).
■ The technical potential represents achievable energy savings thatresult from implementing the most energy-efficient commercialand near-commercial technology available at a given time, regardlessof cost considerations and reinvestment cycles. This can be expressedas a phased-in potential that reflects the total replacement ofexisting energy-converting and -using capital stocks.
■ The market trend potential—or expected potential—is the efficiencyimprovement that can be expected to be realised for a projectedyear and given set of boundary conditions (such as energy prices,consumer preferences, and energy policies). The market trendpotential reflects obstacles and market imperfections that keep
FIGURE 6.4. THEORETICAL, TECHNICAL, ECONOMIC, AND MARKET TREND POTENTIALS OF ENERGY EFFICIENCY
Markettrend potential
Economicpotential
Welfarepotential
Marketimperfections
2010 2010 Today's efficiency
Socialobstacles
Technicalpotential
Theoreticalpotential
PJ
Source: Enquête Commission, 1991.
WORLD ENERGY ASSESSMENT: ENERGY AND THE CHALLENGE OF SUSTAINABILITY
Chapter 6: Energy End-Use Efficiency
184
efficiency potentials from beingfully realised (see the section belowon obstacles).
■ The economic potential is the energysavings that would result if during eachyear over the time horizon in question, allreplacements, retrofits, and new investmentswere shifted to the most energy-efficient technologiesthat are still cost-effective at given energy market prices. It alsoincludes all organisational measures such as maintenance, sensitive operation and control, and timely repairs. The econom-ic potential has subdefinitions depending on the economic perspective being used: the business (or project) perspective,the macroeconomic perspective, or the societal (or welfare-based) perspective (box 6.2). The economic potential implies awell-functioning market, with competition between investmentsin energy supply and demand. It also assumes that the barriers tosuch competition have been corrected by energy policies. It isassumed that as a result of such policies, all users have easyaccess to reliable information about the cost-effectiveness andtechnical performance of existing and emerging options for energy efficiency. The transaction costs for individual investors,and the indirect costs of policies associated with implementingthese options, are assumed to have been lowered to their irreducible minimum.
■ The societal (or welfare-based) potential represents ‘cost-effective’savings when externalities are taken into consideration. These
include damage or avoided damagecosts from health impacts, air pollution,
global warming, and other ecologicalimpacts, as well as energy-related occu-
pational accidents that accrue to society.This wider definition of cost-effectiveness is the
most important for a holistic energy policy that includesenergy security and environmental quality (OTA, 1993).
■ Finally, the policy-based achievable potential represents the energysavings that can be realised with various policy instruments orpackages of policy instruments. Here field data are used to estimateparticipation rates and per participant savings in voluntary orstandards-based technology programmes. The policy-basedachievable potential lies between the market trend potential andthe economic potential (which can be influenced by energy taxes).This chapter focuses on the economic potential. The economic
perspective underlying the potentials reported here, however, variesby study. Most current estimates are based on a business (financial)perspective, though there are also hybrids that use a macroeconomicperspective (see box 6.2). Quantitative comparisons between businessand macroeconomic efficiency potentials suggest that microeconomicapproaches underestimate the cost-effective savings potential (Krause,1996). Similarly, macroeconomic approaches underestimate cost-effective savings potentials relative to a societal perspective.
The economic potential of energy efficiency by region and sectorEconomic potentials of energy efficiency depend on current andforeseeable technology developments and on current and anticipatedenergy prices (box 6.3). In a world of low energy prices, the potentialis relatively small. But high energy prices could be achieved throughenergy taxes at a national, regional, or global level. The economicpotential presented below for each region is based on the energyprices assumed in the literature. Calculations of the economicpotential of energy efficiency cover different technologies:■ The potential of mono-functional and concise energy-converting
technology (boilers, heat exchangers, electrical motors) is usuallydetermined by standard profitability calculations comparing the fullcosts of alternative and statistically relevant conversion technology.
■ Process substitution and new building concepts or transportationsystems include other changes in economic efficiency (capital,labour, and so on) and in product or service quality. Here itbecomes difficult to talk about the profitability of the technologyin the narrow sense of energy efficiency if the new, higher-efficiency technology is considered competitive in the broadersense (as with new catalysts in the production of petrochemicals,separation by membranes instead of energy-intensive distillation,or low-energy houses instead of conventional houses).
■ Branch-specific but technology-clustered energy efficiency potentialsof low energy-intensive sectors in industry or the commercialsector are estimated by trend extrapolation of statistical data orby generalisation of calculations made for representative or typified
Achieving two benefits ofincreased energy efficiency�positive
economic effects and reduced environmental burden�is called
a �double dividend�.
BOX 6.2. DIFFERENT PERSPECTIVES ON THE ECONOMIC POTENTIAL OF ENERGY EFFICIENCY
In all definitions of the economic potential of energy efficiency, thecore cost-effectiveness test is the life-cycle cost of providing agiven level of energy services. Different definitions of the economicpotential arise because of different cost-benefit perspectives.These perspectives influence how costs and financial parametersare defined and whether policy-dependent implementation costsor reductions in external costs are included.
The economic potential at the business level is calculated fromthe perspective of an individual investor based on engineering and economic life-cycle costs, using a financial perspective. Inthis narrowest of all definitions, total costs consist of the levelisedcapital costs of energy efficiency investments plus changes inannual energy and non-energy operation and maintenance costs.Neither the costs of large-scale policy implementation nor the costsavings from policy-induced feedback effects are attached to thispotential. The discount rate for evaluating the cost-effectivenessof energy efficiency investments is typically set to reflect the costsof capital of particular sectors, industries, or households. After-taxenergy efficiency investments are compared to after-tax averageenergy prices as projected for each sector or group of energy users.
The macroeconomic potential is based on a more comprehensiveaccounting of costs and on a different financial perspective. Herethe administrative costs of implementing various required policiesare included. In addition, energy efficiency investment costs andpolicy implementation costs are corrected in a forward-lookingmanner to account for changes in manufacturer pricing strategies,economies of scale, and learning effects.

WORLD ENERGY ASSESSMENT: ENERGY AND THE CHALLENGE OF SUSTAINABILITY
Chapter 6: Energy End-Use Efficiency
185
plants or factories. To avoid misinterpretation, data on branch-specific energy efficiency potentials should not include intrabranchstructural changes (such as a shift of high value added but lowenergy-intensive pharmaceuticals to higher shares of total valueadded in the chemical industry).These different cost assessments may help explain the differences
in certainty about the economic potentials cited below. The data oneconomic potentials provide projections for 2010 and 2020. Thismeans that where reinvestment cycles last more than 20 years (as withbuildings, public transport, and plants of basic product industries),the economic potentials are only partly realised by 2020. The sectorsand technological areas discussed in this section were chosen basedon the relevance of the efficiency technology and the availability ofthe literature for the region or country considered.
Deviations from a given economic potential reflect changes inenergy prices, economies of scale, or local differences. In many casesthe life-cycle cost functions have rather broad minima (such as optimalinsulation thickness), which means that there is little risk of overinvestingin energy efficiency or of overestimating the cited potentials.
Western EuropeIndustry. Until the early 1990s industry was the largest consumer offinal energy in Western Europe.8 But despite production growth ofabout 2 percent a year, the final energy demand of WesternEuropean industry has hovered near 11,500 petajoules for the past20 years. Yet industry still holds substantial economic efficiencypotential, even in energy-intensive sectors where investment hasfocused on efficiency improvements to lower high energy costs (Phylipsen,Blok, and Worrell, 1998).■ De Beer (1998, pp. 75–102) estimates that by 2020 paper mills
operating with new pressing and drying techniques, latent heatrecovery systems, and a number of minor improvements (closedwater circulation, graduated heat recovery) will have 50 percentlower specific heat demand and that investment costs may belower than for conventional paper-making (table 6.4). The eco-nomic efficiency potential of steel-making is less extraordinary,between 13 and 20 percent, and results from thin slab casting,more efficient blast furnaces, and minor improvements in theoxygen steel process by 2020 (Jochem and Bradke, 1996).Similar economic efficiency potential has been described forrefineries (Refining Processes, 1998), petrochemical processes(Patel, 1999) and basic organic chemicals (Brewer and Lopez,1998), construction materials (Rosemann and Ellerbrock, 1998;Ottoboni and others, 1998), glass production (ATLAS, 1997),and the food industry (Jochem and Bradke, 1996).
■ For Dutch light industry, the economic efficiency improvementsin 2000 (relative to 1990) are estimated at 30 percent (with a 5percent discount rate) and 27 percent (with a 10 percent discountrate; Blok and others, 1996; Böde and others, 1999).
■ Baumgartner and Muggli (1996) evaluated the efficiencyimprovements of cross-cutting technologies in Swiss industry.Savings of 15–35 percent were found for electrical and mechanical
drives over the next 10–15 years (Almeida, Bertoldi, and Leonhard,1997). Metering, controlling, and optimal regulation can lead toefficiency improvements of up to 15 percent in most industrialprocesses. Cogeneration in Western Europe still holds economicpotential, particularly with the midterm effects of liberalisingelectricity supply and small cogeneration (ATLAS, 1997; EC, 1999).Residential. The economic efficiency potential in heating of
residential buildings depends—besides regional aspects—on the stockof boilers and their reinvestment cycles, the rate of constructing newbuildings, and the rate of refurbishing existing buildings. Condensingboilers are about 10 percent more energy efficient than a new low-temperature boiler and 15–25 percent more efficient than existingboilers (Ziesing and others, 1999). Insulation of building elements,highly efficient window systems, and adequately thick insulation areeconomic within the cycle of refurbishment (ETSU, 1994). In new build-ings, low-energy houses (those with annual heat demand of 50–100kilowatt-hours per square metre) are now cost-effective due to
BOX 6.3. ECONOMIC BENEFITS OF INCREASED ENERGY EFFICIENCY IN END
USES—THE UNKNOWN DOUBLE DIVIDEND
Energy consumers benefit when profitable energy efficiency potentialsare realised.7 But the economy also benefits, because saved energycosts can be reallocated, energy imports are replaced (in manycountries) by domestically produced energy-efficient products and(energy) services, and labour-intensive branches can grow in industry,construction, and services (instead of capital-intensive energysupply), spurring innovation. Macroeconomic analyses for Germanyand the United States show that policies to improve energy efficiencyand to shift to advanced technology and less carbon-intensivefuels generate four important benefits for the national economy(Jochem and Hohmeyer, 1992; Laitner, Bernow, and DeCicco,1998). Such policies:• Spur economic growth to a small degree (by less than 1 percent
of the absolute growth rate of GDP) due to the reallocation ofsaved energy costs.
• Generate jobs (including entrepreneurial jobs that foster resourceful,self-sufficient, and satisfied workers) for the reasons mentionedabove. Net employment increases by 40–60 new jobs per petajoule saved each year.
• Increase exports of high-technology products. In 1976–92exports of 12 energy-efficient products increased more than 50 percent faster than West Germany’s total exports.
• Reduce the environmental and social costs of energy use thatwere previously uncounted in market transactions for fuel. Suchcosts may be as high as $0.02 per kilowatt-hour of electricity(Friedrich and Krewitt, 1997) and almost $0.01 per kilowatt-hourof oil product used, not including the impacts of climatechange (Hohmeyer, Ottinger, and Rennings, 1997).Achieving two benefits of increased energy efficiency—positive
economic effects and reduced environmental burden—is called a‘double dividend’. Unlike many other employment effects of investment,the jobs created by efficiency investments are not evenly distributedover time. In most cases they are created during the initial periodof investment—when wall insulation is installed or investments aremade in condensing boilers or high-efficiency window systems. Inaddition, the regional distribution of net employment becomes moreequitable. Employment in the energy supply sector is concentratedin urban and industrial areas, while efficiency involves planners,crafts, trade, and banking in the entire country.

WORLD ENERGY ASSESSMENT: ENERGY AND THE CHALLENGE OF SUSTAINABILITY
Chapter 6: Energy End-Use Efficiency
186
better design and low-cost insulation techniques and window sytems(Altner and others, 1995).
The economic efficiency potential of electric appliances in 2010is best evaluated by comparing the equipment in use with the equipmentavailable on the market. But the market is not homogeneous: a surveyof washing machines, dryers, and dishwashers available in the EuropeanUnion showed minimum:maximum ratios of specific consumptionbetween 1:2.5 for washing machines and 1:4 for condenser tumbledryers (GEA, 1995). Initial costs are sometimes higher for efficientequipment, but life-cycle costs are generally lower. In France a detailedend-use study showed that electricity savings of 40 percent can beachieved by replacing average equipment with the most efficient appliancesreadily available on the market (Rath and others, 1997; ECODROME, 1998).These results are confirmed by Hennicke and others (1998) and Ziesingand others (1999). Given the relatively short lives of lights andappliances, savings of 33 percent could be achieved in the UnitedKingdom by 2010 with the widespread adoption of better lights andappliances using known technologies (Boardman and others, 1997).
Service and public sectors. In 1990 office equipment consumedjust 3–4 percent of the electricity used in Western Europe’s servicesector (Aebischer, Schwarz, and Spreng, 1996). But office equipmentis the fastest-growing consumer of electricity. About two-thirds ofthis electricity is used in standby and off modes. Thus easy and cost-effective savings are possible for most equipment (Hallenga andKok, 1998; MACEBUR, 1998). With the fast increase in the amountof office equipment and its short lives, these improvements could berealised by 2010. Hennicke and others (1998) reports that 27–35percent of the electricity consumed by Germany’s service sectorcould be saved for $0.043–0.071 a kilowatt-hour.
The economic potential for reducing space and process heatdemand in commercial buildings ranges from 15–25 percent (Ziesingand others, 1999; Aebischer and others,1996). The efficiency of heatgeneration and distribution could be improved by 10–15 percentthrough reinvestments in boilers, burners, and insulation and controltechniques, in some cases by direct process heat generation (avoidingsteam and hot water systems), and by engine-driven cogeneration.
TABLE 6.4. ECONOMIC ENERGY EFFICIENCY POTENTIALS IN WESTERN EUROPE, 2010 AND 2020
Sector and technological area
IndustryIron and steel, coke ovensConstruction materialsGlass productionRefineriesBasic organic chemicalsPulp and paperInvestment and consumer goodsFoodCogeneration in industry
ResidentialExisting buildings
Boilers and burnersBuilding envelopes
New buildingsElectric appliances
Commercial, public, and agricultureCommercial buildings
ElectricityHeat
Public buildingsAgriculture and forestryHorticultureDecentralised cogenerationOffice equipment
TransportationCarsDoor-to-door integrationModal split of freight transportTrains and railwaysAircraft, logistics
a. Assumes a constant structure or use of the sector or technology considered. b. Refers to the final energy use of the entire sector.
Energy price levelassumed
199419971997199519971996199419971997
today’s pricestoday’s pricestoday’s prices
1997
8–13 cts/kWh4–10 cts/kWhtoday’s prices7–15 cts/kWhtoday’s pricestoday’s pricestoday’s prices
1995
today’s prices
today’s pricestoday’s prices
Base year
199519971997199719961997199519971997
1997199519951997
1995199719981992
19951995
19951995199519991998
Source
Jochem and Bradke, 1996; Ameling and others, 1998
ATLAS, 1997Refining Processes, 1998Patel, 1999; Brewer and Lopez, 1998De Beer, 1998Jochem and Bradke, 1996; Böde and others, 1999Jochem and Bradke, 1996ATLAS, 1997; EC, 1999
ETSU, 1994; Böde and others,1999Ziesing and others, 1999Altner, Durr, Michelson, 1995GEA, 1995; ECODROME, 1999; Hennicke andothers, 1998; Boardman and others, 1997
Geiger and others, 1999ECODROME, 1998Zeising and others, 1999Brechbühl, 1992Neyer and Strebel, 1996Arbeitsgemeinschaft, 1992 Ravel, 1994Aebischer and others, 1996; MACEBUR, 1998;Hallenga and Kok, 1998
IPSEP, 1995Zeising and others, 1999
Brunner and Gartner, 1999IPCC, 1999a
Economic potential (percent)a
2010 2020
9–15 13–205–10 8–15
10–15 15–255– 8 7–105–10
5010–20 15–2510–15
10–20
15–20 20–258–12 10–20
20–3020–30 35–45
10–20 3010–25 20–37
15–2530–4015–2020–3020–3040–50
254
3b
2015–20 25–30
WORLD ENERGY ASSESSMENT: ENERGY AND THE CHALLENGE OF SUSTAINABILITY
Chapter 6: Energy End-Use Efficiency
187
Transportation. Between 1990 and 2010 final energy use by transportmay increase by 40 percent in Western Europe if no efficiency potentialsare used. About 50 percent of this energy is used by passenger cars andalmost 40 percent by road freight. A voluntary agreement concludedby the Association of European Car Manufacturers reflects thepotential for energy-efficient car use: in 2008 new cars will be 25percent more fuel efficient than in 1995. Using taxes and insuranceto internalise the external costs of road transport, estimated at$20–70 billion, would increase efficiency by another 7–16 percent.
Relative to road transport, Western Europe’s rail transport isabout 3 times less energy-intensive for passengers and up to 10times less energy-intensive for goods. With lighter trains, reducedair drag, and better drive concepts, the specific electricity consumption of rail transport could drop almost 50 percent over
the next 40 years (Brunner and Gartner, 1999). A 25 percent cut inrailway freight tariffs due to increased productivity and cross-borderharmonisation is expected to induce a shift from road to rail, allowing a 3 percent reduction in final energy use for the transportsector as a whole. Although aeroplanes and related logistics havesubstantial efficiency potential (IPCC, 1999a), it is not expected tocompensate for the growth in air transport mileage.
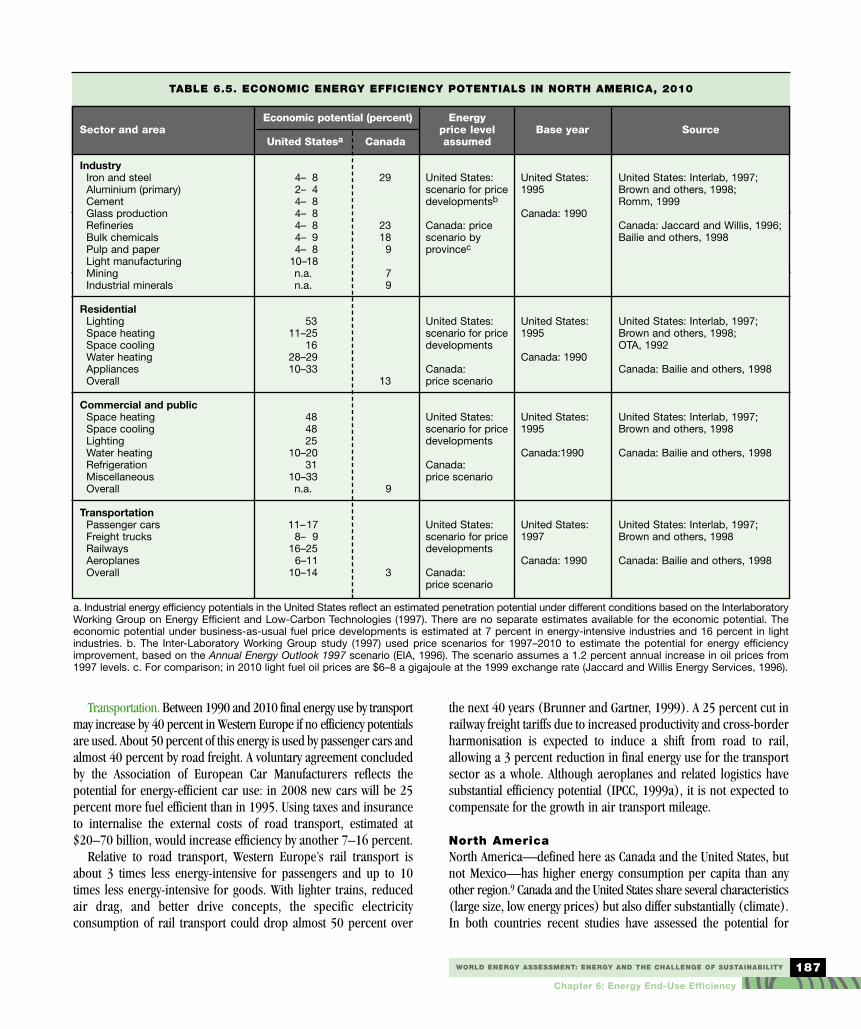
North AmericaNorth America—defined here as Canada and the United States, butnot Mexico—has higher energy consumption per capita than anyother region.9 Canada and the United States share several characteristics(large size, low energy prices) but also differ substantially (climate).In both countries recent studies have assessed the potential for
TABLE 6.5. ECONOMIC ENERGY EFFICIENCY POTENTIALS IN NORTH AMERICA, 2010
Sector and area
IndustryIron and steelAluminium (primary)CementGlass productionRefineriesBulk chemicalsPulp and paperLight manufacturingMiningIndustrial minerals
ResidentialLightingSpace heatingSpace coolingWater heatingAppliancesOverall
Commercial and public Space heatingSpace coolingLightingWater heatingRefrigerationMiscellaneousOverall
TransportationPassenger carsFreight trucksRailwaysAeroplanesOverall
a. Industrial energy efficiency potentials in the United States reflect an estimated penetration potential under different conditions based on the InterlaboratoryWorking Group on Energy Efficient and Low-Carbon Technologies (1997). There are no separate estimates available for the economic potential. Theeconomic potential under business-as-usual fuel price developments is estimated at 7 percent in energy-intensive industries and 16 percent in lightindustries. b. The Inter-Laboratory Working Group study (1997) used price scenarios for 1997–2010 to estimate the potential for energy efficiencyimprovement, based on the Annual Energy Outlook 1997 scenario (EIA, 1996). The scenario assumes a 1.2 percent annual increase in oil prices from1997 levels. c. For comparison; in 2010 light fuel oil prices are $6–8 a gigajoule at the 1999 exchange rate (Jaccard and Willis Energy Services, 1996).
Energy price levelassumed
United States:scenario for price developmentsb
Canada: pricescenario byprovincec
United States:scenario for pricedevelopments
Canada: price scenario
United States:scenario for price developments
Canada: price scenario
United States:scenario for price developments
Canada: price scenario
Base year
United States:1995
Canada: 1990
United States:1995
Canada: 1990
United States:1995
Canada:1990
United States:1997
Canada: 1990
Source
United States: Interlab, 1997;Brown and others, 1998; Romm, 1999
Canada: Jaccard and Willis, 1996; Bailie and others, 1998
United States: Interlab, 1997;Brown and others, 1998; OTA, 1992
Canada: Bailie and others, 1998
United States: Interlab, 1997;Brown and others, 1998
Canada: Bailie and others, 1998
United States: Interlab, 1997;Brown and others, 1998
Canada: Bailie and others, 1998
Economic potential (percent)
United Statesa Canada
4– 8 292– 44– 84– 84– 8 234– 9 184– 8 9
10–18n.a. 7n.a. 9
5311–25
1628–2910–33
13
484825
10–2031
10–33n.a. 9
11–178– 9
16–256–11
10–14 3
WORLD ENERGY ASSESSMENT: ENERGY AND THE CHALLENGE OF SUSTAINABILITY
Chapter 6: Energy End-Use Efficiency
188
increased energy efficiency by 2010.In the United States the InterlaboratoryWorking Group on Energy-Efficient andLow-Carbon Technologies (1997) assessedthe economic potential for efficiencyimprovement, while a recent follow-up studyassesses the potential impact of policies. In Canadaa study has assessed several industrial sectors in detail(Jaccard and Willis Energy Services, 1996), while others haveassessed the economic potential of sets of technologies in all sectors(Bailie and others, 1998; Brown and others, 1998; Faruqui and others, 1990; OTA, 1991). Both countries are assessing policies toaddress climate change, and the results may vary from previousstudies (table 6.5).
Under the business-as-usual scenario, energy growth in theUnited States through 2010 would increase energy demand by 26percent relative to 1990. Two other scenarios address, with progressively stronger measures, the adoption of energy-efficienttechnologies. The first, the efficiency scenario, assumes that technology-based reductions in energy and carbon emissionsbecome cost-effective and so attractive to the marketplace. The second, the high-efficiency/low-carbon scenario, assumes that theUnited States makes an even greater commitment to reducing carbon emissions through federal and state programs and policies,as well as active private sector involvement. The high-efficiency/low-carbon scenario assumes that the emission charge is $25 or $50 pertonne of carbon.
Industry. Because of the complexity of industrial processes, theInterlaboratory Working Group did not model from the bottom upusing explicit estimates of changes in efficiency expected from theintroduction of energy-efficient technologies. Instead, the groupused existing models to estimate the potential for increased generalinvestment in industrial energy efficiency, supplemented by examplesof a few technologies that have potential throughout the industrialsector (for example, advanced gas turbines and efficient motors).The models single out seven energy-intensive industries that togetheraccount for 80 percent of manufacturing energy use. Light manufacturingis considered a separate category.
Under the business-as-usual scenario, manufacturing grows 2.1percent a year through 2010, divided between energy-intensiveindustries (1.3 percent a year) and non-intensive industries (2.6percent a year). Total energy intensity is projected to decline by 1.1percent a year (Interlaboratory Working Group, 1997).
In the efficiency scenario, industrial energy consumption drops6.6 percent relative to the business as usual scenario. In the high-efficiency/low-carbon scenario, consumption falls 12.5 percent.Energy efficiency improvements are larger in light industry than inheavy manufacturing because there are more opportunities to adoptenergy-efficient-technologies. Energy is a smaller component ofoverall manufacturing costs, so there is less incentive to adopt newtechnology than in the past. A recent bottom-up study (Worrell,Martin, and Price, 1999) of energy efficiency potential in the U.S.
iron and steel industry estimatesthe potential contribution of nearly
50 technologies, and suggests that thepotential is twice as high as indicated by
the Interlaboratory Working Group study.Bailie and others (1998) estimate at 8
percent the cost-effective potential for reducing carbon dioxide (CO2) emissions through increased energy
efficiency in Canadian industry. The authors use high discount ratesto reflect the market rates of time preference.10 Jaccard and WillisEnergy Services (1996) estimate the economic and technical potential for increased energy efficiency in six major industrial sectors using the same model and a discount rate of 7 percent inassessing the macroeconomic potential (see box 6.2). They findtechnical potential in 2010 to vary by industry from 8 to 38 percent(relative to 1990), while economic potential varies from 7 to 29 percent. These findings are similar to those for Western Europe(see table 6.4).
Buildings. In the efficiency scenario, buildings use 36.0 exajoulesof energy in 2010, compared with 38.0 exajoules in the business asusual scenario. The efficiency scenario assumes that by 2010 buildingswill have achieved just over one-third of their cost-effective energyefficiency savings potential of 15 percent (Interlaboratory WorkingGroup, 1997). Energy services cost $11 billion a year less than inthe business-as-usual scenario. Costs are lower because thedecrease in energy spending that results from installing more efficient technology is larger than the cost of purchasing andinstalling this technology in buildings. The high-efficiency/low-carbon scenario assumes that nearly two-thirds of the cost-effectiveenergy efficiency savings are achieved by 2010. The result is a largerdrop in energy use, to 33.3 exajoules—or by 13 percent relative tothe business-as-usual scenario.
Bailie and others (1998) assume that energy efficiency measuresare implemented in Canadian buildings. While households showmoderate economic potential (13 percent), the economic potentialfor commercial buildings is limited (9 percent).11 Although thetechnical potential is high (Bailie and others, 1998), the assumedhigh costs and additional office automation lead to smaller economic potentials.
Transportation. The business as usual scenario for U.S. transportationassumes that the passenger car fuel efficiency rate (in litres per 100kilometres) will improve from 8.55 in 1997 to 7.47 in 2010. Butthis represents a 1.4 percent annual increase in fuel economy, animprovement that has not been seen in the past without increasedfuel mileage standards or higher oil prices. The business-as-usualscenario also assumes that the fuel efficiency of light trucks will notincrease. The result is an increase in transportation energy use from26,000 petajoules in 1997 to 34,000 petajoules in 2010 despite a10 percent improvement in overall efficiency. Under the efficiencyscenario, transportation energy use is 10 percent lower in 2010.Under the high-efficiency/low-carbon scenario, it is 14 percentlower (Interlaboratory Working Group, 1997).
Between 1990 and 2010 final energy use by transport may increase
by 40 percent in Western Europe,if no efficiency potentials
are used.
WORLD ENERGY ASSESSMENT: ENERGY AND THE CHALLENGE OF SUSTAINABILITY
Chapter 6: Energy End-Use Efficiency
189
The high-efficiency/low-carbon scenario includes the efficiencyscenario assumptions as well as major breakthroughs in fuel cellsfor light-duty vehicles, large gains in the energy efficiency of aircraft,and an optimistic estimate of the cost of ethanol fuel from biomass.This modelling approach is very different from that taken for buildings, because of the assumption of breakthrough technology in transportation.
Bailie and others (1998), however, estimate an extremely loweconomic potential for energy efficiency improvement in Canada’stransportation sector.12 The study concentrates on efficiency standards for engines but also includes fuel switching. The baselinescenario assumes large growth in transport demand, dramaticallyincreasing energy demand in Canada between 1990 and 2010. Thestudy finds a large technical potential for efficiency improvement,but the costs of the economic potential are prohibitive. Hence theeconomic potential is estimated at just 3 percent relative to 2010baseline energy use.
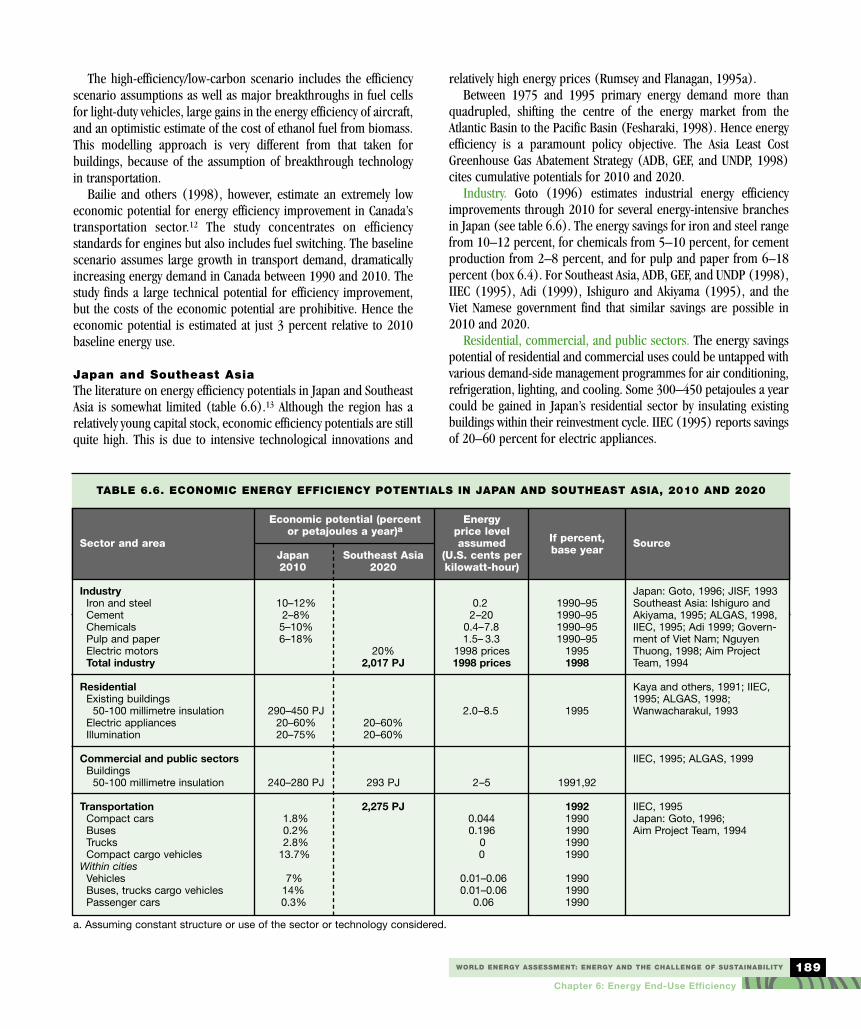
Japan and Southeast AsiaThe literature on energy efficiency potentials in Japan and SoutheastAsia is somewhat limited (table 6.6).13 Although the region has arelatively young capital stock, economic efficiency potentials are stillquite high. This is due to intensive technological innovations and
relatively high energy prices (Rumsey and Flanagan, 1995a). Between 1975 and 1995 primary energy demand more than
quadrupled, shifting the centre of the energy market from theAtlantic Basin to the Pacific Basin (Fesharaki, 1998). Hence energyefficiency is a paramount policy objective. The Asia Least CostGreenhouse Gas Abatement Strategy (ADB, GEF, and UNDP, 1998)cites cumulative potentials for 2010 and 2020.
Industry. Goto (1996) estimates industrial energy efficiencyimprovements through 2010 for several energy-intensive branchesin Japan (see table 6.6). The energy savings for iron and steel rangefrom 10–12 percent, for chemicals from 5–10 percent, for cementproduction from 2–8 percent, and for pulp and paper from 6–18percent (box 6.4). For Southeast Asia, ADB, GEF, and UNDP (1998),IIEC (1995), Adi (1999), Ishiguro and Akiyama (1995), and theViet Namese government find that similar savings are possible in2010 and 2020.
Residential, commercial, and public sectors. The energy savingspotential of residential and commercial uses could be untapped withvarious demand-side management programmes for air conditioning,refrigeration, lighting, and cooling. Some 300–450 petajoules a yearcould be gained in Japan’s residential sector by insulating existingbuildings within their reinvestment cycle. IIEC (1995) reports savingsof 20–60 percent for electric appliances.
TABLE 6.6. ECONOMIC ENERGY EFFICIENCY POTENTIALS IN JAPAN AND SOUTHEAST ASIA, 2010 AND 2020
Sector and area
IndustryIron and steelCementChemicalsPulp and paper Electric motorsTotal industry
ResidentialExisting buildings
50-100 millimetre insulationElectric appliancesIllumination
Commercial and public sectorsBuildings
50-100 millimetre insulation
TransportationCompact carsBusesTrucksCompact cargo vehicles
Within citiesVehiclesBuses, trucks cargo vehiclesPassenger cars
a. Assuming constant structure or use of the sector or technology considered.
Energy price levelassumed
(U.S. cents perkilowatt-hour)
0.22–20
0.4–7.81.5– 3.3
1998 prices1998 prices
2.0–8.5
2–5
0.0440.196
00
0.01–0.060.01–0.06
0.06
If percent,base year
1990–951990–951990–951990–95
19951998
1995
1991,92
19921990199019901990
199019901990
Source
Japan: Goto, 1996; JISF, 1993Southeast Asia: Ishiguro andAkiyama, 1995; ALGAS, 1998,IIEC, 1995; Adi 1999; Govern-ment of Viet Nam; NguyenThuong, 1998; Aim ProjectTeam, 1994
Kaya and others, 1991; IIEC,1995; ALGAS, 1998;Wanwacharakul, 1993
IIEC, 1995; ALGAS, 1999
IIEC, 1995Japan: Goto, 1996; Aim Project Team, 1994
Economic potential (percent or petajoules a year)a
Japan Southeast Asia2010 2020
10–12%2–8%5–10%6–18%
20%2,017 PJ
290–450 PJ20–60% 20–60%20–75% 20–60%
240–280 PJ 293 PJ
2,275 PJ 1.8%0.2%2.8%
13.7%
7%14% 0.3%
WORLD ENERGY ASSESSMENT: ENERGY AND THE CHALLENGE OF SUSTAINABILITY
Chapter 6: Energy End-Use Efficiency
190
In the commercial and public sectors the same efficiency technologywould save 240–280 petajoules a year. Mungwitikul and Mohanty(1997) report electricity savings of 25 percent for office equipmentat no additional cost in Thailand.
Transportation. In 1980–95 transport was the largest consumerof energy in Japan and Southeast Asia, with annual growth of 8.8percent (excluding Viet Nam). Transport energy demand is stillincreasing because larger vehicles are becoming more popular,while the share of small vehicles in new car sales fell to 60 percentin 1996. Japanese government policy is now aiming to introduce the‘top runner method’, setting efficiency standards above the performancestandards currently achievable in order to raise vehicle fuel efficiencies.These measures include subsidies for hybrid vehicles, which double fuelefficiencies. Smaller cars are expected to reduce their fuel consumptionto 3.0–3.6 litres per 100 kilometres, and one car manufacturerplans to increase efficiency by 25 percent between 1995 and 2005.
Energy policy also attempts to improve the energy efficiency of trains, ships, and planes, upgrading distribution efficiency bypromoting railroad transportation, coastal shipping, and publictransport. A study on an electric mass transit project under construction in Thailand identified potential savings of 28 petajoulesa year. The savings would come from switching to diesel fuel in citybuses. The introduction of fuel cells in road vehicles will furtherimprove efficiency after 2010.
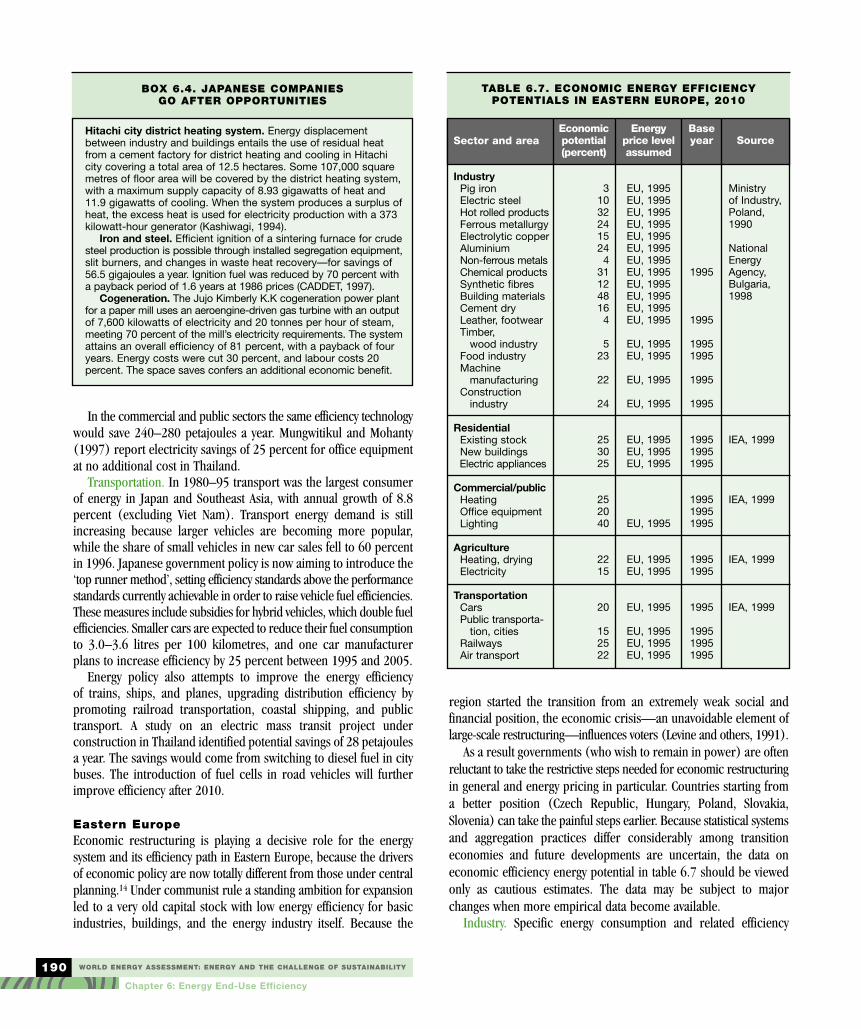
Eastern EuropeEconomic restructuring is playing a decisive role for the energy system and its efficiency path in Eastern Europe, because the driversof economic policy are now totally different from those under centralplanning.14 Under communist rule a standing ambition for expansionled to a very old capital stock with low energy efficiency for basicindustries, buildings, and the energy industry itself. Because the
region started the transition from an extremely weak social andfinancial position, the economic crisis—an unavoidable element oflarge-scale restructuring—influences voters (Levine and others, 1991).
As a result governments (who wish to remain in power) are oftenreluctant to take the restrictive steps needed for economic restructuringin general and energy pricing in particular. Countries starting froma better position (Czech Republic, Hungary, Poland, Slovakia,Slovenia) can take the painful steps earlier. Because statistical systemsand aggregation practices differ considerably among transitioneconomies and future developments are uncertain, the data on economic efficiency energy potential in table 6.7 should be viewedonly as cautious estimates. The data may be subject to majorchanges when more empirical data become available.
Industry. Specific energy consumption and related efficiency
BOX 6.4. JAPANESE COMPANIES GO AFTER OPPORTUNITIES
Hitachi city district heating system. Energy displacementbetween industry and buildings entails the use of residual heatfrom a cement factory for district heating and cooling in Hitachicity covering a total area of 12.5 hectares. Some 107,000 squaremetres of floor area will be covered by the district heating system,with a maximum supply capacity of 8.93 gigawatts of heat and11.9 gigawatts of cooling. When the system produces a surplus ofheat, the excess heat is used for electricity production with a 373kilowatt-hour generator (Kashiwagi, 1994).
Iron and steel. Efficient ignition of a sintering furnace for crudesteel production is possible through installed segregation equipment,slit burners, and changes in waste heat recovery—for savings of56.5 gigajoules a year. Ignition fuel was reduced by 70 percent witha payback period of 1.6 years at 1986 prices (CADDET, 1997).
Cogeneration. The Jujo Kimberly K.K cogeneration power plantfor a paper mill uses an aeroengine-driven gas turbine with an outputof 7,600 kilowatts of electricity and 20 tonnes per hour of steam,meeting 70 percent of the mill’s electricity requirements. The systemattains an overall efficiency of 81 percent, with a payback of fouryears. Energy costs were cut 30 percent, and labour costs 20 percent. The space saves confers an additional economic benefit.
TABLE 6.7. ECONOMIC ENERGY EFFICIENCY POTENTIALS IN EASTERN EUROPE, 2010
Sector and area
IndustryPig ironElectric steelHot rolled productsFerrous metallurgyElectrolytic copperAluminiumNon-ferrous metalsChemical productsSynthetic fibresBuilding materialsCement dryLeather, footwearTimber,
wood industryFood industryMachine
manufacturingConstruction
industry
ResidentialExisting stockNew buildingsElectric appliances
Commercial/publicHeatingOffice equipmentLighting
AgricultureHeating, drying Electricity
TransportationCarsPublic transporta-
tion, citiesRailwaysAir transport
Economic potential (percent)
310322415244
311248164
523
22
24
253025
252040
2215
20
152522
Energyprice levelassumed
EU, 1995EU, 1995EU, 1995EU, 1995EU, 1995EU, 1995EU, 1995EU, 1995EU, 1995EU, 1995EU, 1995EU, 1995
EU, 1995EU, 1995
EU, 1995
EU, 1995
EU, 1995EU, 1995EU, 1995
EU, 1995
EU, 1995EU, 1995
EU, 1995
EU, 1995EU, 1995EU, 1995
Baseyear
1995
1995
19951995
1995
1995
199519951995
199519951995
19951995
1995
199519951995
Source
Ministry of Industry,Poland,1990
NationalEnergyAgency,Bulgaria,1998
IEA, 1999
IEA, 1999
IEA, 1999
IEA, 1999

WORLD ENERGY ASSESSMENT: ENERGY AND THE CHALLENGE OF SUSTAINABILITY
Chapter 6: Energy End-Use Efficiency
191
potentials are related to physical production in energy-intensiveindustries. The economic potential of other sectors ranges from 4 percent (leather) to 40 percent (building materials) by 2010 (seetable 6.7). Available data are from climatically and economically different countries (from Bulgaria to Poland) but most of the figures aresimilar—reflecting a shared history of Soviet technology and standards.
Residential. Individual heat metering in multifamily houses inEastern Europe represents an energy efficiency potential of at least 15–20 percent. In panel-built housing estates, individualmetering of domestic warm water consumption has already resulted in savings of up to 40 percent where it has been introduced.A programme to improve thermal insulation in these buildingsbegan in the mid-1990s with central support. Thus a 20–30 percentreduction of the heat demand in these buildings can be achieved inthe next 10 years.
For 2020 and beyond, specific energy and material demands areexpected to be close to the EU average. Economic and technologydevelopment in Eastern Europe will likely be carried out throughthe expansion of multinational companies, integration with theEuropean Union, and globalisation. As a consequence, by 2020technologies will be in place that are technically and economicallyacceptable and comparable to EU standards. Exceptions will be
some parts of the non-refurbished building stock.Commercial and public sectors. Improved boilers and heating
systems, insulation, high-efficiency window systems, and new lightingsystems will contribute to substantial savings in the commercial andpublic sectors.
Transportation. Although specific energy consumption will likelyfall by at least 1 percent a year, the final energy consumed by roadtransportation will substantially increase due to motorization inEastern Europe.
Russia and other members of the Commonwealth of Independent StatesMembers of the Commonwealth of Independent States face very differentclimates, domestic energy resources, and levels of industrialisationand motorisation.15 The last extensive studies of economic energyefficiency potentials for the former Soviet Union were performed inthe early 1990s (WBNSS, 1999). About 120 technologies and energy-saving measures with potential savings greater than 5.8 petajoules ayear were considered, covering all the sectors and assuming thereplacement of technology and equipment in use at that time withbest-practice, world-class technology (CENEf, 1993). Potential savingswere estimated at 21,690 petajoules a year, about 77 percent of
TABLE 6.8. ECONOMIC ENERGY EFFICIENCY POTENTIALS IN RUSSIA AND UKRAINE, 2010
Sector and technological area
IndustryGeneralMetallurgyIron and steel, coke ovensConstruction materials
CementRefineries
Basic organic chemicalsPulp and paperInvestment goods industryElectricity savingsFood industries
Commercial and public sectors and agriculture
Commercial buildingsAgricultureHorticulture
ResidentialAutomated boilersExisting building stockNew buildingsHot water supply
TransportationTrains
a. Refineries and chemicals. b. Residential and commercial sectors.
Energy price levelassumed
1990s price levels of WesternEurope
1995 pricelevels ofEuropeanUnion
1995 pricelevels ofEuropeanUnion
1995 pricelevels ofEuropeanUnion
Source
Russia: Federal Ministry of Fuel andEnergy, 1998
Ukraine: ARENA-ECO,1997; Vakulko/Zlobin,1997
Bashmakov, Gritsevich,and Sorokina, 1996;ARENA-ECO, 1997;Lapir, 1997
Bashmakov, Gritsevich,and Sorokina, 1996;ARENA-ECO, 1997
Russia: SNAP, 1999;Russian Federation,Ministry of Transport,1995
Economic potential (percent or petajoules a year)
Russia Ukraine
3,370–4,980 PJ 1,430–2,485 PJ1,524–2,198 PJ
733–1,026 PJ 284– 361 PJ132– 161 PJ
440 PJ176 PJ
176– 205 PJ 73– 138 PJa
176– 322 PJ176– 322 PJ322– 469 PJ 247– 249 PJ
More than 30%114– 205 PJ
791– 879 PJ 91– 138 PJUp to 3 times
1,905–2,198 PJ 475–570 PJb
20–40%20–30%
381– 431 PJ197– 276 PJ
967–1,172 PJ 290–293 PJ10–15%
If percent, base year
Russia Ukraine
1995 199019951995 19901995
19951995 1990199519951995 19901997
1995 19901997
1995 19901995199519951995
1995 19901997
WORLD ENERGY ASSESSMENT: ENERGY AND THE CHALLENGE OF SUSTAINABILITY
Chapter 6: Energy End-Use Efficiency
192
which was considered economical by 2005.In 1996 Russia and Ukraine—the two largest members of the
Commonwealth of Independent States—used 83 percent of theregion’s primary energy. The most recent estimate of Russia’s energyefficiency potential was developed in 1997 (Russian FederationMinistry of Fuel and Energy, 1998). It projects savings of13,000–15,500 petajoules by 2010; 80 percent of these savings areexpected in the end-use sector. The most comprehensive recentevaluation of technological and economic potentials for energy efficiency in Ukraine was undertaken by the Agency for RationalEnergy Use and Ecology (ARENA-ECO, 1997).
Industry. The economic efficiency potential of industry in 2010 isabout 4,000 petajoules a year (table 6.8). This is equal to about 30percent of the economic efficiency potential of the entire economy,or more than 30 percent of the projected energy demand for 2010.In ferrous metallurgy, replacing open-heart furnaces with oxygenconverters and electric steel furnaces could save 73–88 petajoulesa year (box 6.5). Introducing continuous casting on greater scalecould save 59–70 petajoules a year. Recycling an additional 10 milliontonnes of ferrous scrap would save 290 petajoules a year.
In primary aluminium production it is realistic to cut the use ofelectric power to 13,200 kilowatt-hours per tonne by using elec-trolysers of greater capacity and introducing automated control oftechnological parameters. In the production of building materials thetransfer of cement clinker production to dry process in the productionof bricks and lime and other related measures may cut energy useby 400 petajoules a year. In the chemical industry, replacing obsoletewith modern technology in the production of ammonia, olefines,aromates, alcohols, and the like will not only reduce energy intensityto levels comparable to the best world examples (around 200 petajoulesin 2010), it will also improve the product mix.
According to Vakulko and Zlobin (1997), the main directions forrational use of electricity in industrial facilities are: installing electricitymetering and control devices, practising power compensation,determining the optimal number of working transformers, andmaking efficient use of lighting and lighting devices, high-efficiency
electric drives, electrothermal devices, welding transformers andunits, and converters. Ukraine’s energy efficiency potential in industryis similar once adjusted for the smaller country, but are still about2,000 petajoules a year by 2010 (see table 6.8).
Residential. Better building insulation will reduce heat losses.Overall, by 2010 Russia could save at least 2,000 petajoules a yearin its residential sector. Ukraine could save 500 petajoules a year(see table 6.8). Typical for Russian households, a 250–360-litrerefrigerator consumes 500–600 kilowatt-hours a year. According toBashmakov, Gritsevich, and Sorokina (1996), more energy-efficientrefrigerators could save up to 175 petajoules a year by 2010. Theefficiency measures in this sector and the commercial sector arevery similar to those in Russia (installing new metering and controldevices, improving insulation of buildings and heating systems).
Transportation. Russia’s Ministry of Transport has adopted severalprogrammes to make the transportation system more efficient, safe,and comfortable (SNAP, 1999). In 1995 the ministry introduced aprogramme aimed at introducing energy-saving vehicles, optimisingthe structure of the vehicle stock, developing energy-efficient engines,and introducing energy-saving fuels and lubricants (RussianFederation Ministry of Transport 1995). Among other measures, theprogramme is expected to increase of the share of diesel-fuelledtrucks and buses and modernise aeroplanes and helicopters.
Though there is great potential for economic energy savings,these savings will be difficult to achieve. Russia and Ukraine cannotprovide the necessary financial support to industry and municipalities.Current investments in energy-saving measures are so low that lessthan 10 percent of economic energy saving potential is beingreached in the Commonwealth of Independent States (Bashmakov,Gritsevich, and Sorokina, 1996). But this is likely to change with theeconomic recovery of Russia and Ukraine over the next 10 years.
IndiaWith more than 1 billion inhabitants, India is one of the world’sbiggest emerging economies.16 In the 50 years since independencethe use of commercial energy has increased by ten times, and in1996/97 was 10,300 petajoules (GOI, Ninth Plan Document, 1996).But per capita energy consumption is only about 15 gigajoules ayear (including non-commercial energy)—far below the worldaverage of 65 gigajoules. Given the ever-widening gap between energysupply and demand in India, and the resource constraint impedinglarge-scale energy generation at source, efficient energy use is anextremely important, cost-effective option. Commercial energy useis dominated by industry (51 percent), followed by transportation(22 percent), households (12 percent), agriculture (9 percent),and other sectors including basic petrochemical products (6 percent).
Industry. Indian industry is highly energy-intensive, with energyefficiency well below that of industrialised countries (see table 6.3).Efforts to promote energy efficiency in such industries could substantiallyreduce operating costs. About 65–70 percent of industrial energyconsumption is accounted for by seven sectors—fertiliser, cement,pulp and paper, textiles, iron and steel, aluminium, and refineries.
BOX 6.5. MARKET FORCES DRIVE MORE ENERGY-EFFICIENT INDUSTRY IN THE
COMMONWEALTH OF INDEPENDENT STATES
Automated controls introduced in the processing of petrochemicalsreduced electricity consumption per unit of output by 40–65 percentat the Kirishinefteorgsyntez plant in Leningrad oblast. Narrowerfluctuations in technological parameters also increased the lives ofelectric motors, valves, and transmitters (Goushin and Stavinski, 1998).
At one of Russia’s largest ferrous metallurgy plants, Magnitogorski,the energy management department developed and implementeda programme for energy saving and efficiency that took into accountthe plant’s new market environment. The programme focuses onmaking better use of internal energy resources. Steam is now usedfor electric power cogeneration (26 megawatts), and coke gas isused as a fuel at boilers-utilisers and in the drying of containersfor transporting iron, replacing 19,000 cubic metres of natural gas(Nikiforov, 1998).
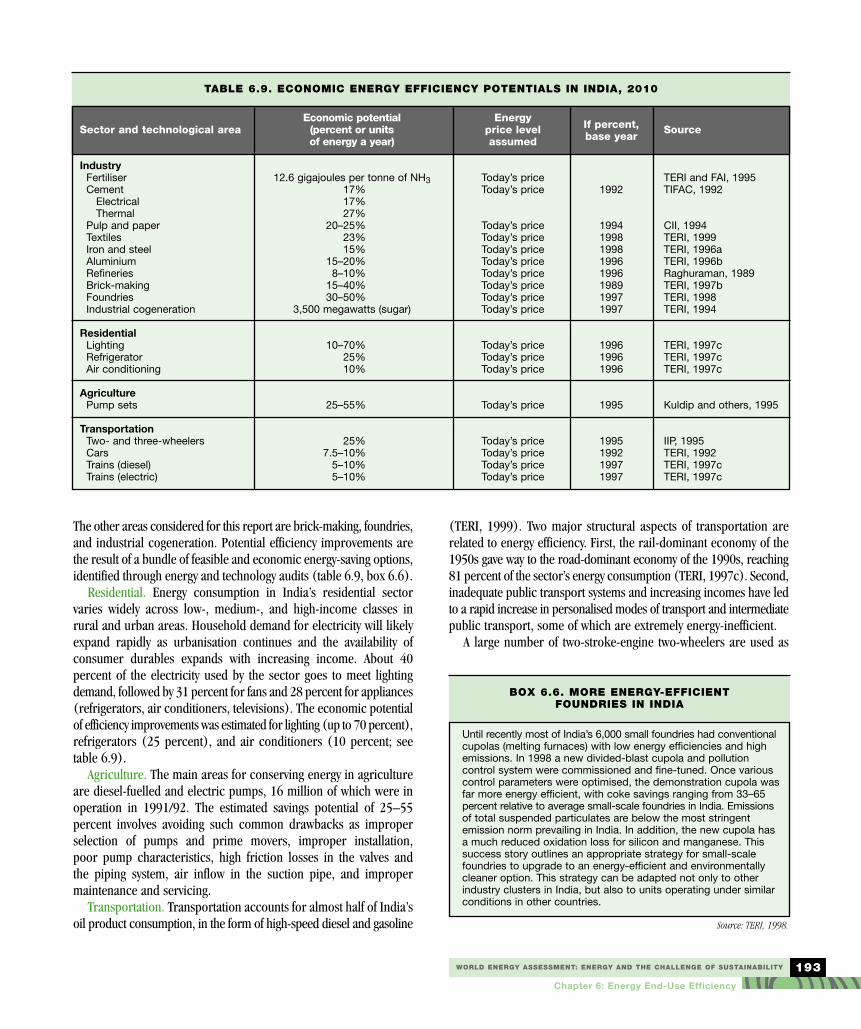
WORLD ENERGY ASSESSMENT: ENERGY AND THE CHALLENGE OF SUSTAINABILITY
Chapter 6: Energy End-Use Efficiency
193
The other areas considered for this report are brick-making, foundries,and industrial cogeneration. Potential efficiency improvements arethe result of a bundle of feasible and economic energy-saving options,identified through energy and technology audits (table 6.9, box 6.6).
Residential. Energy consumption in India’s residential sectorvaries widely across low-, medium-, and high-income classes inrural and urban areas. Household demand for electricity will likelyexpand rapidly as urbanisation continues and the availability of consumer durables expands with increasing income. About 40 percent of the electricity used by the sector goes to meet lightingdemand, followed by 31 percent for fans and 28 percent for appliances(refrigerators, air conditioners, televisions). The economic potentialof efficiency improvements was estimated for lighting (up to 70 percent),refrigerators (25 percent), and air conditioners (10 percent; seetable 6.9).
Agriculture. The main areas for conserving energy in agricultureare diesel-fuelled and electric pumps, 16 million of which were inoperation in 1991/92. The estimated savings potential of 25–55percent involves avoiding such common drawbacks as improperselection of pumps and prime movers, improper installation, poor pump characteristics, high friction losses in the valves and the piping system, air inflow in the suction pipe, and improper maintenance and servicing.
Transportation. Transportation accounts for almost half of India’soil product consumption, in the form of high-speed diesel and gasoline
(TERI, 1999). Two major structural aspects of transportation arerelated to energy efficiency. First, the rail-dominant economy of the1950s gave way to the road-dominant economy of the 1990s, reaching81 percent of the sector’s energy consumption (TERI, 1997c). Second,inadequate public transport systems and increasing incomes have ledto a rapid increase in personalised modes of transport and intermediatepublic transport, some of which are extremely energy-inefficient.
A large number of two-stroke-engine two-wheelers are used as
TABLE 6.9. ECONOMIC ENERGY EFFICIENCY POTENTIALS IN INDIA, 2010
Sector and technological area
IndustryFertiliserCement
ElectricalThermal
Pulp and paperTextilesIron and steel AluminiumRefineriesBrick-makingFoundriesIndustrial cogeneration
Residential LightingRefrigeratorAir conditioning
AgriculturePump sets
TransportationTwo- and three-wheelersCarsTrains (diesel)Trains (electric)
Energy price levelassumed
Today’s priceToday’s price
Today’s priceToday’s priceToday’s priceToday’s priceToday’s priceToday’s priceToday’s priceToday’s price
Today’s priceToday’s priceToday’s price
Today’s price
Today’s priceToday’s priceToday’s priceToday’s price
Source
TERI and FAI, 1995TIFAC, 1992
CII, 1994TERI, 1999TERI, 1996aTERI, 1996bRaghuraman, 1989TERI, 1997bTERI, 1998TERI, 1994
TERI, 1997cTERI, 1997cTERI, 1997c
Kuldip and others, 1995
IIP, 1995TERI, 1992TERI, 1997cTERI, 1997c
Economic potential (percent or units of energy a year)
12.6 gigajoules per tonne of NH317%17%27%
20–25%23%15%
15–20%8–10%
15–40%30–50%
3,500 megawatts (sugar)
10–70%25%10%
25–55%
25%7.5–10%
5–10% 5–10%
If percent,base year
1992
19941998199819961996198919971997
199619961996
1995
1995199219971997
BOX 6.6. MORE ENERGY-EFFICIENT FOUNDRIES IN INDIA
Until recently most of India’s 6,000 small foundries had conventionalcupolas (melting furnaces) with low energy efficiencies and highemissions. In 1998 a new divided-blast cupola and pollution control system were commissioned and fine-tuned. Once variouscontrol parameters were optimised, the demonstration cupola wasfar more energy efficient, with coke savings ranging from 33–65percent relative to average small-scale foundries in India. Emissionsof total suspended particulates are below the most stringent emission norm prevailing in India. In addition, the new cupola hasa much reduced oxidation loss for silicon and manganese. Thissuccess story outlines an appropriate strategy for small-scalefoundries to upgrade to an energy-efficient and environmentallycleaner option. This strategy can be adapted not only to otherindustry clusters in India, but also to units operating under similarconditions in other countries.
Source: TERI, 1998.

WORLD ENERGY ASSESSMENT: ENERGY AND THE CHALLENGE OF SUSTAINABILITY
Chapter 6: Energy End-Use Efficiency
194
personal vehicles. (In 1996 the number of registered two-wheelerswas 23.1 million.) Efficiency improvements of 25 percent are pos-sible for two-stroke engines (two- and three-wheelers). The strin-gent emission standards proposed for two- and three-wheelers willforce manufacturers to switch to four-stroke engines. Efficiencyimprovements for cars and buses are expected to come primarilyfrom switching from gasoline and diesel to compressed natural gas(TERI, 1992).
The importance of research and development for increasing energyefficiency is still underestimated in India. Spending on research anddevelopment increased from 0.35 percent of GNP in 1970 to 0.81percent in 1994. But this share is still just one-third of the ratio inindustrialised countries. Tackling the complex technological problemsof the energy sector, particularly end-use efficiencies, will requireresearch and development on a steadily increasing scale.
ChinaLike India, China is one of the world’s main emerging economies,with a population of more than 1.2 billion.17 In 1996 China’s primary energy demand was 44,000 petajoules, or 36 gigajoules percapita. Substantial energy efficiency gains could be realised throughintensive investments in the country’s productive sectors.
Industry. In 1995 steel and iron industry consumed 3,740 petajoules, accounting for 13 percent of China’s final energy usewith a performance of 46 percent energy efficiency. Energy consumption per tonne of steel will likely drop from 44 gigajoulesin 1995 to 35 gigajoules in 2010, which is a little higher thanthe level in industrialised countries in the 1970s (table 6.10). The potential efficiency savings in some other energy-intensivebranches are higher—construction materials could achieve 20 percent and chemicals up to 30 percent, with particular savings inbasic chemicals such as ammonia, sulphate, soda, carbide, and olefine production.
Residential. Since the 1980s domestic energy consumption hasincreased because of higher living standards and expanded livingspace. Measures such as preventing heat losses, improving electricappliance efficiency, replacing incandescent lamps with fluorescentlamps, improving stoves and boilers, and using cogeneration willenhance energy efficiency in this sector. In 1995 the average efficiency of China’s energy use—as defined by the relationshipbetween useful energy and final energy—was 45 percent in urbanareas and 25 percent in rural areas, indicating considerable potentialfor improvement. By 2010 energy efficiency is expected to reach 50 percent in urban areas and 45 percent in rural areas, close to
TABLE 6.10. ECONOMIC ENERGY EFFICIENCY POTENTIALS IN CHINA, 2010
Sector and area
IndustryIron and steelCementFoundriesPulp and paperTextilesFertiliserAluminiumBrick kilnsRefineriesEthyleneCalcium carbideSulphateCaustic soda
HouseholdLightingRefrigeratorAir conditionerWashing machineCooking utensilsHeating equipment
AgricultureMotorsPump sets
TransportationTrain (diesel)Train (electric)CarsVessels
Energy price level assumed
Today’s priceToday’s price Today’s priceToday’s priceToday’s priceToday’s priceToday’s priceToday’s priceToday’s priceToday’s priceToday’s priceToday’s priceToday’s price
Today’s priceToday’s priceToday’s priceToday’s priceToday’s priceToday’s price
Today’s priceToday’s price
Today’s priceToday’s priceToday’s priceToday’s price
Reference
Hu, 1997Hu, 1997Hu, 1997 Hu and Jiang, 1997Hu, 1997Hu and Jiang, 1997Hu and Jiang, 1997Hu and Jiang, 1997Hu and Jiang, 1997Hu and Jiang, 1997Hu and Jiang, 1997CIECC, 1997CIECC, 1997
CIECC, 1997CIECC, 1997CIECC, 1997CIECC, 1997CIECC, 1997CIECC, 1997
CIECC, 1997CIECC, 1997
Hu, 1997Hu, 1997Hu, 1997Hu, 1997
Economic potential (percent)
15-2510-208-14
20-4015-2810-20
2032
5-1010-3010-2214-2510-30
10-4010-15
1515
20-4010-30
10-3020-50
5-158-14
10-1510
Base year
1995199519951995199519951995199519951995199519951995
199519951995199519951995
19951995
1995199519951995
WORLD ENERGY ASSESSMENT: ENERGY AND THE CHALLENGE OF SUSTAINABILITY
Chapter 6: Energy End-Use Efficiency
195
levels in industrialised countries inthe early 1990s (box 6.7). This meanssavings of 10–15 percent in urbanareas and 80 percent in rural areas.These gains are important because the drivers for energy services will be increasing by 5–18 percent a year.
Other sectors. In 1995 other final energy users in theservice sector had an average end-use efficiency of about 40 percent.By 2010 technological progress and technical measures are expectedto increase the efficiency level by 5–10 percentage points over 1995,reaching the level of industrialised countries in the early 1990s.
Transportation. Transportation is a large and fast-growing energy-consuming sector, especially for petroleum products (2,640 petajoulesin 1995, including public transport). By 2010 energy consumptionwill almost double, with oil products accounting for 87 percent oftransport energy consumption. Relative to other sectors, transportationhas a low end-use efficiency of around 30 percent. The main technicalmeasures for increasing efficiency are similar to those elsewhere:increase the share of diesel vehicles, rationalise the weight of cars,speed up road construction and improve its quality; increase theshare of electric engines and internal combustion engines on trains,and optimise engines. Better-designed propellers on ships couldsave 5 percent on ships’ fuel consumption. Optimal ship shapeenergy-saving technology will save 4–10 percent of fuel, and the useof tidal energy another 3–5 percent.
Latin AmericaPrimary energy demand in Latin America grew 2.3 percent a yearover the past 20 years, reaching 18,130 petajoules in 1996.18 Theregion also contains several emerging economies that are increasingworld energy demand. In 1997 Argentina, Brazil, Mexico, and Venezuelaused 85 percent of the region’s primary energy (EIA, 1999b).
Industry. Four sectors (cement, iron and steel, chemicals, foodand beverages) consume 60 percent of industrial energy in LatinAmerica. Iron and steel alone account for 23 percent of industrialenergy. Better management of blast furnaces, the injection of gases,and improved processes could reduce energy demand by 10–28percent (Cavaliero, 1998). Machado and Shaeffer (1998) estimatepotential electricity savings of 23 percent in Brazil’s iron and steelindustry and 11–38 percent in its cement industry (table 6.11). Thefood and beverage industry and chemical industry have similar efficiencypotential (Argentina Secretaria de Energía, 1997; Jannuzzi, 1998).
In Brazil’s industrial sector, electrical motors consume 51 percentof electricity, electrochemical processes 21 percent, electrothermalprocesses 20 percent, refrigeration 6 percent, and lighting 2 percent(Geller and others, 1997 and 1998). In Argentina nearly 75 percentof industrial electricity is used in motors (Dutt and Tanides, 1994)and in Chile it is 85 percent (Valdes-Arrieta, 1993). The BrazilianElectricity Conservation Agency estimates that savings of 8–15 percentare achievable in Brazilian industry based on cost-effective measuressuch as replacing oversized motors, improving transmission systems,replacing overloaded internal lines and transformers, correcting low
power factors, and reducing excessivepeak loads (box 6.8). Additional
savings of 7–15 percent could beachieved by using efficient motors and
variable speed drives; improving electricalfurnaces, boilers, and electrolytic process
efficiencies; and disseminating cogeneration inindustry (Geller and others, 1998; Soares and Tabosa, 1996).
Recycling the heat surplus or installing more efficient equipmentcould reduce by 10 percent the amount of electricity used in electricovens. Similar savings for Argentina have been estimated by Dutt andTanides (1994) and Argentina Secretaria de Energía (1997).
The significant potential of combined heat and power is under-exploited in most Latin American countries. The potential is great insectors such as paper and pulp, chemicals, and the alcohol-sugarindustry, because they produce industrial residues that can be usedto generate a surplus of electricity, which can then be sold to the common grid. Legislation establishing independent power producersis in place, but there are still problems in regulating buy-back rates,maintenance power, and wheeling between industry and electric utilities.
Residential. Annual energy use for cooking is estimated at 5.2 gigajoules per capita, nearly half of which is from firewood(data cover only Argentina, Brazil, Mexico, and Venezuela). The useof biomass (firewood and charcoal) is declining, however, and theuse of liquefied petroleum gas and natural gas is on the rise.Because these fuels are more efficient, per capita energy consumptionwill be 20 percent lower by 2020. During 1990–95 per capita residential electricity use increased by 4–5 percent a year in Braziland Mexico. Specific savings in electricity use by appliances rangefrom 20–40 percent over the next 10–20 years for several LatinAmerican countries (see table 6.11).
Commercial and public sectors. More efficient energy use in thecommercial and public sectors can be achieved by introducing better
BOX 6.7. GREEN LIGHT PROGRAMME OF CHINA
China’s Green Light Programme is an energy conservation projectsupported by UNDP and organised and carried out by the StateEconomic and Trade Commission of China. The programme isdesigned to increase the use of lighting systems that are highlyefficient, long-lasting, safe, and stable. The goal is to save electricity, reduce environmental pollution from power generation,and improve the quality of working and living. The programme has had several achievements:• Electricity savings. During 1995–2000, 300 million compact
fluorescent lamps, thin-tube fluorescent lamps, and other high-efficiency illumination products will save 22 terawatt-hours ofelectricity (as final energy).
• Reduced emissions. By 2000 sulphur dioxide emissions willbe reduced by 200,000 tonnes and carbon dioxide emissionsby 7.4 million tonnes.
• Establishing the market. By creating market-driven demandfor high-efficiency lighting products, China will minimise spending for the associated gains. Close attention has beengiven to upgrading energy-efficient products by improving quality standards and certification.
Low-energy houses need only 10�30 percent of the heat per square metre that is used in the
average residential building in West Germany.
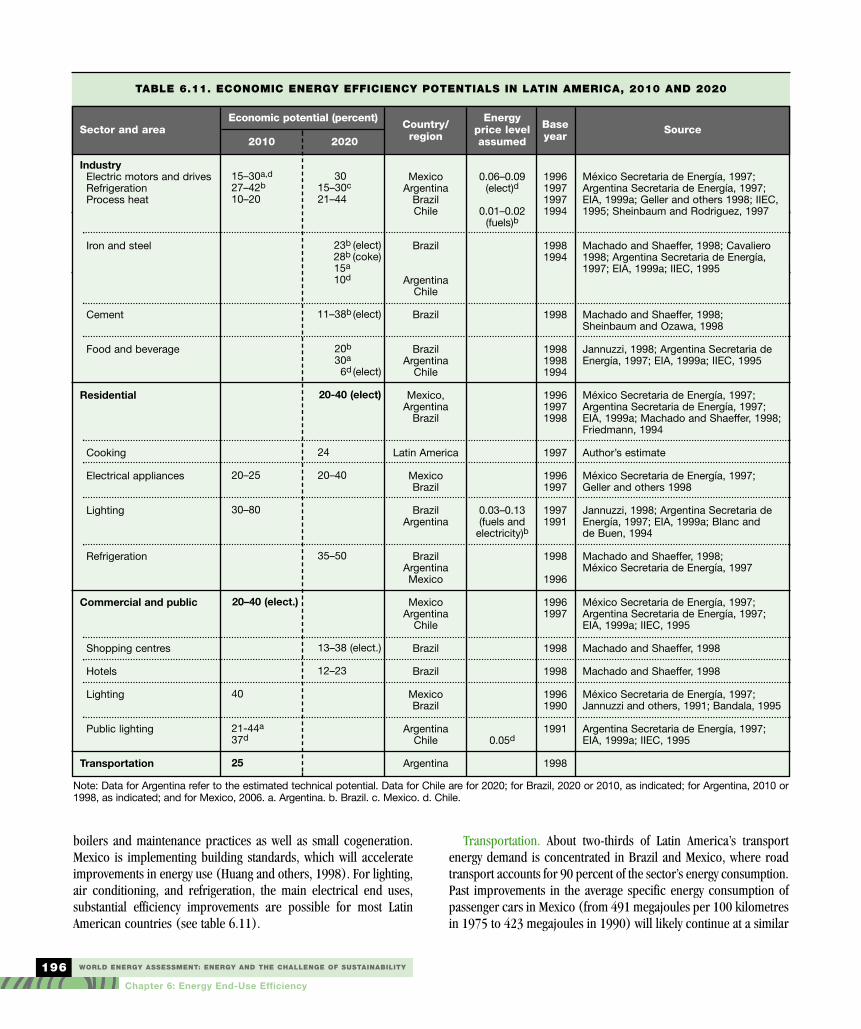
WORLD ENERGY ASSESSMENT: ENERGY AND THE CHALLENGE OF SUSTAINABILITY
Chapter 6: Energy End-Use Efficiency
196
boilers and maintenance practices as well as small cogeneration.Mexico is implementing building standards, which will accelerateimprovements in energy use (Huang and others, 1998). For lighting,air conditioning, and refrigeration, the main electrical end uses,substantial efficiency improvements are possible for most LatinAmerican countries (see table 6.11).
Transportation. About two-thirds of Latin America’s transportenergy demand is concentrated in Brazil and Mexico, where roadtransport accounts for 90 percent of the sector’s energy consumption.Past improvements in the average specific energy consumption ofpassenger cars in Mexico (from 491 megajoules per 100 kilometresin 1975 to 423 megajoules in 1990) will likely continue at a similar
TABLE 6.11. ECONOMIC ENERGY EFFICIENCY POTENTIALS IN LATIN AMERICA, 2010 AND 2020
Sector and area
IndustryElectric motors and drivesRefrigerationProcess heat
Iron and steel
Cement
Food and beverage
Residential
Cooking
Electrical appliances
Lighting
Refrigeration
Commercial and public
Shopping centres
Hotels
Lighting
Public lighting
Transportation
Note: Data for Argentina refer to the estimated technical potential. Data for Chile are for 2020; for Brazil, 2020 or 2010, as indicated; for Argentina, 2010 or1998, as indicated; and for Mexico, 2006. a. Argentina. b. Brazil. c. Mexico. d. Chile.
Energy price levelassumed
0.06–0.09(elect)d
0.01–0.02(fuels)b
0.03–0.13(fuels and
electricity)b
0.05d
Baseyear
1996199719971994
19981994
1998
199819981994
199619971998
1997
19961997
19971991
1998
1996
19961997
1998
1998
19961990
1991
1998
Source
México Secretaria de Energía, 1997;Argentina Secretaria de Energía, 1997;EIA, 1999a; Geller and others 1998; IIEC,1995; Sheinbaum and Rodriguez, 1997
Machado and Shaeffer, 1998; Cavaliero1998; Argentina Secretaria de Energía,1997; EIA, 1999a; IIEC, 1995
Machado and Shaeffer, 1998; Sheinbaum and Ozawa, 1998
Jannuzzi, 1998; Argentina Secretaria deEnergía, 1997; EIA, 1999a; IIEC, 1995
México Secretaria de Energía, 1997;Argentina Secretaria de Energía, 1997;EIA, 1999a; Machado and Shaeffer, 1998;Friedmann, 1994
Author’s estimate
México Secretaria de Energía, 1997;Geller and others 1998
Jannuzzi, 1998; Argentina Secretaria deEnergía, 1997; EIA, 1999a; Blanc and de Buen, 1994
Machado and Shaeffer, 1998; México Secretaria de Energía, 1997
México Secretaria de Energía, 1997;Argentina Secretaria de Energía, 1997;EIA, 1999a; IIEC, 1995
Machado and Shaeffer, 1998
Machado and Shaeffer, 1998
México Secretaria de Energía, 1997;Jannuzzi and others, 1991; Bandala, 1995
Argentina Secretaria de Energía, 1997;EIA, 1999a; IIEC, 1995
2010
15–30a,d
27–42b
10–20
20–25
30–80
20–40 (elect.)
40
21-44a
37d
25
2020
3015–30c
21–44
23b (elect) 28b (coke) 15a
10d
11–38b (elect)
20b
30a
6d (elect)
20-40 (elect)
24
20–40
35–50
13–38 (elect.)
12–23
Economic potential (percent)Country/region
MexicoArgentina
BrazilChile
Brazil
ArgentinaChile
Brazil
BrazilArgentina
Chile
Mexico,Argentina
Brazil
Latin America
MexicoBrazil
BrazilArgentina
BrazilArgentinaMexico
MexicoArgentina
Chile
Brazil
Brazil
MexicoBrazil
ArgentinaChile
Argentina
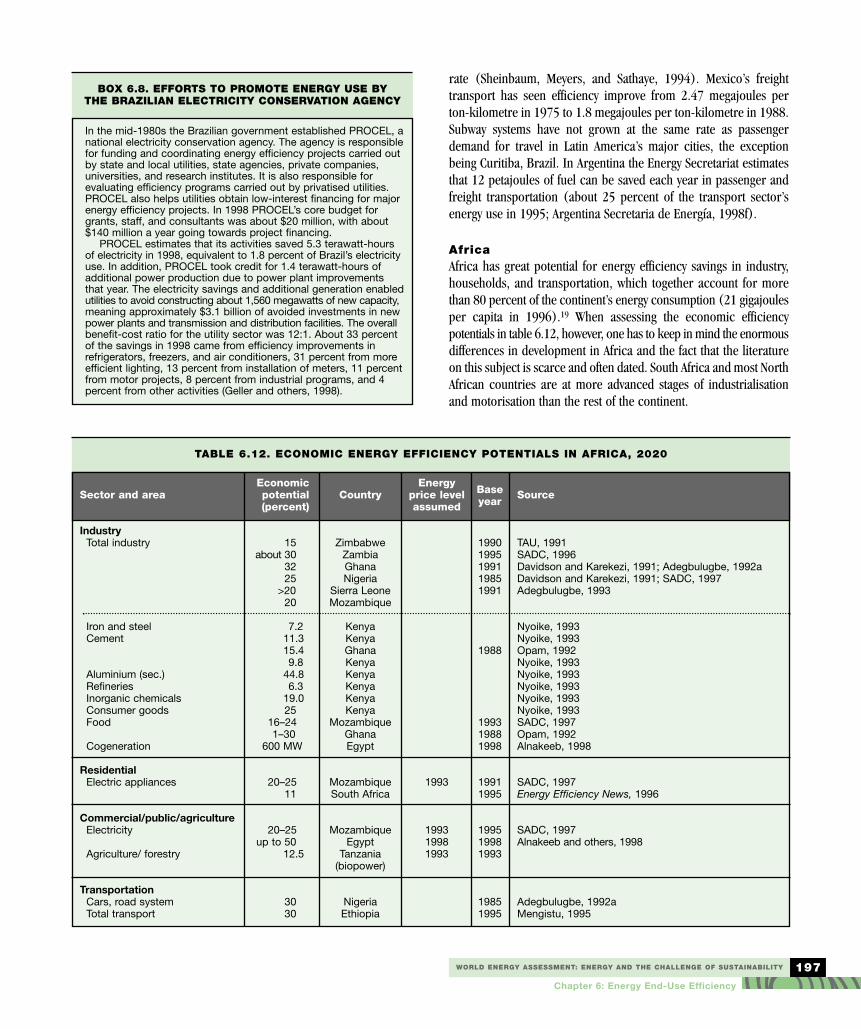
WORLD ENERGY ASSESSMENT: ENERGY AND THE CHALLENGE OF SUSTAINABILITY
Chapter 6: Energy End-Use Efficiency
197
rate (Sheinbaum, Meyers, and Sathaye, 1994). Mexico’s freighttransport has seen efficiency improve from 2.47 megajoules perton-kilometre in 1975 to 1.8 megajoules per ton-kilometre in 1988.Subway systems have not grown at the same rate as passengerdemand for travel in Latin America’s major cities, the exceptionbeing Curitiba, Brazil. In Argentina the Energy Secretariat estimatesthat 12 petajoules of fuel can be saved each year in passenger andfreight transportation (about 25 percent of the transport sector’senergy use in 1995; Argentina Secretaria de Energía, 1998f).
AfricaAfrica has great potential for energy efficiency savings in industry,households, and transportation, which together account for morethan 80 percent of the continent’s energy consumption (21 gigajoulesper capita in 1996).19 When assessing the economic efficiencypotentials in table 6.12, however, one has to keep in mind the enormousdifferences in development in Africa and the fact that the literatureon this subject is scarce and often dated. South Africa and most NorthAfrican countries are at more advanced stages of industrialisationand motorisation than the rest of the continent.
BOX 6.8. EFFORTS TO PROMOTE ENERGY USE BY THE BRAZILIAN ELECTRICITY CONSERVATION AGENCY
In the mid-1980s the Brazilian government established PROCEL, anational electricity conservation agency. The agency is responsiblefor funding and coordinating energy efficiency projects carried outby state and local utilities, state agencies, private companies, universities, and research institutes. It is also responsible for evaluating efficiency programs carried out by privatised utilities.PROCEL also helps utilities obtain low-interest financing for majorenergy efficiency projects. In 1998 PROCEL’s core budget forgrants, staff, and consultants was about $20 million, with about$140 million a year going towards project financing.
PROCEL estimates that its activities saved 5.3 terawatt-hoursof electricity in 1998, equivalent to 1.8 percent of Brazil’s electricityuse. In addition, PROCEL took credit for 1.4 terawatt-hours ofadditional power production due to power plant improvementsthat year. The electricity savings and additional generation enabledutilities to avoid constructing about 1,560 megawatts of new capacity,meaning approximately $3.1 billion of avoided investments in newpower plants and transmission and distribution facilities. The overallbenefit-cost ratio for the utility sector was 12:1. About 33 percentof the savings in 1998 came from efficiency improvements inrefrigerators, freezers, and air conditioners, 31 percent from moreefficient lighting, 13 percent from installation of meters, 11 percentfrom motor projects, 8 percent from industrial programs, and 4percent from other activities (Geller and others, 1998).
TABLE 6.12. ECONOMIC ENERGY EFFICIENCY POTENTIALS IN AFRICA, 2020
Sector and area
IndustryTotal industry
Iron and steelCement
Aluminium (sec.)RefineriesInorganic chemicalsConsumer goodsFood
Cogeneration
ResidentialElectric appliances
Commercial/public/agricultureElectricity
Agriculture/ forestry
TransportationCars, road systemTotal transport
Energy price levelassumed
1993
199319981993
Baseyear
19901995199119851991
1988
199319881998
19911995
199519981993
19851995
Source
TAU, 1991SADC, 1996Davidson and Karekezi, 1991; Adegbulugbe, 1992aDavidson and Karekezi, 1991; SADC, 1997Adegbulugbe, 1993
Nyoike, 1993Nyoike, 1993Opam, 1992Nyoike, 1993Nyoike, 1993Nyoike, 1993Nyoike, 1993Nyoike, 1993SADC, 1997Opam, 1992Alnakeeb, 1998
SADC, 1997Energy Efficiency News, 1996
SADC, 1997Alnakeeb and others, 1998
Adegbulugbe, 1992aMengistu, 1995
Economic potential (percent)
15about 30
3225
>2020
7.211.315.49.8
44.86.3
19.025
16–241–30
600 MW
20–2511
20–25up to 50
12.5
3030
Country
ZimbabweZambiaGhanaNigeria
Sierra LeoneMozambique
KenyaKenyaGhanaKenyaKenyaKenyaKenyaKenya
MozambiqueGhanaEgypt
MozambiqueSouth Africa
MozambiqueEgypt
Tanzania(biopower)
NigeriaEthiopia
WORLD ENERGY ASSESSMENT: ENERGY AND THE CHALLENGE OF SUSTAINABILITY
Chapter 6: Energy End-Use Efficiency
198
Industry. Studies indicate that good housekeeping measures cansave substantial amounts of energy in African industries (see table6.12). Potential energy savings in national industries range from15–32 percent by 2020. Results from energy audits in Nigeria (oftwo cement plants, one steel plant, and a furniture manufacturingplant) show potential savings of up to 25 percent. In 28 small- andmedium-size industries in Zambia and Zimbabwe the potential sav-ings are between 15 and 30 percent, in Kenyan industries about 25percent, in nine industrial plants in Egypt about 23 percent, inGhana 32 percent, and in Sierra Leone more than 20 percent. A more recent analysis carried out in industries in Mozambiqueindicates an economic electricity saving potential of 20 percent(SADC, 1997). Cogeneration also seems to have unexploited potential—in Egypt four industrial branches could save 600megawatts by engaging in cogeneration (Alnakeeb, 1998).
Residential. The use of inefficient traditional three-stone fuelwoodstoves for cooking, mainly in rural areas, results in considerableenergy losses. The end-use efficiency of the stoves ranges from12–18 percent. Promoting better biomass-cooking stoves andswitching to modern fuels would greatly reduce the huge energylosses in this sector. Better cooking stoves could raise efficiency to30–42 percent in Ghana, Kenya, and Uganda (box 6.9). In urbanareas the focus should be on energy-efficient appliances, lighting,and other housekeeping measures for domestic appliances. In lightinga shift from kerosene to incandescent lamps, and from incandescentlamps to fluorescent and compact fluorescent lamps, wouldincrease energy efficiency (see table 6.12).
Transportation. Road transport is the dominant mode in Africa.Nearly all vehicles are imported from overseas, often used cars andtrucks. Potential savings are achievable by using roadworthy vehiclesand changing policies. Vehicles tend to have low fuel efficiency. Theaverage fuel efficiency in Nigeria is estimated to be about 18 litres of
gasoline per 100 kilometres (Adegbulugbe, 1992a). Fuel efficiencyis low because the vehicle fleet is old and poorly maintained,because of traffic congestion in most urban centres, and because ofbad driving habits. Energy savings of 30 percent could be achievedin the road subsector by shifting from an energy-intensive transportmode to a less energy-intensive public transport system and byadopting traffic management schemes. In Ethiopia and Nigeria thedemand for gasoline and diesel could be cut by 30 percent byemphasising public transportation over private automobiles(Adegbulugbe, 1992b; Mengistu, 1995).
The economic potential of energy efficiency—a systemic perspectiveThe preceding section covered only individual technology for energyconversion and use.20 But additional—and sometimes major—energy savings can be realised by looking at energy-using systems ina broader sense. Aspects of this systemic view include:■ Optimising the transport and distribution of energy. Commercial
energy use is often highly decentralised, yet the energy is produced in central plants; examples include electricity and district heating networks.
■ Optimising the location of energy users to avoid transportinggoods or people.
■ Optimising according the second law of thermodynamics by supplying the suitable form of energy, including heat at the need-ed temperature and pressure, or by exploiting opportunities forenergy cascading.These concepts are not new. But they are often neglected in the
planning of cities and suburbs, industrial sites and areas, airports,power plants, and greenhouses.
Excellent examples of the systemic approach include not onlytechnical systems but also innovations in joint planning and coordi-nated—or even joint—operation or financing of energy generating,distributing, or using systems (IEA, 1997a):■ A district heating system in Kryukovo, Russia, that supplies almost
10 petajoules of heat was to a large extent manually controlledand monitored. Automated control of substations, remote sensing,and control between substations and the operator working stationresulted in savings of 20–25 percent.
■ Organising urban mobility is a major challenge for all countries.In areas with rapidly growing populations, planning decisions onresidential, industrial, and commercial areas do not adequatelyconsider induced mobility demand and possible modes of transportation. Incentives for car sharing, park-and-ride systems,and parking influence the use of cars and public transportation.In developing countries a lack of capital for subways must notlead to disastrous traffic jams. A possible solution has been realisedby the bus system in Curitiba, Brazil (IEA, 1997a, p. 103).
■ The adequate use of the exergy of energy carriers is another systemicaspect of energy efficiency. Cogeneration takes many forms: combined gas and steam turbines, gas turbines instead of burners,engine-driven cogeneration, and fuel cells that can supply heat at
BOX 6.9. ENERGY-EFFICIENT COOKING IN RURAL AFRICA
The Kenya Ceramic Jiko initiative is one of the most successfulurban cookstove projects in Africa. The initiative promotes a charcoal-based cookstove with an energy efficiency of about 30percent. The stove is made of local ceramic and metal components.Since the mid-1980s more than 500,000 of the stoves have beenproduced and distributed in Kenya. The stove is not a radicaldeparture from the traditional all-metal stove. Rather, it is an incremental development. On the other hand, the stove requiresthat charcoal be produced and transported.
The improved stove is fabricated and distributed by the samepeople who manufacture and sell traditional stoves. From thebeginning the stove initiative received no subsidies—a decisionthat had a tremendous impact on its development, encouragingprivate entrepreneurs to invest their capital and work hard to recovertheir investment. This drive to recover the original investment helpedensure self-sustained production, marketing, and commercialisationof the charcoal stoves. In addition, the lack of subsidy enhancedcompetition between producers, bringing down its market price toa more realistic and affordable level for Kenya’s low-income urbanhouseholds. The stove design has been successfully replicated inMalawi, Rwanda, Senegal, Sudan, Tanzania, and Uganda.
WORLD ENERGY ASSESSMENT: ENERGY AND THE CHALLENGE OF SUSTAINABILITY
Chapter 6: Energy End-Use Efficiency
199
the correct levels of temperatureand pressure (Kashiwagi, 1999).Excess heat at low temperaturesmay be used in heat transformers, heatpumps, or adsorption cooling systems.Production processes with high-temperatureheat demand can be located in industrial parkssurrounded by production processes with lower-temperatureheat that can be reused in greenhouses or fish ponds (Kashiwagi, 1995).These systemic aspects have been investigated less intensively
because such systems demand a lot of coordinated planning andaction by several actors and institutions. They often also demandchanges in legal frameworks and decision-making in companiesand administrations. Additional risks have to be managed by newentrepreneurial solutions and insurance services. In many cases,however, the efficiency potentials if such systems may exceed theeconomic efficiency potentials of individual technologies.
Technical and theoretical potentials for rational energy use after 2020Many energy economists expect energy demand to increase inindustrialised countries, accompanied by a substantial shift to natural gas, nuclear power, and renewables to avoid climatechanges caused by energy-related greenhouse gases (chapter 9).21
Explicitly or implicitly, those expectations assume that substantialcost-effective efficiency improvements will be exhausted within thenext 20 years, contributing to new growth in energy demand aftersome 25 years of stagnation. But applied scientists and engineershave questioned the judgement that feasible improvements in energyefficiency are limited to 30–40 percent (Jochem, 1991; De Beer, 1998;ETSU, 1994; Blok and others, 1996; Kashiwagi and others, 1998).These authors argue that, depending on new technology and scientificknowledge, the long-term technical potential for rational energy usemay even exceed 80 percent in the 21st century, driven by efforts to: ■ Increase exergy efficiency (which today is less than 15 percent,
even in industrialised countries) by exploiting the different tem-peratures of heat streams and using the adequate form of finalenergy or heat at the needed temperature level.
■ Decrease the level of useful energy by reducing losses (forexample, through insulation or heat recovery) and by substitutingenergy-intensive processes (such as membrane and absorptiontechnologies instead of thermal separation, thin slab casting ofsteel instead of rolling steel sheets, new catalysts or enzymes, newbio-technical processes, and inductive electric processes insteadof thermal surface treatment).
■ Apply new materials (new compound plastics, foamed metals,nano-technology applications).
■ Intensify recycling of energy-intensive materials (increasedshares of recycled plastics, aluminium, or flat glass, which stillhave low recycling rates in most regions).
■ Re-substitute wood, natural fibres, and natural raw materials forenergy-intensive plastics (due to great potential for genetic manip-
ulation of plants and substitutionamong energy-intensive materials;
see box 6.1). Because of the unbalanced perception
between the long-term potential for rationalenergy use and energy conversion and supply
technologies (Jochem, 1991), the huge long-termpotential for increasing energy efficiency at the end-use level
will likely remain underestimated for some time. Indeed, given theenormous economies of scale in fast-growing national, regional,and global markets, the economic efficiency potentials cited abovefor 2010 and 2020 may be too small in many cases.
To use as many energy sources as possible, the concept of cascadedenergy use must be introduced in the energy conversion and end-usesectors. Cascaded energy use involves fully harnessing the heat produced by fossil fuel combustion (from its initial 1,700°C downto near-ambient temperatures), with a thermal ‘down flow’ of heatanalogous to the downward flow of water in a cascade (Kashiwagi,1995; Shimazaki and others, 1997). Applications that exploit thefull exergetic potential of energy in multiple stages (cascaded) arenot common. To exploit the exergetic potential of industrial wasteheat, energy transfers between the industrial and residential orcommercial sectors are advisable. But low energy prices make it difficult to find economically attractive projects.
For refrigeration, air conditioning, and hot water supply, it is possible to meet most of the heat demand with low-exergy wasteheat obtained as a by-product of high-temperature, high-grade primary energy use in heat engines or fuel cells, in a cascaded useof cogeneration. From a thermodynamic viewpoint it is appropriateto combine low-exergy heat sources, such as solar and waste heat,with systems requiring low-exergy heat, such as heating, cooling,and air conditioning.
The level of specific useful energy demand can be influenced byinnumerable technological changes without reducing the energyservices provided by energy use and without impairing comfort. Afew examples demonstrate these almost unconverted possibilities:■ The quality of insulation and air-tightness determine the demand
for useful energy in buildings, furnaces, refrigerators and freezers.Low-energy houses need only 10–30 percent of the heat persquare metre that is used in the average residential building inWest Germany (box 6.12). A cold-storage depot or a refrigeratorcould be operated by outdoor air in the winter in zones withmoderate climate.
■ A substantial part of industrial waste heat occurs at temperaturesbelow 50oC. Water adsorption chillers provide a way to recoversuch heat sources and produce cooling energy (Saha and Kashiwagi,1997), increasing energy efficiency.
■ Catalysts, enzymes, new materials, and new processes will makepossible the substitution of many energy-intensive processes.High energy demand to activate chemical reactions, with high-pressure and high-temperature processes, may be renderedunnecessary by new catalysts or biotechnological processes.Membrane processes will use only a small percentage of the useful
Catalysts, enzymes,new materials, and new
processes will make possible the substitution of many energy-
intensive processes.
WORLD ENERGY ASSESSMENT: ENERGY AND THE CHALLENGE OF SUSTAINABILITY
Chapter 6: Energy End-Use Efficiency
200
energy needed today in thermal separation processes. The productionof iron—which today involves energy-intensive sintering andcoke-making—will be switched to the new coal metallurgy, withsubstantial energy savings. Over the long term, the energy-intensiverolling-mill operation of steel-making will be replaced by continuousthin slab casting or even spraying of steel sheets.
■ New materials for cutting edges will improve surface quality,avoiding several machine operations. Lasers will reduce the specificenergy demand of metal cutting, and inductive electric processeswill save energy in thermal surface treatment. New compoundplastics or foamed metals will induce less energy demand inmanufacturing and (because of smaller specific weight andreduced losses due to inertia) be used in vehicles and movingparts of machines and engines.Over the past century energy systems in industrialised countries
saw efficiency increase by 1.0–1.5 percent a year. Looking at thetheoretical and technical potential of future energy efficiency, a sim-ilar increase of 1.0–1.5 percent a year appears possible over thenext century. Increases in efficiency will be steadily exhausted byimplementing economic efficiency opportunities and steadily fed byimplementing technical innovations and cost reductions for energy-efficient technology. This process can be understood as a constanteconomic efficiency potential of 25–30 percent over the next 20years, similar to the observation at the energy supply side that theratio of proven reserves to consumption of oil remains at 30–40years due to continuous searching for new reserves and technicalprogress on prospecting, drilling, and production techniques.
Obstacles, market imperfections, anddisincentives for efficient energy useEnergy efficiency improvements since the oil shock of 1973 mayhave done more to redesign energy markets than did changes inconventional energy supply systems.22 And as noted, such improvementsstill offer huge opportunities and can contribute to sustainabledevelopment in all regions. But given today’s levels of energy-relatedknowledge, decision-making, and power structures, there is muchevidence that the great potential for rational energy use will be overlooked by many companies, administrations, and householdsor deemed purely theoretical or unfeasible.
Of course, it will not be easy to fully achieve economic efficiencypotentials, the ‘fifth energy resource’. The technologies are decentralisedand technologically very different, and increased efficiency is harderto measure than energy consumption. In addition, instead of a dozenlarge energy supply companies or a few engineering companies in acountry, millions of energy consumers have to decide on their energyefficiency investments and organisational measures. The heterogeneityand diversity of energy consumers and manufacturers of energy-efficientequipment contribute to a low perception of the high potential ofenergy efficiency. Because of this variety and complexity, energy efficiencyis not appealing for the media or for politicians (Jochem, 1991).
In theory, given all the benefits of energy efficiency at the micro-economic and macroeconomic levels, a perfect market would invest
in, and allocate the rewards from, new energy-efficient technologiesand strategies. But in practice, many obstacles and market imperfectionsprevent profitable energy efficiency from being fully realised(Jochem and Gruber, 1990; Hirst, 1991; IEA, 1997a; Gardner andStern, 1996; Reddy, 1991). Although these obstacles and marketimperfections are universal in principle, their importance differsamong sectors, institutions, and regions.
General obstaclesObstacles to end-use efficiency vary by country for many reasons,including technical education and training, entrepreneurial andhousehold traditions, the availability of capital, and existing legislation.Market imperfections include the external costs of energy use(Hohmeyer, Ottinger, and Rennings, 1997) as well as subsidies, traditional legislation and rules, and traditions, motivations, anddecision-making in households, companies, and administrations.Finally, an inherent obstacle is the fact that most energy efficiencyinvestments remain invisible and do not contribute to politicians’public image. The invisibility of energy efficiency measures (in contrast to photovoltaic or solar thermal collectors) and the difficulty of demonstrating and quantifying their impacts are alsoimportant. Aspects of social prestige influence the decisions on efficiency of private households—as when buying large cars (Sanstadand Howarth, 1994; Jochem, Sathaye, and Bouille, 2000).
OECD countries. Obstacles to and market imperfections for energyefficiency in end-use sectors have been observed in OECD countriesfor more than 20 years.23 While limited, empirical research on thebarriers underscores the diversity of individual investors (with thousands of firms, hundreds of thousands of landlords, and millions of consumers in a single country).
Lack of knowledge, know-how, and technical skills and hightransaction costs. Improved energy efficiency is brought about bynew technology, organisational changes, and minor changes in aknown product, process, or vehicle. This implies that investors andenergy users are able to get to know and understand the perceivedbenefits of the technical efficiency improvement as well as evaluatepossible risks. It also implies that investors and users have to beprepared to realise the improvement and to take time to absorb thenew information and evaluate the innovation (OTA, 1993; Levineand others, 1995; Sioshansi, 1991). But most households and private car drivers, small and medium-size companies, and smallpublic administrations do not have enough knowledge, technicalskills, and market information about possibilities for energy savings.The construction industry and many medium-size investment firmsface the same problem as small companies on the user’s side.Managers, preoccupied with routine business, can only engagethemselves in the most immediately important tasks (Velthuijsen,1995; Ramesohl, 1999). Because energy efficiency reduces a smallshare of the energy costs of total production or household costs, itgets placed on the back burner.
Lack of access to capital and historically or socially formedinvestment patterns. The same energy consumers, even if they gain
WORLD ENERGY ASSESSMENT: ENERGY AND THE CHALLENGE OF SUSTAINABILITY
Chapter 6: Energy End-Use Efficiency
201
knowledge, often have trouble raisingfunds for energy efficiency investments.Their capital may be limited, and addi-tional credit may be expensive. Especiallywhen interest rates are high, householdsand small firms tend to prefer to accept highercurrent costs and the risk of rising energy pricesinstead of taking a postponed energy credit (DeCanio, 1993;Gruber and Brand, 1991).
Disparity of profitability expectations of energy supply anddemand. The lack of knowledge about energy efficiency among small energy consumers raises their perceptions of risk, so energy consumers and suppliers expect different rates of return on investments (Hassett and Metcalf, 1993). Energy supply companiesin countries with monopolistic energy market structures are willingto accept nominal internal rates of return of 8–15 percent (aftertax) for major supply projects (IEA, 1987). But for efficiency investments, energy consumers demand—explicitly or without calculating—payback periods between one and five years, whichare equivalent to a nominal internal rate of return of 15–50 percent(DeCanio, 1993; Gruber and Brand, 1991). This disparity in rate of return expectations also seems to apply to international loans,putting energy efficiency investments in developing countries at adisadvantage (Levine and others, 1995).
The impact of grid-based price structures on efficient energyuse. Grid-based forms of energy play a dominant role in OECDcountries. The structure of gas, electricity, and district heat tariffsfor small consumers and the level of the load-independent energycharge are important for energy conservation. Tariff structures aredesigned in two parts to reflect two services—the potential to obtaina certain amount of capacity at any given time, and the deliveredenergy. The capacity charge plays an important role in profitabilitycalculations for investments where efficiency improvements do notreduce capacity demand, such as inverters on electric engines orcontrol techniques in gas or district heating (IEA, 1991). In addition,in most OECD countries utilities still do not offer time-of-use or seasonal rates to small consumers, which would reward them forusing energy during off-peak hours. This, however, may change infully liberalised electricity and gas markets.
Legal and administrative obstacles. There are legal and administrativeobstacles in almost all end-use sectors. They are mostly country specific, and often date back to before 1973, when energy priceswere low and declining in real terms and there was no threat ofglobal warming. For most local government authorities the budgetingformat is an ‘annual budgeting fixation’, which means that they cannot transfer funds from the recurrent to the investment budget.With a lot of other urgent needs calling for capital investment, energyefficiency measures are given low priority. The poor perception ofpublic goods adds to the obstacles confronting energy efficiency indeveloping and transition economies (see below).
Other market barriers. The investor-user dilemma points to the factthat for rented dwellings or leased buildings, machines, or vehicles,
there are few incentives for rentersto invest in property that they do not
own. Similarly, landlords, builders, andowners have few incentives to invest because
of the uncertainty of recovering their investmentthrough higher rent (Fisher and Rothkopf, 1989;
Golove, 1994). Finally, the quality of delivered energy(as with unstable frequencies or voltages of electricity or
impurities in gasoline or diesel) may pose a severe barrier for effi-ciency investments (electronic control or high efficiency motors).
Additional barriers in transition economies.24 Transition economiesdid not experience the sharp increase in world energy prices in the 1970s.As a result opportunities for more efficient energy use were scarcelyrealised in these countries. Most transition economies suffer from all thebarriers described above for OECD countries, as well as from additionalmarket problems stemming from the legacy of central planning. The deepeconomic and structural crisis during the early years of transitionshifted the investment priorities of industrial and commercial companiesto short-term decisions, helping them to survive. Technological innovationsthat increase energy efficiency are hardly considered a priority in manytransition economies (Borisova and others, 1997). There are, however,substantial differences among most Eastern European countries andmembers of the Commonwealth of Independent States.
Unpaid energy bills. The economic crisis in transition economiescreated special obstacles to investing in energy efficiency, includingnon-payments and non-monetary payments (barter, promissory notes,and other surrogates by energy consumers, mutual debt clearingbetween companies). In Georgia less than 30 percent of residentialelectricity rates were paid in 1994; industrial payments fell to 16percent, and 25–50 percent of the electricity supply was not accountedor billed (World Bank, 1996; TACIS, 1996). In Russia about 25 percentof generated electricity was not paid for by customers in 1995–97(BEA, 1998). Industrial and commercial customers covered up to80 percent of their energy bills using non-monetary and surrogatemeans (Russian Federation Ministry of Fuel and Energy, 1998). Theuse of barter is contributing to the neglect of potential reductions inenergy costs through efficiency measures. Experience in EasternEurope, however, demonstrates that cutting customers off from theelectricity or gas supply persuades them to pay (box 6.10).
Because energy efficiency reduces a small share of the
energy costs of total production or household costs, it gets placed
on the back burner.
BOX 6.10. THE IMPLICATIONS OF TERMINATING ELECTRICITY SUBSIDIES IN HUNGARY
Raising energy prices to cost-covering levels can produce miracles.Until 1997 Hungary spent $5–10 million a year on energy efficiencyimprovements. In January 1997 energy prices were raised to market-based levels—and in just two years, investments in energy efficiencyjumped to $80 million a year. The usual argument against correctenergy pricing, that consumers cannot pay the bills, is not provenin Hungary. Just 10 percent of the national energy bill remained unpaid,and that just partly. True, retirees with low incomes have difficulties.But they are not the big consumers with high bills. The problem isa social problem, and has been solved by special payment schemesin the social policy framework of local and national budgets.

WORLD ENERGY ASSESSMENT: ENERGY AND THE CHALLENGE OF SUSTAINABILITY
Chapter 6: Energy End-Use Efficiency
202
Barriers to energy metering.Many energy customers in transitioneconomies are still not equipped withmeters and controllers or have simplistic,outdated meters. In particular, residentialcustomers in the Commonwealth of IndependentStates often have no meters to measure the use ofnatural gas, heat, and hot water, reflecting a long-held viewthat heat and fuel are public goods. According to the RussianFederation Ministry of Fuel and Energy (1998), only about 10 percentof heat customers (and no more than 15 percent of hot water andnatural gas customers) are equipped with meters. Since 1994, however,significant efforts have been made to manufacture modern meters andcontrollers and to develop related services (certification, maintenance,and verification) (Minfopenergo, 1996). Meters are far more commonin Eastern Europe, because since the 1980s these countries havehad to import needed energies in exchange for hard currency.
Lack of cost-based tariffs for grid-based energies. Natural gas, electricity, heat, and hot water are supplied to users in theCommonwealth of Independent States and some Eastern Europeancountries by regional or local energy monopolies with governmentparticipation and municipal distribution companies. Energy tariffsare still set by federal and regional energy commissions in most ofthe Commonwealth of Independent States. In Russia a large portionof customers are subsidised; fuels are of poor quality, expensive, orboth; resellers charge excessive costs and receive large profits;detailed information is lacking on the production costs of suppliers;and the decisions of regional commissions do not sufficiently reflectcost considerations, but depend on the political priorities of thelocal authorities (Vasiliev and others, 1998).
Subsidies. In all Commonwealth of Independent States countriesand a few Eastern European countries the grid-based energy supplyof residential and agricultural customers is still subsidised.Subsidies are driven by traditional concepts of public goods orsocial policy. In addition, some groups (war veterans, low incomefamilies) pay discounted residential tariffs. In Ukraine the governmentpaid 20 percent of the cost of natural gas for residential customersin 1996 (Gnedoy, 1998). Russian municipalities spend 25–45 percentof their budgets on residential heat subsidies, covering more thanhalf of heat bills (Bashmakov, 1997a).
Subsidised energy prices reduce the economic attractiveness ofenergy efficiency measures. Cross-subsidies for electric power inthe Commonwealth of Independent States distort price signals betweengroups of customers. For instance, cross-subsidies for residentialelectricity account for 20–60 percent of prices for industrial customers in different regions of Russia (Moloduik, 1997; Kretinina,Nekrasov, and Voronina, 1998). In principle, this price structure wouldlead to large investments in efficiency in Russian industry. But non-payment of energy bills prevents that from happening. The case forabolishing electricity subsidies in most Eastern European countriesdemonstrates that the social aspects of such a pricing policy can beaddressed by social policy at the municipality level (see box 6.10).
Additional barriers in developingcountries. The general obstacles to
efficient energy use are sometimes moreintense in developing countries than in
OECD or transition economies.25 But thereare similarities between subsidies and pricing
policies in developing and transition economies.The situation in developing countries may be more complex
given the big differences in energy use, income, development, andinfrastructure between urban and rural areas in India, China, LatinAmerica, and Africa.
Lack of awareness of potential benefits. The limited awarenessof the potential for energy efficiency is the most important obstacleto wide-scale adoption of energy efficiency measures and technologiesin developing countries. Limited awareness is a by-product of inadequate information infrastructure to raise awareness of thepotential for energy efficiency and of available technologies andproven practices. The media used to raise awareness in most developing countries limit the audience. Awareness campaigns rely onradio, television, and newspapers, which most rural populations—the majority of the population in developing countries—do not haveaccess to. In addition, managers in industry do not have timelyinformation on available efficiency technology (Reddy, 1991), andmany producers of end-use equipment are unacquainted with energy-efficient technology and related knowledge.
Many developing countries still lack an effective energy efficiencypolicy at the national level. Energy supply policies are preferred inmost developing countries because of the focus on developmentpolicies. This pattern may also be due to the fact that grid-basedenergy supplies are often owned by national or local governments,a pattern that supports rigid hierarchical structures and closed networks of decision-makers.
Energy supply constraints. In some developing countries, energysupply constraints provide no alternative fuel and technology optionsfor consumers. The limited availability of commercial fuels (petroleumproducts, electricity) in rural areas impedes switching to moreenergy-efficient stoves, dryers, and other technologies, posing amajor challenge for energy policy (see chapter 10).
Inappropriate energy pricing and cross-subsidies. Energyprices are still below marginal opportunity costs in many developingcountries, reflecting the desire of governments to use energy supplyto achieve political objectives. Successive governments have upheldenergy subsidies over decades, making it politically difficult to raiseenergy prices to the level of marginal opportunity costs (box 6.11;Nadel, Kothari, and Gopinath, 1991).
Lack of trained staff, operators, and maintenance workers.Insufficient energy workers are an important constraint to theinvestment and operation of buildings, machines, plants, and transportsystems (Suzuki, Ueta, and Mori, 1996).
Lack of capital and import of inefficient used plants andvehicles. Many energy efficiency measures are delayed by a lack offinancing. The availability of credit at high interest rates tends to make
Subsidised energy prices reduce the economic
attractiveness of energy efficiency measures.
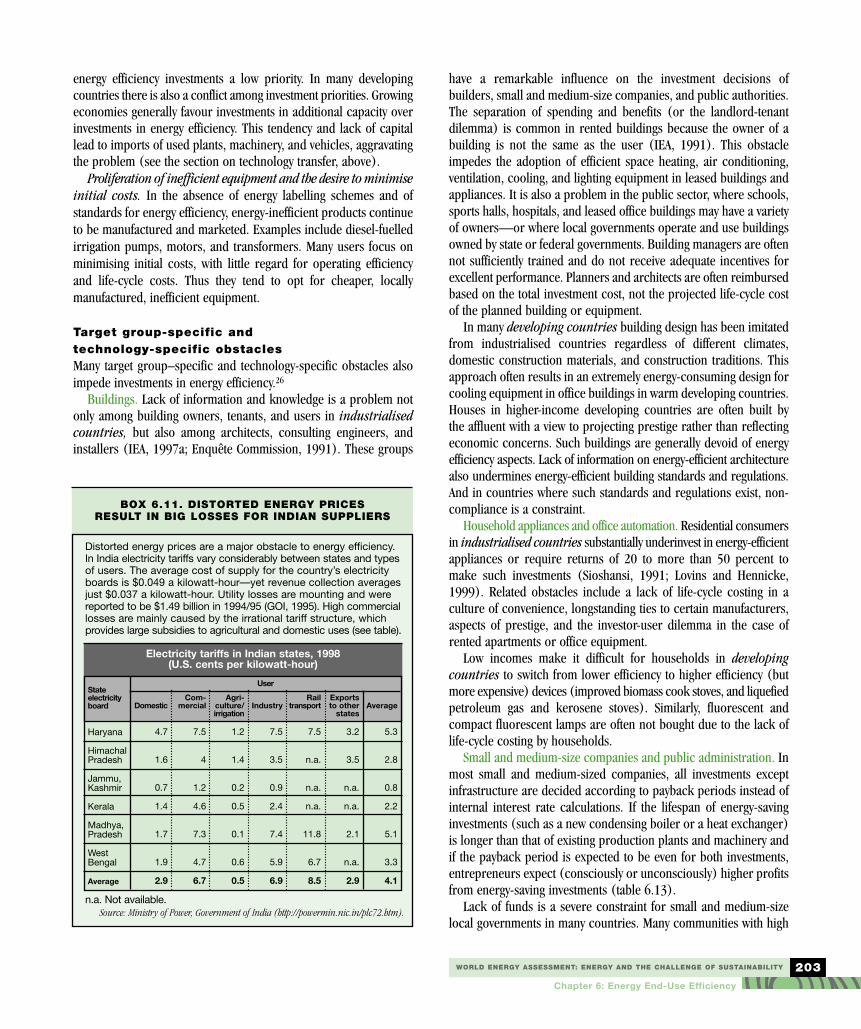
WORLD ENERGY ASSESSMENT: ENERGY AND THE CHALLENGE OF SUSTAINABILITY
Chapter 6: Energy End-Use Efficiency
203
energy efficiency investments a low priority. In many developingcountries there is also a conflict among investment priorities. Growingeconomies generally favour investments in additional capacity overinvestments in energy efficiency. This tendency and lack of capitallead to imports of used plants, machinery, and vehicles, aggravatingthe problem (see the section on technology transfer, above).
Proliferation of inefficient equipment and the desire to minimiseinitial costs. In the absence of energy labelling schemes and ofstandards for energy efficiency, energy-inefficient products continueto be manufactured and marketed. Examples include diesel-fuelledirrigation pumps, motors, and transformers. Many users focus onminimising initial costs, with little regard for operating efficiencyand life-cycle costs. Thus they tend to opt for cheaper, locally manufactured, inefficient equipment.
Target group-specific and technology-specific obstaclesMany target group–specific and technology-specific obstacles alsoimpede investments in energy efficiency.26
Buildings. Lack of information and knowledge is a problem notonly among building owners, tenants, and users in industrialisedcountries, but also among architects, consulting engineers, andinstallers (IEA, 1997a; Enquête Commission, 1991). These groups
have a remarkable influence on the investment decisions ofbuilders, small and medium-size companies, and public authorities.The separation of spending and benefits (or the landlord-tenantdilemma) is common in rented buildings because the owner of abuilding is not the same as the user (IEA, 1991). This obstacleimpedes the adoption of efficient space heating, air conditioning,ventilation, cooling, and lighting equipment in leased buildings andappliances. It is also a problem in the public sector, where schools,sports halls, hospitals, and leased office buildings may have a varietyof owners—or where local governments operate and use buildingsowned by state or federal governments. Building managers are oftennot sufficiently trained and do not receive adequate incentives forexcellent performance. Planners and architects are often reimbursedbased on the total investment cost, not the projected life-cycle costof the planned building or equipment.
In many developing countries building design has been imitatedfrom industrialised countries regardless of different climates,domestic construction materials, and construction traditions. Thisapproach often results in an extremely energy-consuming design forcooling equipment in office buildings in warm developing countries.Houses in higher-income developing countries are often built by the affluent with a view to projecting prestige rather than reflectingeconomic concerns. Such buildings are generally devoid of energyefficiency aspects. Lack of information on energy-efficient architecturealso undermines energy-efficient building standards and regulations.And in countries where such standards and regulations exist, non-compliance is a constraint.
Household appliances and office automation. Residential consumersin industrialised countries substantially underinvest in energy-efficientappliances or require returns of 20 to more than 50 percent tomake such investments (Sioshansi, 1991; Lovins and Hennicke,1999). Related obstacles include a lack of life-cycle costing in a culture of convenience, longstanding ties to certain manufacturers,aspects of prestige, and the investor-user dilemma in the case ofrented apartments or office equipment.
Low incomes make it difficult for households in developingcountries to switch from lower efficiency to higher efficiency (butmore expensive) devices (improved biomass cook stoves, and liquefiedpetroleum gas and kerosene stoves). Similarly, fluorescent andcompact fluorescent lamps are often not bought due to the lack oflife-cycle costing by households.
Small and medium-size companies and public administration. Inmost small and medium-sized companies, all investments exceptinfrastructure are decided according to payback periods instead ofinternal interest rate calculations. If the lifespan of energy-savinginvestments (such as a new condensing boiler or a heat exchanger)is longer than that of existing production plants and machinery andif the payback period is expected to be even for both investments,entrepreneurs expect (consciously or unconsciously) higher profitsfrom energy-saving investments (table 6.13).
Lack of funds is a severe constraint for small and medium-sizelocal governments in many countries. Many communities with high
BOX 6.11. DISTORTED ENERGY PRICES RESULT IN BIG LOSSES FOR INDIAN SUPPLIERS
Distorted energy prices are a major obstacle to energy efficiency.In India electricity tariffs vary considerably between states and typesof users. The average cost of supply for the country’s electricityboards is $0.049 a kilowatt-hour—yet revenue collection averagesjust $0.037 a kilowatt-hour. Utility losses are mounting and werereported to be $1.49 billion in 1994/95 (GOI, 1995). High commerciallosses are mainly caused by the irrational tariff structure, whichprovides large subsidies to agricultural and domestic uses (see table).
n.a. Not available.Source: Ministry of Power, Government of India (http://powermin.nic.in/plc72.htm).
Electricity tariffs in Indian states, 1998 (U.S. cents per kilowatt-hour)
Stateelectricityboard
Haryana
HimachalPradesh
Jammu, Kashmir
Kerala
Madhya, Pradesh
West Bengal
Average
Domestic
4.7
1.6
0.7
1.4
1.7
1.9
2.9
Com-mercial
7.5
4
1.2
4.6
7.3
4.7
6.7
Agri-culture/irrigation
1.2
1.4
0.2
0.5
0.1
0.6
0.5
Industry
7.5
3.5
0.9
2.4
7.4
5.9
6.9
Railtransport
7.5
n.a.
n.a.
n.a.
11.8
6.7
8.5
Exportsto other
states
3.2
3.5
n.a.
n.a.
2.1
n.a.
2.9
Average
5.3
2.8
0.8
2.2
5.1
3.3
4.1
User
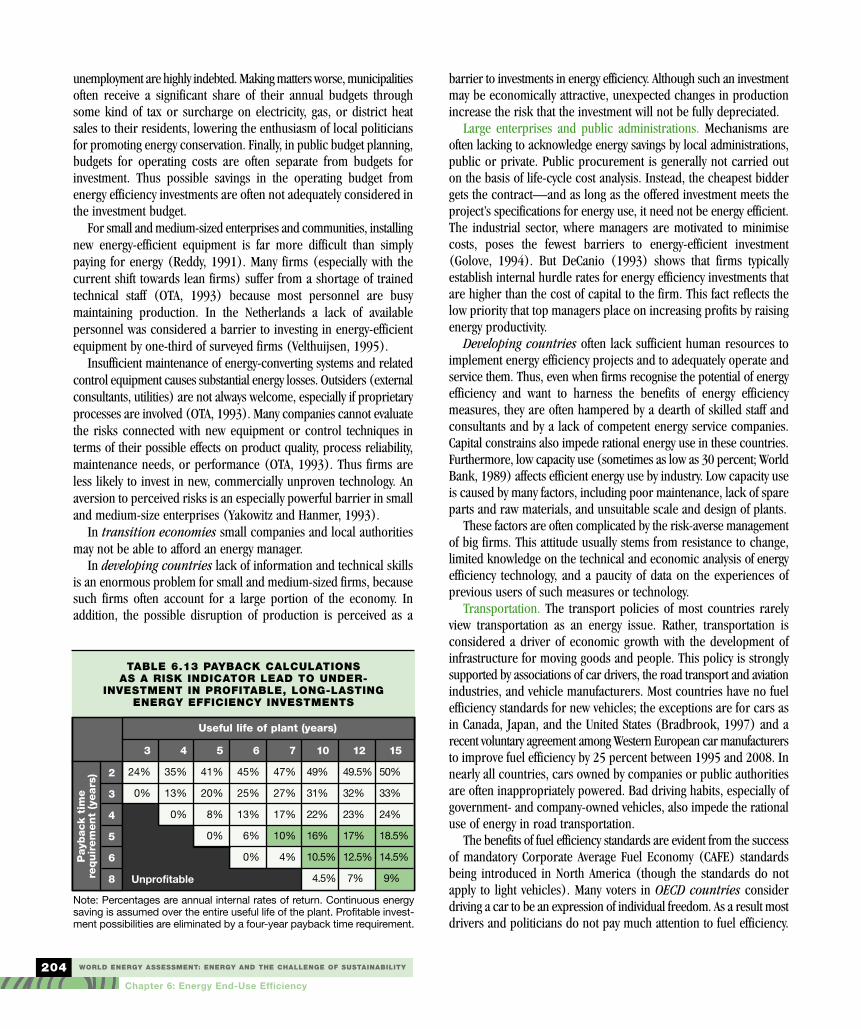
WORLD ENERGY ASSESSMENT: ENERGY AND THE CHALLENGE OF SUSTAINABILITY
Chapter 6: Energy End-Use Efficiency
204
unemployment are highly indebted. Making matters worse, municipalitiesoften receive a significant share of their annual budgets throughsome kind of tax or surcharge on electricity, gas, or district heatsales to their residents, lowering the enthusiasm of local politiciansfor promoting energy conservation. Finally, in public budget planning,budgets for operating costs are often separate from budgets forinvestment. Thus possible savings in the operating budget fromenergy efficiency investments are often not adequately considered inthe investment budget.
For small and medium-sized enterprises and communities, installingnew energy-efficient equipment is far more difficult than simply paying for energy (Reddy, 1991). Many firms (especially with thecurrent shift towards lean firms) suffer from a shortage of trainedtechnical staff (OTA, 1993) because most personnel are busy maintaining production. In the Netherlands a lack of available personnel was considered a barrier to investing in energy-efficientequipment by one-third of surveyed firms (Velthuijsen, 1995).
Insufficient maintenance of energy-converting systems and relatedcontrol equipment causes substantial energy losses. Outsiders (externalconsultants, utilities) are not always welcome, especially if proprietaryprocesses are involved (OTA, 1993). Many companies cannot evaluatethe risks connected with new equipment or control techniques interms of their possible effects on product quality, process reliability,maintenance needs, or performance (OTA, 1993). Thus firms areless likely to invest in new, commercially unproven technology. Anaversion to perceived risks is an especially powerful barrier in smalland medium-size enterprises (Yakowitz and Hanmer, 1993).
In transition economies small companies and local authoritiesmay not be able to afford an energy manager.
In developing countries lack of information and technical skillsis an enormous problem for small and medium-sized firms, becausesuch firms often account for a large portion of the economy. In addition, the possible disruption of production is perceived as a
barrier to investments in energy efficiency. Although such an investmentmay be
barrier to investments in energy efficiency. Although such an investmentmay be economically attractive, unexpected changes in productionincrease the risk that the investment will not be fully depreciated.
Large enterprises and public administrations. Mechanisms areoften lacking to acknowledge energy savings by local administrations,public or private. Public procurement is generally not carried outon the basis of life-cycle cost analysis. Instead, the cheapest biddergets the contract—and as long as the offered investment meets theproject’s specifications for energy use, it need not be energy efficient.The industrial sector, where managers are motivated to minimisecosts, poses the fewest barriers to energy-efficient investment(Golove, 1994). But DeCanio (1993) shows that firms typicallyestablish internal hurdle rates for energy efficiency investments thatare higher than the cost of capital to the firm. This fact reflects thelow priority that top managers place on increasing profits by raisingenergy productivity.
Developing countries often lack sufficient human resources toimplement energy efficiency projects and to adequately operate andservice them. Thus, even when firms recognise the potential of energyefficiency and want to harness the benefits of energy efficiencymeasures, they are often hampered by a dearth of skilled staff andconsultants and by a lack of competent energy service companies.Capital constrains also impede rational energy use in these countries.Furthermore, low capacity use (sometimes as low as 30 percent; WorldBank, 1989) affects efficient energy use by industry. Low capacity useis caused by many factors, including poor maintenance, lack of spareparts and raw materials, and unsuitable scale and design of plants.
These factors are often complicated by the risk-averse managementof big firms. This attitude usually stems from resistance to change,limited knowledge on the technical and economic analysis of energyefficiency technology, and a paucity of data on the experiences ofprevious users of such measures or technology.
Transportation. The transport policies of most countries rarelyview transportation as an energy issue. Rather, transportation isconsidered a driver of economic growth with the development ofinfrastructure for moving goods and people. This policy is stronglysupported by associations of car drivers, the road transport and aviationindustries, and vehicle manufacturers. Most countries have no fuelefficiency standards for new vehicles; the exceptions are for cars asin Canada, Japan, and the United States (Bradbrook, 1997) and arecent voluntary agreement among Western European car manufacturersto improve fuel efficiency by 25 percent between 1995 and 2008. Innearly all countries, cars owned by companies or public authoritiesare often inappropriately powered. Bad driving habits, especially ofgovernment- and company-owned vehicles, also impede the rationaluse of energy in road transportation.
The benefits of fuel efficiency standards are evident from the successof mandatory Corporate Average Fuel Economy (CAFE) standardsbeing introduced in North America (though the standards do notapply to light vehicles). Many voters in OECD countries considerdriving a car to be an expression of individual freedom. As a result mostdrivers and politicians do not pay much attention to fuel efficiency.
Note: Percentages are annual internal rates of return. Continuous energysaving is assumed over the entire useful life of the plant. Profitable invest-ment possibilities are eliminated by a four-year payback time requirement.
TABLE 6.13 PAYBACK CALCULATIONS AS A RISK INDICATOR LEAD TO UNDER-
INVESTMENT IN PROFITABLE, LONG-LASTING ENERGY EFFICIENCY INVESTMENTS
Useful life of plant (years)
Payb
ack t
ime
requir
em
ent
(years
) 2
3
4
5
6
8
3
24%
0%
4
35%
13%
0%
5
41%
20%
8%
0%
6
45%
25%
13%
6%
0%
7
47%
27%
17%
10%
4%
10
49%
31%
22%
16%
10.5%
4.5%
12
49.5%
32%
23%
17%
12.5%
7%
15
50%
33%
24%
18.5%
14.5%
9%Unprofitable
WORLD ENERGY ASSESSMENT: ENERGY AND THE CHALLENGE OF SUSTAINABILITY
Chapter 6: Energy End-Use Efficiency
205
The weak finances of local andnational governments in transitioneconomies make it difficult to introducemodern public transport systems or toupgrade existing ones. The limited financialresources of households and small companiesare the main reason for heavy imports of used carsfrom Western Europe and Japan.
In developing countries road transportation increases mobilitywithout the huge public upfront investment needed for railways,subways, and trams. Thus one major obstacle to improved energyefficiency is the limited number of alternative transport modes. Inmany developing countries vehicles are either assembled or imported.Economic problems and devaluations of local currencies have drivenup vehicle prices. As a result many people and small firms cannotafford new vehicles, so a lot of car buyers opt for imported used vehiclesthat have been used for several years in the country of origin.Similar problems are being encountered with the pricing of spareparts. In addition, most developing countries lack regulation onregular car inspections. Together these problems have resulted inpoor vehicle maintenance that has exacerbated energy inefficiency.
The Intergovernmental Panel on Climate Change report on aviation(IPCC, 1999a) projects a 20 percent improvement in fuel efficiencyby 2015 and a 40 percent improvement by 2050 relative to aircraftproduced today. Improvements in air traffic management wouldreduce fuel demand by another 8–18 percent. Environmental leviesand emissions trading can help realise these improvements byencouraging technological innovation and reducing the growth indemand for air travel.
Agriculture. Agriculture is the main beneficiary of subsidisedelectricity in developing countries. In some cases electricity is evenprovided to agricultural consumers free of charge. One major falloutof this approach is the phenomenal growth in electricity consump-tion by this sector. In the 1980s agriculture consumed 18 percent ofIndia’s electricity; by 1994 it consumed 30 percent (CMIE, 1996).Even after accounting for the additional pump sets installed duringthis period, extremely low electricity prices are one of the main reasons for the increase in the sector’s energy intensity.
Cogeneration. Cogeneration has considerable potential in industrialsites and district heating systems. Yet the monopolistic structure ofthe electricity sector in many countries has led to high prices formaintenance and peak power, rather low buyback rates and costlytechnical standards for grid connection, and to dumping prices inthe case of planning new cogeneration capacity (VDEW, 1997). As aresult many auto producers restrict the capacity of the cogenerationplant to their minimum electricity and heat needs, although they maywish to produce more heat by cogeneration. This situation is changingnow in countries (such as France) with liberalised electricity marketsand regulated or competitive buyback rates.
In Central and Eastern Europe centralised district heating remainsa widespread solution for heating big housing estates. The economicsof centralising the heat supply of a certain area is regarded not as a
question of profitability, but a his-torical fact. But inadequate pricing,
inefficient operation, mismanagement,and lack of full use of cogeneration
potential are encouraging heat consumersto disconnect from the district heating grid.
The easy availability of natural gas, existence of smalland medium-size cogeneration units (namely, gas engines
and gas turbines), and desire for independence also encourageconsumers to disconnect. This tends to make the heat demand densityleaner, driving the system in a negative spiral that may end in the econom-ic collapse of many district heating enterprises in transition economies.
The potential for industrial cogeneration is estimated at 20–25percent of industrial and commercial electricity demand in severaldeveloping countries (TERI, 1994; Alnakeeb, 1998). India’s sugarindustry, for instance, generates 3,500 megawatts of bagasse-basedcogenerated power. But the full potential of industrial cogenerationin China, India, and Latin America has yet to be realised because ofslow progress on power buyback arrangements and the wheelingand banking of cogenerated power by state electricity boards. Althoughinstitutional barriers are considered the main obstacle in thisregard, limited indigenous capacity to manufacture high-pressureboilers and turbines is also an important barrier, as hard currencyis scarce in developing countries (TERI, 1994).
For every obstacle and market imperfection discussed in this section,there are interrelated measures of energy efficiency policy thatcould remove or reduce them (figure 6.5). But the choice of whichpolicies to pursue must be made with care, because their effectivenessdepends on many regional, cultural, and societal circumstances andon the different weights of the obstacles in different regions.
National and international policies to exploit the economic potential ofenergy efficiency in end-use sectorsDespite the clear warnings of the scientific community (IPCC, 1995)and the commitments made under the Kyoto Protocol, and despitepossible reductions in energy costs and the benefits of energy efficiencyfor employment and economic development (see box 6.3), manyscientists and non-governmental organisations (NGOs) feel that“policy makers are still doing too little to use energy efficiencypotentials in order to safeguard their citizens and their future”(Lovins and Hennicke, 1999, pp. 7–10; Phylipsen, Blok, and Hendriks,1999; further citations).27 These authors ask for more activity inpolicy areas such as energy efficiency, transportation, and renewables.
Over the past 25 years individual and ad hoc policy measures—such as information, training, grants, or energy taxes—have oftenproduced limited results (Dasgupta, 1999). But integrated energydemand policies—which consider simultaneous obstacles and theinterdependence of regulations, consultations, training programmes,and financial incentives—and long-lasting programmes have beenrelatively successful. Energy demand policy is not only initiated bygovernments. Companies, utilities, industrial associations, and NGOsmay also play an important part.
Low incomes make it difficult for households in developing countries
to switch from lower efficiency to higher efficiency (but more
expensive) devices.

WORLD ENERGY ASSESSMENT: ENERGY AND THE CHALLENGE OF SUSTAINABILITY
Chapter 6: Energy End-Use Efficiency
206
An integrated energy, transportation, financial, and economicpolicy is one of the main opportunities for realising the huge economicenergy saving potentials not only of individual parts and technologies,but also of a country’s energy-using systems. There is a strong needto formulate a long-term strategy that promotes energy efficiencyimprovements in all sectors of the economy and that takes intoaccount general obstacles, market imperfections, and targetgroup–specific barriers. This section presents the policy initiativesto be taken in different end-use sectors in a linear manner, but suchinitiatives have to be implemented together to contribute to sustainable
development (see figure 6.5). These policies include general policyinstruments such as energy taxes, direct tax credits, emissions trading,a general energy conservation law, general education on energy issuesin schools, and research and development (see chapter 11). Insome cases international cooperation by governments and industrialassociations may play an important supporting role.
General policy measuresGeneral policies to promote energy efficiency try to overcome generalobstacles and market imperfections. They may also be implemented
FIGURE 6.5. OBSTACLES AND MARKET IMPERFECTIONS FOR ENERGY EFFICIENCY AND RELATED POLICIES: A SCHEME FOR POLICY OPTIONS AND INTEGRATED EFFICIENCY POLICY
Lack of knowledge and market transparancy
Financial bottlenecks and investment priorities
Disparity of profitable expectations
Investor/user dilemma
Legal and administrative obstacles
Utility-autoproducers relationship
Actual electricity and gas tariffs
Lacking externalisation of external costs
On-the-spot consulting, training, motivation of top management
Energy labelling for electric appliances
Voluntary agreements of mass producers
Financial incentives by governments and utilities
Energy service companies, contracting
Changes of laws, standards, and regulations
Changes of tariff structures
Joint Research & Development projects in small and medium-sized firms
Emission or energy levies or taxes
WORLD ENERGY ASSESSMENT: ENERGY AND THE CHALLENGE OF SUSTAINABILITY
Chapter 6: Energy End-Use Efficiency
207
in the context of broader economicissues, such as shifting the tax burdenfrom labour to non-renewable resourcesthrough an ecotax at the national ormultinational level (see chapter 11). Ornew regulation may be needed to limit theambiguous impacts of liberalised electricity and gasmarkets in their transition phase.
The acceptance of such policy measures differs by country andvaries over time depending on how much an energy policy objectiveis violated or in question. Energy efficiency policy was widelyaccepted in OECD countries in the 1970s and early 1980s, whendependence on oil imports from OPEC countries was high and higherfuel prices had changed cost structures and weakened competitivenessin energy-intensive industries. With declining world energy pricesbetween 1986 and 1999, reduced dependence on energy imports in manyOECD countries, and stagnating negotiations on the implementationof the Kyoto Protocol, public interest in energy efficiency policy hasfallen in many OECD countries.
By contrast, energy efficiency receives considerable attentionfrom governments, industries, and households in Eastern Europeancountries, in some Commonwealth of Independent States countrieswithout indigenous energy resources, and in many emergingeconomies facing problems with sufficient and reliable supplies ofcommercial energy.
Energy conservation laws have been passed in many countries(Australia, Canada, China, Finland, Germany, Japan, Russia, Switzerland,the United States) or are in the process of being passed (India).Such laws are important for establishing a legal framework for sectorregulation (building codes, labelling, technical standards for equipmentand appliances) and for implementing other measures (energy agencies,financial funds for economic incentives or public procurement). Inmany countries with federal structures, however, much of the legislativepower to enact energy conservation laws rests with individual states—posing problems for compliance and joint action.
Education on energy efficiency issues in primary or secondaryschools, along with professional training, raises consciousness andbasic knowledge about the efficient use of energy and the mostrecent technologies.
Direct subsidies and tax credits were often used to promote energyefficiency in the past. Direct subsidies often suffer from a free-ridereffect when they are used for investments that would have beenmade anyway. Although it is difficult to evaluate this effect, inWestern Europe 50–80 percent of direct subsidies are estimated togo to free riders (Farla and Blok, 1995). Low-interest loans forenergy efficiency projects appear to be a more effective subsidy,although they may have a distribution effect.
Energy service companies are a promising entrepreneurial development, as they simultaneously overcome several obstacles byproviding professional engineering, operational, managerial, and financialexpertise, along with financial resources. Such companies either getpaid a fee based on achieved savings or sign a contract to provide
defined energy services such asheating, cooling, illumination, delivery
of compressed air, or hot water.Transition economies. From a policy
perspective, efficient energy use createsenormous opportunities in light of huge
reinvestments in industry and infrastructure andlarge new investments in buildings, vehicles, and appliances.
In the Commonwealth of Independent States and Eastern Europeincreased energy efficiency was made a top political priority in theearly and mid-1990s—as with Russia’s 1994 National EnergyStrategy (IEA, 1995). But according to the Russian Federation Ministryof Fuel and Energy (1998), government support for such activitieswas less than 8 percent of the planned funding in 1993–97.
Transition economies that were relatively open under centralplanning (defined as those for whom foreign trade accounted formore than 30 percent of GDP) have had an easier time adjusting toworld markets. Multinational companies from Western Europe andother OECD countries maintain their technical standards whenbuilding new factories in transition economies. In addition, EasternEuropean countries are trying to approach (and later, to meet)Western European technical standards as part of their eventualaccession to the European Union (Krawczynski and Michna, 1996;Michna, 1994).
Energy efficiency policies developed differently according to thespeed of transition and economic growth in these countries. Someelements of efficiency programmes have been quite successfuldespite economic difficulties: laws, energy agencies, energy auditingof federal buildings. In most transition economies the first energyservice companies were established with the support of internationalinstitutions. Some industrial enterprises established internal energymonitoring and control, reinforced by incentives and sanctions forparticular shops and their management. The results of such activitiesdiffered considerably among transition economies, reflecting levelsof organisation, human and financial capital, trade experience, foreigninvestment, energy subsidies, and other factors.
Developing countries. The phasing out of substantial energy subsidiescan often be complemented by capacity building, professional training,and design assistance. Utilities in Mexico and Brazil, for example,have been active in demand-side management programmes withcost-benefit ratios of more than 10 to 1 (Dutt and others, 1996).Given the shortage of capital in many developing countries, financialincentives seem to have a large impact on energy efficiency (unlikein OECD countries). An example is China in the 1980s, where suchincentives contributed to the remarkable decline in China’s industrialenergy intensity (Sinton and Levine, 1994).
Sector- and technology-specific policy measuresGiven the many obstacles that keep economic energy-saving potentialfrom being realised on a sectoral or technological level, any actorwill look for a single instrument that can alleviate all obstacles. Formass products, performance standards are considered an efficient
Energy demand policy is not only initiated by governments. Companies,
utilities, industrial associations,and NGOs may also play
an important part.
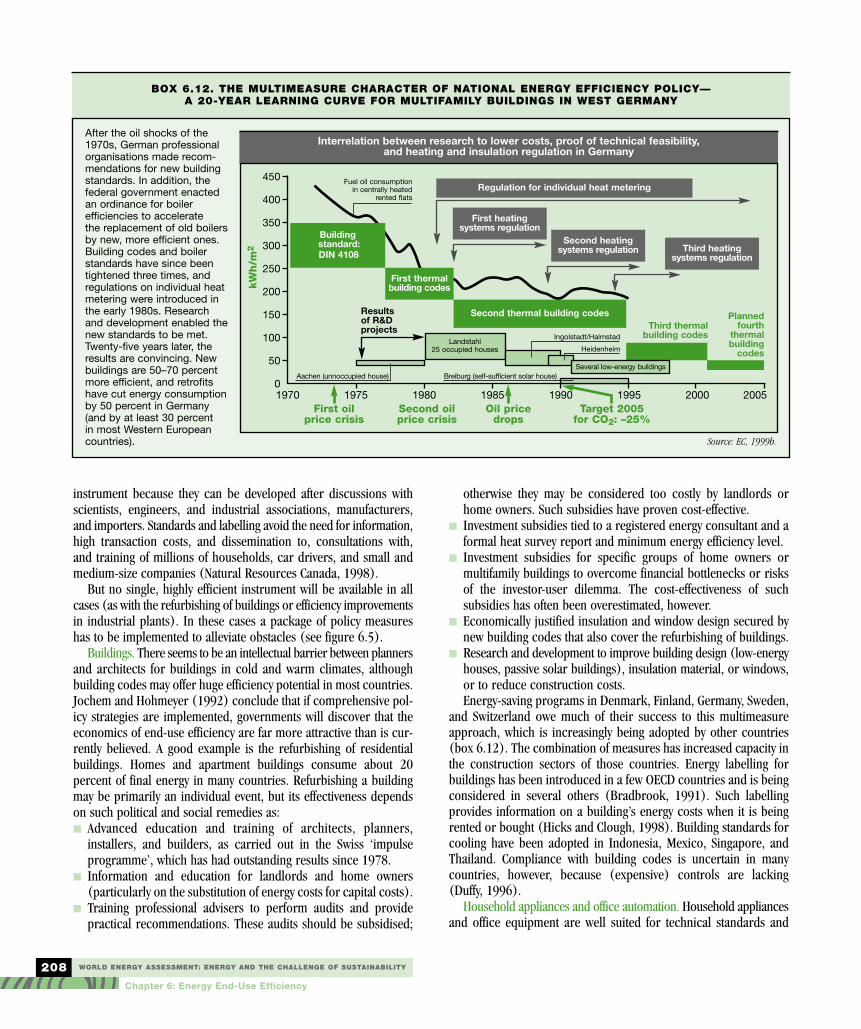
WORLD ENERGY ASSESSMENT: ENERGY AND THE CHALLENGE OF SUSTAINABILITY
Chapter 6: Energy End-Use Efficiency
208
BOX 6.12. THE MULTIMEASURE CHARACTER OF NATIONAL ENERGY EFFICIENCY POLICY—A 20-YEAR LEARNING CURVE FOR MULTIFAMILY BUILDINGS IN WEST GERMANY
After the oil shocks of the1970s, German professionalorganisations made recom-mendations for new buildingstandards. In addition, thefederal government enactedan ordinance for boiler efficiencies to accelerate the replacement of old boilersby new, more efficient ones.Building codes and boilerstandards have since beentightened three times, andregulations on individual heatmetering were introduced inthe early 1980s. Research and development enabled thenew standards to be met.Twenty-five years later, theresults are convincing. Newbuildings are 50–70 percentmore efficient, and retrofitshave cut energy consumptionby 50 percent in Germany(and by at least 30 percent in most Western Europeancountries). Source: EC, 1999b.
Interrelation between research to lower costs, proof of technical feasibility, and heating and insulation regulation in Germany
kW
h/m
2
Second oil price crisis
Oil price drops
Target 2005 for CO2: –25%
First oil price crisis
450
400
350
300
250
200
150
100
50
01970 1975 1980 1985 1990 1995 2000 2005
Third thermal building codes
Results of R&D projects
Fuel oil consumption in centrally heated
rented flats
Planned fourth
thermal building
codes
Second thermal building codes
Building standard: DIN 4108
First thermalbuilding codes
First heating systems regulation
Regulation for individual heat metering
Second heating systems regulation Third heating
systems regulation
Landstahl25 occupied houses
Ingolstadt/Halmstad
Heidenheim
Breiburg (self-sufficient solar house)Aachen (unnoccupied house)Several low-energy buildings
instrument because they can be developed after discussions withscientists, engineers, and industrial associations, manufacturers,and importers. Standards and labelling avoid the need for information,high transaction costs, and dissemination to, consultations with, and training of millions of households, car drivers, and small and medium-size companies (Natural Resources Canada, 1998).
But no single, highly efficient instrument will be available in allcases (as with the refurbishing of buildings or efficiency improvementsin industrial plants). In these cases a package of policy measureshas to be implemented to alleviate obstacles (see figure 6.5).
Buildings. There seems to be an intellectual barrier between plannersand architects for buildings in cold and warm climates, althoughbuilding codes may offer huge efficiency potential in most countries.Jochem and Hohmeyer (1992) conclude that if comprehensive pol-icy strategies are implemented, governments will discover that theeconomics of end-use efficiency are far more attractive than is cur-rently believed. A good example is the refurbishing of residentialbuildings. Homes and apartment buildings consume about 20 percent of final energy in many countries. Refurbishing a buildingmay be primarily an individual event, but its effectiveness dependson such political and social remedies as:■ Advanced education and training of architects, planners,
installers, and builders, as carried out in the Swiss ‘impulse programme’, which has had outstanding results since 1978.
■ Information and education for landlords and home owners (particularly on the substitution of energy costs for capital costs).
■ Training professional advisers to perform audits and providepractical recommendations. These audits should be subsidised;
otherwise they may be considered too costly by landlords orhome owners. Such subsidies have proven cost-effective.
■ Investment subsidies tied to a registered energy consultant and aformal heat survey report and minimum energy efficiency level.
■ Investment subsidies for specific groups of home owners or multifamily buildings to overcome financial bottlenecks or risksof the investor-user dilemma. The cost-effectiveness of such subsidies has often been overestimated, however.
■ Economically justified insulation and window design secured bynew building codes that also cover the refurbishing of buildings.
■ Research and development to improve building design (low-energyhouses, passive solar buildings), insulation material, or windows,or to reduce construction costs.Energy-saving programs in Denmark, Finland, Germany, Sweden,
and Switzerland owe much of their success to this multimeasureapproach, which is increasingly being adopted by other countries(box 6.12). The combination of measures has increased capacity inthe construction sectors of those countries. Energy labelling forbuildings has been introduced in a few OECD countries and is beingconsidered in several others (Bradbrook, 1991). Such labellingprovides information on a building’s energy costs when it is beingrented or bought (Hicks and Clough, 1998). Building standards forcooling have been adopted in Indonesia, Mexico, Singapore, andThailand. Compliance with building codes is uncertain in manycountries, however, because (expensive) controls are lacking(Duffy, 1996).
Household appliances and office automation. Household appliancesand office equipment are well suited for technical standards and
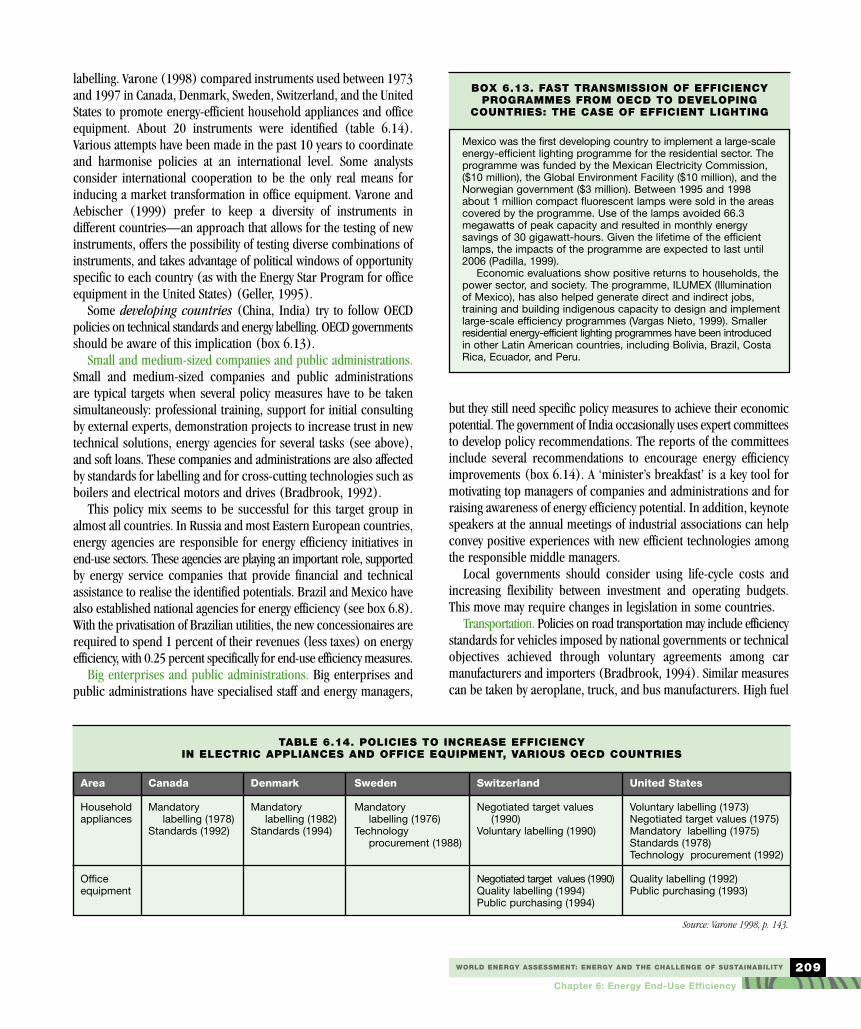
WORLD ENERGY ASSESSMENT: ENERGY AND THE CHALLENGE OF SUSTAINABILITY
Chapter 6: Energy End-Use Efficiency
209
labelling. Varone (1998) compared instruments used between 1973and 1997 in Canada, Denmark, Sweden, Switzerland, and the UnitedStates to promote energy-efficient household appliances and officeequipment. About 20 instruments were identified (table 6.14).Various attempts have been made in the past 10 years to coordinateand harmonise policies at an international level. Some analysts consider international cooperation to be the only real means forinducing a market transformation in office equipment. Varone andAebischer (1999) prefer to keep a diversity of instruments in different countries—an approach that allows for the testing of newinstruments, offers the possibility of testing diverse combinations ofinstruments, and takes advantage of political windows of opportunityspecific to each country (as with the Energy Star Program for officeequipment in the United States) (Geller, 1995).
Some developing countries (China, India) try to follow OECDpolicies on technical standards and energy labelling. OECD governmentsshould be aware of this implication (box 6.13).
Small and medium-sized companies and public administrations.Small and medium-sized companies and public administrations are typical targets when several policy measures have to be takensimultaneously: professional training, support for initial consultingby external experts, demonstration projects to increase trust in newtechnical solutions, energy agencies for several tasks (see above),and soft loans. These companies and administrations are also affectedby standards for labelling and for cross-cutting technologies such asboilers and electrical motors and drives (Bradbrook, 1992).
This policy mix seems to be successful for this target group inalmost all countries. In Russia and most Eastern European countries,energy agencies are responsible for energy efficiency initiatives inend-use sectors. These agencies are playing an important role, supportedby energy service companies that provide financial and technicalassistance to realise the identified potentials. Brazil and Mexico havealso established national agencies for energy efficiency (see box 6.8).With the privatisation of Brazilian utilities, the new concessionaires arerequired to spend 1 percent of their revenues (less taxes) on energyefficiency, with 0.25 percent specifically for end-use efficiency measures.
Big enterprises and public administrations. Big enterprises andpublic administrations have specialised staff and energy managers,
but they still need specific policy measures to achieve their economicpotential. The government of India occasionally uses expert committeesto develop policy recommendations. The reports of the committeesinclude several recommendations to encourage energy efficiencyimprovements (box 6.14). A ‘minister’s breakfast’ is a key tool formotivating top managers of companies and administrations and forraising awareness of energy efficiency potential. In addition, keynotespeakers at the annual meetings of industrial associations can helpconvey positive experiences with new efficient technologies amongthe responsible middle managers.
Local governments should consider using life-cycle costs andincreasing flexibility between investment and operating budgets.This move may require changes in legislation in some countries.
Transportation. Policies on road transportation may include efficiencystandards for vehicles imposed by national governments or technicalobjectives achieved through voluntary agreements among car manufacturers and importers (Bradbrook, 1994). Similar measurescan be taken by aeroplane, truck, and bus manufacturers. High fuel
Source: Varone 1998, p. 143.
TABLE 6.14. POLICIES TO INCREASE EFFICIENCY IN ELECTRIC APPLIANCES AND OFFICE EQUIPMENT, VARIOUS OECD COUNTRIES
Switzerland
Negotiated target values(1990)
Voluntary labelling (1990)
Negotiated target values (1990)Quality labelling (1994)Public purchasing (1994)
United States
Voluntary labelling (1973)Negotiated target values (1975)Mandatory labelling (1975)Standards (1978)Technology procurement (1992)
Quality labelling (1992)Public purchasing (1993)
Sweden
Mandatory labelling (1976)
Technology procurement (1988)
Denmark
Mandatory labelling (1982)
Standards (1994)
Canada
Mandatorylabelling (1978)
Standards (1992)
Area
Household appliances
Office equipment
BOX 6.13. FAST TRANSMISSION OF EFFICIENCY PROGRAMMES FROM OECD TO DEVELOPING
COUNTRIES: THE CASE OF EFFICIENT LIGHTING
Mexico was the first developing country to implement a large-scaleenergy-efficient lighting programme for the residential sector. Theprogramme was funded by the Mexican Electricity Commission,($10 million), the Global Environment Facility ($10 million), and theNorwegian government ($3 million). Between 1995 and 1998about 1 million compact fluorescent lamps were sold in the areascovered by the programme. Use of the lamps avoided 66.3megawatts of peak capacity and resulted in monthly energy savings of 30 gigawatt-hours. Given the lifetime of the efficientlamps, the impacts of the programme are expected to last until2006 (Padilla, 1999).
Economic evaluations show positive returns to households, thepower sector, and society. The programme, ILUMEX (Illuminationof Mexico), has also helped generate direct and indirect jobs,training and building indigenous capacity to design and implementlarge-scale efficiency programmes (Vargas Nieto, 1999). Smallerresidential energy-efficient lighting programmes have been introducedin other Latin American countries, including Bolivia, Brazil, CostaRica, Ecuador, and Peru.

WORLD ENERGY ASSESSMENT: ENERGY AND THE CHALLENGE OF SUSTAINABILITY
Chapter 6: Energy End-Use Efficiency
210
taxes in countries with low taxation may support technical progress.A more systemic view relates to several areas of transport systemsand policy measures (IEA, 1997a):■ Subsidies for mobility (such as for daily commuting, national airlines,
or public urban transport) increase the demand for transportation,especially road transport, and should be removed where sociallyacceptable. An untaxed benefit for employees driving a carbought by companies or institutions should also be removed.
■ Road user charges and parking charges may reduce driving incities, cut down on congestion and road accidents, and shiftsome mobility to public transport. Car sharing also has implicationsfor car use and occupancy levels.
■ It is possible to lower the cost of public transport throughautomation and international procurement, as is a better organisationof rail freight crossing national borders.
■ In the long term, intelligent city planning that does not divide anurban area by functions and related sections creates substantialpotential for reduced mobility.In higher-income developing countries there are concerns that
a shift from fuel-efficient to fuel-inefficient transport is threateningthe oil security of these countries. To address these concerns, policiesshould encourage a shift from road transport to subways and railtransport by reducing travel times and increasing the costs of roadtransportation. These countries should also search for new financingto replace old bus fleets.
Agriculture. Two main issues affect the energy efficiency of agriculturein developing countries. The first is related to subsidised electricitytariffs for this sector; the second is the use of highly inefficient primemovers for agricultural pump sets and the ineffective configurationin which they are often used. Increases in electricity tariffs shouldbe accompanied by free consultation by experts and an expansionof credit and savings schemes to help rural people keep their energycosts at an acceptable level. Efficient prime movers and appliancesand organisational measures in water use efficiency and irrigationmanagement would help achieve that goal.
Cogeneration. Liberalisation of the electricity market may havedifferent implications for cogeneration in different countries (Jochemand Tönsing, 1998; AGFW, 2000). Earlier obstacles, such as lowbuyback rates and high rates for maintenance and emergencypower, are alleviated by competition. But a legal framework forwheeling and public control seems to be necessary to level the playingfield, particularly during the adaptation phase of liberalisation andfor small and medium-size cogeneration plants of independentpower producers. Lack of expertise and the trend of outsourcingcogeneration plants in industry can be addressed by supportingenergy service companies with training, standardised contracts forsmall units, and deductions on fuels for cogeneration.
Maintaining energy-efficient cogeneration with district heating inindustrialised and transition economies requires determination,a legal framework, technical and economic skills, and financialresources. Several steps are needed to make or to keep centraliseddistrict heating systems competitive:■ A possibility of switching between fuels (lowering gas prices by
switching to storable oil in the coldest 100–200 hours of the winter)and using cheap fuel (‘puffer’ gas, coal, municipal solid waste,garbage incineration, sewage treatment biogas).
■ Proper and economic sharing of heat generation between centralisedheat units and peak load boilers, and an increase in the electricityproduction planted on the given heat demand by turning to higherparameters in the power-generating cycle (such as combined gasand steam cycles).
BOX 6.14. ENERGY EFFICIENCY POLICY RECOMMENDATIONS BY EXPERT COMMITTEES FOR COMPANIES IN INDIA
Technical and operational measures• Detailed energy audit should be made mandatory in all large
and medium-sized enterprises.• Potential cogeneration opportunities should be identified and
pursued by providing financial assistance• Energy consumption norms should be set for each industry
type and penalties and rewards instituted based on the performance of the industry.
Fiscal and economic measures• Creation of an energy conservation fund by levying energy
conservation taxes on industrial consumption of petroleumproducts, coal, and electricity.
• Customs duty relief on energy conservation equipment.
Energy pricing• Energy pricing policies must ensure that sufficient surplus is
generated to finance energy sector investments, economicalenergy use is induced, and interfuel substitution is encouraged.
Industrial licensing, production, and growth• Before licenses are given to new units, the capacity of
existing units and the capacity use factor should be taken into consideration.
• In setting up new units, the technology should be the leastenergy-intensive option.
• The possibility of using waste heat from power plants by settingup appropriate industries in the vicinity should be considered.
Organisational measures• The appointment of energy managers in large and medium-sized
industries should be mandatory. For small-scale enterprises, amechanism should be instituted for energy auditing and reporting.
Energy equipment• Better standards should be set for energy-consuming equipment.• Restrictions must be placed on the sale of low-efficiency equipment.• Manufacture of instruments required to monitor energy flows
must be encouraged. Imports of such instruments and spareparts should be free of customs duty.
Research and development• Each industrial process should be reviewed to identify the research
and development required to reduce energy consumption.• Research and development on energy efficiency should be
sponsored by the government as a distinct component of thescience and technology plan.
Other measures• Formal training to develop energy conservation expertise
should be introduced in technical institutions.• The government should recognise and honour individuals and
organisations for outstanding performance on energy conservation.• Efforts to raise awareness on energy conservation should
be intensified.
Source: Bhattacharjee, 1999.

WORLD ENERGY ASSESSMENT: ENERGY AND THE CHALLENGE OF SUSTAINABILITY
Chapter 6: Energy End-Use Efficiency
211
■ Better performance control ofthe heating system, variable mass-flow in addition to temperature controlin hot water systems, lower temperaturesin the heating system, and the use of heatfor cooling (through absorption techniques)to improve the seasonal load of the system.
■ One-by-one metering and price collection for consumersin transition economies.
■ A minimum buyback rate for cogenerated electricity in the adaptationphase of liberalisation (AGFW, 2000).Such a bundle of measures can assure the competitiveness of
other options and the realisation of the huge potential for cogenerationin centralised heating systems.
In developing countries a lack of knowledge, capital, and hardcurrency may constrain cogeneration investments. Thus policy measuresand incentives are often needed—and were recommended, forexample, by a task force in India in 1993. The Ministry of Non-Conventional Energy Sources launched a national programmepromoting bagasse-based cogeneration. The process of agreeing on mutually acceptable buyback rates and wheeling of power by state electricity boards is still under way, but there is hope that theinstitutional barriers will give way to large-scale cogeneration, particularly in liberalised electricity markets.
International policy measuresThe globalisation of many industrial sectors creates enormouspotential for improving energy efficiency at the global scale.Harmonising technical standards for manufactured goods offersnew opportunities for economies of scale, lowering the cost of energy-efficient products. To avoid the import of energy-inefficient products,governments, associations of importers, and NGOs may considernegotiating efficiency standards for appliances and other mass-producedproducts imported from industrialised countries. Imported vehicles,used cars, buses, and trucks should not be more than five or sixyears old (as in Bangladesh and Hungary). Similar rules could beintroduced for major imported and energy-intensive plants.
The Energy Charter Protocol on Energy Efficiency and RelatedEnvironmental Aspects entered into force in April 1998. The protocolis legally binding but does not impose enforceable obligations onnations to take specified measures. It is a ‘soft law’ requiring actionssuch as:■ Formulating aims and strategies for improving energy efficiency
and establishing energy efficiency policies.■ Developing, implementing, and updating efficiency programmes
and establishing energy efficiency bodies that are sufficientlyfunded and staffed to develop and implement policies.
■ Creating the necessary legal, regulatory, and institutional environmentfor energy efficiency, with signatories cooperating or assistingeach other in this area.The protocol received significant political support from the EU
Environmental Ministers Conference in June 1998. By December 1998,
however, it had only about 40 sig-natories, mainly Western European
countries and transition economies.Thus it has no world-wide support
(Bradbrook, 1997).Commitments to the Kyoto Protocol by
Annex B countries are a major driver of energy efficiency,as about 70 percent of these countries’ greenhouse gas
emissions are related to energy use. Although energy efficiency is amajor contributor for achieving the targets of the protocol, there arefew references to it in the text of the document. Ratification of theprotocol and implementation of the flexible instruments will beimportant for developing policy awareness in industrialised countriesof the substantial potential that improved energy efficiency offers formeeting the objectives.
Better air traffic management will likely reduce aviation fuel burnby some 10 percent if fully implemented in the next 20 years—providedthe necessary international regulatory and institutional arrangementshave been put in place in time. Stringent aircraft engine emissionand energy efficiency regulations or voluntary agreements amongairlines can expedite technological innovations. Efforts to removesubsidies, impose environmental levies (charges or taxes), and promote emissions trading could be negotiated at the internationallevel (IPCC, 1999b). These economic policies—though generallypreferred by industry—may be highly controversial.
ConclusionAs the long-term potential for energy efficiency reduces useful energydemand and the proceeding levels of energy conversion, futureenergy policy of most countries and on the international level willhave to broaden substantially its scope from energy supply to energyservices. This kind of policy will be much more demanding in designingtarget group–specific and technology-specific bundles of policy measures.But the success of this new policy process will be worth the effortfrom the economic, social and environmental perspective. ■
Notes1. Lee Schipper was the lead author of this section.
2. Eberhard Jochem was the lead author of this box.
3. Inna Gritsevich and Eberhard Jochem were the lead authors of this section.
4. Anthony Adegbulugbe was the lead author of this section.
5. Somnath Bhattacharjee was the lead author of this section.
6. Eberhard Jochem was the lead author of this section.
7. Eberhard Jochem was the lead author of this box.
8. Bernard Aebischer and Eberhard Jochem were the lead authors ofthis section.
9. Ernst Worrell, Allen Chen, Tim McIntosch, and Louise Metirer were thelead authors of this section.
10. This means that the cost-effective potential is probably equivalent tothe microeconomic potential (see the introduction to the section onpotential economic benefits).
The globalisation of many industrial sectors
creates enormous potential for improving energy efficiency
at the global scale.
WORLD ENERGY ASSESSMENT: ENERGY AND THE CHALLENGE OF SUSTAINABILITY
Chapter 6: Energy End-Use Efficiency
212
11. The estimates of the economic potential are based on supply curvesfor each sector developed by Bailie and others (1998). It is unclear whatdiscount rate was used to estimate the economic potential. Hence wecannot determine if the study estimates a microeconomic or macroeco-nomic potential (see box 6.2).
12. It is unclear what discount rate was used to estimate the economicpotential. In some economic assessments in this report a discount rateof 50 percent is used for investments in the transportation sector.
13. Bidyut Baran Saha and David Bonilla were the lead authors of this section.
14. Tamas Jaszay was the lead author of this section.
15. Inna Gritsevich was the lead author of this section.
16. Somnath Bhattacharjee was the lead author of this section.
17. Fengqi Zhou was the lead author of this section.
18. Gilberto M. Jannuzzi was the lead author of this section.
19. Anthony Adegbulugbe was the lead author of this section.
20. Eberhard Jochem was the lead author of this section.
21. Eberhard Jochem was the lead author of this section.
22. Eberhard Jochem was the lead author of this section.
23. Jean Pierre Des Rosiers was the lead author of this section.
24. Inna Gritsevich and Tamas Jaszay were the lead authors of this section.
25. Somnath Bhattacharjee, Gilberto Jannuzzi, and Fengqi Zhou werethe lead authors of this section.
26. Eberhard Jochem was the lead author of this section.
27. Eberhard Jochem was the lead author of this section.
ReferencesADB (Asian Development Bank), GEF (Global Environment Facility), and
UNDP (United Nations Development Programme). 1998. “Asia LeastCost Greenhouse Gas Abatement Strategy.” Manila, Philippines.
Adegbulugbe, A.O. 1992a. “The Energy-Environment Nexus: The Roleof Energy Efficiency.” In Energy Issues in Nigeria: Today andTomorrow. Proceedings of a conference held at the NigerianInstitute of International Affairs, Victoria Island, Lagos.
———, ed. 1992b. “Energy for Tomorrow’s World: The Realities, theReal Options and the Agenda for Achievement.” Sub-SaharanAfrica Regional Report. Presented at the 15th World EnergyCouncil Congress, Madrid.
Adegbulugbe, A.O. 1993. “Energy Efficiency in Industry: A RegionalPerspective.” In S. Karekezi and G.A. Mackenzie, eds., EnergyOptions for Africa: Environmentally Sustainable Alternatives.London: Zed Books.
Adi Cahyono A. 1999. Personal communication. Ministry for Mines andEnergy, Indonesia.
Aebischer, B., J. Schwarz, and D. Spreng. 1996. “Perspectives ofEnergy Demand of the Tertiary Sector: Scenarios I to III, 1990–2030[in German].” Federal Office of Energy, Bern, Switzerland.
AGFW (Arbeitsgemeinschaft Fernwärme). 2000. “Strategien undTechnologien einer pluralistischen Fern- und Nahwärmeversorgungin einem liberalisierten Energiemarkt unter besondererBerücksichtigung der Kraft-Wärme-Kopplung und erneuerbarenEnergien.” Studie Kurzzusammenfassung, Frankfurt.
Aim Project Team. 1994. “An Energy Technology Model for ForecastingCarbon Dioxide Emissions in Japan [in Japanese].” Report F-64-94. National Institute for Environmental Studies.
ALGAS, 1998. Asian Least-Cost Greenhouse Gas Abatement Study.Tokyo, Japan.
Almeida, A., P. Bertoldi, and W. Leonhard, eds. 1997. Energy EfficiencyImprovements in Electric Motors and Drives. Berlin: Springer.
Alnakeeb, H. 1998. “Co-generation Potential in Egyptian Industry.”Organization for Energy Consumption and Planning, Cairo.
Alnakeeb, H., M. El Gazzar, and M. Emam. 1998. “Demand Side Managementof Efficient Lighting: A Case Study of an Administrative Building.”Organization for Energy Consumption and Planning, Cairo.
Altner, G., H.-P. Dürr, and G. Michelsen. 1995. Zukünftige Energiepolitik:Vorrang für rationelle Energienutzung und regenerative Energiequellen[Future Energy Policy Priority for Energy Efficiency and Renewables].Bonn: Economica Verlag.
Ameling, D., and others. 1998. “Coke Production Technology in 2000:The State of the Art and New Structures [in German].” Eisen undStahl 118 (11): 55–61.
Angerer, G. 1995. “Auf dem Weg zu einer ökologischen Stoffwirtschaft.Teil I: Die Rolle des Recycling.” GAIA 4 (2): 77.
Arbeitsgemeinschaft. 1992. “Arbeitsgemeinschaft Amstein & Walthertund Intep AG. Methode zur Optimierung des Elektrizitätsverbrauchs.Sparpotentiale beim Elektrizitätsverbrauch von zehn ausgewähltenart-typischen Dienstleistungsbetrieben.” Schlussbericht. Bundesamtfür Energie, Bern.
ARENA-ECO (Agency for Rational Energy Use and Ecology). 1997. Ukraine:On the Way to Energy Efficiency. Kiev, Ukraine.
Argentina Secretaria de Energía. 1997. “Prospectiva del sector eléctrico1997 [in Spanish].” [http://www.mecon.ar/energia/].
———. 1998a. “Balances energéticos [in Spanish].” [http://energia.mecon.gov.ar/Balances%20/Energeticos/balances.asp].
———. 1998b. “Cogeneración de energía: Analisis sectoriales [in Spanish].”[http://www.mecon.ar/energia/ure/anlisis.htm].
———. 1998c. “Cogeneración de energía en el sector industrial [in Spanish].”[http://energia.mecon.ar/ure/oportunidades.htm].
———. 1998d. “Cogeneración de energía en el sector terciário [in Spanish].”[http://energia.mecon.ar/ure/].
———. 1998e. “Equipos para conservación de alimentos en hogares [inSpanish].” [http://energia.mecon.ar/ure/oportunidades.htm].
———. 1998f. “Uso racional de la energía en el sector transporte [inSpanish].” [http://energia.mecon.ar/ure/anlisis.htm].
ATLAS Report Compendium of Technology Modules. 1997. “Industry:Energy Technology Information Base 1980–2010.” EuropeanCommission, Brussels.
Ayres, R. 1996. Industrial Ecology: Towards Closing the Materials Cycle.London: Edward Elgar.
Bailie, A., B. Sadownik, A. Taylor, M. Nanduri, R. Murphy, J. Nyboer, M.Jaccard, and A. Pape. 1998. “Cost Curve Estimations for ReducingCO2 Emissions in Canada: An Analysis by Province and Sector.”Simon Fraser University, Energy Research Group, Vancouver, Canada.
Bandala, A. 1995. “Importance of the Mexican Lighting Systems in Commerceand Services.” Proceedings of the third European Conference onEnergy-Efficient Lighting, Newcastle upon Tyne, England.
Bashmakov, I. 1997a. “Heat, Money and Housing Reform.” EnergyEfficiency 14 (January–March).
———. 1997b. “Strengthening the Russian Economy through ClimateChange Policies.” Energy Efficiency Bulletin 17. Centre for EnergyEfficiency, Moscow.
Bashmakov, I., I. Gritsevich, and S. Sorokina. 1996. “System ofInstitutional Measures to Stimulate Energy Efficiency in Russia asPart of the GHG Mitigation Strategy.” Report to the Country StudyProgram. Centre for Energy Efficiency, Moscow.
Baumgartner, W., and C. Muggli. 1996. “Perspectives of Energy Demandof the Industrial Sector: Scenarios I to III, 1990–2030 [in German].”Federal Office of Energy, Bern, Switzerland.
Baxter, L.W. 1995. “Assessment of Net Lost Revenue AdjustmentMechanisms for Utility DSM Programs.” Oak Ridge NationalLaboratory, Oak Ridge, Tenn.
WORLD ENERGY ASSESSMENT: ENERGY AND THE CHALLENGE OF SUSTAINABILITY
Chapter 6: Energy End-Use Efficiency
213
BEA (Bureau of Economic Analysis). 1998. “Survey on Economic Policyin Russia in 1997.” Moscow.
Beer, de, Jeroen. 1998. “Potential for Industrial Energy Efficiency Improvementin the Long Term.” PhD. diss. University of Utrecht, Netherlands.
Bernadini, R. 1993. “Dematerialization: Long-term Trends in the Intensityof Use of Materials and Energy.” Futures 25: 431–47.
Bhattacharjee, S. 1999. Personal communication. Tata Energy ResearchInstitute, Mumbai, India.
Blanc, A., and O. de Buen. 1994. “Residential Lighting Efficiency in Mexico:The Road to ILUMEX.” In Proceedings of the ACEEE SummerStudy on Energy Efficiency in Buildings. Asilomar, Calif.: AmericanCouncil for an Energy-Efficient Economy.
Blok, K., W.C. Turkenburg, W. Eichhammer, U. Farinelli, and T.B. Johansson.1996. “Overview of Energy RD&D Options for a SustainableFuture.” European Commission, Luxembourg.
Böde, U., and others. 1999. “Efficient Energy Use: A Literature Survey[in German].” BWK 86 (4): 86–90.
Boardman, B., T. Fawcett, H. Griffin, M. Hinnels, K. Lane, and J. Palmer. 1997.“DECADE: Domestic Equipment and Carbon Dioxide Emissions.”University of Oxford, Energy and Environment Program.
Borisova, I., and others. 1997. “Energy Intensity of Russian Economy.”Problems of Forecasting 6: 11–36.
Bradbrook, A. 1991. “The Development of Energy ConservationLegislation for Private Rental Hosing.” Environmental and PlanningLaw Journal 8 (2): 91–1107.
———. 1992. “Energy Conservation Legislation for Industry.” Journal ofEnergy and Natural Resources Law 1 (2): 145–63.
———. 1994. “Regulation for Fuel Efficiency in the Road TransportationSector.” Australian Journal of Natural Resources Law and Policy 1 (1): 1–31.
———. 1997. “Energy Efficiency and the Energy Charter Treaty.”Environmental and Planning Law Journal 14 (5): 327–40.
Brechbühl B. 1992. “Energiesparmaßnahmen in Lüftungsanlagen mittelsadaptiver Einzelraumregulierung.” Proceedings of an internationalsymposium on Energy for Urban Areas, August 25–26, Zürich.
Brewer, W.M., and S.F. Lopez. 1998. “Successful Closed-loop OlefinsPlant Optimisation.” Hydrocarbon Processing 6: 83–89.
Brown, M., M. Levine, J. Romm, and A. Rosenfeld. 1998. “EngineeringEconomic Studies of Energy Technologies to Reduce GreenhouseGas Emissions: Opportunities and Challenges.” Annual Review ofEnergy and the Environment 23.
Brunner, C.U., and R. Gartner. 1999. Energieeffizienz im Schienenverkehr.Neue Eisenbahnkonzepte senken den Energieverbrauch um 50%.Bulletin SEV/VSE 11/99.
CADDET (Centre for the Analysis and Dissemination of DemonstratedEnergy Technology). 1997. “International Data on SuccessfullyDemonstrated Energy Efficiency Projects.” Sittard, Netherlands.
Carter, A.P. 1996. “The Economics of Technological Change.” ScientificAmerican 214: 25–31.
Cavaliero, C.K.N. 1998. “Redução das Emissões de CO2 do SegmentoSiderúrgico Nacional através da Injeção de Combustível Auxiliar emAlto Forno: Estudos de Casos na Acesita e Cosipa.” Planejamentode Sistemas Energéticos thesis. Universidade Estadual deCampinas (UNICAMP), Faculdade de Engenharia Mecânica, Brazil.
CENEf (Centre for Energy Efficiency). 1993. Energy Efficiency Potentialand Strategy for Russia [in Russian]. Moscow.
———. 1998. Russian Energy Picture Statistical Yearbook. Moscow.
CIECC (China International Engineering Consultant Corporation). 1997.“Comparison between China and Foreign Countries on Unit EnergyConsumption of Energy Intensive Industries.” State DevelopmentPlanning Commission, Beijing.
CII (Confederation of Indian Industry). 1994. “Specific Energy ConsumptionNorm in Indian Pulp and Paper Industry.” CII Energy Summit, Madras.
Cleveland, C.J., and M. Ruth. 1999. “Indicators of Dematerialization and the Materials Intensity of Use.” Journal of Industrial Ecology3 (3): 15–50.
CMIE (Centre for Monitoring the Indian Economy). 1996. India’s EnergySector. Mumbai, India.
———. 1997. “Approach Paper to Ninth Five-year Plan.” Mumbai, India.
CODA. 1989. “Household Energy Planning Programme (HEPP).” Uganda,Ministry of Energy, Kampala.
Dadhich P., and B. Bhatia. 1994. “Co-generation—A DSM Option forIndia.” Energy and Environment Monitor 10 (1): 27–34.
Dasgupta, N. 1999. “Energy Efficiency and Environmental Improvementsin Small Scale Industries: Present Initiatives in India Are NotWorking.” Energy Policy 27 (13): 789–800.
Davidson, O., and S. Karekezi. 1991. “A New Environmentally-SoundEnergy Strategy for the Development of Sub-Saharan Africa.”AFREPREN, Nairobi, Kenya.
Davidson, O.R., A.M. Al-Shatti, and A.O. Adegbulugbe. 1991. “CO2Emissions from Developing Countries: Better Understanding theRole of Energy in the Long Term.” Lawrence Berkeley LaboratoryReport 30061 UC-350. Berkeley, Calif.
Davis, S. 1997. “Transportation Energy Data Book Edition 17.” OakRidge National Laboratory, Oak Ridge, Tenn.
DeCanio, S.J. 1993. “Barriers within Firms to Energy-Efficient Investments.”Energy Policy 21: 906–14.
Diekmann, J., and others. 1999. “Energy Efficiency Indicators: StatisticalBases, Theoretical Foundation, and Basis for Orientation in PolicyPractice [in German].” Physica-Verlag, Heidelberg
Dobozi, I. 1991. “Impacts of Market Reforms on USSR Energy Consumption.”Energy Policy 19 (4): 303–24.
Duffy J. 1996. “Energy Labelling Standards and Building Codes: A GlobalSurvey and Assessment for Selected Developing Countries.”International Institute for Energy Conservation, Washington, D.C.
Dutt, G., and C. Tanides. 1994. “Potencial de Uso Eficiente de la EnergíaEléctrica: Una Primera Aproximación.” Proceedings of Actas de la17ª Reunión de Trabajo de la Asociación Argentina de EnergíaSolar, Rosario, Argentina.
Dutt, G., C. Tanides, and M. Brugnoni. 1996. “DSM (Demand-SideManagement) y Empresas Distribuidoras en Mercados Desregulados:Possibilidades para Argentina.” Proceedings of the InternationalConference on Electricity Distribution, Buenos Aires, Argentina.
EC (European Commission). 1999a. Energy in Europe: Energy Outlook2020. Special issue. Brussels.
———. 1999b. Foundations of Energy Policy: Energy in Europe: SpecialIssue. Brussels.
———. Various years. Energy in Europe: Annual Energy Review. Specialissue. Brussels.
ECODROME. 1998. “Etude experimentale des appareils electroménagersà haute éfficacité énérgétique places en situation reelle.” SAVE programme 4.1031./S/94-093. Auteur Cabinet Olivier Sidler. Partenaire:DGXVII, ADEME, OSRAM, Groupe Brant, Electrolux, Liebher.
EIA (Energy Information Agency). 1996. Annual Energy Outlook 1997:With Projections to 2015. DOE/EIA-0383 (97). Washington, D.C.:U.S. Department of Energy.
———. 1999a. “Country Profile: Argentina.” [http://www.eia.doe.gov/emeu/cabs/argentna.html].
———. 1999b. “Energy in the Americas.” [http://www.eia.doe.gov/emeu/cabs/theamerics].
Enquête Commission (German Bundestag). 1991. Protecting the Earth:A Status Report with Recommendations for a New Energy Policy.vol. 2. Bonn: Bonner University Press.
WORLD ENERGY ASSESSMENT: ENERGY AND THE CHALLENGE OF SUSTAINABILITY
Chapter 6: Energy End-Use Efficiency
214
ETSU (Energy Technical Support Unit). 1994. “An Appraisal of UKEnergy Research, Development, Demonstration and Dissemination.”Her Majesty’s Stationery Office, London.
Farla, J.C.M., and K. Blok. 1995. “Energy Conservation InvestmentBehaviour of Firms: Business as Usual?” In Proceedings of the1995 ECEEE Summer Study: Sustainability and the Reinvention ofthe Government—A Challenge for Energy Efficiency. Stockholm.
Faruaui, A., M. Mauldin, S. Schick, K. Seiden, and G. Wilder. 1990.“Efficient Electricity Use: Estimates for Maximum Energy Savings.”Prepared by Barakat & Chamberlin, Inc. for the Electric PowerResearch Institute, Palo Alto, Calif.
Fesharaki, F. 1998. “Asia As the Center of Gravity of the World EnergySystem.” Energy: The International Journal 19 (4): 85–105.
Fisher, A., and C. Rothkopf. 1989. “Market Failure and Energy Policy.”Energy Policy 17: 397–406.
Friedmann, R. 1994. “Saving Electricity in Mexican Homes: Potentialand Accomplishments to Date.” In Proceedings of the ACEEESummer Study on Energy Efficiency in Buildings. Asilomar, Calif.:American Council for an Energy-Efficient Economy.
Friedrich, R., and W. Krewitt. 1997. Umwelt- und Gesundheitsschädendurch die Stromerzeugung. Heidelberg/Berlin: Springer.
Gardner, G.T., and P.C Stern. 1996. Environmental Problems and HumanBehaviour. Needham Heights, Mass.: Allyn and Bacon.
GEA (Group for Efficient Appliances). 1995. Washing Machines, Dryersand Dishwashers. Final Report. European Energy Network WorkingGroup. Copenhagen: Danish Energy Agency.
Geiger, B., W. Eichhammer, E. Gruber, D. Köwener, H. Kottmann, W. Mannsbart,U. Mielicke, M. Patel, and D. Saage. 1999. Energieverbrauch undEnergieeinsparung in Handel, Gewerbe und Dienstleistung.Heidelberg: Physica-Verl.
Geller, H. 1995. National Appliance Efficiency Standards: Cost-effectiveFederal Regulations. Washington D.C.: American Council for anEnergy-Efficient Economy.
Geller, H., G. M. Jannuzzi, R. Schaeffer, and M. T. Tolmasquim. 1998.“The Efficient Use of Electricity in Brazil: Progress andOpportunities.” Energy Policy 26 (11): 859–72.
Geller, H., P. Leonelli, R. Abreu, I. Araújo, and H. Polis. 1997. “Energy-EfficientLighting in Brazil: Market Evolution, Electricity Savings and PublicPolicies.” In Proceedings of the Fourth European Conference onEnergy-Efficient Lighting. Copenhagen: International Associationof Energy-Efficient Lighting.
German Statistical Office, various years. Statisches Jahrbuch.Wiesbaden, Germany.
Gnedoy, N. 1998. “Energy Situation in Ukraine.” Industrial Energy 5: 10–14.
———. 1983. “Inter Ministerial Working Group Report on Utilisation andConservation of Energy.” New Delhi.
———. 1985. “Report of the Advisory Board on Energy.” New Delhi.
———. 1994. “Consultancy Capabilities in Energy Conservation andManagement for the Industrial Sector in India.” New Delhi.
———. 1995. “State Electricity Boards and Electricity Departments.”Planning Commission, Power and Energy Division, New Delhi.
———. 1996. Ninth Plan Document (1997–2002). New Delhi.
———. 1997. “Handbook of Industrial Policy and Statistics.” Ministry ofIndustry, Office of the Economic Adviser, New Delhi.
Golove, W. 1994. “Are Investments in Energy Efficiency Over or Under:An Analysis of the Literature.” In Proceedings of the 1994 ACEEESummer Study on Energy Efficiency in Buildings. Asilomar, Calif.:American Council for an Energy-Efficient Economy.
Goscomstat of Russia. 1996. Industry of Russia. Moscow.
———. 1997. Russian Statistical Yearbook. Moscow.
Goto, N. 1996. “Macroeconomic and Sectoral Impacts of Carbon Taxation:A Case Study for the Japanese Economy.” In A. Amano, ed., GlobalWarming, Carbon Limitation and Economic Development. NationalInstitute for Environmental Studies and Environment Agency ofJapan, Centre for Global Environmental Research, Tokyo.
Goushin, S., and G. Stavinski. 1998. “Case of Implementation of EnergySaving Technologies at Kirishi Refinery Plant ‘Kirishinefteorgsyntez’.”Energomeneger 12: 20–23.
Greene, David, 1998. “Why CAFE Worked.” Energy Policy 26 (8): 595–613.
Gritsevich, I. 1993. “Energy Conservation Problem under Conditions ofTransition to Market Economy.” Economics and MathematicalMethods 29 (2): 209–16.
Gritsevich, I., Y. Dashevsky, and V. Zhuze. 1997. “Prospects for WesternTechnologies in Improving District Heating Energy Efficiency inRussia.” In Greenhouse Gas Mitigation: Technologies for ActivitiesImplemented Jointly. Proceedings of the International Conferenceon Technologies for Activities Implemented Jointly, May,Vancouver, Canada.
Gruber, E., and M. Brand. 1991. “Promoting Energy Conservation inSmall and Medium-sized Companies.” Energy Policy 279–87.
Hagler Bailly Services, Inc. 1997. “The Energy Efficiency Market inDeveloping Countries: Trends and Policy Implications.” BusinessFocus Series. U.S. Agency for International Development, Office ofEnergy, Environment, and Technology, Washington, D.C.
Hallenga, R.J., and I.C. Kok. 1998. “Inventory of Office EquipmentEnergy Efficiency.” Report 98 PO/PRO 606. TNO Institute ofIndustrial Technology. Delft, Netherlands.
Hassett, K.A., and G.E. Metcalf. 1993. “Energy Conservation Investment:Do Consumers Discount the Future Correctly?” Energy Policy 21: 710–16.
Hennicke, P., and others. 1995. “Integrierte Ressourcenplanung.” DieLCP-Fallstudie der Stadtwerke Hannover AG. Ergebnisband,Hannover, Germany.
———. 1998. “Interdisciplinary Analysis of Successful Implementation ofEnergy Efficiency in the Industrial, Commercial and Service Sectors.”Final report. Copenhagen, Karlsruhe, Kiel, Vienna, Wuppertal.
Hicks, T.W., and D.W. Clough. 1998. “The ENERGY STAR BuildingLabel: Building Performance through Benchmarking andRecognition.” In Proceedings of the ACEEE Summer Study onEnergy Efficiency in Buildings. Asilomar, Calif.: American Councilfor an Energy-Efficient Economy.
Hiessl, H., F. Meyer-Krahmer, and M. Schön. 1995. “Auf dem Weg zueiner ökologischen Stoffwirtschaft. Teil II: Die Rolle einerganzheitlichen Produktpolitik.” GAIA 4 (2): 89.
Hinterberger, F., F. Luks, and F. Schmidt-Bleek. 1997. “Material Flowsversus ‘Natural Capital’: What Makes an Economy Sustainable?”Ecological Economics 23: 1–14.
Hirst, E. 1991. “Improving Energy Efficiency in the USA: The FederalRole.” Energy Policy 19 (6): 567–77.
Hohmeyer, O., R.L. Ottinger, and K. Rennings, eds. 1997. Social Costsand Sustainability: Valuation and Implementation in the Energy andTransport Sector. Berlin/Heidelberg: Springer.
Hu, X. 1997. “Chart for Energy System Network of China and EnergyEfficiency Study Report.”
Hu, X., and K. Jiang. 1997. “The Structure and Simulation ResultsAnalysis of China AIM Energy Emission Model.”
Huang, J., and others. 1998. “A Commercial Building Energy Standardfor Mexico.” In Proceedings of the ACEEE Summer Study onEnergy Efficiency in Buildings. American Council for an Energy-Efficient Economy, Asilomar, Calif.
IEA (International Energy Agency). 1987. Energy Conservation in IEACountries. Paris.
———. 1991. Energy Efficiency and the Environment. Paris.
WORLD ENERGY ASSESSMENT: ENERGY AND THE CHALLENGE OF SUSTAINABILITY
Chapter 6: Energy End-Use Efficiency
215
———. 1995. Energy Policies of the Russian Federation. Paris.
———. 1997a. Energy Efficiency Initiative. vol. 1. Paris
———. 1997b. Energy Efficiency Initiative. vol. 2. Paris.
———. 1998. Energy Statistics and Balances of Non-OECD Countries,1995–1996. Paris.
———. 1999. Energy Policies of IEA Countries: Hungary 1999 Review. Paris.
IIEC (International Institute of Energy Conservation). 1995. Asian EnergyEfficiency Success Stories. Washington D.C.
IIP (Indian Institute of Petroleum). 1995. State of the Art Report onVehicular Pollution.
Interlaboratory Working Group on Energy Efficient and Low-CarbonTechnologies. 1997. “Scenarios of U.S. Carbon Reductions:Potential Impacts of Energy Technologies by 2010 and Beyond.”Lawrence Berkeley National Laboratory, Berkeley, Calif.
IPCC (Intergovernmental Panel on Climate Change). 1995. SecondAssessment Report. Cambridge: Cambridge University Press.
———. 1999a. Aviation and the Global Atmosphere. Cambridge:Cambridge University Press.
———. 1999b. Methodological and Technological Issues in TechnologyTransfer. Cambridge: Cambridge University Press.
IPSEP (International Project for Sustainable Energy Paths). 1995.“Negawatt Power: The Cost and Potential of Efficiency Resourcesin Western Europe.” Part 3B in Energy Policy in the Greenhouse,vol. II. El Cerrito, Calif.
Ishiguro, M., and T. Akiyama. 1995. Energy Demand in Five Major AsianDeveloping Countries: Structure and Prospects. World BankDiscussion Paper 277. Washington, D.C.
Jaccard, M.K., and Willis Energy Services. 1996. “Industrial Energy End-Use Analysis & Conservation Potential in Six Major Industries inCanada.” Natural Resources Canada, Ottawa.
Jaenicke M. 1998. “Towards an End to the ‘Era of Materials’? Discussionof a Hypothesis.” Forschungsstelle für Umweltpolitik, Berlin.
Jannuzzi, G.M. 1998. “A Sectoral Review of Energy in Brazil: Supply and Demand and Opportunities for Reducing Carbon Emissions.”M. Kaplan. Denver, Colorado, Institute for Policy Research andImplementation, Graduate Studies of Public Affairs, University ofColorado at Denver and Câmara de Comércio Brasil-Estados Unidos.
JISF (Japan Iron and Steel Federation). 1993. “Energy EfficientMeasures and Energy Reduction in Integrated Steel Mills in Japan[in Japanese].” Tokyo.
Jochem, E., 1991. “Long-Term Potentials of Rational Energy Use—TheUnknown Possibilities of Reducing Greenhouse Gas Emissions.”Energy Environment 2 (1): 31–44.
Jochem, E., and H. Bradke.1996. Energieeffizienz, Strukturwandel undProduktionsentwicklung der deutschen Industrie: IKARUS.Instrumente für Klimagas-Reduktionsstrategien. AbschlußberichtTeilprojekt 6 “Industrie”. Jülich: Forschungszentrum Jülich,Zentralbibliothek, Germany.
Jochem, E., and E. Gruber. 1990. “Obstacles to Rational Electricity Useand Measures to Alleviate Them.” Energy Policy 18 (5): 340–50.
Jochem, E., and O. Hohmeyer. 1992. “The Economics of Near-TermReductions in Greenhouse Gases.” In J.M. Mintzer, ed., ConfrontingClimate Change. Cambridge: Cambridge University Press.
Jochem, E., and E. Tönsing. 1998. “The Impact of the Liberalisation ofElectricity and Gas Supply on Rational Energy Use in Germany [inGerman].” UWF 6 (3): 8–11.
Jochem, E., J. Sathaye, and D. Bouille, eds. 2000. Society, Behaviour,and Climate Change Mitigation. Kluwer: Dordrecht, Netherlands.
Kashiwagi, T. 1994. “Industrial Energy Efficiency Policies andProgrammes.” Presented at the International Energy AgencyInternational Workshop, May 26–27, Washington D.C.
———. 1995: “Second Assessment Report of the IntergovernmentalPanel on Climate Change.” Cambridge: Cambridge University Press.
———. 1999. “The Future Vision of Urban Energy Systems by theIntroduction of Polymer Electrolyte Fuel Cell Technology.” OsakaResearch and Development Forum, Japan.
Kashiwagi T., B.B. Saha, and A. Akisawa. 1998. “Technological Breakthroughfor the Environmental Issues in Japan.” Japan Society ofMechanical Engineers News 9 (1): 3–10.
Kaya, Y., Y. Fujii, R. Matsuhashi, K. Yamaji, Y. Shindo, H. Saiki, I.Furugaki, and O. Kobayashi. 1991. “Assessment of TechnologicalOptions for Mitigating Global Warming.” Paper presented to theEnergy and Industry Subgroup, WG 3 of IPCC, August, Geneva.
Kishimba, M., and F. Musomba. 1996. “Production of Energy fromBiomass and Biomass Waste.” African Energy Policy ResearchNetwork Working Paper 103.
Kos, M. 1999. “Energy Efficiency in Post-Communist Countries.” Writtencommunication. Ljubljana, Slovenia.
Krause, F. 1996. “The Costs of Mitigating Carbon Emissions: A Reviewof Methods and Findings from European Studies.” Energy Policy,Special Issue on the Second UN IPCC Assessment Report,Working Group III, 24 (10/11): 899–915.
Krawczynski, F., and J. Michna. 1997. “Effektivität westlicher Hilfe imEnergiesektor.” Energiewirtschaftliche Tagesfragen 47(1/2): 23.
Kretinina, Yu., A. Nekrasov, and S. Voronina. 1998. “Energy Price forPopulation.” Studies on Russian Economic Development (6): 44–55.
Kuldip, K., and others. 1995. “Energy Conservation in AgriculturalPumping Systems.” Proceedings of the National Workshop onEnergy Conservation, September 8–9, New Delhi.
Laitner, S., St. Bernow, and J. DeCicco. 1998. “Employment and OtherMacroeconomic Benefits of an Innovation-led Climate Strategy forthe United States.” Energy Policy 26 (5): 425–32.
Lapir, M. 1997. “On Energy Saving Activities in the City of Moscow [inRussian].” Industrial Energy (9): 7–10.
Levine, M.D., and R. Sonnenblick. 1994. “On the Assessment of UtilityDemand-side Management Programs.” Energy Policy 22.
Levine, M.D., E. Hirst, J.G Koomey, J.E. McMahon, and A.H. Sanstad.1994. “Energy Efficiency, Market Failures, and Government Policy.”Lawrence Berkeley National Laboratory, Berkley, Calif.; and OakRidge National Laboratory, Oak Ridge, Calif.
Levine, M.D., J. Koomey, J. McMahin, A. Sanstad, and E. Hirst. 1995.“Energy Efficiency Policies and Market Failures.” Annual Review ofEnergy and the Environment 20: 535–55.
Levine, M.D., A. Gadgil, S. Meyers, J. Sathaye, J. Stafurik, and Wilbanks.1991. “Energy Efficiency, Developing Nations and Eastern Europe.”A report to the U.S. Working Group on Global Energy Efficiency,Lawrence Berkeley Lab, Berkeley, Calif.
Livinski, A., 1998. “On Energy Saving Activities in Russia.” Energomeneger(10): 4–6.
Lovins, A., and P. Hennicke. 1999. “Voller Energie [in German; Full ofEnergy].” Campus Frankfurt/N.Y.
MACEBUR. 1998. “Energy-Efficient Office Technologies: The One Watt-One Ampere Challenge.” European Commission. Contract NoXVII/4.1301/s/94-87. Brussels.
Machado, A.C., and R. Shaeffer. 1998. “Estimativa do Potencial deConservação de Energia Elétrica Pelo Lado da Demanda no Brasil.” PROCEL/COPPETEC/ PNUD BRA/93/032, COPPE, Rio de Janeiro.
Mengistu T. 1995. “Energy in the Transport Sector: The Case of Ethiopia.”African Energy Policy Research Network Newsletter 19.
México Secretaría de Energía. 1997. “Prospectiva Del Sector Eléctrico1996–2006.” Mexico City.
Michna, J., 1994. “Energy Conservation during the Transition Period.Special Issue on Central and Eastern European Energy Policy.”International Journal of Global Energy Issues 6: 183–90.
WORLD ENERGY ASSESSMENT: ENERGY AND THE CHALLENGE OF SUSTAINABILITY
Chapter 6: Energy End-Use Efficiency
216
Mintopenergo. 1996. “Federal Target Programme of Development ofManufacturing of Certified Metering Devices and System andEquipping Customers in 1996–2000.”
Moloduik, V. 1997a. “Main Directions of Restructuring NaturalMonopolies in Fuels and Energy Complex.” Energomeneger 8: 6–8.
———. 1997b. “Problems of Electricity Tariffs Regulation.”Energomeneger 6: 14–17.
Morovic, T. 1989. Energy Conservation Indicators II. Heidelberg, N.Y.: Springer.
Moscow Government. 1997. “Moscow City Energy Saving Programmein 1998–2003.” Moscow.
Mungwititkul W., and B. Mohanty. 1997. “Energy Efficiency of OfficeEquipment in Commercial Buildings: The Case of Thailand.”Energy The International Journal 22 (7): 673–80.
Nadel, S., V. Kothari, and S. Gopinath. 1991. “Opportunities for ImprovingEnd-use Electricity Efficiency in India.” American Council for anEnergy-Efficient Economy, Washington, D.C.
National Energy Efficiency Agency at the Council of Ministers ofBulgaria. 1998. “National Energy Efficiency Program of Bulgaria.”Sofia, Bulgaria.
Natural Resources Canada. 1998. “Energy Efficiency Trends in Canada,1990 to 1996.” Ottawa.
Nelson, K. 1994. “Finding and Implementing Projects that Reduce Waste.”In R.H. Socolow, C. Andres, F. Berkhout, and V. Thomas, eds.
Neyer A., and M. Strebel. 1996. “Grundlagenarbeiten für Perspektiven desEnergieverbrauchs in Dienstleistungsbetrieben und Landwirtschaft.Schlussbericht. Zürich.”
Nikiforov, G. 1998. “On Approaches to Reducing Production Energy Useat MMK.” Energomeneger (11): 21–23.
Nguyen Thuong. 1998. “Energy Saving Potential in Industry in Vietnamand Climate Friendly Technology.” Presented at the First CTI/IndustryJoint Seminar on Technology Diffusion in Asia, May, Beijing.
Nyoike, P.M., and Okech, B., 1992. “Energy Management in theManufacturing Industry—The Case of Kenya.” In M.R. Bhagavan andS. Karekezi, eds., Energy Management in Africa. London: Zed Books.
Opam M. 1992. “Country Paper on Efficiency and Conservation inEnergy Resource Development: The Ghanaian Experience.” EnergySector Workshop, Abidjan, Côte d’Ivoire.
Organización Latino-americana de Energía. 1998. “Energy-EconomicInformation System (SIEE).” Quito, Ecuador.
OTA (Office of Technology Assessment), U.S. Congress. 1991. Changingby Degrees: Steps to Reduce Greenhouse Gases. OTA-0-482.Washington, D.C.: U.S. Government Printing Office.
———. 1992. Building Energy Efficiency. OTA-E-518. Washington, D.C.:U.S. Government Printing Office.
———. 1993. “Industrial Energy Efficiency.” Washington, D.C.
Ottoboni, and others. 1998. “Efficiency of Destruction of Waste Used inthe Co-incineration in the Rotary Kilns.” Energy Conversion andManagement 39 (16–18): 1899–909.
Padilla, A.M. 1999. “Evaluación del Impacto Eléctrico de ILUMEX.” InProceedings International ILUMEX Seminar. Puerto Vallarta, Mexico.
Patel, M. 1999. “Closing Carbon Cycles. Carbon Use for Materials in theContext of Resource Efficiency and Climate Change.” Dissertation,University of Utrecht, Netherlands.
Phylipsen, D., K. Blok, and Ch. Hendriks. 1999. “A Review of the Stage of Implementation of European Union Policies and Measuresfor CO2 Emission Reduction.” Report no. 98077. University ofUtrecht, Netherlands.
Phylipsen, G.J.M. K Blok, and E. Worrell. 1998. “Handbook on InternationalComparisons of Energy Efficiency in the Manufacturing Industry.”University of Utrecht, Netherlands.
Poland Ministry of Industry. 1990. “Status and Assumptions for FutureDevelopment of the Polish Energy Sector in the Years 1990 to2010.” Warsaw.
President’s Committee of Advisors on Science and Technology. 1999.“Powerful Partnerships: The Federal Role in InternationalCooperation on Energy Innovation.” Washington, D.C.
Radetzki, M. 1991. “USSR Energy Exports Post-perestroika.” EnergyPolicy 19 (4): 291–302.
Raghuraman, V. 1989. “Study Report on Reducing Energy Intensity inSelected Indian Industrial Sectors.”
Ramesohl, S., 1999. “Opening the Black Box—What Can Be Learnedfrom Socio-economic Research for Energy Policy Analysis?” In IEAand U.S. Department of Energy, eds., Proceedings of theInternational Workshop “Technology to Reduce Greenhouse GasEmissions: Engineering-Economic Analysis of Conserved Energyand Carbon.” Washington, D.C.
Rath, U., M. Hartmann, A. Präffcke, and C. Mordziol. 1997. “ClimateProtection by Reducing the Losses of Electrical Motors [inGerman].” Research report 204.08 541 UBA-FB 97-071.Umweltbundesamt, Berlin.
Ravel. 1994. Praxislehrstücke, wie Ausgaben für einen rationellerenStromeinsatz zur lohnenden Investition werden. Bundesamt fürKonjunkturfragen, Bern.
Reddy, A.K. 1991. “Barriers to Improvement in Energy Efficiency.”Energy Policy 19: 953–61.
Reddy, A.K., R.H. Williams, and R.B. Johansson. 1997. Energy AfterRio—Prospects and Challenges. United Nations DevelopmentProgramme, New York.
Refining Processes. 1998. “Flow Diagrams and Summary DescriptionsRepresent Typical Processes Used by Modern Refineries.”Hydrocarbon Processing 77 (11): 53–114L.
Ritt, A. 1997. “Acme Rolls 0.030 Inch Hot Band.” New Steel 13 (5).
Romm, J.J. 1999. Cool Companies—How the Best Businesses BoostProfits and Productivity by Cutting Greenhouse Gas Emissions.London: Earthscan.
Rosemann, H., and H.G. Ellerbrock. 1998. “Milling Technology ofCement Production [in German].” ZKG International 51(2): 51–62.
Rumsey P.R., and T. Flanagan. 1995a. “South East Asian EnergyEfficiency Success Stories, Singapore, Malaysia and Indonesia.”International Institute for Energy Conservation.
———. 1995b. “Standards and Labelling: The Philippines Residential AirConditioning Market.” International Institute for Energy Conservation.
Russian Federation, Ministry of Fuel and Energy. 1998. “Federal TargetProgram ‘Energy Saving in Russia’.” Moscow.
Russian Federation, Ministry of Transport. 1995. “Target Programme‘Fuels and Energy Saving in Transport’ [in Russian].”
SADC (South African Development Cooperation). 1996: “Focus onZambia: Energy Conservation in Zambia.” Energy ManagementNewsletter 1 (4).
———.1997. “Focus on Mozambique: Potential for Energy Conservationin Mozambique.” Energy Management Newsletter 3 (1).
Saha B.B., and T. Kashiwagi. 1997. “Experimental Investigation of anAdvanced Adsorption Refrigeration Cycle.” ASHRAE Trans. 103: 50–57.
Sanstad, A.H., and R.B. Howarth. 1994. “‘Normal’ Markets, MarketImperfections and Energy Efficiency.” Energy Policy 22: 811–18.
Schipper, L. 1997. “Indicators of Energy Use and Efficiency:Understanding the Link Between Energy and Human Activity.”International Energy Agency and Organisation for Economic Co-operation and Development, Paris.
Sheinbaum, C, and L. Ozawa. 1998. “Energy Use and CO2 Emissions forMexico’s Cement Industry.” Energy Policy 23 (9): 725–32.
Sheinbaum, C., and V. Rodríguez. 1997. “Recent Trends in MexicanIndustrial Energy Use and Their Impact on Carbon DioxideEmissions.” Energy Policy 25 (7–9): 825–31.
WORLD ENERGY ASSESSMENT: ENERGY AND THE CHALLENGE OF SUSTAINABILITY
Chapter 6: Energy End-Use Efficiency
217
Sheinbaum, C., S. Meyers, and J. Sathaye. 1994. “TransportationEnergy Used in Mexico.” Lawrence Berkeley National Laboratory.LBL-35919. Berkeley, Calif.
Shimazaki Y., A. Akisawa, and T. Kashiwagi. 1997. “A Model Analysis on the Effects of Energy Cascaded Systems.” Proceedings of the Thermodynamic Analysis and Improvement of Energy Systems, Beijing.
Sinton, J.E., and M.D. Levine. 1994. “Changing Energy Intensity inChinese Industry.” Energy Policy 22: 239–55.
Sinyak, Yu. 1991. “USSR: Energy Efficiency and Prospects.” Energy 16(5): 791–815.
Sioshansi, F.P. 1991. “The Myths and Facts of Energy Efficiency.” EnergyPolicy 19: 231–43.
SNAP (Strategic National Action Plan). 1999. Climate Change ActionPlan Report to the Country Study Programme. Moscow.
Soares, J.A., and R.P. Tabosa. 1996. “Motores Elétricos: Uma AnáliseComparativa de Mercado e Eficiência.” Proceedings: VIICongresso Brasileiro de Energia. Rio de Janeiro, COPPE/UFRJ.
Suzuki Y., K. Ueta, and S. Mori, eds. 1996. Global Environmental Security.Berlin: Springer.
TACIS (Technical Assistance for CIS Countries). 1996. “Development ofEnergy Policy in Georgia.” TACIS/92/EG001. Brussels.
Tanides, C., M. Brugnoni, and G. Dutt. 1996. “Characterisation ofResidential Electricity Use in Argentina and Implications for EnergyConservation Programmes.” Proceedings of the 31st UniversitiesPower Engineering Conference (UPEC 96), Heraklion, Creece.
TAU of SADCC, Energy Sector. 1991. “Experience in Energy Conservation:Zimbabwe Case.” Paper presented at the International Seminar onEnergy in Africa, Abidjan, Côte d’Ivoire.
TERI (Tata Energy Research Institute). 1992. “State of the Art Report onUse of CNG in the Transport Sector.” New Delhi.
———. 1994. “National Programme in Bagasse Based Co-generation.”TERI Energy and Environment Monitor 10 (1).
———. 1996a. “Research on Energy-intensive Industries in India.” New Delhi.
———. 1996b. “Sector Analysis, Aluminium Industry.” Prepared for theEnergy Efficiency Support Project, New Delhi.
———. 1997a. “Capacity Building for Technology Transfer in the Contextof the Climate Change.” New Delhi.
———. 1997b. “Report on Small-scale Brick Industry in India.” New Delhi.
———. 1997c. “Technical Paper on GHG Mitigation/Abatement Options.”New Delhi.
———. 1998. “Action Research Project in Small Scale Foundry Industry.”New Delhi.
———. 1999. TERI Energy Data Directory and Yearbook 1998–99(TEDDY). New Delhi.
TERI (Tata Energy Research Institute), and FAI (Fertilizer Association ofIndia). 1995. “Development of Oil Consumption Norm for theFertilizer Industry.” New Delhi.
TIFAC (Technology Information Forecasting and Assessment Council).1992. “Recommendations on Energy Conservation in CementIndustry.” Government of India, Department of Scientific andIndustrial Research.
Turyareeba, P. 1993. “Mobilizing Local Financial Resources—The Caseof Uganda.” In S. Karekezi and G.A. Mackenzie, eds., EnergyOptions for Africa—Environmentally Sustainable Alternatives.London: Zed Books.
UN (United Nations). 1999. Yearbook of Industrial Statistics, 1999. Vol. II.New York.
UNDP (United Nations Development Programme). 1999. Energy as aTool for Sustainable Development for African, Caribbean andPacific Countries. New York.
UNFCCC (United Nation Framework Convention on ClimateChange).1997. Horticultural Project in Tyumen. Uniform Report onActivities Implemented Jointly Under the Pilot Phase. UNFCCCSecretariat, Bonn.
———. 1998. 1998 Annual Energy Review. Washington, D.C.
Vakulko, A.G., and A.A. Zlobin. 1997. “Energy Saving Measures inElectricity Supply Systems of Industrial Enterprices.” VestnikGlavgosenergonadzora Rossii no.1, Moscow.
Valdes-Arrieta, F. 1993. “Saving Energy in Chile: an Assessment ofEnergy Use and Potential Efficiency Improvements.” InternationalInstitute for Energy Conservation, Santiago, Chile.
Vargas Nieto, E. 1999. “ILUMEX Project: A General Vision.” In ProceedingsInternational ILUMEX Seminar. Puerto Vallarta, Mexico.
Varone, F. 1998. “Le choix des instruments des politiques publiques.Une analyse comarée des politique d’efficience énergétique duCanada, du Danmark, des Etats-Unis, de la Suède et de la Suisse.”Editions Paul Haupt. Bern, Switzerland.
Varone, F., and B. Aebischer. 1999. “From National Policies to GlobalMarket Transformation: The Challenges of (International) PolicyDesign.” In Proceedings of the 1999 ECEEE Summer Study“Energy Efficiency and CO2 Reduction: The Dimensions of theSocial Challenge” Paris: ADEME Editions.
Vasiliev, A., and others. 1998. “Improvements of Tariffs Regulations atEnd-users Energy Markets.” Energomeneger (11): 12–14 [in Russian].
VDEW (German Electricity Utility Association). 1997. “Stromversorgerrüsten sich für den Wettbewerb.” Stromthemen 7: 1–2.
Velthuijsen, J.W. 1995. “Determinants of Investment in EnergyConservation.” SEO, University of Amsterdam, Netherlands.
Wanwacharakul V. 1993. “Reducing CO2 Emission in Thailand.” QuarterlyEnvironmental Journal, Thailand Environment Institute 1 (1): 50–65.
WBCSD (World Business Council for Sustainable Development). 1996.“Eco-efficient Leadership for Improved Economic and EnvironmentalPerformance.” Geneva.
WBNSS (World Bank National Strategy Study). 1999. “Study on RussianNational Strategy of Greenhouse Gas Emissions Reduction.” Task 4. Moscow.
Wereko-Brobby C. 1993. “Innovative Energy Policy Instruments andInstitutional Reform—The Case of Ghana.” In S. Karekezi and G.A.Mackenzie, eds., Energy Options for Africa—EnvironmentallySustainable Alternatives. London: Zed Books.
Werling, E., J. Hall, and D. Meseigeier. 1998. “Lessons Learned in theENERGY STAR Homes Program.” In Proceedings of the ACEEESummer Study on Energy Efficiency in Buildings. Asilomar, Calif.:American Council for an Energy-Efficient Economy.
Wirtschaftvereinigung Stahl. 1998. Statistical Yearbooks of the SteelIndustry [in German].
World Bank. 1989. Sub-Saharan Africa: From Crisis to Sustainable Growth.Washington, D.C.
———. 1993. “Energy Efficiency and Conservation in the DevelopingWorld. The World Bank’s Role.” Policy Paper, Washington, D.C.
———. 1996. Georgia: Energy Sector Review. Washington, D.C.
Worrell, E., N. Martin, and L. Price. 1999. “Energy Efficiency and CarbonEmissions Reduction Opportunities in the U.S. Iron and SteelIndustry.” Lawrence Berkeley National Laboratory, LBNL-41724.Berkeley, Calif.
Yakowitz, H. and R. Hanmer. 1993. “Policy Options—EncouragingCleaner Production in the 1990s.” In: T. Jackson, ed., CleanProduction Strategies. Boca Raton, Fla.: Lewis Publishers.
Ziesing, H.-J., and others. 1999. “Scenarios and Measures for MitigatingCO2-Emissions in Germany until 2005.” In G. Stein and B. Strobel,eds., Policy Scenarios for Climate Protection [in German].Forschungszentrum Jülich, Germany.
Related Documents