('' '' •OFFICE OF NAVAL RESEARCH ___ Contract No. N00014-91-J-1409 N _ Technical Report No. 151 Charge-Induced (1 x 3) Reconstruction of Au(ll0): Mechanistic Insights from Potentiodynamic Scanning Tunneling Microscopy in Alkali Iodide Electrolytes by Xiaoping Gao and Michael J. Weaver Prepared for Publication in D IC Surface Science LEMAR 10 19 94-07822 L) Department of Chemistry Purdue University West Lafayette, Indiana 47907-1393 February 1994 Reproduction in whole, or in part, is permitted for any purpose of the United States Government. * This document has been approved for public release and sale; its distribution is unlimited. • 3 • 7ý

Welcome message from author
This document is posted to help you gain knowledge. Please leave a comment to let me know what you think about it! Share it to your friends and learn new things together.
Transcript

(''
'' •OFFICE OF NAVAL RESEARCH
___ Contract No. N00014-91-J-1409
N _ Technical Report No. 151
Charge-Induced (1 x 3) Reconstruction of Au(ll0):
Mechanistic Insights from Potentiodynamic
Scanning Tunneling Microscopy in Alkali Iodide Electrolytes
by
Xiaoping Gao and Michael J. Weaver
Prepared for Publication
in D ICSurface Science LEMAR 10 19
94-07822 L)Department of Chemistry
Purdue University
West Lafayette, Indiana 47907-1393
February 1994
Reproduction in whole, or in part, is permitted for any purpose of the UnitedStates Government.
* This document has been approved for public release and sale; its distributionis unlimited.
• 3 • 7ý
ABSTRACT
The nature of the local atomic-level and nanoscale structural changes
associated with the charge-induced (1 x 3) reconstruction on Au(ll0) in alkali
iodide electrolytes is explored by means of potentiodynamic scanning tunneling
microscopy, i.e., with STM images obtained during electrode potential excursions
where the surface transformations are triggered on a suitable (seconds)
timescale. In potassium iodide electrolyte, the usual "three-missing-row" (1 x
3) structure is seen to be generated by single gold atomic-row segments shifting
both across and along the (110) direction. In cesium iodide, however, at least
two spatially as well as potentiodynamically resolvable steps were observed,
involving the intermediate local formation of "one-missing-row" (I x 3) domains
by removal of one-third of the top layer gold rows onto nearby terrace regions.
Domains having (1 x 2) symmetry were also discerned. A subsequent transformation
into the final "three-missing-row" (I. x 3) structure is achieved by aggregation
of the displaced monoatomic row segments. The mechanistic value of following
atomic-level reconstruction processes by such coupled electrochemical-STM tactics
is illustrated by these findings.,
0ACos~ion For
I � ___t _ - - -__ _ I_ IDTIC Tj,, -],
'Dist•",bt•¢n

1
1. INTRODUCTION
Understanding the manner by which Lurface reconstruction occurs, as well
as the equilibrium structures that form, is in most cases inadequately
understood. Scanning tunneling microscopy (STM), however, is having a major
impact on these issues, exploiting the remarkable ability of the technique to
ascertain real-space local structures down to the atomic level[l]. ln addition
to metal surfaces in ultrahigh vacuum (uhv), high-quality atomic-level STM data
is now obtainable at monocrystalline metal-solution interfaces[2]. Besides the
intrinsic importance of such electrochemical interfaces, an additional external
means of structural (arid kinetic) control is available in the form of the
electrode potential. A number of recent studies using in-situ STM[3-I0] and also
X-ray scattering (SXRS) [11-14] have shown in remarkable detail the nature of the
reconstructions that can be formed and removed at low-index gold surfaces in
aqueous media in the presence of negative and positive electronic charges,
respectively, induced by altering the electrode potential. Related phenomena
have also been observed for some stepped gold surfaces[15]. Significantly, this
sensitivity of the surface metal structure to the electrode potential can yield
detailed insight into the surface morphological changes attending the formation
and removal of the reconstruction. A particularly useful tactic, which has been
dubbed 'potentiodynamic" STM, involves acquiring sequences of images during (or
immediately following) potential sweeps and steps[9,10., This can enable the
extraction of real-time/-space information on the reconstruction mechanisms.
A surface which has attracted particular attention with regard to surface
reconstruction in electrochemical[5,7,13,15) as well as uhv environments is
Au(ll0) (see refs. 16 and 17 for an introduction to the extensive uhv
literature). While the clean surface in uhv forms a stable (1 x 2) "missing-row"
phase, (1 x 3) and even higher-crder reconstructions are produced in the presence

2
of alkali-metal adsorption[17-19]. A similar (1 x 3) "three-missing-row"
("facetted") reconstruction[20,21) has been observed for Au(ll0) at negative
charges in aqueous alkali halide electrolytes[13), whereas predominantly (1 x 2)
domains are formed in weakly (or non-) adsorbing aqueous media[5,7,15b].
We report here potentiodynamic STM data obtained on Au(llO) in alkali
iodide electrolytes, primarily under cyclic voltammetric conditions. The
presence of adsorbed iodide yields a uniform (1 x 1) (i.e., reconstructed) phase
at positive electronic charge densities. The addition of negative charge (i.e.,
sweeping the electrode potential more negative) induces a phase transition
yielding a (1 x 3) structure. In cesium iodide electrolyte, however, the
transition is seen to occur in several resolvable steps. The local structural
"'hanges associated with these steps, which are readily discernable by STM,
provide mechanistic insight which may have more general implications.
2. EXPERIMENTAL
The experimental details for in-situ STM are described elsewhere[2,7]. The
microscope is a Nanoscope Ii (Digital Instruments) with a bipotentiostat for
electrochemical STM. The Au(llO) single crystal (hemisphere, 5 mm diameter) was
flame annealed, cooled partly in air and then in ultrapure water, and transferred
immediately to the STM cell. The STM tip was an electrochemically etched
tungsten wire. Most STM images were obtained in the "constant-current" mode, and
are shown here in unfiltered form. The voltammetric data were obtained in a
conventional (nitrogen-puiged) electrochemical cell. While comparable results
could also be observed in the STM cell, the voltammetric features at negative
potentials tend to be masked by faradaic currents for oxygen reduction. All
electrode potentials are reported here versus the saturated calomel electrode
(SCE).

3
3. RESULTS AND DISCUSSION
Figure 1 shows a pair of typical cyclic voltammograms obtained for ordered
Au(ll0) under conditions that are similar to those emplured for the present STM
results. The upper voltammograr was obtained at 10 mV s-I in 50 mM KCIO4 + 5 mM
KI. As detailed elsewhere[22], the cation-sensitive voltammetric features
observed over the electrode potential range shown, -0.25 to -1.2 V vs. SCE, are
indicative of marked potential-induced alterations in the intarfacial structure
and composition. (Additional, cation-insensitive, transitions are also evident
at higher potentials[22].) The current spikes marked c/c' and surrounding
features arise from the reversible removal/formation of ordered coadsorbed alkali
iodide adlayers[22].
Of particular interest here are the voltammetric peaks labelled b/b' in
Fig. 1. As discerned from the STM data and by analogy with related systems such
as Au(lO0)-I-[l0,23], these features are associated with the removal and
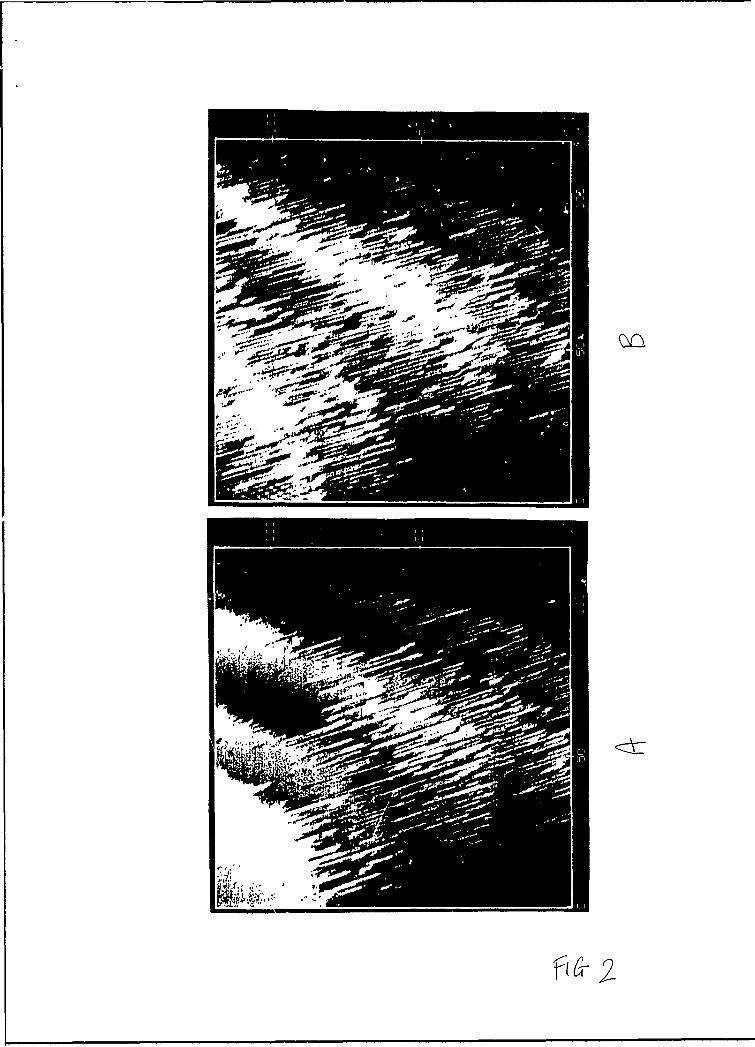
formation, respectively, of Au(l!0) reconstruction. Figures 2A and B show two
images obtained during a potentiodynamic STM sequence under conditions similar
to Fig. 1A, for A'tll0) in 10 mM KI at 10 mV s-1 from -0.45 to -0.85 V and
return. The first image was obtained while the potential was swept between -0.6
to -0.8 V. Since the image as shown was obtained by downward rastering
(consuming 20 s), the y.-axis can be considered to be a (downward-pointing) linear
scale of electrode potential and time.
Close inspection of the STM data (Fig. 2A) in conjunction with the
corresponding voltammetric segment in Fig. 1A, reveals that the reconstruction
is initially discernable about a quarter of the way down the image, at about
-0.65 V, corresponding to the foot of the voltammetric feature marked b'. The
reconstruction appears as arrays of bright strings parallel to the (110)
direction, initially spreading out preferentially from the semi-circular terrace

4
edges evident in Fig. 1A, thereby forming extended kinks. These bright strings
each consist of individual gold atomic rows added to the initialLy (I x 1)
terrace. The source of these atoms appears to be partly the highest (top)
terrace, and also the adjacent lower terrace as evidenced from the occurrence of
nearby missing rows. By the time the twin voltam etric peaks labelled b' in Fig.
1A are reached, at -0.7 to -0.75 V (corresponding to one-half to three-quarters
down Fig. 2A), at least local areas of densely packed strings are seen yielding
mostly (1 x 3) patterns. In addition to these "bright" added-row regions, nearby
areas containing periodic missing rows are evident from the STM z-corrugations,
which also approximate (1 x 3) symmetry.
Figure 2B shows the next STM image, now obtained by rastering the tip back
upwards while the potential was swept from -0.8 to -0.85 V and back to -0.7 V.
Most of the imaged region, encompassing the same five terrace domains a, in Fig.
2B, is now seen to have been transformed into largely uniform (I x 3) regions,
with z-corrugations consistent with the usual three-missing-row strtcture (vide
infra). Subscquent STM images show that the (1 x 3) structure reverts clearly
to the (1 x 1) arrangement during traversal of the voltammetric peak b,
Substantially different behavior, however, was observed in similar
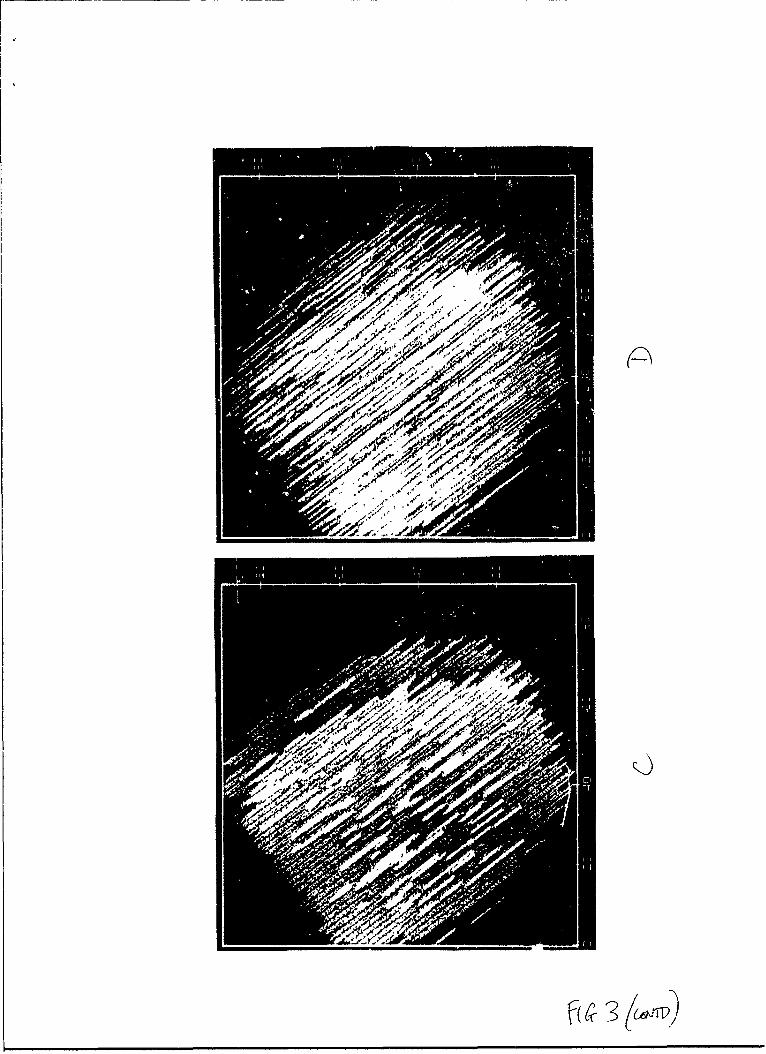
potentiodynamic STM images gathered for Au(lll) in CsI electrolytes. Figrc 3A-F
displays such an image sequence obtained in 10 mM CsI, during 5 mV s-1 potential
excursion from -0.5 to -0.95 V and return, arranged so to span the region wnre
the voltammetric features bl, b2/b', b', b' are located (Fig. IB). The fir.,t
image (A), obtained while holding the potential at -0.5 V, shows a large (ca 80
x 20 nm) terrace, surrounded by several lower terraces. Although not discernable
at the magnification used here, a uniform (1 x 1) domain is present, the (1i0)
direction running diagonally from the lower right-hand to the top left-hand
corner of the image. The next, upward-rastered, image (Fig. 3B), was acquired

5
while the potential was swept negative from -0.55 to -0.65 V at 5 mV s-1.
Comparison between Fig. 3A and B shows that formed in the latter are arrays
of small (ca 4 by 10 A) holes, about 1.5 A (i.e. one-atom) deep, populated
throughout the terraces. These features appear similar to those observed in the
early stage of the K-induced reconstruction of Cu(1l0) in uhv[24]. Towards the
top of Fig 3B (i.e., approaching -0.65 V, at the foot of wave b' in Fig. 1B), and
especially close to the terrace edges, a (1 x 3) reconstruction becomes evident.
The next, downward-rastered, image (Fig. 3C), was obtained during the ensuing
potential-sweep segment from -0.65 to -0.75 V. This potential sector corresponds
to the voltammetric region between b' and b' at the 5 mV s- sweep-rate employed.
EvLIent in FI. 3C is a uniform (1 x 3) reconstruction pattern throughout the
terraces, of the type 3een to be initiated in the upper region of the preceding
image (A).
Detailed examination of the reconstruction pro-rile from the STM images,
however, indicates that the nature of this (1 X 3) reconstruction is quite
different from the type seen to be generated in the KI electrolyte (Fig. 2). The
latter exhibits a symmetric "v-shaped" z x profile across the (110) direction,
with a ca 2 A corrugation between the monoatomic rails, corresponding to the
common "three-missing-iow" structure (vide infra). The (1 x 3) reconstruction
seen in Fig. 3C, however, consists of pairs of adjacent (110) monoatomic "rails",
each separated by a single missing row. This is shown more clearly in the "blow-
up" image of a portion of Fig. 3C, shown in Fig. 4A. A typical z-x corrugation
profile (along the straight line marked on Fig. 4A) is shown in the top left-hand
segment of Fig. 5. The matching ball model is shown on the top right-hand side:
this has been termed the "one-missing-row" (1 x 3) structure[20,21]. An atomic-
resolution image showing this paired-row arrangement is given in Fig. 4B. While
(1 x 1) regions dominate the center region, (I x 3) segmwnts are seen towards the
6
right-hand side, Such images confirm that the top-layer ordered rows consist of
gold, rather than cesium and/or iodide, based on the measured interatomic
distance (2.9 ± 0.1 A).
This alternate (1 x 3) structure is rarely seen, although it has been
observed by STM to form upon during higher K coverages on Cu(ll0) in uhv[24].
The one-missing-row structure is nonetheless quite stable in the present case,
remaining prevalent when the potential is held within the range ca -0.65 to -0.75
V for at least 30 min. Interestingly, the fate of the missing one-third row
atoms is clearly evident in Fig. 3C: they are shifted so to form single- and
double-atomic string segments on top of the (I x 3) lattice; appearing as bright
rows in Fig. 3C. (The bright strings are largely absent close to the terrace
edges. The excess atoms have been incorporated into the steps, as indicated
clearly from the increased size of the largest terrace evident upon comparing
Fig. 3A and C.)
Further structural changes are seen in the next, upward-rastered, image
(Fig. 3D), corresponding to a potential sweep from -0,75 V to -0.85 V (i.e.
straddling the voltammetric peak b'Z and an additional "satellite" peak, b' 3,
appearing at slightly more negative potentials). A markedly increased density
of bright (adlayer) strings is evident, along with the formation of surrounding
(I x 2) corrugated regions., A higher-magnification reproduction of a portion of
Fig. 3D showing the (1 x 2) regions is displayed in Fig. 4C. A z-x profile
obtained along the line marked in Fig. 4C is shown in Fig. 5 (left-middle), shown
alongside the ball model for the (1 x 2) "missing-row" structure. The close
relationship between the (I x 2) and (1 x 3) one-missing-row structures is
evident in Fig, 5; production of the former provides an additional source of the
"added-row" atomic strings.
This conversion process continues at higher potentials, at -0.85 to -0.95
7
V, until a nearly uniform array of the adlayer strings is formed (Fig. 3E), now
exhibiting (I x 3) symmetry of the "three-missing-row" type. This final
reconstructed form is similar to that produced in KI electrolytes (Fig. 2). A
typical z-x plot culled from Fig. 3E is included in Fig. 5 (lower), alongside the
corresponding oall-model structure. Interestingly, the magnitude of the ordered
z-x STM corrugation for this structure, as well as the other two mooels shown in
Fig. 5 matches well with the predicted ball models, especially when the
anticipated occurrence of surface relaxation[25] is considered. A high-quality
atomic-resolution image of the symmetrical (1 x 3) structure is given in Fig. 4D.
This example was obtained in 0.1 M HC1O 4 (at -0.4 V); images exhibiting such
atomic detail are very difficult to obtain at the larger negative electrode
potential required to trigger reconstruction in the iodide electrolytes. Evident
in Fig. 4L is indeed an x-y surface relaxation whereby the gold rows adjacent to
the center top strings are displaced outwards, by 0.6(± 0.2) A.
The last image shown in this potentiodynamic STM sequence, Fig., 3F, was
obtained by downward rastering while the potential was swept from -0.6 to -0.5
V. The early (i,e., upper) portion of this image shows the presence of the one-
missing-row (1 x 3) structure giving way to an unreconstructed smooth terrace
once the voltam etric peak b, (Fig, 1B) has been traversed. Comparison of the
first and last images in this sequence (Fig. 3A and F, respecti-'ely), illustrates
that the sequential potential-induced formation and removal of the recoilstruction
incurs substantial changes in the terrace-edge morphology. This confirms the
occurrence of substantial nanoscale mass traný-port. Also note the presence of
"island strands" of gold seen atop the large terrace in Fig. 3F; these, hl'wevel,
are dissipaced with 1-2 min.
The present findings therefore demonstrate that the formation of the (1 x
3) reconstruction in alkali halide media is not only sensitive to the nature of

8
the cation, but also that spatially as well a- potentiodynamically distinct steps
can be resolved in the Cs' electrolyte. This cation sensitivity is undoubtedly
connected with the specific adsorption of cesium known to occur on Au(ll0) under
these conditions[22]. One therefore might be tempted to draw a close analogy
with the alkali metal-induced (1 x 3) reconstruction seen for (110) surfaces in
uhv[17-19]. Aside from the presence of iodide, however, the electrochemical
system differs from its uhv counterpart in that the negative charge triggering
the reconstruction for the former is inserted electronically (from the
potentiostat), the cesium ions acting as a double-layer countercharge. (This
charging is evident directly from the nonfaradaic voltammetric response which
constitutes the b/b' peaks in Fig. 1.) For the uhv system, the alkali metal
dosed onto the surface acts itself as the electron source.
Most importantly, the ability to control and vary sensitively the surface
electronic charge during sequential STM imaging in tha electrochemicaL system
reveals significant new detail concerning the real-space transformations leading
to the final (1 x 3) reconstruction. The mechanism followed to form the three-
missing-row structure, at least for the cesium electrolyte, does not involve
merely short-range row shifting as might be expected given that this structure
contains the same net gold atomic density as the (1 x 1) surface. Rather, the
route chosen by the system is distinctly more elegant, involving an intermediate
production of the "one-missing-row" (1 x 3) structure, the displaced rows (one-
third of the original top layer atoms) themselves forming nearby (1 x 3) segments
that eventually envelope the entire surface, yielding the familiar "three-
missing-row" pattern.

9
Acknowledgments
We thank Greg Edens for obtaining the cyclic voltammograms and Antoinette
Hamelin for preparing the Au(ll0) crystal. This work is su:jpported1 by the Office
of Naval Research and the National Science Foundation.
References
1) J. Wintterlin and R.J. Behm, in "Scanning Tunneling Microscopy I", Springer
Series in Surface Sciences, Vol. 20, H-J. G(ntherodt and R. Wiesendanger,
eds., Springer-Verlag, Berlin, 1992, Chapter 4.
2) M.J. Weaver and X. Gao, Ann. Rev. Phys. Chem., 44 (1993), 459.
3) (a) X. Gao, A. Hamelin, and M.J. Weaver, Phys. Rev. Lett., 67 (1991), 618;
(b) X. Gao, A., Hamelin, and M.J. Weaver, Phys. Rev. B, 46 (1992), 7096; (c)
X. Gao and M.J. Weaver, Ber. Bunsenges Phys. Chem., 97 (1993), 507.
4) X. Gao, A. Hamelin, and M.J. Weaver, J. Chem, Phys., 95 k1991), 6993.
5) X. Gao, A. Hamelin, and M.J. Weaver, Phys. Rev. B., 44 (1991), 10983.
6) (a) N.J. Tao and S.M. Lindsay, J. Appl. Phys., 70 (1991), 5141; (b) N.J.
Tao and S.M. Lindsay, Surf. Sci., 274 (1992), L546.
7) O.M. Magnussen, J. Wiechers, and R.J, Behm, Surf., Sci., 289 (1993), 139.
8) O.M. Magnussen, J. Hotlos, R.J. Behhm, N. Batina, and D.M. Kolb, Surf. Sci.,
296 (1993), 310.
9) X. Gao, G.J. Edens, A. Hamelin, and M.J. Weaver, Surf. Sci., 296 (1993),
333.
10) X. Gao and M.J. Weaver, J. Phys. Chem., 97 (1993), 8685
11) B.M. Ocko, J. Wang, A. Davenport, and H. Isaacs, Phys. Rev, Lett., 65
(1990), 1466.
12) J. Wang, B.M. Ocko, A. Davenport, and H. Isaacs, Phys. Rev. B., :6 (1992),
10321.
13) B.M. Ocko, G. Helgensen, B. Scbardt, J. Wang, and A. Hamelin, Phys. Rev.
Lett., j9 (1992), 3350.

10
14) I.M. Tidswell, N.M. Markovic, C.A. Lucas, and P.N. Ross, Phys. Rev. B, 47
(1993), 16542.
15) (a) X. Gao, A. Hamelin, and N.J. Weaver, Surf. Sci., 274 (1992), L58S; (b)
X. Gao, G.J. Edens, A. Hamelin, and M.J. Weaver, Surf. Sci., submitted.
16) T. Gritsch, D, Coulman, R.J. Behm, and G. Ertl, Surf. Sci., 257 (1991),
297.
17) D.K. Flynn-Sanders, H.D. Jamison, J.V. Barth, J. Wintterlin, P.A. Thiel,
G. Ertl, and R.J. Behm, Surf. Sci., 253 (1991), 270.
18) R.J. Behm, D.K. Flynn, K.D. Jamison, G. Ertl, and P.A. Thiel, Phys. Rev.
B, 36 (1987), 9267.
19) P. Haberle, P. Fenter, and T. Gustafsson, Phys. Rev. B, 39 (1989), 5810.
20) F. Masson and J.W. Rabalais, Surf. Sci., 253 (1991), 258.
21) P.A. Thiel and P.J. Estrup, in "CRC Handbook of Surface Imaging and
Visualization", A.T. Hubbard, ed., CRC Press, in press.
22) X. Gao and M.J. Weaver, J. Phys. Chem., submitted.
23) X. Gao, G.J. Edens, F-C. Liu, and M.J. Weaver, in preparation.
24) R. Schuster, J.V. Barth, G. Ertl, and R.J. Behm, Surf. Sci., 247 (1991),
L229.
25) I.K. Robinson, P.J. Eng, C. Romainczyk, and K. Kern, Phys. Rev. B, 47
(1993), 10700.
11
FIGURE CAPTIONS
Figure 1
Typical cyclic voltammograms, showing region whe, "urface reconstruction occurs,
for Au(ll0) in
A) 50 mM KClO 4 + 5 mM KI (at 10 mV s-1);
B) 50 mM CsC1O4 + 5 mM CsI (at 5 mV s-1).
Figure 2
Large-scale potentiodynamic STM images for Au(ll0) in 10 mM KI obtained during
initially negative-going 10 mV s-1 potential sweep. A) Downward-rastered image,
during sweep from -0.6 to -0.8 V vs. SCE; B) Upward-rastered image, from -0.8 to
-0.85 V and return to -0.7 V.
Figure 3
Sequence of large-scale potentiodynamic STM images for Au(ll0) in 10 mM CsI
obtained during 5 mV s-1 potential sweep from -0.45 V to -0.85 V and return.
Electrode potential, tip-rastering conditions as follows' A) -0.5 V (fixed
potential); B) -0.55 to -0.65 V, upward raster; C) -0.65 to -0.75 V, downward
raster; D) -0.75 to -0.85 V, upward raster; E) -0.85 to -0.95 V, downward raster;
F) -0.6 to -0.5 V, downward raster.
Figure 4
Higher-magnification STM images showing various atomic-level details of Au(ll0)
reconstruction patterns. A) "Blow-up" of upper left-hand region of Fig. 3C,
showing one-missing-row structural pattern; B) Height-shaded atomic-resolution
image, showing one-missing-row structure (right-hand region) and adjacent (1 x
1) domains; C) "Blow-up" of lower-portion of Fig. 3D, showing (1 x 2) missing row
regions; D) Detailed atomic-resolution image (constant-height mode) for Au(ll0)
in 0.1 M HCIO4 at -0.4 V, showing relaxed three-missing-row (1 x 3) structure.
Straight-line segments drawn on A and C denote directions used to generate z-x
profile plots shown in Fig. 5.

12
Figure 5
Z-corrugation profiles (z-x plots) along direction periodic to (110), obtained
from STM images in Fig. 4 in comparison with schematic ball models for (1 x 3)
one-missing-row, (1 x 2) missing row, and (1 x 3) three-missing-row
reconstructions observed for Au(1l0). Top two z-x profiles refer to line
segments drawn in Figs. 4A and C, respectively.
NOTE TO PRINTER:
IF POSSIBLE, PLEASE PLACE THE FIGURE 3 AND FIGURE 4 SET OF SIX AND FOUR IMAGES,
RESPECTIVELY, AS -CLUSTERS" -
FIGURE 3 FIGURE 4
A B A B
C D C D
E F
THANKS!

AT j ,.Acm-2 b c
2.L Acw? b
a
al
C
b
I i I
-1.0 -0.5E/V vs SCE
C
-;:A be

- 4t7N
Fgi
44

AV, ~
Vs3


C

(Ix3) one missing row structure
(Wx2) missing row structure
(W3) three missing row structure
j2ASide view of three possible
reconstruction models
5I ,.0I -0 50 100 A
Related Documents