INTERNATIONAL JOURNAL ON SMART SENSING AND INTELLIGENT SYSTEMS VOL. 7, NO. 4, DECEMBER 2014
1736
ZIGBEE TRANSMISSION POWER DYNAMIC ADJUSTMENT
SYSTEM BASED ON FUZZY CONTROL
Zhonghu Yuan, Wenwu Hua and Xiaowei Han
College of Information Engineering,
Shenyang University, SYU, Shenyang, China
Emails: [email protected], [email protected], [email protected]
Submitted: July 16, 2014 Accepted: Nov. 2, 2014 Published: Dec. 1, 2014
Abstract-We designed a fuzzy controller for ZigBee equipment’s transmission power adaptive
adjustment. The controller is based on RSSI (Received Signal Strength Indicator). It can make a
dynamic adjustment on the transmitted power according to the fuzzy control rules. The fuzzy control is
suitable to solve the problem which is difficult to deal with in building system mathematical model.
What’s more, the fuzzy control system has perfect performance in response speed and antijamming
capability. It’s convenient to embed in devices. In this paper we use Ti Company’s CC2530 chip as an
experiment object. By using the fuzzy controller we keep the transmission power to the minimum. By
this way, the energy consumption can be reduced on the premise of ensuring normal communication.
The fuzzy controller system has a good steady-state and dynamic performance, and contributes to the
ZigBee system’s stability and low power consumption performance.
Index terms: fuzzy control, ZigBee, RSS, CC2530, low power consumption
Zhonghu Yuan, Wenwu Hua and Xiaowei Han, ZIGBEE TRANSMISSION POWER DYNAMIC ADJUSTMENT SYSTEM BASED ON FUZZY CONTROL
1737
I. INTRODUCTION
ZigBee is a low power personal area network (PAN) protocol based on the IEEE 802.15.4
standard. The technology according to this technical agreement is a wireless communication
technology of low power consumption. It has features such as short distance, low complexity,
self-organization, low power consumption, low transfer rate and low cost [1-3].It can be
embedded into a variety of devices and suitable for automatic control, remote control,
environmental monitoring and other fields [4].
ZigBee devices have three work modes called transmit, receive and sleep. Generally, the ZigBee
device will enter into the sleep mode during its free time to meet the purpose of reducing
consumption [5]. The transmit mode has the largest power consumption. In order to ensure the
transmission quality the ZigBee protocol using the maximum power as default sets. But for nodes
with small distance, using small transmission power is enough to ensure good communication
quality. So we can control the transmission power and keep it to the minimum transmission
power which can ensure normal communication. By using this system, we can get less power
consumption [6].
Most of researches on this subject are to make a set according to distance or the RSSI’s statistic
at the network organization time. These strategies can achieve good performance on condition
that the distribution of the nodes is invariable. However, in case that the node is moved or
network topology is changed during the network is running, the network won’t adjust the
transmission power immediately. In these cases, the performance of the nodes will go down and
unexpected network off-line maybe occurred for worse [7] [8]. Some researches implement the
dynamic adjustment of power by running an algorithm on the ZigBee devices which need to be
adjusted. In consideration of ZigBee devices’ limited computing resources and difficult to
establish accurate mathematics model, these methods need to solve two key problems. One is that
how to keep the balance between algorithm performance and computing resource consumption.
The other is that how to establish or avoid establishing accurate mathematics model [9] [10].
This paper uses the fuzzy control algorithm, so we do not need to establish accurate mathematical
model. By building a fuzzy controller and using the controller I/O table, the ZigBee devices can
avoid the huge computational cost which has been done during the fuzzy controller’s design time.
INTERNATIONAL JOURNAL ON SMART SENSING AND INTELLIGENT SYSTEMS VOL. 7, NO. 4, DECEMBER 2014
1738
II. COMPOSITION OF TRANSMISSION POWER CONTROL SYSTEM
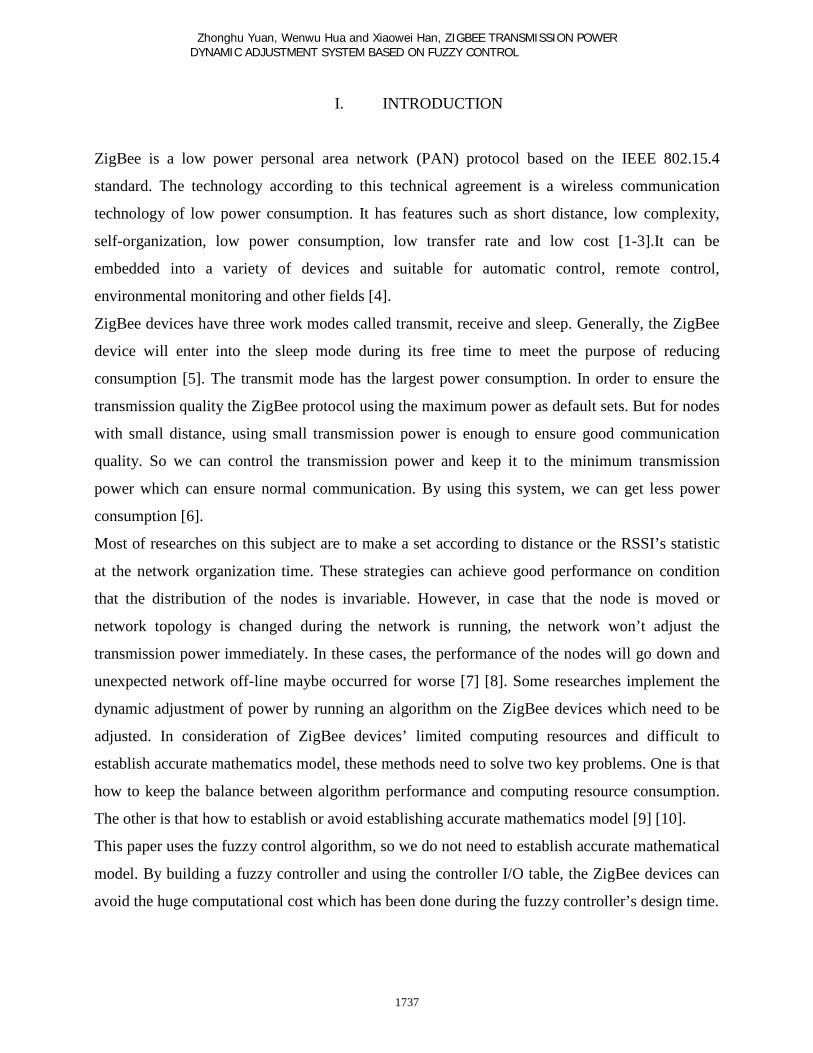
A typical ZigBee network topology is shown in figure 1[4]. To ensure maximum network
coverage, the network’s Coordinator and Router’s transmission power has been set to +4.5dB
which is the maximum value (The value may have differences due to different chips and antennas,
the +4.5dB is for CC2530)
Figure 1. A typical mesh network
The control system is used to regulate the End Device’s transmission power to keep it as small as
possible on the premise of ensuring normal communication. In other words, we must keep the
End Device’s signal strength similar to the receiving sensitivity’s, when its signal arrives at the
receiver (The upper Router).
Fuzzy controller End Device
RSSI value
+
-R Ce P
Upper Router
Figure 2. The control system structure diagram
The control system structure is shown in figure 2[12].
The legend:The C is the received signal strength that comes back from its upper Router. C’s
value (It is the actual RSSI value) is the control system’s negative feedback input;
The R is the given RSSI value which is the RSSI value corresponding to the receiver sensitivity.
To ensure the communication quality, R is the RSSI value corresponding to the maximum

Zhonghu Yuan, Wenwu Hua and Xiaowei Han, ZIGBEE TRANSMISSION POWER DYNAMIC ADJUSTMENT SYSTEM BASED ON FUZZY CONTROL
1739
sensitivity. For chip CC2530, the receiving sensitivity characteristic value is -97 dB and the
maximum sensitivity value is -88 dB. So R is -88dB;
The e is the deviation between the actual RSSI value and the given RSSI value R;
The P is the transmission power value that has been calculated and ready to take effect. The P is
used to control the End Devices’ transmission power. The End Devices make the P to take effect
by calling interface function macRadioSetTxPower( uint8 txPower ) [4].
In the system, we can reach the target of keeping the End Device’s signal strength similar to
given RSSI value R by building an appropriate fuzzy controller.
III. DESIGN OF FUZZY CONTROLLER
a. Description of Fuzzy Control Strategy
As the End Devices’ link conditions are different and their distances to Router are also different,
the RSSI values of different signals received by Router are different from each other [9].
The specific control strategy is as follows. The condition in which RSSI value is greater than R (e
is a negative number) indicates that the End Device’s signal strength is strong and we can reduce
the transmission power appropriately. The condition in which RSSI value is smaller than R (e is a
positive number) indicates that the End Device’s signal strength is weak and we can increase the
transmission power appropriately. Meanwhile, on condition that e is a negative number, the
smaller the e is, the larger the decreasing amplitude of the transmission power is. On condition
that e is a positive number, the bigger the e is, the larger the increasing amplitude of the
transmission power is [11].
b. Composition of the Fuzzy Controller
The controller’s output is the transmission power value which is ready to take effect. The output
of the controller is determined by the given RSSI value, the actual RSSI value and the current
transmission power. The three variables are marked with 0u , 1u and u . The controller’s output is
marked with y They have function relation 0 1( , ( ))y f u u u= − .
The function ( )0 1, ( )f u u u− has described a two-dimensional fuzzy controller with input
variables u and 0 1( )u u− . The variable 0u is shown as R in figure 2, and 0 88u dB= − . The
variable 0 1( )u u− is shown as e in figure 2. Then, the calculated transmission power value
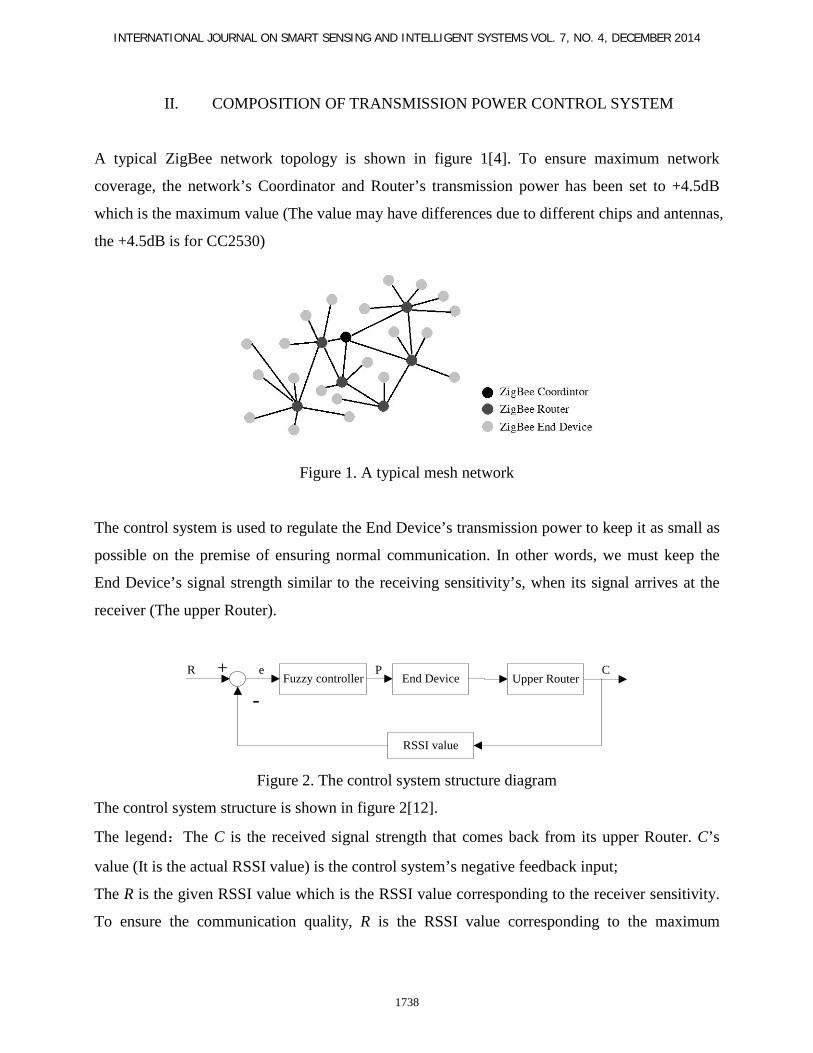
( , )y f u e= is shown as P in figure 2. The fuzzy controller structure is shown in figure 3.
INTERNATIONAL JOURNAL ON SMART SENSING AND INTELLIGENT SYSTEMS VOL. 7, NO. 4, DECEMBER 2014
1740
Fuzzy reasoning Defuzzification
Knowledge base
FuzzificationInput Output
Figure 3. The fuzzy controller structure diagram
The current transmission power u can be acquired by reading register value from the signal
transmission power register. The corresponding relation between register values and the actual
transmission power is shown as table 1.
Table 1. The lookup table of the actual transmission power from transmission power registers
value
Register value Actual transmission power (dB) Current(mA)
0xF5 4.5 34
0xE5 2.5 31
0xD5 1 29
0xC5 –0.5 28
0xB5 –1.5 27
0xA5 –3 27
0x95 –4 26
0x85 –6 26
0x75 –8 25
0x65 –10 25
0x55 –12 25
0x45 –14 25
0x35 –16 25
0x25 –18 24
0x15 –20 24
0x05 –22 23
Zhonghu Yuan, Wenwu Hua and Xiaowei Han, ZIGBEE TRANSMISSION POWER DYNAMIC ADJUSTMENT SYSTEM BASED ON FUZZY CONTROL
1741
The controller’s working process is as follows. First the fuzzy controller executes fuzzification
process of the input variables u and e . Then, the controller will calculate fuzzy output variable in
accordance with the fuzzy rules in the knowledge base. Finally, the fuzzy controller executes
defuzzification process of the fuzzy output variable to get accurate output variable y . After that,
the y will be set as the transmission power.
c. Fuzzification Process
After experiment, we got that 1 [ 101, 41]u ∈ − − for ZigBee Device with CC2530 core. So, there is
[ ]47,13e∈ − as 0 1( )e u u= − . After the linear transformation for e, we got the universe of
discourse [ 6,2]E = − follow the transformation formula (1). Similar to e, it signed the U as the
universe of discourse of the input variable u. Then [ 2,6]U = − follow the transformation formula
(2). The universe of discourse of y is similar tou ’s and it is signed with Y.
( )'1 12 17 / 7.5x x= − + + (1)
( )'2 22 8.75 / 3.31x x= + + (2)
Five fuzzy subsets were defined in U and Y. They are {Weak, Middle, Strong, Very Strong,
Extremely Strong} and signed with{ }ESVSSMW ,,,, . Other Five fuzzy subsets were defined in E.
They are {Negative Big, Negative Middle, Negative Small, Zero, Positive Small} and signed
with{ }PSZONSNMNB ,,,, . They are shown in Table 2.
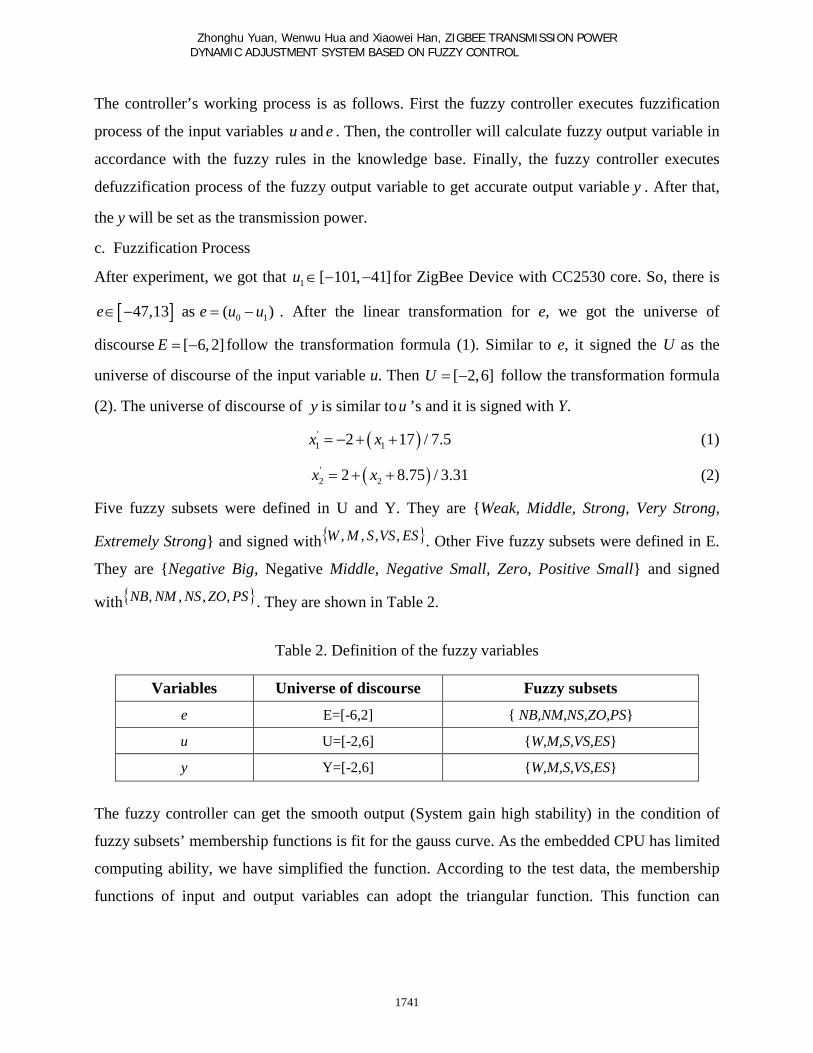
Table 2. Definition of the fuzzy variables
Variables Universe of discourse Fuzzy subsets
e E=[-6,2] { NB,NM,NS,ZO,PS}
u U=[-2,6] {W,M,S,VS,ES}
y Y=[-2,6] {W,M,S,VS,ES}
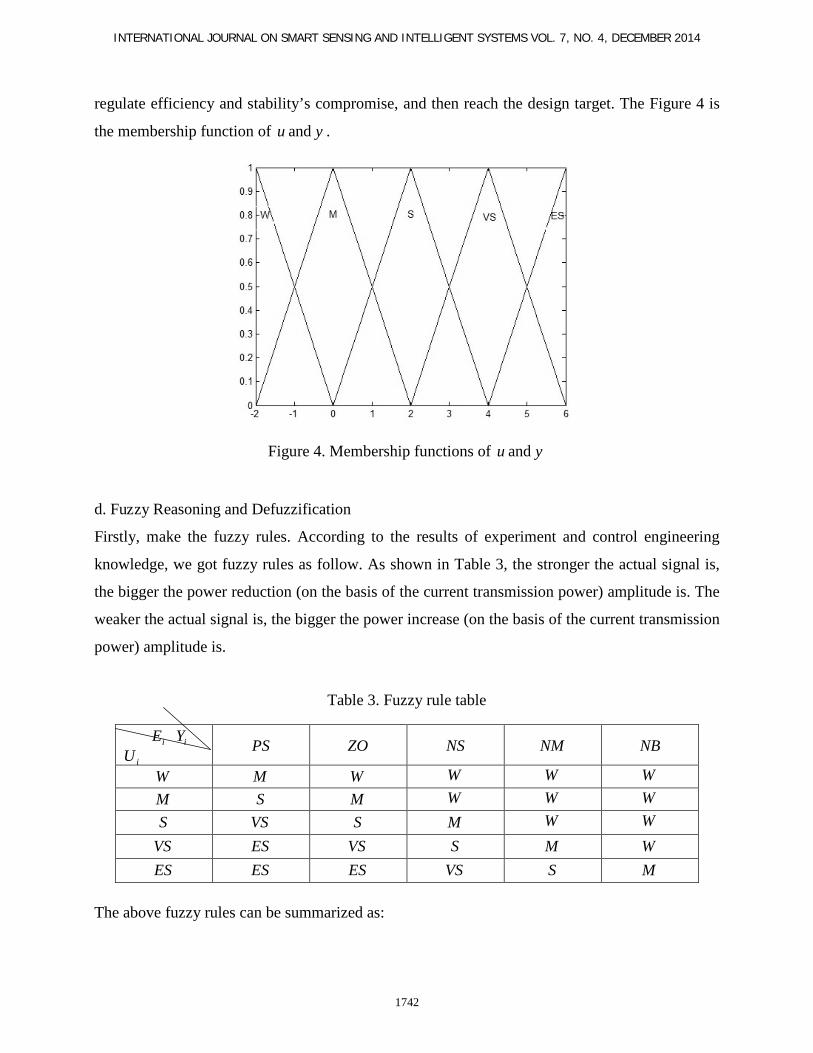
The fuzzy controller can get the smooth output (System gain high stability) in the condition of
fuzzy subsets’ membership functions is fit for the gauss curve. As the embedded CPU has limited
computing ability, we have simplified the function. According to the test data, the membership
functions of input and output variables can adopt the triangular function. This function can
INTERNATIONAL JOURNAL ON SMART SENSING AND INTELLIGENT SYSTEMS VOL. 7, NO. 4, DECEMBER 2014
1742
regulate efficiency and stability’s compromise, and then reach the design target. The Figure 4 is
the membership function of u and y .
Figure 4. Membership functions of u and y
d. Fuzzy Reasoning and Defuzzification
Firstly, make the fuzzy rules. According to the results of experiment and control engineering
knowledge, we got fuzzy rules as follow. As shown in Table 3, the stronger the actual signal is,
the bigger the power reduction (on the basis of the current transmission power) amplitude is. The
weaker the actual signal is, the bigger the power increase (on the basis of the current transmission
power) amplitude is.
Table 3. Fuzzy rule table
iE iY
iU PS ZO NS NM NB
W M W W W W
M S M W W W
S VS S M W W
VS ES VS S M W
ES ES ES VS S M
The above fuzzy rules can be summarized as:
Zhonghu Yuan, Wenwu Hua and Xiaowei Han, ZIGBEE TRANSMISSION POWER DYNAMIC ADJUSTMENT SYSTEM BASED ON FUZZY CONTROL
1743
( ) iii YthenandUEif (3)
The corresponding fuzzy implication relation matrix is:
iii YUER ××= (4)
The fuzzy reasoning:
RUEY iii ×= (5)
Target output value:
)64.4(31.3 * −= yy (6)
In the above formulas, iY is a fuzzy subset and the actual output value y is an exact value. To
ensure real-time performance, it adopts maximum membership degree method to make
defuzzification of iY . Sign the output value after the defuzzification with *y , we can get y by
inverse scale transform formula (6) [13] [14].
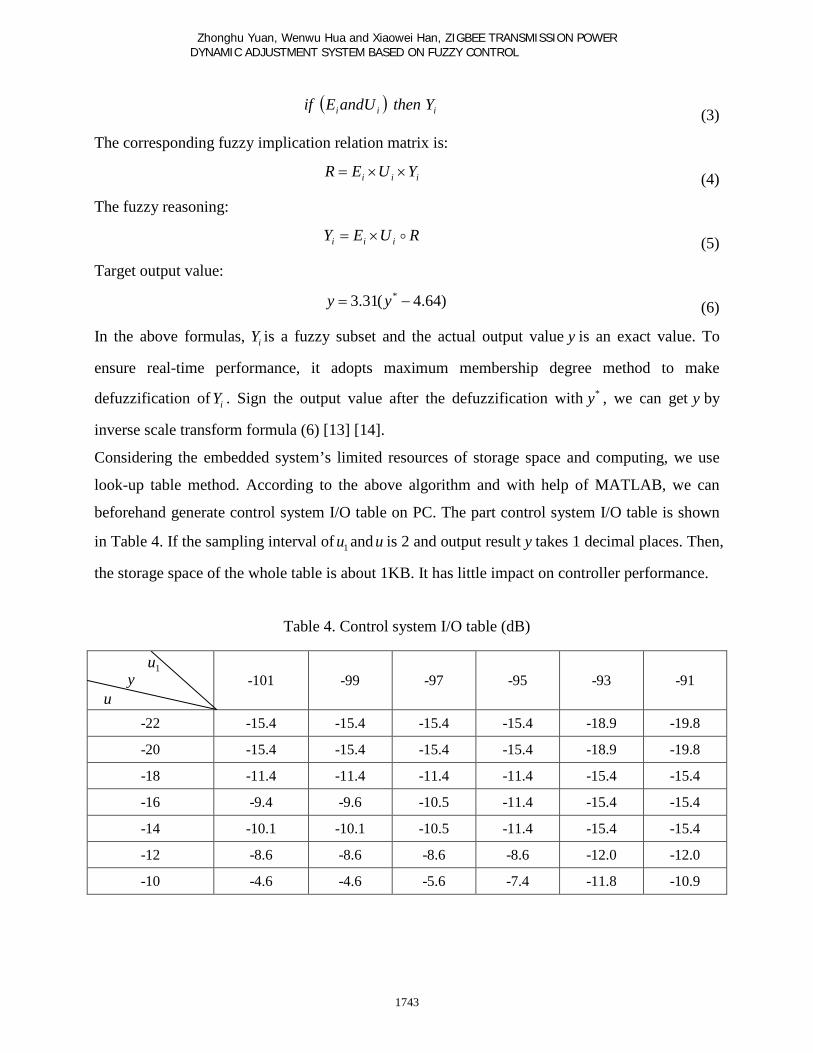
Considering the embedded system’s limited resources of storage space and computing, we use
look-up table method. According to the above algorithm and with help of MATLAB, we can
beforehand generate control system I/O table on PC. The part control system I/O table is shown
in Table 4. If the sampling interval of 1u and u is 2 and output result y takes 1 decimal places. Then,
the storage space of the whole table is about 1KB. It has little impact on controller performance.
Table 4. Control system I/O table (dB)
1u y
u -101 -99 -97 -95 -93 -91
-22 -15.4 -15.4 -15.4 -15.4 -18.9 -19.8
-20 -15.4 -15.4 -15.4 -15.4 -18.9 -19.8
-18 -11.4 -11.4 -11.4 -11.4 -15.4 -15.4
-16 -9.4 -9.6 -10.5 -11.4 -15.4 -15.4
-14 -10.1 -10.1 -10.5 -11.4 -15.4 -15.4
-12 -8.6 -8.6 -8.6 -8.6 -12.0 -12.0
-10 -4.6 -4.6 -5.6 -7.4 -11.8 -10.9

INTERNATIONAL JOURNAL ON SMART SENSING AND INTELLIGENT SYSTEMS VOL. 7, NO. 4, DECEMBER 2014
1744
During the system running, every time it gathers values of the input variables 1u and u , searches
the control system I/O table to find out the correspondence or similar input values. Then, the
system can get the output value in the table. After setting the value as output power, the system
will finish one adjustment period.
IV. EXPERIMENT RESULTS AND ANALYSIS
a. Experiment environment
The hardware system adopts TI Company’s chip CC2530 as the core. The whole network
consists of a coordinator, two routers (1, 2), and 15 end-nodes (from 6 to 20), you can chooses
any one of the end-node as the experiment object.
Experimental methods: under the open environment, constantly increase the distance between the
measured node and its upper router, respectively record changes of the system when the
transmission power of the end-node is the maximum, minimum, under relay control strategy
(adjusted by fixed change of 2 dB) and fuzzy adjusted, namely record changes of the signal
strength that on arrival at the router, the transmission power setting value of the end-node and the
current consumption value. At a certain moment during the normal running of the system, we
cover the End Device (It simulates strong interference appear) and uncover the End Device (It
simulates strong interference disappears). Then, we observe the dynamic characteristics of
control system via the recorded process and change times that the system changes to the steady
state.
b. Experiment Results
As shown in table 5, under the minimum transmission power, they are changes of the signal
strength C that on arrival at the router at the distance D, respectively, 1m, 3m, 5m, 8m, 10m, 15m,
20m. The transmission power value P is constant for -22dB and power consumption value I is
constant for 23mA.
Zhonghu Yuan, Wenwu Hua and Xiaowei Han, ZIGBEE TRANSMISSION POWER DYNAMIC ADJUSTMENT SYSTEM BASED ON FUZZY CONTROL
1745
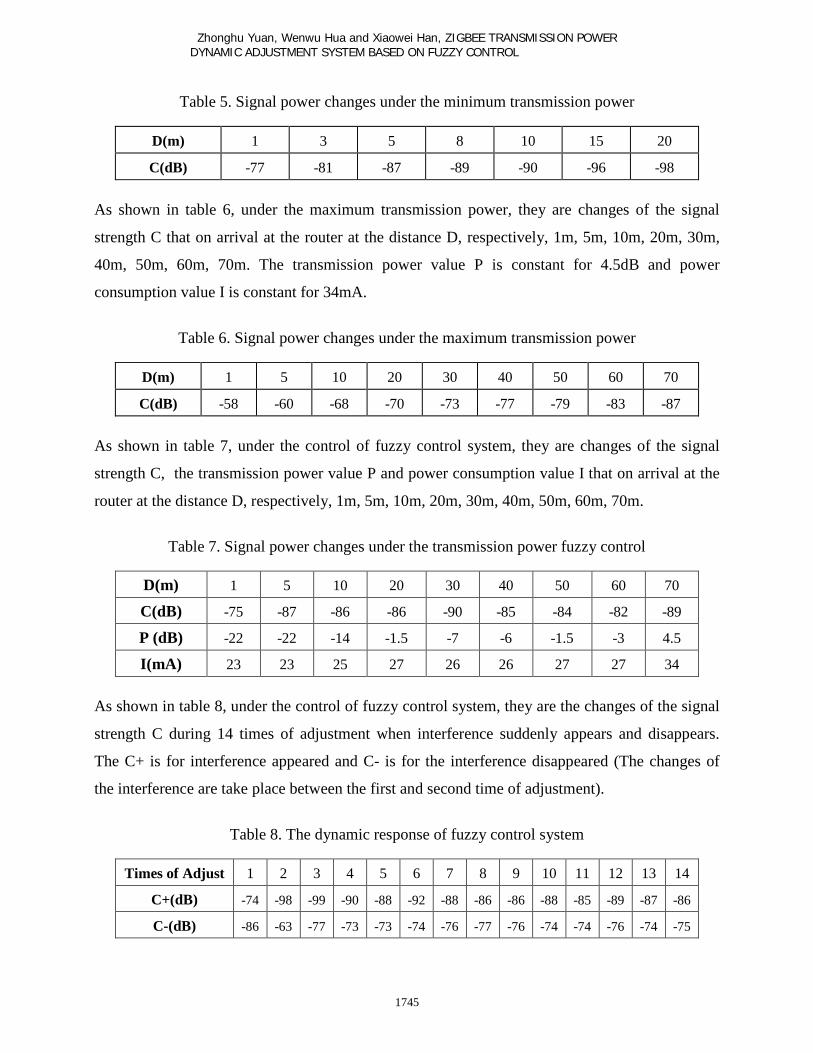
Table 5. Signal power changes under the minimum transmission power
D(m) 1 3 5 8 10 15 20
C(dB) -77 -81 -87 -89 -90 -96 -98
As shown in table 6, under the maximum transmission power, they are changes of the signal
strength C that on arrival at the router at the distance D, respectively, 1m, 5m, 10m, 20m, 30m,
40m, 50m, 60m, 70m. The transmission power value P is constant for 4.5dB and power
consumption value I is constant for 34mA.
Table 6. Signal power changes under the maximum transmission power
D(m) 1 5 10 20 30 40 50 60 70
C(dB) -58 -60 -68 -70 -73 -77 -79 -83 -87
As shown in table 7, under the control of fuzzy control system, they are changes of the signal
strength C, the transmission power value P and power consumption value I that on arrival at the
router at the distance D, respectively, 1m, 5m, 10m, 20m, 30m, 40m, 50m, 60m, 70m.
Table 7. Signal power changes under the transmission power fuzzy control
D(m) 1 5 10 20 30 40 50 60 70
C(dB) -75 -87 -86 -86 -90 -85 -84 -82 -89
P (dB) -22 -22 -14 -1.5 -7 -6 -1.5 -3 4.5
I(mA) 23 23 25 27 26 26 27 27 34
As shown in table 8, under the control of fuzzy control system, they are the changes of the signal
strength C during 14 times of adjustment when interference suddenly appears and disappears.
The C+ is for interference appeared and C- is for the interference disappeared (The changes of
the interference are take place between the first and second time of adjustment).
Table 8. The dynamic response of fuzzy control system
Times of Adjust 1 2 3 4 5 6 7 8 9 10 11 12 13 14
C+(dB) -74 -98 -99 -90 -88 -92 -88 -86 -86 -88 -85 -89 -87 -86
C-(dB) -86 -63 -77 -73 -73 -74 -76 -77 -76 -74 -74 -76 -74 -75
INTERNATIONAL JOURNAL ON SMART SENSING AND INTELLIGENT SYSTEMS VOL. 7, NO. 4, DECEMBER 2014
1746
c. Analysis of experiment results
This paper draws the data in a table into curved forms, in order to facilitate data analysis.
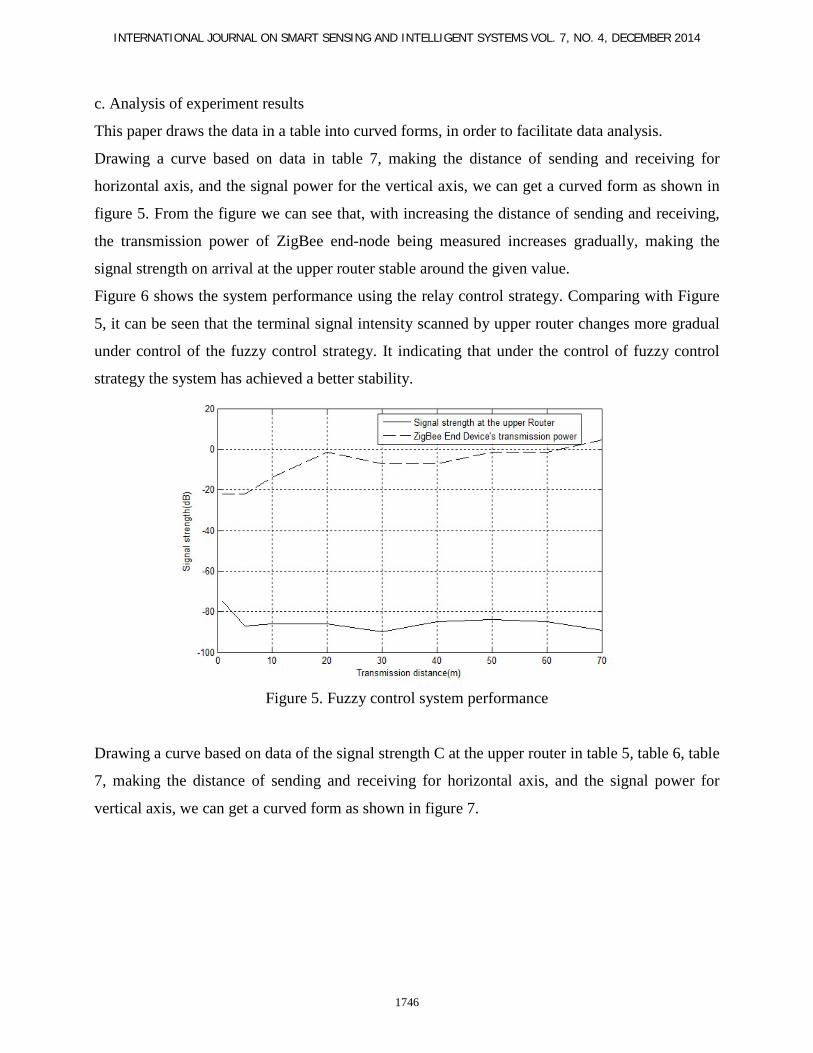
Drawing a curve based on data in table 7, making the distance of sending and receiving for
horizontal axis, and the signal power for the vertical axis, we can get a curved form as shown in
figure 5. From the figure we can see that, with increasing the distance of sending and receiving,
the transmission power of ZigBee end-node being measured increases gradually, making the
signal strength on arrival at the upper router stable around the given value.
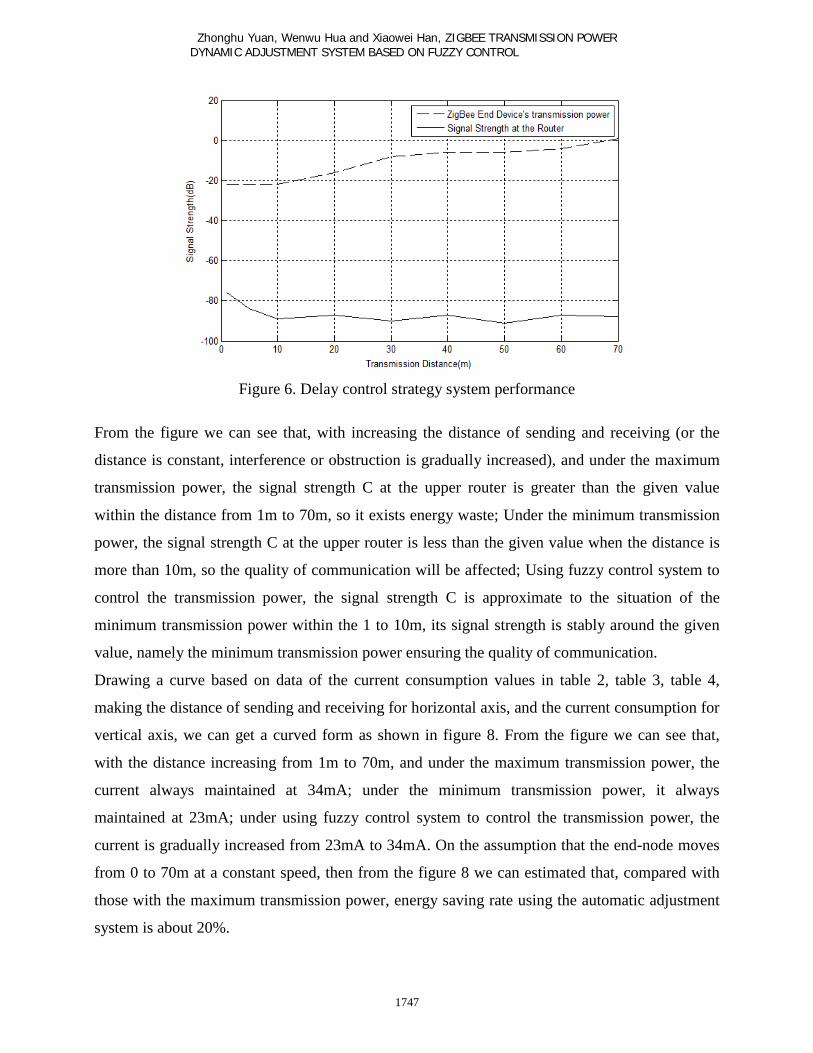
Figure 6 shows the system performance using the relay control strategy. Comparing with Figure
5, it can be seen that the terminal signal intensity scanned by upper router changes more gradual
under control of the fuzzy control strategy. It indicating that under the control of fuzzy control
strategy the system has achieved a better stability.
Figure 5. Fuzzy control system performance
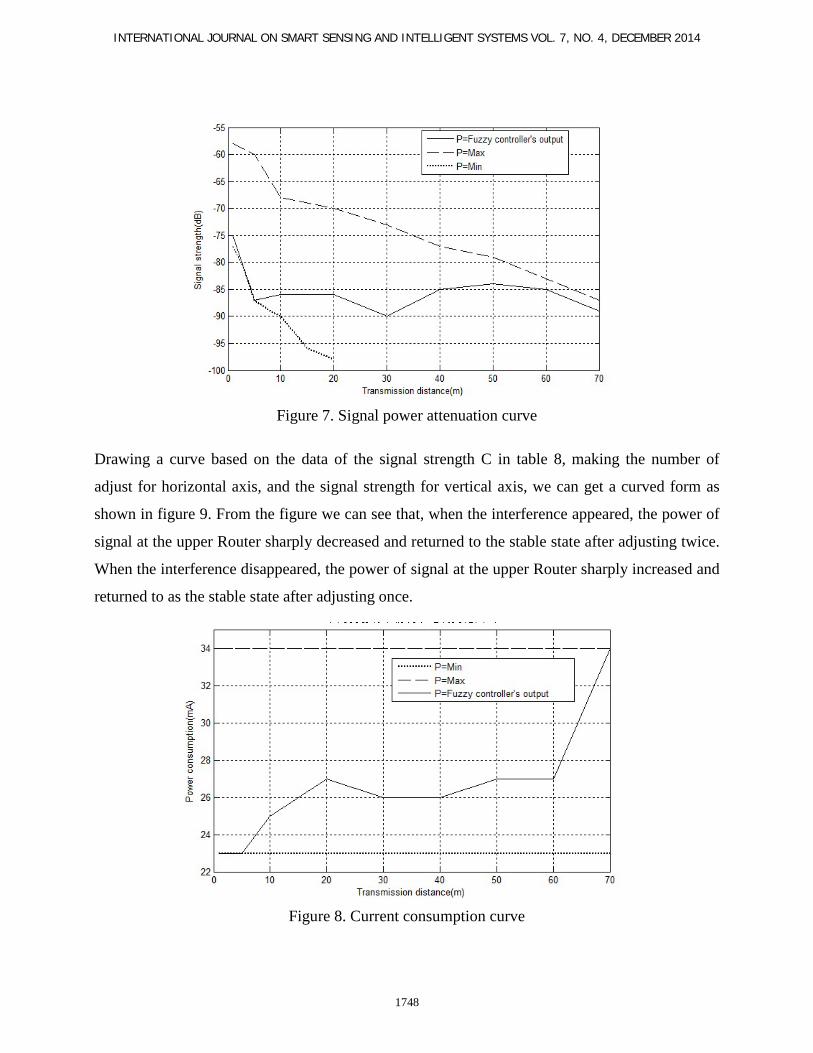
Drawing a curve based on data of the signal strength C at the upper router in table 5, table 6, table
7, making the distance of sending and receiving for horizontal axis, and the signal power for
vertical axis, we can get a curved form as shown in figure 7.
Zhonghu Yuan, Wenwu Hua and Xiaowei Han, ZIGBEE TRANSMISSION POWER DYNAMIC ADJUSTMENT SYSTEM BASED ON FUZZY CONTROL
1747
Figure 6. Delay control strategy system performance
From the figure we can see that, with increasing the distance of sending and receiving (or the
distance is constant, interference or obstruction is gradually increased), and under the maximum
transmission power, the signal strength C at the upper router is greater than the given value
within the distance from 1m to 70m, so it exists energy waste; Under the minimum transmission
power, the signal strength C at the upper router is less than the given value when the distance is
more than 10m, so the quality of communication will be affected; Using fuzzy control system to
control the transmission power, the signal strength C is approximate to the situation of the
minimum transmission power within the 1 to 10m, its signal strength is stably around the given
value, namely the minimum transmission power ensuring the quality of communication.
Drawing a curve based on data of the current consumption values in table 2, table 3, table 4,
making the distance of sending and receiving for horizontal axis, and the current consumption for
vertical axis, we can get a curved form as shown in figure 8. From the figure we can see that,
with the distance increasing from 1m to 70m, and under the maximum transmission power, the
current always maintained at 34mA; under the minimum transmission power, it always
maintained at 23mA; under using fuzzy control system to control the transmission power, the
current is gradually increased from 23mA to 34mA. On the assumption that the end-node moves
from 0 to 70m at a constant speed, then from the figure 8 we can estimated that, compared with
those with the maximum transmission power, energy saving rate using the automatic adjustment
system is about 20%.
INTERNATIONAL JOURNAL ON SMART SENSING AND INTELLIGENT SYSTEMS VOL. 7, NO. 4, DECEMBER 2014
1748
Figure 7. Signal power attenuation curve
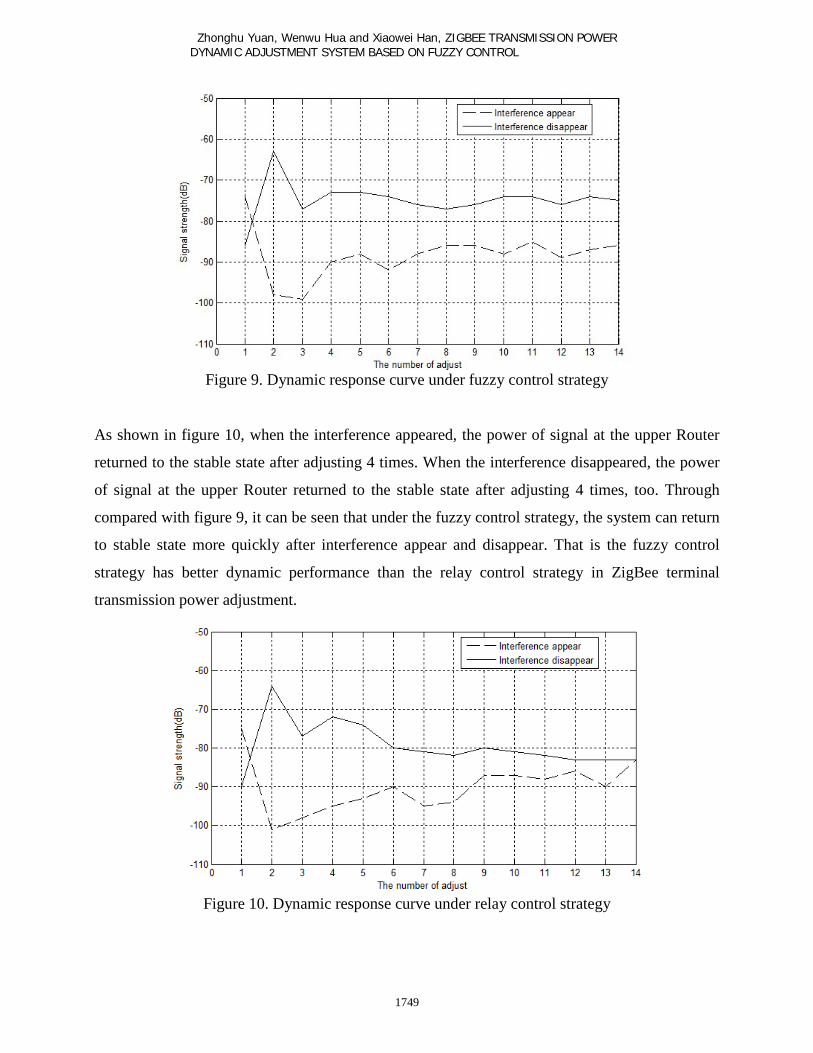
Drawing a curve based on the data of the signal strength C in table 8, making the number of
adjust for horizontal axis, and the signal strength for vertical axis, we can get a curved form as
shown in figure 9. From the figure we can see that, when the interference appeared, the power of
signal at the upper Router sharply decreased and returned to the stable state after adjusting twice.
When the interference disappeared, the power of signal at the upper Router sharply increased and
returned to as the stable state after adjusting once.
Figure 8. Current consumption curve
Zhonghu Yuan, Wenwu Hua and Xiaowei Han, ZIGBEE TRANSMISSION POWER DYNAMIC ADJUSTMENT SYSTEM BASED ON FUZZY CONTROL
1749
Figure 9. Dynamic response curve under fuzzy control strategy
As shown in figure 10, when the interference appeared, the power of signal at the upper Router
returned to the stable state after adjusting 4 times. When the interference disappeared, the power
of signal at the upper Router returned to the stable state after adjusting 4 times, too. Through
compared with figure 9, it can be seen that under the fuzzy control strategy, the system can return
to stable state more quickly after interference appear and disappear. That is the fuzzy control
strategy has better dynamic performance than the relay control strategy in ZigBee terminal
transmission power adjustment.
Figure 10. Dynamic response curve under relay control strategy

INTERNATIONAL JOURNAL ON SMART SENSING AND INTELLIGENT SYSTEMS VOL. 7, NO. 4, DECEMBER 2014
1750
V. CONCLUSIONS
The method proposed by the paper is only used to adjust the transmission power of terminal
nodes, so it can be applied in the network types as point to point type, star type and mesh type
network, with the same adjusting method.
The reasons that only adjusting the transmission power of terminal nodes are as follows:
(1) Most nodes in one network are terminal nodes.
(2) To ensure maximum network coverage, coordinator and routing use maximum
transmission power.
Through the above analysis it can be seen that using fuzzy control method to adjust ZigBee
Device’s transmission power can deeply reduce the power consumption of the system and
improve the system stability. Most of all it has a good dynamic performance on condition that
network changes or node moved.
VI. ACKNOWLEDGE
Thanks for information engineering college of Shenyang university to provide the support for
research; Thanks for the funding of Shenyang science and technology plan (Project number: F12-
169-9-00).
REFERENCES
[1] J.H.Yang, D.L.Xu and X.L.Wang, “Research and Application of Campus Power Equipment Monitoring System Based on ZigBee”, Automation & Instrumentation, No. 12, 2011, pp. 29-32. [2] P.Yu, “ZigBee-A Wireless Communication Protocol with Features of Low Power, Low
Cost,High Reliability and Low Complexity”, Automation & Instrumentation, Vol. 26, No. 5,
2005, pp .1-4.
[3] Texas Instruments Incorporated, CC253x System-on-Chip Solution for 2.4-GHz IEEE
802.15.4 and ZigBee® Applications. USA: Texas Instruments Incorporated, 2012.
[4] Texas Instruments Incorporated, Z-Stack Developer’s Guide, USA: Texas Instruments
Incorporated, 2011.
[5] Y.Tang, M.T.Zhou and X. Zhang, “The reviewed of wireless sensor network routing
protocol”, Journal of Software, Vol. 17 No. 3, 2006, pp. 412-417.

Zhonghu Yuan, Wenwu Hua and Xiaowei Han, ZIGBEE TRANSMISSION POWER DYNAMIC ADJUSTMENT SYSTEM BASED ON FUZZY CONTROL
1751
[6] Y.L.Liu, J.H.Pu, W.W.Fang and Z.Xiong, “An optimization algorithm of wireless sensor
network MAC protocol”, Chinese Journal of Computers, Vol. 35 No. 3, 2012, pp. 530-536.
[7] Sean Dieter Tebje Kelly, Nagender Kumar Suryadevara, and S. C. Mukhopadhyay, "Towards
the Implementation of IoT for Environmental Condition Monitoring in Homes" IEEE SENSORS
JOURNAL, VOL. 13, NO. 10, OCTOBER 2013, pp. 3846-3853.
[8] Y.W Zhou, Z.H.Ling and Q.Q.Wu, “The discussed of ZigBee wireless communication
technology and its application”, Automation & Instrumentation, Vol. 26, No. 6, 2005, pp. 5-9.
[9] J.F. Wang, “Wireless sensor network based on the ZigBee”, Sandong: Jinan University, 2010.
[10] M.K. Fang and L.Li, “An adaptive transmission power control scheme for WLAN”,
Computer Engineering, Vol. 38, No. 13, 2012, pp. 86-88.
[11] N.K. Suryadevara, S.C. Mukhopadhyay, R. Wang, R.K. Rayudu, Forecasting the behavior of
an elderly using wireless sensors data in a smart home, Engineering Applications of Artificial
Intelligence, Volume 26, Issue 10, November 2013, Pages 2641-2652, ISSN 0952-1976,
http://dx.doi.org/10.1016/j.engappai.2013.08.004.
[12] Y.Feng, X.Z.Zhou and B. Li. “The optimization method of transmission power based on
CC2430”, Microcomputer Information, Vol. 25 No. 11, pp. 40-41, 2009.
[13] K. Kaur, S. C. Mukhopadhyay, J. Schnepper, M. Haefke and H. Ewald, “A Zigbee Based
Wearable Physiological Parameters Monitoring System”, IEEE Sensors Journal, Vol. 12, No. 3,
March 2012, pp.423-430.
[14] Y.S. Ding and L.H.Ren, “A novel fuzzy self-tuning immune feedback control system”,
Control and Decision, Vol. 25 No. 11, 2000, pp. 443-446.
[15] N. K. Suryadevara and S. C. Mukhopadhyay, “Determining Wellness Through An Ambient
Assisted Living Environment”, IEEE Intelligent Systems, May/June 2014, pp. 30-37.
[16] J.M.Shi, J.Wang and S.W.Liu, “Fuzzy adaptive time-varying time-delay uncertain systems’
∞H control”, Systems Engineering and Electronics, Vol.34, No. 3, 2012, pp. 550-553.
[17] M. Haefke, S. C. Mukhopadhyay and H. Ewald, A Zigbee Based Smart Sensing Platform for
Monitoring Environmental Parameters, Proceedings of IEEE I2MTC 2011 conference, IEEE
Catalog number CFP11MT-CDR, ISBN 978-1-4244-7934-4, May 10-12, 2011, Hangzhou China,
pp. 1549-1556.

INTERNATIONAL JOURNAL ON SMART SENSING AND INTELLIGENT SYSTEMS VOL. 7, NO. 4, DECEMBER 2014
1752
[18] H.B. Zhou, H. Ying and J.A. Duan, “Adaptive control using interval Type-2 fuzzy logic for
uncertain nonlinear systems”, Journal of Central South University of Technology, Vol.18 No. 3,
2011, pp. 60-766.
[19] M. Haefke, S. C. Mukhopadhyay and H. Ewald, A Zigbee Based Smart Sensing Platform for
Monitoring Environmental Parameters, Proceedings of IEEE I2MTC 2011 conference, IEEE
Catalog number CFP11MT-CDR, ISBN 978-1-4244-7934-4, May 10-12, 2011, Hangzhou China,
pp. 1549-1556.
[20] Y.N.Yang, J. Wu and W. Zheng, “Adaptive fuzzy sliding mode control for robotic airship
with model uncertainty and external disturbance”, Journal of Systems Engineering and
Electronics, Vol.23, No. 2, 2012, pp. 250-25.


![ZigBee RF4CE Stack User Guide - NXP Semiconductors · 094945r00ZB ZigBee RF4CE Specification [ZigBee Alliance document] 094950r00ZB ZigBee RF4CE Device Type List [ZigBee Alliance](https://static.cupdf.com/doc/110x72/5f168d2f412bb13bb1076764/zigbee-rf4ce-stack-user-guide-nxp-semiconductors-094945r00zb-zigbee-rf4ce-specification.jpg)


![AT08550: ZigBee Attribute Reporting · ZigBee Attribute Reporting [APPLICATION NOTE] Atmel-42334A-ZigBee-Attribute-Reporting -ApplicationNote_012015 3 1 Overview The ZigBee Specification](https://static.cupdf.com/doc/110x72/5f43d267b58b3c15740a0db6/at08550-zigbee-attribute-reporting-zigbee-attribute-reporting-application-note.jpg)


![ZigBee Stack Profile: Platform restrictions for compliant ...read.pudn.com/.../3...ZigBee-Feature-Set-Profile.pdf · 11 [R2] ZigBee 04140r05, ZigBee Protocol Stack Settable Values](https://static.cupdf.com/doc/110x72/5f183a7d6417c0751a61665e/zigbee-stack-profile-platform-restrictions-for-compliant-readpudncom3zigbee-feature-set-.jpg)