www.biotech.co.nz
INNOVATION IN THE
CITY
www.biotech.co.nz
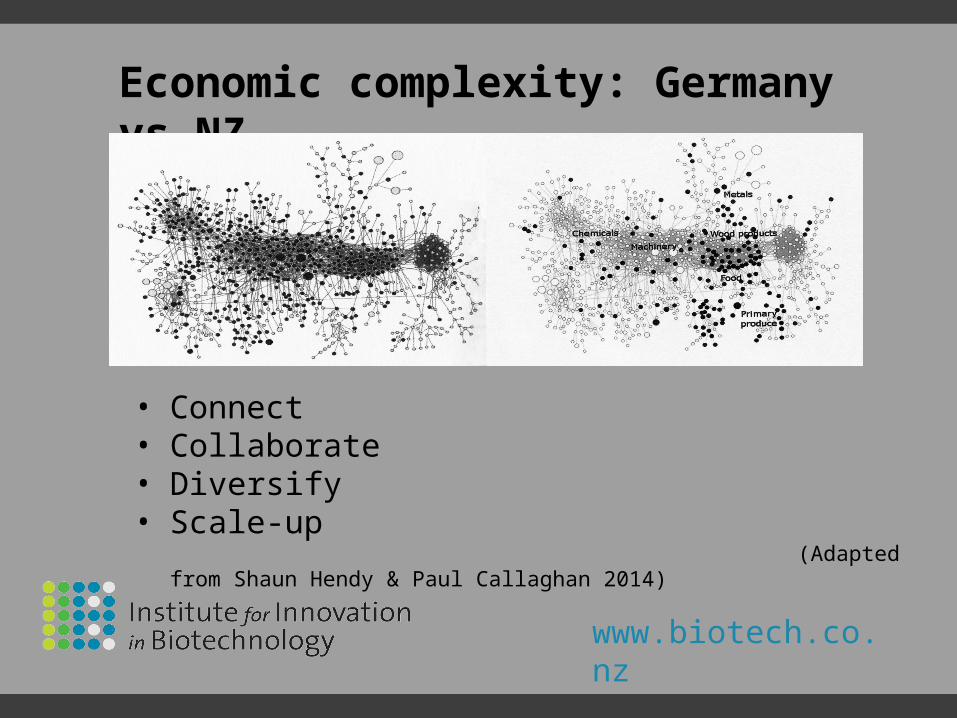
Economic complexity: Germany vs NZ
• Connect• Collaborate• Diversify• Scale-up (Adapted from Shaun Hendy & Paul Callaghan 2014)

www.biotech.co.nz
Key indicators Switzerland Sweden Germany Denmark New Zealand
GDP/capita US$ 45,000 42,000 39,000 38,000 29,000
Total R&D expenditure
7 4 8 6 28
Hi-tech manufacturing
3 21 5 23 75
Cluster development
8 10 6 18 39
Academic-industry collaboration
1 7 11 20 22
Ease of starting a business
61 17 75 18 1
GDP/capita vs complexity, connectivity -global rankings (Global Innovation Index 2013)

www.biotech.co.nz
Progress made in the city
Connect: NZTE, ATEED, CI, NZIC, IIB, WQ
Commercialisation: CI, KiwiNet, Return on Science, Health Innovation Hub, Universities, CRIs, ICEHOUSE, VCs, IP firms
Clusters: F&B – Manukau, Foodbowl, UoA F/H programme, P&F Res ICT – WQ Innovation Precinct, city-wide Health technologies: Grafton, Newmarket (tech park?), Mt Wellington, Henderson Materials, manufacturing: Tamaki, Mt Wellington, city-wide
Ecosystem: industry networks, workshops, Bioscience Enterprise Forums

www.biotech.co.nz
Still to do in the city – change attitudes
Academia:• Industry engagement strategy • What are the market needs?• Change staff attitudes• Set expectations and incentives• Staff exchanges
Industry:• Increase R&D investment• Connect and collaborate• Maximise local strengths• Staff exchanges• External market focus

www.biotech.co.nz
Still to do in the city – scale up
Make it a priority to attract multinational companies:• R&D centres• High-tech manufacturing• Tailored value propositions• Strategy and targets• Regional collaboration• Job creation• Skill retention

www.biotech.co.nz
A GREAT BIG
THANK YOUFOR ALL YOUR SUPPORT FOR THE IIB AND
THE BIOSCIENCE ENTERPRISE PROGRAMME