Welcome to Berlin! t-online.de
HALF-YEAR
FINANCIAL REPORT 6M/Q2 2017
STRÖER SE & Co. KGaA

Ströer SE & Co. KGaA 2 Half-year financial report 6M/Q2 2017
CONTENTS
The Group’s financial figures at a glance 3
Foreword by the board of management 4
Share 6
Interim group management report
Background of the Ströer Group 9
Economic report 10
Results of operations, financial position and net assets of the Group 11
Results of operations of the segments 17
Employees 19
Opportunities and risks 19
Forecast 19
Subsequent events 19
Consolidated interim financial statements
Consolidated income statement 21
Consolidated statement of comprehensive income 22
Consolidated statement of financial position 23
Consolidated statement of cash flows 24
Consolidated statement of changes in equity 25
Notes to the condensed consolidated interim financial statements 26
Responsibility statement 39
Financial calendar, contact, imprint and disclaimer 40
Ströer SE & Co. KGaA 3 Half-year financial report 6M/Q2 2017
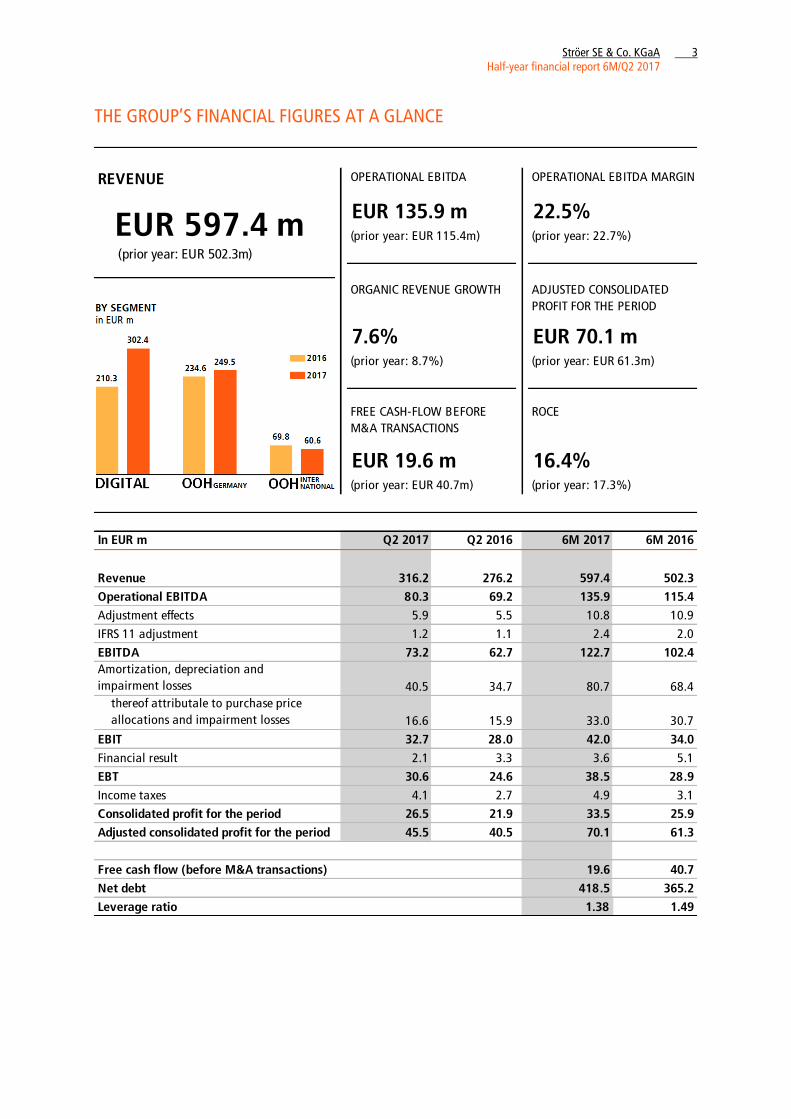
THE GROUP’S FINANCIAL FIGURES AT A GLANCE
REVENUE OPERATIONAL EBITDA OPERATIONAL EBITDA MARGIN
EUR 135.9 m 22.5%(prior year: EUR 115.4m) (prior year: 22.7%)
(prior year: EUR 502.3m)
7.6% EUR 70.1 m(prior year: 8.7%) (prior year: EUR 61.3m)
ROCE
EUR 19.6 m 16.4%(prior year: EUR 40.7m) (prior year: 17.3%)
In EUR m Q2 2017 Q2 2016 6M 2017 6M 2016
Revenue 316.2 276.2 597.4 502.3
Operational EBITDA 80.3 69.2 135.9 115.4
Adjustment effects 5.9 5.5 10.8 10.9
IFRS 11 adjustment 1.2 1.1 2.4 2.0
EBITDA 73.2 62.7 122.7 102.4
Amortization, depreciation and
impairment losses 40.5 34.7 80.7 68.4
thereof attributale to purchase price
allocations and impairment losses 16.6 15.9 33.0 30.7
EBIT 32.7 28.0 42.0 34.0
Financial result 2.1 3.3 3.6 5.1
EBT 30.6 24.6 38.5 28.9
Income taxes 4.1 2.7 4.9 3.1
Consolidated profit for the period 26.5 21.9 33.5 25.9
Adjusted consolidated profit for the period 45.5 40.5 70.1 61.3
Free cash flow (before M&A transactions) 19.6 40.7
Net debt 418.5 365.2
Leverage ratio 1.38 1.49
EUR 597.4 m
ORGANIC REVENUE GROWTH ADJUSTED CONSOLIDATED
PROFIT FOR THE PERIOD
FREE CASH-FLOW BEFORE
M&A TRANSACTIONS
Ströer SE & Co. KGaA 4 Half-year financial report 6M/Q2 2017
FOREWORD BY THE BOARD OF MANAGEMENT
Dear shareholders,
The Ströer Group continued to perform very well in the second quarter, reporting strong increases in
revenue and earnings. The two core segments OOH Germany and Ströer Digital contributed to this
very positive business development. Ströer Digital, now our largest segment, reported robust and
high-margin revenue growth. We have a strong digital portfolio in this segment, where we focus on
structurally growing and profitable assets. The catalysts here are online, public and mobile video as
well as local digital revenue and digital subscriptions. The upward trend was also bolstered by the
continued strong performance of the OOH Germany segment, where business remains robust as in
prior years.
Our revenue, operational EBITDA and profit increased significantly year on year. Revenue growth for
the first half of the year as a whole stands at 19%, with organic growth of 8%. Operational EBITDA
improved by 18% to a total of EUR 136m in the first six months of 2017. The healthy performance of
the operating business also had a positive effect on the financial position, with Ströer also further
reducing its leverage ratio from 1.5 to 1.4 over the past 12 months despite acquisitions and a
dividend payout.
One of the keys to this success is the fast pace of innovation in a rapidly changing environment.
Ströer is leading the way in the digitization of out-of-home media and is successively digitizing its
advertising media across German cities. In addition to the further expansion of its public video
infrastructure, Ströer is also forging ahead with the roll out of roadside screens – large format digital
advertising spaces on roadsides – and with the installation of iBeacons in advertising media. The
new editorial office of t-online.de set up in Berlin in June is not only the content supplier of the
t-online website but also provides editorial content for the roadside screens and the public video
network. This gives us access to a high-performance, high-reach channel. We are making our unique
multiscreen, multi-touchpoint concept a reality, offering integrated and multimedia storytelling
across all devices, channels and media formats. In parallel, we are also increasing direct traffic and
increasing the visibility of the brand. With the launch of the unique multiscreen, multi-touchpoint
concept, t-online.de can now reach some 47 million users per month all over Germany.
Through the value-enhancing acquisitions of the performance-based dialog marketing specialists of
the Avedo Group and Ranger Group, Ströer can add additional channels to its own performance
marketing business. By combining the different product ranges, the new and expanded Ströer Group
will be able to offer its customers integrated, end-to-end solutions along the entire marketing and
sales value chain in the future.
In view of this performance, it was agreed at this year’s shareholder meeting held in June 2017 to
increase the dividend payment for fiscal year 2016 by nearly 60%, raising it from EUR 0.70 to
EUR 1.10 per qualifying share, allowing us to let all shareholders participate substantially in our
Company’s growing success.
Ströer SE & Co. KGaA 5 Half-year financial report 6M/Q2 2017
We expect to record organic revenue growth in the mid to high single-digit percentage range in
fiscal year 2017. We are confirming our current guidance of operational EBITDA of more than
EUR 320m and consolidated revenue of around EUR 1.3b for 2017.
Best wishes,
The Board of Management
Udo Müller Christian Schmalzl Dr. Bernd Metzner
Co-CEO Co-CEO CFO
Ströer SE & Co. KGaA 6 Half-year financial report 6M/Q2 2017
SHARE
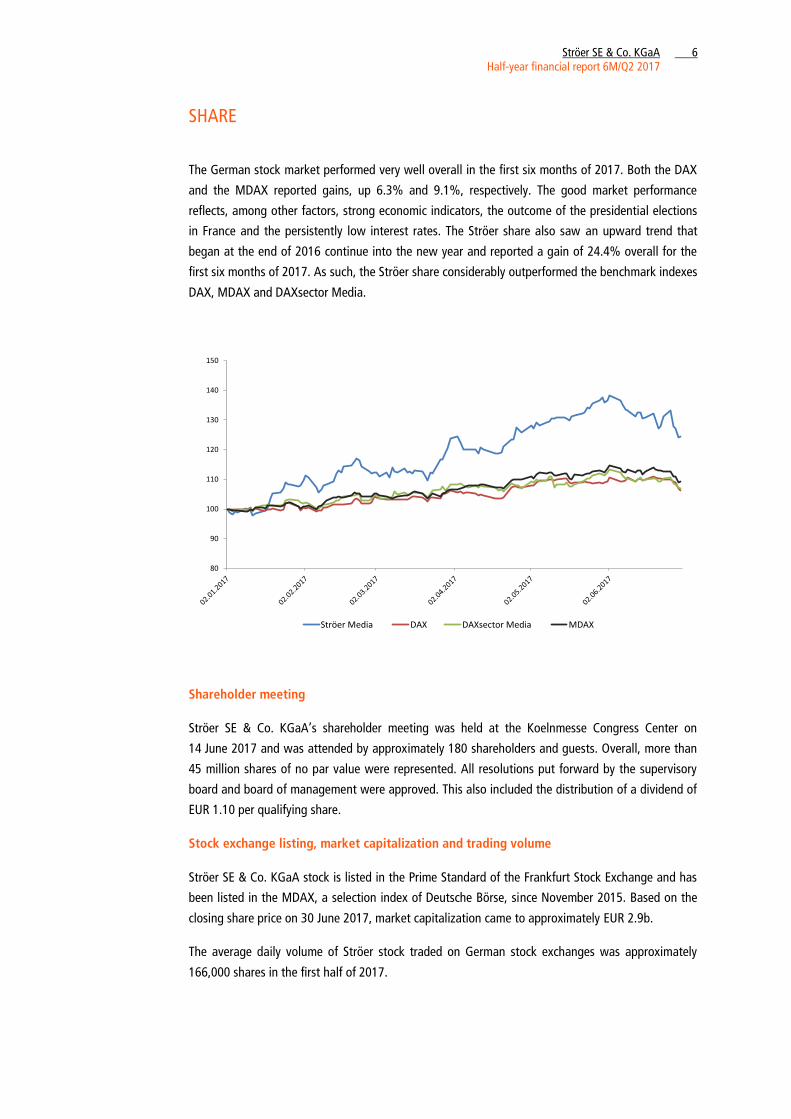
The German stock market performed very well overall in the first six months of 2017. Both the DAX
and the MDAX reported gains, up 6.3% and 9.1%, respectively. The good market performance
reflects, among other factors, strong economic indicators, the outcome of the presidential elections
in France and the persistently low interest rates. The Ströer share also saw an upward trend that
began at the end of 2016 continue into the new year and reported a gain of 24.4% overall for the
first six months of 2017. As such, the Ströer share considerably outperformed the benchmark indexes
DAX, MDAX and DAXsector Media.
Shareholder meeting
Ströer SE & Co. KGaA’s shareholder meeting was held at the Koelnmesse Congress Center on
14 June 2017 and was attended by approximately 180 shareholders and guests. Overall, more than
45 million shares of no par value were represented. All resolutions put forward by the supervisory
board and board of management were approved. This also included the distribution of a dividend of
EUR 1.10 per qualifying share.
Stock exchange listing, market capitalization and trading volume
Ströer SE & Co. KGaA stock is listed in the Prime Standard of the Frankfurt Stock Exchange and has
been listed in the MDAX, a selection index of Deutsche Börse, since November 2015. Based on the
closing share price on 30 June 2017, market capitalization came to approximately EUR 2.9b.
The average daily volume of Ströer stock traded on German stock exchanges was approximately
166,000 shares in the first half of 2017.
80
90
100
110
120
130
140
150
Ströer Media DAX DAXsector Media MDAX
Ströer SE & Co. KGaA 7 Half-year financial report 6M/Q2 2017
Analysts’ coverage
The performance of Ströer SE & Co. KGaA is tracked by 16 teams of analysts. Based on the most
recent assessments, 14 of the analysts are giving a “buy” recommendation and 2 say “hold.” The
latest broker assessments are available at http://ir.stroeer.com and are presented in the following
table:
Investment bank Recommendation*
Bankhaus Lampe Buy
Barclays Buy
Citigroup Global Markets Buy
Commerzbank Buy
Deutsche Bank Buy
Hauck & Aufhäuser Buy
HSBC Buy
Jeffries Buy
J.P. Morgan Buy
KeplerCheuvreux Buy
LBBW Buy
Liberum Buy
MainFirst Buy
Morgan Stanley Buy
NordLB Hold
Oddo Seydler Hold
*As of 30 June 2017
Shareholder structure
Co-CEO Udo Müller, holds 21.70%, supervisory board member Dirk Ströer holds 21.80% and
Co-CEO Christian Schmalzl holds 0.05% of the shares in Ströer SE & Co. KGaA. The free float comes
to around 45%.
According to the notifications made to the Company as of the date of publication of this report on
10 August 2017, the following parties reported to us that they hold more than 3% of the voting
rights in Ströer SE & Co. KGaA: Deutsche Telekom AG (11.60%), Allianz Global Investors (6.15%)
and Credit Suisse (4.63%).
Information on the current shareholder structure is permanently available at http://ir.stroeer.com.
Ströer SE & Co. KGaA 8 Half-year financial report 6M/Q2 2017
INTERIM GROUP MANAGEMENT REPORT This interim group management report covers the period from 1 January to 30 June 2017.
Interim group management report
Background of the Ströer Group 9
Economic report 10
Results of operations, financial position and net assets of the Group 11
Results of operations of the segments 17
Employees 19
Opportunities and risks 19
Forecast 19
Subsequent events 19
Ströer SE & Co. KGaA 9 Half-year financial report 6M/Q2 2017
INTERIM GROUP MANAGEMENT REPORT
BACKGROUND OF THE STRÖER GROUP
Business model, segments and organizational structure
Ströer SE & Co. KGaA is one of the large providers in the commercialization of out-of-home and
online advertising in Germany, and offers its advertising customers individualized and integrated
communications solutions. Its portfolio of branding and performance products gives customers the
opportunity to address specific target groups and simultaneously increase the relevance of the Ströer
Group as a contact for media agencies and advertisers.
The Company’s business model is based on offering traditional out-of-home advertising, the public
video network that is shown on screens installed in train stations and shopping malls, as well as
online display and video marketing via stationary internet and mobile devices and tablets. Ströer
thus covers the entire digital marketing and innovative brand presence value chain. In 2016, the
product portfolio was expanded to include subscription-based revenue models and digital
commerce.
Ströer also signed agreements to acquire the Avedo Group and the Ranger Group in July and August
2017. Through these acquisitions of the performance-based dialog marketing specialists, Ströer adds
additional advertising channels to its own performance marketing business.
For further information on our business model, our segments and our organizational structure, see
pages 14 to 23 of our annual report for 2016.
Ströer SE & Co. KGaA 10 Half-year financial report 6M/Q2 2017
ECONOMIC REPORT
Macroeconomic development
The International Monetary Fund (IMF) is putting economic growth in the eurozone for 2017 at the
prior-year level of 1.7%. This estimate reflects, among other factors, political uncertainties
(upcoming elections in 2017 in several countries) coupled with uncertainty regarding the future
relations between the EU and the UK.
The economic development in Germany, by far our most important sales market, is already at a high
level and is still given a positive assessment by several institutions, with the Kiel Institute for the
World Economy (IfW) projecting growth of 1.7% in its latest economic forecast, while the ifo
Institute in Munich raised its previous forecast for the current year from 1.5% to 1.8%. The
Organisation for Economic Co-operation and Development (OECD) also expects to see the German
economy’s upward trend continue and is projecting a 1.7% increase in GDP.
In Turkey, our biggest foreign market, the World Bank expects economic growth to remain flat at the
prior-year level of 3.5% for 2017 owing to the country’s continued geopolitical instability.
In terms of exchange rates, the Turkish lira fell again against the euro in the first six months of 2017,
remaining at a very low level.
Ströer SE & Co. KGaA 11 Half-year financial report 6M/Q2 2017
RESULTS OF OPERATIONS OF THE GROUP
The Ströer Group also closed the second quarter of 2017 with strong revenue growth, with half-
yearly revenue up overall by EUR 95.1m to EUR 597.4m.1 In addition to the revenue from our newly
acquired companies, organic growth in both the Ströer Digital and OOH Germany segments was
once again one of the main drivers. By contrast, the performance of the OOH International segment
was less pleasing, with the difficult overall situation in particular in Turkey greatly hindering growth.
Overall, however, this downward development was more than offset by the continued positive
growth trend in the Digital and German OOH segments, with the Group overall reporting organic
revenue growth of 7.6%.
The noticeable climb in revenue was accompanied by a further increase in cost of sales. While
EUR 346.4m was incurred in the prior-year period, cost of sales came to EUR 404.8m in the current
period. The initial consolidation of the entities acquired drove up cost of sales, as did the higher
publisher fees in the Digital segment and higher production and other direct costs in the OOH
Germany segment owing to the rise in revenue. Gross profit totaled EUR 192.6m (prior year:
EUR 155.9m).
The development of selling and administrative expenses also reflects the continued expansion of
the Ströer Group with its newly acquired entities. At the same time, the ongoing expansion of the
local sales organization for digital and OOH products in Germany also led to further cost increases.
Overall, selling and administrative expenses were up from EUR 129.2m in the prior-year period to
EUR 161.4m, or expressed as a percentage of revenue, up slightly from 25.7% to 27.0%. By
contrast, net other operating income and expenses showed a moderate improvement. While
EUR 5.0m was reported in the prior year, the Group is disclosing a net total of EUR 7.9m for the first
six months of the current fiscal year. The share in profit or loss of equity method investees
continued to show a slight upward trend and was up EUR 0.6m year on year to EUR 2.9m.
The strong growth in the operating business lifted the Ströer Group’s EBIT up from EUR 34.0m to
EUR 42.0m. At the same time, operational EBITDA2 developed very positively again, growing
significantly from EUR 115.4m to EUR 135.9m. Return on capital employed (ROCE) stood at 16.4%
(prior year: 17.3%).
1 See section 7 of the notes for information on the reconciliation of revenue growth to organic growth. 2 See section 6 of the notes for information on the reconciliation of EBITDA to operational EBITDA.
Ströer SE & Co. KGaA 12 Half-year financial report 6M/Q2 2017
With regard to the financial result, the Group benefited, among other things, from the more
favorable interest conditions renegotiated in December 2016, with the financial result improving
from EUR -5.1m to EUR -3.6m.
In line with a further increase in profit before taxes, the tax expense rose to EUR 4.9m (prior year:
EUR 3.1m).
By driving forward our profitable growth strategy, the Ströer Group once again grew its
consolidated profit in the first six months of 2017 from EUR 25.9m to EUR 33.5m. Adjusted
consolidated profit amounted to EUR 70.1m (prior year: EUR 61.3m).

Ströer SE & Co. KGaA 13 Half-year financial report 6M/Q2 2017
FINANCIAL POSITION
Liquidity and investment analysis
In EUR m 6M 2017 6M 2016
(1) Cash flows from operating activities 80.4 83.4
(2) Cash received from the disposal of intangible assets and property, plant and equipment 6.0 2.8
(3) Cash paid for investments in intangible assets and property, plant and equipment -66.7 -45.6
(4) Cash paid for investments in financial assets -0.7 -0.4
(5) Cash received from and cash paid for the acquisition of consolidated entities -6.4 -106.0
(6) Cash flows from investing activities -67.8 -149.1
(7) Free cash flow 12.6 -65.7
(8) Cash flows from financing activities -12.6 74.2
(9) Change in cash -0.1 8.5
(10) Cash at the end of the period 64.1 65.0
(7)-(5)-(4) Free cash flow before M&A transactions 19.6 40.7
In the first six months of 2017, the Ströer Group generated cash flows from operating activities
of EUR 80.4m, slightly short of the prior-year record result of EUR 83.4m. Although the Group’s
EBITDA clearly improved again, rising by EUR 20.3m, this increase was fully offset by a considerable
increase of EUR 17.7m in tax payments and negative changes in working capital of EUR 3.6m. The
significant increase in tax payments mainly reflects the tax backpayments for fiscal years up to 2015.
Additional payments relating to the utilization of restructuring provisions (EUR 9.1m) also cast a
shadow over the good development in the operating business.
In relation to cash flows from investing activities (EUR -67.8m), the Group’s cash outflows were
considerably lower in the first six months of the current fiscal year than in the comparative prior-year
period (EUR -149.1m). While 2016 was still shaped by extensive M&A transactions, in particular in
connection with the acquisition of the Statista Group, purchase price payments for business
combinations have only been of minor significance year to date. By contrast, cash paid for
investments in intangible assets and property, plant and equipment in connection with extended
investing activities is well above the prior-year level. Overall, the free cash flow before M&A
transactions came to EUR 19.6m (prior year: EUR 40.7m). The free cash flow amounted to
EUR 12.6m (prior year: EUR -65.7m).
Ströer SE & Co. KGaA 14 Half-year financial report 6M/Q2 2017
Due to the decrease in cash paid for M&A transactions, cash flows from financing activities also
decreased. In terms of the composition of cash flows, EUR 61.6m related to the payment of
dividends, of which the largest portion of EUR 60.8m went to the shareholders of Ströer SE & Co.
KGaA. In addition, a total of EUR 23.2m was invested in additional shares in entities in which the
Ströer Group already held a majority interest. In relation to the raising and repayment of borrowings,
the amounts reported in the prior year were significantly higher as Ströer placed a note loan on the
capital market in June 2016 and used the funds raised to repay credit lines drawn down.
Cash stood at EUR 64.1m as of the reporting date.
Financial structure analysis
The development of non-current liabilities largely reflects the continued growth course of the
Ströer Group. The increase of EUR 61.6m to EUR 658.8m is mainly attributable to the additions to
non-current financial liabilities amounting to EUR 70.2m. By contrast, deferred tax liabilities were
down by a noticeable EUR 9.6m. This decrease can be attributed to the ongoing amortization of
recognized hidden reserves.
Current liabilities were down from EUR 476.3m as of 31 December 2016 to EUR 443.8m, due to
customary fluctuations in trade payables along with the utilization of extensive restructuring
provisions. These decreases, however, were partly offset by higher other liabilities.
The Ströer Group’s equity was down EUR 36.1m on the year-end figure to EUR 621.8m, mainly as a
result of the EUR 60.8m dividend distribution to shareholders of Ströer SE & Co. KGaA. This
distribution was contrasted by a consolidated profit of EUR 33.5m for the first six months of 2017.
The equity ratio stood at 36.1% as of the reporting date.
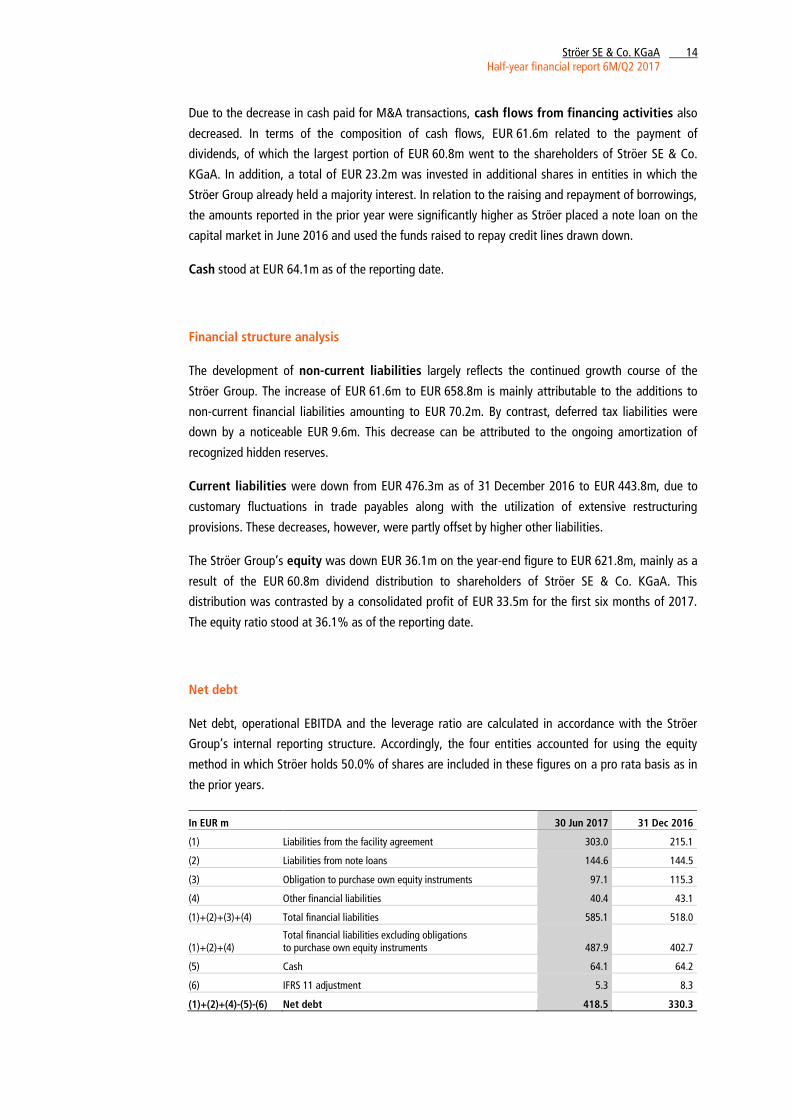
Net debt
Net debt, operational EBITDA and the leverage ratio are calculated in accordance with the Ströer
Group’s internal reporting structure. Accordingly, the four entities accounted for using the equity
method in which Ströer holds 50.0% of shares are included in these figures on a pro rata basis as in
the prior years.
In EUR m 30 Jun 2017 31 Dec 2016
(1) Liabilities from the facility agreement 303.0 215.1
(2) Liabilities from note loans 144.6 144.5
(3) Obligation to purchase own equity instruments 97.1 115.3
(4) Other financial liabilities 40.4 43.1
(1)+(2)+(3)+(4) Total financial liabilities 585.1 518.0
(1)+(2)+(4) Total financial liabilities excluding obligations to purchase own equity instruments 487.9 402.7
(5) Cash 64.1 64.2
(6) IFRS 11 adjustment 5.3 8.3
(1)+(2)+(4)-(5)-(6) Net debt 418.5 330.3
Ströer SE & Co. KGaA 15 Half-year financial report 6M/Q2 2017
In the first six months of 2017, net debt of the Ströer Group stood at EUR 418.5m, an increase of
EUR 88.2m on the year-end figure. This debt gives rise to a leverage ratio, defined as the ratio of net
debt to operational EBITDA, of 1.38 as of 30 June 2017. Although the leverage ratio worsened for
seasonal reasons compared with the ratio of 1.17 at the end of fiscal year 2016, it further improved
on the ratio of 1.49 as of 30 June of the prior year.

Ströer SE & Co. KGaA 16 Half-year financial report 6M/Q2 2017
NET ASSETS
Analysis of the net asset structure
Non-current assets fell by EUR 13.1m from EUR 1,446.5m to EUR 1,433.3m in the current fiscal
year. This decrease chiefly relates to the EUR 29.1m fall in intangible assets due to regular
amortization which was only partly offset by new investments. By contrast, the Group reported a
slight increase in property, plant and equipment of EUR 12.4m, which was primarily due to
investments in our advertising media portfolio. The changes in the other items of non-current assets
were of marginal importance.
The increase in current assets from EUR 284.8m to EUR 291.0m is largely attributable to other
assets, in particular, the lease prepayments for our advertising rights contracts which are customarily
higher during the year. There were no other significant changes to report.

Ströer SE & Co. KGaA 17 Half-year financial report 6M/Q2 2017
RESULTS OF OPERATIONS OF THE SEGMENTS
Ströer Digital
In EUR m Q2 2017 Q2 2016 Change 6M 2017 6M 2016 Change
Segment revenue, thereof 154.5 117.1 37.5 32.0% 302.4 210.3 92.2 43.8%
Display 58.8 59.2 -0.4 -0.6% 121.9 110.9 11.0 9.9%
Video 28.7 24.7 4.0 16.1% 50.7 43.2 7.5 17.4%
Transactional 67.0 33.1 33.8 >100% 129.8 56.2 73.7 >100%
Operational EBITDA 41.7 30.6 11.2 36.5% 76.9 54.6 22.4 40.9%
Operational EBITDA margin 27.0% 26.1% 0.9 percentage
points 25.4% 26.0% -0.5 percentage
points
The Ströer Digital segment saw its revenue grow further across all product groups in the first six
months of 2017. Our investments in other digital business models (e.g., subscription and e-
commerce models), with the revenue contributions recorded under the new transactional product
group, also contributed to strong revenue growth. Our public video business and the expansion of
our sales operations for local digital solutions geared to small and medium-sized companies also
significantly boosted growth. As Ströer is continually adding to and expanding its business, the
segment figures can only be compared with those of the prior year to a limited extent. The
integration and targeted restructuring of the newly acquired companies was driven forward in the
reporting period and we are frequently able to leverage synergies and economies of scale on both
the revenue and cost side.
Out-of-Home Germany
In EUR m Q2 2017 Q2 2016 Change 6M 2017 6M 2016 Change
Segment revenue, thereof 135.6 126.3 9.2 7.3% 249.5 234.6 14.9 6.4%
Large formats 65.5 61.5 3.9 6.4% 111.7 109.5 2.2 2.0%
Street furniture 35.0 32.5 2.5 7.8% 69.8 65.8 4.1 6.2%
Transport 16.3 15.7 0.6 3.9% 30.3 28.9 1.4 4.8%
Other 18.8 16.6 2.2 13.2% 37.7 30.4 7.3 24.0%
Operational EBITDA 40.2 34.2 5.9 17.4% 66.4 59.1 7.4 12.4%
Operational EBITDA margin 29.6% 27.1% 2.5 percentage
points 26.6% 25.2% 1.4 percentage
points
With business remaining robust, revenue growth in the OOH Germany segment remained strong in
the second quarter of 2017. This growth was once again largely driven by regional business in light
of the continued expansion of the local sales organization.
All product groups performed well in the second quarter. The large formats product group, which
focuses on national as well as regional and local customer groups, reported significant growth in the
second quarter following a decline in revenue in the first three months. Revenue for the first six
months came to EUR 111.7m (prior year: EUR 109.5m). This increase was largely fueled by ongoing
robust demand for out-of-home media and our stepped-up sales activities. Our street furniture
product group, which is more targeted at national and international customer groups, grew tangibly
Ströer SE & Co. KGaA 18 Half-year financial report 6M/Q2 2017
once more compared with the first quarter, generating revenue for the first six months of EUR 69.8m
(prior year: EUR 65.8m). The performance of this product group was bolstered by robust demand
from media agencies for these product formats. By contrast, the further growth of the transport
product group primarily reflects the growing business with our local customer groups, with revenue
at the end of the first six months amounting to EUR 30.3m (prior year: EUR 28.9m). In addition, the
other segment was also significantly buoyed by the expansion of the local sales organization, with
strong revenue growth in business from both our regional and local customers who are traditionally
more interested in full-service solutions – including the production of advertising materials. This
product group also reports continued growth in revenue generated with local customers from our
new roadside screen products.
The ongoing upward trend in revenue also led to a corresponding increase in cost of sales, which is
largely reflected by the increase in production and other direct costs. Overall, the segment generated
operational EBITDA of EUR 66.4m in the first six months (prior year: EUR 59.1m). The operational
EBITDA margin improved to 26.6% (prior year: 25.2%).
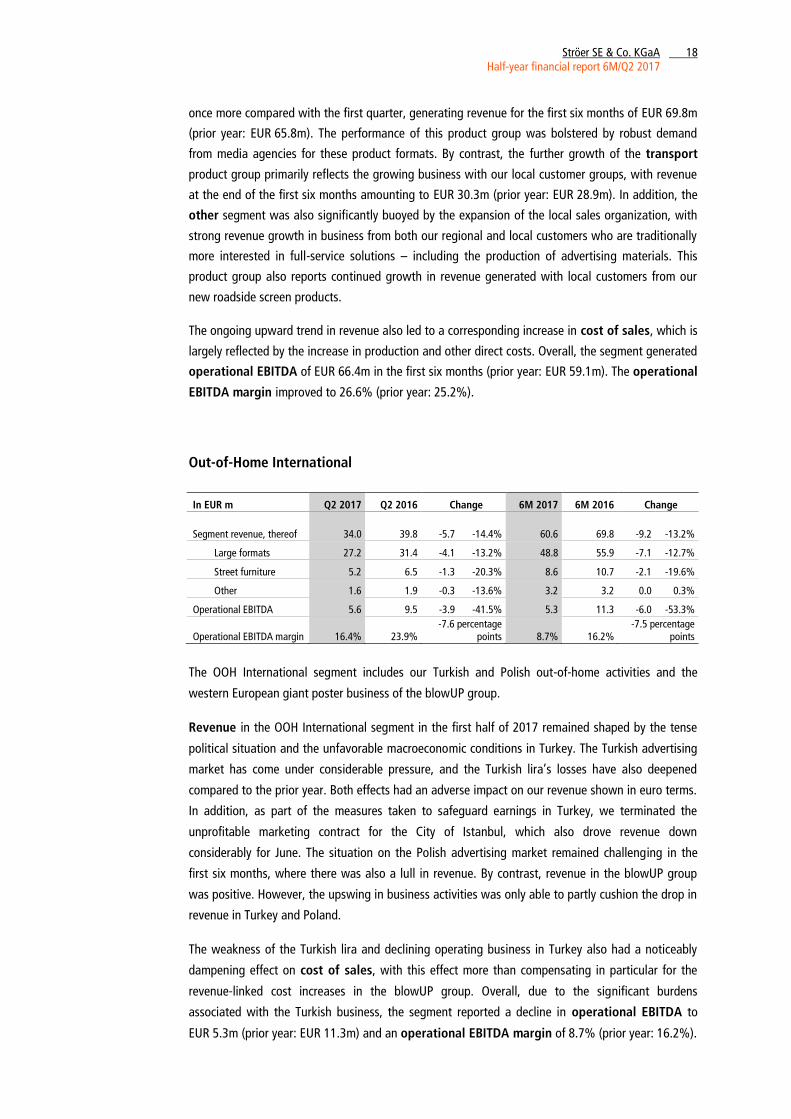
Out-of-Home International
In EUR m Q2 2017 Q2 2016 Change 6M 2017 6M 2016 Change
Segment revenue, thereof 34.0 39.8 -5.7 -14.4% 60.6 69.8 -9.2 -13.2%
Large formats 27.2 31.4 -4.1 -13.2% 48.8 55.9 -7.1 -12.7%
Street furniture 5.2 6.5 -1.3 -20.3% 8.6 10.7 -2.1 -19.6%
Other 1.6 1.9 -0.3 -13.6% 3.2 3.2 0.0 0.3%
Operational EBITDA 5.6 9.5 -3.9 -41.5% 5.3 11.3 -6.0 -53.3%
Operational EBITDA margin 16.4% 23.9% -7.6 percentage
points 8.7% 16.2% -7.5 percentage
points
The OOH International segment includes our Turkish and Polish out-of-home activities and the
western European giant poster business of the blowUP group.
Revenue in the OOH International segment in the first half of 2017 remained shaped by the tense
political situation and the unfavorable macroeconomic conditions in Turkey. The Turkish advertising
market has come under considerable pressure, and the Turkish lira’s losses have also deepened
compared to the prior year. Both effects had an adverse impact on our revenue shown in euro terms.
In addition, as part of the measures taken to safeguard earnings in Turkey, we terminated the
unprofitable marketing contract for the City of Istanbul, which also drove revenue down
considerably for June. The situation on the Polish advertising market remained challenging in the
first six months, where there was also a lull in revenue. By contrast, revenue in the blowUP group
was positive. However, the upswing in business activities was only able to partly cushion the drop in
revenue in Turkey and Poland.
The weakness of the Turkish lira and declining operating business in Turkey also had a noticeably
dampening effect on cost of sales, with this effect more than compensating in particular for the
revenue-linked cost increases in the blowUP group. Overall, due to the significant burdens
associated with the Turkish business, the segment reported a decline in operational EBITDA to
EUR 5.3m (prior year: EUR 11.3m) and an operational EBITDA margin of 8.7% (prior year: 16.2%).
Ströer SE & Co. KGaA 19 Half-year financial report 6M/Q2 2017
EMPLOYEES
The Ströer Group employed a total of 4,567 people as of 30 June 2017 (31 December 2016: 4,577).
2,707 thereof are Ströer Digital employees, 1,147 OOH Germany employees, 352 OOH International
employees and 361 are employed at the holding company.
OPPORTUNITIES AND RISKS
Our comments in the group management report as of 31 December 2016 remain applicable with
regard to the presentation of opportunities and risks (see pages 57 to 62 of our 2016 annual report).
As in the past, we are currently not aware of any risks to the Company’s ability to continue as a
going concern. Any material divergence from the planning assumptions used for the individual
segments and any changes in the external parameters applied to calculate the cost of capital could
lead to the impairment of intangible assets or goodwill.
FORECAST
For 2017 as a whole, we forecast organic revenue growth in the mid to high single-digit percentage
range and expect operational EBITDA to amount to more than EUR 320m.
SUBSEQUENT EVENTS
See the disclosures made in consolidated interim financial statements for information on subsequent
events.
Ströer SE & Co. KGaA 20 Half-year financial report 6M/Q2 2017
CONSOLIDATED INTERIM FINANCIAL STATEMENTS
Consolidated interim financial statements
Consolidated income statement 21
Consolidated statement of comprehensive income 22
Consolidated statement of financial position 23
Consolidated statement of cash flows 24
Consolidated statement of changes in equity 25
Notes to the condensed consolidated interim financial statements 26
Responsibility statement 39
Ströer SE & Co. KGaA 21 Half-year financial report 6M/Q2 2017
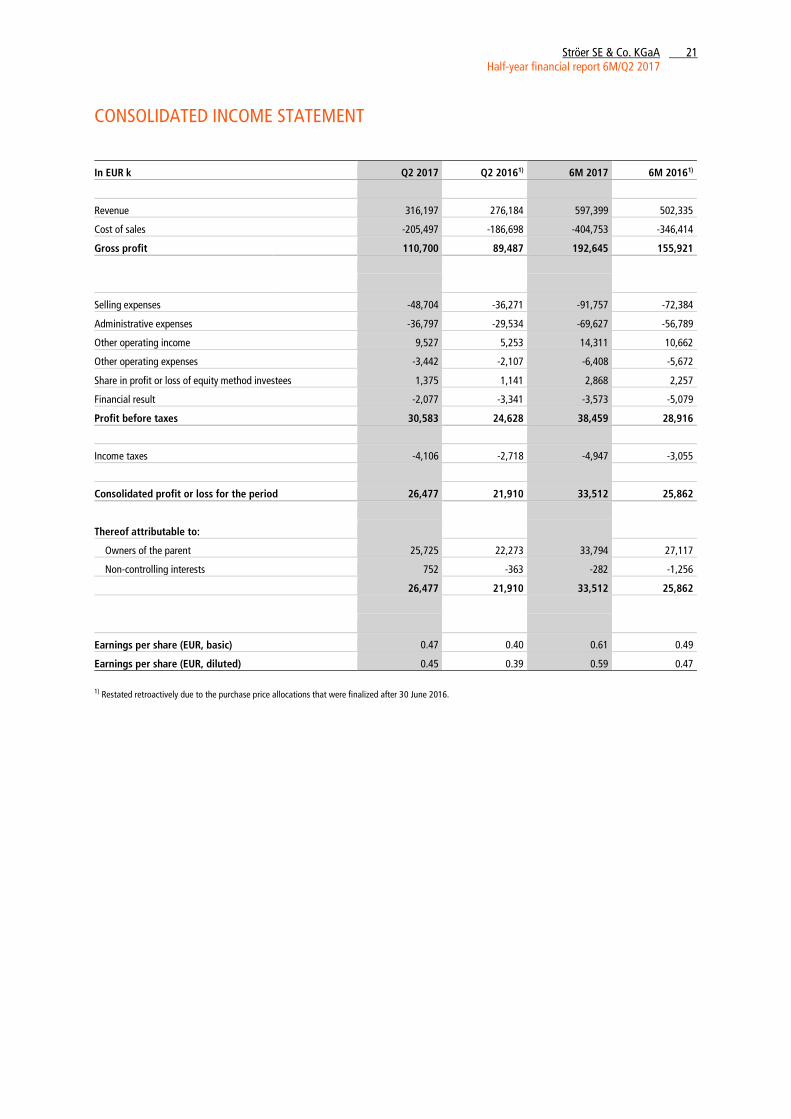
CONSOLIDATED INCOME STATEMENT
In EUR k Q2 2017 Q2 20161) 6M 2017 6M 20161)
Revenue 316,197 276,184 597,399 502,335
Cost of sales -205,497 -186,698 -404,753 -346,414
Gross profit 110,700 89,487 192,645 155,921
Selling expenses -48,704 -36,271 -91,757 -72,384
Administrative expenses -36,797 -29,534 -69,627 -56,789
Other operating income 9,527 5,253 14,311 10,662
Other operating expenses -3,442 -2,107 -6,408 -5,672
Share in profit or loss of equity method investees 1,375 1,141 2,868 2,257
Financial result -2,077 -3,341 -3,573 -5,079
Profit before taxes 30,583 24,628 38,459 28,916
Income taxes -4,106 -2,718 -4,947 -3,055
Consolidated profit or loss for the period 26,477 21,910 33,512 25,862
Thereof attributable to:
Owners of the parent 25,725 22,273 33,794 27,117
Non-controlling interests 752 -363 -282 -1,256
26,477 21,910 33,512 25,862
Earnings per share (EUR, basic) 0.47 0.40 0.61 0.49
Earnings per share (EUR, diluted) 0.45 0.39 0.59 0.47
1) Restated retroactively due to the purchase price allocations that were finalized after 30 June 2016.

Ströer SE & Co. KGaA 22 Half-year financial report 6M/Q2 2017
CONSOLIDATED STATEMENT OF COMPREHENSIVE INCOME
In EUR k Q2 2017 Q2 20161) 6M 2017 6M 20161)
Consolidated profit or loss for the period 26,477 21,910 33,512 25,862
Other comprehensive income
Amounts that will not be reclassified to profit or loss
in future periods
Actuarial gains and losses 0 0 0 0
Income taxes 0 0 312 0
0 0 312 0
Amounts that could be reclassified to profit or loss
in future periods
Exchange differences on translating foreign operations -2,360 -862 -5,294 -2,284
Income taxes 101 -12 242 31
-2,260 -874 -5,052 -2,253
Other comprehensive income, net of income taxes -2,260 -874 -4,740 -2,253
Total comprehensive income, net of income taxes 24,218 21,035 28,772 23,609
Thereof attributable to:
Owners of the parent 23,645 21,311 29,539 24,831
Non-controlling interests 573 -275 -767 -1,222
24,218 21,035 28,772 23,609
1) Restated retroactively due to the purchase price allocations that were finalized after 30 June 2016.
Ströer SE & Co. KGaA 23 Half-year financial report 6M/Q2 2017
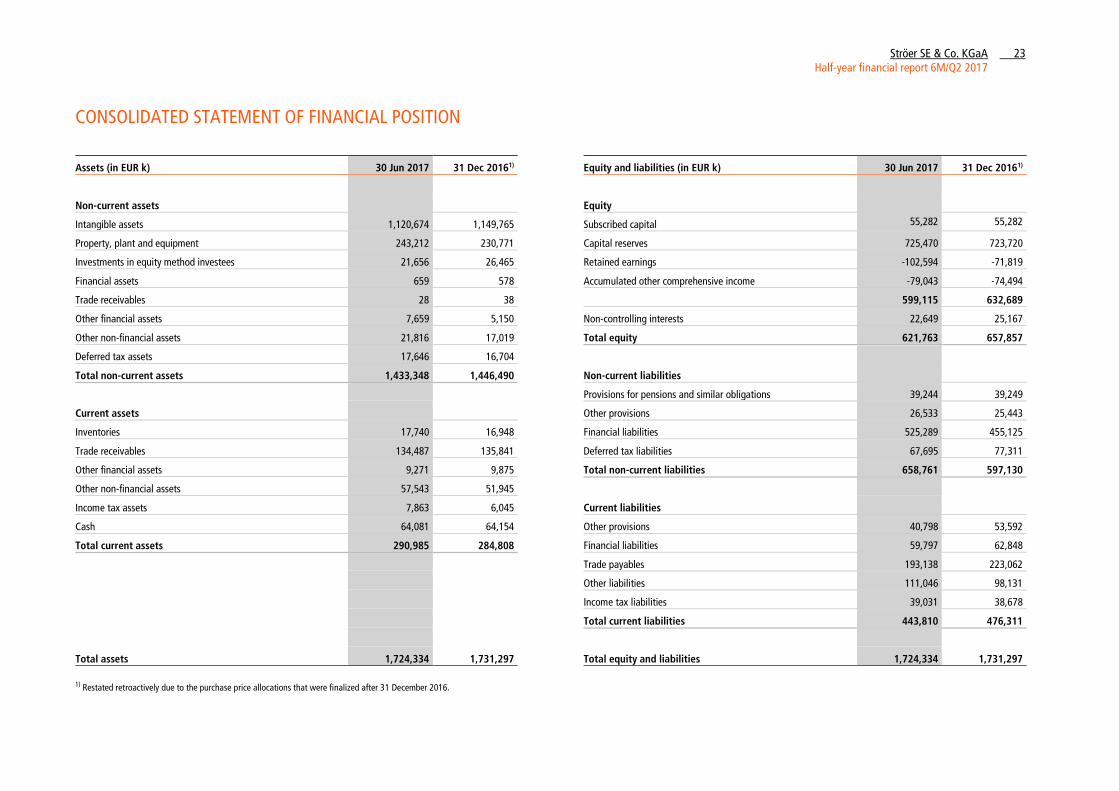
CONSOLIDATED STATEMENT OF FINANCIAL POSITION
Assets (in EUR k) 30 Jun 2017 31 Dec 20161)
Non-current assets
Intangible assets 1,120,674 1,149,765
Property, plant and equipment 243,212 230,771
Investments in equity method investees 21,656 26,465
Financial assets 659 578
Trade receivables 28 38
Other financial assets 7,659 5,150
Other non-financial assets 21,816 17,019
Deferred tax assets 17,646 16,704
Total non-current assets 1,433,348 1,446,490
Current assets
Inventories 17,740 16,948
Trade receivables 134,487 135,841
Other financial assets 9,271 9,875
Other non-financial assets 57,543 51,945
Income tax assets 7,863 6,045
Cash 64,081 64,154
Total current assets 290,985 284,808
Total assets 1,724,334 1,731,297
1) Restated retroactively due to the purchase price allocations that were finalized after 31 December 2016.
Equity and liabilities (in EUR k) 30 Jun 2017 31 Dec 20161)
Equity
Subscribed capital 55,282 55,282
Capital reserves 725,470 723,720
Retained earnings -102,594 -71,819
Accumulated other comprehensive income -79,043 -74,494
599,115 632,689
Non-controlling interests 22,649 25,167
Total equity 621,763 657,857
Non-current liabilities
Provisions for pensions and similar obligations 39,244 39,249
Other provisions 26,533 25,443
Financial liabilities 525,289 455,125
Deferred tax liabilities 67,695 77,311
Total non-current liabilities 658,761 597,130
Current liabilities
Other provisions 40,798 53,592
Financial liabilities 59,797 62,848
Trade payables 193,138 223,062
Other liabilities 111,046 98,131
Income tax liabilities 39,031 38,678
Total current liabilities 443,810 476,311
Total equity and liabilities 1,724,334 1,731,297

Ströer SE & Co. KGaA 24 Half-year financial report 6M/Q2 2017
CONSOLIDATED STATEMENT OF CASH FLOWS
In EUR k 6M 2017 6M 20161)
Cash flows from operating activities
Profit or loss for the period 33,512 25,862
Expenses (+)/income (-) from the financial and tax result 8,520 8,134
Amortization, depreciation and impairment losses (+) on non-current assets 80,688 68,423
Share in profit or loss of equity method investees -2,868 -2,257
Cash received from profit distributions of equity method investees 5,708 3,541
Interest paid (-) -3,229 -3,390
Interest received (+) 32 28
Income taxes paid (-)/received (+) -15,605 2,144
Increase (+)/decrease (-) in provisions -12,226 -7,861
Other non-cash expenses (+)/income (-) -925 -2,397
Gain (-)/loss (+) on disposals of non-current assets -2,052 -1,263
Increase (-)/decrease (+) in inventories, trade receivables and other assets -10,400 -4,325
Increase (+)/decrease (-) in trade payables and other liabilities -804 -3,247
Cash flows from operating activities 80,352 83,392
Cash flows from investing activities
Cash received (+) from the disposal of intangible assets and property, plant and equipment 5,984 2,820
Cash paid (-) for investments in intangible assets and property, plant and equipment -66,696 -45,557
Cash paid (-) for investments in equity method investees -690 -358
Cash received (+) from/paid (-) for the acquisition of consolidated entities -6,383 -105,980
Cash flows from investing activities -67,785 -149,075
Cash flows from financing activities
Dividend distribution (-) -61,572 -39,097
Cash paid (-) for the acquisition of shares not involving a change in control -23,212 -9,024
Cash received (+) from borrowings 94,315 246,390
Cash paid (-) to obtain and modify borrowings -200 -888
Cash repayments (-) of borrowings -21,971 -123,222
Cash flows from financing activities -12,640 74,158
Cash at the end of the period
Change in cash -73 8,475
Cash at the beginning of the period 64,154 56,503
Cash at the end of the period 64,081 64,978
Composition of cash
Cash 64,081 64,978
Cash at the end of the period 64,081 64,978
1) Restated retroactively due to the purchase price allocations that were finalized after 30 June 2016.
Ströer SE & Co. KGaA 25 Half-year financial report 6M/Q2 2017
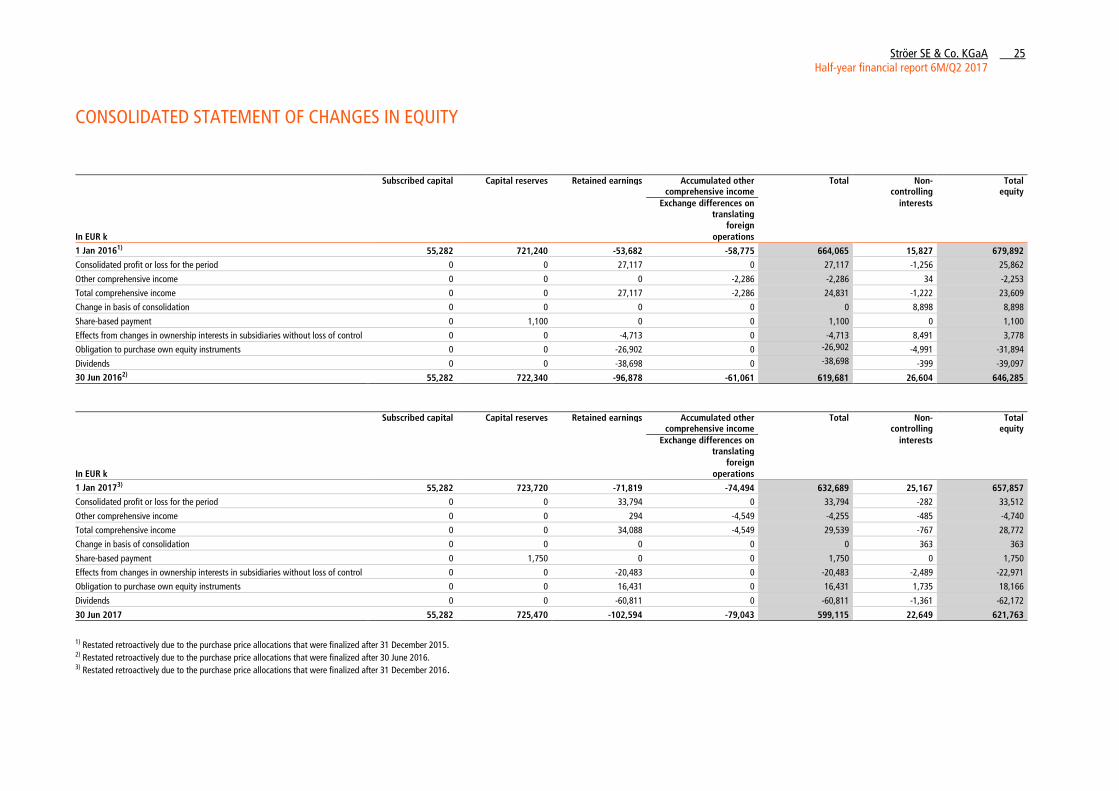
CONSOLIDATED STATEMENT OF CHANGES IN EQUITY
Subscribed capital Capital reserves Retained earnings Accumulated other Total Non- Total comprehensive income controlling equity
Exchange differences on interests translating
foreign
In EUR k operations
1 Jan 20161) 55,282 721,240 -53,682 -58,775 664,065 15,827 679,892
Consolidated profit or loss for the period 0 0 27,117 0 27,117 -1,256 25,862
Other comprehensive income 0 0 0 -2,286 -2,286 34 -2,253
Total comprehensive income 0 0 27,117 -2,286 24,831 -1,222 23,609
Change in basis of consolidation 0 0 0 0 0 8,898 8,898
Share-based payment 0 1,100 0 0 1,100 0 1,100
Effects from changes in ownership interests in subsidiaries without loss of control 0 0 -4,713 0 -4,713 8,491 3,778
Obligation to purchase own equity instruments 0 0 -26,902 0 -26,902 -4,991 -31,894
Dividends 0 0 -38,698 0 -38,698 -399 -39,097
30 Jun 20162) 55,282 722,340 -96,878 -61,061 619,681 26,604 646,285
Subscribed capital Capital reserves Retained earnings Accumulated other Total Non- Total comprehensive income controlling equity
Exchange differences on interests translating
foreign
In EUR k operations
1 Jan 20173) 55,282 723,720 -71,819 -74,494 632,689 25,167 657,857
Consolidated profit or loss for the period 0 0 33,794 0 33,794 -282 33,512
Other comprehensive income 0 0 294 -4,549 -4,255 -485 -4,740
Total comprehensive income 0 0 34,088 -4,549 29,539 -767 28,772
Change in basis of consolidation 0 0 0 0 0 363 363
Share-based payment 0 1,750 0 0 1,750 0 1,750
Effects from changes in ownership interests in subsidiaries without loss of control 0 0 -20,483 0 -20,483 -2,489 -22,971
Obligation to purchase own equity instruments 0 0 16,431 0 16,431 1,735 18,166
Dividends 0 0 -60,811 0 -60,811 -1,361 -62,172
30 Jun 2017 55,282 725,470 -102,594 -79,043 599,115 22,649 621,763
1) Restated retroactively due to the purchase price allocations that were finalized after 31 December 2015. 2) Restated retroactively due to the purchase price allocations that were finalized after 30 June 2016. 3) Restated retroactively due to the purchase price allocations that were finalized after 31 December 2016.
Ströer SE & Co. KGaA 26 Half-year financial report 6M/Q2 2017
NOTES TO THE CONDENSED CONSOLIDATED INTERIM FINANCIAL
STATEMENTS
General
1 Information on the Company and the Group
Ströer SE & Co. KGaA is a listed corporation. The Company has its registered office at Ströer-Allee 1,
50999 Cologne. It is entered in the Cologne commercial register under HRB no. 86922.
See the relevant explanations in the consolidated financial statements as of 31 December 2016 for a
detailed description of the Group’s structure and its operating segments.
2 Basis of preparation of the financial statements
The consolidated interim financial statements for the period from 1 January to 30 June 2017 were
prepared in accordance with IAS 34, “Interim Financial Reporting.” The consolidated interim
financial statements must be read in conjunction with the consolidated financial statements as of
31 December 2016.
The disclosures required by IAS 34 on changes to items in the consolidated statement of financial
position (also known as a balance sheet), the consolidated income statement and the consolidated
statement of cash flows are made in the interim group management report.
Due to rounding differences, figures in tables may differ slightly from the actual figures.
The consolidated interim financial statements and interim group management report were not the
subject of a review.
Ströer SE & Co. KGaA 27 Half-year financial report 6M/Q2 2017
3 Accounting policies
The figures disclosed in these consolidated interim financial statements were determined in
accordance with International Financial Reporting Standards (IFRSs) as adopted by the EU. The
accounting policies applied in the consolidated financial statements as of 31 December 2016 were
also applied in these consolidated interim financial statements.
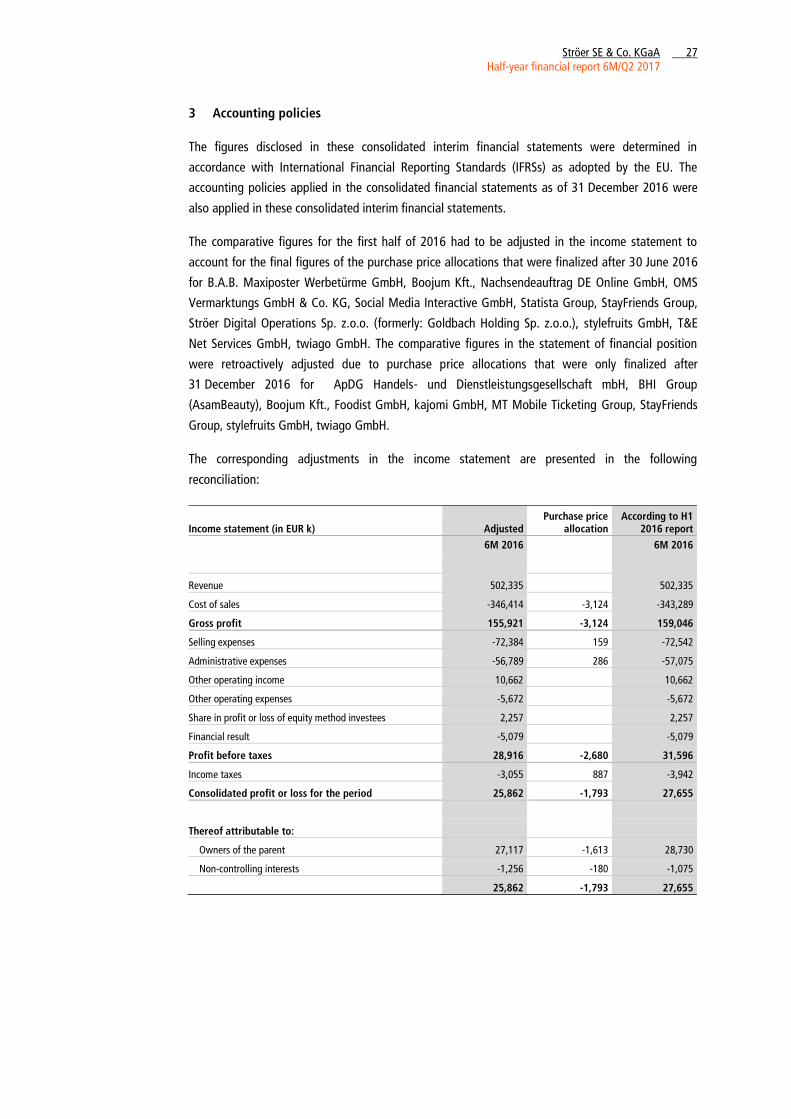
The comparative figures for the first half of 2016 had to be adjusted in the income statement to
account for the final figures of the purchase price allocations that were finalized after 30 June 2016
for B.A.B. Maxiposter Werbetürme GmbH, Boojum Kft., Nachsendeauftrag DE Online GmbH, OMS
Vermarktungs GmbH & Co. KG, Social Media Interactive GmbH, Statista Group, StayFriends Group,
Ströer Digital Operations Sp. z.o.o. (formerly: Goldbach Holding Sp. z.o.o.), stylefruits GmbH, T&E
Net Services GmbH, twiago GmbH. The comparative figures in the statement of financial position
were retroactively adjusted due to purchase price allocations that were only finalized after
31 December 2016 for ApDG Handels- und Dienstleistungsgesellschaft mbH, BHI Group
(AsamBeauty), Boojum Kft., Foodist GmbH, kajomi GmbH, MT Mobile Ticketing Group, StayFriends
Group, stylefruits GmbH, twiago GmbH.
The corresponding adjustments in the income statement are presented in the following
reconciliation:
Income statement (in EUR k) Adjusted Purchase price
allocation According to H1
2016 report
6M 2016 6M 2016
Revenue 502,335 502,335
Cost of sales -346,414 -3,124 -343,289
Gross profit 155,921 -3,124 159,046
Selling expenses -72,384 159 -72,542
Administrative expenses -56,789 286 -57,075
Other operating income 10,662 10,662
Other operating expenses -5,672 -5,672
Share in profit or loss of equity method investees 2,257 2,257
Financial result -5,079 -5,079
Profit before taxes 28,916 -2,680 31,596
Income taxes -3,055 887 -3,942
Consolidated profit or loss for the period 25,862 -1,793 27,655
Thereof attributable to:
Owners of the parent 27,117 -1,613 28,730
Non-controlling interests -1,256 -180 -1,075
25,862 -1,793 27,655

Ströer SE & Co. KGaA 28 Half-year financial report 6M/Q2 2017
The following overview provides a reconciliation of the original published statement of financial
position as of 31 December 2016 to the comparative figures as of 31 December 2016 contained in
the current half-year financial statements for 2017 following the purchase price allocations:
Assets (in EUR k) Adjusted Purchase price
allocation
According to 2016 annual
report
31 Dec 2016 31 Dec 2016
Non-current assets
Intangible assets 1,149,765 5,344 1,144,421
Property, plant and equipment 230,771 230,771
Investments in equity method investees 26,465 26,465
Financial assets 578 578
Trade receivables 38 38
Other financial assets 5,150 5,150
Other non-financial assets 17,019 17,019
Deferred tax assets 16,704 85 16,620
Total non-current assets 1,446,490 5,428 1,441,062
Current assets
Inventories 16,948 16,948
Trade receivables 135,841 -8 135,849
Other financial assets 9,875 1,311 8,564
Other non-financial assets 51,945 -298 52,243
Income tax assets 6,045 6,045
Cash 64,154 64,154
Total current assets 284,808 1,005 283,803
Total assets 1,731,297 6,433 1,724,865

Ströer SE & Co. KGaA 29 Half-year financial report 6M/Q2 2017
Equity and liabilities (in EUR k) Adjusted Purchase price
allocation
According to 2016 annual
report
31 Dec 2016 31 Dec 2016
Equity
Subscribed capital 55,282 55,282
Capital reserves 723,720 723,720
Retained earnings -71,819 -4,154 -67,664
Accumulated other comprehensive income -74,494 -74,494
632,689 -4,154 636,843
Non-controlling interests 25,167 2,328 22,840
Total equity 657,857 -1,827 659,683
Non-current liabilities
Provisions for pensions and similar obligations 39,249 39,249
Other provisions 25,443 25,443
Financial liabilities 455,125 455,125
Deferred tax liabilities 77,311 5,973 71,339
Total non-current liabilities 597,130 5,973 591,157
Current liabilities
Other provisions 53,592 299 53,293
Financial liabilities 62,848 -57 62,905
Trade payables 223,062 7 223,055
Other liabilities 98,131 -295 98,426
Income tax liabilities 38,678 2,332 36,346
Total current liabilities 476,311 2,287 474,025
Total equity and liabilities 1,731,297 6,433 1,724,865
See our explanations in the notes to the consolidated financial statements as of 31 December 2016
for standards that are not yet effective and the resulting changes in future financial statements.
With regard to IFRS 15, “Revenue from Contracts with Customers,” which is effective from
1 January 2018, we do not expect any significant quantitative effects on future consolidated
financial statements based on our analyses to date. However, these analyses are not yet complete
for the companies acquired in 2016 and 2017, such that a final assessment is not possible at this
time.
With respect to the new IFRS 16, “Leases,” we expect a significant increase in total equity and
liabilities due to the increase in lease liabilities and a comparable rise in non-current assets as a
result of the right-of-use assets to be recognized from leases for equipment and real estate as well
as for rental obligations for advertising locations. The increase in lease liabilities will lead to a
commensurate rise in net financial liabilities. In the future, instead of lease expenses, interest
expenses and write-downs will be recorded in the income statement which will lead to a significant
improvement in EBITDA. Our analyses of the quantitative impact on future consolidated financial
statements have yet to be completed at present. The standard becomes effective for fiscal years
Ströer SE & Co. KGaA 30 Half-year financial report 6M/Q2 2017
beginning on or after 1 January 2019; we currently expect to adopt the new provisions from
1 January 2018.
4 Accounting estimates
Preparation of the consolidated interim financial statements in compliance with IFRSs requires
management to make assumptions and estimates which have an impact on the figures disclosed in
the consolidated financial statements and consolidated interim financial statements. The estimates
are based on historical data and other information on the transactions concerned. Actual results may
differ from such estimates. The accounting estimates and assumptions applied in the consolidated
financial statements as of 31 December 2016 were also used to determine the estimated values
presented in these consolidated interim financial statements.
5 Related party disclosures
See the consolidated financial statements as of 31 December 2016 for information on related party
disclosures. To our knowledge, there were no significant changes as of 30 June 2017.
6 Segment information
The Ströer Group has bundled its business into three segments which operate independently on the
market in close cooperation with the group holding company Ströer SE & Co. KGaA. The three
segments are Ströer Digital, OOH Germany and OOH International. While the Ströer Digital segment
includes the public video business and the subscription and e-commerce business, the OOH
International segment comprises the business in Turkey and Poland as well as the giant poster
business blowUP.
The Ströer Group allocates its revenue to a total of seven product groups on the basis of the
products and services it provides. In addition to the four traditional product groups in the OOH
business, a further three product groups were defined from the beginning of fiscal year 2016 in the
Ströer Digital segment. Income from the commercialization of digital advertising is divided into
traditional display advertising revenue on the one hand and video marketing on the other. The third
product group comprises revenue from the subscription and e-commerce business which is reported
under the transactional product group.
Irrespective of the provisions under IFRS 11, segment reporting follows the management approach
under IFRS 8 according to which external segment reporting should follow the internal reporting
structure. The internal reporting structure of the Ströer Group is based on the concept of
proportionate consolidation of joint ventures. As a result, despite the provisions under IFRS 11, 50%
of the four joint ventures’ earnings contributions are included in all segment figures as in the past. In
contrast to the presentation in the income statement, they are not presented as a single net line item
according to the equity method.
Ströer SE & Co. KGaA 31 Half-year financial report 6M/Q2 2017
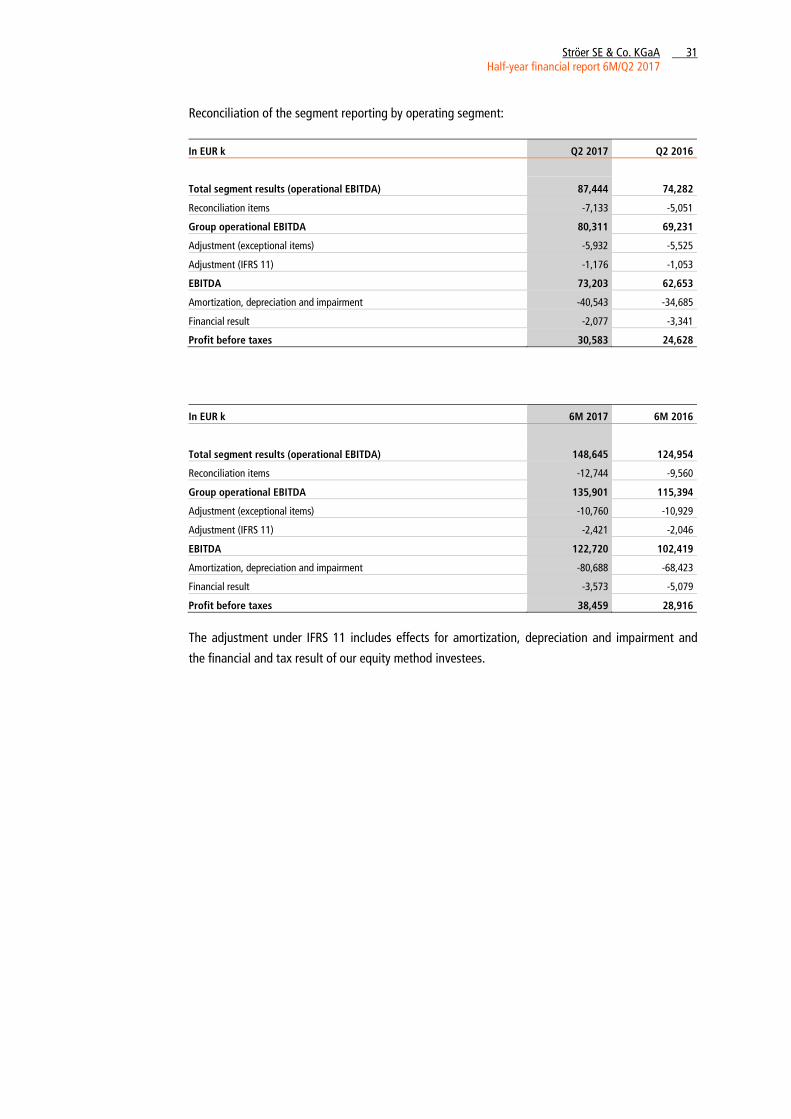
Reconciliation of the segment reporting by operating segment:
In EUR k Q2 2017 Q2 2016
Total segment results (operational EBITDA) 87,444 74,282
Reconciliation items -7,133 -5,051
Group operational EBITDA 80,311 69,231
Adjustment (exceptional items) -5,932 -5,525
Adjustment (IFRS 11) -1,176 -1,053
EBITDA 73,203 62,653
Amortization, depreciation and impairment -40,543 -34,685
Financial result -2,077 -3,341
Profit before taxes 30,583 24,628
In EUR k 6M 2017 6M 2016
Total segment results (operational EBITDA) 148,645 124,954
Reconciliation items -12,744 -9,560
Group operational EBITDA 135,901 115,394
Adjustment (exceptional items) -10,760 -10,929
Adjustment (IFRS 11) -2,421 -2,046
EBITDA 122,720 102,419
Amortization, depreciation and impairment -80,688 -68,423
Financial result -3,573 -5,079
Profit before taxes 38,459 28,916
The adjustment under IFRS 11 includes effects for amortization, depreciation and impairment and
the financial and tax result of our equity method investees.
Ströer SE & Co. KGaA 32 Half-year financial report 6M/Q2 2017
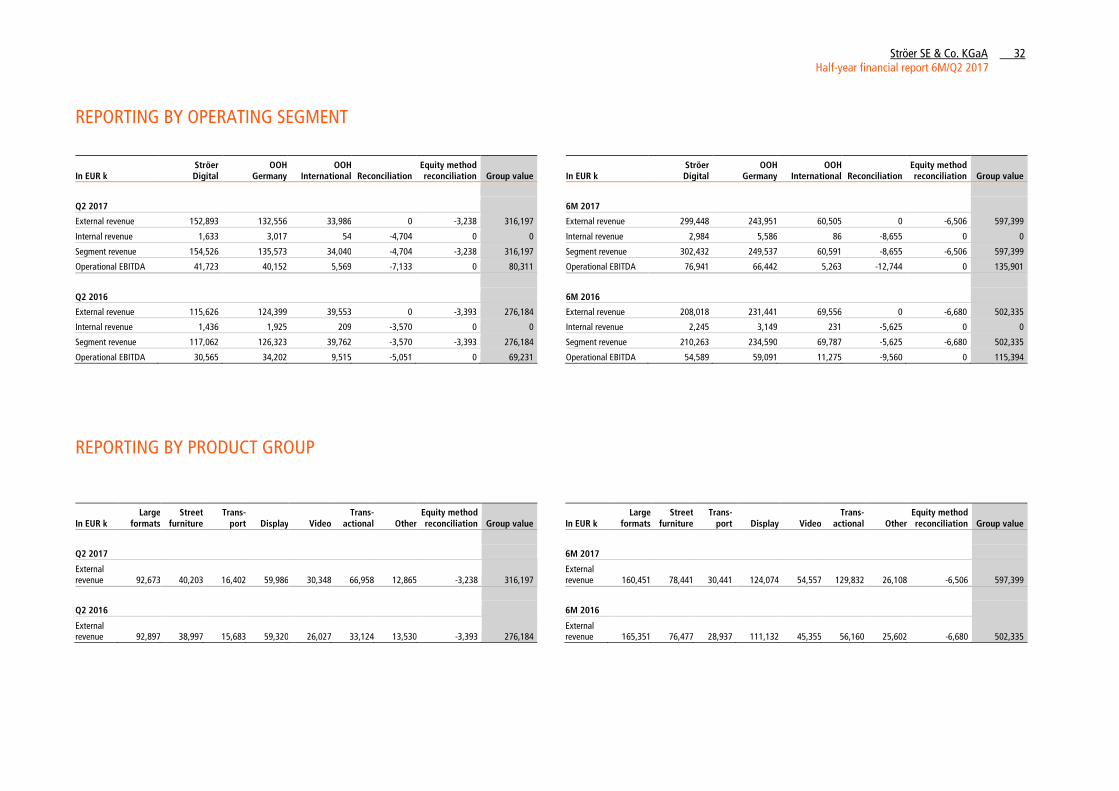
REPORTING BY OPERATING SEGMENT
In EUR k Ströer Digital
OOH Germany
OOH International Reconciliation
Equity method reconciliation Group value In EUR k
Ströer Digital
OOH Germany
OOH International Reconciliation
Equity method reconciliation Group value
Q2 2017 6M 2017
External revenue 152,893 132,556 33,986 0 -3,238 316,197 External revenue 299,448 243,951 60,505 0 -6,506 597,399
Internal revenue 1,633 3,017 54 -4,704 0 0 Internal revenue 2,984 5,586 86 -8,655 0 0
Segment revenue 154,526 135,573 34,040 -4,704 -3,238 316,197 Segment revenue 302,432 249,537 60,591 -8,655 -6,506 597,399
Operational EBITDA 41,723 40,152 5,569 -7,133 0 80,311 Operational EBITDA 76,941 66,442 5,263 -12,744 0 135,901
Q2 2016 6M 2016
External revenue 115,626 124,399 39,553 0 -3,393 276,184 External revenue 208,018 231,441 69,556 0 -6,680 502,335
Internal revenue 1,436 1,925 209 -3,570 0 0 Internal revenue 2,245 3,149 231 -5,625 0 0
Segment revenue 117,062 126,323 39,762 -3,570 -3,393 276,184 Segment revenue 210,263 234,590 69,787 -5,625 -6,680 502,335
Operational EBITDA 30,565 34,202 9,515 -5,051 0 69,231 Operational EBITDA 54,589 59,091 11,275 -9,560 0 115,394
REPORTING BY PRODUCT GROUP
In EUR k Large
formats Street
furniture Trans-
port Display Video Trans-
actional Other Equity method reconciliation Group value In EUR k
Large formats
Street furniture
Trans- port Display Video
Trans-actional Other
Equity method reconciliation Group value
Q2 2017 6M 2017
External revenue 92,673 40,203 16,402 59,986 30,348 66,958 12,865 -3,238 316,197
External revenue 160,451 78,441 30,441 124,074 54,557 129,832 26,108 -6,506 597,399
Q2 2016 6M 2016
External revenue 92,897 38,997 15,683 59,320 26,027 33,124 13,530 -3,393 276,184
External revenue 165,351 76,477 28,937 111,132 45,355 56,160 25,602 -6,680 502,335
Ströer SE & Co. KGaA 33 Half-year financial report 6M/Q2 2017
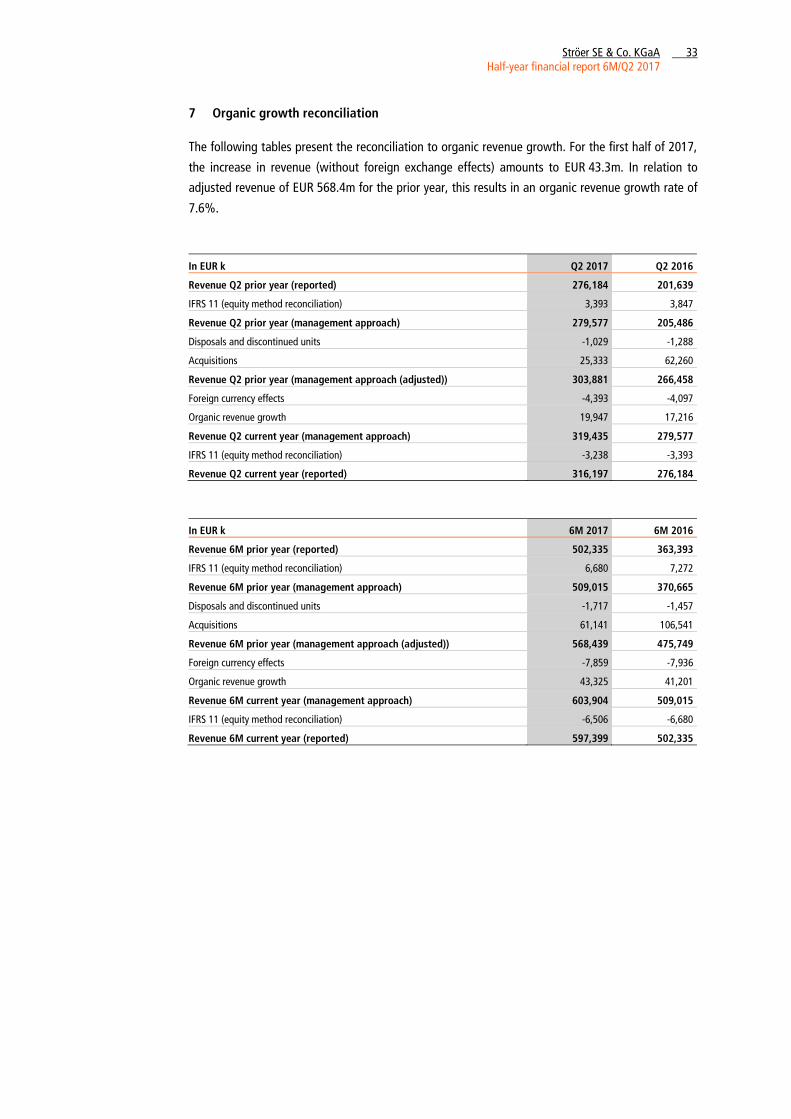
7 Organic growth reconciliation
The following tables present the reconciliation to organic revenue growth. For the first half of 2017,
the increase in revenue (without foreign exchange effects) amounts to EUR 43.3m. In relation to
adjusted revenue of EUR 568.4m for the prior year, this results in an organic revenue growth rate of
7.6%.
In EUR k Q2 2017 Q2 2016
Revenue Q2 prior year (reported) 276,184 201,639
IFRS 11 (equity method reconciliation) 3,393 3,847
Revenue Q2 prior year (management approach) 279,577 205,486
Disposals and discontinued units -1,029 -1,288
Acquisitions 25,333 62,260
Revenue Q2 prior year (management approach (adjusted)) 303,881 266,458
Foreign currency effects -4,393 -4,097
Organic revenue growth 19,947 17,216
Revenue Q2 current year (management approach) 319,435 279,577
IFRS 11 (equity method reconciliation) -3,238 -3,393
Revenue Q2 current year (reported) 316,197 276,184
In EUR k 6M 2017 6M 2016
Revenue 6M prior year (reported) 502,335 363,393
IFRS 11 (equity method reconciliation) 6,680 7,272
Revenue 6M prior year (management approach) 509,015 370,665
Disposals and discontinued units -1,717 -1,457
Acquisitions 61,141 106,541
Revenue 6M prior year (management approach (adjusted)) 568,439 475,749
Foreign currency effects -7,859 -7,936
Organic revenue growth 43,325 41,201
Revenue 6M current year (management approach) 603,904 509,015
IFRS 11 (equity method reconciliation) -6,506 -6,680
Revenue 6M current year (reported) 597,399 502,335
Ströer SE & Co. KGaA 34 Half-year financial report 6M/Q2 2017
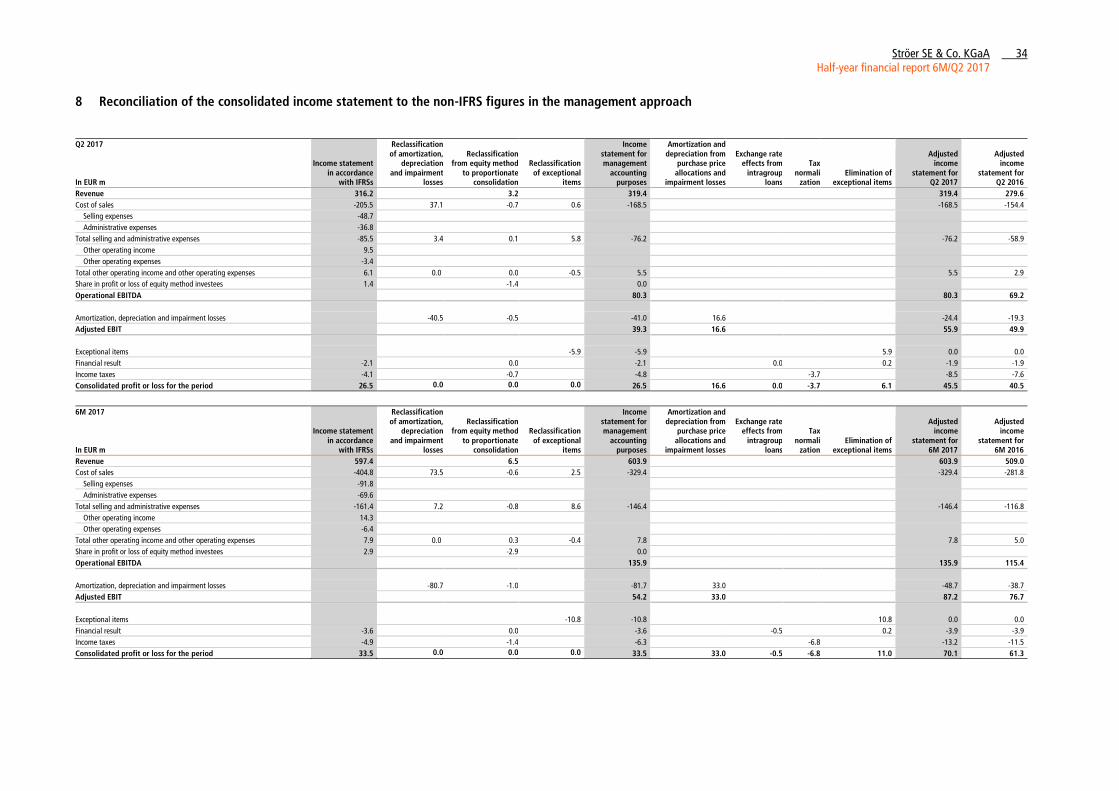
8 Reconciliation of the consolidated income statement to the non-IFRS figures in the management approach
Q2 2017 In EUR m
Income statement in accordance
with IFRSs
Reclassification of amortization,
depreciation and impairment
losses
Reclassification from equity method
to proportionate consolidation
Reclassification of exceptional
items
Income statement for management
accounting purposes
Amortization and depreciation from
purchase price allocations and
impairment losses
Exchange rate
effects from intragroup
loans
Tax normali
zation Elimination of
exceptional items
Adjusted income
statement for Q2 2017
Adjusted income
statement for Q2 2016
Revenue 316.2 3.2 319.4 319.4 279.6
Cost of sales -205.5 37.1 -0.7 0.6 -168.5 -168.5 -154.4
Selling expenses -48.7
Administrative expenses -36.8
Total selling and administrative expenses -85.5 3.4 0.1 5.8 -76.2 -76.2 -58.9
Other operating income 9.5
Other operating expenses -3.4
Total other operating income and other operating expenses 6.1 0.0 0.0 -0.5 5.5 5.5 2.9
Share in profit or loss of equity method investees 1.4 -1.4 0.0
Operational EBITDA 80.3 80.3 69.2
Amortization, depreciation and impairment losses -40.5 -0.5 -41.0 16.6 -24.4 -19.3
Adjusted EBIT 39.3 16.6 55.9 49.9
Exceptional items -5.9 -5.9 5.9 0.0 0.0
Financial result -2.1 0.0 -2.1 0.0 0.2 -1.9 -1.9
Income taxes -4.1 -0.7 -4.8 -3.7 -8.5 -7.6
Consolidated profit or loss for the period 26.5 0.0 0.0 0.0 26.5 16.6 0.0 -3.7 6.1 45.5 40.5
6M 2017 In EUR m
Income statement in accordance
with IFRSs
Reclassification of amortization,
depreciation and impairment
losses
Reclassification from equity method
to proportionate consolidation
Reclassification of exceptional
items
Income statement for management
accounting purposes
Amortization and depreciation from
purchase price allocations and
impairment losses
Exchange rate effects from
intragroup loans
Tax normali
zation Elimination of
exceptional items
Adjusted income
statement for 6M 2017
Adjusted income
statement for 6M 2016
Revenue 597.4 6.5 603.9 603.9 509.0
Cost of sales -404.8 73.5 -0.6 2.5 -329.4 -329.4 -281.8
Selling expenses -91.8
Administrative expenses -69.6
Total selling and administrative expenses -161.4 7.2 -0.8 8.6 -146.4 -146.4 -116.8
Other operating income 14.3
Other operating expenses -6.4
Total other operating income and other operating expenses 7.9 0.0 0.3 -0.4 7.8 7.8 5.0
Share in profit or loss of equity method investees 2.9 -2.9 0.0
Operational EBITDA 135.9 135.9 115.4
Amortization, depreciation and impairment losses -80.7 -1.0 -81.7 33.0 -48.7 -38.7
Adjusted EBIT 54.2 33.0 87.2 76.7
Exceptional items -10.8 -10.8 10.8 0.0 0.0
Financial result -3.6 0.0 -3.6 -0.5 0.2 -3.9 -3.9
Income taxes -4.9 -1.4 -6.3 -6.8 -13.2 -11.5
Consolidated profit or loss for the period 33.5 0.0 0.0 0.0 33.5 33.0 -0.5 -6.8 11.0 70.1 61.3
Ströer SE & Co. KGaA 35 Half-year financial report 6M/Q2 2017
Selected notes to the consolidated income statement, the consolidated statement of
financial position, the consolidated statement of cash flows and other notes
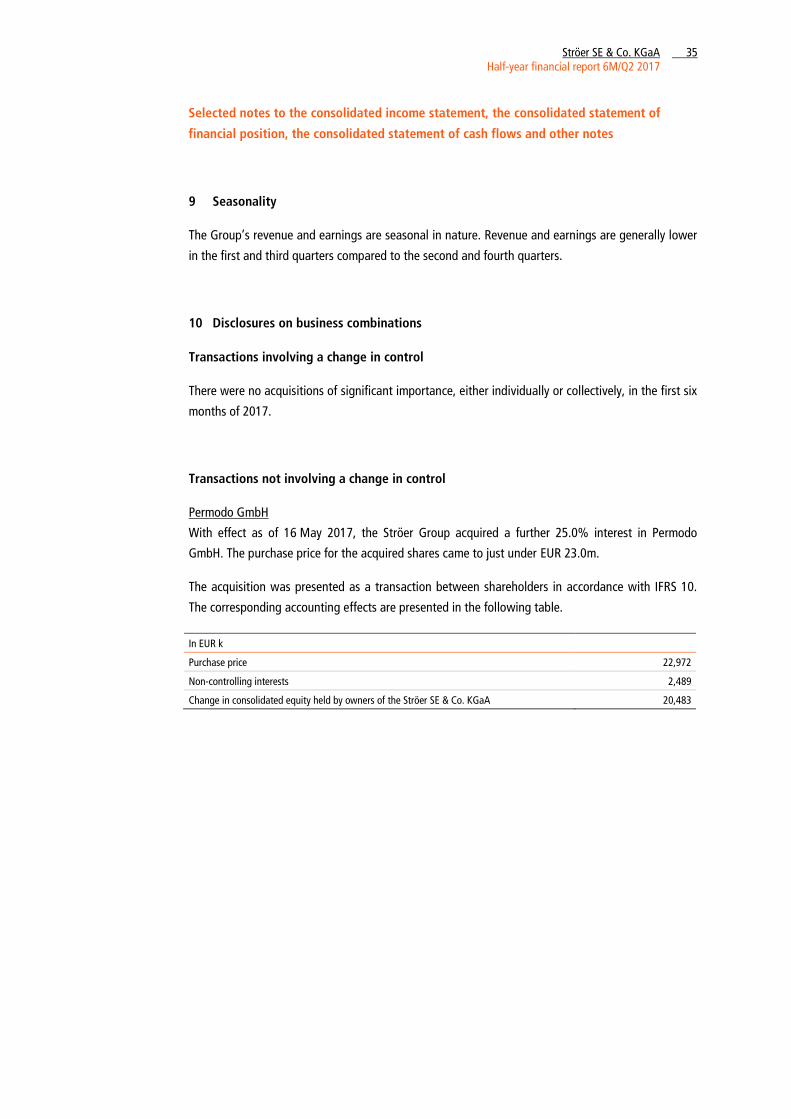
9 Seasonality
The Group’s revenue and earnings are seasonal in nature. Revenue and earnings are generally lower
in the first and third quarters compared to the second and fourth quarters.
10 Disclosures on business combinations
Transactions involving a change in control
There were no acquisitions of significant importance, either individually or collectively, in the first six
months of 2017.
Transactions not involving a change in control
Permodo GmbH
With effect as of 16 May 2017, the Ströer Group acquired a further 25.0% interest in Permodo
GmbH. The purchase price for the acquired shares came to just under EUR 23.0m.
The acquisition was presented as a transaction between shareholders in accordance with IFRS 10.
The corresponding accounting effects are presented in the following table.
In EUR k
Purchase price 22,972
Non-controlling interests 2,489
Change in consolidated equity held by owners of the Ströer SE & Co. KGaA 20,483
Ströer SE & Co. KGaA 36 Half-year financial report 6M/Q2 2017
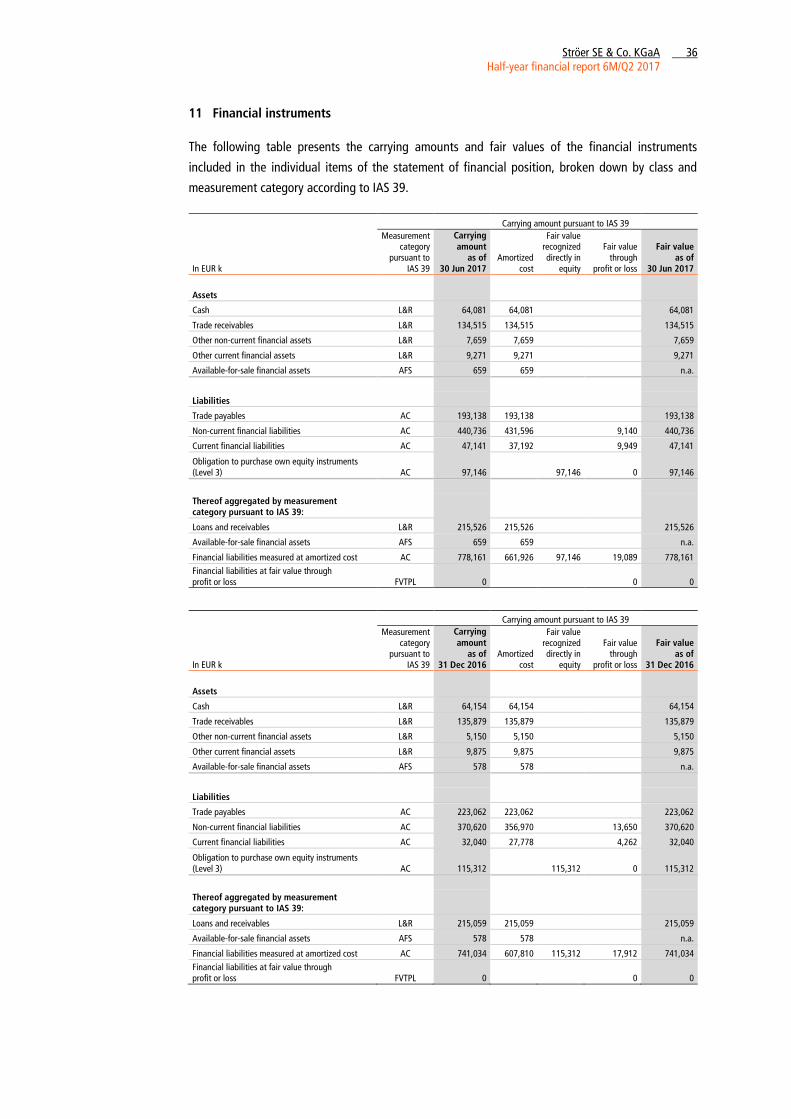
11 Financial instruments
The following table presents the carrying amounts and fair values of the financial instruments
included in the individual items of the statement of financial position, broken down by class and
measurement category according to IAS 39.
In EUR k
Carrying amount pursuant to IAS 39
Measurement category
pursuant to IAS 39
Carrying amount
as of 30 Jun 2017
Amortized cost
Fair value recognized directly in
equity
Fair value through
profit or loss
Fair value as of
30 Jun 2017
Assets
Cash L&R 64,081 64,081 64,081
Trade receivables L&R 134,515 134,515 134,515
Other non-current financial assets L&R 7,659 7,659 7,659
Other current financial assets L&R 9,271 9,271 9,271
Available-for-sale financial assets AFS 659 659 n.a.
Liabilities
Trade payables AC 193,138 193,138 193,138
Non-current financial liabilities AC 440,736 431,596 9,140 440,736
Current financial liabilities AC 47,141 37,192 9,949 47,141
Obligation to purchase own equity instruments (Level 3) AC 97,146 97,146 0 97,146
Thereof aggregated by measurement category pursuant to IAS 39:
Loans and receivables L&R 215,526 215,526 215,526
Available-for-sale financial assets AFS 659 659 n.a.
Financial liabilities measured at amortized cost AC 778,161 661,926 97,146 19,089 778,161
Financial liabilities at fair value through profit or loss FVTPL 0 0 0
In EUR k
Carrying amount pursuant to IAS 39
Measurement category
pursuant to IAS 39
Carrying amount
as of 31 Dec 2016
Amortized cost
Fair value recognized directly in
equity
Fair value through
profit or loss
Fair value as of
31 Dec 2016
Assets
Cash L&R 64,154 64,154 64,154
Trade receivables L&R 135,879 135,879 135,879
Other non-current financial assets L&R 5,150 5,150 5,150
Other current financial assets L&R 9,875 9,875 9,875
Available-for-sale financial assets AFS 578 578 n.a.
Liabilities 70,799
Trade payables AC 223,062 223,062 223,062
Non-current financial liabilities AC 370,620 356,970 13,650 370,620
Current financial liabilities AC 32,040 27,778 4,262 32,040
Obligation to purchase own equity instruments (Level 3) AC 115,312 115,312 0 115,312
Thereof aggregated by measurement category pursuant to IAS 39:
Loans and receivables L&R 215,059 215,059 215,059
Available-for-sale financial assets AFS 578 578 n.a.
Financial liabilities measured at amortized cost AC 741,034 607,810 115,312 17,912 741,034
Financial liabilities at fair value through profit or loss FVTPL 0 0 0

Ströer SE & Co. KGaA 37 Half-year financial report 6M/Q2 2017
Due to the short terms of cash, trade receivables, trade payables, other financial assets and current
financial liabilities, it is assumed that the fair values correspond to the carrying amounts.
The fair values of the liabilities to banks included in non-current financial liabilities are calculated as
the present values of the estimated future cash flows taking into account Ströer’s own credit risk
(Level 2 fair values). Market interest rates for the relevant maturity date are used for discounting. It
is therefore assumed as of the reporting date that the carrying amount of the non-current financial
liabilities is equal to the fair value.
The fair value hierarchy levels and their application to the Group’s assets and liabilities are described
below.
Level 1: Listed market prices are available in active markets for identical assets or liabilities.
Level 2: Quoted or market price on an active market for similar financial instruments or for identical
or similar financial instruments on a market that is not active or inputs other than quoted
prices that are based on observable market data.
Level 3: Valuation techniques that use inputs which are not based on observable market data.
Changes in the assessment of the level to be used for measuring the assets and liabilities are made
at the time any new facts are established. At present, derivative financial instruments are measured
at fair value in the consolidated financial statements and are all classified as Level 2. Additionally,
there are contingent purchase price liabilities from acquisitions as well as put options for shares in
various group entities that are each classified as Level 3.
Ströer SE & Co. KGaA 38 Half-year financial report 6M/Q2 2017
12 Subsequent events
Avedo Group
On 6 July 2017, the Ströer Group signed an agreement to acquire a total of 75.0% of the shares in
the Avedo Group, one of Germany’s leading dialog marketing specialists. By acquiring Avedo and
moving into the area of performance-based dialog marketing, Ströer adds an additional channel to
its portfolio. Avedo predominantly uses the chat and telephone channels to market third-party
products. The provisional purchase price for the acquired shares, including the redemption of
financial liabilities, came to EUR 87.3m.
Ranger Group
In addition, Ströer signed an agreement to acquire all of the shares in the Ranger Group on 1 August
2017. The Ranger Group is a direct sales specialist and sells products to private and corporate
customers on behalf of its clients in the telecommunications, energy, retail, financial services and
media sectors. The provisional purchase price for the acquired shares, including the redemption of
financial liabilities, comes to around EUR 45.5m.
Cologne, 10 August 2017
Udo Müller Christian Schmalzl Dr. Bernd Metzner
Co-CEO Co-CEO CFO
Ströer SE & Co. KGaA 39 Half-year financial report 6M/Q2 2017
RESPONSIBILITY STATEMENT
To the best of our knowledge, and in accordance with the applicable reporting principles for interim
financial reporting, the condensed consolidated interim financial statements give a true and fair view
of the assets, liabilities, financial position and profit or loss of the Group, and the interim
management report of the Group includes a true and fair view of the development and performance
of the business and the position of the Group, together with a description of the principal
opportunities and risks associated with the expected development of the Group for the remaining
months of the financial year.
Cologne, 10 August 2017
Ströer SE & Co. KGaA represented by:
Ströer Management SE (general partner)
Udo Müller Christian Schmalzl Dr. Bernd Metzner
Co-CEO Co-CEO CFO
Ströer SE & Co. KGaA 40 Half-year financial report 6M/Q2 2017
FINANCIAL CALENDAR
10 November 2017 Publication of the 9M/Q3 quarterly statement for 2017
IMPRINT
IR CONTACT PRESS CONTACT
Ströer SE & Co. KGaA Ströer SE & Co. KGaA
Dr. Bernd Metzner Marc Sausen
CFO Director Corporate Communications
Ströer-Allee 1 . 50999 Cologne Ströer-Allee 1 . 50999 Cologne
Phone +49 (0)2236 . 96 45-118 Phone +49 (0)2236 . 96 45-246
Fax +49 (0)2236 . 96 45-126 Fax +49 (0)2236 . 96 45-6246
[email protected] / [email protected] [email protected] / [email protected]
Publisher
Ströer SE & Co. KGaA
Ströer-Allee 1 . 50999 Cologne
Phone +49 (0)2236 . 96 45-0
Fax +49 (0)2236 . 96 45-299
Cologne Local Court
HRB no. 86922
VAT identification no.: DE811763883
This half-year financial report was published on 10 August 2017
and is available in German and English.
In the event of inconsistencies, the German version shall prevail.
DISCLAIMER
This half-year financial report contains forward-looking statements which entail risks and
uncertainties. The actual business development and results of Ströer SE & Co. KGaA and of the
Group may differ significantly from the assumptions made in this half-year financial report. This half-
year financial report does not constitute an offer to sell or an invitation to submit an offer to
purchase securities of Ströer SE & Co. KGaA. There is no obligation to update the statements made
in this half-year financial report.
Publisher
Ströer SE & Co. KGaA Ströer-Allee 1 . 50999 Cologne
+49 (0)2236 . 96 45-0 Phone +49 (0)2236 . 96 45-299 Fax