RIOCAN INVESTOR PRESENTATION
First Quarter 2013 May 14, 2013
TRANSFORMING…

Forward Looking Statements
2
Certain information included in this presentation contains forward-looking statements within the meaning of applicable securities laws including, among others, statements concerning our objectives, our strategies to achieve those objectives, as well as statements with respect to management's beliefs, plans, estimates, and intentions, and similar statements concerning anticipated future events, results, circumstances, performance or expectations that are not historical facts. Certain material factors, estimates or assumptions were applied in drawing a conclusion or making a forecast or projection as reflected in these statements and actual results could differ materially from such conclusions, forecasts or projections.
Additional information on the material risks that could cause our actual results to differ materially from the conclusions, forecast or projections in these statements and the material factors, estimates or assumptions that were applied in drawing a conclusion or making a forecast or projection as reflected in the forward-looking information can be found in our annual information form and annual report that are available on our website and at www.sedar.com.
Except as required by applicable law, RioCan undertakes no obligation to publicly update or revise any forward-looking statement, whether as a result of new information, future events or otherwise.

One of North America’s Largest Retail REITS
3
344 retail properties in Canada & U.S.
84 million sqft total portfolio
$8.4 billion market cap
54 million sqft owned
$14.4 billion enterprise value
~86% revenue generated by national and anchor tenants
~7,775 tenancies

Investment Highlights
4
Strong, reliable distribution yield provided to investors
Stable, dominant, and geographically diversified portfolio of national retail tenants
Disciplined growth strategy in Canada and U.S.
Positioned to benefit from robust acquisition activity and development pipeline
Experienced, performance driven management team
Conservative balance sheet / financial strength and access to capital

QC
PA
VA
Property Portfolio
5 As at March 31, 2013 at RioCan’s interest
CT
MA
BC
AB
ON
QC SA MB
NB
NFLD
294 retail properties
45 million sqft
85.7% annualized rental revenue
TX
GTA
50 retail properties
8.9 million sqft
14.3% annualized rental revenue

Property Portfolio – Canada
6
Calgary
Edmonton
Vancouver
Toronto
Montreal Ottawa
BC
AB
ON
QC
Annualized Rental Revenue by Major Market Proforma Post Acquisitions & Asset Sales
8.3%
Major markets
combined, 70.6%
Rest of Canada, 29.4%
5.9%
3.8%
3.7%
9.1%
39.8%

PA
VA
Property Portfolio – U.S.
7
RI CT
NH
MA
TX
Regional Market Strategy & Focus Annualized Rental Revenue by State
NY
MD
NJ
WV
55.1%
2.7%
0.9%
6.7%
2.1%
0.7%
3.0%
2.8%
21.6%
2.1%
2.3%
As at March 31, 2013
50 retail properties
8.9 million sqft

PA
VA
Property Portfolio – U.S.
8
RI CT
NH
MA
TX
Regional Market Strategy & Focus Annualized Rental Revenue by State – Proforma RPAI Transaction
NY
MD
NJ
WV
55.3%
2.7%
0.8%
6.6%
2.1%
0.7%
3.0%
2.8%
21.6%
2.1%
2.3%
45 retail properties
8.9 million sqft

Strong Tenant Relationships
9

Strong Tenant Relationships
10
Top 10 Canada & US Combined
Top 10 Tenant Name Annualized
Rental Revenue
Number Of Locations
Total Area Occupied (Sq. Ft. In
000s)
Weighted Avg Remaining Lease Term
(Yrs)
1 Walmart 4.4% 34 4,110 13.1
2 Canadian Tire Corporation (i) 3.9% 100 2,044 9.0
3 Famous Players/Cineplex/Galaxy Cinemas 3.6% 30 1,417 10.3
4 Metro/Super C/Loeb/Food Basics 3.4% 57 2,081 7.4
5 Winners/HomeSense/Marshalls 3.0% 74 1,699 7.2
6 Loblaws/No Frills/Fortinos/Zehrs/Maxi 2.6% 32 1,315 7.3
7 Staples/Business Depot 2.1% 57 1,135 6.2
8 Target Corporation 1.9% 24 2,014 9.0
9 Future Shop/Best Buy 1.8% 35 799 6.2
10 Shoppers Drug Mart 1.6% 48 525 9.2
(i) Canadian Tire Corporation includes Canadian Tire/PartSource/Mark's Work Wearhouse/Sport Mart/Sport Chek/Sports Experts/National Sports/Atmosphere
As at March 31, 2013

Strong Tenant Relationships
11
Top 10 Canada
Top 10
Tenant Name Annualized
Rental Revenue
Number Of Locations
Total Area Occupied (Sq. Ft. In
000s)
Weighted Avg
Remaining Lease Term
(Yrs)
1 Walmart 4.7% 29 3,334 12.7
2 Canadian Tire Corporation (i) 4.6% 100 2,044 9.0
3 Famous Players/Cineplex/Galaxy Cinemas 4.2% 30 1,417 10.3
4 Metro/Super C/Loeb/Food Basics 4.0% 57 2,081 7.4
5 Winners/HomeSense/Marshalls 3.4% 68 1,548 7.2
6 Loblaws/No Frills/Fortinos/Zehrs/Maxi 3.1% 32 1,315 7.3
7 Target Corporation 2.2% 24 2,014 9.0
8 Staples/Business Depot 2.1% 48 969 6.3
9 Shoppers Drug Mart 1.9% 48 525 9.2
10 Reitmans/Penningtons/Smart Set/Addition-Elle/ Thyme Maternity 1.7% 122 510 4.7
(i) Canadian Tire Corporation includes Canadian Tire/PartSource/Mark's Work Wearhouse/Sport Mart/Sport Chek/Sports Experts/National Sports/Atmosphere
As at March 31, 2013

Strong Tenant Relationships
12
Top 10 U.S.
Top 10
Tenant Name Annualized
Rental Revenue
Number Of Locations
Total Area Occupied (Sq. Ft. In
000s)
Weighted Avg
Remaining Lease Term
(Yrs)
1 Giant Food Stores/ Stop & Shop (Royal Ahold) 9.7% 20 1,025 12.9
2 Best Buy 3.8% 11 332 7.4
3 PetSmart 3.0% 15 286 5.7
4 Walmart 2.5% 5 776 15.7
5 Michael’s 2.1% 13 233 6.2
6 Ross Dress for Less 1.9% 10 235 5.5
7 Staples 1.6% 9 166 5.6
8 Bed Bath & Beyond 1.4% 9 195 7.2
9 Lowes 1.3% 3 353 15.3
10 Market Street 1.3% 2 138 10.8
As at March 31, 2013

Lease Rollover Profile
Broadly Distributed Lease Expiries
13
2,424
4,120 4,193 4,838
4,084
2013 2014 2015 2016 2017
331
707
473 448 610
2013 2014 2015 2016 2017
% Square Feet expiring / portfolio NLA Canadian Portfolio As at March 31, 2013
U.S. Portfolio As at March 31, 2013
’000s Square Feet
’000s Square Feet
5.9% 10.1% 10.2%
11.8% 10.0%
3.7% 7.9%
5.3% 5.0% 6.9%

Occupancy since 1996
Historical Occupancy Rates 1996 to 2012
14
96.9%
95.0% 95.0% 95.4%
96.1% 95.6% 95.8%
96.3% 96.3%
97.1%
97.7% 97.6%
96.9% 97.4% 97.4%
97.6% 97.4% 97.0%
1996 1997 1998 1999 2000 2001 2002 2003 2004 2005 2006 2007 2008 2009 2010 2011 2012Q1 2013
As at March 31, 2013

Financial Highlights
Q1 2013

Financial Highlights • RioCan’s Operating FFO increased by 20% to $124 million for the three months ending March 31,
2013 (“First Quarter”) compared to $103 million in the first quarter of 2012. On a per unit basis, Operating FFO increased 11% to $0.41 per unit from $0.37 per unit in the same period of 2012;
• Overall occupancy was 97.0% at March 31, 2013, compared to 96.9% at March 31, 2012;
• RioCan renewed 808,000 square feet in the Canadian portfolio during the First Quarter at an average rent increase of $1.93 per square foot, representing an increase of 13.4%, compared to 10.0% for the same period in 2012;
• During the First Quarter, RioCan acquired interests in one income property in Canada and one income property in the US aggregating approximately 169,000 square feet at an aggregate purchase price of $19 million at RioCan’s interest at a weighted average capitalization rate of 6.3%;
• Subsequent to the quarter end, RioCan completed the purchase of four properties in Canada at an aggregate purchase price of $418 million and a weighted average capitalization rate of 5.2%, which includes Burlington Mall and Oakville Place, two regional enclosed malls;
• Subsequent to the quarter end, RioCan sold or has under firm contract to sell four properties located in secondary markets at a total purchase price of $364 million;
16
Financial Highlights
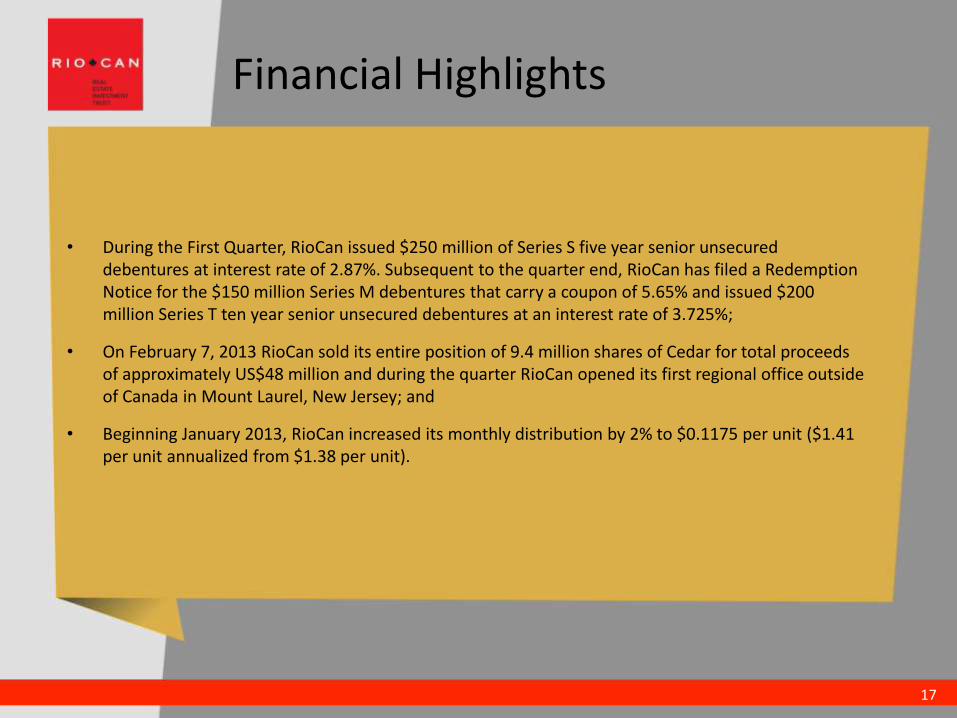
• During the First Quarter, RioCan issued $250 million of Series S five year senior unsecured debentures at interest rate of 2.87%. Subsequent to the quarter end, RioCan has filed a Redemption Notice for the $150 million Series M debentures that carry a coupon of 5.65% and issued $200 million Series T ten year senior unsecured debentures at an interest rate of 3.725%;
• On February 7, 2013 RioCan sold its entire position of 9.4 million shares of Cedar for total proceeds of approximately US$48 million and during the quarter RioCan opened its first regional office outside of Canada in Mount Laurel, New Jersey; and
• Beginning January 2013, RioCan increased its monthly distribution by 2% to $0.1175 per unit ($1.41 per unit annualized from $1.38 per unit).
17

Financial Highlights
(in millions of $ except per unit amounts)
Revenues
764 758
882 988
1,128
2008 2009 2010 2011 2012
Operating FFO*
315 324 276
380 440
2008 2009 2010 2011 2012
Operating FFO* Per Unit
1.32
1.22
1.33
1.43
1.52
2008 2009 2010 2011 2012
18
Years ended December 31st
* Note: FFO reported under IFRS for 2010 onwards, excludes trading gain income
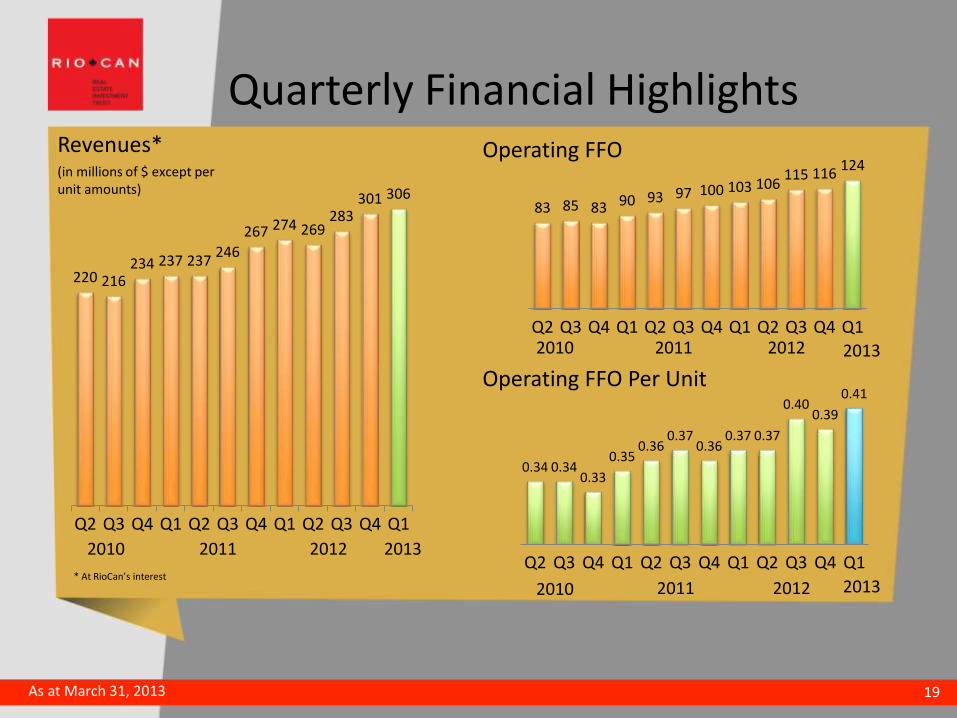
Quarterly Financial Highlights
(in millions of $ except per unit amounts)
Revenues*
220 216 234 237 237
246
267 274 269 283
301 306
Q2 Q3 Q4 Q1 Q2 Q3 Q4 Q1 Q2 Q3 Q4 Q1
Operating FFO
83 85 83 90 93 97 100 103 106 115 116
124
Q2 Q3 Q4 Q1 Q2 Q3 Q4 Q1 Q2 Q3 Q4 Q1
Operating FFO Per Unit
0.34 0.34 0.33
0.35 0.36
0.37 0.36
0.37 0.37
0.40 0.39
0.41
Q2 Q3 Q4 Q1 Q2 Q3 Q4 Q1 Q2 Q3 Q4 Q1
19 As at March 31, 2013
2010 2011 2012
2010 2011 2012
2010 2011 2012
2013
* At RioCan’s interest 2013
2013

Financial Highlights
(in millions of $)
452 466
551
622
713
2008 2009 2010 2011 2012
Net Operating Income* Q1 2010 – Q1 2013
136 138 147 148 151 156
167 171 172 182 188 186
Q2 Q3 Q4 Q1 Q2 Q3 Q4 Q1 Q2 Q3 Q4 Q1
Net Operating Income 2007 –2012
20 As at March 31, 2013
2010 2011 2012
* At RioCan’s interest
2013

Financial Highlights
(in millions of $ except per unit amounts)
Distributions to Unitholders
228 261 281 285 293
277 297 318
343 367
2008 2009 2010 2011 2012
0.99 1.04 1.13 1.14 1.07 1.01 1.04
1.3275 1.36 1.38 1.38 1.38 1.38 1.41
2007 2008 2009 2010 2011 2012 2013*
Distributions to Unitholders per Unit
21 As at Dec. 31, 2012
Distributions to Unitholders net of DRIP Distributions per Unit net of DRIP
* Effective January 2013, RioCan increased its distribution 2% to $1.41 annualized

Financial Summary
22
Period Ended March. 31,
(in millions of $ except per unit amounts) % Change 2013 vs. 2012
2013 2012
Total Revenues - consolidated 11.9% $292 $261
Total Revenues – at RioCan’s interest 14.2% $306 $268
Operating FFO 20.4% $124 $103
Operating FFO per Unit 10.8% $0.41 $0.37
Distributions to unitholders 10.4% $106 $96
Distributions to unitholders per Unit (annualized) 2.2% $1.41 $1.38
Distributions to unitholders net of distribution reinvestment plan (DRIP) 6.8% $78 $73
Distributions to unitholders net of DRIP per Unit - $0.26 $0.26
Unit issue proceeds under distribution reinvestment plan 21.7% $28 $23
Distribution reinvestment plan participation rate 11.0% 26.3% 23.7%
As at
Total assets - consolidated 16.8% $12,713 $10,884
Total assets – at RioCan’s interest 17.9% $12,975 $11,001
Debt – consolidated 12.2% $5,477 $4,881
Debt – at RioCan’s interest 13.4% $5,748 $5,069
Debt to Total Assets – (at RioCan’s interest) - 43.7% 45.9%
Debt Service Coverage (at RioCan’s interest)* 8.0% 2.03x 1.88x
Market capitalization 10.3% $8,374 $7,590
Total capitalization (incl. Preferred Units) 11.4% $14,411 $12,937
*Coverage figures calculated on a twelve month rolling basis

Financial Summary
23
Occupancy and Leasing Profile
(i) – Includes impact of the vacancy of Zellers totalling 188,000 sq ft at 100% (100,500 sq ft at RioCan’s interest) during the quarter. Retention rate excluding Zellers is 81.1%.
(ii) – Refers to the growth in same store on a year over year basis
2013(thousands of square feet, First Fourth Third Second First Fourth Third Second
millions of dollars) quarter quarter quarter quarter quarter quarter quarter quarter
Committed occupancy 97.0% 97.4% 97.3% 97.4% 96.9% 97.6% 97.5% 97.5%
Economic occupancy 95.8% 95.9% 95.5% 95.5% 95.7% 96.6% 96.3% 96.3%
NLA leased but not paying rent 615 711 855 871 542 466 541 485
Annualized rental impact 15.0$ 15.0$ 18.0$ 18.0$ 12.0$ 11.0$ 12.0$ 13.0$
Retention rate – Canada (i) 68.3% 94.3% 84.8% 89.9% 91.2% 90.5% 88.9% 92.1%
% increase in average net rent per sq ft – Canada 13.4% 18.4% 12.9% 13.4% 10.0% 14.5% 7.2% 13.9%
Retention rate – US 98.8% 87.6% 96.3% 84.2% 83.1% 95.7% 89.9% 96.9%
% increase in average net rent per sq ft – US 2.3% 5.1% 6.0% 7.3% 7.2% 8.9% 6.4% 9.3%
Average in place rent 15.77$ 15.70$ 15.85$ 15.33$ 15.37$ 15.14$ 15.09$ 14.91$
Same store growth (ii) – Canada 0.1% 0.2% 0.0% 1.5% 1.5% 1.9% 1.3% 0.3%
Same store growth (ii) – US 1.4% 1.9% (0.3%) 1.3% (0.6%) 1.3% 1.0% 1.4%
20112012

Financial Summary
24
(thousands of dollars)
Three Months Ended March 31, 2013 2013 2012 Increase
(decrease)
Net Operating Income
Same store1 $139,387 $139,266 0.1%
Land use intensification $1,205 $951 nm
Same properties2 $140,592 $140,217 0.3%
Acquisitions & Dispositions $8,060 44 nm
Greenfield development $3,497 $3,348 4.5%
NOI before adjustments $152,149 $143,609 5.9%
Lease cancellation fees $3,754 $783 nm
Straight-lining of rents $1,337 $472 nm
NOI – At RioCan’s interest $157,240 $144,864 8.5%
“nm” – not meaningful. 1 Same store refers to those income properties that were owned by RioCan and had consistent leasable area in both periods. 2 Same properties refer to those income properties that were owned by RioCan throughout both periods.
Net Operating Income – Three months ended March 31 Canadian Portfolio

Financial Summary
25
(thousands of dollars) Three Months ended March 31,
2013 2012 Increase (decrease)
Base rent – US$ $22,255 $21,849 1.9%
Property tax and operating cost recoveries – US$ 7,286 6,417 13.5%
Other – US$ 195 415 nm
Rental revenue – US$ 29,736 28,681 3.7%
Property operating costs – US$ 8,640 7,869 9.8%
Same store and same properties 12– US$ $21,096 $20,812 1.4%
Foreign currency translation adjustment 159 99 nm
Same store and same properties 12 – CDN$ 21,255 20,911 1.6%
Acquisitions 6,767 12 nm
NOI before adjustments $28,022 $20,923 33.9%
Dispositions – 978 nm
Lease cancellation fee 301 – nm
Straight-lining of rents 896 915 nm
NOI – At RioCan’s interest $29,219 $22,816 28.1%
“nm” – not meaningful. 1 Same store refers to those income properties that were owned by RioCan and had consistent leasable area in both periods. 2 Same properties refer to those income properties that were owned by RioCan throughout both periods..
Net Operating Income US Portfolio

Conservative Debt Profile
• Debt‐to‐Total Assets of 43.7% at March 31, 2013;
• Total operating lines $429 million with approximately $405 million available at March 31, 2013
• Unencumbered pool has a fair value of $1.6 billion
• Floating rate debt 6.3% of total debt
• Strong coverage ratios in Q1 2013 • EBITDA interest coverage of 3.02x
• Debt service coverage of 2.21x and
• Fixed charge coverage of 1.10x
26 * At RioCan’s interest
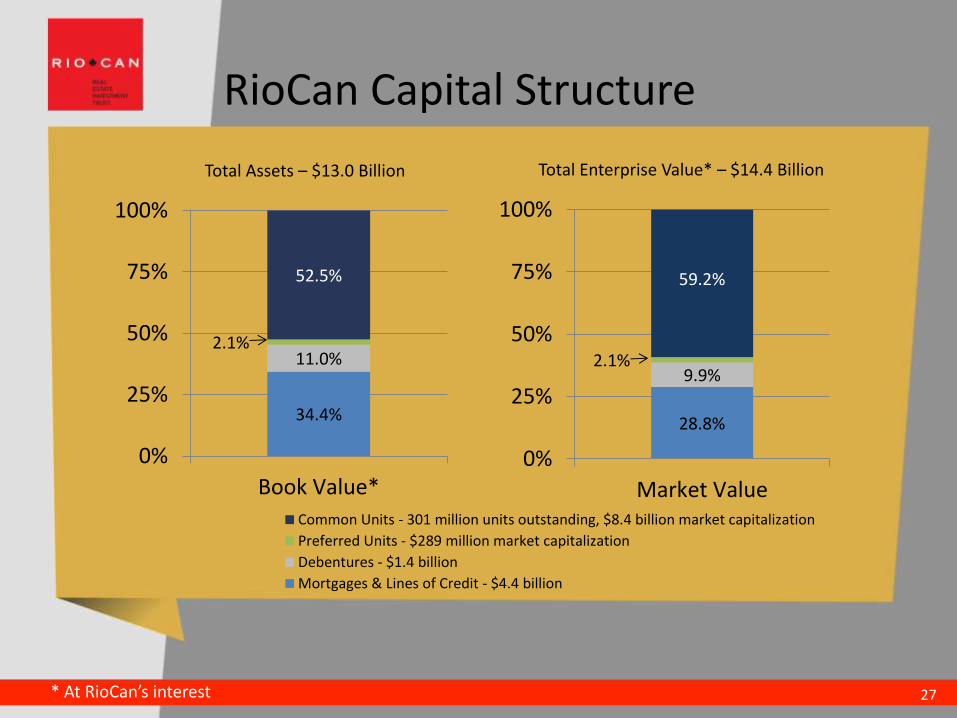
RioCan Capital Structure
34.4%
11.0% 2.1%
52.5%
0%
25%
50%
75%
100%
Book Value*
Common Units - 301 million units outstanding, $8.4 billion market capitalization
Preferred Units - $289 million market capitalization
Debentures - $1.4 billion
Mortgages & Lines of Credit - $4.4 billion
27
28.8%
9.9% 2.1%
59.2%
0%
25%
50%
75%
100%
Market Value
Total Assets – $13.0 Billion Total Enterprise Value* – $14.4 Billion
* At RioCan’s interest
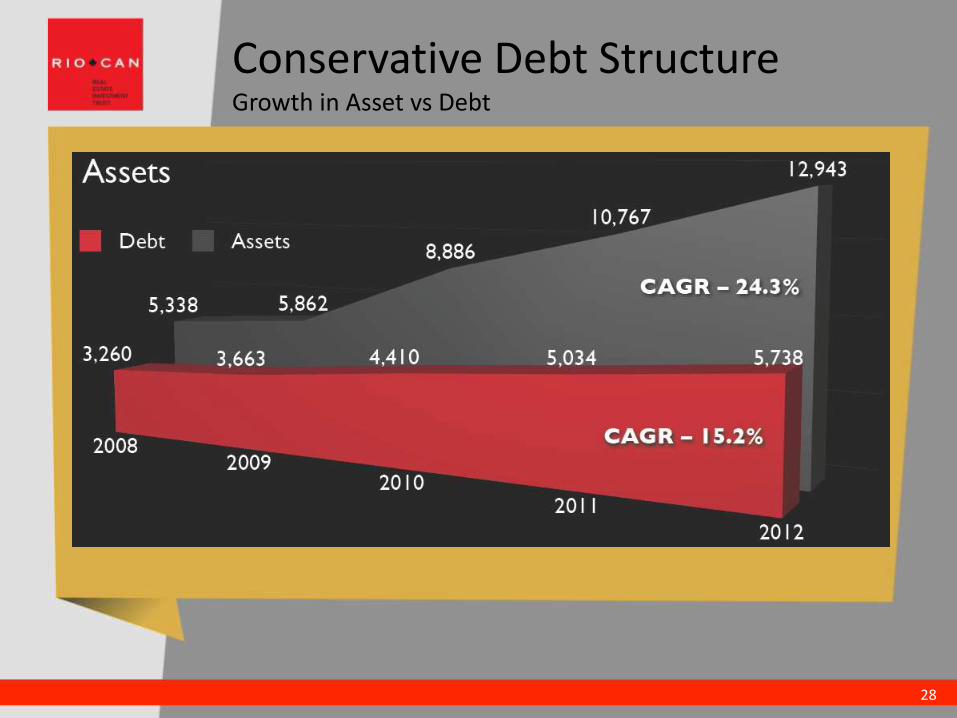
Conservative Debt Structure Growth in Asset vs Debt
28

Modest Leverage, Strong Interest Coverage
• RioCan has consistently adhered to a conservative debt policy even through periods of considerable growth
• 60% max permitted under covenant
• Interest coverage well in excess of the 1.65x maintenance covenant
47.3% 48.2% 51.9% 53.1% 53.8% 53.9% 56.6% 56.3% 54.9% 55.6% 49.1% 46.4% 43.5% 43.7%
2.9x 2.9x 2.6x 2.6x 2.7x 2.8x 2.9x
2.7x 2.6x
2.2x 2.5x 2.5x
2.7x 3.0x
2000 2001 2002 2003 2004 2005 2006 2007 2008 2009 2010 2011 2012Q1 2013
Leverage Interest Coverage
29 * At RioCan’s interest

Debt Maturity Schedule
30
• Includes redemption of Series M, and Series T offering completed after the quarter end.
• Long‐term, staggered debt maturity profile
• 4.5% Overall WAIR and 4.7 Year weighted avg. term to maturity at RioCan’s interest
• Low floating rate debt exposure (6.3% of total debt) at RioCan’s interest
• Mortgage financings currently sub 3.0% (dependent on term)
5.7%
4.5% 4.7% 4.7%
3.9% 4.1%
3.00%
4.00%
5.00%
6.00%
7.00%
0
500
1,000
1,500
2,000
2,500
2013 2014 2015 2016 2017 Thereafter
Scheduled principal amortization
Mortgages payable$ Millions
Weigh
ted A
vg. Interest R
ate on
Matu
ring D
ebt
342 482
803 845
1,092
2,261

Leverage and Coverage Ratios & Targets
31
3 Months Rolling 12 Months
Targeted Ratios
March 31/13 5
March 31/13
March 31/13
Dec. 31/12*
Dec. 31/12
Interest coverage ratio1 >2.75x 3.02x 2.84x 2.76x 2.69x 2.69x
Debt service coverage ratio2 >2.25x 2.21 2.11 2.03 1.98 1.99
Fixed charge coverage ratio3 >1.1x 1.10 1.08 1.06 1.04 1.05
Net operating debt to adjusted operating EBITDA ratio4
<6.5x 7.05 7.05 7.04 7.09 7.08
Unencumbered Assets ($millions)
$1,611 $1,353
Unsecured Debentures ($millions)
$1,402 $1,299
Unencumbered Assets to Unsecured Debt
>130% 115% 104%
(1) Interest coverage defined as: Adjusted EBITDA for the period, divided by total interest expense (including interest that has been capitalized). (2) Debt service coverage defined as: Adjusted EBITDA for the period, divided by total interest expense and scheduled mortgage principal amortization (including interest that has been capitalized). (3) Fixed charge coverage is defined as: Adjusted EBITDA for the period, divided by total interest expense (including interest that has been capitalized) and distributions to common and preferred unitholders. (4) Net operating debt to Adjusted Operating EBITDA is defined as: the average debt outstanding (net of cash) for the period less debt related to property under development divided by Adjusted EBITDA excluding amounts related to property under development (5) Adjusted to exclude interest capitalized. * Restated on same basis as March 31, 2013
* At RioCan’s interest

Growth Strategy

Future Growth Drivers
33
Future Growth
Drivers
Institutional
Relationships
Organic
Growth
Acquisitions
Development
Pipeline
Land Use
Intensification

Acquisitions
34
2010 2011 2012
$986
$1,100
$926
Annual Acquisitions – Canada & US Purchase price at RioCan’s interest (millions)
Total
$3.01 Billion

Acquisitions
Track Record – Acquisitions 2011 – Q1 2013
35
Location Cap Rate RioCan’s Purchase Price
(millions)
Canada 6.4% 506
United States 6.9% 567
2011 Acquisitions 6.6% $1,073
Canada 5.7% 543
United States 6.8% 383
2012 Acquisitions 6.1% $926
Canada 6.0% 16
United States 7.6% 3
Q1 2013 6.3% $19
Grand Total 2011-Q1 2013 6.4% $2,018

Dissolution of JV with Retail Properties of America, Inc.
(“RPAI”)
Transaction Highlights
• RioCan and RPAI have agreed to dissolve their joint venture arrangement formed in 2010;
• RPAI to acquire from RioCan a 80% interest in 5 properties to increase their ownership to 100%.
• When completed, RioCan will own a 100% interest in eight high quality retail assets in Texas, including the dominant power centres in Austin and San Antonio. The portfolio includes four Target shadow anchored centres in Austin, San Antonio and Temple, as well as four exceptional grocery anchored or shadow anchored centres in Houston and Dallas.
• The additional 20% interest will provide RioCan with a 100% ownership interest for 2.5 million square feet of RioCan’s 4.3 million square foot portfolio in Texas.
37

Transaction Highlights
• The gross purchase price for the 8 properties is $96.6 million, representing a capitalization rate of 6.9%. Under the terms, RioCan will assume RPAI’s share of the currently in place mortgage financing of $41.8 million, which carries an average interest rate of 3.7% and has an average term to maturity of 2.9 years. The purchase price for the 8 properties net of financing and mark to market adjustment on debt is $53.7 million.
• RioCan will sell its 80% ownership in five assets at a gross purchase price of $102.8 million ($45.6 million net of financing and mark to market adjustment on debt).
• RioCan’s US portfolio is composed of 26 properties containing 4.6 million square feet in the Northeastern US and 4.3 million square feet in 24 properties (19 properties containing 4.3 million square feet on completion) in Texas.
38

Transaction Highlights
39
High quality assets with a focus towards grocery anchored centres

Transaction Highlights Assets Acquired
40
Property Name Location NLA Occupancy Major Tenants
1890 Ranch Austin 486,896 90.5% Super Target (shadow), Ross Dress for Less, Beall’s, PetSmart
Alamo Ranch San Antonio
465,371 89.4% Super Target (shadow), Ross Dress for Less, Dick’s Sporting Goods, PetSmart, Michaels
Bear Creek Shopping Center Houston 87,912 98.8% HEB
Bird Creek Crossing Temple 124,941 100.0% Target (Shadow), Home Depot (Shadow), PetSmart, Michaels, Office Max
Great Southwest Crossing Dallas 92,270 100.0% Sam’s Club (shadow), Kroger (Shadow), PetSmart, Office Depot
Riverpark Phase I,II Houston 253,011 95.9% HEB, LA Fitness, Dollar Tree
Southpark Meadows Austin 921,141 97.0% Walmart (ground lease), Super Target (Shadow), Bed Bath & Beyond, Marshalls, Ross Dress for Less, Sports Authority
Suntree Square Dallas 99,269 94.2% Tom Thumb (Safeway),
TOTAL / W.A. 2,530,811 94.4%
RioCan Cedar Dissolution Transaction Highlights
• In October 2012, RioCan and Cedar Realty Trust entered into an agreement to dissolve their joint venture formed in late 2009.
• RioCan acquired from Cedar a 20% interest in 21 properties to increase its ownership to 100% and Cedar has acquired from RioCan an 80% interest in Franklin Village to increase its ownership to 100% in the property.
• The gross purchase price for the 21 properties is $120 million, representing a capitalization rate of 6.5%. Under the terms, RioCan assumed Cedar’s share of the currently in place mortgage financing of $54.4 million, which carries an average interest rate of 5.2% and has an average term to maturity of 5.2 years. The purchase price for the 21 properties net of financing and mark to market adjustment on debt was $64.4 million.
• RioCan sold its 80% ownership in Franklin Village at a gross purchase price of $60.1 million ($25.4 million net of financing).
• Net cash investment by RioCan of approximately $39 million.
• In February 2013, RioCan sold its entire position of 9.4 million shares of Cedar for $48 million.
• In January 2013, RioCan opened a regional office in Mount Laurel, New Jersey and effective February 1, 2013 RioCan assumed property and asset management functions for its Northeast portfolio.
41 Figures in US dollars

Recent Enclosed Mall Acquisitions
42
Burlington Mall, Burlington, Ontario Oakville Place, Oakville, Ontario Georgian Mall, Barrie, Ontario

Recent Enclosed Mall Acquisitions Impact on Property Type Mix
43
RioCan plans to actively increase its presence in two sectors; enclosed regional malls and urban retail centers, as a means of leveraging its retail tenant base across the US and Canada. The 2012 purchase of Georgian Mall along with the acquisitions of Oakville Place and a 50% interest in Burlington Mall in April 2013, complement RioCan’s strategic purchases and the redevelopment and development of certain retail centers such as Yonge Eglinton Center, Sheppard Center, Lawrence Square, Shoppers World Brampton and the Globe and Mail lands. RioCan considers these sectors to have strong growth and value creation potential. There are additional opportunities for organic growth within the acquired shopping centres, which RioCan believes it can realize with its deep infrastructure and management strength.
Office, 4.3%
Urban Retail, 8.6%
Non-Grocery Anchor, 5.0%
Enclosed Shopping
Centre, 15.1%
Grocery Anchored
Centre, 18.3%
New Format Retail, 48.7%
As at March 31, 2013 Office, 4.3%
Urban Retail, 8.7%
Non-Grocery Anchor, 5.0%
Enclosed Shopping
Centre, 18.0%
Grocery Anchored
Centre, 18.8%
New Format Retail, 45.2%
Proforma Annualized rental revenue by property type

RioCan Primaris Acquisitions
• RioCan completed the purchase of a 50% interest in Burlington Mall in Burlington, Ontario, and a 100% interest in Oakville Place in Oakville, Ontario. – The gross purchase price for these two properties was approximately $362 million (at RioCan’s interest) at a cap rate of approximately 5.2%.
In connection with the purchase, RioCan assumed, at its interest, the in place mortgage financing of approximately $165 million. The purchase price was reduced by a mark-to-market adjustment on closing in consideration of the debt’s above market interest rate, which is currently estimated at approximately $9.8 million.
• Extends RioCan’s retail reach to develop deeper relationships with fashion tenants and could create additional opportunities at RioCan’s urban properties and Outlet Centres.
• RioCan also acquired a third asset, South Cambridge Centre from H&R REIT at a purchase price of $35 million at a cap rate of approximately 6.7%.
44
Burlington Mall, Burlington, Ontario Oakville Place, Oakville, Ontario

Recent Acquisitions Georgian Mall
• In Q3 2012, RioCan purchased Georgian Mall in Barrie, Ontario for $318 million at a 5.4% cap rate
• Obtained first mortgage financing of $185 million at a 3.1% interest rate
45
• RioCan’s largest single acquisition by dollar amount • A dominant regional mall in a quickly growing market with solid
demographics

Extracting Value by Recycling Capital
• RioCan is currently in various stages of selling eleven non-core Canadian properties located in secondary markets. During the first quarter, RioCan sold one property at a sales price of $10.5 million and subsequent to the quarter, RioCan sold four properties at a sales price of $363.8 million. Additionally, RioCan has four property dispositions under conditional contract where conditions have not been waived pursuant to purchase and sale agreements at an aggregate sales price of $35.7 million. RioCan is also in the process of marketing for sale two other non-core Canadian properties;
• Current asset sales plan involves selling institutional grade, unenclosed centres, in lower growth markets and secondary assets in tertiary markets;
• These asset sales will further enhance RioCan’s strategy to be focused in Canada’s high population, high growth markets;
– RioCan’s proforma concentration in Canada’s six high growth markets if completed will exceed 70% (Year end 2012 68%)
– Capital from asset sales redeployed into enclosed mall acquisitions.
46
RioCan’s plan to recycle capital into higher growth assets will provide for enhanced returns to unitholders and a reduced need for access to public equity markets to raise capital.
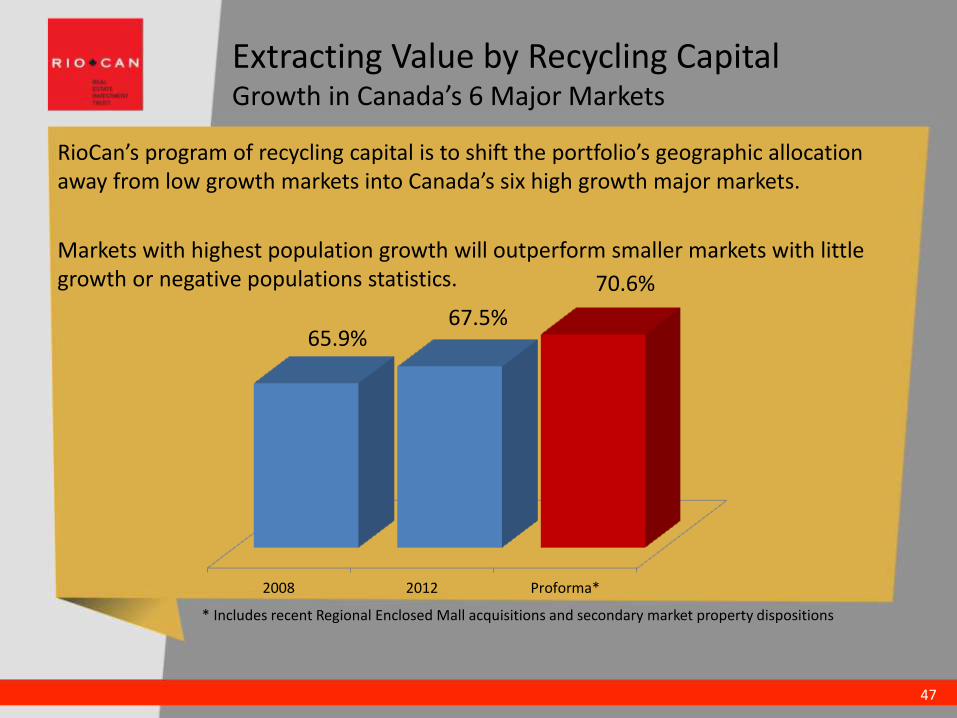
Extracting Value by Recycling Capital Growth in Canada’s 6 Major Markets
RioCan’s program of recycling capital is to shift the portfolio’s geographic allocation away from low growth markets into Canada’s six high growth major markets.
Markets with highest population growth will outperform smaller markets with little growth or negative populations statistics.
2008 2012 Proforma*
65.9% 67.5%
70.6%
* Includes recent Regional Enclosed Mall acquisitions and secondary market property dispositions
47

Development Activity
At March 31, 2013
• Total developments comprise 10.5 million square feet, including shadow anchors
• RioCan’s interest consists of 4.8 million square feet (9.2 million square feet with partners)
• Total estimated project cost is $2.5 billion, with RioCan’s interest being approx. $1.3 billion
• Invested $516 million in these projects
• RioCan’s funding obligations, before construction financing, is $723 million ($90 million is for current development and $633 million is for potential future development)
– In addition, RioCan will fund approx. $115 million under mezzanine lending program to certain partners, primarily Trinity Developments ($22 million is for current development and $93 million is for potential future development)
• Generate unlevered yield between 7% to 11%, at a weighted average of 8.5% to 9.5%
• Recent Urban Development acquisitions include Yonge & Eglinton Northeast corner, Bathurst & College, and 740 Dupont in the GTA and Herongate Mall in Ottawa, ON
• In July 2012, RioCan formed a JV with Allied Property REIT to develop sites in major markets across Canada
• RioCan, Allied Properties and Diamond Corp entered into a joint venture arrangement and have acquired two parcels which comprise the Globe and Mail site in downtown Toronto
48
Development Pipeline
Greenfield developments through in‐house capabilities and with partners, such as Trinity and Canada Pension Plan Investment Board (CPPIB) and Allied Properties

-250
250
750
1,250
1,750
2,250
20
06
20
07
20
08
20
09
20
10
20
11
20
12
20
13
20
14
20
15
20
16
20
17
20
18
20
19
Squ
are
fe
et
(‘0
00
s)
Development Buildout History & Pipeline at RioCan’s Interest
Development Activity Development History
49
From 2006 through Dec. 31, 2012: • RioCan’s development pipeline has
added 4.3 million square feet to the portfolio
• Invested $1.2 billion of total capital (development costs and land acquisition costs)
• Average cost psf including land of projects completed from 2006 to 2012 was approximately $280 psf
Pipeline*
* Subject to preleasing and market conditions
RioCan’s development portfolio is expected to add considerable value to the overall investment property portfolio over the next 3-5 years. These assets are expected to generate higher yields than what can currently be achieved in the acquisition market.

Development Activity - Current Portfolio
69% 19%
1% 11%
Property Type as a % of Development Portfolio
Power Centre Main Street/Urban
Convenience Retail Excess Land
50
Alberta 14%
New Brunswick 5%
Toronto 13%
Ottawa 12%
Suburban GTA 38%
Other Ontario 18%
Ontario 81%
Development Portfolio by Geographic Diversification

Development Pipeline
51
• RioCan, Allied Properties and Diamond Corp announced in November 2012 that they had entered into a joint venture arrangement to acquire the Globe and Mail site in downtown Toronto. In April 2013, the partners also purchased an adjacent parcel.
• Acquired at a purchase price of $136 million (at 100%). Second parcel (highlighted in red) acquired at a purchase price of $37 million (at 100%).
• Project is expected to be mixed use retail, office and residential.
• The joint venture will be structured on a 40/40/20 basis between RioCan, Allied and Diamond. RioCan and Allied would act as joint development and construction managers. Upon completion of any projects RioCan would act as property manager for any retail portion of the property and Allied would act as property manager for any office portion
RioCan & Allied Properties REIT Joint Venture
Globe & Mail Lands
Source: RBC

Development Pipeline
52
• RioCan and Allied Properties announced in July 2012 that they had entered into a joint venture arrangement to acquire sites in the urban areas of major Canadian cities that are suitable for mixed use intensification
• The joint venture will be structured on a 50/50 basis between RioCan and Allied. RioCan and Allied would act as joint development and construction managers. Upon completion of any projects RioCan would act as property manager for any retail portion of the property and Allied would act as property manager for any office portion
• First two sites to be developed are:
– College and Manning which will be developed into a mixed use complex with approx. 125,000 square feet and
– King and Portland which will be developed into a mixed use complex with approx. 400,000 square feet in Toronto, Ontario.
RioCan & Allied Properties REIT Joint Venture
King Street
College and Manning

Development Activity
53
Target will open 24 locations in RioCan’s portfolio
• First 15 locations,
• Eight have opened year to date
• The majority to open throughout the remainder of 2013
• Target will be the anchor tenant at RioCan’s St Clair and Weston road project Stockyards
• Canada’s first purpose built Target location opening spring 2014
• RioCan employing an extensive capital improvement program for those locations where it feels the cash flow can be improved
• RioCan expects to spend approximately $18 million to upgrade existing shopping center infrastructure and aesthetics

Development Pipeline
54
St. Clair & Weston, Toronto 555,000 sqf. two storey retail – Projected Completion 2014
Anchor Tenant - Target
Development Partners: Trinity and Canada Pension Plan Investment Board (“CPPIB”)

Development Pipeline
• 2.8 acre site located in the East Village area of downtown Calgary, Alberta.
• The site was acquired on a 50/50 joint venture basis with KingSett at a purchase price of $20 million.
• The joint venture is contemplating the development of 526,000 square feet of mixed use retail and office space.
• Development is anticipated to commence in the spring of 2014.
55
Calgary East Village

Development Pipeline
• This 160 acre site located in Oshawa, Ontario is currently being developed into a 1.2 million square foot regional new format retail centre.
• RioCan acquired its partners’ interests in July 2011. RioCan now owns 100% of this development site.
56
Sage Hill, Calgary
Windfield Farms, Oshawa
RioCan has completed the acquisition of Sage Hill Crossing, a 34 acre greenfield development site in Northwest Calgary. The purchase price for the lands, which will be serviced and zoned at the time of closing, will be $32 million ($16 million at RioCan’s interest). RioCan will own the development on a 50/50 basis with KingSett Capital. Once completed, the anticipated gross leasable area is 378,000 square feet of retail use. A letter of intent is in place with Walmart for a land lease and a binding offer to lease has been executed with Loblaws for a 45,000 square foot store. Development is expected to commence in 2013.

Canadian Outlet Centre Development
• In 2011, RioCan entered into an exclusive joint venture for the acquisition, development and leasing of sites across Canada that are suitable for development or redevelopment as outlet shopping centres similar in concept and design to those within the existing Tanger U.S. portfolio.
• In December 2011, RioCan and Tanger acquired the Cookstown Outlet Mall, located about 45 minutes north of Toronto. A 161,000 square foot outlet centre with the potential to add a further 160,000 square feet of retail space.
• In November 2012, RioCan and Tanger acquired two sites in the Montreal area, Les Factoreries Saint-Sauveur, and Le Carrefour Champetre (Bromont Outlet Centre). The Montreal sites are existing centres which will be expanded and re-branded as Tanger Outlet Centers.
• The joint venture currently has a 52.5 acre site in Kanata, Ontario, which the partners expect to break ground on during the second quarter 2013.
• Also pursuing a site in the Calgary market.
57

Development Pipeline
• 161,000 square foot outlet centre with the potential to add a further 160,000 square feet of retail space
• Expect to break ground on expansion in Q2 2013.
58
Cookstown Outlet Mall Purchased in December 2011 with Tanger Factory Outlet Centers.

Development Pipeline
• 52.5 acre site, approximately 20 kilometres west of Ottawa
• To be developed into a 347,000 square foot outlet centre
• Expect to break ground on development in Q2 2013.
59
West Kanata Lands
On April 23, 2013 RioCan and Tanger purchased the West Kanata Lands

Development Pipeline Tanger Opportunities
• 116,000 square foot outlet centre with the potential to add a further 15,000 square feet of retail space
• Well established outlet centre in suburban Montreal
60
Les Factoreries, St-Sauveur Tanger Outlet Centre

Development Pipeline Tanger Opportunities
• 162,000 square foot outlet centre with the potential to add a further 89,000 square feet of retail space
• Established outlet centre located 85kms east of Montreal, near the eastern townships
61
Bromont Tanger Outlet Centre – Bromont, Quebec

Land Use Intensification and Urban Development
• Capitalize on trend in Canada’s six high growth markets towards “densifying” existing urban locations, driven by:
– Prohibitive costs of expanding infrastructure beyond urban boundaries
– Environmental concerns
– Maximizing use of mass transit
– Generate high yields as land is already owned
62

“Densifying” existing urban locations
63
Yonge Eglinton Centre - Toronto, Ontario
• RioCan’s acquired the property for $223 million
• launched revitalization and expansion plan to capitalize on area’s residential intensification
• significant increases in NOI and occupancy

Creating New Cash Flow Sources
64
RioCan Yonge Eglinton Centre –The Cube
Location: Toronto, Ontario
Intersection: Yonge & Eglinton
Total Proposed GLA: 45,000 square feet
Design Concept: Urban Retail
Construction Start: 2013
Today
Proposed

Creating New Cash Flow Sources
65
The Sheppard Centre, Toronto
Location: Toronto, Ontario
Intersection: Yonge & Sheppard
Total Proposed GLA: 672,854 square feet
Design Concept: Urban Retail
Today
• Potential for both retail and residential expansion
• Fast growing area of
North Toronto
Proposed

Creating New Cash Flow Sources
66
Location: Toronto, Ontario
Intersection: Yonge & Eglinton
Total Proposed GLA: 54,000 square feet
Design Concept: Urban Retail
Anticipated Completion: 2017
NE Yonge Eglinton - Toronto, Ontario
Today
Proposed

Creating New Cash Flow Sources
67
Location: Toronto, Ontario
Intersection: 740 Dupont Street
Total Proposed GLA: 184,000 square feet
Design Concept: Urban Retail
Anticipated Completion: 2017
740 Dupont - Toronto, Ontario

Creating New Cash Flow Sources
68
420 Bathurst Street, Toronto
Location: Toronto, Ontario
Intersection: Bathurst & Dundas
Total Proposed GLA: 133,000 square feet
Design Concept: Urban Retail
Anticipated Completion: 2015

Urban Intensification
• Located at the busy intersection of Bayview Avenue and Eglinton Avenue in midtown Toronto
• The site benefits from excellent demographics and is a probable location for a stop along the proposed Eglinton subway line
• The property is an excellent location for a redevelopment project similar to what has been accomplished at 1717 Avenue Road
69
RioCan has a number of Urban Intensification opportunities in the GTA market
Sunnybrook Plaza, Toronto, ON
Queensway Cineplex, Toronto, ON
• Located in Western Toronto at the corner of The Queensway and Islington Avenue with access to the Queen Elizabeth Way (QEW)
• The Currently anchored by Cineplex, which will be expanded to include VIP screens. This centre is an ideal property for additional density and potential redevelopment into a mixed‐use facility, in keeping with the trend of urban intensification

Urban Intensification – Completed Projects
70
Queen & Portland, Toronto, ON
Before
After
Location: Toronto, Ontario
Intersection: Portland & Queen
Total Proposed GLA: 91,000 square feet
Design Concept: Mixed‐use facility Construction Completed: 2011

Urban Intensification – Completed Projects
71
1717 Avenue Road, Toronto, ON
Location: Toronto, Ontario
Intersection: 1717 Avenue Road
Total Proposed GLA: 91,000 square feet
Design Concept: Mixed‐use facility Construction Completed: 2011

72
Leasing of the Zellers stores not taken by Target should, in aggregate provide an opportunity for RioCan to generate additional rental income going forward, as the lease income previously generated by Zellers was considerably below current market rental rates. • RioCan has nine locations leased by Zellers that were not selected by Target comprising approximately 727,000 square feet (640,000
square feet at RioCan’s interest) contributing $6.6 million of annual gross revenue ($6 million at RioCan’s interest). • Average base rent on this space of $5.28 per square foot contributing $6.6 million of annual gross revenue ($6 million at RioCan’s
interest). • RioCan negotiated a lease termination fee on these five remaining Zellers locations of $9.3 million.
RioCan has negotiated firm leases and conditional LOI’s for 350,000 square feet or 55% of the former Zeller’s space (at RioCan’s ownership interest) accounting for $5.4MM of gross revenue or 90% of the gross rent formerly paid by Zellers (at RioCan’s ownership interest). The average base rent on the re-leased space is $10.17 per square foot compared to the $5.28 per square foot formerly received from Zellers representing a 93% increase. Depending on the terms of the leases with new tenants, RioCan expects to spend a total of between $30 million and $40 million to redevelop and reposition the properties vacated by Zellers that will not be occupied by Target. The majority of this expense is projected to be incurred for construction costs associated with demolition and demising of premises, replacement of the store interiors, replacement of electrical, mechanical and plumbing systems, replacement of the exterior façade storefronts and loading areas as well as tenant allowances for the new tenancies. Given the significant amount of work required to redevelop and reposition the properties, RioCan estimates that the construction and tenant fixturing period will average approximately one year.
Zellers update

Organic Growth
Canadian Portfolio
73
Lease Expires
(thousands except psf and % amounts Portfolio NLA 2013 2014 2015 2016 2017
Total 40,914 2,424 4,120 4,193 4,838 4,084
Square Feet expiring/portfolio NLA 5.9% 10.1% 10.2% 11.8% 10.0%
Total average net rent psf $16.17 $18.51 $16.26 $16.06 $16.89 $17.81
Ability to add growth through rental renewals with 48% of leases renewing over next five years. • In Q1 2013 achieved renewal rent increases of 13% or $1.93 psf with an average renewal rate of $16.34. • Retention rate of 81.1% excluding Zellers vacancies.
$12
$13
$14
$15
$16
$17
$18
$19
$20
0
700
1,400
2,100
2,800
3,500
4,200
4,900
2008 2009 2010 2011 2012 2013 2014 2015 2016
Re
nt
PSF
Squ
are
Fe
et
(‘0
00
s)
RioCan Lease Maturity Schedule and Renewal History
Square feet renewed/expiring (left axis) Achieved Renewal Rent PSF Expiring Rent PSF

Organic Growth
U.S. Portfolio
74
Lease Expires
(thousands except psf and % amounts Portfolio NLA 2013 2014 2015 2016 2017
Total 8,902 331 707 473 448 610
Square Feet expiring/portfolio NLA 3.7% 7.9% 5.3% 5.0% 6.9%
0%
20%
40%
60%
80%
100%
2013 2014 2015 2016 2017
Leases Expiring Total Portfolio Cumulative
Square Feet expiring/portfolio NLA
Ability to add growth through rental renewals with 29% of leases renewing over next five years.
• In Q1 2013 achieved renewal rent increases of 2.3% or $0.36 psf with an average renewal rental rate of $15.99 • Maintained a retention rate of 98.8%

Strong Institutional Relationships
• Through the years RioCan has developed strong institutional relationships
• Leverage RioCan’s capital to enhance returns and increase scale of investments
• Generate additional revenue streams Property and asset management fees
• RioCan recently entered into a Joint Venture arrangement with KingSett Capital when it acquired the Sheppard Centre – RioCan manages the property, acts as leasing manager for the property and will
be the development manager in connection with any redevelopment of the property.
– Currently partnered with KingSett on the acquisition of the Sage Hill development site.
– Currently partnered with KingSett on the acquisition of Burlington Mall as part of the Primaris acquisition
• RioCan has also developed a strong relationship with Allied properties – RioCan has partnered with Allied on the urban development sites of King &
Portland and College street in Toronto.
– RioCan, Allied, and Diamond Corp. have entered into a joint venture to develop the Globe and Mail lands at Front Street and Spadina in downtown Toronto.
75

Strong Institutional Relationships
• RioCan REIT and Kimco Realty Corporation, a U.S. REIT listed on the NYSE which also focuses on the ownership of shopping centres, each have a 50% interest in RioKim joint venture.
• Invested over $1.2 billion in 45 properties since 2001 comprising over 9.3 million sq. ft. of GLA including a 10 property portfolio in central and eastern Canada purchased in September 2008.
• RioCan provides asset and property management, development and leasing services to RioKim in Canada.
• RioCan recently acquired an 80% interest in Montgomery Plaza in Fort Worth, Texas from Kimco, who remains a 20% owner in the property and provides property management and leasing services.
76
RioKim Joint Venture Brentwood Village
Tillicum Centre

Strong Institutional Relationships
• In October 2004, RioCan REIT and CPPIB announced an agreement to acquire premier regional power centres in Canada on a 50/50 basis as a core, long‐term holding strategy
• Today, RioCan and CPPIB are partners in over 1.3 million sq. ft. of completed regional power centres and approximately 3.0 million sq. ft. of planned development projects
• RioCan provides property and asset management, leasing, development and construction management services for the co‐ownership
77
CPPIB Joint Venture RioCan Centre Burloak ‐ Before
RioCan Centre Burloak ‐ After

Strong Institutional Relationships
• Acquired in December 2009 on a 50‐50 basis
• Unique asset located in the Greater Vancouver Area market of Surrey
• Diverse and strong tenant mix
• 529,827 sq. ft. anchored by a 217,278 sq. ft. Walmart
78
CPPIB Strategic Alliance Grandview Corners
• RioCan completed the rezoning for its St. Clair and Weston Road development with Trinity and Canada Pension Plan Investment Board (“CPPIB”) in Toronto.
• Site work commenced in the fourth quarter of 2011. Expected completion in first half of 2014
St. Clair & Weston
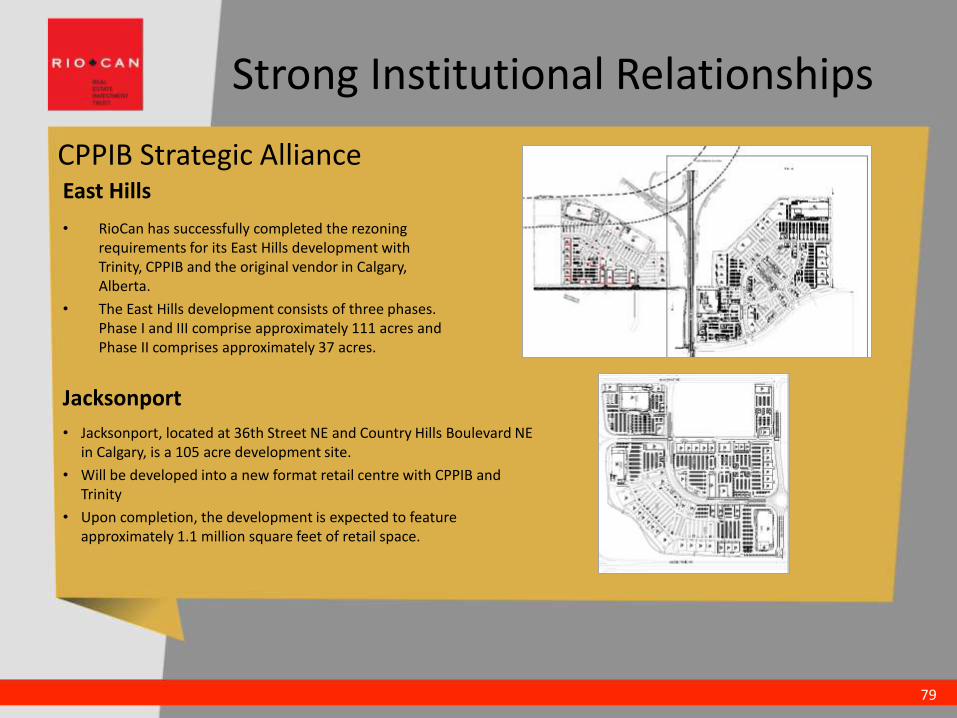
Strong Institutional Relationships
• RioCan has successfully completed the rezoning requirements for its East Hills development with Trinity, CPPIB and the original vendor in Calgary, Alberta.
• The East Hills development consists of three phases. Phase I and III comprise approximately 111 acres and Phase II comprises approximately 37 acres.
79
CPPIB Strategic Alliance East Hills
• Jacksonport, located at 36th Street NE and Country Hills Boulevard NE in Calgary, is a 105 acre development site.
• Will be developed into a new format retail centre with CPPIB and Trinity
• Upon completion, the development is expected to feature approximately 1.1 million square feet of retail space.
Jacksonport

Investment Highlights
80
Strong, reliable distribution yield provided to investors
Stable, diversified portfolio of national retail tenants
Disciplined growth strategy in Canada and U.S.
Positioned to benefit from robust acquisition activity and development pipeline
Experienced, performance driven management team
Dominant platform, geographically diversified
Conservative balance sheet / financial strength

RioCan Yonge Eglinton Centre
2300 Yonge Street, Suite 500
PO Box 2386
Toronto, Ontario
M4P 1E4
TRANSFORMING…