Quality Measures for Antimicrobial use in
European Children
Prof. Mike Sharland, St George’s University of London

Paediatric and Adult AMR rates are
different between children and adults.
ECDC EARS-Net – Klebsiella data
Diaz-Högberg L et al. Abstract, ESPID annual conference 2013, Milan, Italy.

Distribution of the major HAI categories by country – Paediatric data,
ECDC point prevalence survey 2011-2012 (BSI – 37.2 %)
Zingg W et al ESPID 2014

ARPEC-PPS Oct-Nov 2012 :
Neonates
Most Prescribed Antibiotics to neonates <1month old (%) by UN Region
Proportions >5% are marked in red
Data presented at the ICAAC Conference 2014

Antibiotic use in children is different
from adults Antibiotic group ESAC – 2009
children
ESAC – 2009
adults
ARPEC – EU
2011/2012
Tetracyclines 0.2% 1.9% 0.1%
Amphenicols - 0.1% 0.1%
Beta-lactams – penicillins 35.5% 38.4% 30.0%
Other beta-lactams 24.8% 18.5% 26.6%
Sulfonamides & trimethoprim 4.7% 5.2% 7.4%
Macrolides & lincosamides 5.9% 7.4% 5.8%
Aminoglycosides 15.2% 4.3% 14.2%
Quinolones 3.3% 10.6% 2.0%
• Antibiotic use differs between children and adults
• This is likely to disproportionately affect some
antibiotic classes

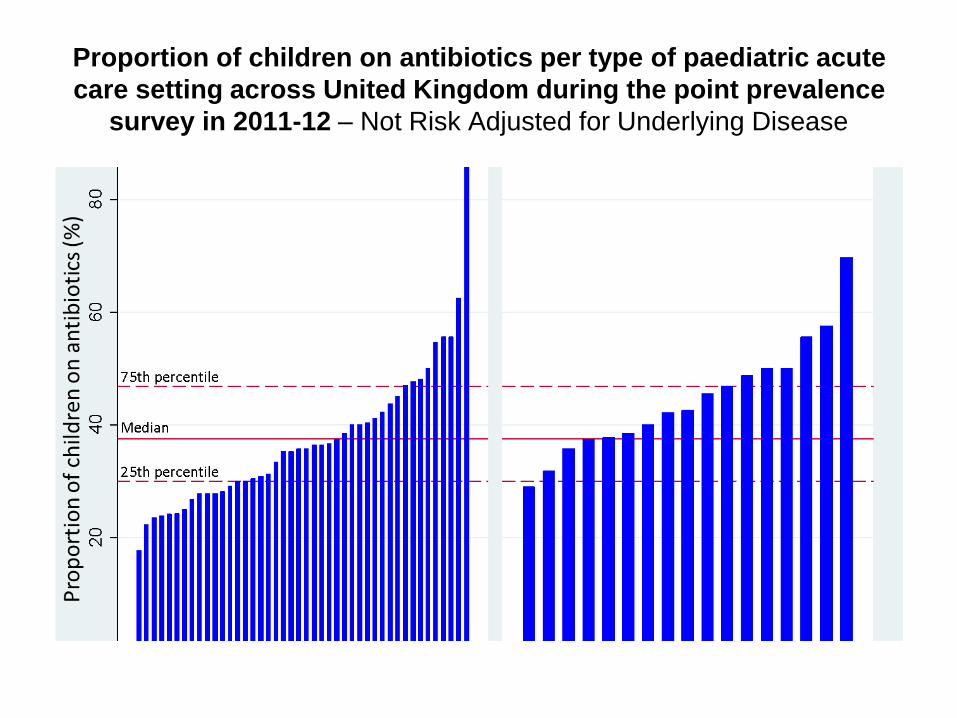
Proportion of children on antibiotics per type of paediatric acute
care setting across United Kingdom during the point prevalence
survey in 2011-12 – Not Risk Adjusted for Underlying Disease

QI - Total prescribed antibiotics (DDD/100OBD) per age class and per type of
paediatric acute care setting across United Kingdom - ARPEC PPS 2012
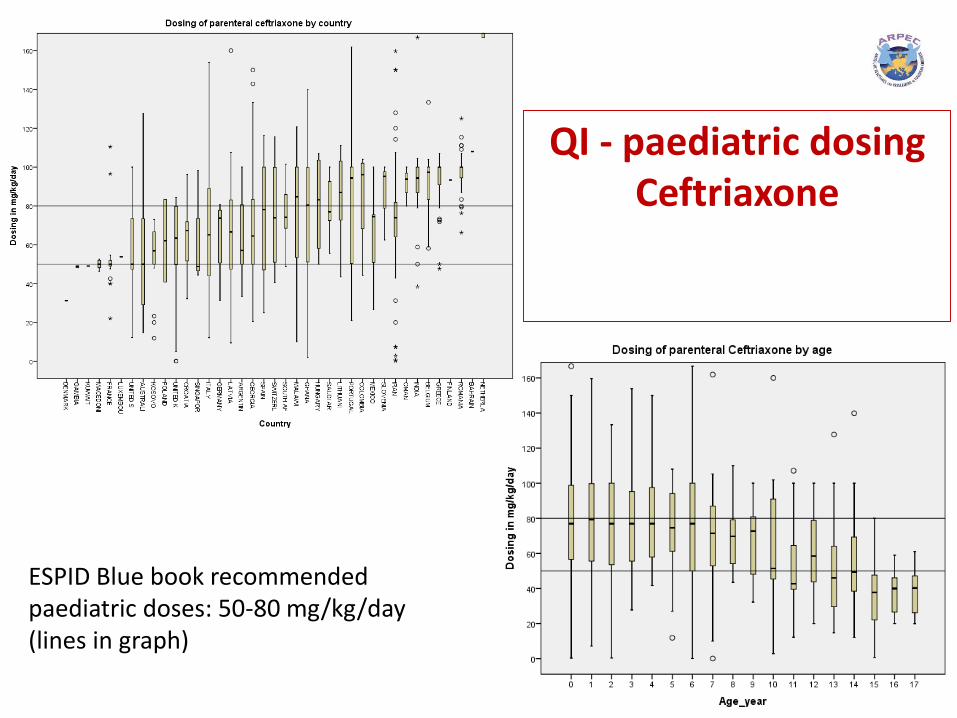
QI - paediatric dosing Ceftriaxone
ESPID Blue book recommended paediatric doses: 50-80 mg/kg/day (lines in graph)

ceftriaxone dosing
Frequently occurring doses: 500, 1000, 1500 and 2000mg
driven by vial size?
Mixed dosing: 50% weight-based + 50% irrespective of weight
Adherence to guidelines seems poor:
17% get exact recommended dose34% get recommended dose +/- 5mg

QI - Antibiotic therapy for children with suspected RTI, UTI, SSTI, bone and joint
infection in 80 European paediatric hospitals.

Quality Measures - Hospital
Paediatric Antimicrobial Stewardship
evidence-based standards for routine
antimicrobial use for RIGHT
•Decision – appropriate choice of antibiotic
•Drug – narrow spectrum - meropenem
•Dosing – within RDD bands
Ashiru-Oredope, D et al. J Antimicrob Chemother. 2012; 67 Suppl 1: 51-63.

Quality measures for community
prescribingBroad/
narrow
J01D J01F J01M J01CE_
%
J01CR_
%
J01_B/
N
J01_SV J01M_S
V
1.70 3.56 1.36 6.1 30.2 7.68 29.0 14.2
1.59 2.92 2.69 0.3 30.4 49.72 - -
2.32 3.00 1.99 1.8 13.6 1.4 6.79 - -
1.62 3.47 1.22 11.1 21.7 4.15 16.4 2.8
0.03 2.38 0.51 31.1 4.1 0.44 12.6 5.6
0.88 2.16 0.81 2.3 11.4 8.77 28.2 4.1
2.33 1.47 0.88 7.7 7.4 0.76 - -
2.67 3.75 2.00 0.5 23.4 42.98 - -
2.61 2.35 1.51 5.6 2.2 4.32 31.8 23.8
8.91 8.85 2.89 0.2 16.7 148.41 - -
1.92 3.00 1.97 3.4 29.3 15.85 41.5 21.4
0.62 1.56 1.02 10.8 20.7 1.87 12.9 81.9
1.21 3.66 0.91 4.3 27.0 5.65 10.9 0.6
2.55 5.13 3.45 <0.1 35.4 110.60 - -
0.54 1.06 0.86 0.4 12.1 5.32 - -
0.80 1.48 0.83 1.8 10.2 0.3 5.33 - -
4.18 3.87 2.94 0.3 30.9 35.17 31.3 20.6
5.04 3.15 1.79 0.2 40.4 180.15 - -
0.04 1.45 0.87 3.3 16.1 6.79 - -
0.12 1.79 0.54 23.3 <0.1 0.20 - -
2.44 3.54 1.23 0.7 21.3 37.07 - -
1.81 3.41 2.97 0.2 40.9 28.32 18.0 6.6
0.40 2.10 1.10 12.7 28.8 3.58 17.6 3.7
1.56 1.96 2.54 0.4 38.7 61.37 - -
0.20 0.75 0.77 27.8 1.7 0.17 - -
0.55 2.73 0.46 4.1 6.4 1.02 14.1 5.2
0.03 1.06 0.51 0.2 2.2 0.20 10.9 0.6
0.62 1.79 0.87 0.4 11.9 4.15 14.7 3.9
1.61 2.83 1.22 3.3 21.3 6.79 17.8 6.1
2.41 4.45 2.00 7.7 29.3 36.60 29.0 20.8
8.91 8.85 3.45 31.1 40.9 180.15 41.5 81.9
J01
J01C
J01D
J01F
J01M
J01CE_%
J01CR_%
J01DD+DE
J01MA_%
J01_B/N
J01_SV
J01M_SV
Consumption (DDD per 1000
inhabitants and per day)Relative consumption (%)
Country J01* JO1C J01DD+DE_
%
J01MA_
%
Seasonal
variation
Bulgaria 18.18 8.05 11.0
Austria 14.94 6.64 4.7 9.1
Belgium 28.44 16.28 <0.1 9.5
Czech Republic 17.89 7.60 0.5 6.8
Denmark 16.51 10.29 <0.1 3.1
Estonia 11.06 4.22 <0.1 7.4
Finland 18.50 6.61 <0.1 4.8
France 28.23 15.62 6.4 6.9
Germany 14.46 4.10 3.5 10.4
Greece** 39.37 12.87 0.6 7.3
Hungary 15.67 6.69 2.5 12.4
Iceland** 23.13 12.90 0.3 4.4
Latvia 11.11 5.27 0.5 7.4
Ireland 20.32 10.65 0.5 4.5
Italy 27.43 14.55 7.1 12.1
Lithuania 12.68 6.99 6.0
Luxembourg 28.60 13.96 <0.1 10.3
Malta 21.34 9.80 1.0 8.4
Netherlands 11.21 4.36 <0.1 7.6
Norway 15.77 6.77 <0.1 3.4
Poland 21.03 9.43 <0.1 5.8
Slovenia 14.39 9.67 0.7 7.6
Portugal 22.44 12.08 1.6 13.3
Spain 20.31 12.64 2.6 12.3
Sweden 14.15 7.09 0.2 5.5
Quality indicators
Indicators on consumption of antibacterials for systemic use (ATC group J01) and at ATC group level 3
J01_DID*** Consumption of antibacterials for systemic use (J01) expressed in DDD per 1000 inhabitants and per day
* Denominator for relative consumption; ** Country provided only to tal care data, ‡ Indicators within the fourth quartile (i.e. values > percentile 75 (p75) suggest better
quality than indicator values within the third quartile (i.e. p50 < values < p75) and so on.
J01C_DID Consumption of penicillins (J01C) expressed in DDD per 1000 inhabitants and per day
J01D_DID Consumption of cephalosporins (J01D) expressed in DDD per 1000 inhabitants and per day
J01F_DID Consumption of macrolides, lincosamides and streptogramins (J01F) expressed in DDD per 1000 inhabitants and
per day
J01M_DID Consumption of quinolones (J01M) expressed in DDD per 1000 inhabitants and per day
Indicators on seasonal variation of antibacterials for systemic consumption (ATC group J01, subgroup J01M)
Indicators on the relative consumption of antibacterials for systemic use (ATC group 3)Relative consumption
J01CE_% Consumption of b-lactamase sensitive penicillins (J01CE) expressed as percentage of the total consumption of
antibacterials for systemic use (J01)
J01CR_% Consumption of combination of penicillins, including b-lactamase inhibitor (J01CR) expressed as percentage of the
total consumption of antibacterials for systemic use (J01)
J01DD+DE_% Consumption of third and fourth generation of cephalosporins (J01(DD+DE)) expressed as percentage of the
total consumption of antibacterials for systemic use (J01)
J01_SV Seasonal variation of the total antibiotic consumption (J01) of a year period starting in July and ending the next
calendar year in June, expressed as percentage: [(DDD (winter quarters)/DDD (summer quarters)-1] x 100
Seasonal variation: Overuse in the winter quarters (January–March and October–December) compared with the J01M_SV Seasonal variation of quinolone consumption (J01M) -" -
*** The co lumn displays the original labels of quality indicators described in Qual Saf Health Care 2007;16:440–445.
J01MA_% Consumption of fluoroquinolones (J01MA) expressed as percentage of the total consumption of antibacterials for
systemic use (J01)
Indicators on the ratio of broad and narrow spectrum antibacterials
J01_B/N Ratio of the consumption of broad (J01(CR+DC+DD+(F-FA01))) to the consumption of narrow spectrum
penicillins, cephalosporins and macrolides (J01(CE+DB+FA01))
United Kingdom 18.58 8.56 <0.1 2.5
p0 11.06 4.10 <0.1 3.1
0.46 7.4
p75 22.17 12.50 1.56 10.1
p25 14.46 6.69 0.04 5.8
p50 18.34 9.00
p100 39.37 15.62 7.11 13.3
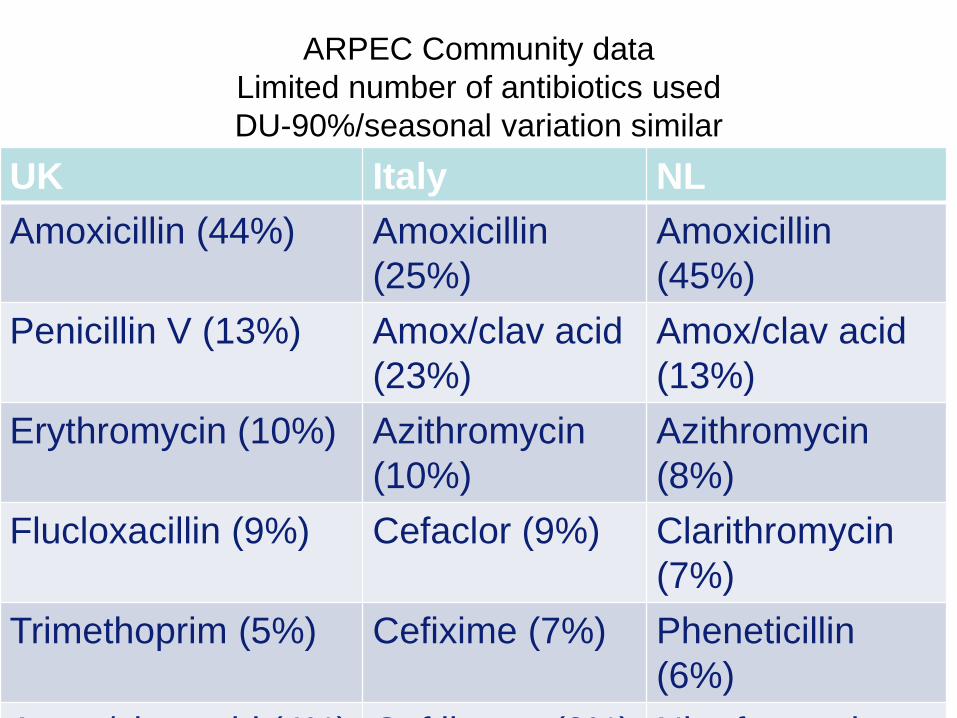
ARPEC Community data
Limited number of antibiotics used
DU-90%/seasonal variation similar
UK Italy NL
Amoxicillin (44%) Amoxicillin
(25%)
Amoxicillin
(45%)
Penicillin V (13%) Amox/clav acid
(23%)
Amox/clav acid
(13%)
Erythromycin (10%) Azithromycin
(10%)
Azithromycin
(8%)
Flucloxacillin (9%) Cefaclor (9%) Clarithromycin
(7%)
Trimethoprim (5%) Cefixime (7%) Pheneticillin
(6%)
Amox/clav acid (4%) Ceftibuten (3%) Nitrofurantoin

Amoxicillin Index - Percentage of children exposed to amoxicillin on the
total number of children exposed to antibiotics per database and calendar
year
0%
10%
20%
30%
40%
50%
60%
70%
80%
90%
100%
IPCI
THIN
PEDIA
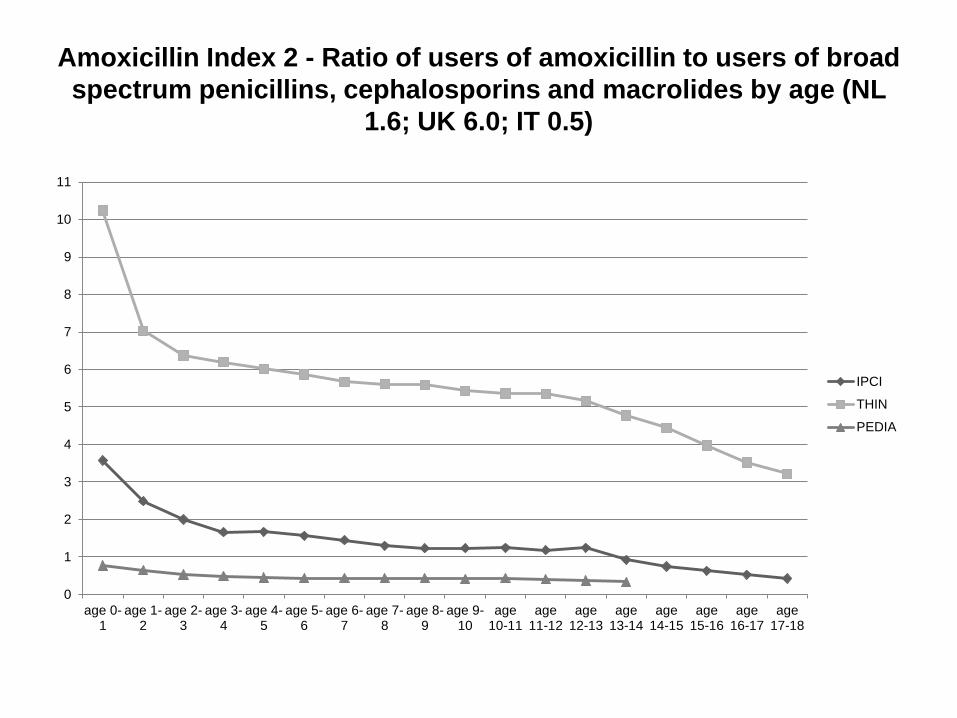
Amoxicillin Index 2 - Ratio of users of amoxicillin to users of broad
spectrum penicillins, cephalosporins and macrolides by age (NL
1.6; UK 6.0; IT 0.5)
0
1
2
3
4
5
6
7
8
9
10
11
age 0-1
age 1-2
age 2-3
age 3-4
age 4-5
age 5-6
age 6-7
age 7-8
age 8-9
age 9-10
age10-11
age11-12
age12-13
age13-14
age14-15
age15-16
age16-17
age17-18
IPCI
THIN
PEDIA

Amoxicillin Index 2 - Ratio of users of amoxicillin to users of broad
spectrum penicillins, cephalosporins and macrolides by year
0
1
2
3
4
5
6
7
IPCI
THIN
PEDIA

Quality measures for community• ESAC data – sales/reimbursement –
Syrup/Galenic formulation – limited list 10
antibiotics
• Age weighted prevalence range and trend
• Amoxicillin Index – simple indicator
• Region specific guideline adherence

Possible suggestions from
ARPEC• EARS-net – sub-analysis (biannually) of
paediatric BSI data - 0, 1-4, 5-10, 10-15
(add code NICU)
• ESAC-net – sub-analysis of paediatric
data - Community – Syrup/Galenic
formulation data; Hospital - weight, UD
• HAI-net – sub-analysis of paediatric data -
clarify well newborn and NICU code

Acknowledgements
Liselotte Diaz-
Högberg
Ole Heuer
Klaus Weist
Karl Suetens
Marc Struelens
Julia Bielicki
Tim Planche
Myriam Gharbi
Tatiana Munera
Katja Doerholt
David Cromwell
And all ARPEC
participants!
ARHAI Antimicrobial
Prescribing Measures
recommended to the
sponsor Department of
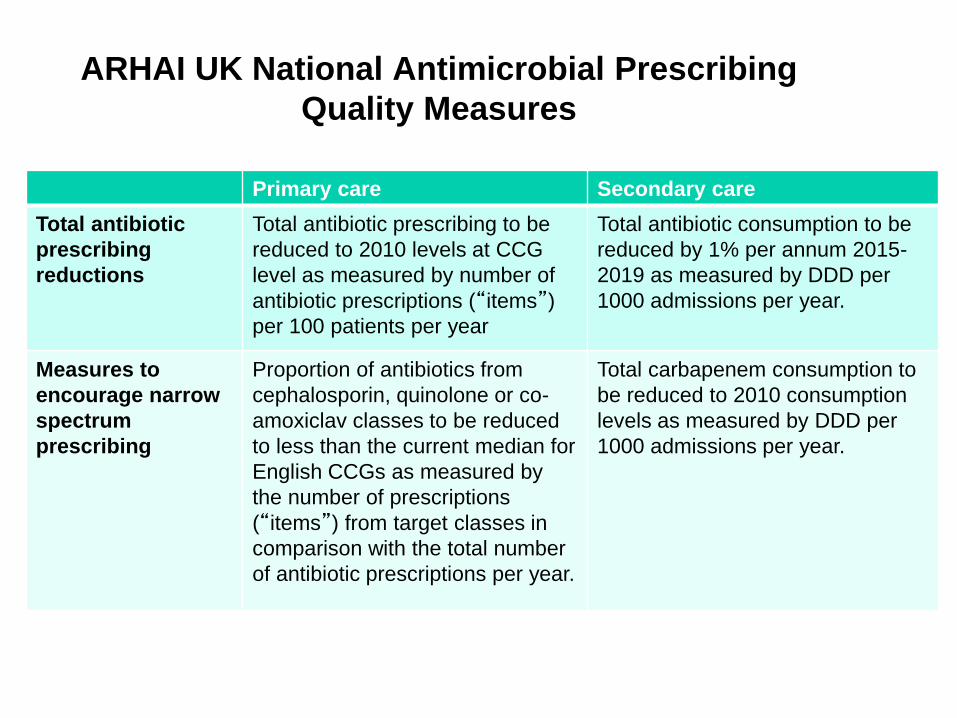
ARHAI UK National Antimicrobial Prescribing
Quality Measures
Primary care Secondary care
Total antibiotic
prescribing
reductions
Total antibiotic prescribing to be
reduced to 2010 levels at CCG
level as measured by number of
antibiotic prescriptions (“items”) per 100 patients per year
Total antibiotic consumption to be
reduced by 1% per annum 2015-
2019 as measured by DDD per
1000 admissions per year.
Measures to
encourage narrow
spectrum
prescribing
Proportion of antibiotics from
cephalosporin, quinolone or co-
amoxiclav classes to be reduced
to less than the current median for
English CCGs as measured by
the number of prescriptions
(“items”) from target classes in
comparison with the total number
of antibiotic prescriptions per year.
Total carbapenem consumption to
be reduced to 2010 consumption
levels as measured by DDD per
1000 admissions per year.