UV disinfection of treated wastewater in a large-scale pilot plant andinactivation of selected bacteria in a laboratory UV device
Abdennaceur Hassen a,*, Meryem Mahrouk a, Hadda Ouzari a, Mohamed Cherif b,Abdellatif Boudabous c, Jean Jacques Damelincourt d
a Institut National de Recherche Scienti®que et Technique, Laboratoire Environnement, B.P. 24-1082 Cit�e Mahraj�ene, Tunis, Tunisiab Institut National Agronomique de Tunisia, 43 Avenue Charles Nicolle, 1082 Cit�e Mahraj�ene Tunis, Tunisia
c Facult�e des Sciences de Tunis, Laboratoire de Microbiologie, Campus universitaire, 1060 Tunis, Tunisiad Centre de Physique des Plasmas et Applications de Toulouse, Universit�e Paul Sabatier, 118 Route de Narbonne, 31062 Toulouse cedex, France
Received 26 March 1998; received in revised form 2 December 1999; accepted 10 December 1999
Abstract
E�ciency of UV disinfection of un®ltered and ®ltered secondary wastewater e�uent, using a large-scale pilot system, and the
inactivation of six bacterial species in a laboratory UV-device have been studied. Pilot plant studies revealed low levels of coliforms
and streptococci (3 logarithmic units reduction) when a wastewater UV transmission of 45% and an average e�ective UV dose of 100
mW s cmÿ2 were used. By contrast, removal of Pseudomonas aeruginosa appeared insu�cient (<1.1 logarithmic units). Laboratory
investigations, using the six bacterial species as reference, showed that the kinetics of bacterial removal agreed with the model of
Chick±Watson, which is formulated by the equation dN=dt � ÿk0CnN . It also appeared, that according to the UV dose applied, two
types of inactivation prevailed: a high rate of inactivation, with weak UV doses, and a low rate of inactivation with relatively high
doses. Each examined strain was characterised by two K coe�cients, (K1 and K2). Lower the K value, more the bacterial resistance to
UV. Hierarchical classi®cation of bacteria, based on the values of kinetic constants, revealed three groups of di�erent sensitivity to
UV. A resistant group, represented by the two strains of P. aeruginosa ATCC 15442 and Bacillus subtilis 6633, and a sensitive group,
with the strain of Escherichia coli ATCC 11229. A medium group was represented by Enterococcus faecalis ATCC 19433, Serratia
marcescens ATCC 8100 and P. aeruginosa S21. Kinetic studies revealed that the ®rst instants of exposure (2±10 s) to a UV intensity
of 5±8 mW cmÿ2 appeared as deciding factors in the disinfection with UV irradiation. The importance of cumulative UV dose was
only secondary. Photoreactivation of micro-organisms following UV disinfection was observed with all bacterial strains studied
here, except for P. aeruginosa ATCC 15442, P. aeruginosa ATCC 15442 mutant m1 and Enterococcus hirae ATCC 10541. Ó 2000
Elsevier Science Ltd. All rights reserved.
Keywords: UV irradiation; Wastewater; Indicator bacteria; Modelling; Kinetics; Photoreactivation
1. Introduction
Use of wastewater after adequate treatments consti-tutes a potential water resource which could be of greatinterest to several sectors, such as agriculture, especiallyin countries su�ering from a de®ciency in water re-sources (Oppenheimer et al., 1993). Conventional pro-cesses of wastewater treatment (pre-, primary andsecondary treatments) allow a satisfactory removal ofthe organic load (suspended solids, biological oxygendemand and chemical oxygen demand) but appear to beless e�cient in removing pathogenic micro-organisms.
Man could be contaminated by water contact, by di-gestion of spoiled foods, and even by inhalation.
Disinfection of wastewater by UV irradiation isconsidered as a credible alternative to chemical disin-fection, because of the absence of toxic by-productswhich are usually generated and identi®ed duringchemical disinfection (Blatchley, 1996; Carrigan andCairns, 1991; Lindenauer and Darby, 1993; Mark andGordon, 1994; Oppenheimer et al., 1993). UV disinfec-tion is also characterised by a short contact time and amore e�cient antiviral action (Oppenheimer et al., 1993;Masschelein et al., 1989). Many factors, such as lampenvelope, lamp ageing, water turbidity, concentration ofsuspended solids and micro-organisms, and ¯uid thick-ness, a�ect the e�ciency of UV irradiation (Harris et al.,1987; Qualls et al., 1985; Parker and Darby, 1995).
Bioresource Technology 74 (2000) 141±150
* Corresponding author. Tel.: +216-1-788-436; fax: +216-1-430-934.
0960-8524/00/$ - see front matter Ó 2000 Elsevier Science Ltd. All rights reserved.
PII: S 0 9 6 0 - 8 5 2 4 ( 9 9 ) 0 0 1 7 9 - 0

Therefore, it is recommended that a water of goodphysico-chemical quality and with a UV transmissionsuperior to 50% be treated (Allani, 1993). E�ciency ofUV disinfection depends also on the UV dose and on theaggregation state of bacteria in water (Parker andDarby, 1995). Speci®c energies needed to achieve totalor partial destruction of micro-organisms vary accord-ing to the physico-chemical composition of water to betreated and to the sensitivity of organisms to UV irra-diation. Di�erent studies have classi®ed micro-organ-isms and their propagules in the following increasingorder of resistance: bacteria < viruses < fungi <spores < cysts (Failly, 1994).
One of the few problems encountered with UV dis-infection is that this latter cannot provide any residualdisinfection once the e�uents being treated have left theUV photoreactor. This problem is compounded by thefact that micro-organisms are able to repair damage andalterations induced to their DNA by UV treatmentfollowing the administration of a sub-lethal dose.
The models of disinfection available in the literatureare empirical and many of these models have beenproposed to explain disinfection kinetics (Hom, 1972;Selleck et al., 1978; Severin et al., 1984; Haas, 1994). Inthe present study, we introduced the concept of varia-tion of the speed of disinfection during the process, butonly the model of Chick±Watson was used.
The aims of this study were: to study the disinfectionof wastewater by UV irradiation in a semi-industrialpilot plant, to evaluate the kinetics of bacterial inacti-vation using reference strains and a model UV-device,and to determine the photoreactivation of some bacte-rial strains of reference after di�erent times of exposureto ambient laboratory light.
2. Methods
2.1. Pilot plant study
Wastewater treatment. Secondary (trickling-®ltrate)treated wastewater samples were taken from a pilotplant. The mean level of total suspended solids was16 mg/l in the secondary e�uent. Average BOD andchemical oxygen demand (COD) levels were, respec-tively, 24 and 96 mg/l, and average ammonia and nitratelevels were, respectively, 24 and 12 mg/l. The mean levelof indicator bacteria was 105 and 1:25� 105 bacteria/100 ml, respectively for faecal streptococci and faecalcoliforms.
Pilot-plant description. The study took place in awastewater treatment plant using a monolamp UV pilotequipment supplied by Katadyn (Katadyn ProdukteAG, Wallisellen, Switzerland). The pilot plant ran con-tinuously during the study. The UV pilot equipment,with a useful volume of 2 l, was constituted with a
stainless cylindrical container which involved a lowpressure mercury vapour discharge lamp (length �680 mm, diameter � 18 mm, power of UV emission at254 nm � 65 W� inserted into a quartz sleeve used tomechanically protect and seal the lamp. Every monththe sleeve was cleaned mechanically with a dilute hy-drochloric acid solution to prevent ®lthiness of the lamp.A selective detector for UV (253.7 nm) joined to a ra-diometer (Vilbert±Lourmat, Norme la Vall�ee, France)allowed the UV intensity at the emerging of the quartzsleeve to be determined.
Calculation of the e�ective UV dose in the pilot UVsystem. UV doses in the irradiation chamber wereevaluated using the empirical method recommended byQualls et al. (1989). This method considers the UV in-cident intensity, measured on the surface of the quartzsleeve, and the depth of the water layer crossed by UVradiation. Thus the dose at the area e of 1 cm2 in theirradiation chamber is de®ned as follows: De � ImtcT�l�;where De is the UV dose calculated at the area e of 1 cm2,Im the UV incident intensity measured on the surface ofthe quartz tube, tc the exposure time (s): ¯ow (l sÿ1)/volume of the irradiation chamber (l) and T�l� is thevalue of UV transmittance determined in the laboratory(Fig. 1) using a spectrophotometer (UV-visible) withdi�erent length quartz vessels and wastewater of variousqualities.
Sampling and water analysis. The disinfection studiesconcerned un®ltered- and sand-®ltered wastewater fromthe trickling-®lter e�uent. The study consisted in mon-itoring the quality of the e�uent before and after UVexposure. For each experiment, two samples of 3 l werecollected weekly in sterile glass bottles, before and aftereach pass through the UV system. Analysis was doneimmediately on receipt of samples in the laboratory,usually within 1±3 h of sample collection. In parallel to
Fig. 1. Transmittance UV according to the optical way of UV rays
and wastewater quality. EP: Primary treated wastewater, EDC: Sec-
ondary wastewater treated by oxidation lagoon, LB: Secondary
wastewater treated by trickling ®ltrate, DB: Secondary wastewater
treated by Biodisks, ETC: Secondary wastewater treated by activate
sludges.
142 A. Hassen et al. / Bioresource Technology 74 (2000) 141±150
each microbiological sample, an analysis of the physicaland chemical properties of the e�uent was carried out[COD, Standard NF T 90±101; suspended solids (SS),Standard NF T 90±105; turbidity, Standard NF T 90-033; UV transmittance at 253.7 nm, measured by aspectrophotometer, Philips PU 8620 series UV/visible].Indicator bacteria were enumerated by the most prob-able number method (MPN) and they included thecounting of faecal coliforms (FC), faecal streptococci(FS), and Pseudomonas aeruginosa (PA) according toFrench standards (Rodier, 1978). The corrected MPNtables proposed by Man (1983) were used.
3. Modelling study
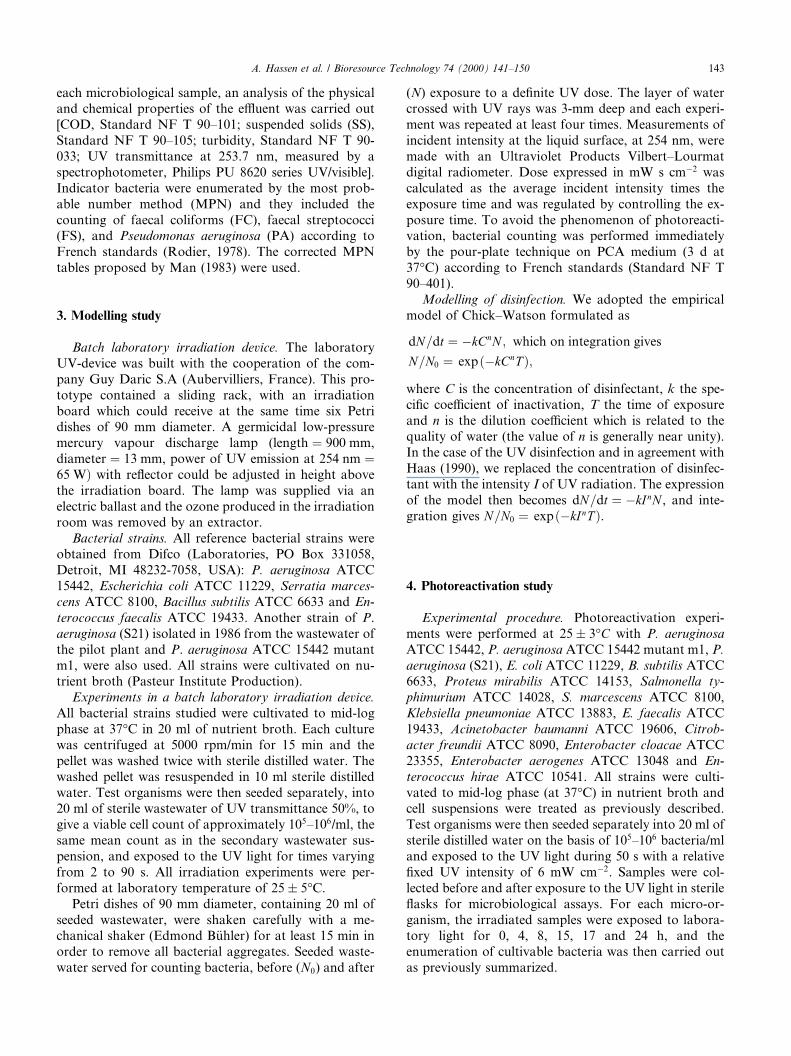
Batch laboratory irradiation device. The laboratoryUV-device was built with the cooperation of the com-pany Guy Daric S.A (Aubervilliers, France). This pro-totype contained a sliding rack, with an irradiationboard which could receive at the same time six Petridishes of 90 mm diameter. A germicidal low-pressuremercury vapour discharge lamp (length � 900 mm,diameter � 13 mm, power of UV emission at 254 nm �65 W� with re¯ector could be adjusted in height abovethe irradiation board. The lamp was supplied via anelectric ballast and the ozone produced in the irradiationroom was removed by an extractor.
Bacterial strains. All reference bacterial strains wereobtained from Difco (Laboratories, PO Box 331058,Detroit, MI 48232-7058, USA): P. aeruginosa ATCC15442, Escherichia coli ATCC 11229, Serratia marces-cens ATCC 8100, Bacillus subtilis ATCC 6633 and En-terococcus faecalis ATCC 19433. Another strain of P.aeruginosa (S21) isolated in 1986 from the wastewater ofthe pilot plant and P. aeruginosa ATCC 15442 mutantm1, were also used. All strains were cultivated on nu-trient broth (Pasteur Institute Production).
Experiments in a batch laboratory irradiation device.All bacterial strains studied were cultivated to mid-logphase at 37°C in 20 ml of nutrient broth. Each culturewas centrifuged at 5000 rpm/min for 15 min and thepellet was washed twice with sterile distilled water. Thewashed pellet was resuspended in 10 ml sterile distilledwater. Test organisms were then seeded separately, into20 ml of sterile wastewater of UV transmittance 50%, togive a viable cell count of approximately 105±106/ml, thesame mean count as in the secondary wastewater sus-pension, and exposed to the UV light for times varyingfrom 2 to 90 s. All irradiation experiments were per-formed at laboratory temperature of 25� 5°C.
Petri dishes of 90 mm diameter, containing 20 ml ofseeded wastewater, were shaken carefully with a me-chanical shaker (Edmond B�uhler) for at least 15 min inorder to remove all bacterial aggregates. Seeded waste-water served for counting bacteria, before (N0) and after
(N) exposure to a de®nite UV dose. The layer of watercrossed with UV rays was 3-mm deep and each experi-ment was repeated at least four times. Measurements ofincident intensity at the liquid surface, at 254 nm, weremade with an Ultraviolet Products Vilbert±Lourmatdigital radiometer. Dose expressed in mW s cmÿ2 wascalculated as the average incident intensity times theexposure time and was regulated by controlling the ex-posure time. To avoid the phenomenon of photoreacti-vation, bacterial counting was performed immediatelyby the pour-plate technique on PCA medium (3 d at37°C) according to French standards (Standard NF T90±401).
Modelling of disinfection. We adopted the empiricalmodel of Chick±Watson formulated as
dN=dt � ÿkCnN ; which on integration gives
N=N0 � exp�ÿkCnT �;where C is the concentration of disinfectant, k the spe-ci®c coe�cient of inactivation, T the time of exposureand n is the dilution coe�cient which is related to thequality of water (the value of n is generally near unity).In the case of the UV disinfection and in agreement withHaas (1990), we replaced the concentration of disinfec-tant with the intensity I of UV radiation. The expressionof the model then becomes dN=dt � ÿkInN , and inte-gration gives N=N0 � exp�ÿkInT �.
4. Photoreactivation study
Experimental procedure. Photoreactivation experi-ments were performed at 25� 3°C with P. aeruginosaATCC 15442, P. aeruginosa ATCC 15442 mutant m1, P.aeruginosa (S21), E. coli ATCC 11229, B. subtilis ATCC6633, Proteus mirabilis ATCC 14153, Salmonella ty-phimurium ATCC 14028, S. marcescens ATCC 8100,Klebsiella pneumoniae ATCC 13883, E. faecalis ATCC19433, Acinetobacter baumanni ATCC 19606, Citrob-acter freundii ATCC 8090, Enterobacter cloacae ATCC23355, Enterobacter aerogenes ATCC 13048 and En-terococcus hirae ATCC 10541. All strains were culti-vated to mid-log phase (at 37°C) in nutrient broth andcell suspensions were treated as previously described.Test organisms were then seeded separately into 20 ml ofsterile distilled water on the basis of 105±106 bacteria/mland exposed to the UV light during 50 s with a relative®xed UV intensity of 6 mW cmÿ2. Samples were col-lected before and after exposure to the UV light in sterile¯asks for microbiological assays. For each micro-or-ganism, the irradiated samples were exposed to labora-tory light for 0, 4, 8, 15, 17 and 24 h, and theenumeration of cultivable bacteria was then carried outas previously summarized.
A. Hassen et al. / Bioresource Technology 74 (2000) 141±150 143

Statistical analysis. All photoreactivation experi-ments were replicated at least ®ve times and data weresubjected to analysis of variance, and means were sep-arated by the least-signi®cant-di�erence according to theStudent Newman±Keuls test (SPSS for Windows, SPSS,17 June, 1993).
5. Results
5.1. Pilot study
E�ective UV doses in the pilot UV system. Table 1indicates that calculated e�ective UV doses in the UVsystem are variable. Three types of doses were de®ned:(i) the minimal dose determined inside the irradiationchamber, which is relative to a layer of water with2.25-cm deep, (ii) the maximal dose calculated atthe exterior surface of the quartz sleeve, and (iii) themedian dose corresponding to the middle depth ofthe irradiation chamber. The calculated UV doses in theirradiation chamber ¯uctuated between 21.6 and120 mW s cmÿ2 with a short exposure time of 10 s andbetween 64.8 and 360 mW s cm2 with a relatively longexposure time of 30 s. It is important to mention in thiscase that the e�ects of ¯ow turbulence in the irradiationchamber were neglected and lamp intensity was supposedto be with no major variation over the experiment.
Performance of the UV pilot system. During the pilotexperiment, the main objective was to attain a minimumdisinfection value of 103 faecal bacteria/100 ml at theoutlet of the UV pilot system. Results shown in Fig. 2show that with the UV dose of 108 mW s cmÿ2, theaverage reduction of FC and FS was about 3 logarith-mic units.
Sand ®ltration did not change seriously the e�cacy ofthe disinfection. The increase of UV dose, beyond themean of 108 mW s cmÿ2, did not seem to have a sig-ni®cant e�ect on the e�cacy of the disinfection. The rateof P. aeruginosa reduction was always inferior to 1.1logarithmic units, regardless of the nature of the treatedwater.
In summary, the study of micro-organisms sensitivityto UV disinfection showed that the most sensitive were
faecal bacteria (FC and FS) and the most resistant wasP. aeruginosa. From the results obtained in these ex-periments, UV-treated wastewater is suitable for beingdischarged into a natural environment or reused in ag-riculture, since the recommended value of 103 faecalbacteria/100 ml was always reached.
6. Batch UV disinfection
The model of Chick±Watson has been proposed toexplain UV disinfection kinetics. The expression of themodel is
Table 1
Estimation of the UV radiation in the pilot UV-device
Mean of UV incident
intensitya (mW cmÿ2)
Path length crossed
by UV (cm)
Calculated UV
transmittanceb (%)
Exposure
timec (s)
10 20 30
UV Doses (mW s cmÿ2)
Minimal ± 2.25 18 21.6 43.2 64.8
Median 12 1.125 45 54 108 162
Maximal ± 0 100 120 240 360
a Mean of UV incident intensity measured on the surface of the tube of quartz and expressed in mW cmÿ2.b UV transmittance calculated according to abacus in Fig. 1.c Exposure time (s)�¯ow (l/s)/Volume of the irradiation chamber (l).
Fig. 2. UV reduction of indicator bacteria at the outlet of the trickling
®ltrate without (A) or with (B) sand ®ltration. FC: Faecal coliforms,
FS: Faecal streptococci, PA: P. aeruginosa, Log reduction �ÿ log�N=N0�; with N: Number of micro-organisms after UV irradia-
tion (at the exit of the UV reactor); N0: Number of micro-organisms
before UV irradiation (at the entry of the UV reactor).
144 A. Hassen et al. / Bioresource Technology 74 (2000) 141±150

N=N0 � exp�ÿkInT �:Parameters to identify are K and n. By using the inte-grated form of the model and passing to the logarithm,then
Ln�ÿ Ln
NN0
� ��� Ln K� � � nLn I� � � Ln T� �;
and with the help of an exponential ®tting the values ofK and n were determined.
According to the literature, if n < 1 then the pro-cesses of disinfection are controlled by the time ofcontact rather than the UV radiation dose. On a con-trary if n > 1, then the UV radiation dose becomes more
important as compared to the contact time (Leahy et al.,1987). In this case, results obtained showed that thevalue of n is always nearly one and the model becomes�N=N0� � exp�ÿkIT �.
An illustration of these adjustments showed a largevariation between the measured and the calculated val-ues (Fig. 3). Consequently, the model of Chick±Watsonis not a representative of the kinetics of disinfection.Therefore, a second approach of modelling was assumedby considering: (1) an initial microbial reduction at thecontact of water with UV radiation; (2) a variation ofthe speed of disinfection during the process of UV ir-radiation. The model becomes in this case N=N0 �A exp�ÿkInT �, where A is the initial microbial reduction
Fig. 3. Kinetics of bacterial reduction according to the model of Chick±Watson. y: Reduction � N=N0 with N: Number of micro-organisms at the
instant T, and N0: Number of micro-organisms at the instant T � 0; x � InT with I: UV intensity (mW cmÿ2), T: Time (s); n:
Coefficient of the model � 1; Symbols, measured values; Lines, calculated values.
A. Hassen et al. / Bioresource Technology 74 (2000) 141±150 145
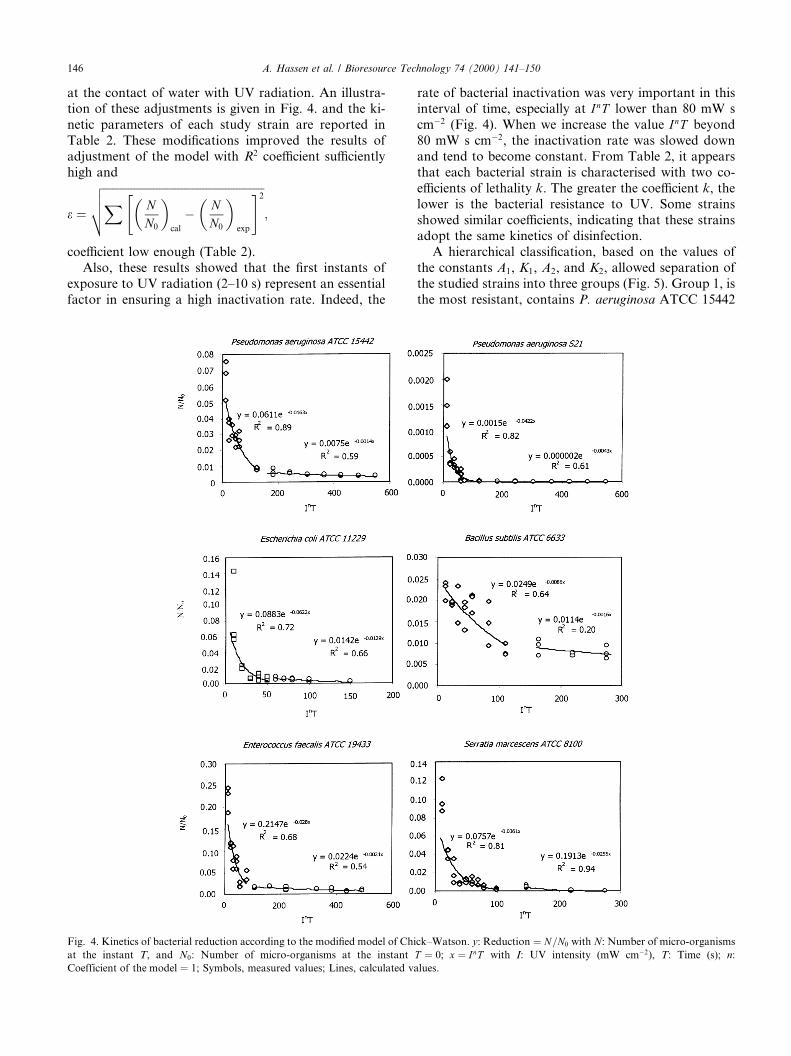
at the contact of water with UV radiation. An illustra-tion of these adjustments is given in Fig. 4. and the ki-netic parameters of each study strain are reported inTable 2. These modi®cations improved the results ofadjustment of the model with R2 coe�cient su�cientlyhigh and
e �
����������������������������������������������������������X NN0
� �cal
ÿ NN0
� �exp
" #2vuut ;
coe�cient low enough (Table 2).Also, these results showed that the ®rst instants of
exposure to UV radiation (2±10 s) represent an essentialfactor in ensuring a high inactivation rate. Indeed, the
rate of bacterial inactivation was very important in thisinterval of time, especially at InT lower than 80 mW scmÿ2 (Fig. 4). When we increase the value InT beyond80 mW s cmÿ2, the inactivation rate was slowed downand tend to become constant. From Table 2, it appearsthat each bacterial strain is characterised with two co-e�cients of lethality k. The greater the coe�cient k, thelower is the bacterial resistance to UV. Some strainsshowed similar coe�cients, indicating that these strainsadopt the same kinetics of disinfection.
A hierarchical classi®cation, based on the values ofthe constants A1, K1, A2, and K2, allowed separation ofthe studied strains into three groups (Fig. 5). Group 1, isthe most resistant, contains P. aeruginosa ATCC 15442
Fig. 4. Kinetics of bacterial reduction according to the modi®ed model of Chick±Watson. y: Reduction � N=N0 with N: Number of micro-organisms
at the instant T, and N0: Number of micro-organisms at the instant T � 0; x � InT with I: UV intensity (mW cmÿ2), T: Time (s); n:
Coefficient of the model � 1; Symbols, measured values; Lines, calculated values.
146 A. Hassen et al. / Bioresource Technology 74 (2000) 141±150

and B. subtilis ATCC 6633. Group 2 included E. faecalisATCC 19433, S. marcescens ATCC 8100 and P. aeru-ginosa S21. Group 3, is the most sensitive, which con-tained only E. coli ATCC 11229.
7. Photoreactivation results
Results shown in Table 3 indicate that the majority ofthe studied strains showed a signi®cant photoreactiva-tion after the di�erent periods of exposure to laboratorylight. On the other hand, in the case of P. aeruginosaATCC 15442, P. aeruginosa ATCC 15442 mutant m1
and E. hirae ATCC 10541 statistical analysis did notshow the signi®cant di�erences in bacterial reductionafter di�erent periods of exposure to laboratory light,suggesting that photoreactivation was not perceptible ornot active.
8. Discussion
As it has been suggested by many authors in the lit-erature, the UV dose necessary to kill pathogens iscomparable to the dose necessary to kill indicator bac-teria (Yip and Konosewich, 1972). UV doses meetingcoliform standards may be relatively more e�ective thanchlorination in killing pathogens (Shaban et al., 1997).Nevertheless, a major disadvantage of UV disinfectionlies in the ability of micro-organisms treated by a sub-lethal UV dose to repair damage caused to their DNA(Mosely, 1984; Lindenauer and Darby, 1993). There-fore, de®nition and calculation of the e�ective UV doseare very important factors in water disinfection, but
these are rather di�cult to determine (Blatchley andHunt, 1994; Qualls et al., 1989; Sommer and Cabaj,1993; Sommer et al., 1997). Studies of Norest and Schild(1986) and Sobotka (1992) recommended the formula ofBeer Lambert Ie � I0eÿax, in order to determine thegermicidal intensity in the UV irradiation device, whereI0 is the incident intensity, Ie the intensity on the depth xand a is the coe�cient of absorption (or UV transmit-tance). Also, currently in the UV plants, the calculationdone by the manufacturer is based on theoretical con-siderations.
In this study, we evaluated the UV dose in the irra-diation chamber using the empirical method recom-mended by Qualls et al. (1989). This method, aspreviously described, considers wastewater quality,particularly UV transmittance at 253.7 nm and pathlength crossed by the UV rays. In this way, the minimalUV dose generally prescribed in water disinfection is afunction of the characteristics of installation, of expo-sure time and of the coe�cient of UV absorption ofwater. For example, the minimal doses recommendedand reported by Rosset and Rosset (1996) are as follows:drinking water 25 mW s cmÿ2, domestic wastewater 30mW s cmÿ2 and wastewater of brewery 50 mW s cmÿ2.For a secondary e�uent with a low bacterial load, adose of 27 mW s cmÿ2 was su�cient to reach the ®xedlimit of 103 FC or FS/100 ml, and as the contaminationincreased, the dose had to be increased to 32 mW s cmÿ2
(Moreno et al., 1997). Failly (1994) recommend theminimal UV dose of 30 mW s cmÿ2 for wastewater. Inpractice, it is necessary to verify every installation, usingan empirical speci®c study and having recourse to somemicrobial counting.
Table 2
Characteristics of the kinetic of bacterial reduction by UV irradiationa
Strain First kinetic reduction Second kinetic reduction
A1 K1 R21 e A2 K2 R2
2 e
P. aeruginosa ATCC 15442 0.0611 )0.0163 0.89 0.0376 0.0075 )0.0014 0.59 0.0038
P. aeruginosa S21 0.0015 )0.0422 0.82 0.0036 0.0000 )0.0043 0.61 0.0001
E. coli ATCC 1229 0.0883 )0.0622 0.72 0.0980 0.0142 )0.0129 0.66 0.0056
B. subtilis ATCC 6633 0.0249 )0.0086 0.64 0.0152 0.0114 )0.0016 0.2 0.0037
E. faecalis ATCC 19433 0.2147 )0.028 0.68 0.0718 0.0224 )0.0021 0.54 0.0235
S. marcescens ATCC 8100 0.0757 )0.0361 0.81 0.0930 0.1913 )0.0255 0.94 0.0027
a A1, K1, A2 and K2: characteristics of the model; R21 and R2
2: coe�cients of determination; e: di�erence between calculated and measured values�������������������������������������������������������R��N=N0�cal ÿ �N=N0� exp �2
q.
Fig. 5. Dendrogram of hierarchical cluster analysis using average linkage (between groups).
A. Hassen et al. / Bioresource Technology 74 (2000) 141±150 147

Our study of micro-organisms sensitivity to UV dis-infection showed that the most sensitive were faecalbacteria (FC and FS) and the most resistant was P.aeruginosa. From the results obtained in these experi-ments, UV treated wastewater is suitable for being dis-charged into natural environment or reused inagriculture, since the recommended value of 103 faecalbacteria/100 ml is always reached. Sand ®ltration ame-liorated slightly the e�cacy of the disinfection. This lowimprovement of about 0.5 logarithmic units could beprobably due to a defective processing of sand ®ltration.Indeed, if the sand ®lter functions correctly, then thephysico-chemical quality of water would be ameliorated,and consequently the output of the disinfection wouldbe improved. This lower e�ciency in the case of P.aeruginosa could be explained by the relative resistanceof this species to UV.
The batch study showed that the kinetics of bacterialinactivation varied according to the applied UV dose.The ®rst instants (2±10 s, corresponding to the meandoses of 10 and 80 mW s cmÿ2) appeared as a deter-mining factor. Consequently, we think that outside thee�ect of dose, an e�ect of shock is necessary at least forcertain species. This observation induced us to modifythe orientation of our investigation, in seeking to in-crease, at e�ciency noticeably constant, the density ofradiation ¯ow emitted on the wavelength 254 nm (Sar-roukh et al., 1999), on the other hand in testing somemixtures of mercury-rare gas-metal halides susceptibleof being used in a ¯ash in order to produce an e�ect ofshock (Damelincourt et al., 1998).
A hierarchical classi®cation, based on the values ofthe kinetic constants of the model, revealed that E. coliATCC 11229 is the most sensitive, while B. subtilis andP. aeruginosa ATCC 15442 are the most resistantstrains. Resistance of P. aeruginosa ATCC 15442 is inconcordance with the resistance of P. aeruginosa ob-served in the pilot study. Resistance of B. subtilis may beexplained by the ability of this latter to sporulate. Infact, sporulation is a form of resistance developed bysome bacteria in order to withstand unfavourable con-ditions. Also, it is interesting to note that bacterialstrains used in our investigations have been utilised inmany other studies on UV disinfection (Martiny et al.,1988; Potapchenko et al., 1995; Qualls et al., 1989;Sommer and Cabaj, 1993; Sommer et al., 1995; Sommeret al., 1996).
In order to highlight the in¯uence of hydraulic tur-bulence in the irradiation chamber on the performanceof UV disinfection, we have used the model of Hom(Hom, 1972), and an expression of the kinetics of re-duction of faecal bacteria (FC and FS) has been simu-lated in a reactor perfectly mixed and in a reactor piston.This simulation is expressed as a function of the expo-sure time and the UV incident intensity. The results (notshown) pointed out that the reduction of faecal bacteriaT
ab
le3
Ph
oto
rea
ctiv
ati
on
resu
ltsA
Str
ain
Red
uct
ion
aft
erth
ed
i�er
ent
per
iod
so
fex
po
sure
tola
bo
rato
ryli
gh
t(h
)
04
815
17
24
P.
aer
ug
inosa
AT
CC
15
442
PA
)5.4
5a�0:7
8a
)5:0
8�
1:0
9a
ÿ5:1
1�
1:0
7a
ÿ4:0
9�
1:4
2a
ND
ND
P.
aer
ug
inosa
AT
CC
15
442
mu
tan
tm
1P
Am
3:3
1�
0:6
2a
2:9
9�
1:2
9a
2:7
2�
0:6
2a
2:4
6�
0:0
7a
ND
ND
P.
aer
ug
inosa
(S21)
S21
4:2
8�
0:3
8a
4:1
9�
0:4
1a
3:5
1�
0:5
2ab
2:7
2�
0:3
8b
ND
ND
E.
coli
AT
CC
11
22
9E
.co
liÿ5:9
6�
0:5
3a
ÿ6:1�
0:3
3a
ND
ÿ3:7
4�
0:4
5b
ND
ND
B.
sub
tili
sA
TC
C6
63
3B
Sÿ2:9
2�
0:7
5a
ÿ3:0
6�
0:8
2a
ÿ2:4
6�
0:2
7a
ÿ0:5
9�
0:2
8b
ÿ1:7
0�
0:9
8ab
ÿ1:0
3�
0:8
6b
P.
mir
abil
isA
TC
C1
41
53
PM
ÿ6:3
6�
0:8
0a
ÿ6:3
1�
0:8
6a
ÿ6:2
8�
0:9
0a
ÿ3:9
4�
0:5
0b
ÿ3:7
3�
0:3
8b
ÿ1:4
6�
0:5
5c
S.
typ
him
uri
um
AT
CC
14
02
8S
Tÿ3:3
7�
0:3
6a
ÿ2:7
5�
0:3
7a
ÿ2:8
5�
0:2
9a
ÿ0:6
5�
0:5
3c
ÿ0:7
6�
0:3
0c
ÿ1:3
8�
0:9
5b
S.
marc
esce
ns
AT
CC
81
00
SM
ÿ7:0
5�
0:1
4a
ÿ6:6
1�
0:4
6a
ÿ6:8
2�
0:1
7a
ÿ3:5
5�
1:1
7b
ÿ3:3
2�
0:5
2b
ÿ1:3
4�
0:9
0c
K.
pn
eum
on
iae
AT
CC
13
88
3K
Pÿ5:3
8�
0:0
2a
ÿ5:3
3�
0:1
3a
ÿ5:3
8�
0:0
2a
ÿ4:3
5�
1:0
5ab
ÿ3:4
5�
0:6
5b
ÿ2:7
7�
0:4
5b
E.
faec
ali
sA
TC
C1
94
33
EF
ÿ5:8
9�
0:1
7a
ÿ5:7
3�
0:2
3a
ÿ5:9
9�
0:0
1a
ÿ1:2
7�
0:4
9c
ND
ÿ2:6
5�
0:4
8b
A.
ba
um
an
ni
AT
CC
19
606
AB
ÿ6:3
8�
0:2
2a
ÿ6:3
3�
0:3
0a
ÿ5:6
7�
0:5
6a
ÿ1:0
1�
0:1
8b
ÿ0:5
5�
0:1
8b
ÿ0:7
4�
0:2
7b
C.
freu
nd
iiA
TC
C8
09
0C
Fÿ4:6
6�
0:0
1a
ÿ4:6
6�
0:0
1a
ÿ4:6
6�
0:0
1a
ÿ1:0
8�
0:2
0c
ÿ1:0
4�
0:1
7c
ÿ2:2
4�
0:8
0b
E.
clo
aca
eA
TC
C2
33
55
EC
ÿ6:4
7�
0:0
1a
ÿ6:0
7�
0:1
7a
ÿ6:0
7�
0:3
6a
ÿ1:8
4�
0:3
3b
ÿ1:9
3�
0:3
1b
ÿ2:4
7�
0:4
6b
E.
aer
og
enes
AT
CC
13
04
8E
Aÿ7:4
5�
0:0
1a
ÿ7:3
5�
0:1
7a
ND
ÿ3:6
7�
0:1
9b
2:2
1�
0:5
6c
ÿ1:0
1�
0:3
6d
E.
hir
ae
AT
CC
10
54
1E
Hÿ6:8
2�
0:0
1a
ND
ND
ÿ6:8
2�
0:3
0a
ND
ÿ6:8
20:2
0a
A(a
,b):
Mea
ns
of
each
lin
ea
nd
a�
ecte
dw
ith
the
sam
ele
tter
isn
ot
sign
i®ca
ntl
yd
i�er
ent
acc
ord
ing
toth
ete
sto
fS
tud
ent
New
man
±K
euls
.a
Mea
ns
of
bact
eria
lre
du
ctio
nex
pre
ssed
inlo
gari
thm
icu
nit
y(Uÿ
log�ÿ
log
N=N
0),
wh
ere
Nis
the
nu
mb
ero
fb
act
eria
aft
erth
ep
erio
do
fex
po
sure
tola
bo
rato
ryli
gh
tan
dN
0is
the
nu
mb
ero
f
ba
cter
iab
efo
reth
etr
eatm
ent
wit
hU
V;�:
Sta
nd
ard
dev
iati
on
;n�
5.
148 A. Hassen et al. / Bioresource Technology 74 (2000) 141±150
is always more important in a reactor with piston ¯owthan in the one perfectly mixed. So, in order to insure agood disinfection, it is necessary to conceive a UV re-actor with turbulent ¯ow as near as possible to thepiston ¯ow. A tubular irradiation chamber with a suf-®ciently long lamp can therefore be considered as a goodreactor for UV disinfection.
Variation in the bacterial photoreactivation is seri-ously discussed in the literature; and it seems that certainmicro-organisms are able to repair some of the damagecaused by UV light when exposed to light in the near-UV or violet-blue spectral range (Mosely, 1984). Dif-ferent mechanisms are proposed to explain the processof photoreactivation. Dimers of pyrimidine, resultingfrom the UV alteration, are reduced in situ to monomersby an active enzyme through the action of visible light inthe near-UV or violet-blue spectral range (310±480 nm).The second mechanism is the substitution of damagednucleotides. The best known example is cutting-repair-ing: a sequence of low adjacent bases is excised fromDNA submitted to the UV radiance, and then it is re-synthesized correctly (Kashimada et al., 1996; Linden-auer and Darby, 1993; Mosely, 1984). Nevertheless, theprocess of photoreactivation is not general in all bacte-ria. Di�erent factors a�ecting photoreactivation arediscussed, such as UV dose, wastewater quality, expo-sure time to photoreactivating light, and particularly thespecies of the micro-organism. Apparent photoreacti-vation by a ¯uorescent lamp was observed in the case ofindicator bacteria (heterotrophic bacteria, coliformbacteria, faecal coliforms) in raw sewage, but not in E.coli B and E. coli K12 A/lambda (F+) (Kashimada et al.,1996).
In conclusion, the use of special germicidal UVlamps, during a relatively uniform short time release andhigh ¯ux of energy (notion of ¯ash lamps), and theoptimisation of UV emission in the irradiation chamberwould be of major interest in order to guarantee a gooddisinfection. This would also present the major advan-tage of avoiding the phenomena of bacterial revitalisa-tion and the release of mutants in the environment.
Acknowledgements
This study was supported by the Economical Euro-pean Community (project Avicenna n°93 AVI 054). Wethank Mr. M. Deshaumes of the Company Daric S.A.(Aubervillier, France), K. Aissaoui and Mrs. Z. Mab-rouki for their technical collaborations.
References
Allani, M. 1993. Epuration des eaux r�esiduaires urbaines par lagunage
a�er�e et d�esinfection par rayonnement UV. Th�ese Doctorat,
Universit�e Paris VII.
Blatchley, E.R., Hunt, B.A., 1994. Bioassay for full-scale UV
disinfection plants. Water. Sci. Technol. 30, 115±123.
Blatchley, E.R., 1996. Ultraviolet irradiation and chlorination/dechlo-
rination for municipal wastewater disinfection. Water Environ.
Res. 68, 194±198.
Carrigan, P., Cairns, B., 1991. Disinfection application of ultraviolet
technology. Water Cond. Purif. 33, 43±48.
Damelincourt, J.J., Aubes, M., Zissis, G., Stambouli, M., Hassen, A.,
Deschaume, M., Saubion, C., Asselman, A., 1998. An attempt of
global modelling of UV treatment system for secondary waste-
water. International conference on ``Water in the Mediterranean ±
Collaborative Euro-Mediterranean Research: state of art, results
and future priorities'', 25±29 November Istanbul, Turkey.
Failly, J., 1994. D�esinfection des eaux us�ees par rayonnement UV.
LÕeau, lÕindustrie, les nuisances 32, 58±60.
Haas, C.N., 1990. Disinfection. Water Quality and Treatment. in: A
Handbook of Community Water Supplies. American Water Works
Association.
Haas, C.N., 1994. Disinfection under dynamic conditions: modi®ca-
tion of Hom's model for decay. Environ. Sci. Technol. 28, 1367±
1369.
Harris, D.G., Adams, D.V., Sorensen, L.D., Curtis, M., 1987.
Ultraviolet inactivation of selected bacteria and viruses with
photoreactivation of bacteria. Water. Res. 21, 687±692.
Hom, L.W., 1972. Kinetics of chlorine disinfection in an ecosystem. J.
San. Eng. Div. ASCE 98, 183±194.
Kashimada, K., Kamiko, N., Yamamoto, K., Ohgaki, S., Angelakis,
A., 1996. Assessment of photoreactivation following ultraviolet
light disinfection. Water. Sci. Technol. 33, 261±269.
Leahy, J.G., Rubin, A.J., Sproul, O.J., 1987. Inactivation of cysts by
free chlorine. Appl. Environ. Microbiol. 6, 120±128.
Lindenauer, K.G., Darby, J., 1993. Evaluation of ultra-violet light
disinfection: Signi®cance of photoreactivation. Davis Water Envi-
ron. Fed. Plan. Des and Operations of e�uent Disinfection Syst.
Whippany, NJ, 23±25 May, p. 49.
Man, J.C., 1983. MPN tables corrected. J. Appl. Biotechnol. 17, 301±
305.
Mark, J.M., Gordon, R.F., 1994. Will UV be the disinfectant of the 90
s? It o�ers some advantages over other means. Water Technol. 17,
74±78.
Martiny, H., Wlodavezyk, K., Harms, G., Gueden, H., 1988. Use of
UV-irradiation for the disinfection of water. Zentralbl. Bakteriol.
Mikrobiol. Hyg. 185, 350±367.
Masschelein, J., Debacker, E., Chebak, S., 1989. Laboratory investi-
gations on the disinfection of water by UV-light. Rev. Sci. Eau. 2,
29±41.
Moreno, B., Goni, F., Fernandez, O., Marinez, J.A., Astigarraga, M.,
1997. The disinfection of wastewater by ultraviolet light. Water.
Sci. Technol. 35, 233±235.
Mosely, B.E.B., 1984. Radiation damage and its repair in non-
sporulating bacteria. In: Andrew, , Russell, (Eds.), The Revival of
Injured Microbes. Academic Press, New York, pp. 409±439.
Norest, D., Schild, J.I., 1986. Les aspects nouveaux de la technologie
du rayonnement UV dans l'industrie alimentaire. L'eau, l'industrie,
les Nuisances 100, 35±38.
Oppenheimer, J.A., Montgomery, W., Pasadena, C.A., Hoagland,
J.E., Laine, J.M., Jacangelo, J.G., Bhamrah, A., 1993. Microbial
inactivation and characterisation of toxicity and by products
occurring in reclaimed wastewater disinfected with UV radiation.
Alit Water Environ. Fed. Plan. Des, Operations of e�uent
Disinfection Syst. Whippany, NJ, 23±25 May, p. 13.
Parker, J.A., Darby, J.L., 1995. Particle-associated coliform in
secondary e�uents: shielding from ultraviolet light disinfection.
Water Environ. Res. 67, 1065±1072.
Potapchenko, N.G., Illyahhenko, V.V., Savluk, O.S., 1995. Inactiva-
tion of drinking water microorganisms by UV-radiation. Mikro-
biol. Zh. 57, 85±91.
A. Hassen et al. / Bioresource Technology 74 (2000) 141±150 149
Qualls, R.G., Osse�, S.F., Chang, J.C.H., Dorfman, M.H., Dumais,
D.C., Johnson, J.D., 1985. Factors controlling sensitivity in
ultraviolet disinfection of secondary e�uent. J. Water Poil. Cont.
Fed. 57, 1006±1011.
Qualls, R.G., Dorfman, M.H., Johnson, J.D., 1989. Evaluation of the
e�ciency of ultraviolet disinfection systems. Water Res. 23, 317±
321.
Rodier, J., 1978. Analyse de l'eau: eaux naturelles, eaux r�esiduaires,
eau de mer. Dunod technique Edition, Bordas, Paris, p. 1135.
Rosset, P., Rosset, R., 1996. Les ultraviolets germicides. Les utilisa-
tions en industries agro-alimentaires. S�erie Actualit�es Scienti®ques
et Techniques en Industrie agro-alimentaire, 48, Edition Ted-Doc,
Cachan, France, p. 98.
Sarroukh, H., Asselman, A., Hassen, A., Damelincourt, J.J., 1999.
D�etermination des �eclairements ultraviolets directs �a partir des
caract�eristiques de construction dÕune source Hg-GR. Application�a un r�eacteur de traitement dÕeau. Journal de Physique, in press.
Selleck, R.E., Saunier, B.M., Collins, H.F., 1978. Kinetics of bacterial
deactivation with chlorine. J. Environ. Eng. Div. ASCE 104, 1197±
1212.
Severin, B.F., Suidan, M.T., Engelbrecht, R.S., 1984. Series-event
kinetic model for chemical disinfection. J. Environ. Eng. 110, 430±
439.
Shaban, A.M., El-Taweel, G.E., Ali, G.H., 1997. UV ability to
inactivate micro-organisms combined with factors a�ecting radia-
tion. Water. Sci. Technol. 35, 107±112.
Sobotka, J., 1992. Application of ultraviolet disinfection and puri®-
cation in Poland. Water. Sci. Technol. 26, 2313±2316.
Sommer, R., Cabaj, A., 1993. Evaluation of the e�ciency of a UV
plant for drinking water disinfection. Water. Sci. Technol. 27, 279±
301.
Sommer, R., Cabaj, A., Schoenen, D., Gebel, J., Kolch, A., Havelaar,
A.H., Schets, F.M., 1995. Comparison of three laboratory devices
for UV-inactivation of micro-organisms. Water. Sci. Technol. 31,
147±156.
Sommer, R., Haider, T., Cabaj, A., Heidenreich, E., Kundi, M.,
1996. Increased inactivation of Saccharomyces cerevisiae by pro-
traction of UV irradiation. Appl. Environ. Microbiol. 62, 1977±
1983.
Sommer, R., Cabaj, A., Pribil, W., Haider, T., 1997. In¯uence of lamp
intensity and water transmittance on the UV disinfection of water.
Water. Sci. Technol. 35, 113±118.
Yip, R.W., Konosewich, D.E., 1972. Ultraviolet sterilisation of water.
Its potential and limitations. Water. Poll. Cont. Canada, 14±18
June, cited by Shaban et al., 1997.
150 A. Hassen et al. / Bioresource Technology 74 (2000) 141±150